Article

Empirical Setting of the Water Stressed Baseline Increases the Uncertainty of the Crop Water Stress Index in a Humid Temperate Climate in Different Water Regimes

1
United Graduate School of Agricultural Science, Tokyo University of Agriculture and Technology, 3-5-8, Saiwaicho, Tokyo 183-8509, Japan
2
Institute of Agriculture, Tokyo University of Agriculture and Technology, 3-5-8, Saiwaicho, Tokyo 183-8509, Japan
*
Author to whom correspondence should be addressed.
Water 2022, 14(12), 1833; https://doi.org/10.3390/w14121833
Submission received: 10 May 2022 / Revised: 1 June 2022 / Accepted: 6 June 2022 / Published: 7 June 2022
(This article belongs to the Section Water, Agriculture and Aquaculture)

Abstract

:
Water productivity of rice is imperative for global water security. Currently, water saving management techniques have been proposed and applied to rice systems. The crop water stress index (CWSI) is a major index for evaluating crop water use. The utility of the CWSI in rice in a humid temperate climate has been given little attention. Previous studies have focused on upland crops and readily available constant reference baselines, primarily the water stressed baseline (WSB), which does not inherently reflect transpiration flux. This study examined the performance of the estimated non-water stressed baseline (NWSB) and WSB for rice in a humid climate and the CWSI sensitivity under variable reference baseline scenarios in a 2-year pot trial under phytotron and field environment conditions with two rice genotypes (IRAT109 and Takanari) in a flooded (FL) and aerobic (AR) water regime. We observed that the dynamics of CWSI is dependent not only on the water regimes but could be strongly influenced by genotype sensitivity to vapor pressure deficit (VPD). A higher slope (pooled data) in the field environment (−5.68 °C kPa−1) compared to the phytotron (−3.04 °C kPa−1) reflected transpiration water loss sensitivity to VPD thresholds. Further studies with diverse rice germplasms to explore generalizability to field conditions and reformulation of reference baselines considering the VPD threshold sensitivity could prove to be significant.

1. Introduction

Rice is an important staple for more than 3 billion people, providing about 19% of global calorie intake [1]. However, rice production accounts for some 24–30% of total global freshwater withdrawals [2]. As water scarcity becomes apparent, inter-sectoral water allocation is expected to increase intra-sectoral water competition among livestock production, staples (wheat, maize, rice), and non-food crops used as biofuels [3]. This could threaten the sustainability of irrigated rice and thus the twin challenge of producing “more crop per drop” is imperative.
Alternative water management regimes have been evaluated to improve water productivity (yield/water supply) of rice. They include among other water regimes, alternate wetting and drying (AWD), where the crop is subjected to intermittent drying and flooding cycles [4,5] and high yield aerobic rice in non-saturated, non-puddled soils [6]. However, at the expense of optimizing water supply to increase water productivity, yield penalties have been a common feature [7,8] due to crop water stress. Plant and soil-based methods of detecting crop water stress have been widely used, such as soil water potential, leaf/stem water potential, and leaf stomatal conductance [9,10,11]. However, these methods are labor intensive and time-consuming. Cultivated rice evolved from a semi-aquatic ancestor with a tenfold stomata compared to leaves of dryland cereals like wheat and barley [12] and typically adapted to flooded conditions. In water limiting environments such as AWD, the rice plants transpire below their potential rate which results in smaller latent heat fluxes which invariably increases the plant canopy temperature (Tc) [13]. This provides a simple and direct insight for early detection of crop water stress using thermal sensors. Nonetheless, meteorological factors such as solar radiation (Rs), relative humidity (RH), and air temperature (Ta) also influence Tc which could reduce the signal-to-noise ratio in contrasting water regimes.
Different indices based on thermal contrast between plants and their environment have been developed [14,15,16] to normalize rapidly changing meteorological factors with reference baselines. The most widely studied and used is the empirical crop water stress index (CWSI) developed by [17]. This index is based on plant canopy-air temperature difference (Tc − Ta) constrained by its potential transpiration and zero transpiration flux commonly named the non-water stressed (NWSB) and water stressed baseline (WSB) respectively [18,19]. This form of the CWSI is ideal for routine use because of its few instrumentation requirements. Other approaches to derive the transpiration baselines are well established [20,21,22] which includes the analytical and direct approach. The analytical approach requires knowledge of net radiation and particularly canopy resistance measurements which are not readily available meteorological data making it impractical for routine use. Meanwhile, the direct approach requires management of reference leaf surfaces whereby water is sprayed at short intervals (approximately 1–3 min) and petroleum jelly is painted on leaf surfaces to mimic wet and dry reference surfaces respectively [23] which could present reproducibility problems and impede maintenance free automation.
With these challenges the utility of the CWSI in rice has been given little attention [24,25,26,27] compared to dryland crops. Previous empirically derived reference baselines have focused on dryland crops in Mediterranean, semi-arid, and arid climates [15,18,19,28,29]. Hence derived reference baselines for rice in a humid climate are crucial. Additionally, the empirical CWSI could contribute to the suite of water management tools for water productivity improvement of rice in this climate. Thus, the objectives of this study were first to determine the empirical reference baselines (NWSB and WSB) for rice in phytotron and field environment conditions in a humid temperate climate. Second, the sensitivity of CWSI to fitted parameters (slope and intercept) based on four scenarios were assessed namely: (a) the slope and intercept between genotypes are not significant, hence a common reference baseline (CBL); (b) the slope and intercept vary significantly based on time of day (field environment data only), hence a time variant reference baseline (TBL); (c) the slope and intercept are genotype specific, hence a genotype reference baseline (GBL); (d) crop water stress is maximal between 12:00 and 13:00 JST (Japan Standard Time), hence a midday baseline (MBL) (field environment data only). Their combination with a constant WSB following [30] was also assessed.

2. Materials and Methods

2.1. Site Description and Experimental Treatments

The experiments were conducted in a naturally lit temperature controlled phytotron (1.8 m in height, 1.75 m in length, 1.75 m in width) and field environment condition at the Tokyo University of Agriculture and Technology, Fuchu campus, Tokyo, Japan (35°41′03″ N, 139°29′02″ E) during the summer in 2019 and 2020 respectively. Air temperature (Ta) in the phytotron was set at 29/22 °C day/night with relative humidity (RH) between 52–75% and air flow from the floor was continuous at 0.5 m/s [31]. Temperature variation in the phytotron was controlled with an air conditioner. The experiments were carried out in 1/5000-a Wagner pots (4.0 L, 16 cm in diameter, 20 cm in height) filled with 3.4 L of air-dried paddy field soil. The soil was a clay loam (sand 39%, silt 29%, clay 32%) with a pH of 6.8, total carbon of 42.9 g/kg, total nitrogen of 3.4 g/kg, and available phosphorus of 0.46 g/kg. Pots in the phytotron were randomly assigned to each water regime and genotype while in the field environment they were assigned to blocks (4 treatments per block) with randomization occuring within each block. There were six replications per treatment.
Rice genotypes (Takanari and IRAT109) were grown under aerobic and flooded water regimes. In the phytotron, 9 seeds per pot (3 seeds/hill) were directly sown on 16 May and thinned to one plant per hill after seedlings were established. Chemical fertilizer (N, P2O5, K2O = 0.8, 1.4, 0.4 g/pot) was applied before sowing and topdressing N = 0.4 g/pot was applied at 2–3 weeks interval (total N = 2.4 g/pot) together with 1.4 g/pot of P2O5 (total P2O5 = 2.8 g/pot). In the field environment, 9 days old seedlings were transplanted on 16 July at a density of 4 plants per pot (2 plants/hill). The high plant density in the field environment was to reduce wind speed and advection effects on plant canopy temperature (Tc) [32]. Total N, P2O5, and K2O applied were 5.6, 2.1, and 0.4 g/pot respectively with N application at 2–3 weeks interval. Pots in the flooded water regime were placed in tubs filled with water to a depth of 3–5 cm whereas full irrigation was applied when soil water potential (SWP), monitored with pF meters (DIK-8343, Daiki Rika Kogyo, Saitama, Japan) at 10 cm soil depth fell below −30 kPa in the aerobic water regime. Weeds were controlled by handpicking.

2.2. Experimental Measurements
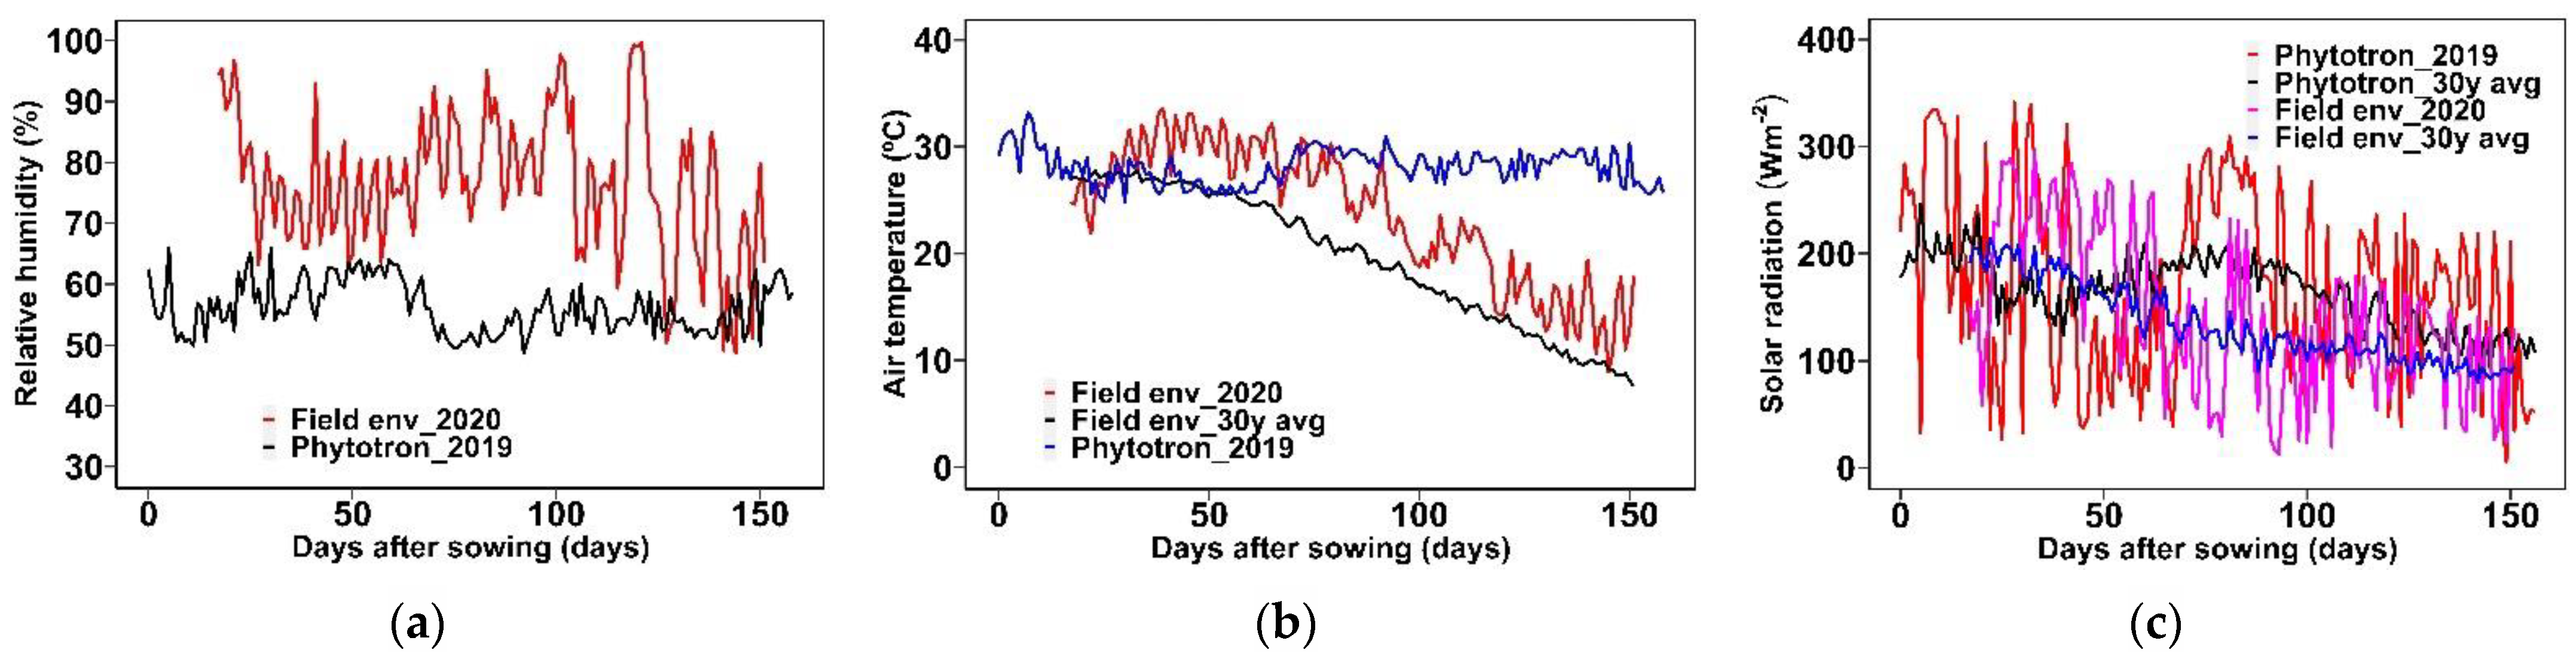
2.2.1. Phytotron

In the phytotron, ambient air temperature (Ta) and relative humidity (RH) were independently recorded on a continuous basis at 1 min intervals with an automatic Ta–RH data logger (MX1101, Onset Computer Corp., Bourne, MA, USA) placed at 0.2 m above plant canopy height and adjusted periodically during plant growth. It has an accuracy of ±0.21 °C. Plant canopy temperature (Tc) was captured using an infrared thermal imager (FLIR C2, FLIR Systems, Wilsonville, OR, USA) during clear sky conditions at 70 and 75 days after sowing (DAS) from nadir view at ~0.5 m with two replicate pots per treatment factor in each image. The thermal camera has an image resolution of 80 × 60 pixels and operates in the 7.5–14 µm spectral range with a 0.1 °C temperature resolution. To improve thermal image contrast, the FLIR proprietary multispectral imaging feature called MSX® was used which automatically combines thermal and visible image [33] which mitigates to some extent the inclusion of non-canopy pixels due to parallax errors [34] in determining the true temperature of leaves. Emissivity of the plant canopy surface was set at 0.98 for the study period. All thermal images were analyzed with FLIR tools version 6.4 (FLIR Systems, Wilsonville, OR, USA) by drawing polygons on regions of interest and extracting mean temperatures (Figure S5a).

2.2.2. Field Environment

In the field environment, an automatic air temperature (Ta)–relative humidity (RH) data logger (MX2302A, Onset Computer Corp., Bourne, MA, USA) with an accuracy of ±0.20 °C was installed at 1.5 m height to record air temperature and relative humidity at 15 min intervals. The temperature of the plant canopy (Tc) was measured on a continuous basis at 2 min intervals using a temperature sensor (MX2303, Onset Computer Corp., Bourne, MA, USA) with an accuracy of ±0.20 °C which provides continuous measurements compared to one-point-in time measurements of thermal camera mentioned in Section 2.2.1. The temperature sensors were placed inside the canopy from the start of heading (50% of panicles showing exsertion) to maturity in two replicate pots per treatment factor. Tc was obtained between 19 September and 25 October for the water regimes (flooded and aerobic). To avoid heating by incident solar radiation, sensors were placed in handmade shields wrapped in aluminum foil (Figure S5b). The air intake, where the temperature sensor is located, was kept at panicle height by adjusting its position using attached poles.

2.3. Determination of Reference Baseline for Rice in a Humid Temperate Climate

2.3.1. Vapor Pressure Deficit (VPD)

First, to derive the reference baseline, the VPD (kPa), which is an index of the evaporative demand of the ambient air was calculated from the observed air temperature (°C) and relative humidity (%) according to [35] as below:
  VPD = 0.0061 × 10 ( 7.5 Ta / Ta + 237.3 ) × ( 100 RH )
where Ta is air temperature (°C), and RH is relative humidity (%).

2.3.2. Establishing Reference Baseline Parameters

The reference baseline parameters for normalizing the crop water stress index require plant canopy temperatures obtained during clear sky conditions. This is relevant for proper discrimination of contrasting water regimes. To this end, because of infrequent cloud-free weather during the rice growing period in Japan, the plant canopy temperature (Tc) data was limited to solar radiation (Rs) values greater than 200 Wm−2. Tc was normalized to air temperature (Tc − Ta) and then regressed against the VPD to estimate the parameters (slope and intercept) of Equation (3). In the case of field environment, Tc between 08:00 and 17:00 JST (Japan Standard Time) were used to derive the reference baseline in contrast to the phytotron environment where Tc data was limited to 10:53–16:05 JST for two measurement days, that is, 70 and 75 days after sowing (DAS).
Four reference baseline scenarios (Common baseline (CBL); Genotype baseline (GBL); Midday baseline (MBL); Time variant baseline (TBL)) were then evaluated based on the parameters (slope and intercept) derived from the regression relationship between (Tc − Ta)NWSB and VPD in Equation (3) for each scenario. In the case of CBL, pooled data for all genotypes and time periods were used to derive the intercept and slope; GBL was based on pooled data for each genotype; MBL was based on pooled data for all genotypes for the time 12–13 JST; TBL was based on pooled data for all genotypes for each time period spanning 08:00–17:00 JST. These were then used as input for Equation (4) to estimate (Tc − Ta)WSB (°C) for each reference baseline scenario.
Figure 1a–c shows the meteorological conditions throughout the experiment. Relative humidity (Figure 1a) in the phytotron condition fluctuated from 49 to 66% in contrast to the field environment condition which was highly variable (49–100%). Air temperature was roughly stable in the phytotron condition whilst in the field environment condition after 110 days the sowing temperature declined below 20 °C which tracked the 30-year average trend for the same time period. The solar radiation (Figure 1c) was highly variable (5.8–341 Wm−2) with daily average of 169 Wm−2 and 143 Wm−2 in 2019 and 2020 respectively for the entire experimental period corresponding to infrequent cloud-free conditions in this temperate region.

2.4. Determination of Crop Water Stress Index (CWSI)

The CWSI was computed using Equation (2):
CWSI   = ( Tc     Ta ) m   ( Tc     Ta ) NWSB ( Tc     Ta ) WSB   ( Tc   Ta ) NWSB
where (Tc − Ta)m is the measured plant canopy-air temperature difference, (Tc − Ta)NWSB is the non-water stressed reference baseline (NWSB) and (Tc − Ta)WSB is the water stressed reference baseline (WSB).
The reference baselines were empirically derived as follows in Equations (3) and (4):
( Tc     Ta ) NWSB = b 0 + b 1 × VPD
( Tc     Ta ) WSB = b 0 + b 1 [ e s   ( Ta ) e s   ( Ta + b 0 ) ]
where b0 and b1 are the intercept (°C) and slope (°C kPa−1) respectively, Ta is the observed air temperature, es (Ta) is the saturated vapor pressure at Ta (kPa) [36].

2.5. Data Analysis

Linear regression was used to assess the relationship between plant canopy-air temperature difference (Tc − Ta) and VPD for each rice genotype (IRAT109 and Takanari), pooled data and time period (field environment only). The crop water stress index (CWSI) for the field environment was computed between 10:00 and 15:00 JST for data parity between genotypes. Difference between CWSI under different water regimes for each genotype was compared using a t-test at p < 0.05. The determination coefficient (R2) was used to assess goodness of fit of linear regressions. All analyses were carried out in R, version 4.1.1.

3. Results

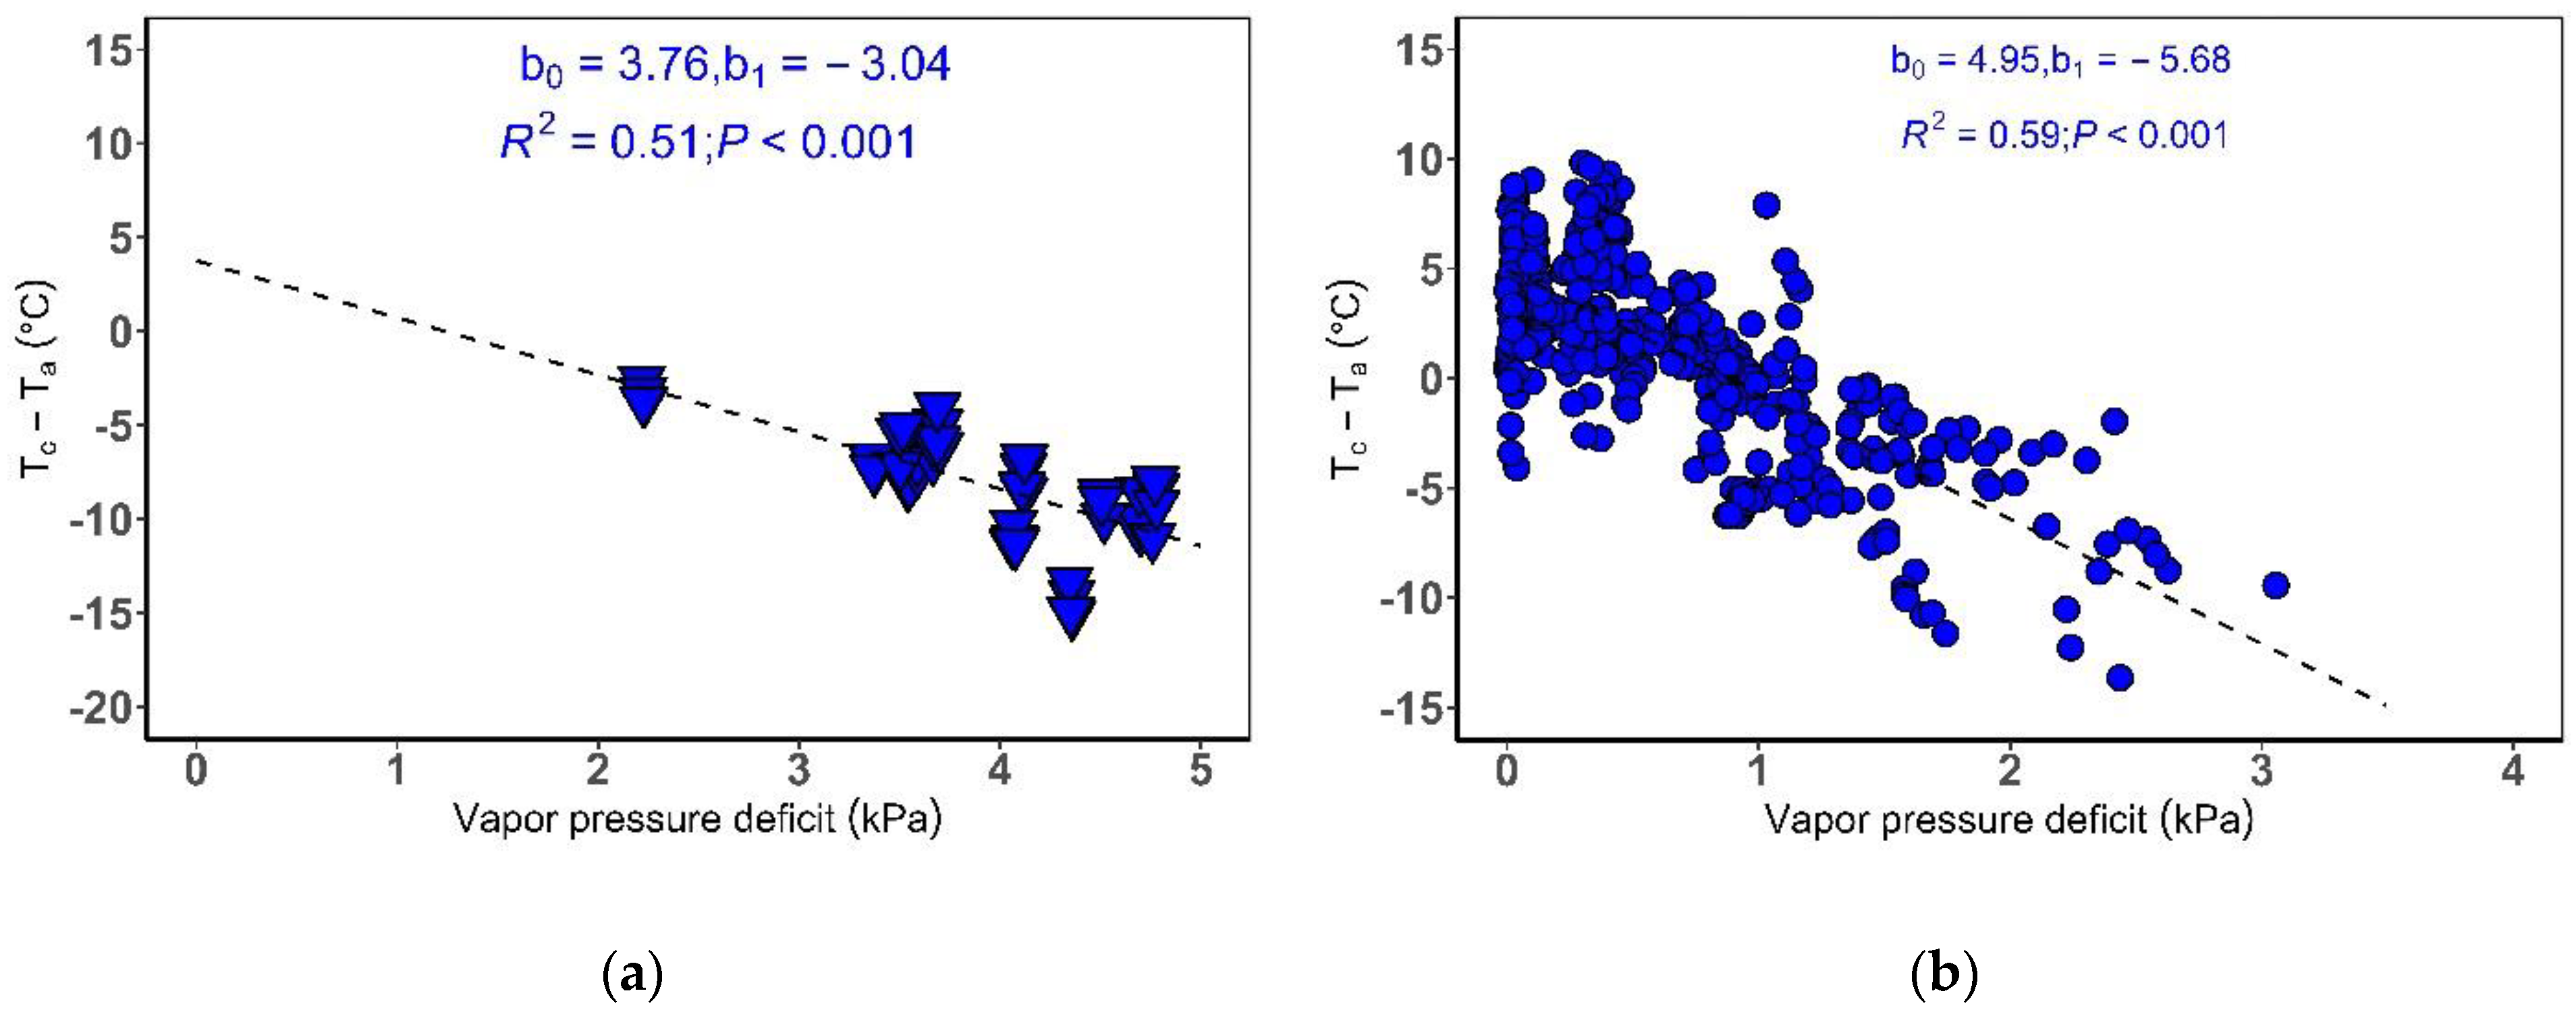
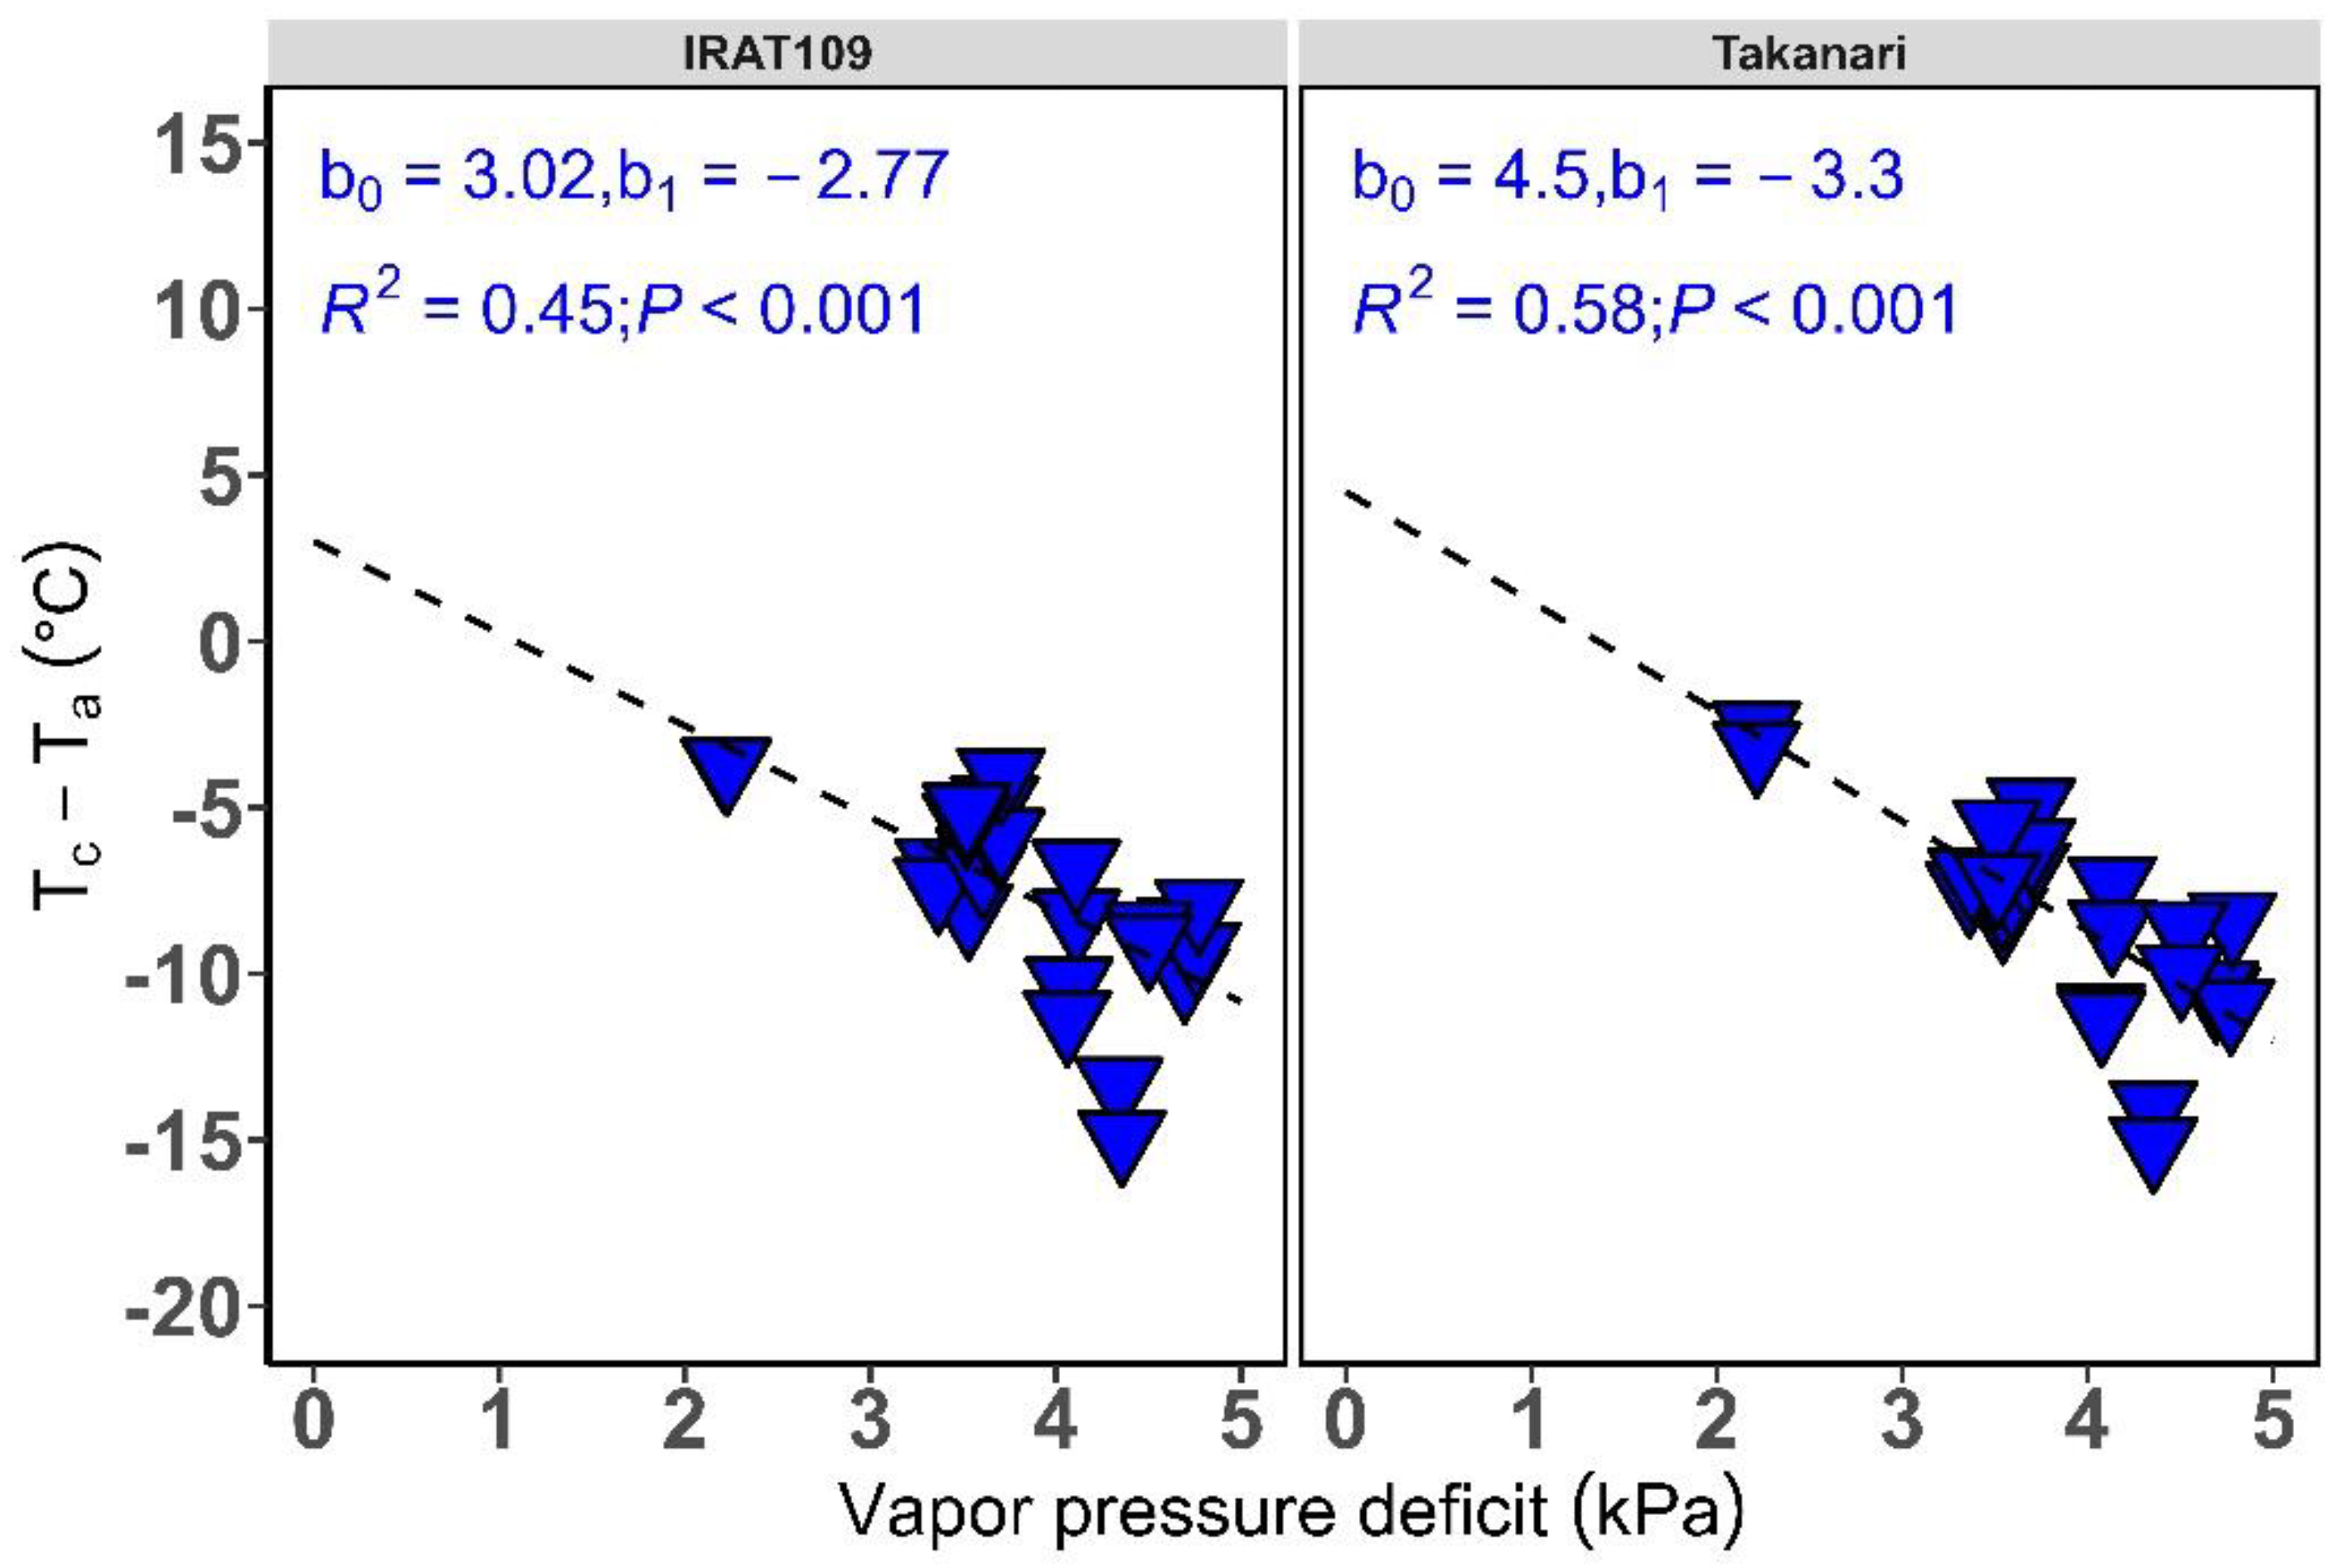
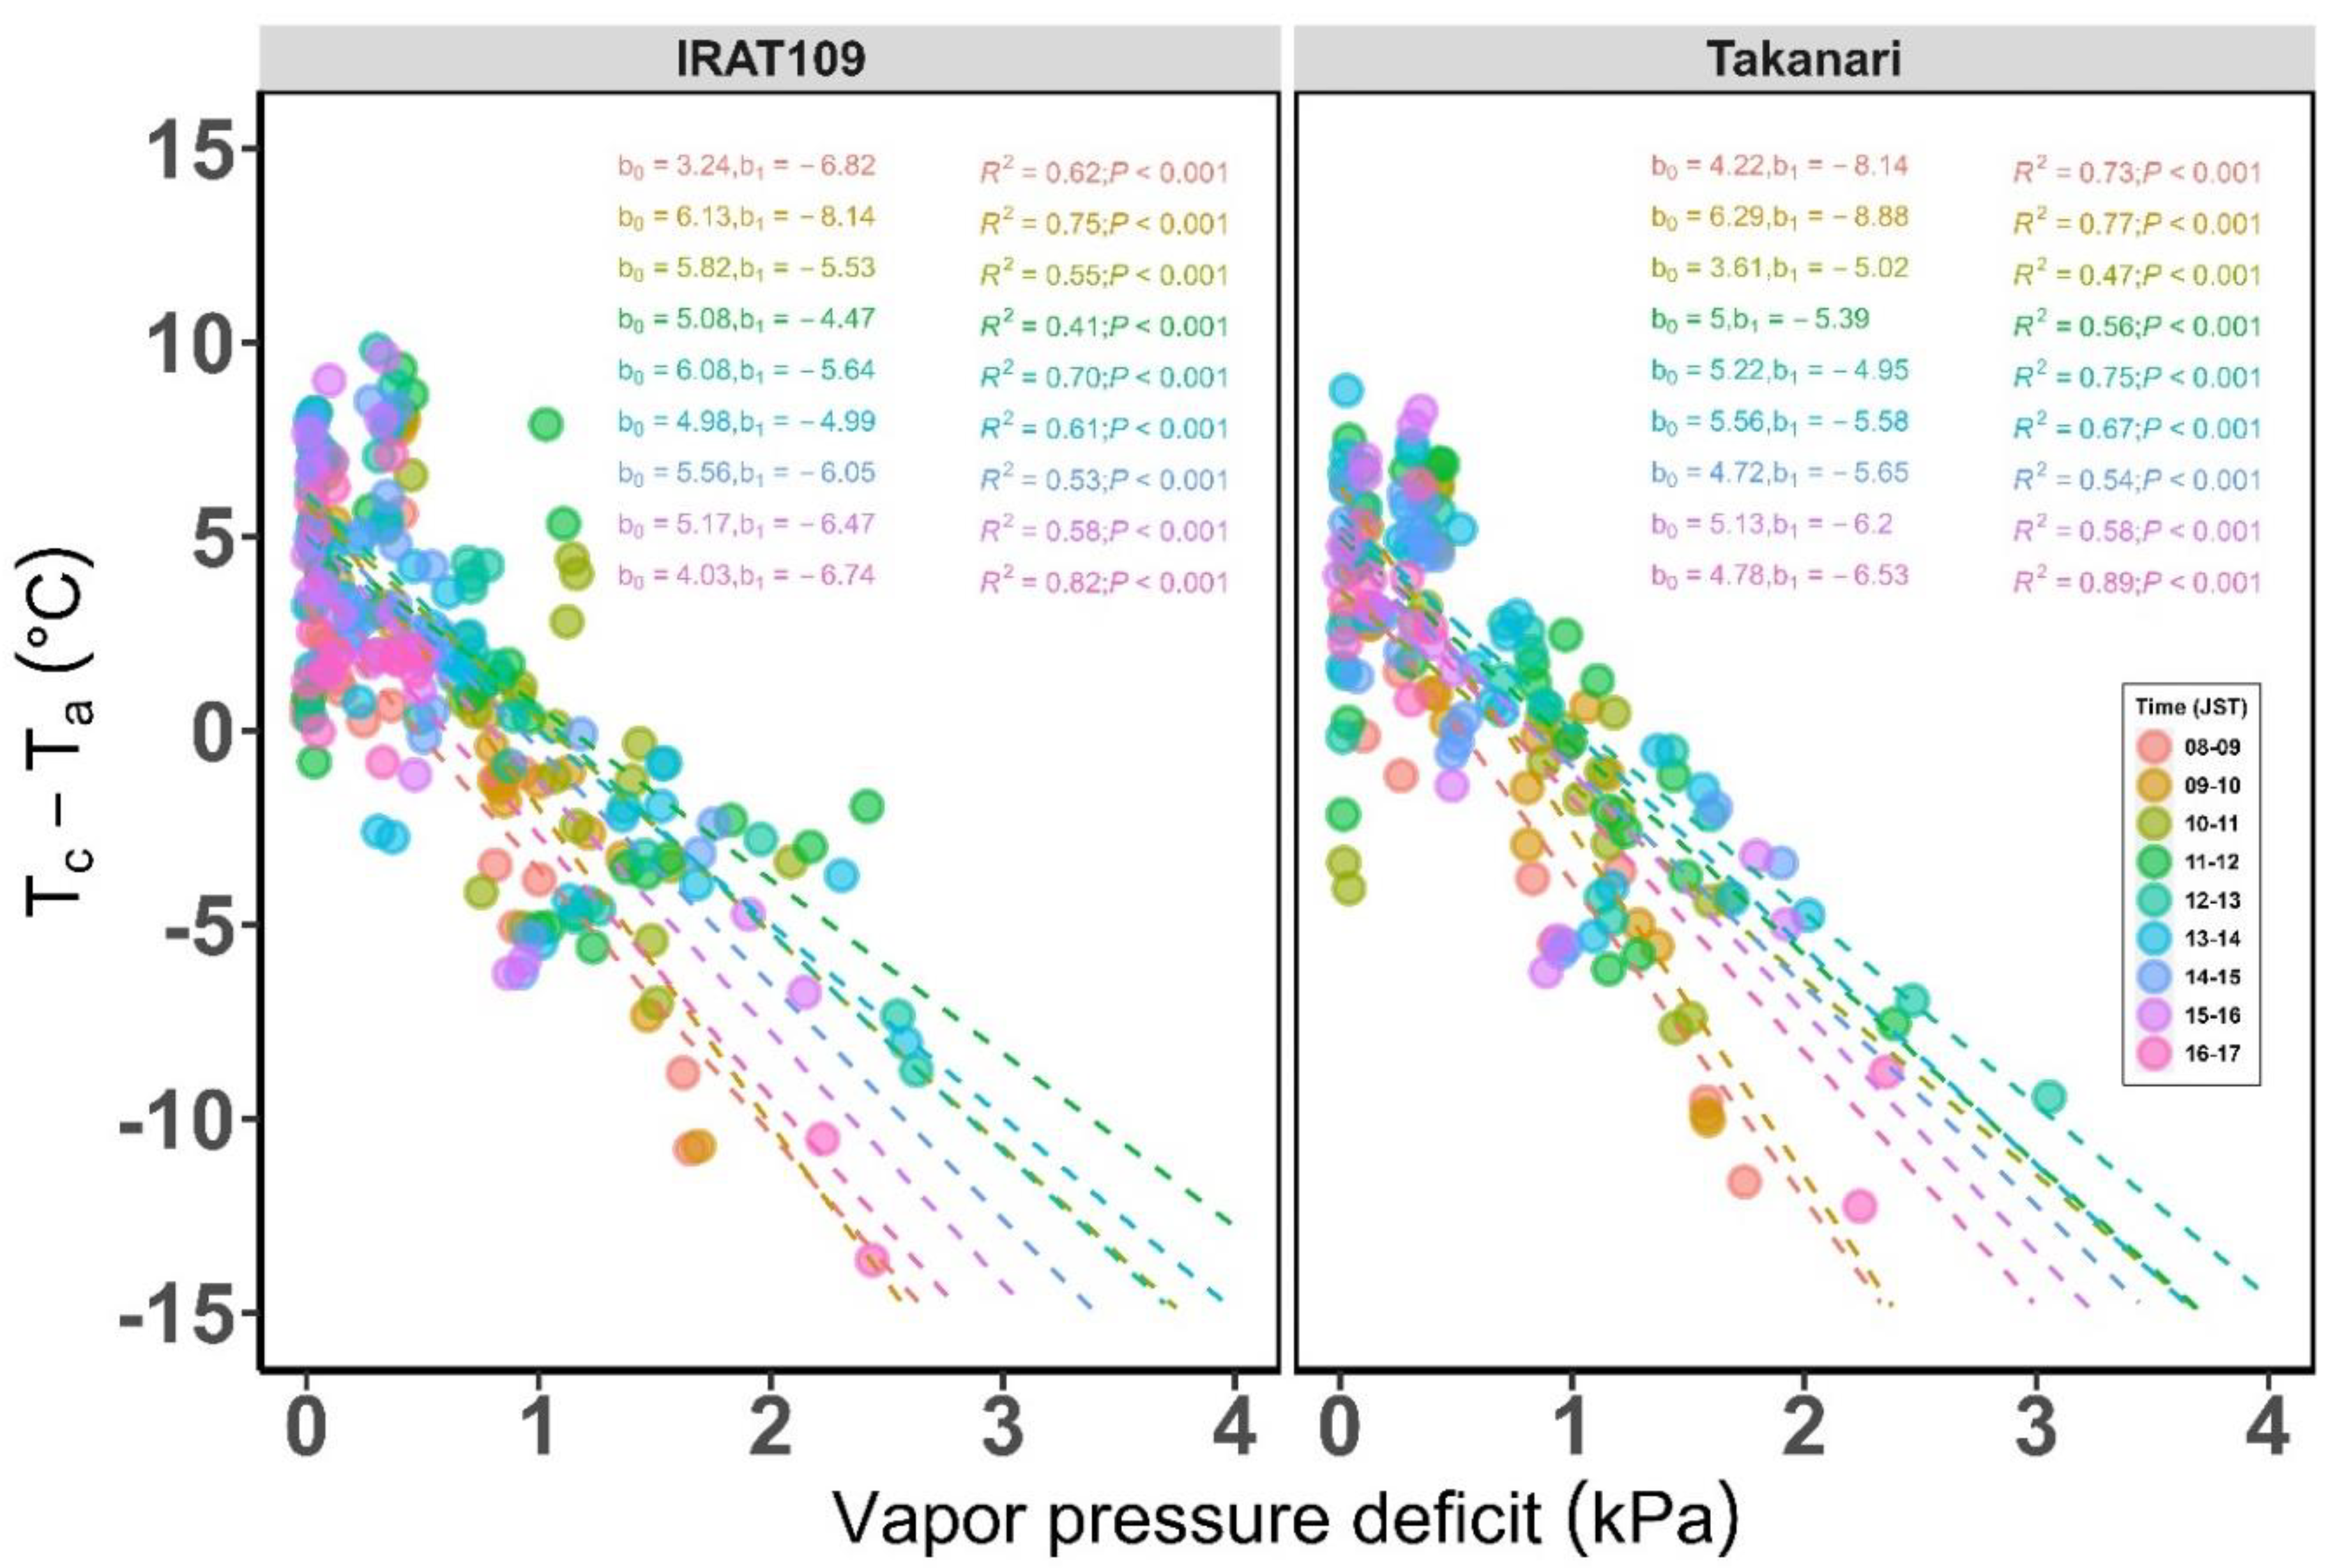
3.1. Non-Water Stressed and Water Stressed Reference Baseline for Rice in a Humid Temperate Climate

Phytotron and Field Environment

Figure 2a shows the relationship between Tc − Ta and VPD in the phytotron condition when data was pooled for both genotypes (IRAT109 and Takanari). The VPD ranged narrowly between 2.22 and 4.77 kPa which explained 51% of the variance in Tc − Ta with a slope (b1) and intercept (b0) of −3.04 °C kPa−1 and 3.76 °C respectively. Generally, Tc − Ta decreased with increasing VPD which is indicative of the transpiration cooling of the rice canopy. This relationship was significant (p < 0.001).
The field environment in a humid temperate climate is typically characterized by high relative humidity (Figure 1a) and hence low VPD conditions. Figure 2b shows a significant (p < 0.001) relationship between Tc − Ta and VPD with a determination coefficient (R2) of 0.59 for the pooled data for the period 08:00–17:00 JST and genotypes (IRAT109 and Takanari). At moderately high VPD (>1 kPa) transpiration cooling was high marked by negative Tc − Ta, however variable Tc − Ta was notable at low VPD conditions. The slope and intercept were −5.68 °C kPa−1 and 4.95 °C respectively.
Nonetheless, transpiration dynamics tend to differ within species because of contrasting morphological and physiological traits. We therefore assessed the regression between Tc − Ta and VPD per genotype (Figure 3 and Figure 4) in the phytotron and field environment respectively. The relationship for both genotypes in the phytotron were statistically significant (p < 0.001) with Takanari showing a greater slope (−3.30 °C kPa−1) and intercept (4.5 °C) than IRAT109 (−2.77 °C kPa−1 and 3.02 °C respectively). The observed determination coefficient (R2) also differed between IRAT109 (R2 = 0.45) and Takanari (R2 = 0.58).
At the genotype level in the field environment (Figure 4), R2 was greater for Takanari (0.62) than IRAT109 (0.56). A similar statistically significant trend was observed with respect to the slope (−5.89 °C kPa−1 for Takanari vs. −5.52 °C kPa−1 for IRAT109) except for the intercept which was greater for IRAT109 (5.03 °C) than Takanari (4.83 °C). The large scatter in the regression particularly at low VPD (<2 kPa) implies a time variant effect of VPD, hence we assessed the variance of the Tc − Ta at different times per genotype. Figure 5 shows the time variant effect of VPD on Tc − Ta for the genotypes. The R2 ranged from 0.41–0.82 for IRAT109 and 0.47–0.89 for Takanari with the highest explained variance in Tc − Ta observed at 16–17 JST (0.82 for IRAT109; 0.89 for Takanari). In addition, there was no significant difference in the slope and intercept at the times evaluated within each genotype except for slope (p < 0.001; both genotypes) and intercept at 08−09 JST (p < 0.01; both genotypes), and intercept at 12–13 JST (p < 0.05; IRAT109) (Table S1).
With respect to the water stressed reference baseline (WSB), Table 1 shows the estimated mean of the WSB under contrasting conditions, water regimes, and genotypes for different reference baseline parameter assumptions. In general, the WSB in the phytotron were lower (6.13–10.21 °C) compared to the field environment (9.90–13.08 °C) condition. In addition, the WSB was stable in the case of the common reference baseline (CBL) parameter between genotypes and the water regime in the phytotron while in the field environment it varied slightly depending on the reference baseline parameter assumption, genotype, and water regime.

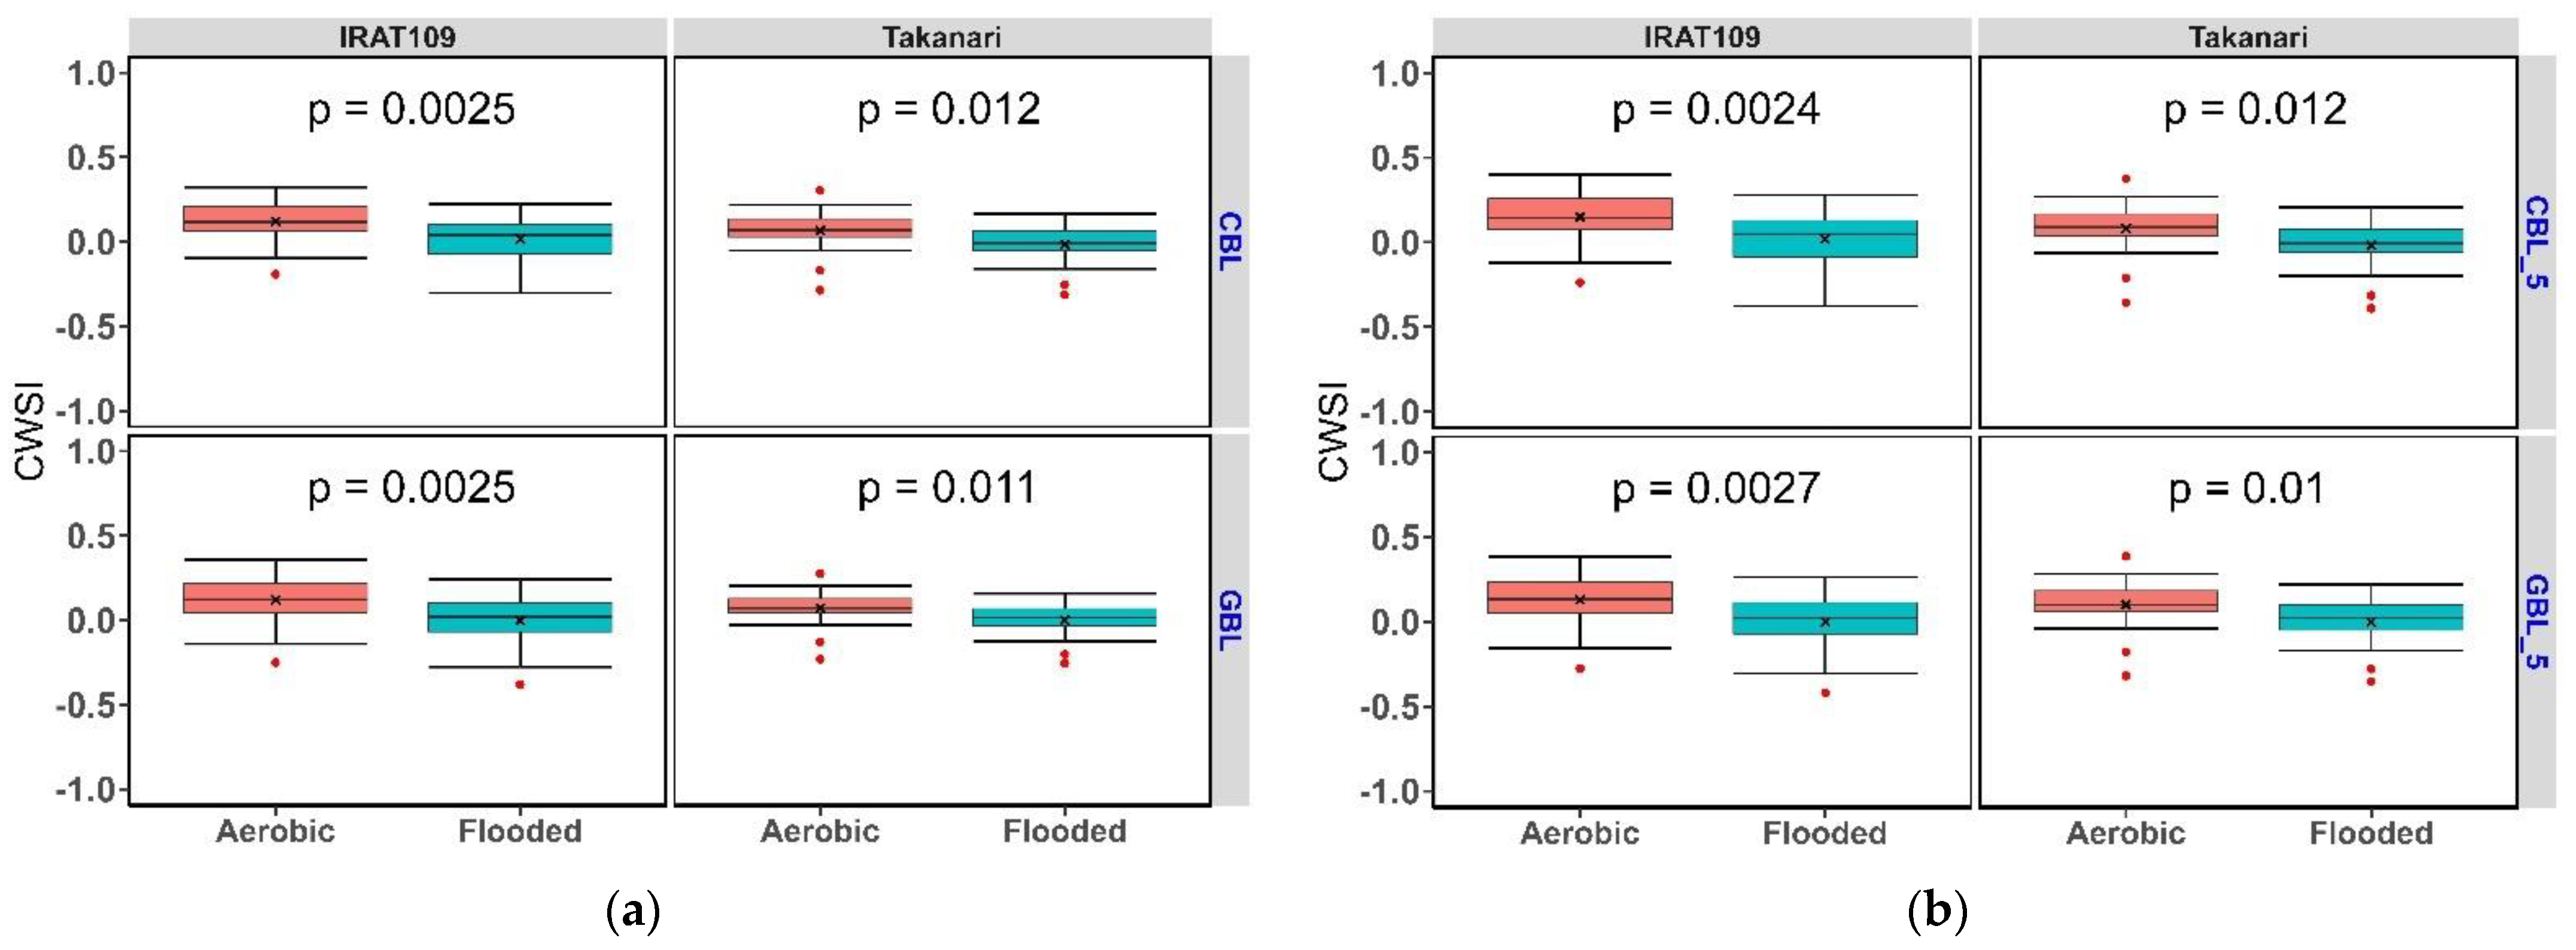
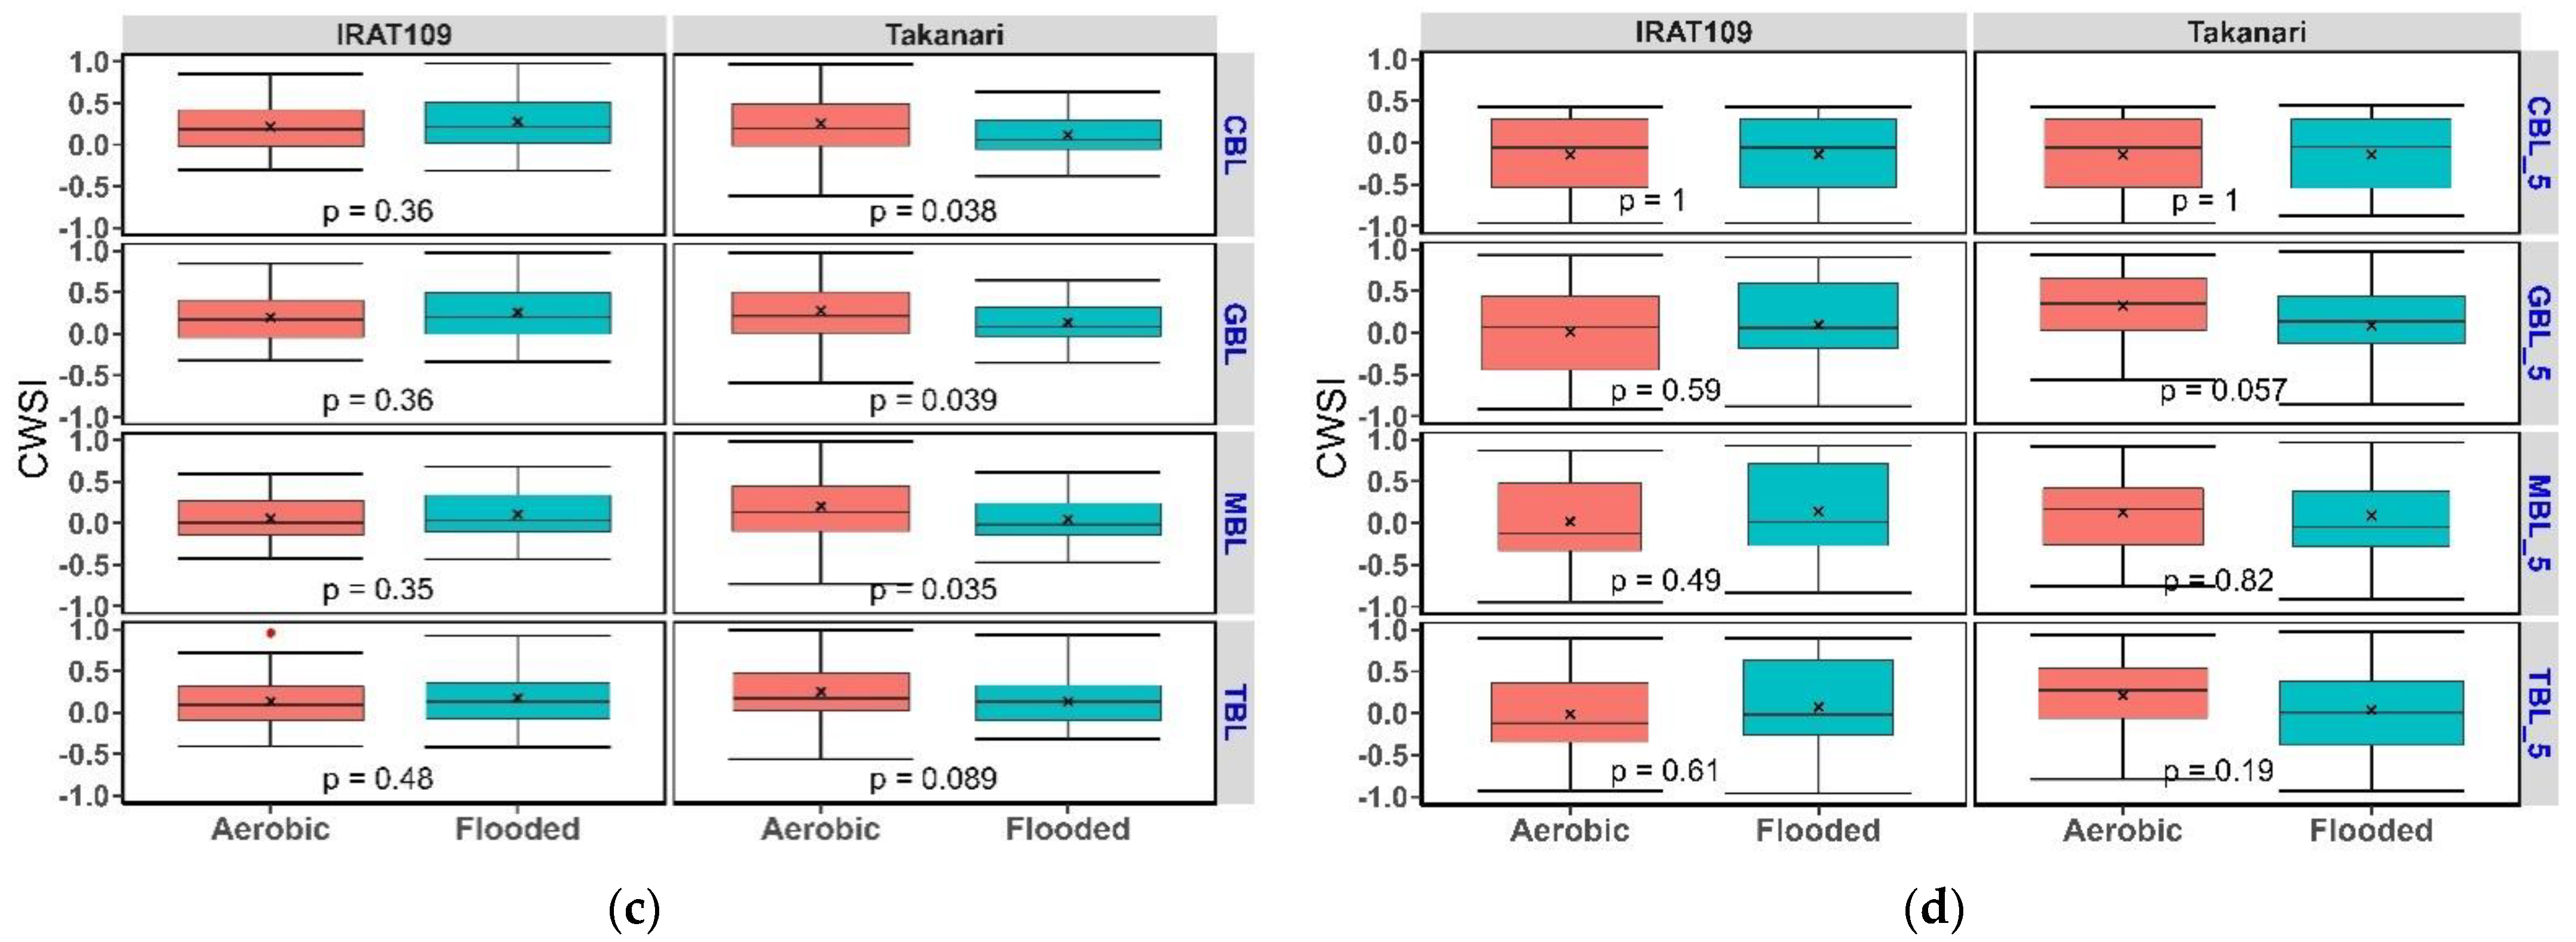
3.2. Crop Water Stress Index in Contrasting Water Regimes and Genotypes

Water Regimes and Genotypes

The utility of the crop water stress index (CWSI) in discriminating plant water status for each genotype (IRAT109 and Takanari) and the sensitivity to different reference baseline parameters are presented in Figure 6a–d. We computed the CWSI between water regimes for each genotype based on two (phytotron) and four (field environment) reference baseline parameter assumptions namely common reference baseline (CBL), genotype reference baseline (GBL), midday (MBL), and time variant (TBL) reference baseline respectively (MBL, TBL; field environment only) using the NWSBs (b0, b1) shown in Figure 2, Figure 3, Figure 4 and Figure 5. In addition, we assessed the sensitivity of replacing the estimated WSB shown in Table 1 with a constant 5 °C for computational simplicity.
In phytotron conditions, CWSI between water regimes (flooded (FL) vs. aerobic (AR)) were statistically significant (p < 0.05) in all cases of the reference baseline parameter assumptions (Figure 6a,b) with more distinct marginal difference observed for IRAT109 compared to Takanari. The mean CWSI for IRAT109 based on CBL was 0.016 and 0.120 for FL and AR respectively. Correspondingly, mean CWSI for Takanari was −0.015 and 0.066. Based on GBL, mean CWSI for IRAT109 was −0.001 and 0.120 under FL and AR respectively. For Takanari, mean CWSI was 0.00 and 0.07 for FL and AR respectively for GBL. When we substituted the estimated WSB shown in Table 1 with a constant 5 °C, the mean CWSI for IRAT109 under FL and AR correspondingly were 0.019 and 0.149 for CBL, −0.002 and 0.130 for GBL. The mean CWSI based on CBL and GBL were −0.019 (FL) and 0.082 (AR), −0.001 (FL) and 0.099 (AR) respectively for Takanari. Notwithstanding the marginal differences between water regimes for both IRAT109 and Takanari, variability was high for IRAT109 compared to Takanari in all reference baseline parameter assumptions (Figure S1).
With respect to field environment conditions, statistically significant difference (p < 0.05) between water regimes in correspondence to CWSI were observed for only Takanari under all reference baseline parameter assumptions except for TBL (Figure 6c). When we replaced the estimated WSB with a constant 5 °C, differences between the water regimes became statistically insignificant for all reference baseline parameter assumptions for both IRAT109 and Takanari except a marginal statistical significance at CBL_5 in the case of Takanari (Figure 6d). The CWSI values presented in Figure 6c,d was constrained between −1 to 1 for analytical purposes. The unconstrained CWSI values are presented as box and density plots (Figures S2 and S4) showing high variability beyond the bounds 0–1 for CWSI values widely reported in the literature. Because the unconstrained CWSI values have no interpretive utility for detecting differences between water regimes, we focused our discussion on the constrained values. Mean CWSI values for MBL was 0.057, 0.110, 0.327, and 0.118 for IRAT109 and Takanari in AR, FL, AR, and FL correspondingly. In the case of MBL_5, mean CWSI varied within the range 0.018–0.124 across water regimes and genotypes. CWSI ranged within 0.118–0.327 and −0.144–(−0.143) for CBL and CBL_5 respectively across water regimes and genotypes. That of GBL, GBL_5, TBL, and TBL_5 ranged within 0.142–0.348, 0.013–0.324, 0.133–0.349, −0.011–0.214 respectively across genotypes and water regimes.

4. Discussion

In this study, we obtained reference baselines for the determination of the crop water stress index (CWSI) for two high yielding rice genotypes (IRAT109 and Takanari) [6] in a temperate humid climate under phytotron and field environment conditions. The field environment was typically characterized by low vapor pressure deficit (VPD) (Figure 5). The few studies conducted on rice which evaluated the utility of the CWSI did not report reference baselines [24,25,27]. In one study [26], where reference baselines were used, they were substitutes from wheat which has a similar canopy architecture to rice. However, obtaining genotype and climate specific reference baselines is crucial because of genotype and species sensitivities to VPD [28,38].
The slope (°C kPa−1), which could be a proxy for transpiration rate sensitivity to VPD [17], and intercept (°C) derived from Equation (3) were −3.04 °C kPa−1 and 3.76 °C in the phytotron (Figure 2a), −5.68 °C kPa−1 and 4.95 °C in the field environment (Figure 2b) for pooled data. The high slope in the field environment compared to the phytotron for the pooled data could be a varied expression of the transpiration rate sensitivity to VPD. In the field environment, the frequency of VPD less than 2 kPa was 96% whereas in the phytotron all VPD values (2.22–4.35 kPa) were above this threshold. Below 2 kPa, there was a weak constrained rate of transpiration water loss whilst above this threshold, sensitivity to VPD was strong. Similar effects were apparent at the genotype level though marginally stronger in Takanari than IRAT109 (Figure 3 and Figure 4). This contrasts with the conclusion of [38], where the limits on transpiration water loss is abolished in rice under flooded conditions in the presence of hypoxia in roots (oxygen deprivation). Research on VPD threshold limits on transpiration water loss under different water management in diverse genotypes of rice are warranted. When we evaluated the effect of VPD on plant canopy-air temperature difference (Tc − Ta) at different time periods (Figure 5), the same effect of low transpiration rate sensitivity to VPD was strong and significant (p < 0.001) particularly during early morning (IRAT109: 08–09 JST, R2 = 0.62; 09–10 JST, R2 = 0.75; Takanari: 08–09 JST, R2 = 0.73; 09–10 JST, R2 = 0.77) and evening (16–17 JST, R2 = 0.82 and 0.89 for IRAT109 and Takanari respectively) when VPDs are expected to be at their lowest levels. Their implications on CWSI values in contrasting water regimes are discussed further.
The CWSI provides a quick diagnostic tool for detecting crop water stress to optimize irrigation frequencies and improve crop productivity [39,40,41]. However, under some conditions, CWSI values are not sensitive to the water regimes imposed [42]. The values observed in our study in the phytotron indicated no stress with a mean of 0.00 and 0.09 in flooded (FL) and aerobic (AR) water regime respectively across genotypes and reference baseline parameter assumption (CBL and GBL) although maximum of 0.242 and 0.356 in FL and AR were attained when GBL was used as a baseline parameter indicating a genotype effect. And with the high variance particularly for IRAT109 (Figure S1), the genotype is a principal factor when exploring the utility of this index in irrigation management. When we explored substitution of the water stressed baseline (WSB) with a constant of 5 °C as commonly used by other studies [24,25,30,39], significant differences (p < 0.05) were still observed between water regimes (Figure 6b) with a difference of 0.174 between FL and AR, while maintaining similar differences at their maximum (0.12) albeit under the CBL parameter assumption. The implication is that irrespective of parameter assumption under stable conditions expected in a controlled environment like the phytotron, the computational convenience of using a constant for the WSB is sufficient. In the case of field environment, the lack of confidence (Figures S3 and S4) in significant crop water stress detection between water regimes in IRAT109 was similar across all four baseline parameter assumptions (Figure 6c,d). The lack of separation between water regimes with respect to IRAT109 is supported by [6], which is an upland adapted genotype with low sensitivity to saturated soil conditions. Although we observed a similar variability in Takanari, the separation of water regimes was significantly distinct under all reference baseline assumptions except TBL (Figure 6c). However, this sensitivity was lost under a constant WSB (Figure 6d). While a constant WSB of 5 °C has proven practical in many conditions, its reliability in a humid temperate environment is untenable in representing the water regimen (Figure S4) particularly for high yielding genotypes and in most cases producing CWSI values with no physical explanation (Figure S2). These values beyond the theoretical bounds of CWSI (that is, 0 < CWSI < 1) have been reported even in more stable climate conditions [14,15].
We expected the CWSI values for both FL and AR water regime to be close to zero, and particularly for FL. While mean CWSI indicated no stress to moderate stress in both FL and AR, their distribution (Figures S1 and S3), ignoring the negative values show severe stress (CWSI > 0.5) even in the case of FL. Two limitations in the use of the estimated reference baselines in the humid environment accounts for this. The first is the basic assumption that, under low VPD, transpiration rate is minimal. That was not the case in our study, where we observed a weak constrain on transpiration water loss below 2 kPa reflected in the slope (°C kPa−1) values which in turn drives the high values estimated for the WSB (Table 1). The consequence of this feedback is the bias of CWSI towards severe stress levels even under continuous FL water regime. Second, because of differing genotype sensitivity to VPD, the scenario of using a common reference baseline (CBL) could shift the detection of severe stress towards high transpiring genotypes in well-watered environments.

5. Conclusions

The objective of this study was to explore the practical usefulness of the crop water stress index (CWSI) in a humid temperate climate under two water regimes (flooded and aerobic) by determining the reference baselines empirically, that is, non-water stressed, and water stressed baseline (NWSB and WSB, respectively) for two high yielding rice genotypes (IRAT109 and Takanari). CWSI was evaluated in its empirical form based on four assumptions in parameter (slope and intercept) selection for computing the NWSB and WSB and by substitution of the WSB with a constant 5 °C for computational simplicity. We observed that genotype sensitivity to vapor pressure deficit (VPD) threshold drives the differences in NWSB and WSB, with low sensitivity in low VPD (<2 kPa) accounting for the bias towards severe stress values in CWSI (>0.5) in flooded and aerobic water regimes. With a constant value for the WSB, uncertainty increased, shown by high variance in CWSI values notably in the field environment. The use of a constant WSB is thus discouraged.
The most pronounced applicative restriction of CWSI in our study is the choice of genotypes (high yielding) in combination with the frequency of low VPD conditions in the field environment. Cooler plant canopies are related to highly productive genotypes, which shifted the baselines higher and in turn biased CWSI, hence further research with a diverse rice germplasm with contrasting sensitivities to VPD will provide a comprehensive outlook on CWSI dynamics in humid conditions.
Finally, while this work has provided unique information, the setup in pots may influence the micro-meteorological characteristics which was not accounted for in our computations. Hence, field validations are required to explore whether these results generalize to field conditions which may have markedly different micro-meteorology.

Supplementary Materials

The following supporting information can be downloaded at: https://www.mdpi.com/article/10.3390/w14121833/s1. Table S1: Summary statistics of significance testing of slope and intercept estimates in field environment; Figure S1: Density plots of crop water stress index in phytotron; Figure S2: Boxplots of unconstrained crop water stress index in field environment; Figure S3: Density plots of constrained crop water stress index in field environment; Figure S4: Density plots of unconstrained crop water stress index in field environment; Figure S5: Example of plant canopy temperature measurement in phytotron and field environment.

Author Contributions

Conceptualization, S.G.-A. and T.K.; Data curation, S.G.-A.; Formal analysis, S.G.-A.; Funding acquisition, T.K.; Investigation, S.G.-A.; Methodology, S.G.-A. and T.K.; Resources, T.K. and K.K.; Supervision, T.K. and K.K.; Visualization, S.G.-A.; Writing—original draft, S.G.-A.; Writing—review & editing, S.G.-A., T.K. and K.K. All authors have read and agreed to the published version of the manuscript.

Funding

This work was partially supported by JSPS KAKENHI Grant number JP20KK0242 and JST SICORP Grant number JPMJSC20E3.

Institutional Review Board Statement

Not applicable.

Informed Consent Statement

Not applicable.

Data Availability Statement

Not applicable.

Acknowledgments

Authors are also grateful to George O. Akoko for his assistance in sampling field soil and setting up the experiments.

Conflicts of Interest

The authors declare no conflict of interest.

References

  1. Elert, E. Rice by the numbers: A good grain. Nature 2014, 514, S50–S51. [Google Scholar] [CrossRef] [Green Version]
  2. Bouman, B.A.M.; Lampayan, R.; Tuong, T. Water Management in Irrigated Rice: Coping with Water Scarcity; International Rice Research Institute: Los Banos, Philippines, 2007. [Google Scholar]
  3. Dubois, O. The State of the World’s Land and Water Resources for Food and Agriculture: Managing Systems at Risk; Earthscan: London, UK, 2011. [Google Scholar]
  4. Lampayan, R.M.; Rejesus, R.M.; Singleton, G.R.; Bouman, B.A. Adoption and economics of alternate wetting and drying water management for irrigated lowland rice. Field Crop. Res. 2015, 170, 95–108. [Google Scholar] [CrossRef]
  5. Oliver, V.; Cochrane, N.; Magnusson, J.; Brachi, E.; Monaco, S.; Volante, A.; Courtois, B.; Vale, G.; Price, A.; Teh, Y.A. Effects of water management and cultivar on carbon dynamics, plant productivity and biomass allocation in European rice systems. Sci. Total Environ. 2019, 685, 1139–1151. [Google Scholar] [CrossRef]
  6. Kato, Y.; Okami, M.; Katsura, K. Yield potential and water use efficiency of aerobic rice (Oryza sativa L.) in Japan. Field Crop. Res. 2009, 113, 328–334. [Google Scholar] [CrossRef]
  7. Peng, S.; Bouman, B.; Visperas, R.M.; Castañeda, A.; Nie, L.; Park, H.-K. Comparison between aerobic and flooded rice in the tropics: Agronomic performance in an eight-season experiment. Field Crop. Res. 2006, 96, 252–259. [Google Scholar] [CrossRef]
  8. Tsujimoto, Y.; Fuseini, A.; Inusah, B.I.; Dogbe, W.; Yoshimoto, M.; Fukuoka, M. Different effects of water-saving management on canopy microclimate, spikelet sterility, and rice yield in the dry and wet seasons of the sub-humid tropics in northern Ghana. Field Crop. Res. 2020, 260, 107978. [Google Scholar] [CrossRef]
  9. Khorsand, A.; Rezaverdinejad, V.; Asgarzadeh, H.; Majnooni-Heris, A.; Rahimi, A.; Besharat, S.; Sadraddini, A.A. Linking plant and soil indices for water stress management in black gram. Sci. Rep. 2021, 11, 869. [Google Scholar] [CrossRef]
  10. Shimono, H.; Okada, M.; Inoue, M.; Nakamura, H.; Kobayashi, K.; Hasegawa, T. Diurnal and seasonal variations in stomatal conductance of rice at elevated atmospheric CO2 under fully open-air conditions. Plant Cell Environ. 2009, 33, 322–331. [Google Scholar] [CrossRef]
  11. Kato, Y.; Okami, M. Root growth dynamics and stomatal behaviour of rice (Oryza sativa L.) grown under aerobic and flooded conditions. Field Crop. Res. 2010, 117, 9–17. [Google Scholar] [CrossRef]
  12. Bouman, B.A.M.; Humphreys, E.; Tuong, T.P.; Barker, R. Rice and Water. Adv. Agron. 2007, 92, 187–237. [Google Scholar]
  13. Agam, N.; Cohen, Y.; Alchanatis, V.; Ben-Gal, A. How sensitive is the CWSI to changes in solar radiation? Int. J. Remote Sens. 2013, 34, 6109–6120. [Google Scholar] [CrossRef]
  14. DeJonge, K.C.; Taghvaeian, S.; Trout, T.J.; Comas, L. Comparison of canopy temperature-based water stress indices for maize. Agric. Water Manag. 2015, 156, 51–62. [Google Scholar] [CrossRef]
  15. Taghvaeian, S.; Comas, L.; DeJonge, K.C.; Trout, T.J. Conventional and simplified canopy temperature indices predict water stress in sunflower. Agric. Water Manag. 2014, 144, 69–80. [Google Scholar] [CrossRef]
  16. Poirier-Pocovi, M.; Bailey, B. Sensitivity analysis of four crop water stress indices to ambient environmental conditions and stomatal conductance. Sci. Hortic. 2019, 259, 108825. [Google Scholar] [CrossRef]
  17. Idso, S.B.; Jackson, R.D.; Pinter, P.J., Jr.; Reginato, R.J.; Hatfield, J.L. Normalizing the stress-degree-day parameter for environmental variability. Agric. Meteorol. 1981, 24, 45–55. [Google Scholar] [CrossRef]
  18. Testi, L.; Goldhamer, D.A.; Iniesta, F.; Salinas, M. Crop water stress index is a sensitive water stress indicator in pistachio trees. Irrig. Sci. 2008, 26, 395–405. [Google Scholar] [CrossRef] [Green Version]
  19. Idso, S.B. Non-water-stressed baselines: A key to measuring and interpreting plant water stress. Agric. Meteorol. 1982, 27, 59–70. [Google Scholar] [CrossRef]
  20. Maes, W.H.; Steppe, K. Estimating evapotranspiration and drought stress with ground-based thermal remote sensing in agriculture: A review. J. Exp. Bot. 2012, 63, 4671–4712. [Google Scholar] [CrossRef] [Green Version]
  21. Poirier-Pocovi, M.; Volder, A.; Bailey, B. Modeling of reference temperatures for calculating crop water stress indices from infrared thermography. Agric. Water Manag. 2020, 233, 106070. [Google Scholar] [CrossRef]
  22. Apolo-Apolo, O.E.; Martínez-Guanter, J.; Pérez-Ruiz, M.; Egea, G. Design and assessment of new artificial reference surfaces for real time monitoring of crop water stress index in maize. Agric. Water Manag. 2020, 240, 106304. [Google Scholar] [CrossRef]
  23. Jones, H.G.; Stoll, M.; Santos, T.; De Sousa, C.; Chaves, M.M.; Grant, O.M. Use of infrared thermography for monitoring stomatal closure in the field: Application to grapevine. J. Exp. Bot. 2002, 53, 2249–2260. [Google Scholar] [CrossRef]
  24. Xu, J.; Lv, Y.; Liu, X.; Dalson, T.; Yang, S.; Wu, J. Diagnosing Crop Water Stress of Rice using Infra-red Thermal Imager under Water Deficit Condition. Int. J. Agric. Biol. 2016, 18, 565–572. [Google Scholar] [CrossRef]
  25. Luan, Y.; Xu, J.; Lv, Y.; Liu, X.; Wang, H.; Liu, S. Improving the performance in crop water deficit diagnosis with canopy temperature spatial distribution information measured by thermal imaging. Agric. Water Manag. 2020, 246, 106699. [Google Scholar] [CrossRef]
  26. Ingram, K.T.; Real, J.G.; Maguling, M.A.; Obien, M.A.; Loresto, G.C. Comparison of selection indices to screen lowland rice for drought resistance. Euphytica 1990, 48, 253–260. [Google Scholar] [CrossRef]
  27. Fitriyah, A.; Fatikhunnada, A.; Okura, F.; Nugroho, B.D.A.; Kato, T. Analysis of the Drought Mitigated Mechanism in Terraced Paddy Fields Using CWSI and TVDI Indices and Hydrological Monitoring. Sustainability 2019, 11, 6897. [Google Scholar] [CrossRef] [Green Version]
  28. Prior, A.; Apolo-Apolo, O.E.; Castro-Valdecantos, P.; Pérez-Ruiz, M.; Egea, G. Long-Term Assessment of Reference Baselines for the Determination of the Crop Water Stress Index in Maize under Mediterranean Conditions. Water 2021, 13, 3119. [Google Scholar] [CrossRef]
  29. Bellvert, J.; Marsal, J.; Girona, J.; Zarco-Tejada, P.J. Seasonal evolution of crop water stress index in grapevine varieties determined with high-resolution remote sensing thermal imagery. Irrig. Sci. 2014, 33, 81–93. [Google Scholar] [CrossRef]
  30. García-Tejero, I.F.; Rubio, A.E.; Viñuela, I.; Hernández, A.; Gutiérrez-Gordillo, S.; Rodríguez-Pleguezuelo, C.R.; Durán-Zuazo, V.H. Thermal imaging at plant level to assess the crop-water status in almond trees (cv. Guara) under deficit irrigation strategies. Agric. Water Manag. 2018, 208, 176–186. [Google Scholar] [CrossRef]
  31. Abidin, M.S.B.Z.; Shibusawa, S.; Ohaba, M.; Li, Q.; Bin Khalid, M. Capillary flow responses in a soil–plant system for modified subsurface precision irrigation. Precis. Agric. 2013, 15, 17–30. [Google Scholar] [CrossRef] [Green Version]
  32. Aschonitis, V.; Diamantopoulou, M.; Papamichail, D. Modeling plant density and ponding water effects flooded rice ET and crop coefficients: Critical discussion about the concepts used in current methods. Theor. Appl. Climatol. 2017, 132, 1165–1186. [Google Scholar] [CrossRef]
  33. Leinonen, I.; Jones, H.G. Combining thermal and visible imagery for estimating canopy temperature and identifying plant stress. J. Exp. Bot. 2004, 55, 1423–1431. [Google Scholar] [CrossRef] [PubMed] [Green Version]
  34. Jones, H.G.; Sirault, X.R.R. Scaling of Thermal Images at Different Spatial Resolution: The Mixed Pixel Problem. Agronomy 2014, 4, 380–396. [Google Scholar] [CrossRef] [Green Version]
  35. Fukuoka, M.; Yoshimoto, M.; Hasegawa, T. Varietal Range in Transpiration Conductance of Flowering Rice Panicle and Its Impact on Panicle Temperature. Plant Prod. Sci. 2012, 15, 258–264. [Google Scholar] [CrossRef] [Green Version]
  36. Murray, F.W. On the Computation of Saturation Vapor Pressure. J. Appl. Meteorol. 1967, 6, 203–204. [Google Scholar] [CrossRef]
  37. García-Tejero, I.F.; Hernández, A.; Padilla-Díaz, C.M.; Diaz-Espejo, A.; Fernández, J.E. Assessing plant water status in a hedgerow olive orchard from thermography at plant level. Agric. Water Manag. 2017, 188, 50–60. [Google Scholar] [CrossRef] [Green Version]
  38. Parent, B.; Suard, B.; Serraj, R.; Tardieu, F. Rice leaf growth and water potential are resilient to evaporative demand and soil water deficit once the effects of root system are neutralized. Plant Cell Environ. 2010, 33, 1256–1267. [Google Scholar] [CrossRef]
  39. Irmak, S.; Haman, D.Z.; Bastug, R. Determination of Crop Water Stress Index for Irrigation Timing and Yield Estimation of Corn. Agron. J. 2000, 92, 1221–1227. [Google Scholar] [CrossRef]
  40. Gutiérrez-Gordillo, S.; García-Tejero, I.F.; Zuazo, V.H.D.; Escalera, A.G.; Gil, F.F.; Amores-Agüera, J.J.; Rodríguez, B.C.; Hernández-Santana, V. Assessing the Water-Stress Baselines by Thermal Imaging for Irrigation Management in Almond Plantations under Water Scarcity Conditions. Water 2020, 12, 1298. [Google Scholar] [CrossRef]
  41. King, B.; Tarkalson, D.; Sharma, V.; Bjorneberg, D. Thermal Crop Water Stress Index Base Line Temperatures for Sugarbeet in Arid Western U.S. Agric. Water Manag. 2020, 243, 106459. [Google Scholar] [CrossRef]
  42. Agam, N.; Cohen, Y.; Jimenez-Berni, J.A.; Alchanatis, V.; Kool, D.; Dag, A.; Yermiyahu, U.; Ben-Gal, A. An insight to the performance of crop water stress index for olive trees. Agric. Water Manag. 2013, 118, 79–86. [Google Scholar] [CrossRef]
Figure 1. Meteorological conditions throughout the experiment in 2019 (May−October) and 2020 (July−December): (a) relative humidity; (b) daily average air temperature; (c) solar radiation. 30-year average solar radiation was obtained from the Automated Meteorological Data Acquisition Systems (AMeDAS) Tokyo site (35°42′ N, 139°45′ E) and 30-year average daily temperature was obtained from AMeDAS Fuchu site (35°41′ N, 139°29′ E). Air temperature shown in (b) for the phytotron indicates independently monitored values.
Water 14 01833 g001
Figure 2. Relationship between plant canopy-air temperature difference (Tc −Ta) and vapor pressure deficit (VPD) of rice in flooded conditions in (a) phytotron and (b) field environment. Data for IRAT109 and Takanari on 25 July 2019 and 30 July 2019 (70 and 75 days after sowing respectively) between 10:53 and 16:05 JST are pooled in the case of the phytotron; 16 September 2020−14 October 2020 and 08:00–17:00 JST for the field environment. The straight broken lines are the best fit regression lines. b0 and b1 are intercept (°C) and slope (°C kPa−1) respectively.
Water 14 01833 g002
Figure 3. Relationship between plant canopy-air temperature difference (Tc − Ta) and vapor pressure deficit (VPD) of rice in flooded conditions per genotype (IRAT109 and Takanari) in the phytotron. The straight broken lines are the best fit regression lines. b0 and b1 are intercept (°C) and slope (°C kPa−1) respectively.
Water 14 01833 g003
Figure 4. Relationship between plant canopy-air temperature difference (Tc − Ta) and vapor pressure deficit (VPD) of rice in flooded conditions in field environment per genotype. Data from 08:00 –17:00 JST is pooled per genotype. The straight broken lines are the best fit regression lines. b0 and b1 are intercept (°C) and slope (°C kPa−1) respectively.
Water 14 01833 g004
Figure 5. Relationship between plant canopy-air temperature difference (Tc − Ta) and vapor pressure deficit (VPD) of rice in flooded conditions in field environment per time of day. Each panel represents a genotype, and a different color denotes a time period. The straight broken lines are the best fit regression lines. b0 and b1 are intercepts (°C) and slopes (°C kPa−1) respectively.
Water 14 01833 g005
Figure 6. Boxplots of the crop water stress index between flooded and aerobic water regime based on two (phytotron only (a,b)) and four (field environment only (c,d)) reference baseline parameter assumptions for two rice genotypes (IRAT109 and Takanari). CBL; common reference baseline, GBL; genotype reference baseline, MBL; midday reference baseline (12−13 JST), TBL; time variant reference baseline. Reference baselines with the suffix (_5) indicates a constant water stressed temperature limit (Tc − Ta)WSB of 5 °C as described by [37]. Boxes indicate 25th and 75th percentiles and tails indicate 5th and 95th percentiles. The red dots and cross mark (×) indicate outliers and mean respectively. p-values < 0.05 indicates significant differences between water regimes. JST; Japan Standard Time.
Water 14 01833 g006aWater 14 01833 g006b
Table 1. Estimated water stressed baseline (WSB) (Tc − Ta)WSB of IRAT109 and Takanari in flooded and aerobic water regimes based on contrasting reference baseline assumptions. Values are mean ± standard deviation. CBL: Common reference baseline; GBL: Genotype reference baseline; MBL: Midday reference baseline; TBL: Time variant reference baseline.
(Tc −Ta)WSB (°C) a
Genotype/Water RegimeConditionCBLGBLMBL bTBL
IRAT109
Flooded 8.08 ± 0.426.13 ± 0.31n/an/a
AerobicPhytotron8.08 ± 0.426.13 ± 0.31n/an/a
Takanari
Flooded 8.08 ± 0.4210.21 ± 0.56n/an/a
Aerobic 8.08 ± 0.4210.21 ± 0.56n/an/a
IRAT109
Flooded 10.52 ± 0.8210.54 ± 0.8113.08 ± 1.0311.45 ± 1.69
AerobicField environment10.52 ± 0.8210.54 ± 0.8113.08 ± 1.0311.45 ± 1.69
Takanari
Flooded 10.53 ± 0.8310.46 ± 0.8410.39 ± 0.779.91 ± 1.68
Aerobic 10.52 ± 0.8210.45 ± 0.8310.38 ± 0.769.90 ± 1.67
a Estimated from Equation (4). b MBL indicates the time 12–13 Japan Standard Time. n/a: not available.
Publisher’s Note: MDPI stays neutral with regard to jurisdictional claims in published maps and institutional affiliations.

