Article

Spatial and Temporal Variations of the Water Quality of the Tiflet River, Province of Khemisset, Morocco

1
Organic Chemistry, Catalysis and Environment, Department of Chemistry, Faculty of Science, Ibn Tofail University, Kenitra 14000, Morocco
2
Laboratory of Animal and Plant Production and Agro-Industry, Department of Biology, Faculty of Science, Ibn Tofail University, Kenitra 14000, Morocco
3
Laboratory of Biotechnology, Conservation and Valorisation of Naturals Resources (LBCVNR), Faculty of Sciences Dhar El Mehraz, University Sidi Mohamed Ben Abdallah, BP 1796 Atlas, Fez 30000, Morocco
4
National Water Monitoring Laboratory, Rabat 10000, Morocco
5
Laboratory of Functional Ecology and Environment, Faculty of Sciences and Technology, Sidi Mohamed Ben Abdellah University, Imouzzer Street, Fez 30000, Morocco
6
Department of Zoology, College of Science, King Saud University, P.O. Box 2455, Riyadh 11451, Saudi Arabia
7
Zoology Department, Faculty of Science, Cairo University, Giza 12613, Egypt
8
Research Centre for Food and Nutrition, Council for Agricultural Research and Economics (CREA-AN), Via Ardeatina 546, 00178 Rome, Italy
*
Authors to whom correspondence should be addressed.
Water 2022, 14(12), 1829; https://doi.org/10.3390/w14121829
Submission received: 28 April 2022 / Revised: 25 May 2022 / Accepted: 27 May 2022 / Published: 7 June 2022
(This article belongs to the Special Issue Water Quality Changes of Lakes and Rivers)

Abstract

:
Humanity’s water needs are constantly increasing, however, under the action of humanity themselves, the reserves of this substance are, constantly, deteriorating in quantity and quality. It is, therefore, necessary to preserve the water reserves. However, any development of a hydrosystem’s quality conservation strategy is based on determining the chemical characteristics of its waters. Therefore, the objective of this study is to investigate the spatial and temporal variations of water quality in the Tiflet River, a watercourse in the northwest of Morocco, to estimate its degree of pollution and to determine its main sources of pollution. Thus, eight stations, distributed along the watercourse and positioned taking into account the potential sources of pollution, were fixed, and eleven physicochemical parameters were, seasonally, evaluated. Multivariate statistical techniques were used to assess variations in water quality and identify the main factors responsible for pollution. The results showed that wastewater discharges into the river can increase the water salinity, phosphorus load and organic pollution load of the river. The total loads of nitrogen and nitrate pollution were higher compared to the standard norms in the stations exposed to agricultural pollution and to the leaching of the watersheds, which could aggravate the eutrophication state of the river and stimulate the growth of aquatic vegetation. The organic pollution load recorded in the wet season is low, compared to that recorded in the dry season. Whereas, the nutrient load recorded during the dry season is low, compared to that recorded in the wet season. An overall pollution index was used, classifying surface waters from sub-clean to moderately polluted.

1. Introduction

In many countries of the world, the question of water quality is a concern. The different uses of this substance by humans and their industrial activities explain the importance and the particular interest given to this element of life. However, in many countries, water resources are experiencing qualitative and quantitative degradation [1]. This degradation is generated and accentuated by population growth, agricultural development, industrialization and use of fertilizers and pesticides [2]. These activities, mainly of human origin, have consequences on the health, economy and ecological balance of aquatic ecosystems [3,4]. It is, therefore, necessary to find a solution to this problem, by implementing an integrated and sustainable development policy, to safeguard this environment. For this, a good prior knowledge of the physical and chemical characteristics of water and soil, as well as the climatic and hydrological context, is necessary.
During the last century, Morocco, like the countries of the Mediterranean region, has been confronted with the problems of the continual degradation of its watercourses. The degradation of waterways has been accentuated by climate change and the succession of periods of drought, which have been putting the country on the path to a major water crisis. Indeed, the disruption of seasonal precipitation could lead to a disruption of runoff inputs. In addition, higher temperatures could have higher evaporation and, therefore, less renewable water potential. In addition, the demand for water is likely, with higher temperatures, to increase, particularly in agricultural irrigated areas. Anxious to preserve its natural ecosystems, Morocco is committed to numerous conventions [1], in particular through the implementation of major projects for the collection and treatment of domestic and industrial wastewater and the integrated management of water resources, implemented by nine basin agencies [5]. The Tiflet River, in northwestern Morocco, is one of the natural resources affected by the qualitative and quantitative degradation of water. Indeed, the quality of the water in this river is threatened by discharges of domestic or industrial wastewater, household waste, land-use patterns, leaching of fertilizers and phytosanitary products used in the basin. The high volume of discharges adds more vulnerability to these challenges, which threatens the physicochemical quality and, consequently, the quality of the river. Thus, it is necessary to seek a solution, allowing the reuse of this previously polluted water [6]. It should be noted that in many countries, this reuse of polluted water has become unavoidable [7]. However, for any project to use the waters of a hydrosystem, the analysis and physicochemical evaluation of these waters are necessary. In recent years, principal component analysis (PCA) has been widely applied to assess the physicochemical quality of surface waters and to understand the spatio-temporal variation of pollutants [1,2]. A statistical study (Multivariate Statistical Analysis of Surface Water Quality Based on Correlations and Variations of the Data Set) [2] confirmed the usefulness of Principal Component Analysis (PCA) technique for the analysis of water quality. Other studies have shown the power of the technique (PCA), to identify possible factors or sources that affect the quality of aquatic ecosystems [3,4]. The present study aims at estimating the values of 12 physicochemical parameters of the Tiflet River, namely: temperature (T), dissolved oxygen (DO), conductivity (CD), pH, of biochemical oxygen demand (BOD5), chemical oxygen demand (COD), total phosphorus (TP), Orthophosphates (PO4-P), TKN, nitrate and ammonium [2]. The objective of this study is to evaluate the effect of human activities on water quality and to carry out a physicochemical typology, to determine the physicochemical heterogeneity of the waters of the river studied.

2. Materials and Methods
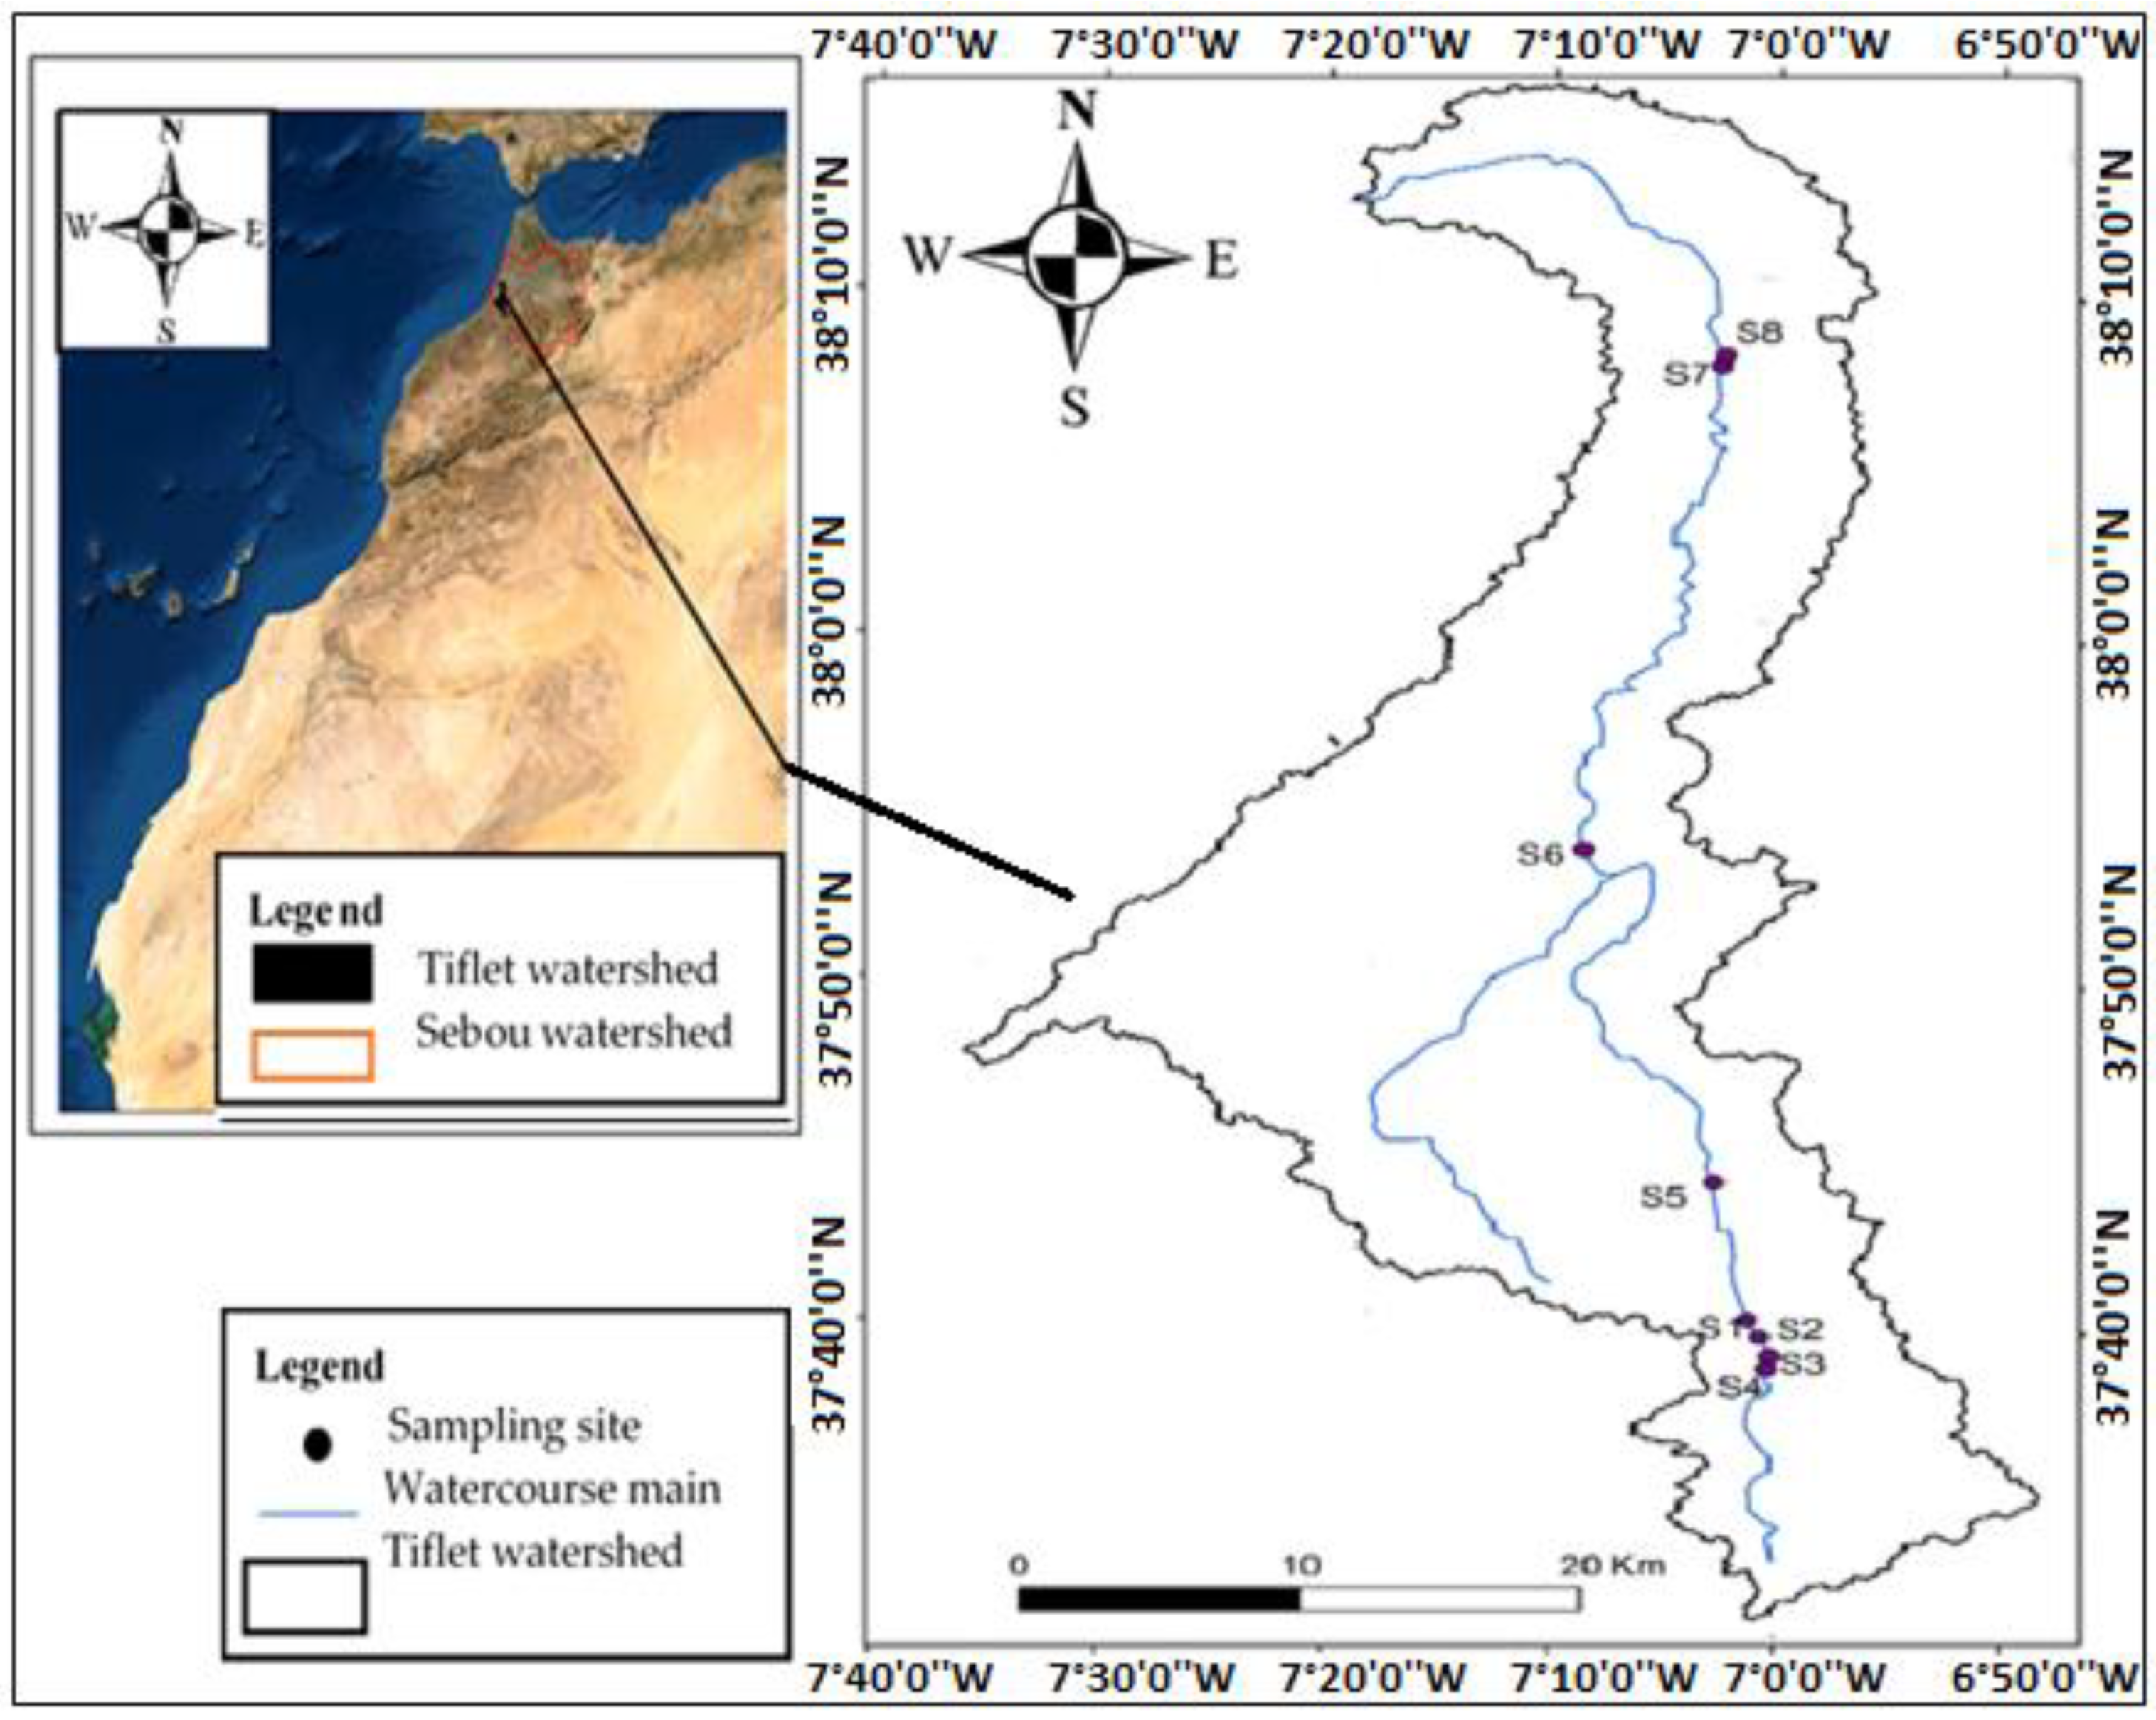
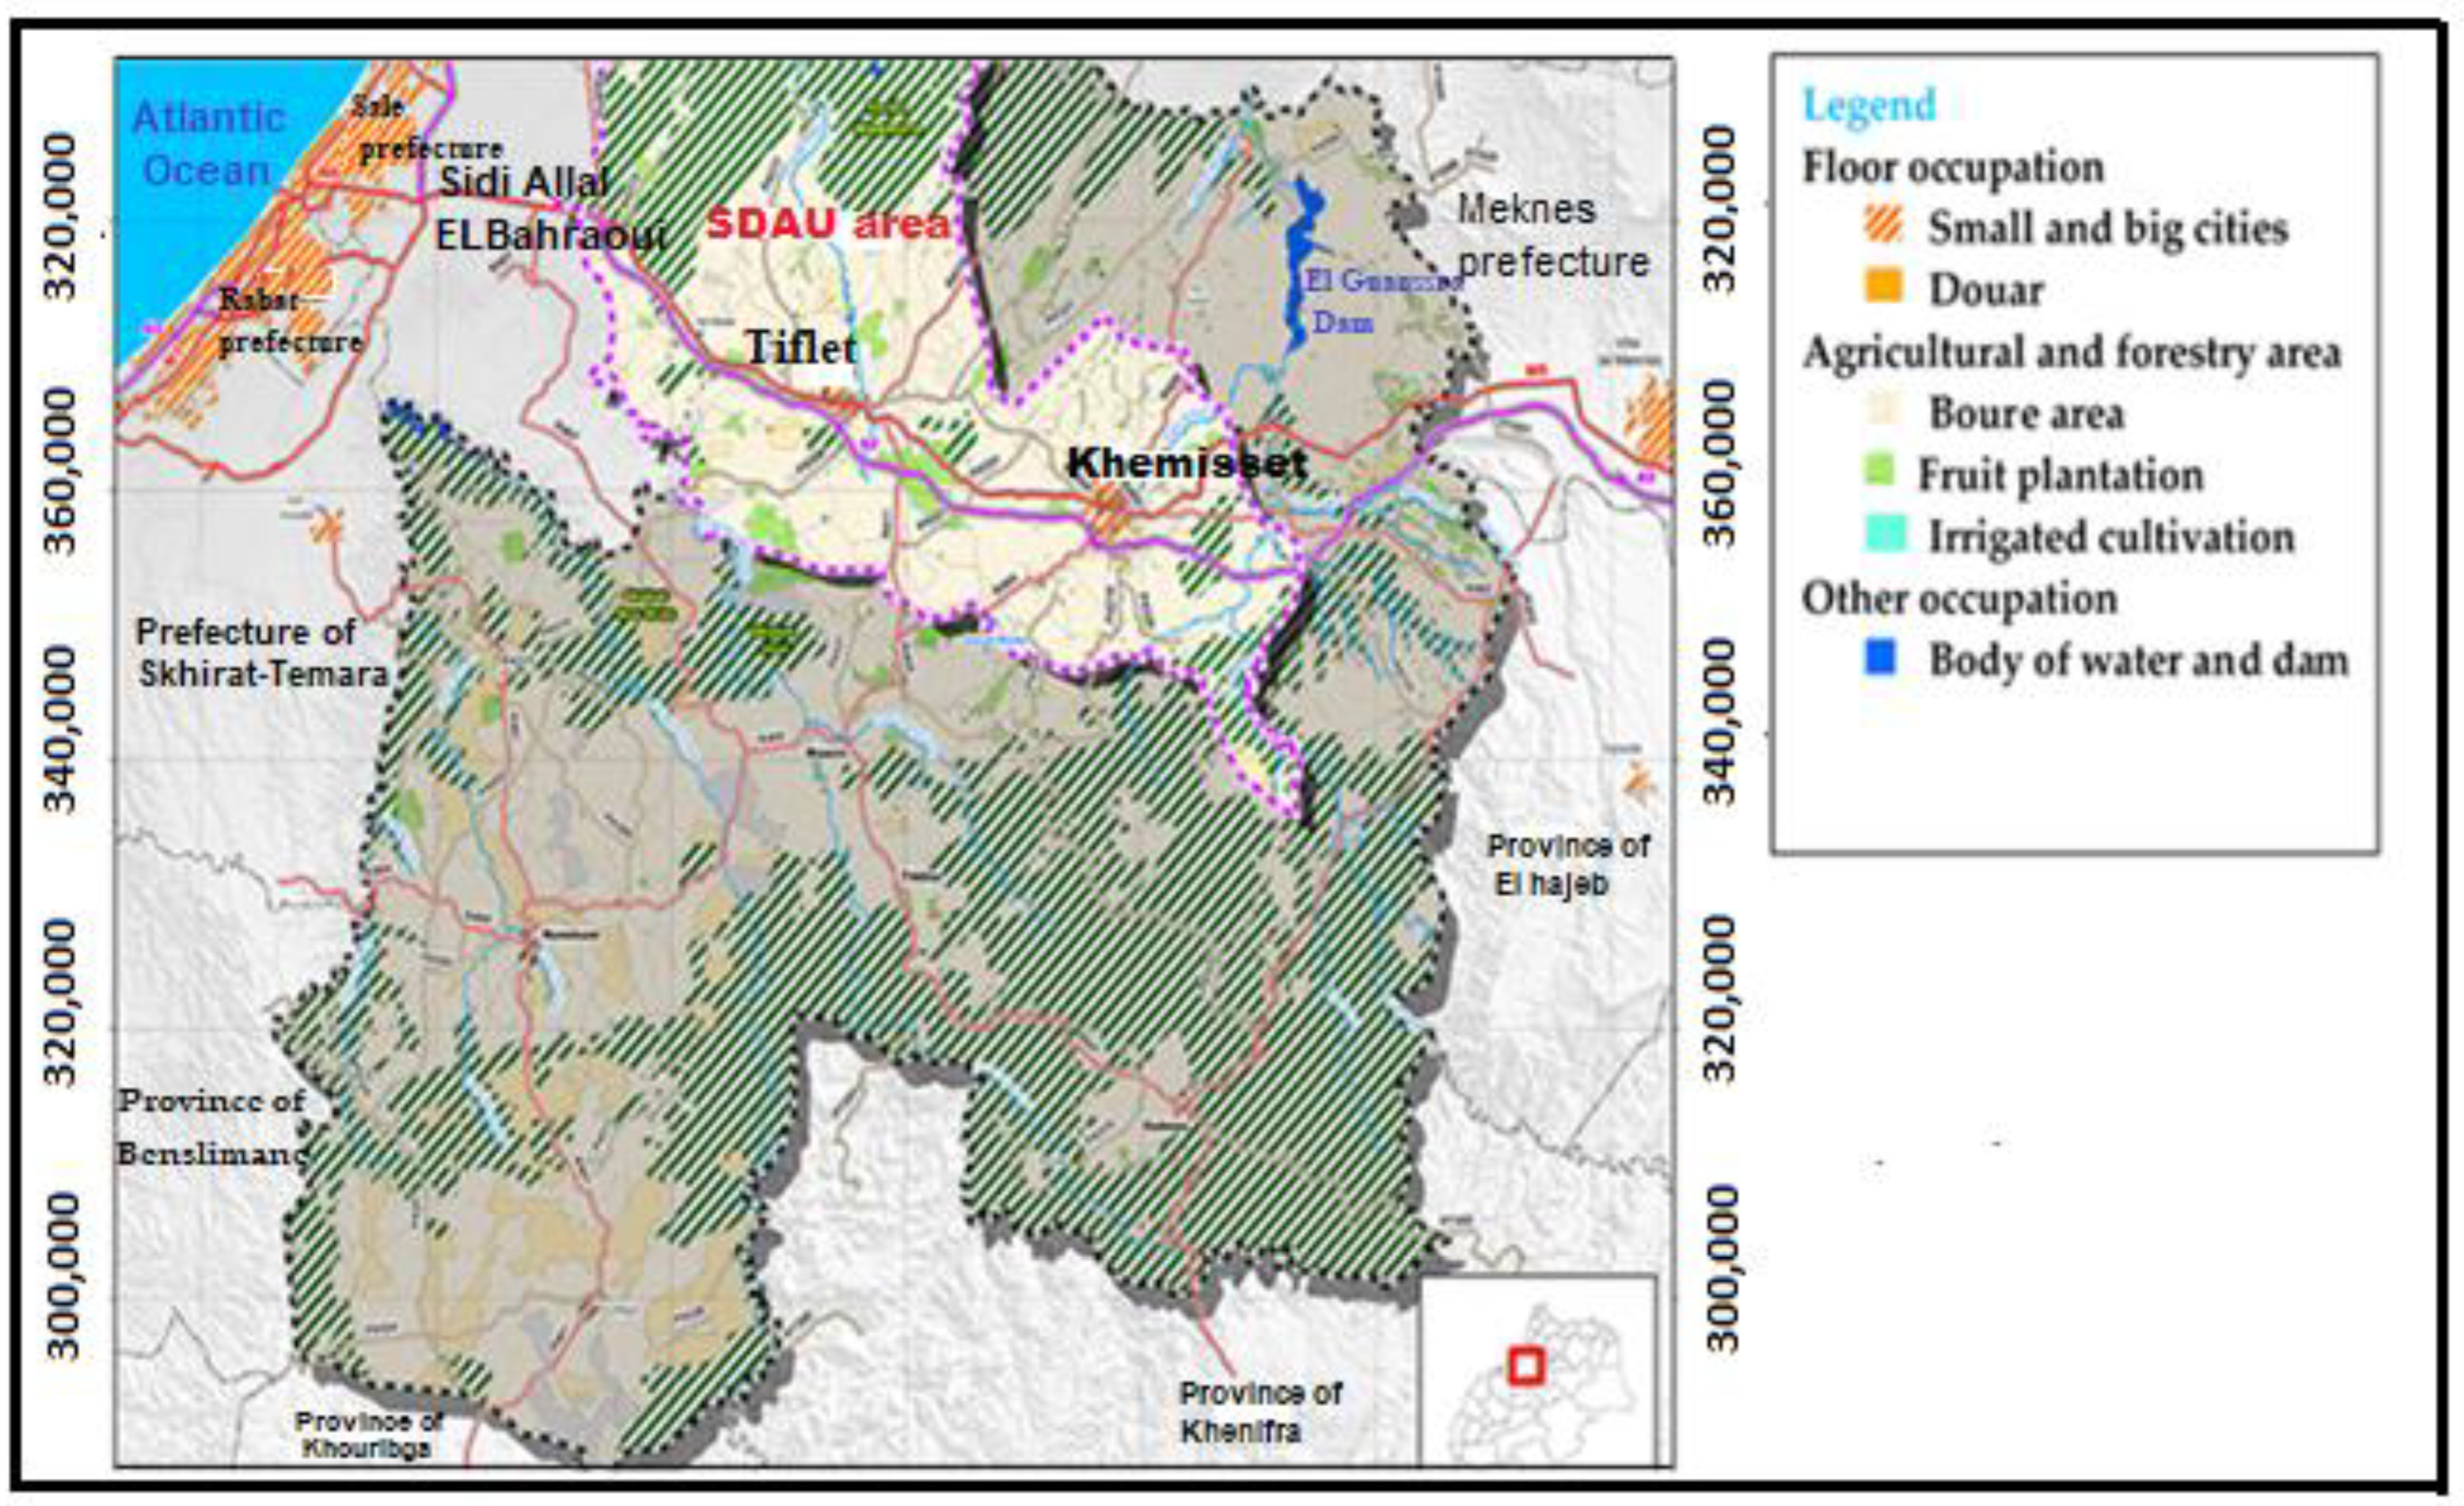
2.1. Study Zone

Oued Tiflet (Figure 1), a watercourse in the Rabat-Salé-Kénitra region, is part of the Sebou hydrological basin. It has major socio-economic importance for the inhabitants (irrigation, abbreviation,). However, in places, it receives untreated wastewater, especially at stations S1, S2, S7 and S8. The climate of its basin is semi-arid, and the agricultural sector is the main driver of the region’s economy.

2.2. Choice of Stations and Sampling Procedures

Eight stations, distributed along the studied river, have been fixed. The choice of these stations took into account the heterogeneity of the environment, in particular, the position of the probable pollution resources. Table 1 illustrates the geographical position of the stations surveyed. The water samples, taken (two trials for each station) in summer (e), autumn (a), winter (h) and spring (p), were collected, refrigerated (±4 °C) in isothermal boxes and transported the same day to the laboratory, where the physicochemical analysis procedures were carried out within 48 h of collection.

2.3. Statistical Analysis Methods of Estimated Variables

The parameters (temperature, dissolved oxygen, conductivity, pH) were measured in situ, using a HACH-type multiparameter device, model HQ40d, while the BOD5 was determined by the electrometric method. The chemical oxygen demand (COD) is determined by the closed system reflux method, followed by a colorimetric determination with potassium dichromate; the wavelength of the spectrophotometer is adjusted to 600 nm. The TKN was measured after mineralizing the water with selenium. Nitrates were assayed by an automated colorimetric method, with hydrazine sulfate and N-1-naphthylethylenediamine dihydrochloride (N.E.D); followed by a spectro-photometer reading at 324 nm. The ammonium was determined by a colorimetric method. PT-P and PO4-P were measured by the phosphomolybdic-complex-photometric method. All water quality analyses were carried out at the National Laboratory for Water Studies and Monitoring, according to standard water analysis methods.

2.4. Global Assessment of the Water Quality of the River

The water quality is estimated by evaluating the global pollution index P. As indicated by Zhao et al., 2012 [5], the relationship Equation (1), used to calculate the global pollution index, is presented below (Table 2) [5]:
P = 1 n i = 1 n Ci / Si
  • where P is the global pollution index.
  • Ci: is the measured concentration of the pollutant (mg/L),
  • Si: represents the limits authorized by Moroccan standards, [6],
  • n: is the number of pollutants selected.

2.5. Multivariate Statistic Alanalysis

Statistical calculations of seasonal data (June, September and December 2018 and March 2019) were performed using univariate, bivariate (correlation) and multivariate (principal component analysis, PCA) statistical analyses. All mathematical and statistical calculations were performed using Excel 2016 (Microsoft, Casablanca, Morocco) and SPSS Statistics 26 (IBM, New York, NY, USA). The first method makes it possible to describe the spatio-temporal distribution of a variable, the second method makes it possible to study the relations between two variables, and the third method makes it possible to determine the sources and the factors responsible for the variation of the physicochemical-quality water from the studied river. It is both a geometric and a statistical approach [8,9]. Note that the performance of the statistical method has been tested using Kaiser–Mayer–Olkin (KMO). The KMO value must be greater than 0.5; here, the KMO index equals 0.634, and, also, as tested by the Bartlett test, this indicates that it is effective to use method factor analysis, for a reduction in the dimensionality of the dataset.
Furthermore, in this research, PCA was performed on a chemical component correlation (Pearson correlation) matrix, to identify the most significant parameters. Thus, each water quality parameter was normalized (z scale), and PCA scores were obtained from standardized analytical data.

3. Results and Discussion

3.1. The Physicochemical Characteristics of Wadi Tiflet Water

The basic water quality statistics for the Tiflet River are summarized in Table 3, which gives the range, mean and standard deviation of the results, for each of the 11 parameters and, also, gives the COD/BOD5 ratio.
In the summer season, the water temperatures vary between 33.60 °C (S6) and 20.10 °C (S4). In autumn, temperatures fluctuate between 31.10 °C (S2) and 15.90 °C (S1). On the other hand, in winter, it oscillates between 22 °C (S6) and 15.4 °C (S1) and, in spring, between 28.8 °C (S6) and 19.9 °C (S3). It can, therefore, be seen that the temperatures measured during the low-water period are higher than those measured during the rainy period, which is normally the cold period. These thermal variations depend on the seasonal variability of the climate, since the sampling takes place at the same time for the same sampling site. Note that the variation in the temperature during the same season is explained by the great variation in sampling times, which is dispersed between 7 a.m. and 4 p.m. Moreover, the water temperature varies from station to station. Indeed, the high temperature values recorded in the stations exposed to slaughterhouse discharges (S2) and industrial discharges (S7 and S8), during the dry period, are explained by the discharge of relatively hot water into the river [10]. The waters of the Tiflet River are alkaline and vary according to the stations and the seasons. In summer, the pH is between 7.29 (S8) and 8.52 (S6). In autumn, the pH varies between 7.36 (S4) and 8.28 (S6). In winter, it varies between 7.66 (S1) and 8.13 (S6) and, in spring, between 7.24 (S2) and 8.62 (S7). Maximum pH values were observed in spring and summer. The high pH values of the river waters could be explained by the photosynthetic activity of aquatic plants favored by the increase in water temperature and light. At the spatial scale, the high values are displayed at stations S2, S6, S7 and S8, which are exposed to wastewater discharges and agricultural discharges. In contrast, the lowest values were noted in S1, S3, S4 and S5, which are far from any source of pollution or any significant amount of decaying organic matter. In addition, in the S7 station, the high pH varies between 7.57 and 8.62, and these high values could be due to the composition of the wastewater and the solid waste discharged or accumulated in the station [11]. Throughout the year, the conductivity values vary between 1070 µS/cm, recorded in summer, rein S4, and 5300 µS/cm, in S2. This last value exceeds the Moroccan standard for surface water [6]. In autumn, the values oscillate between 4280 µS/cm (S2) and 1097 µS/cm (S4); in winter, they oscillate between 1095 µS/cm and 1732 µS/cm, recorded in station S3, and between 2144 µS/cm and 1048 µS/cm. The values, therefore, vary according to the station and the season. The variation from one station to another is made according to the geology of the station and the inputs of sewage from human origin. Indeed, the high conductivity values are recorded in the stations fed by agricultural (S5 and S6), industrial (S8) and wastewater (S1, S2 and S7) discharges. On the other hand, the low values, recorded in stations S3 and S4, are far from any source of pollution. It should, also, be noted that station S2 had a very high degree of salinity during the dry season, which is due to the infiltration of domestic wastewater from the town of Tiflet. Low salinity levels have been recorded during the rainy season, when the volume of the river is very high, hence the phenomenon of river dilution [12]. The dissolved oxygen values, during the summer season, oscillate between 0.14 mg/L (in S8) and 8.24 mg/L (in S6). For the autumn season, the values vary between 0.12 mg/L (in S2) and 7.12 mg/L (in S6). In winter, the values show an increase in the majority of stations and vary between 2.81 mg/L (S1) and 8.73 mg/L (S3). In spring, the values oscillate between 0.36 mg/L in (S1) and 12.22 mg/L (S7). The recorded values, therefore, show a great variation, according to the seasons and the stations. The variation in dissolved oxygen concentration, from one station to another, could be due to various factors, including the speed of water flow, the depth of the river, the abundance of vegetation along the river, the physicochemical characteristics and the presence or absence of micro-organisms in the station [10]. The low values, noted in S1, S2, S7 and S8, are due to the combination of the low flow of the river and the presence of oxygen-consuming microorganisms. On the other hand, the high values of stations S3, S4, S5 and S6 are explained by the high speed of the river flow. Similarly, the seasonal variations in dissolved oxygen concentration show very high values during winter and spring. This is, mainly, due to the decrease in water temperature and the significant agitation of the water at the surface of the water, observed during these periods, which promote an increase in air exchange between the surface of the river and the atmosphere. On the other hand, the values recorded during the summer season and the autumn season are very low, due to the activity of aquatic microorganisms [13] and the rate of re-aeration because of high temperatures. In fact, the solubility of oxygen in water decreases when the temperature increases, which induces a decrease in the oxygen concentration at saturation. In addition, dissolved oxygen is one of the pollution-indicator parameters; its value informs us about the degree of pollution and the importance of self-purification of the river [14].

3.2. BOD5 (Biochemical Oxygen Demand)

In summer, the BOD5 values fluctuate between 3 mg/L in S4 and 200 mg/L, in S8. In autumn, the values vary between a value of 1 mg/L in S4 and 280 mg/L, in S2. On the other hand, in winter, the values oscillate between 1 mg/L, in S4, and a value of 75 mg/L, in S2. In spring, the values oscillate between a value of 1 mg/L, in S4, and 420 mg/L, in S2. From the results obtained, there is, therefore, a variation according to the seasons and the stations. The variation in BOD5, from station to station, depends on the speed of the river flow and the organic load. Indeed, the high values of the biochemical oxygen demand (BOD5), in the stations that are affected by wastewater (S1, S2 and S8), are coming from the towns of Tiflet and Sidi Yahya El Gharb. These wastewater discharges cause an increase in the organic load of the river water. On the other hand, the low values were recorded in the other stations (S3, S4, S5 and S6), which are far from any influence of wastewater, except in station S7, where the speed of the water flow of the river is important.
In addition, the BOD5 values recorded in the dry season are large, compared to those recorded in the wet season. In fact, in station S8, for example, the BOD5 value fluctuates between 20 mg/L, recorded in the wet season, and 200 mg/L, recorded in the dry season. This could be explained by the dilution of water, loaded with organic matter, in the wet season. It should be noted that in the dry season, the degradation of organic matter by microorganisms consumes oxygen and may be at the origin of the self-purification of the waters of the hydrosystem [15].

3.3. COD (Chemical Oxygen Demand)

The values vary between 3 mg/L (in S3) and 200 mg/L, recorded in S8. In autumn, the values oscillate between 10 mg/L, recorded in S4, and 355.2 mg/L, noted in S2. In winter, a slight decrease was recorded at the majority of the stations. A maximum value of 84 mg/L is recorded, in S2 and S5, and a minimum value of 24 mg/L is recorded, in S3. On the other hand, in spring, the values oscillate between 41.3 mg/L (S7) and 1056 mg/L (S2). The COD levels, therefore, vary according to the stations and the seasons. In addition, high values are recorded in the majority of the stations located in the vicinity of the urban agglomerations, in particular, the cities of Tiflet and Sidi Yahya El Gharb.
Thus, the domestic-wastewater discharges discharged in S1, S2 and S7; industrial discharges from the paper mill, discharged into station S8; and agricultural discharges could be at the origin, and the difference in COD contents are noted from one station to another. Note that low values were recorded in stations S3, S4 and S6, which are not directly linked to these releases [15]. Likewise, at the level of each station, a seasonal variation of COD is noted. In fact, in station S8, for example, COD oscillates from 57.6 mg/L and 2664 mg/L. This difference can be attributed to dilution and seasonal variation, in the amount and composition of the releases at the station.

3.4. Nitrogen Nitrates (NO3-N)

NO3-N concentrations vary between 0.5 mg/L, recorded in summer, at stations S1 and S3, and 11.1 mg/L, recorded in autumn, at S5. In autumn, the values increase significantly and vary between 0.964 mg/L (S1) and 19.18 mg/L (S6). In winter, the concentrations vary little and the maximum value (7.643 mg/L) is noted, in S6. The spring values are very low and vary between 0.683 mg/L, in S1, and 12.1 mg/L, in S6. The NO3-N contents, therefore, show a great variation, according to the stations and the seasons. This variation is, mainly due to the decomposition of plant or animal matter as well asthe mode of use of the soil, manure and domestic and industrial wastewater. High levels of NO3-N (greater than 10 mg/L) are recorded in stations exposed to agricultural discharges and leaching from cultivated land (Figure 2) (S5, S6 and S7). On the other hand, the lowest values noted in S1, S2 and S8 are noted in the wastewater zones of two communities, Tiflet and Sidi Yahya Elgharb.
Moreover, the results show that at the same station, the concentration of NO3-N can vary from one season to another. In station S6, for example, NO3-N varies between 19.18 mg/L and 7.643 mg/L. This seasonal variation could be due to the leaching of seasonal fertilizers, used in the agricultural soils located at the edge of the wadi, and to the low levels of dissolved oxygen, during the dry season (Figure 2). It should, also, be noted that high levels of NO3-N have several negative impacts on crops as well as humans and promote eutrophication of hydrosystems [9].

3.5. Ammonium Nitrogen (NO4-N)

In summer, the NO4-N ion values oscillate between 0.03 mg/L, noted in S6, and 28.8 mg/L, shown in S7; in autumn, between 0.067 mg/L, in S2, and 3.5 mg/L, recorded in S8; in winter, between 0.05 mg/L, recorded in S3, and 18.2 mg/L, recorded in S5; and, in spring, between 0.001 mg/L, recorded in S7, and 75 mg/L, recorded in S2.
The levels, therefore, vary according to the stations and the seasons. NO4-N contents vary from station to station, depending on the physicochemical characteristics of the station. High NO4-N values, recorded in stations S2 and S5, during the rainy period, are due to the processes of incomplete degradation of organic matter, mainly due to rainwater. The levels recorded in the majority of stations are, therefore, greater than 0.5 mg/L [9].
The high values of the NO4-N ion content are due to wastewater discharges (urine contained in wastewater) and the decomposition of organic nitrogen by microorganisms [10].
Oued Tiflet is affected by high levels of NO4-N. It should, also, be noted that the values recorded during the rainy seasons are very high, compared to those recorded in the dry seasons, except for stations S7 and S8, during the summer season. This can be explained by the contributions of rainwater, loaded with dissolved atmospheric nitrogen.

3.6. Kahdjel Nitrogen (TKN)

The levels recorded in the summer season oscillate between 0.02 mg/L, recorded in stations S4 and S6, and 443.22 mg/L, recorded in station S2. In autumn, the values vary between 1.2 mg/L, recorded in S4, and 333.49 mg/L, recorded in S2. In winter, the levels oscillate between 0.05 mg/L, recorded in S3, and 31.34 mg/L, recorded in S5, and, in spring, between 0.001 mg/L, recorded in S5, and 77.36 mg/L, recorded in S2. The levels of TKN, therefore, vary according to the stations and the seasons. The variation from one station to another is, mainly, due to human activities bordering each station. Thus, the high values were recorded in the stations exposed to the discharges of domestic water (S2) and of agricultural activities (S5). TKN contents vary from season to season as well. In station S2, for example, the levels fluctuate between 19.43 mg/L (winter season), and 443.22 mg/L (summer season). This can be explained by the effect of the dilution of the river, by the rainwater of the season.

3.7. PO4-P and TP

In summer, the orthophosphates oscillate between a value of 0.01 mg/L, recorded in stations S3 and S4, and a value of 22.2 mg/L, recorded in station S2. Similarly, in autumn, the minimum value of orthophosphates is recorded in station S3, and the maximum value of 6.87 mg/L is recorded in station S2. During the winter season, the values of orthophosphates vary between a minimum value of 0.01, recorded in station S3, and a maximum value of 1.52 mg/L recorded in station S5. In spring, the orthophosphates oscillate between a minimum value of 0.01 mg/L (S3) and a maximum value of 7.66 mg/L (S2). It should be noted that orthophosphates represent very high values in stations S1, S2 and S5, in the summer season and autumn season. On the other hand, the levels recorded in stations S3 and S4 are very low, compared to the other stations. Throughout the year, the total phosphorus of the river waters ranged between 0.07 mg/L, recorded in S4 during the spring season, and 40.96 mg/L, recorded in S2 during the autumn season. Indeed, the very high levels of phosphorus products in the stations mentioned can lead to eutrophication of the environment [14] and stimulate the growth of aquatic vegetation, which may explain the decrease in dissolved oxygen. These results are explained by urban discharges and agricultural activities propagated in the region.

3.8. Assessment of the Physicochemical Pollution of Water via the Pollution Index

By applying the formula of the global pollution index (P), to calculate the pollution index of the main parameters measured and to assess the overall physicochemical quality of the water, with respect to the physicochemical characterization of the water, the results (Table 4) show that this overall physicochemical quality of the water varies according to the stations and can, for the same station, vary according to the sampling season of the survey. This quality can be mild, moderate or, even, severe.

3.9. Statistical Analysis of Data

3.9.1. Correlation of Estimated Variables

As shown in Table 5, there are correlations between the contents or values of the various physicochemical variables measured. The pH values are positively correlated with those of dissolved oxygen (0.657) and nitrates (0.642) and moderately negatively correlated with that of BOD5 (−0.433) and COD (−0.366). Indeed, pH is a parameter that is affected by changes in the physical, chemical and biological conditions of the aquatic environment. A higher rate of photosynthetic activity and CO2 uptake for organic matter synthesis increases the dissolved oxygen and pH [16,17]. In addition, the high rate of photosynthetic activity is an indication of the presence of certain elements, such as nitrogen, which help certain enzymes to complete the process of reacting to light. The temperature values are positively correlated with that of the conductivity (0.353) and COD (0.392).
The conductivity values are strongly correlated with those of NKT (0.943), PO4-P (0.816), TP (0.786) and BOD5 (0.5) and negatively correlated with dissolved oxygen (−0.474). In fact, conductivity is influenced by various natural and anthropogenic factors, such as, the geology of the watershed, variations in river flow and anthropogenic activities. Indeed, the conductivity increases when the flow rate is low, since there is a greater concentration of ions. Similarly, contaminated water inputs from agricultural, industrial and urban activities increase the concentration of conductivity. These inputs loaded with organic matter lead to a decrease in the dissolved oxygen consumed by the micro-organisms. Dissolved oxygen values are negatively correlated with those of NKT (−0.500), BOD5 (−0.577), PO4-P (−0.503) and TP (0.5). Dissolved oxygen values are negatively correlated with those of NKT (−0.492), BOD5 (−0.577), PO4-P(−0.503) and TP (−0.458). A positive correlation is observed between ammonium and BOD5 (0.507) and a moderately positive correlation is observed between COD and PO4-P (0.451). The values of NKT are strongly correlated with those of PO4-P (0.827), TP (0.688) and BOD5 (0.500). BOD5 values are correlated with COD (0.590), PO4-P (0.5) and TP (0.583). Finally, positive correlations are observed between the values of PO4-P with the value of TP (0.553). In fact, the increase in PO4-P and TP levels is due to human activities [18].

3.9.2. Principal Component Analysis

Sampling stations are the dependent variables, while the measured parameters are the independent variables. The results of the PCA principal component analysis (Figure 3), based on a correlation matrix, are expressed in Table 6.
In the PCA method, the eigenvalues are, normally, used to determine the principal components (PC); these values classify the 11 physicochemical parameters into 3 principal components. Six variables are involved in the constitution of component 1, which represents 39.892% of the total variance of all the data, namely BOD5, NTK, TP, dissolved oxygen, PO4-P and conductivity. In addition, this axis corresponds to a concentration gradient of the elements evaluated, increasing from the negative side to the positive side of the axis concerned, for the elements BOD5, NTK, TP, PO4-P and conductivity, while decreasing for oxygen dissolved. The stations located in the right part of this axis have high concentrations of BOD5, NTK, PT, PO4-P and conductivity, with low concentrations of dissolved oxygen. while the stations located in the left part of this axis have low levels of BOD5, NTK, PT, PO4-P and conductivity, with high concentrations of dissolved oxygen. Indeed, the strong positive charge of NTK indicates its anthropogenic origin, from wastewater discharges [19]. These waters can be loaded with organic matter, which causes the increase in BOD5 in the water. In addition, the use of chemical fertilizers and manures containing orthophosphates and total phosphorus in agriculture will accentuate the rate of these elements in the drainage water from agricultural land. In addition, the water contamination can, also, be of natural origin, from the leaching of the sedimentary rocks entering into the composition of the region, which causes the mineralization of the waters of the wadi. In addition, four physicochemical parameters are involved in the constitution of component 2, which represents 20.181% of the total variance of all the data, namely the physical elements (temperature and pH) and the nutrient parameter (nitrites). Moreover, this axis corresponds to a concentration gradient of the elements evaluated, increasing from the negative side towards the positive side of the axis considered, for the elements T, pH, nitrites and nitrates. The coincidence of its elements may be due to the agricultural activities distributed in the study area [20]. Stations located on the positive side of axis 2 have high values for T, pH and nitrates, while those located on the negative side of the axis have low values for T, pH and nitrates. Indeed, the positive load in NO3-N indicates an enrichment of the environment by the nutrients from agricultural runoff [21,22]. This nutrient factor reflects the degree of eutrophication of the waters of the wadi. In addition, the high pH load is attributed to high photosynthetic activity. Indeed, chlorophyllous plants, in the presence of light and at a high temperature, assimilate CO2 to synthesize their own organic matter, which induces an increase in pH [23]. The third component accounted for 12.340% of the total dataset variance and included the ammonium parameter, NH4-N and COD. Indeed, the correspondence of these parameters can be specifically associated with the impacts of agricultural activities and domestic-wastewater discharges in the study area [24,25]. The results of the analysis show that the principal component, C1 and C2, provides insight into the temporal and spatial variations of water quality parameters and explains 58.681% of the variance, while the three components of the PCA analysis showed 71.021% of the variance of the dataset.

3.9.3. Classification According to Projection Plan 1 and 2

The global analysis of the graph of the individuals made it possible to define a typology, determined by the presence of three groups of stations (GI, GII and GIII) (Figure 4). In addition, an overall pollution index was applied, to qualify the state of the water at each station (Table 4). Indeed, the GI group includes stations S2 a, S2 e, S8 e and S2 p, characterized by strongly high values of BOD5, TKN, TP, PO4-P and conductivity as well as low values of dissolved oxygen (DO). In addition, it is characterized by relatively high T, pH and nitrates, with the exception of the S2 p station. It should be noted that this group of readings corresponds to stations located at the level of domestic-wastewater discharges (S2) or downstream of industrial-wastewater discharges (S8). Wastewater is, therefore, the main source of pollution in this area. In addition, the COD/BOD5 ratio obtained is around 2.042 for station S2, demonstrating the domestic nature of the wastewater; we, also, observe a COD/BOD5 ratio greater than 4 in the S8 station, which reflects the contribution of an industrial effluent that is more or less difficult to biodegrade [26,27]. Furthermore, the values of the Global Pollution Index, respectively, for stations S2 e, S2 a, S2 h and S8 e, are 49.84, 47.93, 5.143 and 32.02, are all high and, therefore, according to the values of the global pollution index (p ≥ 2.01), they indicate severe pollution of this area of the river studied. The GII group is composed of stations characterized by slightly high values of BOD5, TKN, TP, PO4-P and conductivity, which are, however, lower than the values observed for the stations of the GI group. It, also, has low pH values and slightly higher dissolved oxygen concentrations than those noted for the GI group. Similarly, with the exception of station S7 e, the temperature, pH and NO3-N of the other stations are lower than those noted in the GI group. In addition, this group includes stations located upstream of the domestic-wastewater discharges from the city of Tiflet (S1) and at the level of the agricultural discharges from a rural human agglomeration (Douar El HajThami) (S5). These discharges are rich in organic matter and lead to low concentrations of dissolved oxygen [28]. This group includes readings, or stations, less polluted than those that constitute the GI group. Indeed, the readings S1 s, S1 a, S1 p, S5 s, S5 p, S7 s and S8 a, having, respectively, P values of 12.98, 21.65, 20.63, 20.63, 24.52, 21.51 and 19.31, are part of the GII group and, also, have values greater than 2. According to the pollution index P, they are heavily polluted, while noting that, for some stations, the degree of pollution severity can change, according to the seasons. In addition, the COD/BOD5 ratio, calculated for station S1 and station S5, is less than 2, which indicates easily biodegradable effluents of the domestic type [29]. On the other hand, stations S7 and S8 have a ratio greater than 4, indicating industrial effluents that are difficult to biodegrade. Besides, the GIII group consists of stations characterized by high concentrations of pH, dissolved oxygen and NO3 as well as low concentrations of BOD5, NKT, TP, PO4-P and conductivity. With regard to water temperature, the stations of this group are divided into two sub-groups: GIII a and GIII b. Stations of the GIII a subgroup are richer in nitrates, and their temperature is higher. In addition, the campaigns constituting the GIII b sub-group are, mainly, campaigns carried out in winter. The “season” effect is, therefore, present [30]. In addition, depending on the values of the P index, the GIII group includes, more or less, severe pollution readings and stations; indeed, for example, stations S1 w, S3 s, S3 a, S3 w, S3 p, S4 s, S4 a, S4 w and S4 p all have index values p less than 2; they, therefore, present light to moderate pollution. On the other hand, stations S5 w, S5 s and S8 s show severe pollution. Furthermore, the COD/BOD5 ratio obtained for the stations in this group indicates the domestic character of the effluents. Indeed, the COD/BOD5 ratio of stations S3 and S4, located in a rural environment downstream of discharges from an oil mill (Douar Shraoua), which is greater than 4, is explained by a high COD, due to the presence of organic molecules that are difficult to degrade [31,32].
Furthermore, GI groups together surveys carried out in station 2 (summer, autumn and spring seasons) and station 8 (summer season). GII groups together surveys taken in station 7 (summer), station 1 (summer, fall and spring), station 5 (summer and spring) and station 8 (fall). GIII groups together surveys carried out in station 1 (winter), station 3 (summer, autumn, spring and winter) and station 4 (summer, autumn, spring and winter), of the surveys carried out in stations 2, 5, 6, 7, and 8 (winter), in station 5 (summer), in stations 6 and 7 (fall) and stations 6, 7 and 8 (spring). Thus, these results clearly show that the “season” factor influences the physicochemical quality of the stations.

3.9.4. Classification According to Axes 1 and 3

According to axes 1 and 3, three zones have been defined (Figure 5). Zone 1 consists of stations characterized by high concentrations of NH4-N and COD. This zone includes stations located near the domestic-wastewater discharges of the town of Tiflet (S2), and near the industrial zones (S8). Zone 2 is made up of stations characterized by values close to the mean value in NH4-N and COD. On the other hand, zone 3 includes a single station characterized by low values of NH4-N and COD during the dry season.

4. Conclusions

In this study, the physicochemical analyses of the water revealed high values of BOD5 and COD in the wastewater reception stations, high concentrations of the TP and PO4-P elements, in the stations exposed to the discharge of domestic wastewater, and agricultural discharges and high concentrations of nitrogenous elements, in particular NO3-N and NH4-N, in stations located in rural areas exposed to agricultural discharges and leaching from the watershed. Note that nitrogen and phosphorus pollution were, relatively, more severe during the dry season than at other times. This leads to the degradation and ecological imbalance of the hydrosystem. Similarly, the principal component analysis made it possible to define a typology by the presence of three groups of readings and stations (GI, GII and GIII). The first group is characterized by strongly high values of BOD5, TKN, TP, PO4-P and conductivity as well as low values of dissolved oxygen (DO). Likewise, it is characterized by high values of temperature, pH and nitrates. The second group is characterized by slightly elevated values of BOD5, TKN, TP, PO4-P and conductivity but lower values than noted for the measurements in the stations of the GI group. The low temperature, pH and nitrate values are slightly higher than those noted for the G1 group stations. The third group is characterized by stations with high values or concentrations of dissolved oxygen and low values of BOD5, TKN, TP, PO4-P and conductivity. Concerning the distribution of the stations in the C1 × C3 plane, principal component analysis made it possible to differentiate three groups: G’1, G’2 and G’3. The G’1 group is characterized by high concentrations of NH4-N and COD. The G’2 group is characterized by values close to the mean value of NH4-N and COD. On the other hand, the G’3 group is characterized by low NH4-N and COD contents in the dry season. The results, therefore, showed that the main causes of the degradation of Oued Tiflet and the differentiation of survey groupings are the discharge of domestic, industrial, agricultural and domestic wastewater, from the communities of Tiflet and Sidi Yahya El Gherb. Indeed, all the results show the presence of a strong degradation in the majority of the stations receiving, or near to, the rejections of anthropic origin. Thus, this situation requires the establishment of wastewater treatment plants for the municipalities of Tiflet and Sidi Yahya El Gherb, and the results of this study can help policymakers and other stakeholders to find the necessary actions to take the measures that impose a decision.

Author Contributions

Conceptualization, Z.E. and I.O.; methodology, A.C.; software, M.K.; validation, Z.E., A.A. and M.E.B.; formal analysis, Z.E. and I.B.; investigation, Z.E. and M.F.; resources, M.E.B.; data curation, Z.E., R.A. and H.R.H.M.; writing—original draft preparation, Z.E. and M.K.; writing—review and editing, Z.E. and I.P.; supervision, A.C. All authors have read and agreed to the published version of the manuscript.

Funding

This research was funded by the Researchers Supporting Project number (RSP-2021/96), King Saud University, Riyadh, Saudi Arabia.

Institutional Review Board Statement

Not applicable.

Informed Consent Statement

Not applicable.

Data Availability Statement

All related data are within the manuscript.

Acknowledgments

The authors would like to extend their sincere appreciation to the Researchers Supporting Project number (RSP-2021/96), King Saud University, Riyadh, Saudi Arabia.

Conflicts of Interest

The authors declare no conflict of interest.

References

  1. Hssaisoune, M.; Bouchaou, L.; Sifeddine, A.; Bouimetarhan, I.; Chehbouni, A. Moroccan Groundwater Resources and Evolution with Global Climate Changes. Geosciences 2020, 10, 81. [Google Scholar] [CrossRef] [Green Version]
  2. Noori, R.; Sabahi, M.S.; Karbassi, A.R.; Baghvand, A.; Zadeh, H. Multivariate statistical analysis of surface water quality based on correlations and variations in the data set. Desalination 2010, 260, 129–136. [Google Scholar] [CrossRef]
  3. Ouyang, Y. Evaluation of river water quality monitoring stations by principal component analysis. Water Res. 2005, 39, 2621–2635. [Google Scholar] [CrossRef]
  4. Noori, R.; Karbassi, A.; Khakpour, A.; Shahbazbegian, M.; Badam, H.M.K.; Vesali-Naseh, M. Chemometric Analysis of Surface Water Quality Data: Case Study of the Gorganrud River Basin, Iran. Environ. Modeling Assess. 2011, 17, 411–420. [Google Scholar] [CrossRef]
  5. Zhao, Y.; Xia, X.H.; Yang, Z.F.; Wang, F. Assessment of water quality in Baiyangdian Lake using multivariate statistical techniques. Procedia Environ. Sci. 2012, 13, 1213–1226. [Google Scholar] [CrossRef] [Green Version]
  6. NMQE. Norme Marocaine Qualité des Eaux. Arrêté conjoint du Ministre de l’équipement et du Ministre chargé de l’aménagement du territoire, de l’urbanisme, de l’habitat et de l’environnement n°1275-02 du Chaabane 1423 définissant lagril. 2002. Available online: http://www.eau-tensift.net/fileadmin/user_files/pdf/reglementation/ControleQualiteEau/Arrete1275_01GrilleQualiteEauxSurface.pdf (accessed on 1 May 2022).
  7. Moatar, F.; Meybeck, M.; Poirel, A. Daily variability and its implication on long term river water quality surveys: The Middle Loire. Houille Blanche-Rev. Int. De L Eau 2009, 4, 91–99. [Google Scholar] [CrossRef] [Green Version]
  8. Pejman, A.H.; Bidhendi, G.N.; Karbassi, A.R.; Mehrdadi, N.; Bidhendi, M.E. Evaluation of Spatial and Seasonal Variations in Surface Water Quality Using Multivariate Statistical Techniques. Int. J. Environ. Sci. Technol. 2009, 6, 467–476. [Google Scholar] [CrossRef] [Green Version]
  9. Malik, R.N.; Nadeem, M. Spatial and Temporal Characterization of Trace Elements and Nutrients in The Rawal Lake Reservoir, Pakistan Using Multivariate Analysis Techniques Environ. Geochem. Health 2011, 33, 525–541. [Google Scholar] [CrossRef] [PubMed]
  10. Livingstone, D.M. The Diel Oxygen Cycle in Three. Arch. Hydrobiol. 1991, 120, 457–479. [Google Scholar] [CrossRef]
  11. Ministère de l’urbanisme et de l’aménagement de territoire. Royaume du Maroc. SDAU 2040 Khémisset-Tiflet. Available online: http://www.sdau-khemisset-tiflet.ma/fr/utilisation-du-sol-et-morphologies-spatiales.html/2022 (accessed on 1 May 2022).
  12. Berdai, H.; Soudi, B.; Bellouti, A. Contribution à l’étude de la pollution nitrique des eaux souterraines en zones irriguées: Cas du Tadla. Proj. INCO-WADEMED Actes Sémin. Mod. L’Agriculture Irriguée Rabat 2004. Volume 19, p. 28. Available online: http://www.abhatoo.net.ma/maalama-textuelle/developpement-durable/environnement/eau-douce/deterioration-des-eaux-douces/pollution-de-l-eau/contribution-a-l-etude-de-la-pollution-nitrique-des-eaux-souterraines-en-zones-irriguees-cas-du-tadla (accessed on 2 May 2022).
  13. Ouharba, E.H.; Triqui, Z.e.A.; Moussadek, R. Impact of Climate Change on the Bouregreg Watershed Vegetation and Forest of Morocco. Int. J. Adv. Sci. Res. Eng. 2019, 5, 109. [Google Scholar] [CrossRef]
  14. Capblancq, J.; Décamps, H. L’eutrophisation des eaux continentales: Questions à propos d’un processus complexe. Nat. Sci. Sociétés 2002, 10, 6–17. [Google Scholar] [CrossRef]
  15. Rezouki, S.; Allali, A.; Touati, N.; Eloutassi, N.; Fadli, M. Spatio-Temporal Evolution of Physico-Chemical Parameters of The Inaouen Wadi And Its Tributaries. Morroccan J. Chem. 2021, 9, 576–587. [Google Scholar]
  16. Tomas, D.; Čurlin, M.; Marić, A.S. Assessing the Surface Water Status in Pannonian Ecoregion by the Water Quality Index Model. Ecol. Indic. 2017, 79, 182–190. [Google Scholar] [CrossRef]
  17. Derwich, E.; Benaabidate, L.; Zian, A.; Sadki, O.; Belghity, D. Caractérisation Physico-Chimique Des Eaux De La Nappe Alluviale Du Haut Sebou En Aval De Sa Confluence Avec Oued Fès. Larhyss J. 2010, 8, 101–112. [Google Scholar]
  18. Medeiros, A.C.; Faial Kr, F.; Faial Kd, C.F.; Da Silva Lopes, I.D.; De Oliveira Lima, M.; Guimarães, R.M.; Mendonça, N.M. Quality Index of The Surface Water of Amazonian Rivers in Industrial Areas in Pará, Brazil. Mar. Pollut. Bull. 2017, 123, 156–164. [Google Scholar] [CrossRef] [PubMed]
  19. Zeinalzadeh, K.; Rezaei, E. Determining Spatial and Temporal Changes of Surface Water Quality Using Principal Component Analysis. J. Hydrol. Reg. Stud. 2017, 13, 1–10. [Google Scholar] [CrossRef]
  20. N’diaye, A.D.; Salem, K.M.M. Contribution A L’étude De La Qualité Physico-Chimique De L’eau De La Rive Droite Du Fleuve Sénégal. Larhyss J. 2013, 12, 71–83. [Google Scholar]
  21. Villeneuve, V.; Légaré, S.; Painchaud, J.; Vincent, W. Dynamique Et Modélisation De L’oxygène Dissous En Rivière. Rev. Des Sci. De L’eau/J. Water Sci. 2006, 19, 259–274. [Google Scholar]
  22. Akil, A.; Hassan, T.; Lahcen, B.; Abderrahim, L. Etude de la qualité physico-chimique et contamination métallique des eaux de surface du bassin versant de Guigou, Maroc. Eur. Sci. J. 2014, 10, 84–94. [Google Scholar]
  23. Derradji, F.; Bousnoubra, H.; Kherici, N.; Romeo, M.; Caruba, R. Science Et Changements Planétaires/Sécheresse, Impact De La Pollution Organique Sur La Qualité Des Eaux Superficielles Dans Le Nord-Est Algérien. Sci. Et Changements Planétaires/Sécheresse 2007, 18, 23–27. [Google Scholar]
  24. Shukla, A.K.; Ojha, C.S.P.; Garg, R.D. Application of Overall Index of Pollution (Oip) for the Assessment of the Surface Water Quality in the Upper Ganga River Basin, India. In Development of Water Resources in India; Springer: Berlin/Heidelberg, Germany, 2017; pp. 135–149. [Google Scholar]
  25. Oufline, R.; Hakkou, R.; Hanich, L.; Boularbah, A. Impact of Human Activities on The Physico-Chemical Quality of Surface Water and Groundwater in The North of Marrakech (Morocco). Environ. Technol. 2012, 33, 2077–2088. [Google Scholar] [CrossRef] [PubMed]
  26. Araoye, P.A. The Seasonal Variation of Ph And Dissolved Oxygen (Do2) Concentration in Asa Lake Ilorin, Nigeria. Int. J. Phys. Sci. 2009, 4, 271–274. [Google Scholar]
  27. Gurjar, S.K.; Tare, V. Spatial-Temporal Assessment of Water Quality and Assimilativecapacity Of River Ramganga, A Tributary of Ganga Using Multivariatenalysis And Quel2k. J. Clean. Prod. 2019, 222, 550–564. [Google Scholar] [CrossRef]
  28. Singh, K.R.; Goswami, A.P.; Kalamdhad, A.S.; Kumar, B. Assessment of Surface Water Quality of Pagladia, Beki And Kolong River (Assam, India) Using Multivariate Statistical Techniques. Intl. J. River Basin Manag. 2020, 4, 511–520. [Google Scholar] [CrossRef]
  29. Zhang, D.; Tao, Y.; Liu, X.; Zhou, K.; Yuan, Z.; Wu, Q.; Zhang, X. Spatial and Temporal Variations of Water Quality in An Artificial Urban River Receiving Wwtp Effluent in South China. Water Sci. Technol. 2016, 73, 1243–1252. [Google Scholar] [CrossRef] [PubMed]
  30. Lu, W.; Wu, J.; Li, Z.; Cui, N.; Cheng, S. Water Quality Assessment of An Urban River Receiving Tail Water Using the Single-Factor Index and Principle Component Analysis. Water Supply 2019, 19, 603–609. [Google Scholar] [CrossRef]
  31. Rassam, A.; Chaouch, A.; Bourkhiss, B.; Ouhssine, M.; Lakhlifi, T.; Bourkhiss, M.; El Watik, L. Caractéristiques Physico-Chimiques Des Eaux Usées Brutes De La Ville D’oujda (Maroc). Les Technol. De Lab. 2012, 7, 28. [Google Scholar]
  32. Ministère de l’Équipement et de l’eau, Direction Générale de l’Hydraualique. Section Première-Le Conseil Supérieur de l’eau et du Climat–Direction Générale de l’Eau. Available online: http://81.192.10.228/reglementation/au-niveau-national/loi-36-15/chapitre-vi-administration-de-leau/section-premiere-le-conseil-superieur-de-leau-et-du-climat/ (accessed on 1 May 2022).
Figure 1. Oued Tiflet water-quality monitoring stations.
Water 14 01829 g001
Figure 2. Land-cover map in the Khemisset–Tiflet area [11].
Water 14 01829 g002
Figure 3. Physicochemical parameter score.
Water 14 01829 g003
Figure 4. Score of stations using axis 1 and axis 2.
Water 14 01829 g004
Figure 5. Station scores using axis 1 and axis 3.
Water 14 01829 g005
Table 1. Location of the water-quality monitoring stations, of the stream studied.
StationsDescriptionXY
S1Located at the source of untreated domestic-wastewater discharges from the municipality of Tiflet (the nursery).33.89839−6.30017
S2Located at the level of rejections from the weekly market and slaughterhouse (Tiflet).33.89128−6.29706
S3Located downstream of the discharges of an oil mill (Douar Shraoua), presence of vegetation in the bank of the river.33.87489−6.29628
S4Located at a source discharging this water directly into Oued Tiflet (control station), presence of vegetation.33.87286−6.29622
S5Located at the level of agricultural discharges of a human and rural agglomeration (Douar El Haj Thami), presence of vegetation in the bank of the river and a red-black color.33.95647−6.31664
S6Located at the level of agricultural waste (Sidi Boukhlkhal), presence of vegetation.34.10094−6.36878
S7Located downstream of urban waste (Sidi Yahya EI Gharb), presence of a bad odor.34.31133−6.31353
S8Located downstream of industrial waste (stationery, etc.).34.31358−6.31317
Table 2. Surface-water-quality classification standard [5].
Global Pollution Index of Pollution (P)Water Quality Level
≤0.20Cleanliness
0.21–0.40Sub-cleanliness
0.41–1.00Slight pollution
1.01–2.0Moderate pollution
≥2.01Severe pollution
Table 3. The results of the evaluation of the physicochemical parameters measured.
S1S2S3S4S5S6S7S8
pHR7.51–7.667.24–7.957.2–7.987.35–7.897.76–7.978.13–8.527.57–8.77.29–8.35
M ± Sd7.5825 ± 0.0617.6125 ± 41.457.6 ± 0.407.5325 ± 0.257.8925 ± 0.098.315 ± 0.168.205 ± 0.547.775 ± 0.44
TR15.40–22.7015.50–31.1017.30–22.100.101–7.2019.10–24.5020.10–33.60021.40–30.9021–33.30
°CM ± Sd18.7925 ± 3.6922.675 ± 6.4319.825 ± 1.9618.675 ± 1.6421.45 ± 2.6826.125 ± 6.2225.125 ± 4.6426.2 ± 5.54
ECR1433–24701187–53001076–14771048–11021732–1997.751711–20401472–20961520–2114
mS/mM ± Sd1994.25 ± 435.083169 ± 1940.051212 ± 184.891079.25 ± 25.131997.75 ± 211.341909 ± 153.421652 ± 297.081790.5 ± 310.73
DOR0.23–2.810.12–8.250.78–8.734.20–8.141.92–7.897.12–8.242.25–12.220.14–7.63
mg/LM ± Sd0.96 ± 1.232.5 ± 3.884.4725 ± 4.256.0025 ± 1.744.665 ± 2.507.4075 ± 0.556.015 ± 4.353.31 ± 3.72
NO3-NR0.47–1.831.85–5.700.30–5.511.83–6.391.67–11.107.64–19.180.62–14.621.21–7.77
mg/LM ± Sd0.98525 ± 0.603.291 ± 1.722.3955 ± 2.514.964 ± 2.154.87975 ± 4.2312.25075 ± 4.967.35775 ± 5.745.06275 ± 2.76
NH4-NR0.95–30.900.07–750.05–11.800.04–0.400.97–63.800.03–4.700–28.803.73–17.10
mg/LM ± Sd10.29275 ± 14.1420.05425 ± 36.673.415 ± 5.620.199 ± 0.1521.20025 ± 29.51.54375 ± 2.139.3655 ± 13.558.7075 ± 5.84
TKNR17.26–156.3719.43–443.229.40–19.600.04–3.1831.84–64.580.03–24.1200–86.033.90–92.42
mg/LM ± Sd74.0675 ± 58.67218.375 ± 202.7013.79 ± 4.311.595 ± 1.3151.8625 ± 14.0513.65 ± 10.8426.7305 ± 40.2828.47 ± 42.72
BOD5R19–20075–4201–121–337–804–805–7020–200
mg/LM ± Sd127.25 ± 80.50221.25 ± 159.96.25 ± 5.561.75 ± 0.9549.25 ± 20.5426 ± 36.1122.5 ± 31.75102.5 ± 91.05
CODR33.75–38484–105612–489.65–43.2055.2–8431.20–6031.20–163.2057.60–2664
mg/LM ± Sd233.4375 ± 149.75451.8 ± 42025 ± 16.1225.826 ± 18.7069 ± 14.7145 ± 11.8173.925 ± 60.70740.4 ± 1283.59
COD/BOD5 1.832.042414.751.41.732.337.22
PO4-PR0.46–7.600.36–22.200.00–0.010.01–0.091.52–4.500.69–1.630.03–9.000.17–10.00
mg/LM ± Sd3.3370 ± 3.180609.2730 ± 9.216960.0078 ± 0.004500.3525 ± 0.401433.4790 ± 1.385411.1843 ± 0.385402.6905 ± 4.251123.0590 ± 4.65956
TPR0.94–12.360.85–40.960.18–0.300.07–0.953.38–6.201.60–30.320.51–10.200.21–31.48
mg/LM ± Sd6.7460 ± 4.7922520.1190 ± 18.56940.2270 ± 0.059880.3525 ± 0.401435.2310 ± 1.261469.2140 ± 14.084253.3220 ± 4.6437811.0550 ± 14.6282
R: interval; M: the average; Sd: the standard deviation.
Table 4. Pollution index of each parameter and global pollution index of eight sampling stations.
PDOPNO3-NPNH4-NPTKNPDBO5PCODPP04PPTPPWater Quality
S1 s0.0460.018681.930.17236.17142915.227.3333312.97993Severe pollution
S1 a0.0880.038562.24278.185408.5714292.8641.221.64812Severe pollution
S1 w0.5620.0730816.48.633.80.9642860.923.1333334.310337Severe pollution
S1 p0.0720.0273261.831.153510.971437.7218.2666720.62593Severe pollution
S2 s0.0360.09041.7221.61228.91428644.410049.84384Severe pollution
S2 a0.0240.134280.134166.7455610.1485713.74136.533347.9324Severe pollution
S2 w1.650.227848.69.715152.40.722.8333335.143272Severe pollution
S2 p0.290.0740415038.688430.1714315.3228.943.42943Severe pollution
S3 s0.1680.0160.629.820.3428570.0211.745857Moderate pollution
S3 a0.1560.012372.40.45714300.61.703143Moderate pollution
S3 w1.7460.220480.14.70.40.6857140.020.8333331.088191Moderate pollution
S3 p1.5080.134823.66.080.21.3714290.020.64.189279Moderate pollution
S4 s1.0080.25560.080.020.60.2757140.020.6666670.365748Slight pollution
S4 a0.840.255040.2320.60.20.2758290.183.1666670.718692Slight pollution
S4 w1.6280.073080.481.590.21.1657140.040.6333330.726266Slight pollution
S4 p1.3260.210520.80.980.41.2342860.060.2333330.655517Slight pollution
S5 s0.9980.4443.6627.117.41.5771439198.648643Severe pollution
S5 a0.3840.119521.94228.405162.2628578.8420.666679.827505Severe pollution
S5 w1.5780.1505636.415.9282.43.0411.266679.844403Severe pollution
S5 p0.7720.06668127.632.2981.6457146.9618.8333324.52097Severe pollution
S6 s1.6480.40320.060.0150.80.8914292.45.3333331.44387Moderate pollution
S6 a1.4240.76721.755.05161.7142862.44101.066716.27652Severe pollution
S6 w1.4260.305721.1410.17521.3028571.386.3333333.007864Severe pollution
S6 p1.4280.4849.412,0621.2342863.2610.133334.999952Severe pollution
S7 s0.7960.024857.643.015144.662857183421.51233Severe pollution
S7 a0.450.58480.3221.55510.8914292.96.91.825404Moderate pollution
S7 w1.1220.30572178.8911.7142860.061.73.974001Severe pollution
S7 p2.4440.261920.002021.180.581.71.02099Moderate pollution
S8 s0.0280.310834.246.214076.114292039.3333332.02455Severe pollution
S8 a0.0540.048567.461.95325.0742862.96104.933319.31002Severe pollution
S8 w1.040.214215.65.2861.7828571.182.4333334.191299Severe pollution
S8 p1.5260.2364812.43.541.6457140.340.73.043524Severe pollution
S: station; s: summer; w: winter; sp: spring; a: autumn.
Table 5. Correlation matrix between studied variables.
pHTECDONO3-NNH4-NNKTBOD5CODPO4-PTP
pH1
T0.2061
EC−0.0830.353 *1
DO0.657 **−0.034−0.474 **1
NO3-N0.642 **0.199−0.110.428 *1
NH4-N−0.2260.080.013−0.186−0.2891
NKT−0.2480.2270.943 **−0.492 **−0.2520.0391
BOD5−0.433 *0.1660.494 **−0.577 **−0.2750.507 **0.500 **1
COD−0.366 *0.392 *0.19−0.389 *−0.030.330.240.590 **1
PO4-P−0.2620.3480.816 **−0.503 **−0.2010.2290.827 **0.491 **0.451 **1
TP−0.1490.2650.786 **−0.458 **0.02−0.0190.688 **0.583 **0.2220.553 **1
**. Correlation is significant at the 0.01 level (two-tailed). *. Correlation is significant at the 0.05 level (two-tailed).
Table 6. Eigenvalues on the correlation matrices of the concentration of the physicochemical parameters, in %.
Component
123
pH−0.5190.7010.014
T0.2930.6230.500
EC0.8210.444−0.294
DO−0.7540.3190.077
NO3-N−0.3760.6440.116
NH4-N0.321−0.3490.602
NTK0.8460.259−0.333
BOD50.793−0.1490.297
COD0.555−0.0590.615
PO4-P0.8450.227−0.036
TP0.7360.343−0.255
eigenvalues4.7872.2551.481
% of variance39.89218.78912.340
Cumulative %39.89258.68171.021
Publisher’s Note: MDPI stays neutral with regard to jurisdictional claims in published maps and institutional affiliations.

