
Delineating Groundwater Recharge Potential through Remote Sensing and Geographical Information Systems

 ,
, 
 ,
,  ,
,  , , and
Abstract
:1. Introduction and Background
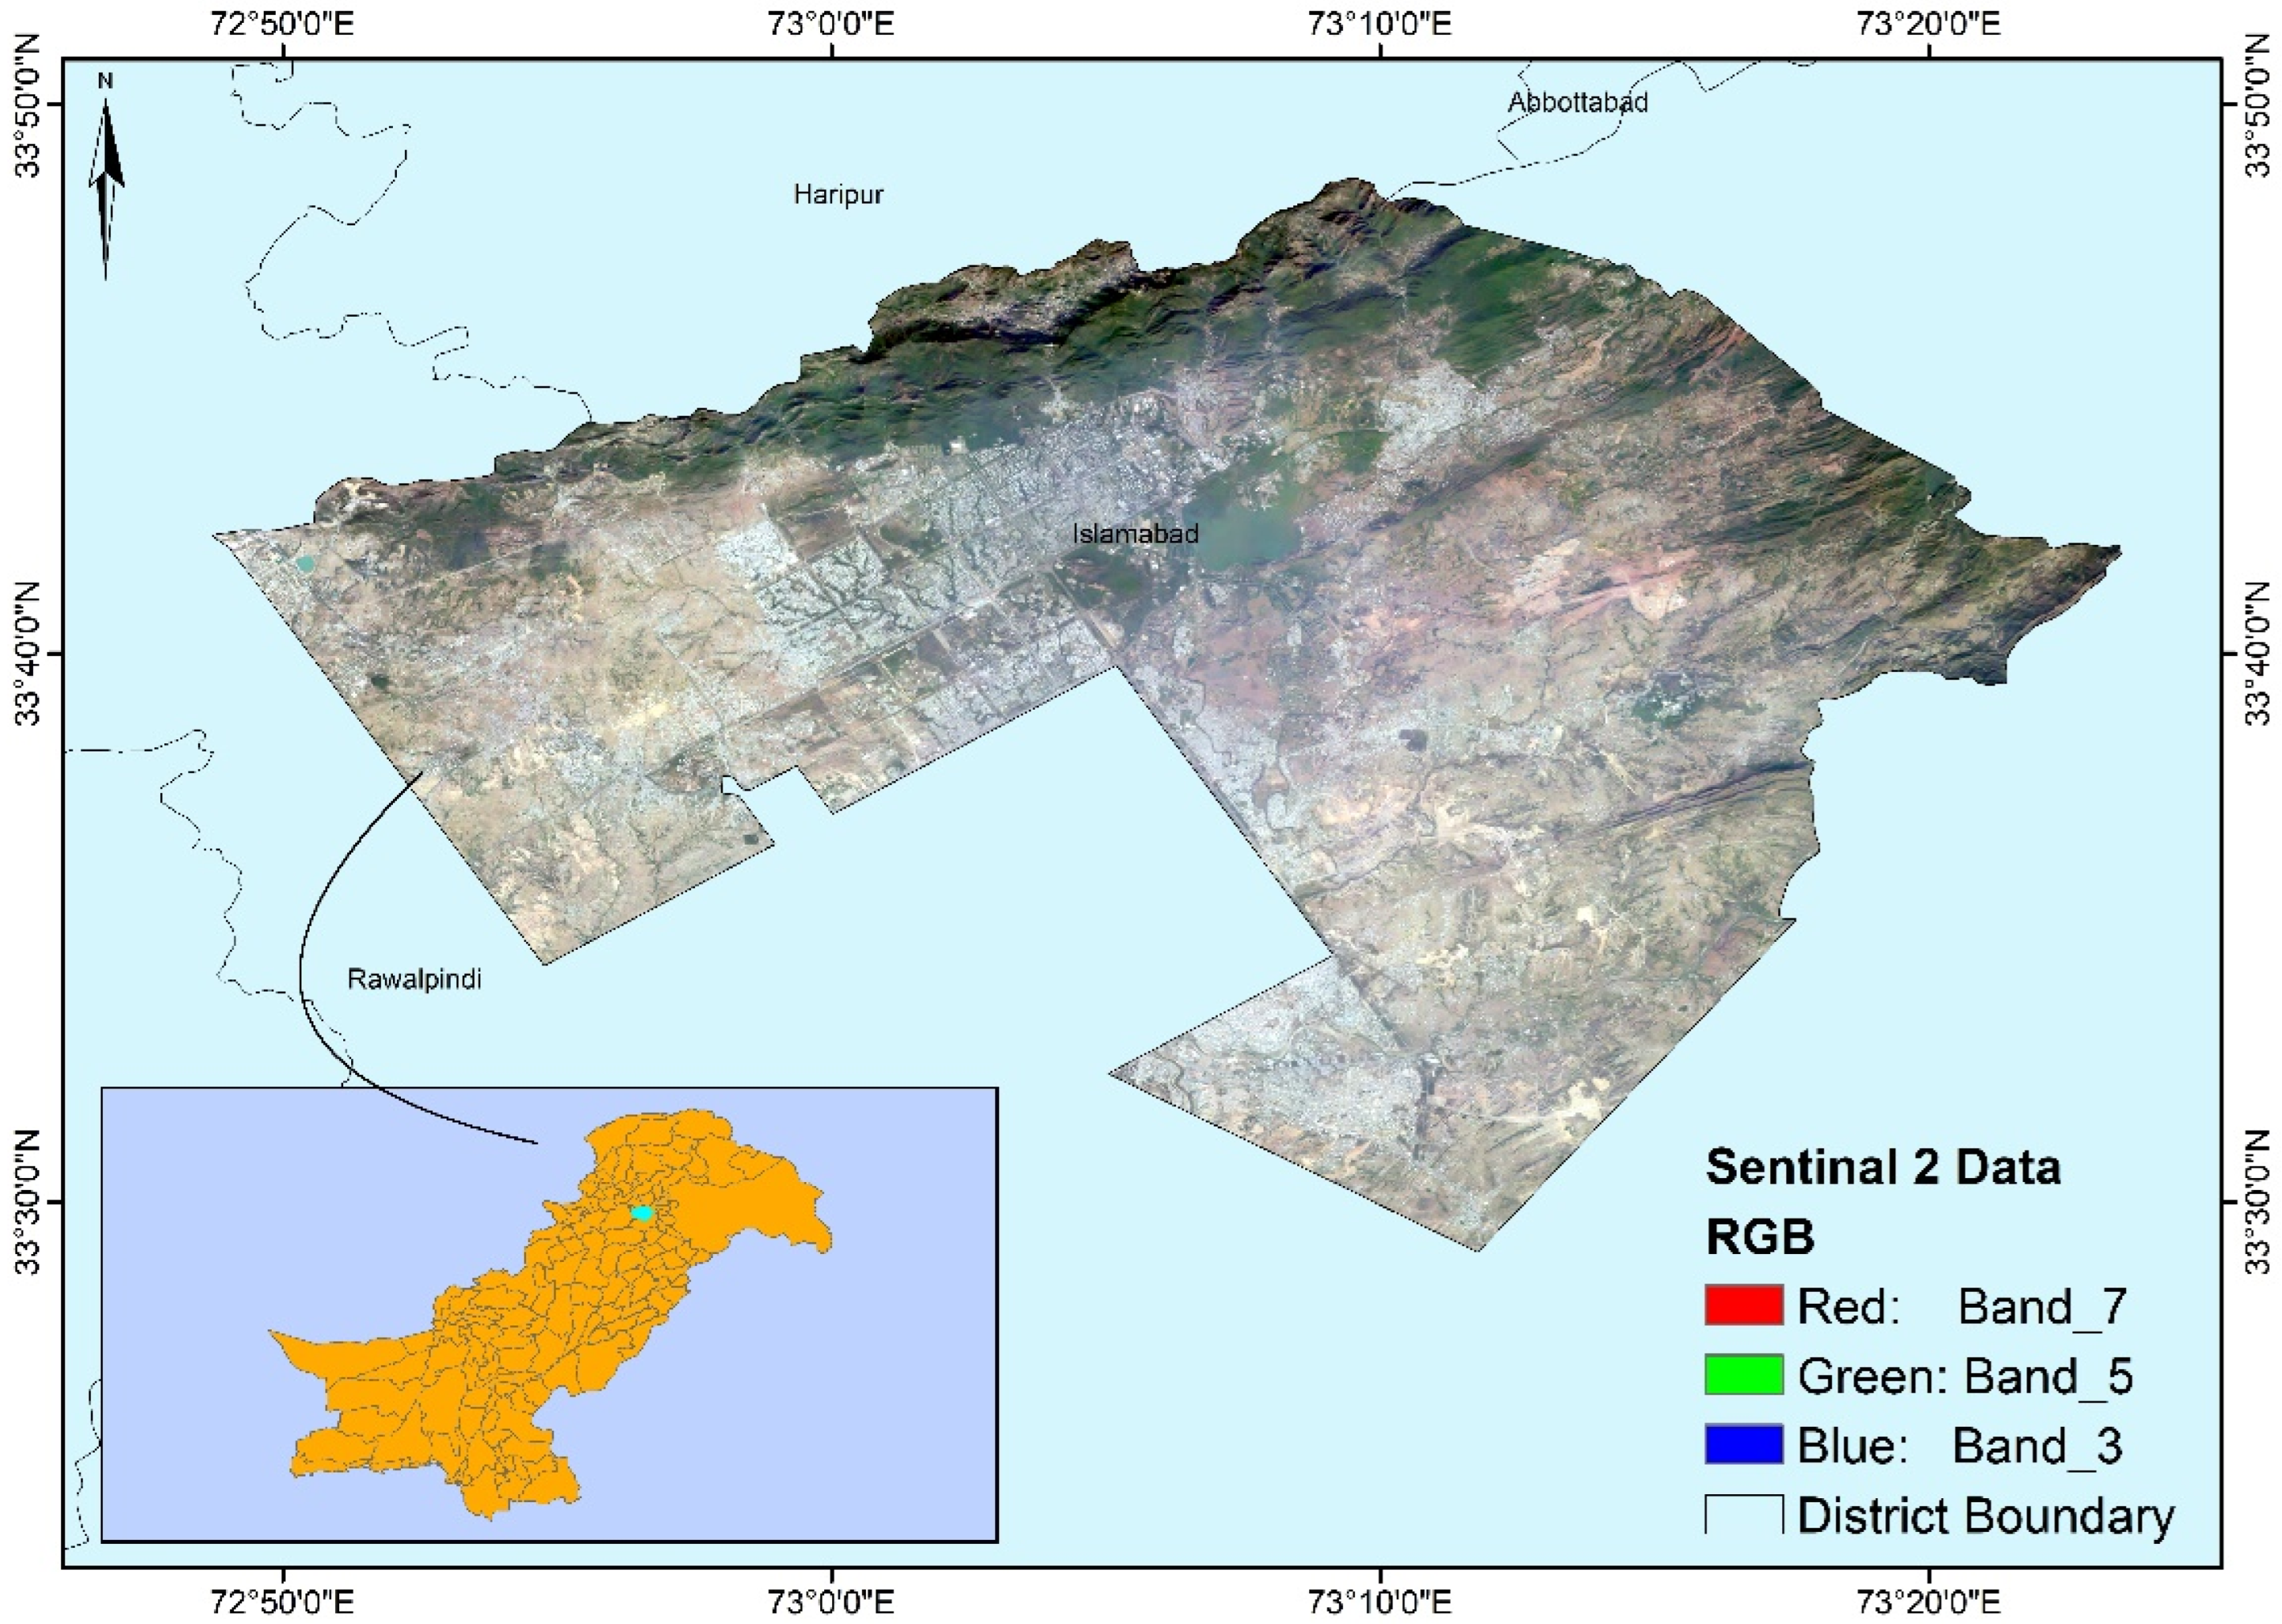
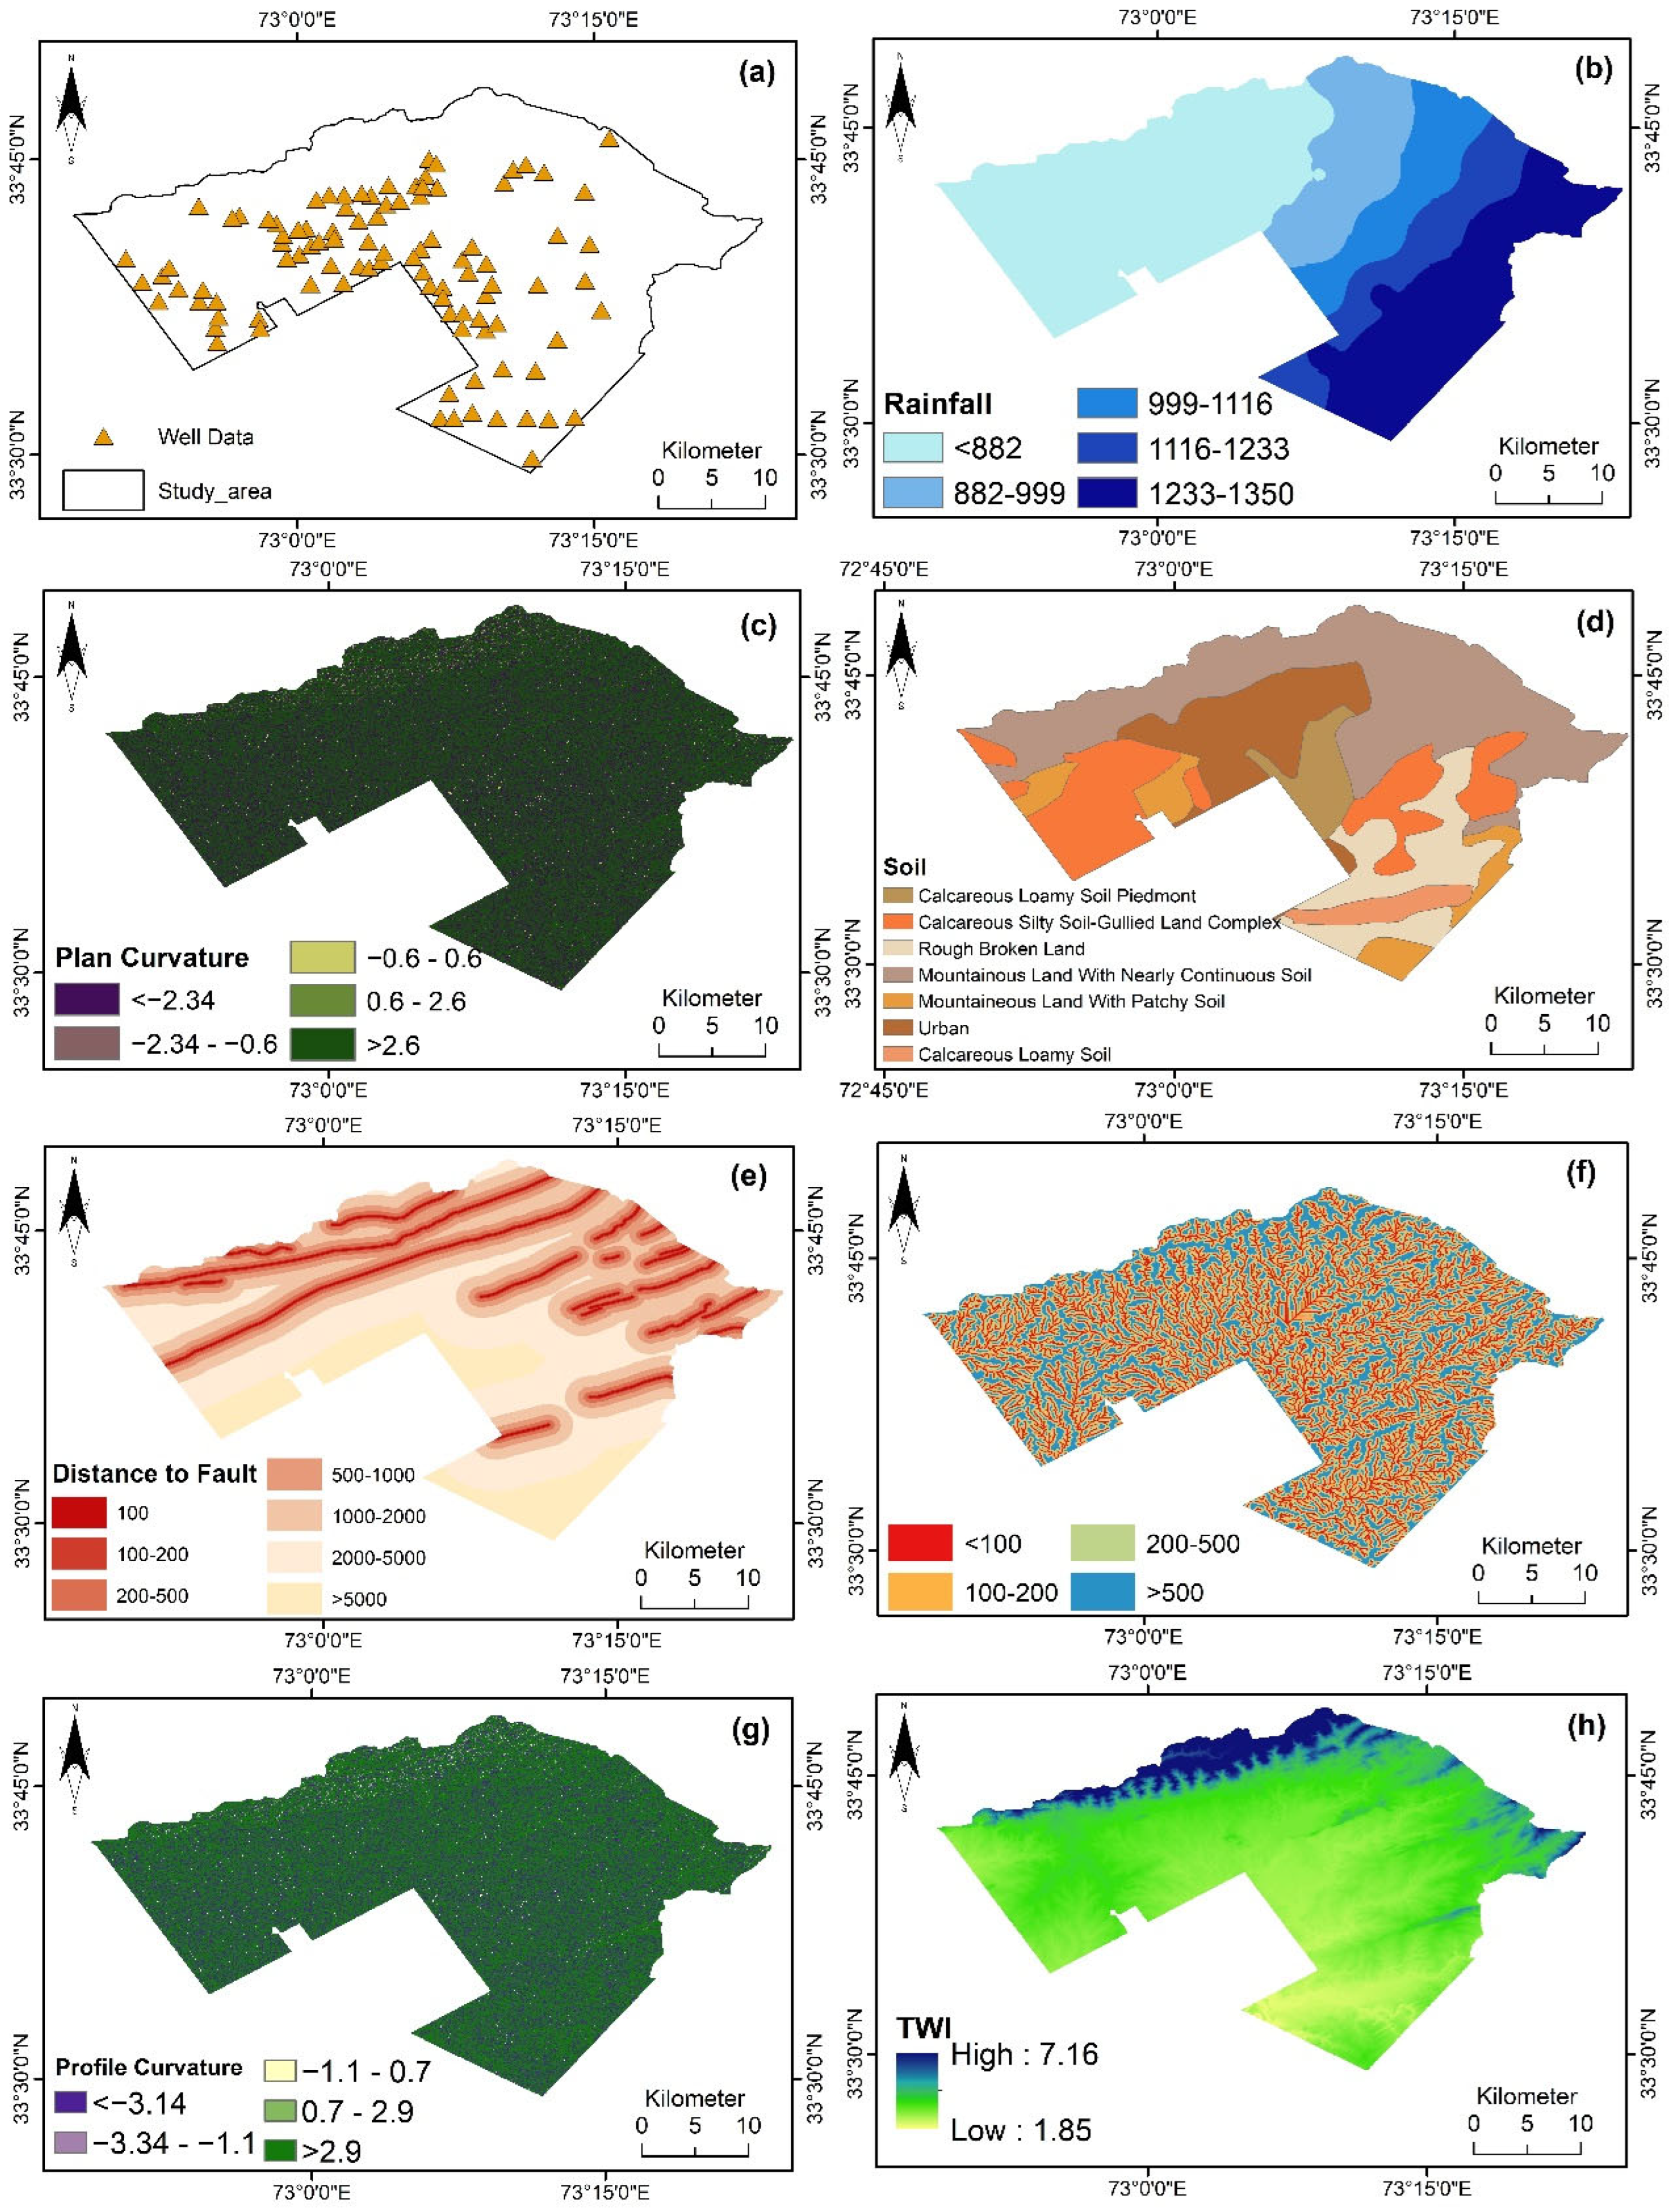
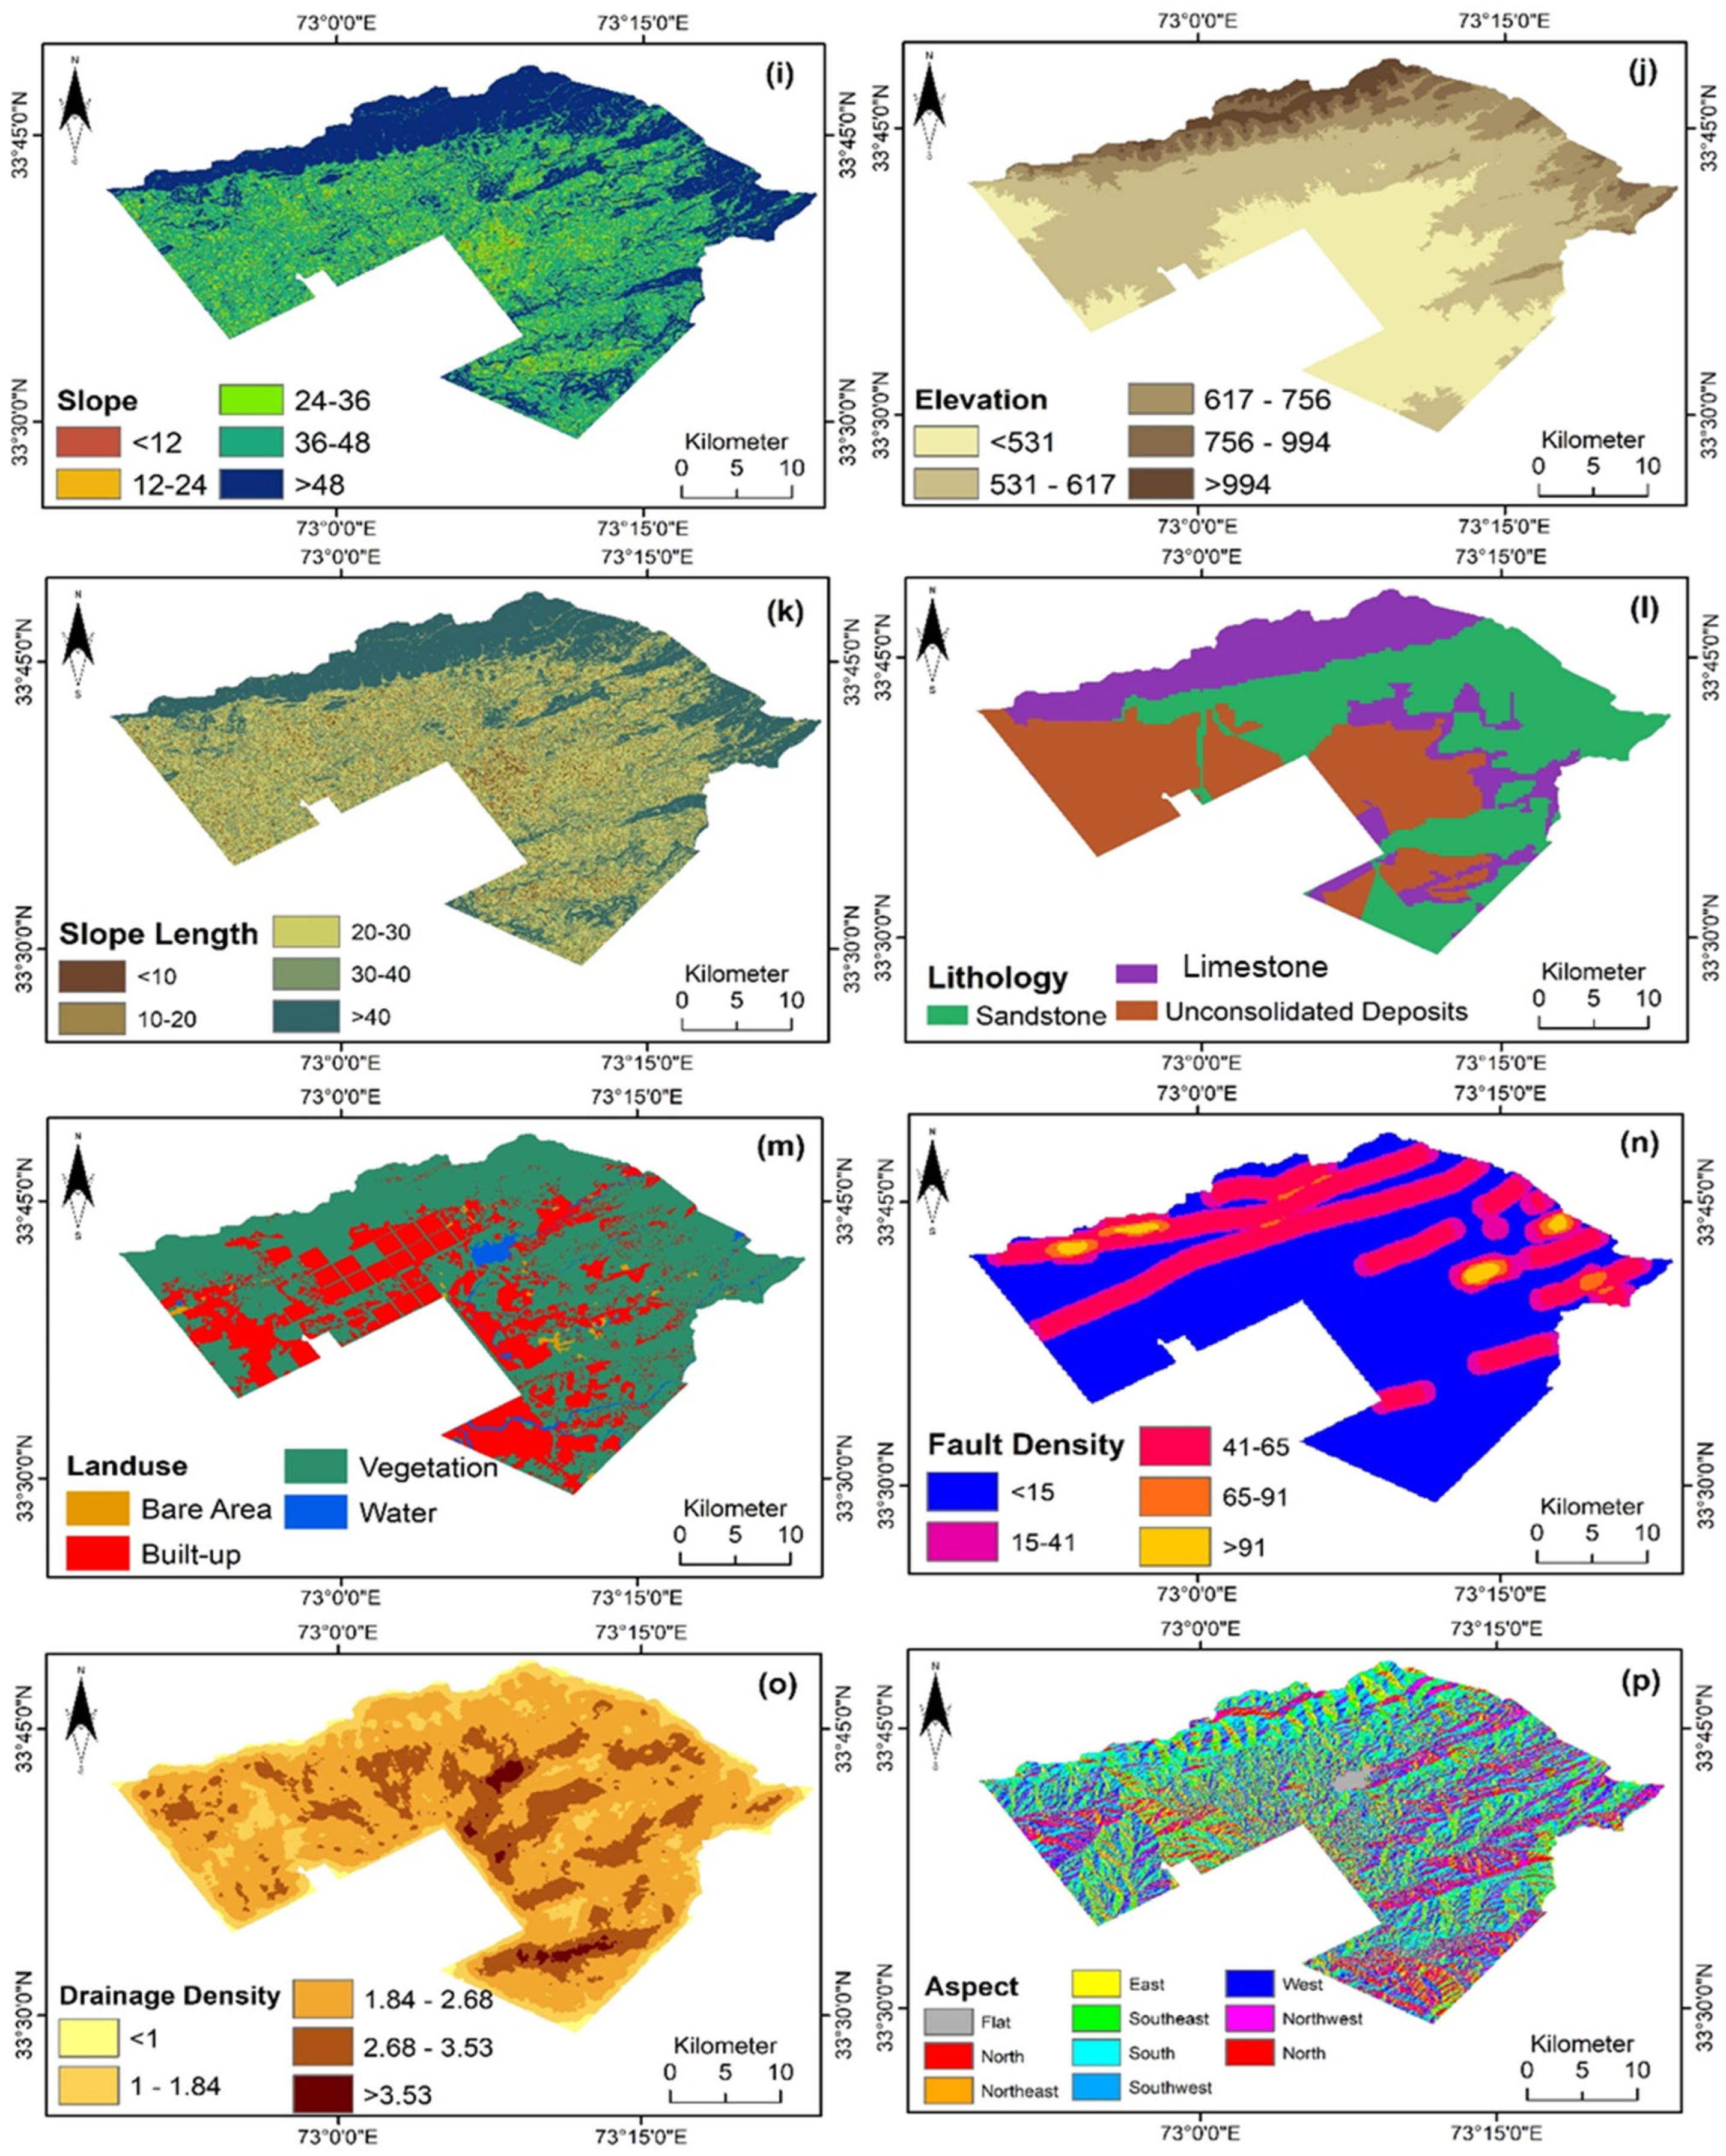
2. Study Area
3. Factors Affecting Groundwater Recharge Potential
3.1. Elevation
3.2. Slope
3.3. Slope Length
3.4. Aspect
3.5. Topographic Wetness Index (TWI)
3.6. Rainfall
3.7. Drainage Distance
3.8. Drainage Density
3.9. Land Use/Land Cover
3.10. Soil
3.11. Lithology
3.12. Plan Curvature
3.13. Profile Curvature
3.14. Distance to Fault
3.15. Fault Density
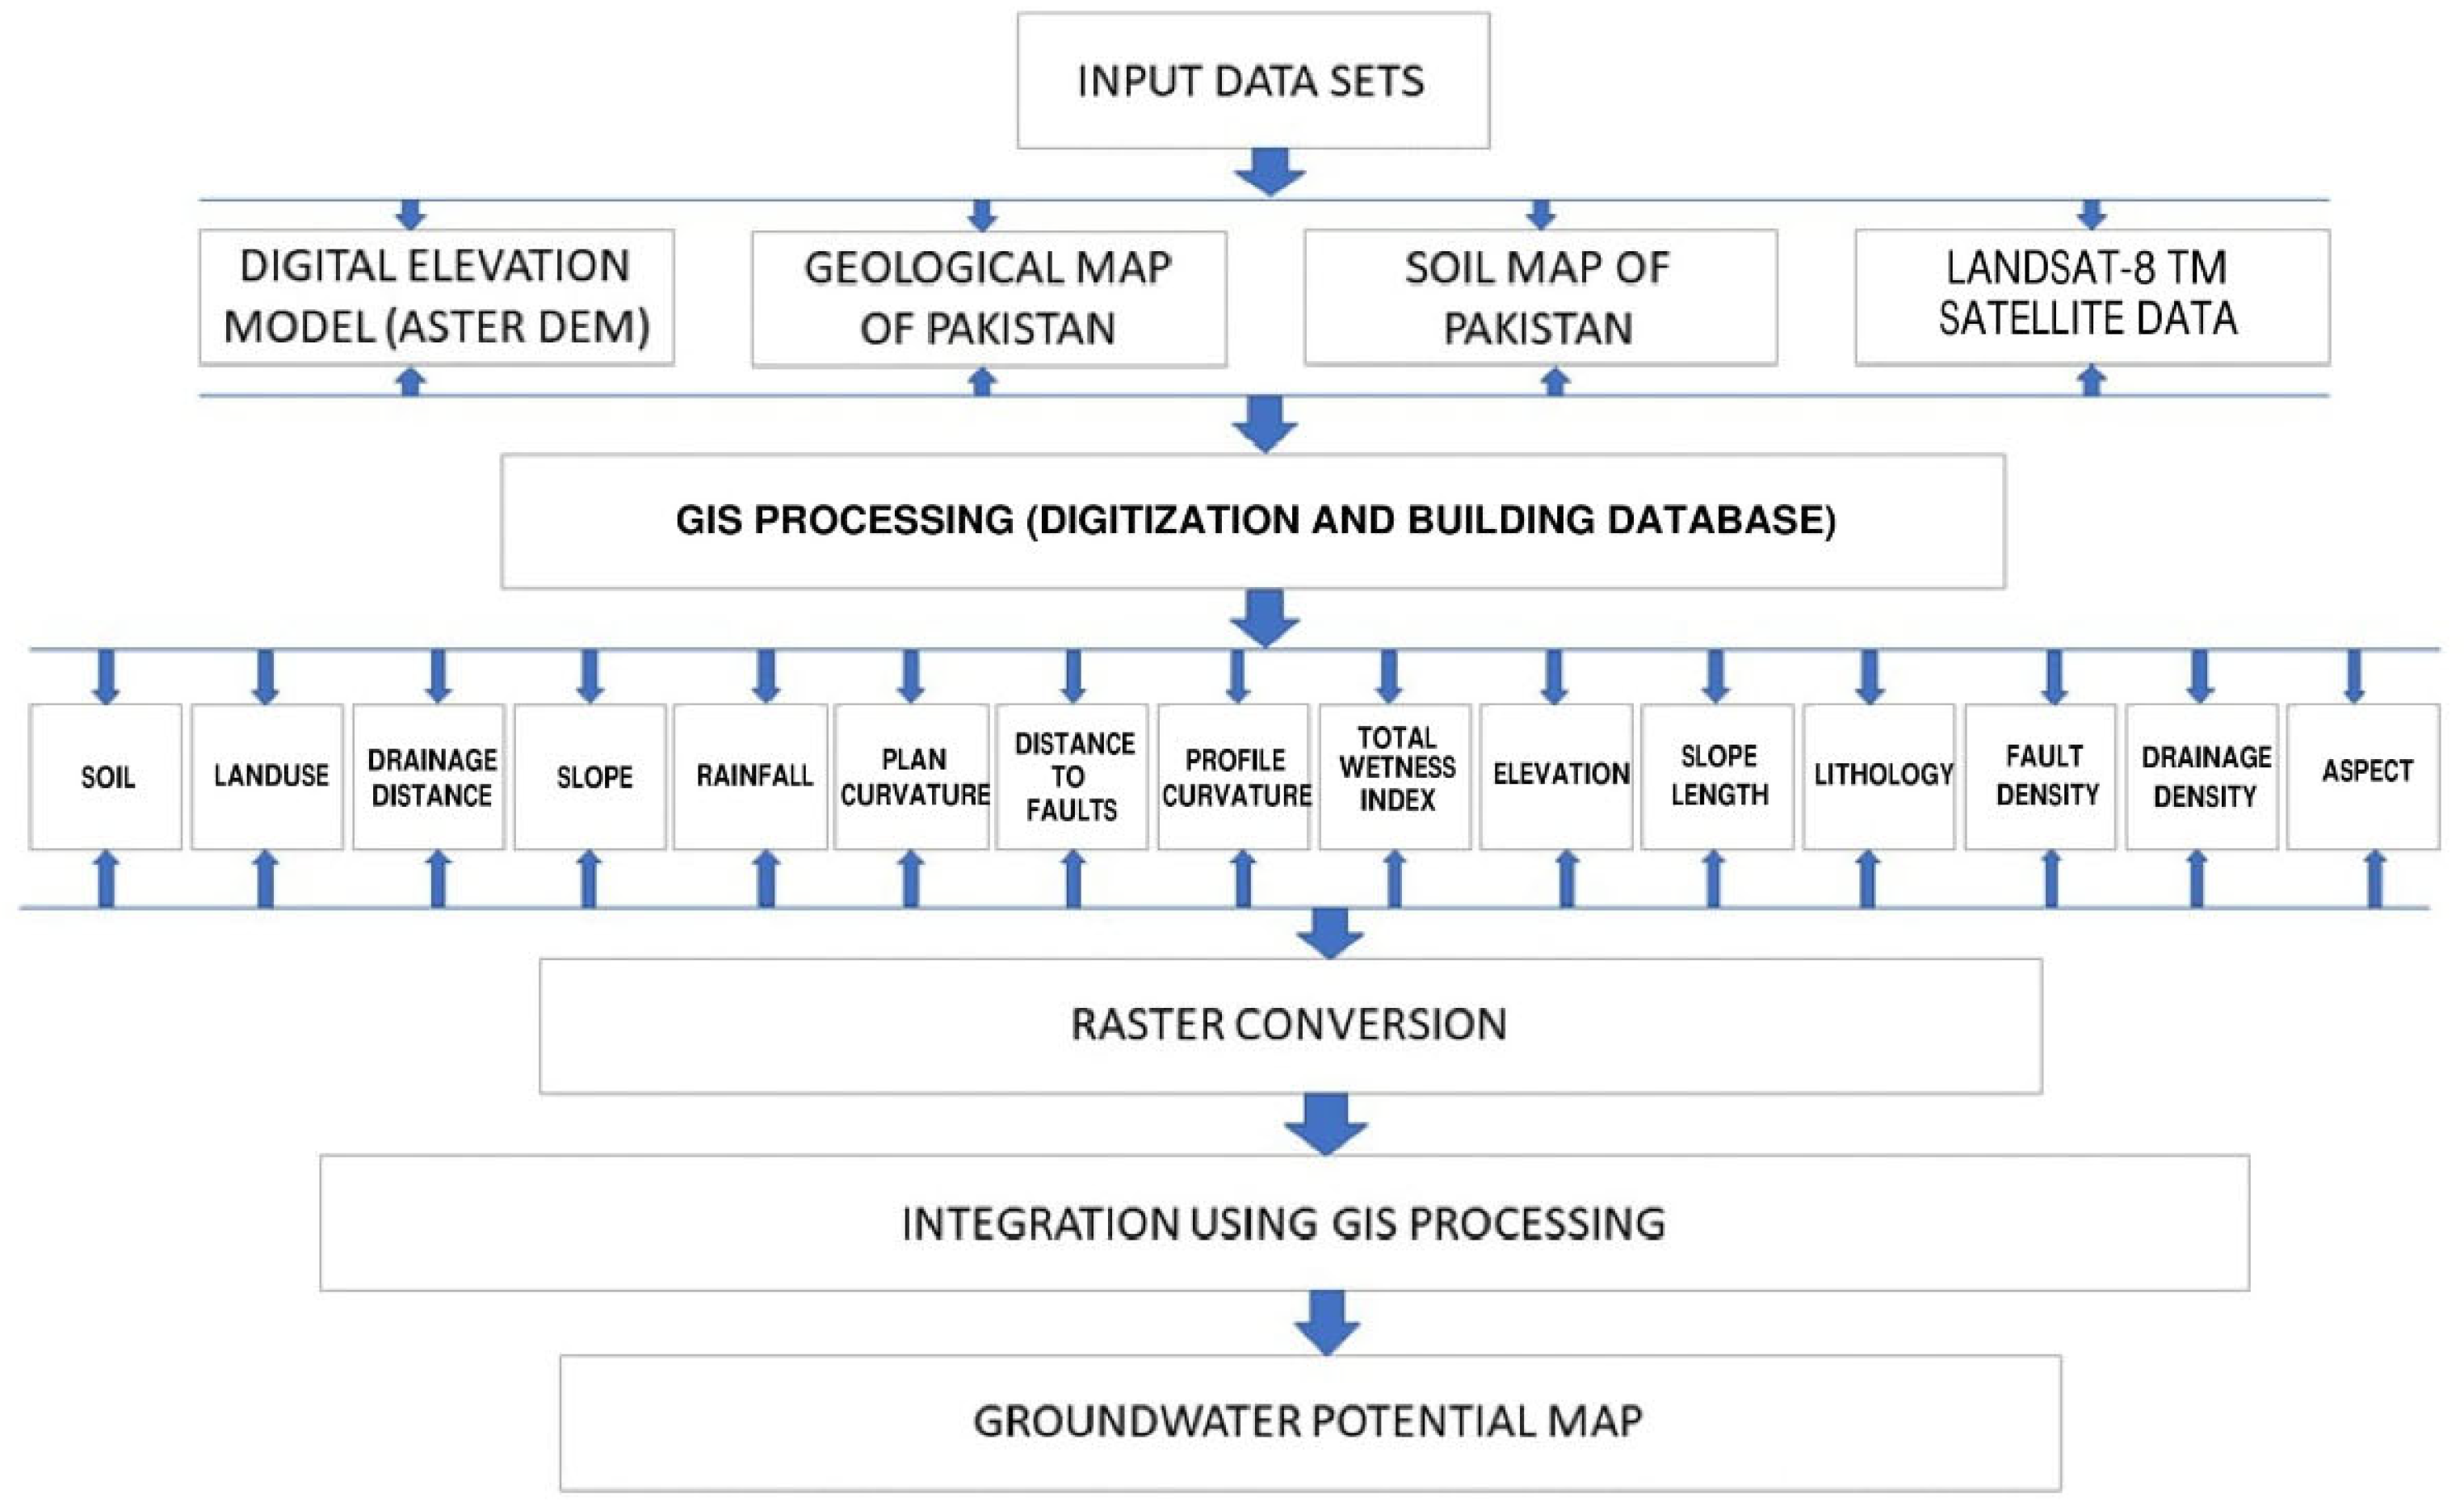
4. Methodology
4.1. Acquisition of Thematic Maps for Contributing Factors
4.2. Weightage Assignment via IF Technique
5. Results and Discussions
5.1. Spatial Analysis of Considered Key Factors
5.2. Weightage Calculation for Influence Factor (IF) Techniques
5.3. Final Combined Recharge Potential Map
6. Conclusions
Author Contributions
Funding
Institutional Review Board Statement
Informed Consent Statement
Data Availability Statement
Acknowledgments
Conflicts of Interest
References
- Megdal, S.B. Invisible Water: The Importance of Good Groundwater Governance and Management. NPJ Clean Water 2018, 1, 15. [Google Scholar] [CrossRef] [Green Version]
- Ganapuram, S.; Kumar, G.V.; Krishna, I.M.; Kahya, E.; Demirel, M.C. Mapping of Groundwater Potential Zones in the Musi Basin Using Remote Sensing Data and Gis. Adv. Eng. Softw. 2009, 40, 506–518. [Google Scholar] [CrossRef]
- Singh, S.K.; Zeddies, M.; Shankar, U.; Griffiths, G.A. Potential Groundwater Recharge Zones within New Zealand. Geosci. Front. 2019, 10, 1065–1072. [Google Scholar] [CrossRef]
- Bear, J. Hydraulics of Groundwater; Courier Corporation: North Chelmsford, MA, USA, 2012. [Google Scholar]
- Todd, D.K.; Mays, L.W. Groundwater Hydrology; John Wiley & Sons: Hoboken, NJ, USA, 2004. [Google Scholar]
- Thakur, D.; Bartarya, S.K.; Nainwal, H.C. Mapping Groundwater Prospect Zones in an Intermontane Basin of the Outer Himalaya in India Using Gis and Remote Sensing Techniques. Environ. Earth Sci. 2018, 77, 368. [Google Scholar] [CrossRef]
- Wang, X.J.; Zhang, J.Y.; Shahid, S.; Guan, E.H.; Wu, Y.X.; Gao, J.; He, R.M. Adaptation to Climate Change Impacts on Water Demand. Mitig. Adapt. Strateg. Glob. Chang. 2016, 21, 81–99. [Google Scholar] [CrossRef]
- Rao, Y.S.; Jugran, D.K. Delineation of Groundwater Potential Zones and Zones of Groundwater Quality Suitable for Domestic Purposes Using Remote Sensing and Gis. Hydrol. Sci. J. 2003, 48, 821–833. [Google Scholar]
- Cherry, J.A.; Freeze, R.A. Groundwater; Prentice-Hall: Hoboken, NJ, USA, 1979. [Google Scholar]
- Shao, Z.; Huq, M.E.; Cai, B.; Altan, O.; Li, Y. Integrated Remote Sensing and Gis Approach Using Fuzzy-Ahp to Delineate and Identify Groundwater Potential Zones in Semi-Arid Shanxi Province, China. Environ. Model. Softw. 2020, 134, 104868. [Google Scholar] [CrossRef]
- Huang, T.; Ma, B.; Pang, Z.; Li, Z.; Li, Z.; Long, Y. How Does Precipitation Recharge Groundwater in Loess Aquifers? Evidence from Multiple Environmental Tracers. J. Hydrol. 2020, 583, 124532. [Google Scholar] [CrossRef]
- Aslam, B.; Maqsoom, A.; Khalid, N.; Ullah, F.; Sepasgozar, S. Urban Overheating Assessment through Prediction of Surface Temperatures: A Case Study of Karachi, Pakistan. ISPRS Int. J. Geo-Inf. 2021, 10, 539. [Google Scholar] [CrossRef]
- Okello, C.; Tomasello, B.; Greggio, N.; Wambiji, N.; Antonellini, M. Impact of Population Growth and Climate Change on the Freshwater Resources of Lamu Island, Kenya. Water 2015, 7, 1264–1290. [Google Scholar] [CrossRef]
- Atif, S.; Umar, M.; Ullah, F. Investigating the Flood Damages in Lower Indus Basin since 2000: Spatiotemporal Analyses of the Major Flood Events. Nat. Hazards 2021, 108, 2357–2383. [Google Scholar] [CrossRef]
- Page, D.; Bekele, E.; Vanderzalm, J.; Sidhu, J. Managed Aquifer Recharge (Mar) in Sustainable Urban Water Management. Water 2018, 10, 239. [Google Scholar] [CrossRef] [Green Version]
- Dillon, P.; Toze, S.; Page, D.; Vanderzalm, J.; Bekele, E.; Sidhu, J.; Rinck-Pfeiffer, S. Managed Aquifer Recharge: Rediscovering Nature as a Leading Edge Technology. Water Sci. Technol. 2010, 62, 2338–2345. [Google Scholar] [CrossRef]
- Bhatti, M.T.; Anwar, A.A.; Aslam, M. Groundwater Monitoring and Management: Status and Options in Pakistan. Comput. Electron. Agric. 2017, 135, 143–153. [Google Scholar] [CrossRef]
- Subhadra, B. Water: Halt India’s Groundwater Loss. Nature 2015, 521, 289. [Google Scholar] [CrossRef] [Green Version]
- Qureshi, A.S. Improving Food Security and Livelihood Resilience through Groundwater Management in Pakistan. Glob. Adv. Res. J. Agric. Sci. 2015, 4, 687–710. [Google Scholar]
- Siebert, S.; Kummu, M.; Porkka, M.; Döll, P.; Ramankutty, N.; Scanlon, B.R. A Global Data Set of the Extent of Irrigated Land from 1900 to 2005. Hydrol. Earth Syst. Sci. 2015, 19, 1521–1545. [Google Scholar] [CrossRef] [Green Version]
- Chindarkar, N.; Grafton, R.Q. India’s Depleting Groundwater: When Science Meets Policy. Asia Pac. Policy Stud. 2019, 6, 108–124. [Google Scholar] [CrossRef]
- Mancosu, N.; Snyder, R.L.; Kyriakakis, G.; Spano, D. Water Scarcity and Future Challenges for Food Production. Water 2015, 7, 975–992. [Google Scholar] [CrossRef]
- Schneider, U.; Havlík, P.; Schmid, E.; Valin, H.; Mosnier, A.; Obersteiner, M.; Böttcher, H.; Skalský, R.; Balkovič, J.; Sauer, T.; et al. Impacts of Population Growth, Economic Development, and Technical Change on Global Food Production and Consumption. Agric. Syst. 2011, 104, 204–215. [Google Scholar] [CrossRef]
- Iqbal, N.; Hossain, F.; Lee, H.; Akhter, G. Satellite Gravimetric Estimation of Groundwater Storage Variations over Indus Basin in Pakistan. IEEE J. Sel. Top. Appl. Earth Obs. Remote Sens. 2016, 9, 3524–3534. [Google Scholar] [CrossRef]
- Van Steenbergen, F.; Kaisarani, A.B.; Khan, N.U.; Gohar, M.S. A Case of Groundwater Depletion in Balochistan, Pakistan: Enter into the Void. J. Hydrol. Reg. Stud. 2015, 4, 36–47. [Google Scholar] [CrossRef] [Green Version]
- Nag, S.K. Application of Lineament Density and Hydrogeomorphology to Delineate Groundwater Potential Zones of Baghmundi Block in Purulia District, West Bengal. J. Indian Soc. Remote Sens. 2005, 33, 521–529. [Google Scholar] [CrossRef]
- Ravindran, A.A.; Selvam, S. Coastal Disaster Damage and Neotectonic Subsidence Study Using 2d Eri Technique in Dhanushkodi, Rameshwaram Island, Tamilnadu, India. Middle-East J. Sci. Res. 2014, 19, 1117–1122. [Google Scholar]
- Jasrotia, A.S.; Kumar, R.; Saraf, A.K. Delineation of Groundwater Recharge Sites Using Integrated Remote Sensing and Gis in Jammu District, India. Int. J. Remote Sens. 2007, 28, 5019–5036. [Google Scholar] [CrossRef]
- Kumar, P.K.D.; Gopinath, G.; Seralathan, P. Application of Remote Sensing and Gis for the Demarcation of Groundwater Potential Zones of a River Basin in Kerala, Southwest Coast of India. Int. J. Remote Sens. 2007, 28, 5583–5601. [Google Scholar] [CrossRef]
- Rodell, M.; Velicogna, I.; Famiglietti, J.S. Satellite-Based Estimates of Groundwater Depletion in India. Nature 2009, 460, 999–1002. [Google Scholar] [CrossRef] [Green Version]
- Srivastava, P.K.; Bhattacharya, A.K. Groundwater Assessment through an Integrated Approach Using Remote Sensing, Gis and Resistivity Techniques: A Case Study from a Hard Rock Terrain. Int. J. Remote Sens. 2006, 27, 4599–4620. [Google Scholar] [CrossRef]
- Selvam, S.; Sivasubramanian, P. Groundwater Potential Zone Identification Using Geoelectrical Survey: A Case Study from Medak District, Andhra Pradesh, India. Int. J. Geomat. Geosci. 2012, 3, 55–62. [Google Scholar]
- Selvam, S. Use of Remote Sensing and Gis Techniques for Land Use and Land Cover Mapping of Tuticorin Coast, Tamilnadu. Univers. J. Environ. Res. Technol. 2012, 2, 233–241. [Google Scholar]
- Saraf, A.K.; Choudhury, P.R. Integrated Remote Sensing and Gis for Groundwater Exploration and Identification of Artificial Recharge Sites. Int. J. Remote Sens. 1998, 19, 1825–1841. [Google Scholar] [CrossRef]
- Chenini, I.; Ben Mammou, A.; El May, M. Groundwater Recharge Zone Mapping Using Gis-Based Multi-Criteria Analysis: A Case Study in Central Tunisia (Maknassy Basin). Water Resour. Manag. 2010, 24, 921–939. [Google Scholar] [CrossRef]
- Kamal, A.M.; Midorikawa, S. Gis-Based Geomorphological Mapping Using Remote Sensing Data and Supplementary Geoinformation: A Case Study of the Dhaka City Area, Bangladesh. Int. J. Appl. Earth Obs. Geoinf. 2004, 6, 111–125. [Google Scholar]
- Gustavsson, M.; Kolstrup, E.; Seijmonsbergen, H. A New Symbol-and-Gis Based Detailed Geomorphological Mapping System: Renewal of a Scientific Discipline for Understanding Landscape Development. Geomorphology 2006, 77, 90–111. [Google Scholar] [CrossRef] [Green Version]
- Singh, A.K.; Parkash, B.; Choudhury, P.R. Integrated Use of Srm, Landsat Etm+ Data and 3d Perspective Views to Identify the Tectonic Geomorphology of Dehradun Valley, India. Int. J. Remote Sens. 2007, 28, 2403–2414. [Google Scholar] [CrossRef]
- Selvam, S.I.J.D.; Mala, R.I.J.D.; Muthukakshmi, V. A Hydrochemical Analysis and Evaluation of Groundwater Quality Index in Thoothukudi District, Tamilnadu, South India. Int. J. Adv. Eng. Appl. 2013, 2, 25–37. [Google Scholar]
- Selvam, S.; Manimaran, G.; Sivasubramanian, P. Hydrochemical Characteristics and Gis-Based Assessment of Groundwater Quality in the Coastal Aquifers of Tuticorin Corporation, Tamilnadu, India. Appl. Water Sci. 2013, 3, 145–159. [Google Scholar] [CrossRef] [Green Version]
- Selvam, S.; Manimaran, G.; Sivasubramanian, P. Cumulative Effects of Septic System Disposal and Evolution of Nitrate Contamination Impact on Coastal Groundwater in Tuticorin, South Tamilnadu, India. Res. J. Pharm. Biol. Chem. Sci. 2013, 4, 1207–1218. [Google Scholar]
- Singaraja, C.; Chidambaram, S.; Srinivasamoorthy, K.; Anandhan, P.; Selvam, S. A Study on Assessment of Credible Sources of Heavy Metal Pollution Vulnerability in Groundwater of Thoothukudi Districts, Tamilnadu, India. Water Qual. Expo. Health 2015, 7, 459–467. [Google Scholar] [CrossRef]
- Machiwal, D.; Jha, M.K.; Mal, B.C. Assessment of Groundwater Potential in a Semi-Arid Region of India Using Remote Sensing, Gis and Mcdm Techniques. Water Resour. Manag. 2011, 25, 1359–1386. [Google Scholar] [CrossRef]
- Saraf, A.K.; Jain, S.K. Integrated Use of Remote Sensing and Geographical Information System Methods for Groundwater Exploration in Parts of Lalitpur District, Up. In Proceedings of the International Conference on Hydrology and Water Resources, New Delhi, India, 20–22 December 1993; Kluwer Academic Publishers: Dordrecht, The Netherlands, 1994. [Google Scholar]
- Krishnamurthy, J.; Srinivas, G. Role of Geological and Geomorphological Factors in Ground Water Exploration: A Study Using Irs Liss Data. Int. J. Remote Sens. 1995, 16, 2595–2618. [Google Scholar] [CrossRef]
- Krishnamurthy, J.; Kumar, N.V.; Jayaraman, V.; Manivel, M. An Approach to Demarcate Ground Water Potential Zones through Remote Sensing and a Geographical Information System. Int. J. Remote Sens. 1996, 17, 1867–1884. [Google Scholar] [CrossRef]
- Kamaraju, M.; Bhattacharya, A.; Reddy, G.S.; Rao, G.C.; Murthy, G.S.; Rao, T.C.M. Ground-Water Potential Evaluation of West Godavari District, Andhra Pradesh State, India—a Gis Approach. Groundwater 1996, 34, 318–325. [Google Scholar] [CrossRef]
- Ravindran, K.V. Drainage Morphometry Analysis and Its Correlation with Geology, Geomorphology and Groundwater Prospects in Zuvari Basin, South Goa: Using Remote Sensing and Gis. In Proceedings of the National Symposium on Remote Sensing for Natural Resources with Special Emphasis on Water Management, Pune, India, 4–6 December 1996. [Google Scholar]
- Kumar, A. Sustainable Utilisation of Water Resource in Watershed Perspective-a Case Study in Alaunja Watershed, Hazaribagh, Bihar. J. Indian Soc. Remote Sens. 1999, 27, 13–22. [Google Scholar] [CrossRef]
- Krishnamurthy, J.; Mani, A.; Jayaraman, V.; Manivel, M. Groundwater Resources Development in Hard Rock Terrain-an Approach Using Remote Sensing and Gis Techniques. Int. J. Appl. Earth Obs. Geoinf. 2000, 2, 204–215. [Google Scholar] [CrossRef]
- Srivastava, P.K.; Bhattacharya, A.K. Delineation of Ground Water Potential Zones in a Hard Rock Terrain of Bargarh District, Orissa Using Irs Data. J. Indian Soc. Remote Sens. 2000, 28, 129–140. [Google Scholar] [CrossRef]
- Shahid, S.; Nath, S.K.; Roy, J. Groundwater Potential Modelling in a Soft Rock Area Using a Gis. Int. J. Remote Sens. 2000, 21, 1919–1924. [Google Scholar] [CrossRef]
- Khan, M.A.; Moharana, P.C. Use of Remote Sensing and Geographical Information System in the Delineation and Characterization of Ground Water Prospect Zones. J. Indian Soc. Remote Sens. 2002, 30, 131–141. [Google Scholar] [CrossRef]
- Karanth, K.R.; Seshubabu, K. Identification of Major Lineaments on Satellite Imagery and on Aerial Photographs for Delineation for Possible Potential Groundwater Zones in Penukonda and Dharmavaram Taluks of Anantapur Ditrict. In Proceedings of the Joint Indo-US Workshop on Remote Sensing of Water Resources, National Remote Sensing Agency (NRSA), Hyderabad, India, 10–14 April 1978. [Google Scholar]
- Raju, K.C.B.; Rao, P.N.; Rao, G.V.K.; Kumar, B.J. Analytical Aspects of Remote Sensing Techniques for Ground Water Prospection in Hard Rocks. In Proceedings of the 6th Asian Conference on Remote Sensing, Hyderabad, India, 21–26 November 1986. [Google Scholar]
- Palanivel, S.; Ganesh, A.; Kumaran, T.V. Geohydrological Evaluation of Upper Agniar and Vellar Basins, Tamil Nadu: An Integrated Approach Using Remote Sensing, Geophysical and Well Inventory Data. J. Indian Soc. Remote Sens. 1996, 24, 153–168. [Google Scholar] [CrossRef]
- Sankar, K. Evaluation of Groundwater Potential Zones Using Remote Sensing Data in Upper Vaigai River Basin, Tamil Nadu, India. J. Indian Soc. Remote Sens. 2002, 30, 119–129. [Google Scholar] [CrossRef]
- Devi, P.S.; Srinivasulu, S.; Raju, K.K. Hydrogeomorphological and Groundwater Prospects of the Pageru River Basin by Using Remote Sensing Data. Environ. Geol. 2001, 40, 1088–1094. [Google Scholar] [CrossRef]
- Saraf, A.K.; Gupta, R.P.; Jain, R.K.; Srivastava, N.K. Gis Based Processing and Interpretation of Ground Water Quality Data. In Proceedings of the Regional Workshop on Environmental Aspects of Ground Water Development, Kurukshetra, India, 17–19 October 1994. [Google Scholar]
- Achu, A.L.; Thomas, J.; Reghunath, R. Multi-Criteria Decision Analysis for Delineation of Groundwater Potential Zones in a Tropical River Basin Using Remote Sensing, Gis and Analytical Hierarchy Process (Ahp). Groundw. Sustain. Dev. 2020, 10, 100365. [Google Scholar] [CrossRef]
- Das, B.; Pal, S.C.; Malik, S.; Chakrabortty, R. Modeling Groundwater Potential Zones of Puruliya District, West Bengal, India Using Remote Sensing and Gis Techniques. Geol. Ecol. Landsc. 2019, 3, 223–237. [Google Scholar] [CrossRef] [Green Version]
- Lakshmi, S.V.; Reddy, Y.V.K. Identification of Groundwater Potential Zones Using Gis and Remote Sensing. Int. J. Pure Appl. Math. 2018, 119, 3195–3210. [Google Scholar]
- Roy, A.; Keesari, T.; Sinha, U.K.; Sabarathinam, C. Delineating Groundwater Prospect Zones in a Region with Extreme Climatic Conditions Using Gis and Remote Sensing Techniques: A Case Study from Central India. J. Earth Syst. Sci. 2019, 128, 201. [Google Scholar] [CrossRef] [Green Version]
- Kaur, L.; Rishi, M.S.; Singh, G.; Thakur, S.N. Groundwater Potential Assessment of an Alluvial Aquifer in Yamuna Sub-Basin (Panipat Region) Using Remote Sensing and Gis Techniques in Conjunction with Analytical Hierarchy Process (Ahp) and Catastrophe Theory (Ct). Ecol. Indic. 2020, 110, 105850. [Google Scholar] [CrossRef]
- Selvam, S.; Dar, F.A.; Magesh, N.S.; Singaraja, C.; Venkatramanan, S.; Chung, S.Y. Application of Remote Sensing and Gis for Delineating Groundwater Recharge Potential Zones of Kovilpatti Municipality, Tamil Nadu Using If Technique. Earth Sci. Inform. 2016, 9, 137–150. [Google Scholar] [CrossRef]
- Abijith, D.; Saravanan, S.; Singh, L.; Jennifer, J.J.; Saranya, T.; Parthasarathy, K. Gis-Based Multi-Criteria Analysis for Identification of Potential Groundwater Recharge Zones-a Case Study from Ponnaniyaru Watershed, Tamil Nadu, India. HydroResearch 2020, 3, 1–14. [Google Scholar] [CrossRef]
- Kaliraj, S.; Chandrasekar, N.; Magesh, N.S. Identification of Potential Groundwater Recharge Zones in Vaigai Upper Basin, Tamil Nadu, Using Gis-Based Analytical Hierarchical Process (Ahp) Technique. Arab. J. Geosci. 2014, 7, 1385–1401. [Google Scholar] [CrossRef]
- Banks, W.S.; Paylor, R.L.; Hughes, W.B. Using Thermal-Infrared Imagery to Delineate Ground-Water Discharge D. Groundwater 1996, 34, 434–443. [Google Scholar] [CrossRef]
- Aslam, B.; Maqsoom, A.; Tahir, M.D.; Ullah, F.; Rehman, M.S.U.; Albattah, M. Identifying and Ranking Landfill Sites for Municipal Solid Waste Management: An Integrated Remote Sensing and GIS Approach. Buildings 2022, 12, 605. [Google Scholar] [CrossRef]
- Gilani, H.; Ahmad, S.; Qazi, W.A.; Abubakar, S.M.; Khalid, M. Monitoring of Urban Landscape Ecology Dynamics of Islamabad Capital Territory (Ict), Pakistan, over Four Decades (1976–2016). Land 2020, 9, 123. [Google Scholar] [CrossRef] [Green Version]
- Das, S.; Pardeshi, S.D. Integration of Different Influencing Factors in Gis to Delineate Groundwater Potential Areas Using If and Fr Techniques: A Study of Pravara Basin, Maharashtra, India. Appl. Water Sci. 2018, 8, 197. [Google Scholar] [CrossRef] [Green Version]
- Juandi, M.; Syahril, S. Empirical Relationship between Soil Permeability and Resistivity, and Its Application for Determining the Groundwater Gross Recharge in Marpoyan Damai, Pekanbaru, Indonesia. Water Pract. Technol. 2017, 12, 660–666. [Google Scholar] [CrossRef]
- Arkoprovo, B.; Adarsa, J.; Animesh, M. Application of Remote Sensing, Gis and Mif Technique for Elucidation of Groundwater Potential Zones from a Part of Orissa Coastal Tract, Eastern India. Res. J. Recent Sci. 2013, 2277, 2502. [Google Scholar]
- Butt, M.J.; Waqas, A.; Iqbal, M.F.; Muhammad, G.; Lodhi, M.A.K. Assessment of Urban Sprawl of Islamabad Metropolitan Area Using Multi-Sensor and Multi-Temporal Satellite Data. Arab. J. Sci. Eng. 2012, 37, 101–114. [Google Scholar] [CrossRef]
- Shaheen, N.; Baig, M.A.; Mahboob, M.A.; Akbar, S.; Khokar, M.F.; Wwf-Pakistan, G. Application of Remote Sensing Technologies to Detect the Vegetation Changes During Past Two Decades in Islamabad, Pakistan. J. Soc. Sci. 2015, 4, 886–900. [Google Scholar] [CrossRef]
- Hassan, Z.; Shabbir, R.; Ahmad, S.S.; Malik, A.H.; Aziz, N.; Butt, A.; Erum, S. Dynamics of Land Use and Land Cover Change (Lulcc) Using Geospatial Techniques: A Case Study of Islamabad Pakistan. SpringerPlus 2016, 5, 812. [Google Scholar] [CrossRef] [Green Version]
- Butt, A.; Shabbir, R.; Ahmad, S.S.; Aziz, N. Land Use Change Mapping and Analysis Using Remote Sensing and Gis: A Case Study of Simly Watershed, Islamabad, Pakistan. Egypt. J. Remote Sens. Space Sci. 2015, 18, 251–259. [Google Scholar] [CrossRef] [Green Version]
- Shabbir, R.; Ahmad, S.S. Water Resource Vulnerability Assessment in Rawalpindi and Islamabad, Pakistan Using Analytic Hierarchy Process (Ahp). J. King Saud Univ.-Sci. 2016, 28, 293–299. [Google Scholar] [CrossRef] [Green Version]
- Shah, A.; Ali, K.; Nizami, S.M. Spatio-Temporal Analysis of Urban Sprawl in Islamabad, Pakistan During 1979–2019, Using Remote Sensing. GeoJournal 2021, 1–14. [Google Scholar] [CrossRef]
- Abbasi, K. Islamabad’s Groundwater Has Lowered by Five Times over Last Five Years: Minister. DAWN News. 20 December 2018. Available online: https://www.dawn.com/news/1452462/islamabads-groundwater-has-lowered-by-five-times-over-last-five-years-minister (accessed on 18 April 2022).
- Doxiadis, C.A. Islamabad: The Creation of a New Capital. Town Plan. Rev. 1965, 36, 1–35. [Google Scholar] [CrossRef] [Green Version]
- Adeel, M. Methodology for Identifying Urban Growth Potential Using Land Use and Population Data: A Case Study of Islamabad Zone Iv. Procedia Environ. Sci. 2010, 2, 32–41. [Google Scholar] [CrossRef] [Green Version]
- Aslam, A.; Rana, I.A.; Bhatti, S.S. The Spatiotemporal Dynamics of Urbanisation and Local Climate: A Case Study of Islamabad, Pakistan. Environ. Impact Assess. Rev. 2021, 91, 106666. [Google Scholar] [CrossRef]
- Sandhu, G.S.; Naeem, M.A. A Case Study of Innovative Businesses Involved with Efficient Municipal Solid Waste Management in Islamabad, Pakistan. WIT Trans. Ecol. Environ. 2017, 223, 529–538. [Google Scholar]
- Maria, S.I.; Imran, M. Planning of Islamabad and Rawalpindi: What Went Wrong. In Proceedings of the 42nd ISoCaRP Congress, Istanbul, Turkey, 14–18 September 2006. [Google Scholar]
- Arribas-Bel, D.; Nijkamp, P.; Scholten, H. Multidimensional Urban Sprawl in Europe: A Self-Organizing Map Approach. Comput. Environ. Urban Syst. 2011, 35, 263–275. [Google Scholar] [CrossRef] [Green Version]
- Liu, Y.; Din, S.U.; Jiang, Y. Urban Growth Sustainability of Islamabad, Pakistan, over the Last 3 Decades: A Perspective Based on Object-Based Backdating Change Detection. GeoJournal 2020, 86, 2035–2055. [Google Scholar] [CrossRef] [Green Version]
- Ghalib, H.; Elkhorazaty, M.T.; Serag, Y. New Capital Cities: A Timeless Mega-Project of Intercontinental Presence. In Proceedings of the IOP Conference Series: Materials Science and Engineering, Chennai, India, 16–17 September 2020. [Google Scholar]
- Sohail, M.T.; Mahfooz, Y.; Azam, K.; Yat, Y.; Genfu, L.; Fahad, S. Impacts of Urbanization and Land Cover Dynamics on Underground Water in Islamabad, Pakistan. Desalin Water Treat. 2019, 159, 402–411. [Google Scholar] [CrossRef]
- Yaseen, H. People in Islamabad Facing Extreme Water Crisis. MM News, 4 February 2020; p. 1. [Google Scholar]
- APP. Water Shortage Puts Islamabad’s I-8/1 Residents at Risk. The Express Tribune. 13 April 2020. p. 2013. Available online: https://tribune.com.pk/story/2196636/water-shortage-puts-islamabads-81-residents-risk (accessed on 18 April 2022).
- Bishop, J.M.; Glenn, C.R.; Amato, D.W.; Dulai, H. Effect of Land Use and Groundwater Flow Path on Submarine Groundwater Discharge Nutrient Flux. J. Hydrol. Reg. Stud. 2017, 11, 194–218. [Google Scholar] [CrossRef] [Green Version]
- Kotchoni, D.O.V.; Vouillamoz, J.-M.; Lawson, F.M.A.; Adjomayi, P.; Boukari, M.; Taylor, R.G. Relationships between Rainfall and Groundwater Recharge in Seasonally Humid Benin: A Comparative Analysis of Long-Term Hydrographs in Sedimentary and Crystalline Aquifers. Hydrogeol. J. 2019, 27, 447–457. [Google Scholar] [CrossRef] [Green Version]
- Lei, M.; Liu, W.; Gao, Y.; Zhu, T. Mobile User Behaviors in China. In Encyclopedia of Mobile Phone Behavior; IGI Global: Hershey, PA, USA, 2015; pp. 1110–1128. [Google Scholar]
- Xu, G.; Li, P.; Lu, K.; Tantai, Z.; Zhang, J.; Ren, Z.; Wang, X.; Yu, K.; Shi, P.; Cheng, Y. Seasonal Changes in Water Quality and Its Main Influencing Factors in the Dan River Basin. Catena 2019, 173, 131–140. [Google Scholar] [CrossRef]
- Mengel, L.; Krauss, H.-W.; Lowke, D. Water Transport through Cracks in Plain and Reinforced Concrete–Influencing Factors and Open Questions. Constr. Build. Mater. 2020, 254, 118990. [Google Scholar] [CrossRef]
- Zhang, M.; Li, J.; Ding, H.; Ding, J.; Jiang, F.; Ding, N.X.; Sun, C. Distribution Characteristics and Influencing Factors of Microplastics in Urban Tap Water and Water Sources in Qingdao, China. Anal. Lett. 2020, 53, 1312–1327. [Google Scholar] [CrossRef]
- Zhao, Y.; Wang, Y.; Wang, Y. Comprehensive Evaluation and Influencing Factors of Urban Agglomeration Water Resources Carrying Capacity. J. Clean. Prod. 2021, 288, 125097. [Google Scholar] [CrossRef]
- Gebreyohannes, T.; De Smedt, F.; Walraevens, K.; Gebresilassie, S.; Hussien, A.; Hagos, M.; Amare, K.; Deckers, J.; Gebrehiwot, K. Regional Groundwater Flow Modeling of the Geba Basin, Northern Ethiopia. Hydrogeol. J. 2017, 25, 639–655. [Google Scholar] [CrossRef]
- Liu, J.; Gao, G.; Wang, S.; Jiao, L.; Wu, X.; Fu, B. The Effects of Vegetation on Runoff and Soil Loss: Multidimensional Structure Analysis and Scale Characteristics. J. Geogr. Sci. 2018, 28, 59–78. [Google Scholar] [CrossRef] [Green Version]
- Raduła, M.W.; Szymura, T.; Szymura, M. Topographic Wetness Index Explains Soil Moisture Better Than Bioindication with Ellenberg’s Indicator Values. Ecol. Indic. 2018, 85, 172–179. [Google Scholar] [CrossRef]
- Akinluyi, F.O.; Olorunfemi, M.O.; Bayowa, O.G. Investigation of the Influence of Lineaments, Lineament Intersections and Geology on Groundwater Yield in the Basement Complex Terrain of Ondo State, Southwestern Nigeria. Appl. Water Sci. 2018, 8, 49. [Google Scholar] [CrossRef] [Green Version]
- Akter, A.; Uddin, A.M.H.; Ben Wahid, K.; Ahmed, S. Predicting Groundwater Recharge Potential Zones Using Geospatial Technique. Sustain. Water Resour. Manag. 2020, 6, 24. [Google Scholar] [CrossRef]
- Gnanachandrasamy, G.; Zhou, Y.; Bagyaraj, M.; Venkatramanan, S.; Ramkumar, T.; Wang, S. Remote Sensing and Gis Based Groundwater Potential Zone Mapping in Ariyalur District, Tamil Nadu. J. Geol. Soc. India 2018, 92, 484–490. [Google Scholar] [CrossRef]
- Jerbi, H.; Massuel, S.; Leduc, C.; Tarhouni, J. Assessing Groundwater Storage in the Kairouan Plain Aquifer Using a 3d Lithology Model (Central Tunisia). Arab. J. Geosci. 2018, 11, 236. [Google Scholar] [CrossRef]
- Torabi, A.; Alaei, B.; Ellingsen, T. Faults and Fractures in Basement Rocks, Their Architecture, Petrophysical and Mechanical Properties. J. Struct. Geol. 2018, 117, 256–263. [Google Scholar] [CrossRef]
- Daryono, M.R.; Natawidjaja, D.H.; Sapiie, B.; Cummins, P. Earthquake Geology of the Lembang Fault, West Java, Indonesia. Tectonophysics 2019, 751, 180–191. [Google Scholar] [CrossRef]
- Ahmed, R.; Sajjad, H. Analyzing Factors of Groundwater Potential and Its Relation with Population in the Lower Barpani Watershed, Assam, India. Nat. Resour. Res. 2018, 27, 503–515. [Google Scholar] [CrossRef]
- Khan, A.; Govil, H.; Taloor, A.K.; Kumar, G. Identification of Artificial Groundwater Recharge Sites in Parts of Yamuna River Basin India Based on Remote Sensing and Geographical Information System. Groundw. Sustain. Dev. 2020, 11, 100415. [Google Scholar] [CrossRef]
- Thapa, R.; Gupta, S.; Gupta, A.; Reddy, D.V.; Kaur, H. Use of Geospatial Technology for Delineating Groundwater Potential Zones with an Emphasis on Water-Table Analysis in Dwarka River Basin, Birbhum, India. Hydrogeol. J. 2018, 26, 899–922. [Google Scholar] [CrossRef]
- Magesh, N.S.; Chandrasekar, N.; Soundranayagam, J.P. Delineation of Groundwater Potential Zones in Theni District, Tamil Nadu, Using Remote Sensing, Gis and Mif Techniques. Geosci. Front. 2012, 3, 189–196. [Google Scholar] [CrossRef] [Green Version]
- Shaban, A.; Khawlie, M.; Abdallah, C. Use of Remote Sensing and Gis to Determine Recharge Potential Zones: The Case of Occidental Lebanon. Hydrogeol. J. 2006, 14, 433–443. [Google Scholar] [CrossRef]
- Ahirwar, S.; Malik, M.S.; Ahirwar, R.; Shukla, J.P. Application of Remote Sensing and Gis for Groundwater Recharge Potential Zone Mapping in Upper Betwa Watershed. J. Geol. Soc. India 2020, 95, 308–314. [Google Scholar] [CrossRef]
- Pakistan. Generalized Soil Map. Soil Survey of Pakistan. Lahore. Available online: https://esdac.jrc.ec.europa.eu/content/pakistan-generalized-soil-map (accessed on 18 April 2022).
- Bakr, M.U. Geological Map of Pakistan. (East and West Pakistan). Direction of N.M. Khan. Director General. Geological Survey of Pakistan. Available online: https://esdac.jrc.ec.europa.eu/content/geological-map-pakistan-east-and-west-pakistan (accessed on 18 April 2022).
- Dar, T.; Rai, N.; Bhat, A. Delineation of Potential Groundwater Recharge Zones Using Analytical Hierarchy Process (Ahp). Geol. Ecol. Landsc. 2020, 5, 292–307. [Google Scholar] [CrossRef] [Green Version]
- Lehmann, P.; Berli, M.; Koonce, J.E.; Or, D. Surface Evaporation in Arid Regions: Insights from Lysimeter Decadal Record and Global Application of a Surface Evaporation Capacitor (Sec) Model. Geophys. Res. Lett. 2019, 46, 9648–9657. [Google Scholar] [CrossRef] [Green Version]
- Igwe, O.; Ifediegwu, S.I.; Onwuka, O.S. Determining the Occurrence of Potential Groundwater Zones Using Integrated Hydro-Geomorphic Parameters, Gis and Remote Sensing in Enugu State, Southeastern, Nigeria. Sustain. Water Resour. Manag. 2020, 6, 39. [Google Scholar] [CrossRef]
- Kumar, V.A.; Mondal, N.C.; Ahmed, S. Identification of Groundwater Potential Zones Using Rs, Gis and Ahp Techniques: A Case Study in a Part of Deccan Volcanic Province (Dvp), Maharashtra, India. J. Indian Soc. Remote Sens. 2020, 48, 497–511. [Google Scholar] [CrossRef]
- Moeck, C.; Grech-Cumbo, N.; Podgorski, J.; Bretzler, A.; Gurdak, J.J.; Berg, M.; Schirmer, M. A Global-Scale Dataset of Direct Natural Groundwater Recharge Rates: A Review of Variables, Processes and Relationships. Sci. Total Environ. 2020, 717, 137042. [Google Scholar] [CrossRef] [PubMed]
- Martos-Rosillo, S.; Ruiz-Constán, A.; González-Ramón, A.; Mediavilla, R.; Martín-Civantos, J.M.; Martínez-Moreno, F.J.; Jódar, J.; Marín-Lechado, C.; Medialdea, A.; Galindo-Zaldívar, J.; et al. The Oldest Managed Aquifer Recharge System in Europe: New Insights from the Espino Recharge Channel (Sierra Nevada, Southern Spain). J. Hydrol. 2019, 578, 124047. [Google Scholar] [CrossRef]
- Lentswe, G.B.; Molwalefhe, L. Delineation of Potential Groundwater Recharge Zones Using Analytic Hierarchy Process-Guided Gis in the Semi-Arid Motloutse Watershed, Eastern Botswana. J. Hydrol. Reg. Stud. 2020, 28, 100674. [Google Scholar] [CrossRef]
- Kolli, M.K.; Opp, C.; Groll, M. Mapping of Potential Groundwater Recharge Zones in the Kolleru Lake Catchment, India, by Using Remote Sensing and Gis Techniques. Nat. Resour. 2020, 11, 127. [Google Scholar] [CrossRef] [Green Version]


| Technique Used | Usage and Findings | Key Factors/Parameters | Limitations | Ref |
|---|---|---|---|---|
| GIS and RS with fuzzy analytic hierarchy process (AHP) | Fuzzy AHP was used to delineate groundwater recharge zones. Several parameters were considered, and GIS and RS techniques were applied. | Drainage, Geomorphology, Geology, Land Use/Land Cover (LULC), Lineament, Permeability, Slope, Soil Texture, Soil Depth, Rainfall. | Fuzzy AHP brings more complexity and fuzziness to the decision-making process, thereby affecting outcomes. | [66,67] |
| GIS and RS with MCDM | MCDM was integrated with RS and GIS to delineate and map potential groundwater zones. | Density, Drainage Geology, Geomorphology, Lineament, LULC, Soil, Slope, Rainfall. | Various MCDM models can provide conflicting rankings of the alternatives for a common set of information. | [66,68] |
| GIS and RS with frequency ratio (FR) | FR, RS, and GIS were combined to delineate and map the potential groundwater zones. | Drainage Density, Soil Density, Geomorphology, Lineament Lithology, Land-use Pattern, Slope, Soil Texture, Rainfall. | The FR method utilizes past trends to predict the future outcome, making this approach depend on historical data that may not always be available. | [69,70,71] |
| Thermal infrared imagery | A thermal infrared multispectral scanner was used to delineate potential groundwater recharge zones. | Hydrogeology, Height, Thermal Parameters | Thermal activities around artificial structures such as power plants and industrial zones, clouds, and other distractions can lead to inaccurate data. | [68,72] |
| Group | Key Factors | Source of Categorization | Selected Ref |
|---|---|---|---|
| Elevation and slope | Elevation | Height value | [99] |
| Slope | Slope gradient | [100] | |
| Slope length | Measurement of slope lengthwise | [100] | |
| Aspect | Aspects of area | [70] | |
| Total wetness index | Runoff collection and infiltration | [101] | |
| Rainfall and drainage | Rainfall | Zones with rainfall recement | [93] |
| Drainage distance | Distance to drainage networks | [102] | |
| Drainage density | Density values for drainage | [103] | |
| Land use/land cover and soil characteristics | Land use/land cover | Satellite imageries | [104] |
| Soil | Textures | [72] | |
| Lithology | Rock type details | [105] | |
| Plan curvature | Detailed area curvature | [70] | |
| Profile curvature | Flow categorization | [61] | |
| Faults | Distance to faults | Lineament distance | [106] |
| Fault density | Density for lineaments | [107] |
| Factors (units) | Sources of Acquisition for Thematic Maps |
|---|---|
| Soil | Soil map of Pakistan |
| Land use, TWI, Rainfall (mm/y) | Landsat-8 TM satellite data |
| Drainage distance (m), Slope (degree), Plan curvature, Profile curvature, Slope length (m), Elevation (m), Drainage density, Aspect | ASTER GDEM |
| Distance to faults (m), Lithology, Fault density | Geological map of Pakistan |
| Factors | Major Effect (A) | Minor Effect (B) | Proposed Relative Rates (A + B) | Normalized Relative Rates (Y) in % |
|---|---|---|---|---|
| Distance to Faults | 2 + 2 + 2 + 2 | 1 + 1 + 1 | 11 | 6.875 |
| Land use/Land cover | 2 + 2 + 2 + 2 + 2 + 2 | 1 + 1 + 1 + 1 | 16 | 10.000 |
| Lithology | 2 + 2 + 2 + 2 + 2 + 2 | 1 + 1 + 1 + 1 | 16 | 10.000 |
| Drainage Density | 2 + 2 + 2 + 2 + 2 + 2 | 1 + 1 + 1 | 15 | 9.375 |
| Slope | 2 + 2 + 2 + 2 + 2 | 1 + 1 + 1 | 13 | 8.125 |
| Soil | 2 + 2 + 2 + 2 + 2 | 1 + 1 + 1 | 13 | 8.125 |
| Rainfall | 2 + 2 + 2 + 2 + 2 | 1 + 1 + 1 | 13 | 8.125 |
| Plan Curvature | 2 + 2 | 1 | 5 | 3.125 |
| Fault Density | 2 + 2 + 2 + 2 | 1 + 1 | 10 | 6.250 |
| Profile Curvature | 2 + 2 | 1 | 5 | 3.125 |
| TWI | 2 + 2 + 2 | 1 + 1 | 8 | 5.000 |
| Elevation | 2 + 2 + 2 + 2 | 1 + 1 + 1 | 11 | 6.875 |
| Aspect | 2 + 2 + 2 | 1 + 1 | 8 | 5.000 |
| Drainage Distance | 2 + 2 + 2 + 2 | 1 + 1 | 10 | 6.250 |
| Slope Length | 2 + 2 | 1 + 1 | 6 | 3.750 |
| Σ = 160 | Σ = 100 | |||
| 160 | 100 |
| Factors | Categories | Effect | Normalized Weight (X) | Normalized Relative Rates (Y) Based on Table 4 | Weighted Rating | Total Weightage max(X) × Y | MAX Effect on Recharge Potential (%) |
|---|---|---|---|---|---|---|---|
| (1–10) | (1–10) | (X × Y) | |||||
| Rainfall | <882 | Very Low | 2 | 8.125 | 16.25 | 81.25 | 8.125 |
| 882–999 | Low | 4 | 32.50 | ||||
| 999–1116 | Medium | 6 | 48.75 | ||||
| 1116–1233 | High | 8 | 65.00 | ||||
| 1233–1350 | Very High | 10 | 81.25 | ||||
| Plan curvature | <−2.34 | Very Low | 2 | 3.125 | 6.25 | 31.25 | 3.125 |
| −1.74 | Low | 4 | 12.50 | ||||
| −1.2 | Medium | 6 | 18.75 | ||||
| 0.6–2.6 | High | 8 | 25.00 | ||||
| >2.6 | Very High | 10 | 31.25 | ||||
| Soil | Calcareous Loamy Soil Piedmont | Very High | 10 | 8.125 | 81.25 | 81.25 | 8.125 |
| Calcareous Silty Soil Gullied Land Complex | High | 8 | 65.00 | ||||
| Rough Broken Land | High | 8 | 65.00 | ||||
| Mountainous land with nearly continuous soil | Medium | 6 | 48.75 | ||||
| Mountainous land with patchy soil | Medium | 6 | 48.75 | ||||
| Urban | Very Low | 4 | 32.50 | ||||
| Calcareous Loamy Soil | Low | 2 | 16.25 | ||||
| Distance to fault | <100 | Very High | 10 | 6.875 | 68.75 | 68.75 | 6.875 |
| 100–200 | High | 8 | 55.00 | ||||
| 200–500 | High | 8 | 55.00 | ||||
| 500–1000 | Medium | 6 | 41.25 | ||||
| 1000–2000 | Medium | 6 | 41.25 | ||||
| 2000–5000 | Very Low | 4 | 27.50 | ||||
| >5000 | Low | 2 | 13.75 | ||||
| Drainage distance | <100 | Very High | 10 | 6.250 | 62.50 | 62.50 | 6.250 |
| 100–200 | High | 8 | 50.00 | ||||
| 200–500 | Medium | 6 | 37.50 | ||||
| >500 | Low | 4 | 25.00 | ||||
| Profile Curvature | <−3.14 | Very Low | 2 | 3.125 | 6.25 | 31.25 | 3.125 |
| −2.24 | Low | 4 | 12.50 | ||||
| −1.8 | Medium | 6 | 18.75 | ||||
| 0.7–2.9 | High | 8 | 25.00 | ||||
| >2.9 | Very High | 10 | 31.25 | ||||
| TWI | <2 | Very Low | 2 | 5.000 | 10.00 | 50.00 | 5.000 |
| 2–4 | Low | 4 | 20.00 | ||||
| 4–6 | Medium | 6 | 30.00 | ||||
| >6 | High or very high | 10 | 50.00 | ||||
| Slope | <12 | Very High | 10 | 8.125 | 81.25 | 81.25 | 8.125 |
| 12–24 | High | 8 | 65.00 | ||||
| 24–36 | Medium | 6 | 48.75 | ||||
| 36–48 | Low | 4 | 32.50 | ||||
| >48 | Very Low | 2 | 16.25 | ||||
| Elevation | <531 | Very High | 10 | 6.875 | 68.75 | 68.75 | 6.875 |
| 531–617 | High | 8 | 55.00 | ||||
| 617–756 | Medium | 6 | 41.25 | ||||
| 756–994 | Low | 4 | 27.50 | ||||
| >994 | Very Low | 2 | 13.75 | ||||
| Slope length | <10 | Very High | 10 | 3.750 | 37.50 | 37.50 | 3.750 |
| 10–20 | High | 8 | 30.00 | ||||
| 20–30 | Medium | 6 | 22.50 | ||||
| 30–40 | Low | 4 | 15.00 | ||||
| >40 | Very Low | 2 | 7.50 | ||||
| Lithology | Limestone | High | 10 | 10.000 | 100.00 | 100.00 | 10.000 |
| Sandstone | Medium | 6 | 60.00 | ||||
| Unconsolidated deposit | Low | 4 | 40.00 | ||||
| Land use | Bare area | Low | 4 | 10.000 | 40.00 | 100.00 | 10.000 |
| Vegetation | High | 8 | 80.00 | ||||
| Water | Very High | 10 | 100.00 | ||||
| Built-up | Medium | 6 | 60.00 | ||||
| Fault density | <15 | Very Low | 2 | 6.250 | 12.50 | 62.50 | 6.250 |
| 15–41 | Low | 4 | 25.00 | ||||
| 41–65 | Medium | 6 | 37.50 | ||||
| 65–91 | High | 8 | 50.00 | ||||
| >91 | Very High | 10 | 62.50 | ||||
| Drainage density | <1 | Very Low | 2 | 9.375 | 18.75 | 93.75 | 9.375 |
| 01/01/1984 | Low | 4 | 37.50 | ||||
| 1.84–2.68 | Medium | 6 | 56.25 | ||||
| 2.68–3.53 | High | 8 | 75.00 | ||||
| >3.53 | Very High | 10 | 93.75 | ||||
| Aspect | Flat | Very High | 10 | 5.000 | 50.00 | 50.00 | 5.000 |
| North | Very High | 10 | 50.00 | ||||
| Northeast | High | 8 | 40.00 | ||||
| East | High | 8 | 40.00 | ||||
| Southwest | Medium | 6 | 30.00 | ||||
| Southeast | Medium | 6 | 30.00 | ||||
| South | Low | 4 | 20.00 | ||||
| West | Low | 4 | 20.00 | ||||
| Northwest | Very Low | 2 | 10.00 | ||||
| GTW: | Σ = 100 | ||||||
| Σ = 3118 |
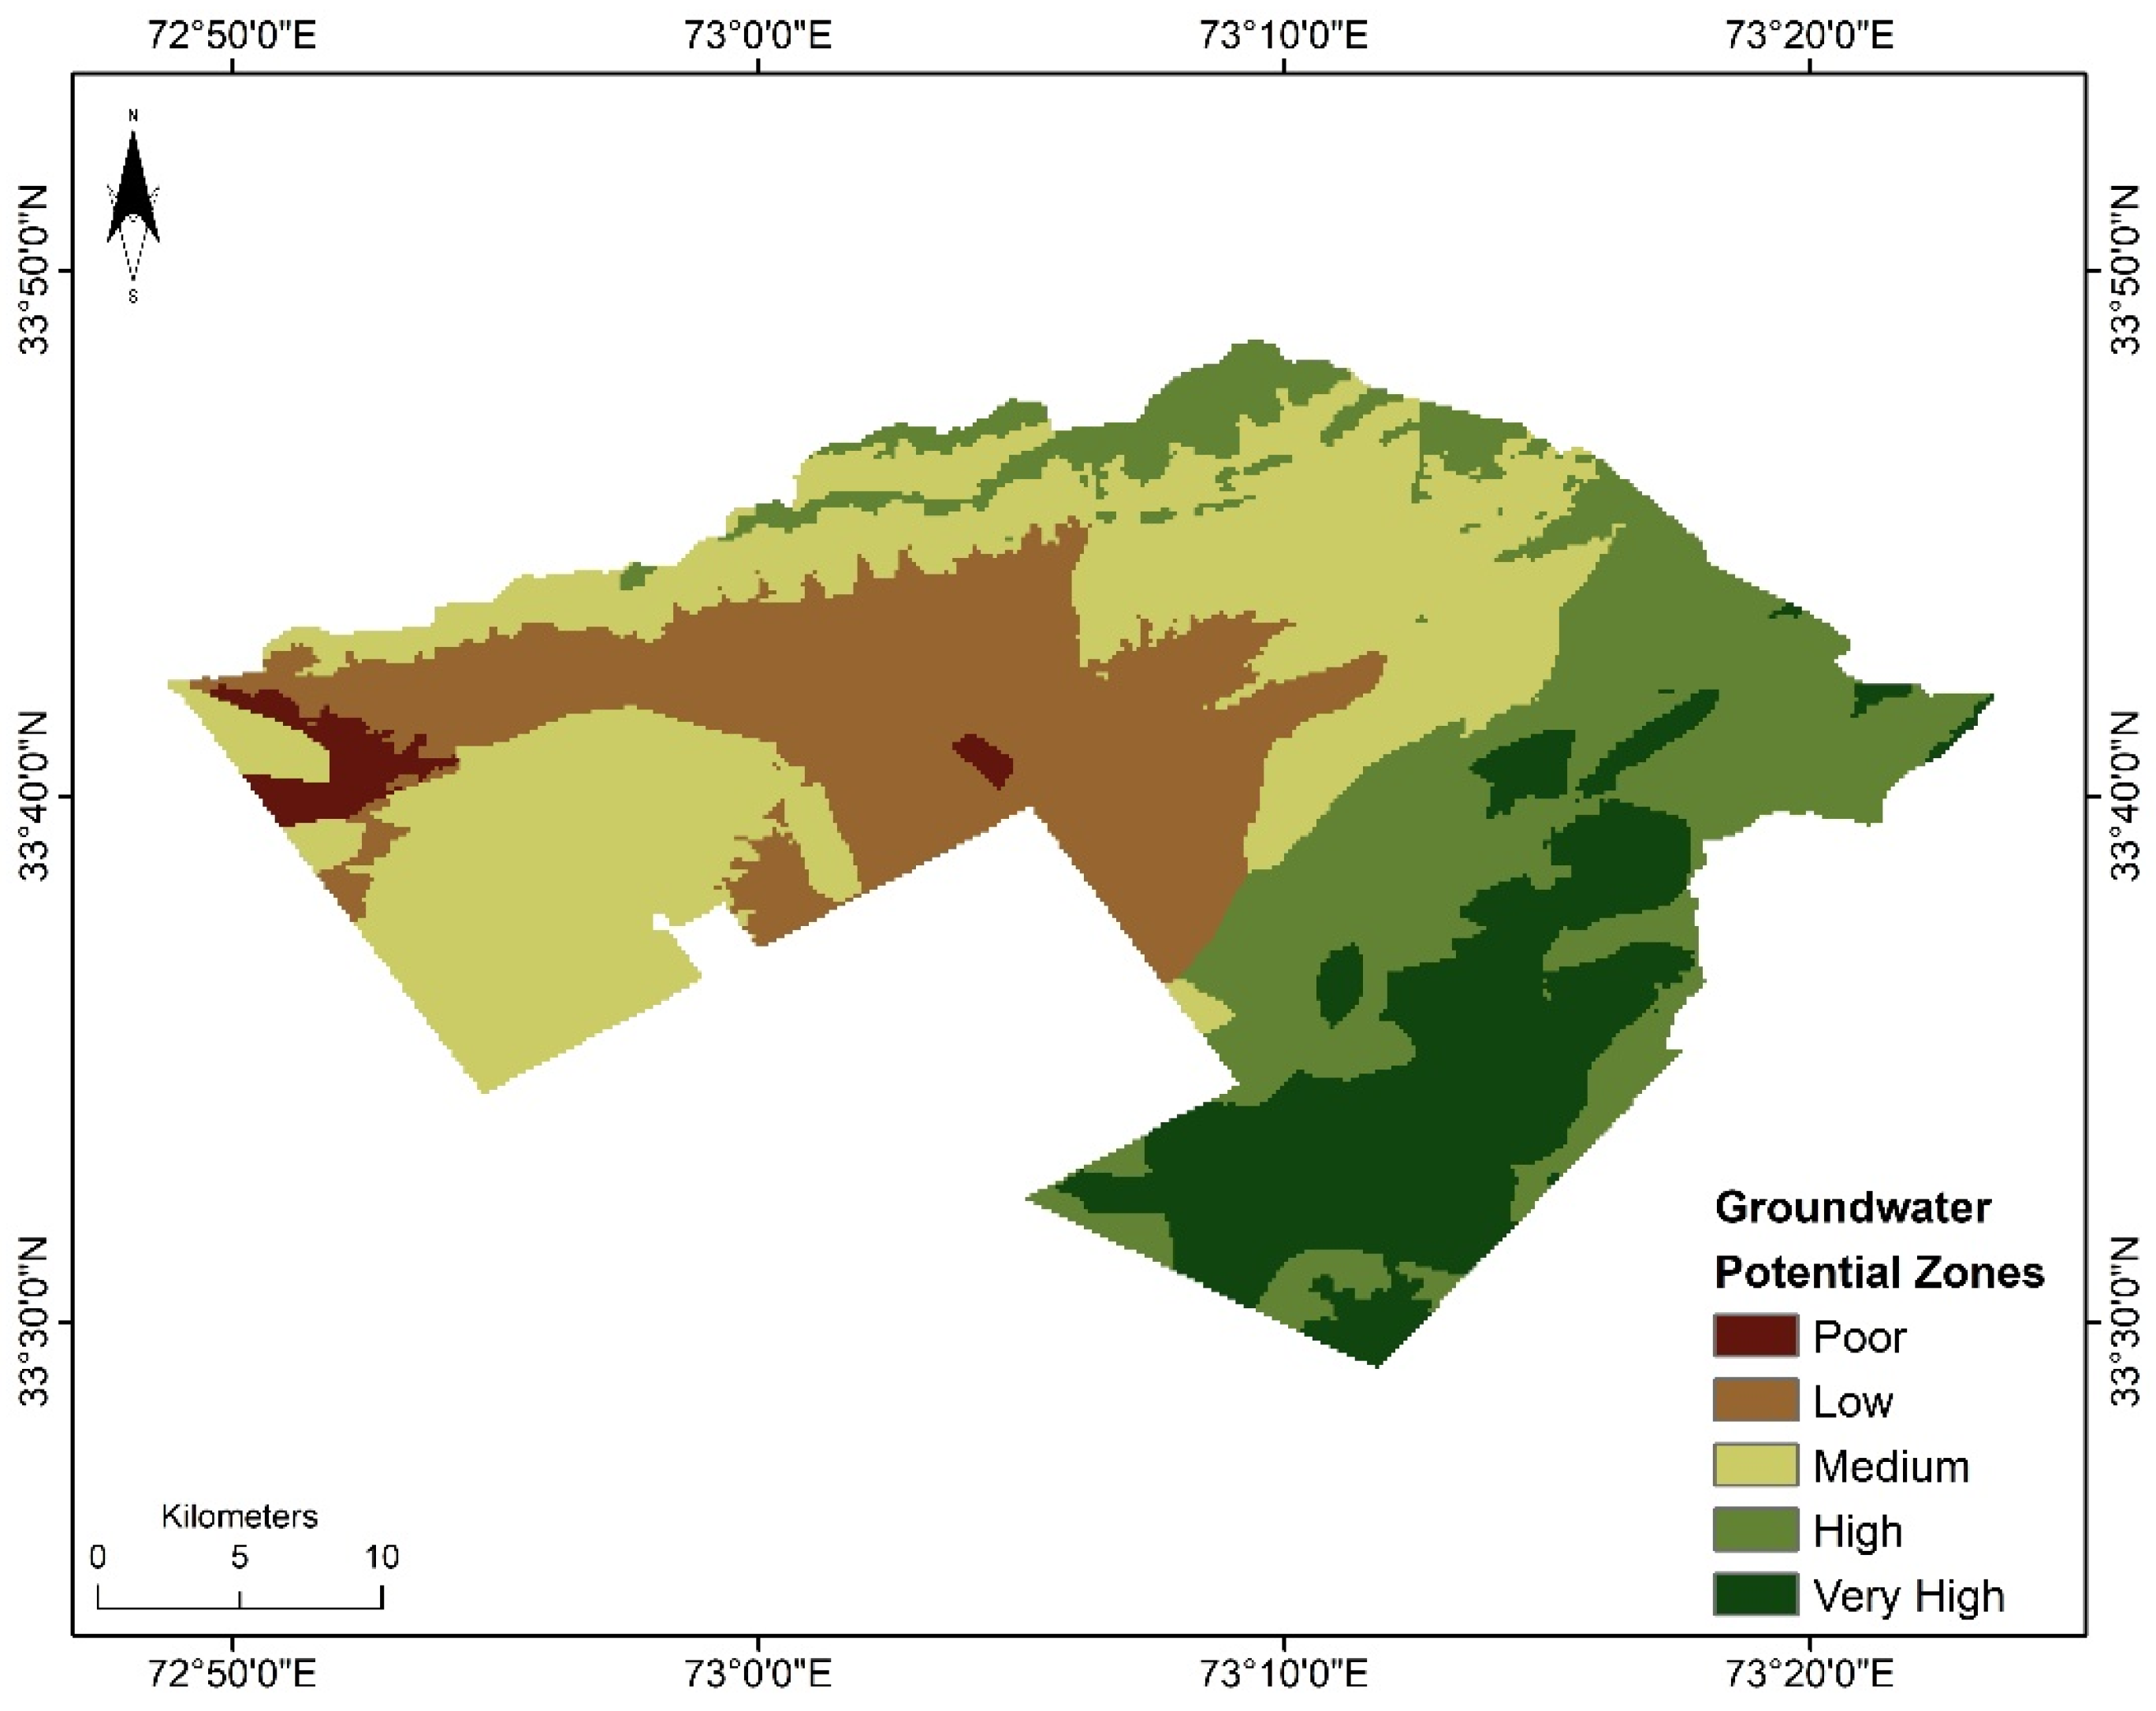
| Recharge Potential Category | Average % | Area Extant (km2) |
|---|---|---|
| Very High | 15% | 136.8 |
| High | 21% | 191.52 |
| Medium | 24% | 218.88 |
| Low | 27% | 246.24 |
| Poor | 13% | 118.56 |
Publisher’s Note: MDPI stays neutral with regard to jurisdictional claims in published maps and institutional affiliations. |
© 2022 by the authors. Licensee MDPI, Basel, Switzerland. This article is an open access article distributed under the terms and conditions of the Creative Commons Attribution (CC BY) license (https://creativecommons.org/licenses/by/4.0/).
Share and Cite
Maqsoom, A.; Aslam, B.; Khalid, N.; Ullah, F.; Anysz, H.; Almaliki, A.H.; Almaliki, A.A.; Hussein, E.E. Delineating Groundwater Recharge Potential through Remote Sensing and Geographical Information Systems. Water 2022, 14, 1824. https://doi.org/10.3390/w14111824
Maqsoom A, Aslam B, Khalid N, Ullah F, Anysz H, Almaliki AH, Almaliki AA, Hussein EE. Delineating Groundwater Recharge Potential through Remote Sensing and Geographical Information Systems. Water. 2022; 14(11):1824. https://doi.org/10.3390/w14111824
Chicago/Turabian StyleMaqsoom, Ahsen, Bilal Aslam, Nauman Khalid, Fahim Ullah, Hubert Anysz, Abdulrazak H. Almaliki, Abdulrhman A. Almaliki, and Enas E. Hussein. 2022. "Delineating Groundwater Recharge Potential through Remote Sensing and Geographical Information Systems" Water 14, no. 11: 1824. https://doi.org/10.3390/w14111824