
Parametric Study on Abutment Scour under Unsteady Flow


1
Department of Civil Engineering, KLE Dr. M.S. Sheshgiri College of Engineering & Technology, Belgaum 590 008, India
2
National Applied Research Laboratories, Taiwan Typhoon and Flood Research Institute, Taipei 10093, Taiwan
3
Department of Civil Engineering, Rajarshi Shahu College of Engineering, Pune 411 033, India
*
Author to whom correspondence should be addressed.
Water 2022, 14(11), 1820; https://doi.org/10.3390/w14111820
Submission received: 25 April 2022
/
Revised: 30 May 2022
/
Accepted: 31 May 2022
/
Published: 6 June 2022
(This article belongs to the Special Issue Advances in Experimental Hydraulics, Coast and Ocean Hydrodynamics)
Abstract
:Experimental results on scour at abutments under unsteady clear water flow condition are presented. Three shapes of short abutments (abutment length/upstream flow depth < 1) were tested, namely, rectangular/vertical wall, semi-circular, and trapezoidal/45° wing-wall abutments embedded in uniform sands of two sizes having d50 = 0.52 mm and 0.712 mm. The unsteadiness of the flow is considered in the form flood hydrographs of three forms, namely: advanced flood hydrograph (Type I), symmetrical flood hydrograph (Type II), and delayed flood hydrograph (Type III) with the flow maintained at clear water condition in all cases. The experimental findings are used to represent the influence of various parameters on scour depth at bridge abutments. It was observed that the scour depth at rectangular abutments is greater than that at trapezoidal and semi-circular abutments. The scour depths at abutments embedded in finer sediments are greater than those in coarser sediments. In addition, based on the study of effect of three flood hydrographs, it was noticed that the delayed flood hydrograph yields greater scour depth as compared to the other two cases. Further, based on the method of superposition and the correction of shape factor, a semi-empirical model using dimensionless parameters is proposed to compute the temporal evolution of scour depth at abutments under unsteady clear water conditions. The parameters used in this model include flow shallowness, flow intensity, sediment coarseness, and time factor. It was found that the proposed model corresponds well with the data of time-dependent scour depth in uniform sediments obtained from the present experiments (unsteady flows) and reported by different investigators (steady flows).
1. Introduction
The land transportation system is the key parameter in the economy of the country, and crossing over river bridges is important for connecting people and transporting commodities from each side of rivers. Bridge foundations consisting of bridge piers and abutments are founded in mobile riverbeds, and their interaction with the approach flow and bed materials cause scour holes around the bridge pier and abutment. The excessive local scouring caused during floods poses a challenging problem to hydraulic engineers and particularly bridge engineers. The phenomenon of pier and abutment scour under steady flow conditions has been extensively studied for a long time [1,2,3,4]. A review of experimental and field studies was given by Breusers et al. [5], Dargahi [6], Breusers and Raudkivi [7], Dey [8,9], Hoffmans and Verheij [10], Melville and Coleman [11], Richardson and Davis [12], and Barbhuiya and Dey [13]. Temporal variation of abutment scour depth has been carried out by Tey [14], Cardoso and Bettess [15], Ballio and Oris [16], Oliveto and Hager [17], Coleman et al. [18], Dey and Barbhuiya [19], and Yanmaz and Kose [20]. Additionally, studies on the time-dependence of pier-scour depth under unsteady flow conditions has been carried out by Kothyari et al. [21], Briaud et al. [22], Chang et al. [23], and Oliveto and Hager [24]. However, only limited studies on abutment-scour under unsteady flows have been reported. In addition, the effect of various parameters on abutment scour depth under unsteady flow has not been studied.
Therefore, the objective of the present study is aimed at a detailed parametric study on abutment scour depth along with the temporal evolution of abutment scour depth under unsteady clear water conditions at short abutments. The experimental results are used to describe the effects of various parameters on scour depth. Further, an attempt is made to develop a semi-empirical calculation scheme for the temporal variation of abutment scour depth under unsteady flows.
2. Experimental Setup and Procedure
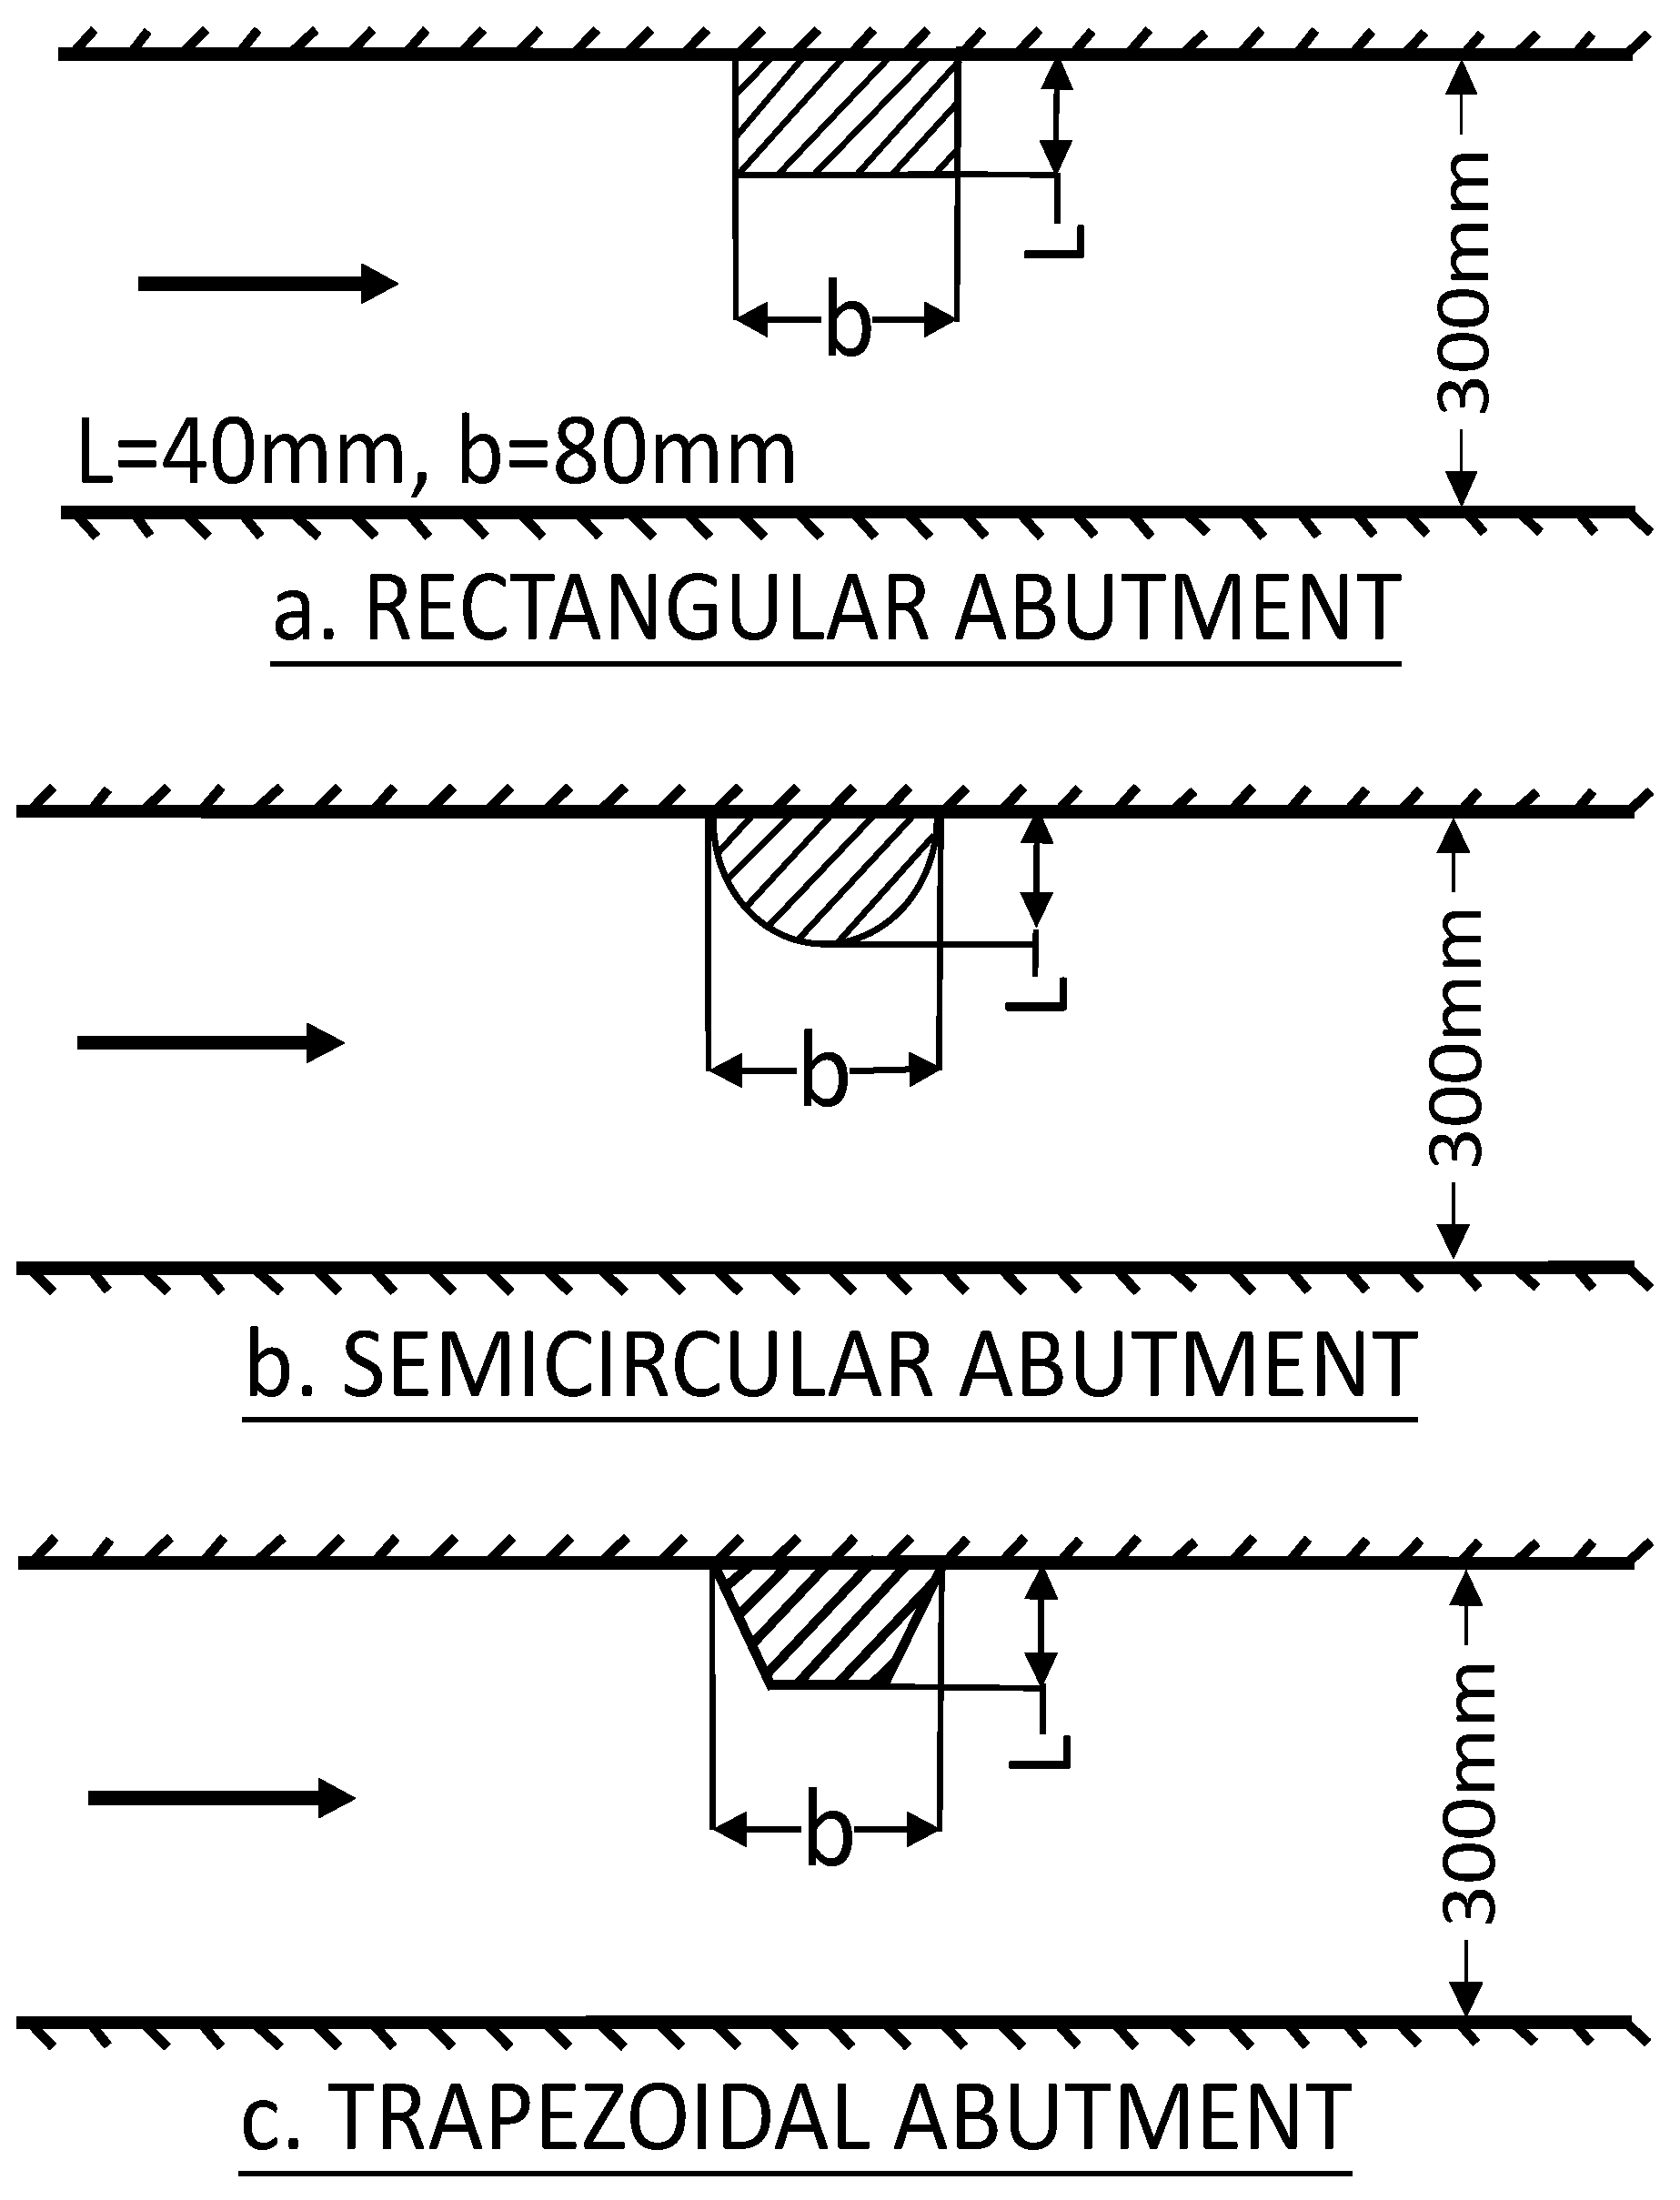
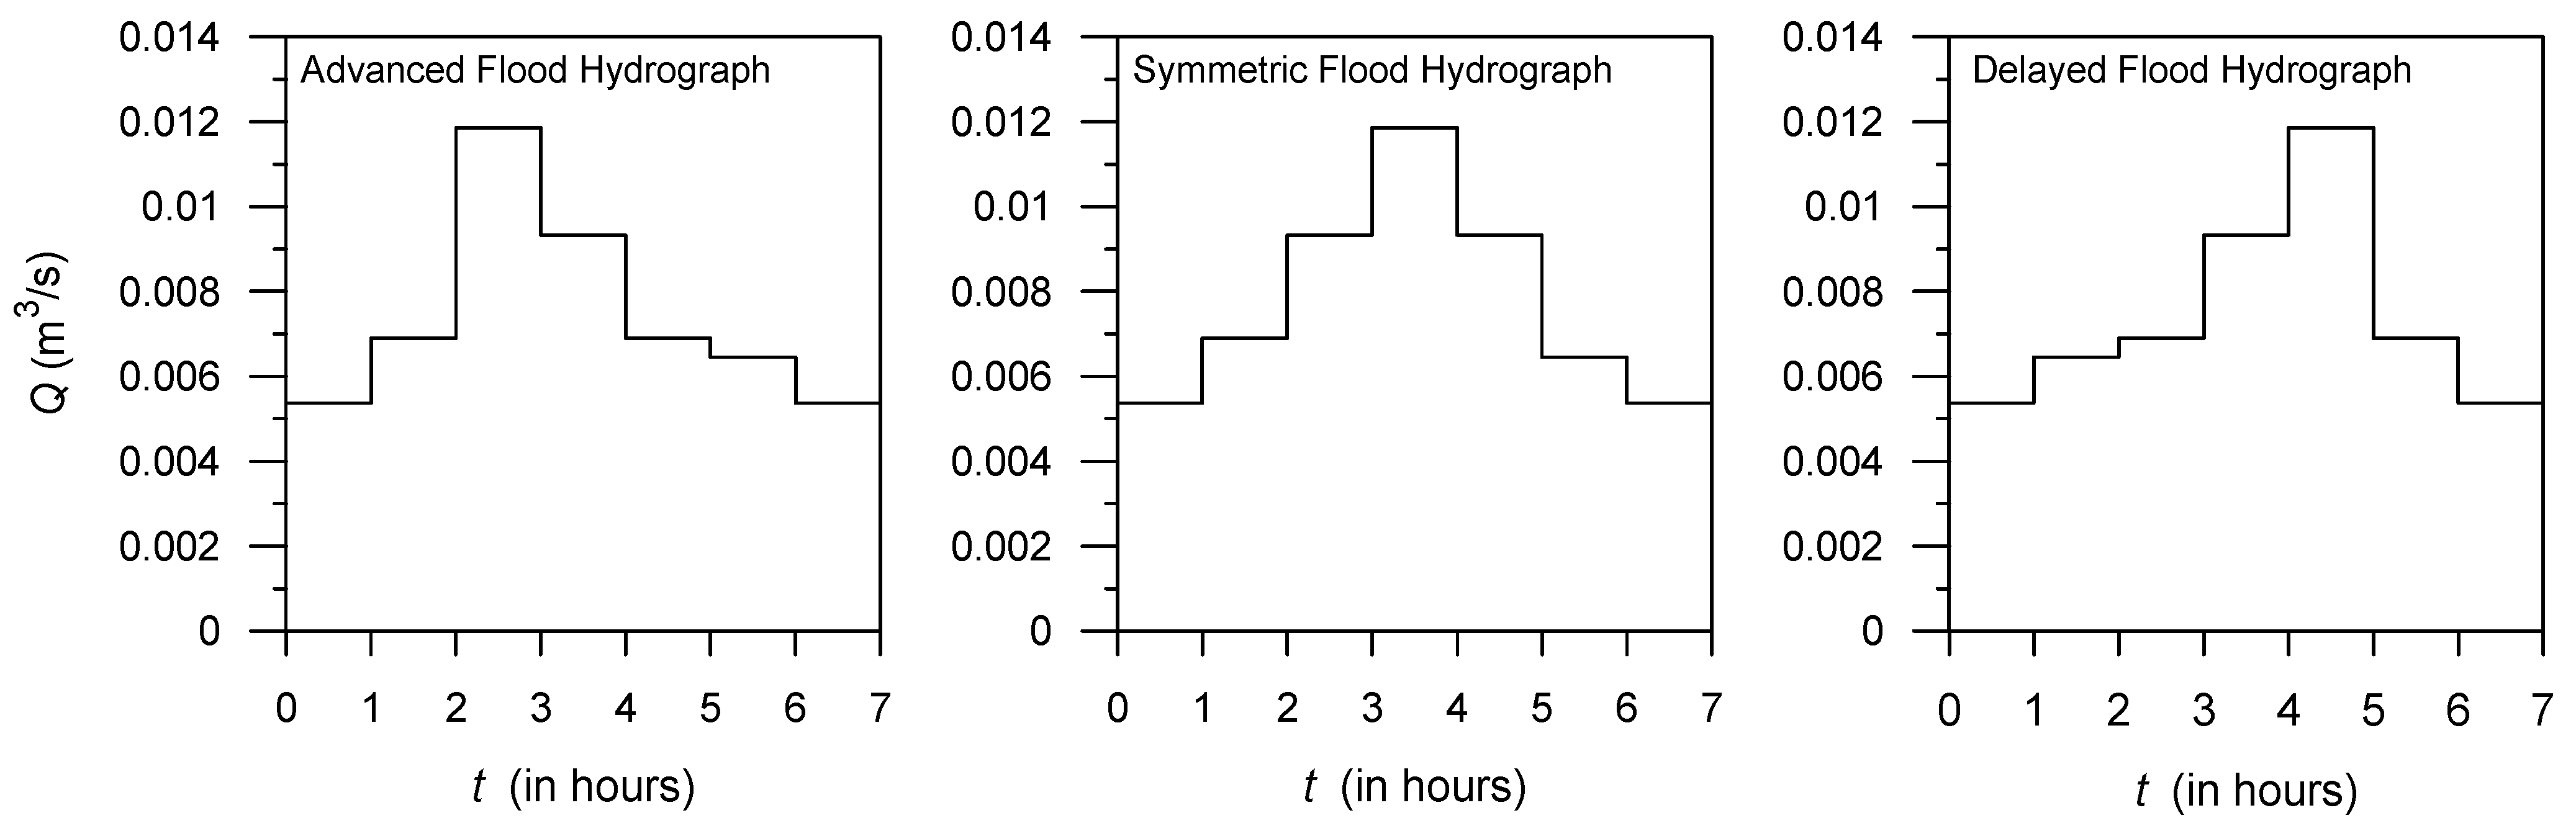
The experiments were conducted at the Department of Civil Engineering, Rajarshi Shahu College of Engineering, Pune, India. A re-circulating tilting water channel of 800 cm length, 30 cm width, and 30 cm depth with glass-sided walls and stainless-steel bottom was used for experimentation. The test section consisting of a mobile bed zone of 185 cm in length, 30 cm width, and 10 cm depth was created 225 cm downstream of the inlet section and was filled with sediment. To facilitate smooth entry of water with reduced turbulence, the false bed was tapered at the entrance and a honeycomb structure was placed vertically at the entrance. A sediment trap of 20 cm in length provided at the tail end of the flume was used to collect scoured sediments. Three types of Perspex short abutment models, namely rectangular/vertical wall, semi-circular, and trapezoidal/45° wing-wall abutment, were employed in the study. The streamwise length b = 80 mm and the transverse length L = 40 mm of abutments are detailed in Figure 1. Two uniform sediments with median grain size (d50) = 0.52 mm and 0.712 mm were used for the experiments. All the experiments were run under clear water scour (V/Vc < 1, where V = average approach flow velocity and Vc = critical velocity) with unsteady flow conditions. Three types of hydrographs having the same base period (td = 7 h) and the same peak flow (Q = 0.012 m3/s) but different shapes, as shown in Figure 2, were considered in this study. Type I is the advanced flood hydrograph having steep rising limb and flat recession limb, while Type III is the reverse of Type I and is called delayed flood hydrograph. However, the Type II hydrograph is a symmetrical one. The peak flow occurs at the 3rd, 4th, and 5th hour for the Type I, Type II, and Type III hydrographs, respectively. Unsteady uniform flow was developed by regulating the inlet orifice and the tailgate simultaneously, and the desired stepwise hydrographs were attained. In addition, the range of flow intensity (V/Vc) for all runs under each step was maintained between 0.7 and 0.85 so that the flow was always at clear water condition (V/Vc < 1). A total of eighteen experiments were conducted and the details are furnished in Table 1. As listed in Table 1, y is the approach flow depth, dsf,m and dsf,c is the measured final scour depth after the hydrograph.
3. Influence of Various Parameters on Scour Depth
This section presents the effect of abutment shape, sediment size, and nature of flood hydrograph (unsteadiness of flow) on the temporal variation of scour depth at abutments. In this discussion, the effect of an only rising limb of the hydrograph is illustrated because the scour depth reaches the maximum value at the peak discharge of a particular hydrograph and remains constant afterwards during the recession part of the hydrograph.
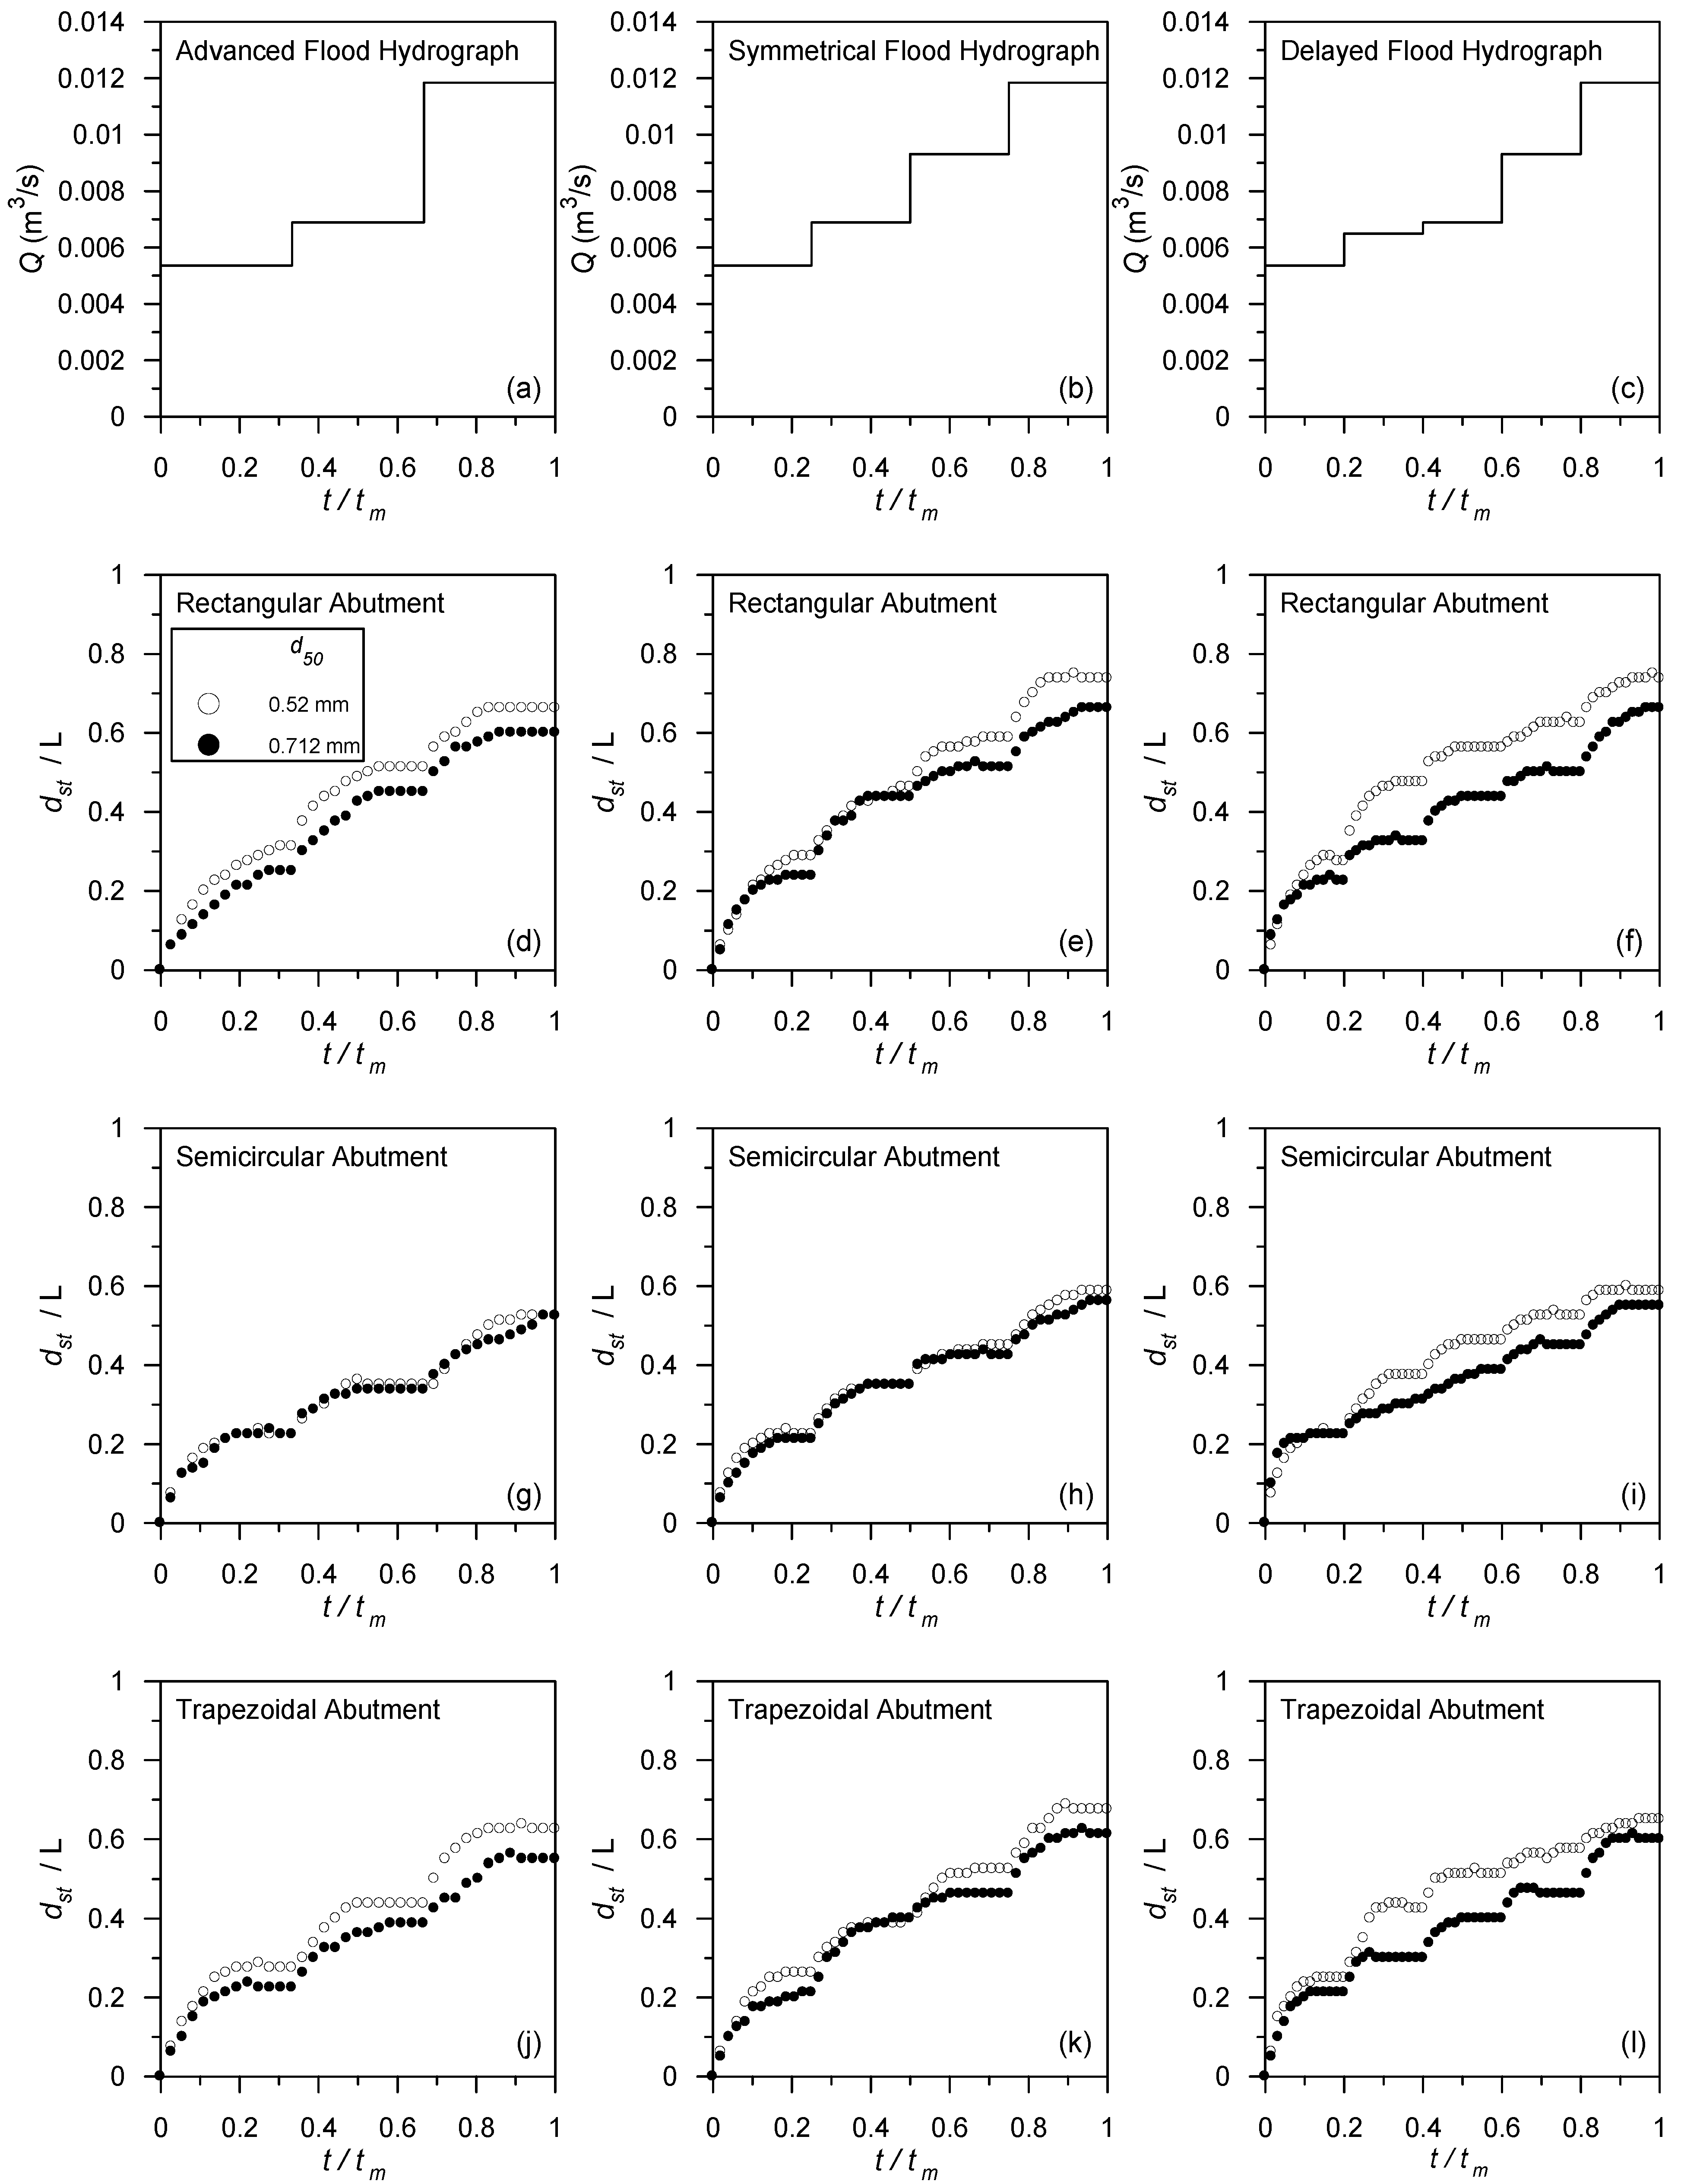
The laboratory experimental results of three abutment shapes (rectangular, semi-circular, and trapezoidal abutments) embedded in two sediments of d50 = 0.52 mm and 0.712 mm under unsteady clear water condition (V/Vc < 1) with three types of hydrographs are used to plot non-dimensional scour depth dst/L (where dst = temporal variation of scour depth and L = transverse length of abutment) versus non-dimensional time t/tm (where tm = final time of scour corresponding to peak discharge) as shown in Figure 3. Figure 3a–c illustrate the rising limbs of the three types of flood hydrographs considered (advanced, symmetrical, and delayed). The variation of the non-dimensional scour depth dst/L with non-dimensional time t/tm for rectangular, semi-circular, and trapezoidal abutments is shown in Figure 3d–f, 3g–i, and 3j–l, respectively. From Figure 3d–l it can be seen that the non-dimensional scour depth dst/L increases steeply in the initial stage of the flood hydrograph and then reaches a steady value at the end of the step. With an increase in discharge from preceding step to next step, the non-dimensional scour depth dst/L again increases steeply and follows the trend of the previous step before the next discharge being introduced. This trend repeats for all the steps of flood hydrographs. However, after the peak discharge is reached, the non-dimensional scour depth dst/L remains constant in the recession part of the hydrographs (not shown in Figure 3d–l). Further, it is also depicted in Figure 3d–l that the scour depth at abutments embedded in finer sediments (d50 = 0.52 mm) is greater than that in coarser sediments (d50 = 0.712 mm). This is due to the larger erosive capacity of vortexes in finer sediment than those in coarser sediments and lesser resistance of finer sediments. Further, the variation of non-dimensional scour depth dst/L with non-dimensional time t/tm at rectangular and trapezoidal abutments is quite separated for different sediment sizes (Figure 3d–f and j–l), while the curves are very close in the case of semi-circular abutments (Figure 3g–i).
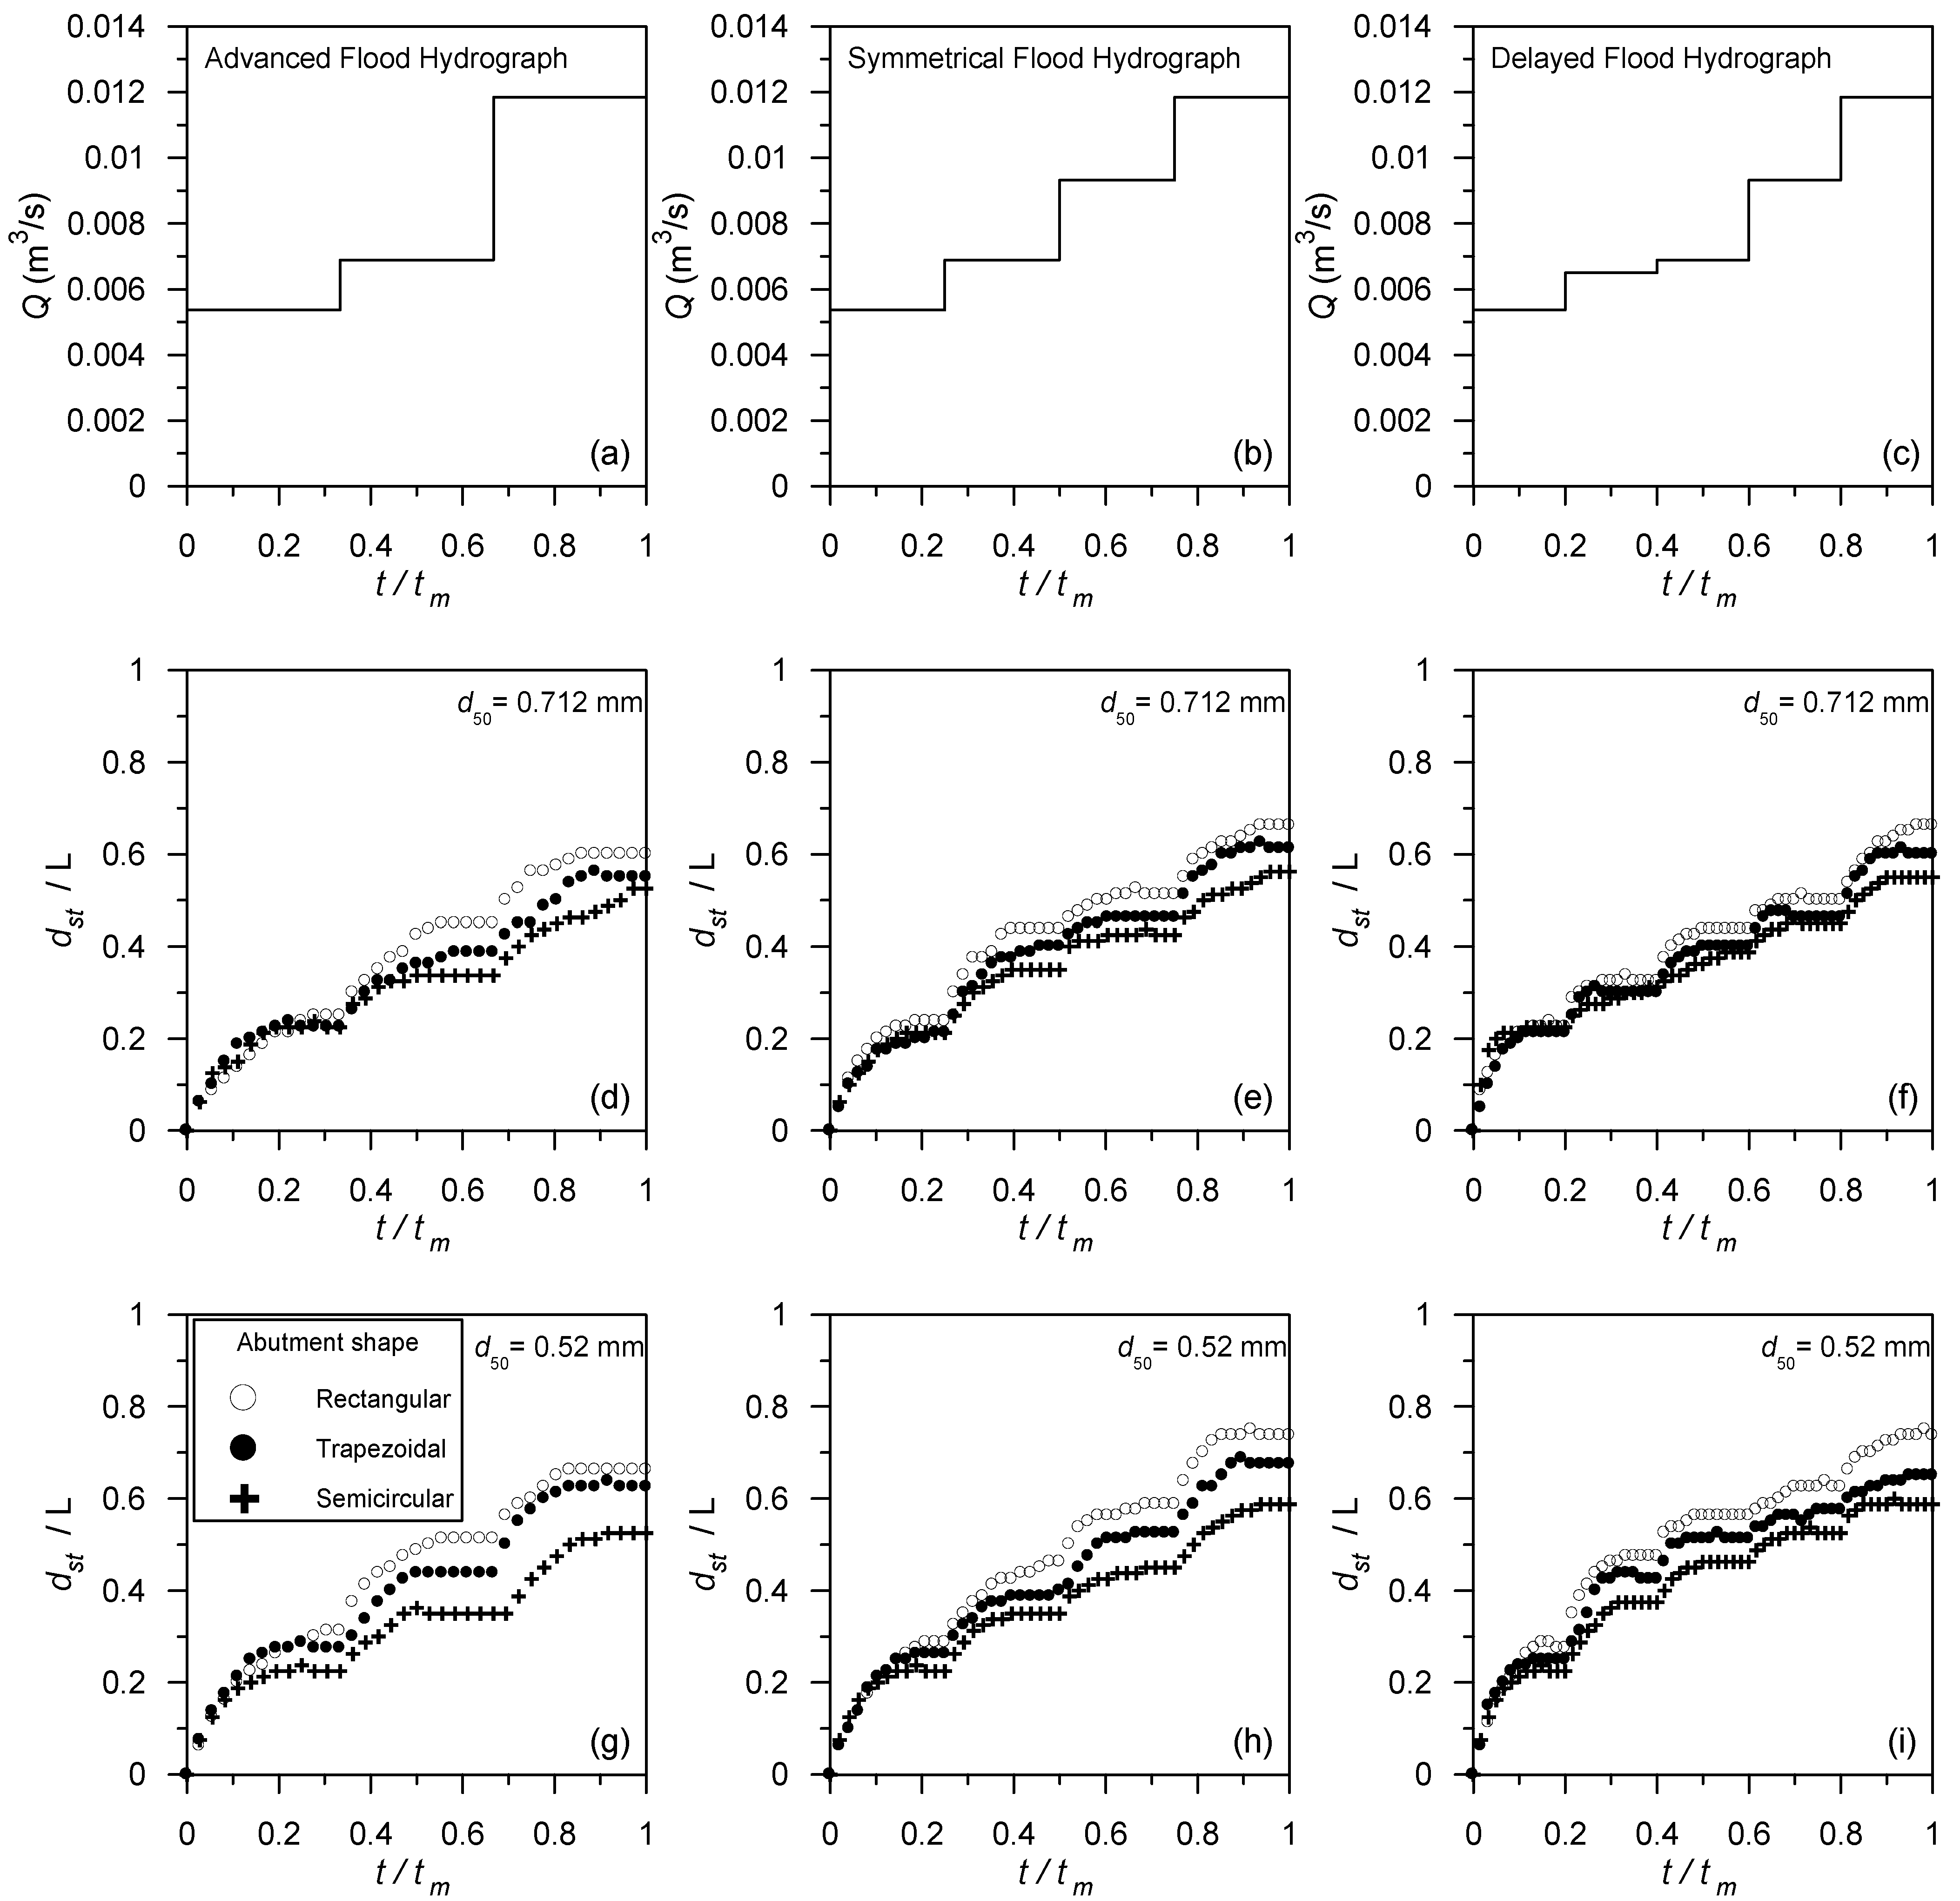
The variations of non-dimensional scour depth dst/L with non-dimensional time t/tm presented in Figure 4d–i are used to study the influence of abutment shape on scour depth. It is observed that the scour depth at rectangular abutments is greater than that at trapezoidal abutments and at semi-circular abutments in both the sediment sizes. This is because at rectangular abutments the flow separation and down flow intensity are much stronger than those at trapezoidal and semi-circular abutments. The shape of an abutment plays an important role on the equilibrium scour depth (Melville and Coleman [11]; Barbhuiya and Dey [13]). The streamline abutments, such as semi-circular and trapezoidal/45° wing-wall abutments, induce weak vortices, whereas blunt bodies, such as rectangular/vertical-wall abutments, generate strong vortices causing deeper scour depth. The three-dimensional vortex structure is stronger at rectangular abutments as compared to trapezoidal and semi-circular abutments causing larger scour depth.
From Figure 4d–f it can be evidenced that non-dimensional scour depth dst/L is larger in the case of the Type III hydrograph (delayed) as compared to Type II (symmetrical) and Type I (advanced) hydrographs. This is because the time to reach peak discharge tp is 5 h in the case of the Type III hydrograph, while it is 4 h for the Type II hydrograph and 3 h for the Type I hydrograph. This indicates that the time to reach peak discharge directly influences scour depth. Further, it is also seen in general that in every step of the flood hydrograph, the Type III hydrograph (delayed) resulted in greater scour depth as compared to Type II (symmetrical) and Type I (advanced). The trend is the same for both sediment sizes of d50 = 0.52 mm (Figure 4d–f) and d50 = 0.712 mm (Figure 4g–i).
4. Computational Model for Evolution of Abutment Scour
The proposed abutment-scour model is similar to that presented for a pier-scour model by Hong et al. [25]. The data of rectangular abutment scour depth under clear water with steady flow conditions collected from the literature are furnished in Table 2. Uniform sediment particles were used in each study, with sediment coarseness (L/d50) ranging from 26 to 844. Flow intensity (V/Vc) ranges from 0.59 to 0.99, while the flow shallowness ranges (y/L) from 0.07 to 4.0, where y = approach flow depth. Based on the parameter analysis, a regression formula is established to compute the abutment scour depth under steady flow conditions:
where Fd = densimetric particle Froude number = V/(g′d50)0.5; g′ = the relative gravitational acceleration = [(ρs − ρ)/ρ]g; ρs = density of sediment particle; ρ = density of fluid; g = gravitational acceleration; TR = t/tR = relative time; t = time; tR = reference time scale = LR/[(g′d50)0.5]; LR = L(2/3)y(1/3) and a0 to a4 = regression constants.
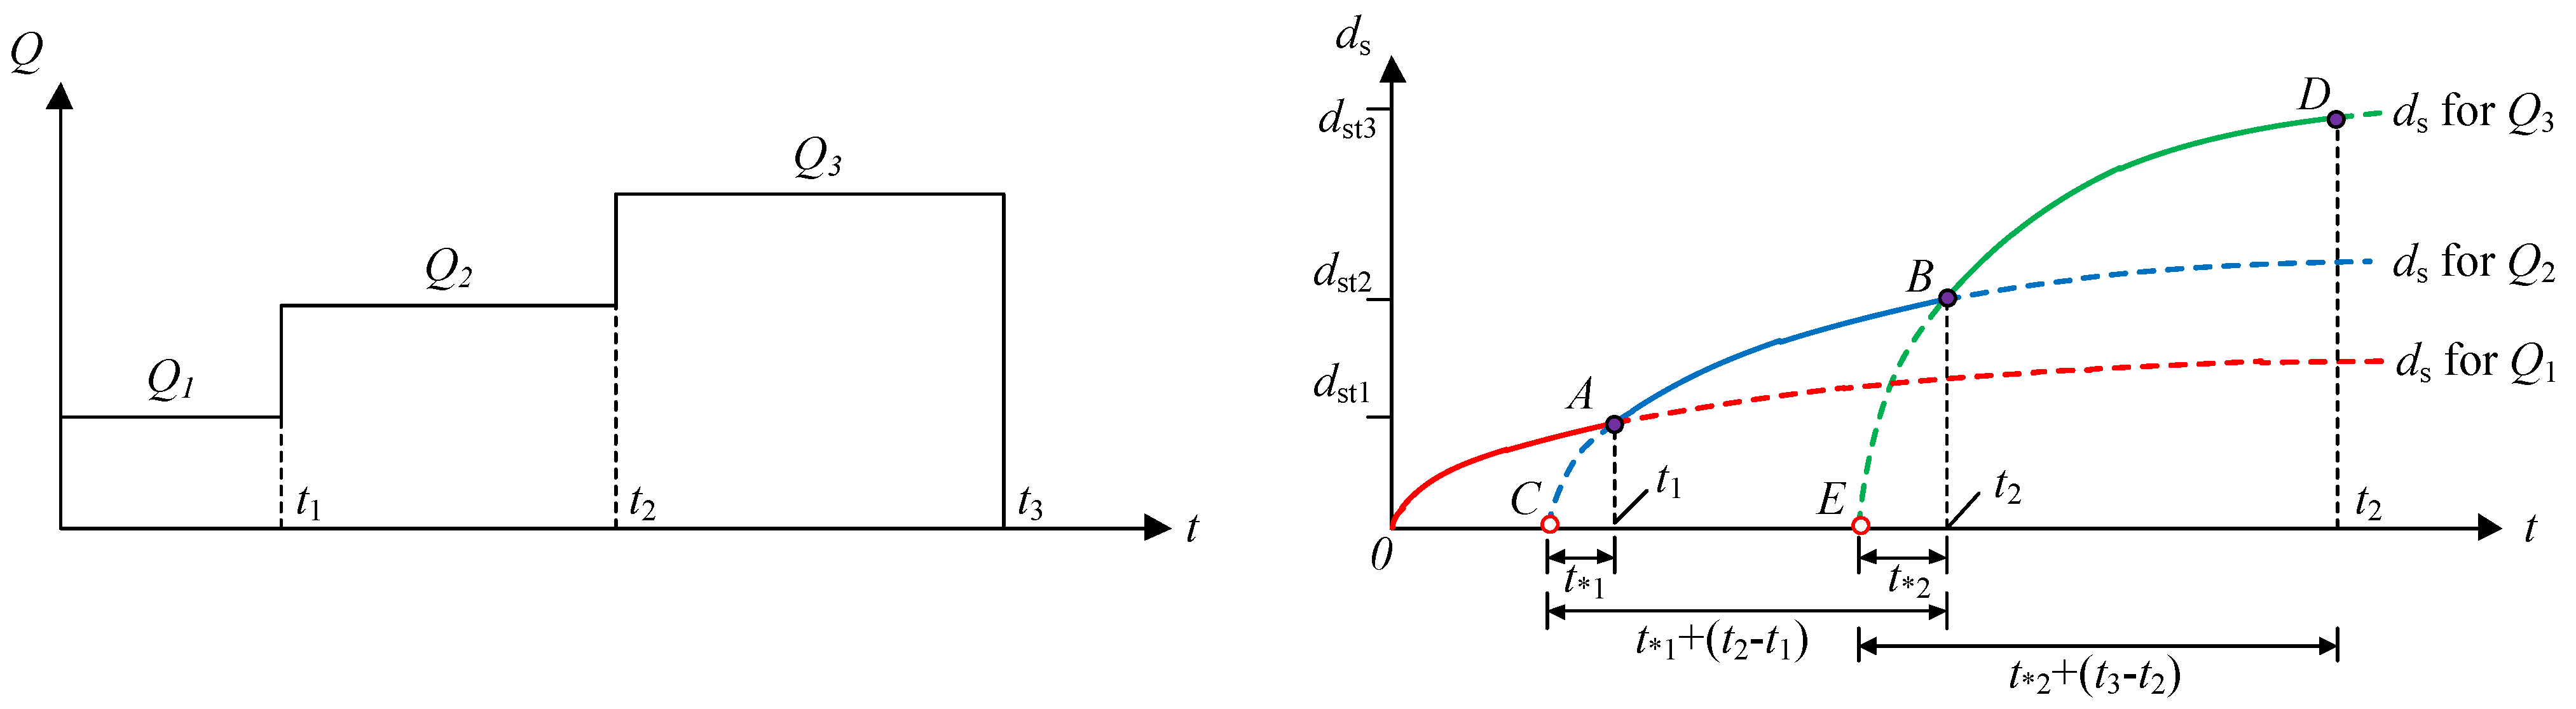
A schematic diagram for scour evolution under an unsteady flow with the method of superposition is shown in Figure 5 and the computational steps are as below:
- (1)
- For the first flow discharge Q1 of duration t1, scour depth evolution follows the red line (OA curve) under the steady flow condition. The final scour depth at t1 is denoted as ds1.
- (2)
- When the flow discharge increases from Q1 to Q2, scour depth evolution changes to follow the blue line (AB curve) under the steady flow condition, and point C is the virtual origin for the scouring process. As the scouring process can memorize the previous scour depth and because Q2 > Q1, the time (t*,1) required for the scour depth to reach ds1 is less than t1. The corresponding scour depth evolution from t1 to t2 is represented by the AB curve. To solve t*,1, one can use the intersection point A of OA curve and CB curve, and if we let , then t*,1 can be obtained as .
- (3)
- Similar to the computing procedure mentioned in step 2, when the flow rate increases from Q2 to Q3 (>Q2), scour depth evolution follows the green line under the steady flow condition, and point E is the virtual origin for the scouring process. As Q3 > Q2, the time (t*,2) required for the scour depth to reach dst2 is less than t*,1 + (t2 − t1). The corresponding scour depth evolution from t2 to t3 is shown by the BD curve. Time t*,2 can be solved by using the same method as mentioned in step 2, .
- (4)
- Repeat the procedure until all of the subdivisions are completed.
- (5)
- Obtain the temporal variation of scour depth under unsteady flow conditions.
- (6)
- Coleman et al. [18] reported that flow shallowness (y/L) has a significant effect on the evolution of abutment scour depth. Hence, for obtaining the best regression result, the data shown in Table 2 were classified into three groups as (1) y/L < 1; (2) 1 ≤ y/L < 2; and (3) 2 ≤ y/L. The coefficients of Equation (1) based on the range of flow shallowness are listed in Table 3. In general, the R2-values for all ranges of flow shallowness are very good.
5. Results of Computational Model
5.1. Comparison Using Steady Flow Data
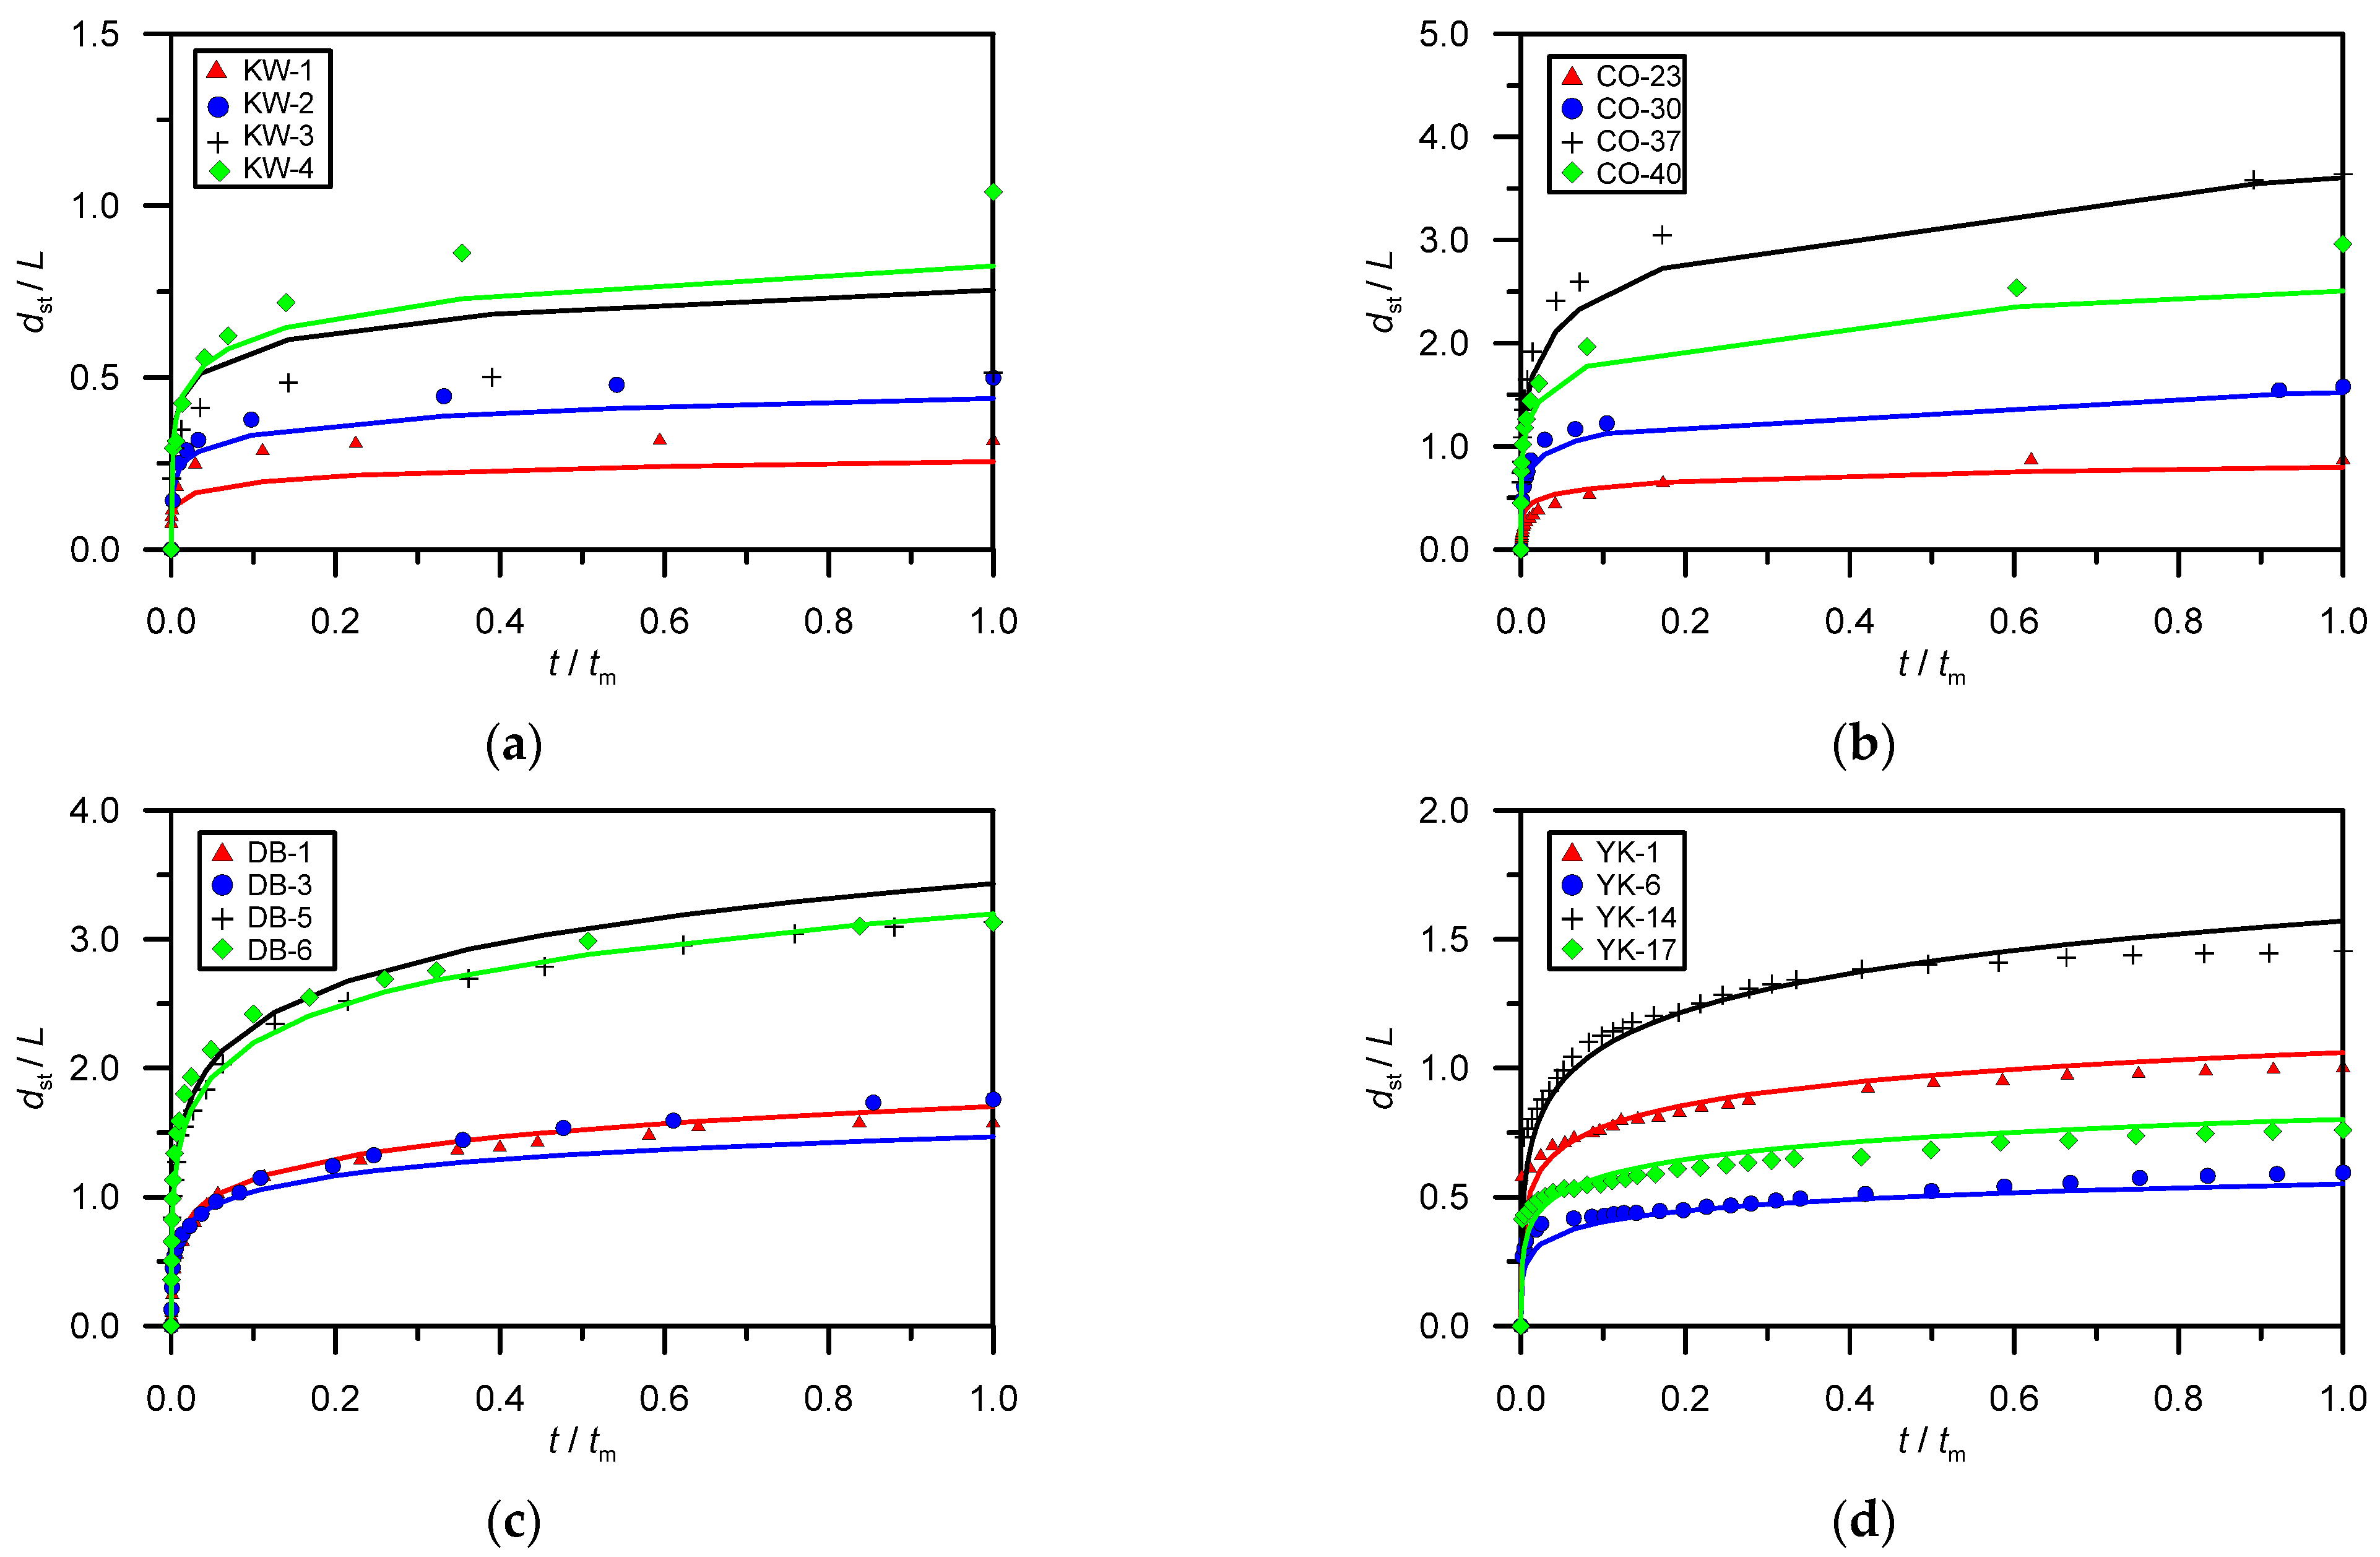
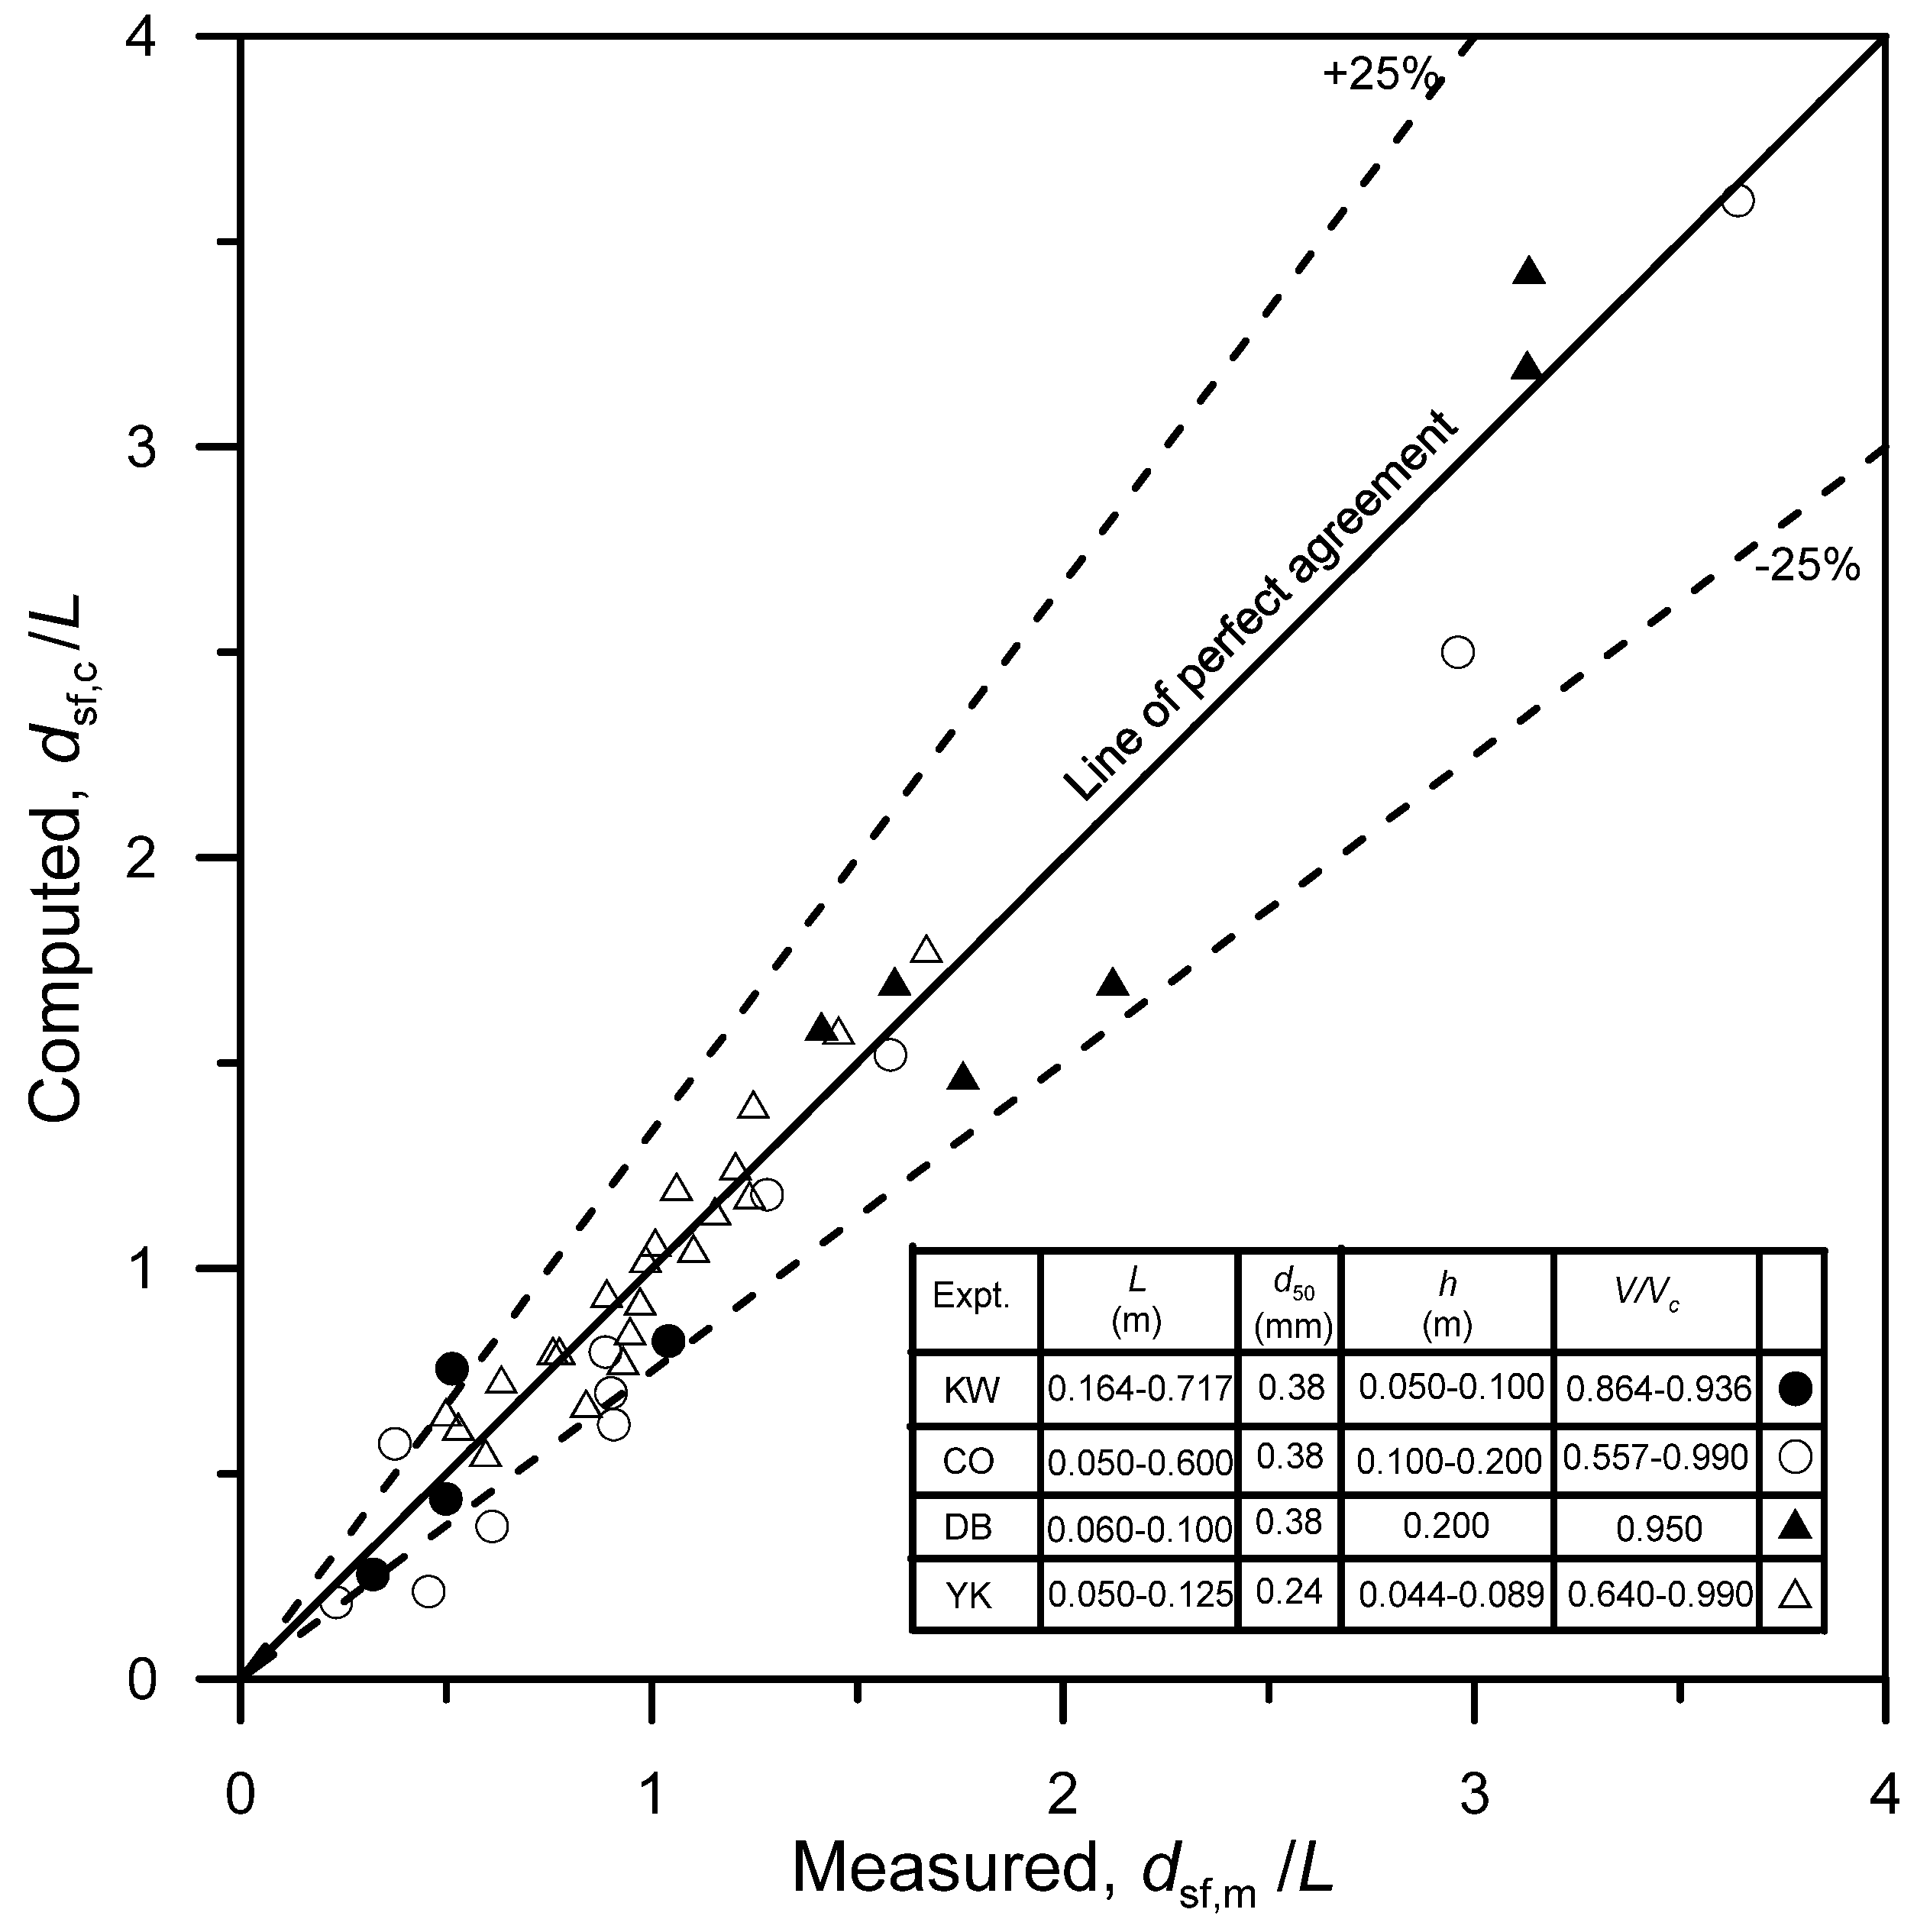
Figure 6a–d presents the comparison of model results to the experimental data of Kwan [26], Coleman et al. [18], Dey and Barbhuiya [19], and Yanmaz and Kose [20], respectively, for only rectangular/vertical-wall abutments. The data were collected to include a wide range of approach flow depths, approach flow intensities, abutment length (only rectangular/vertical-wall abutment), and sediment sizes. The computed temporal variations of non-dimensional abutment scour depths (dst/L) with (t/tm) were plotted along with the corresponding measured non-dimensional abutment scour depths for comparison. In general, the agreement is not so promising for the data of Kwan (1984) as seen in Figure 6a. However, a good agreement was found between the observed and computed abutment scour depths using the proposed model for the data of other investigators (Figure 6b–d). In addition, in the initial period of scouring process (t/tm< 0.05), the proposed model gives very good agreements with the experimental data. This result is very useful for the calculation of scour depth under unsteady flow conditions. In general, for a certain unsteady flow, each flow discharge would not persist for a long period. If one would like to apply the concept of the superposition method (see earlier section), a good prediction for the initial period of scouring process is very important. Figure 7 compares the final abutment scour depth under clear-water with steady flow conditions between the measured data and the computed values using the proposed model. The dotted lines show the ±25% error boundaries, while the solid diagonal line shows the line of perfect agreement. For the data of Coleman et al. [18], the proposed model underestimates the final scour depth (dsf,m/L < 1). However, for the data of Yanmaz and Kose [20], the proposed model gives a comparatively good agreement as compared to the other data. In general, the proposed model fits well to the measured final scour depths. Hence, the accuracy of the calculated result obtained by the proposed model is considered to be reasonably good.
The shape of an abutment plays an important role on equilibrium scour depth (Melville and Coleman [11], Barbhuiya and Dey [13]). The streamline abutments, such as semi-circular and trapezoidal/45° wing-wall abutments, induce weak vortices, while blunt structures like rectangular/vertical-wall abutments generate strong vortices causing deeper scour depth, according to the experimental data of Laursen and Toch [27], Liu et al. [28], Garde et al. [29], and Wong [30]. Melville and Coleman [11] used shape factor to account for the effect of the shape of abutments on equilibrium scour depth. The rectangular/vertical-wall is the simplest shape of an abutment and used as reference (shape factor = 1). Melville and Coleman [11] suggested the shape factors for 45° wing-wall and other types of abutments (shape factors ranges from 0.45–0.75). However, the shape factor for different types of abutments on the temporal variation of scour depth has not been discussed.
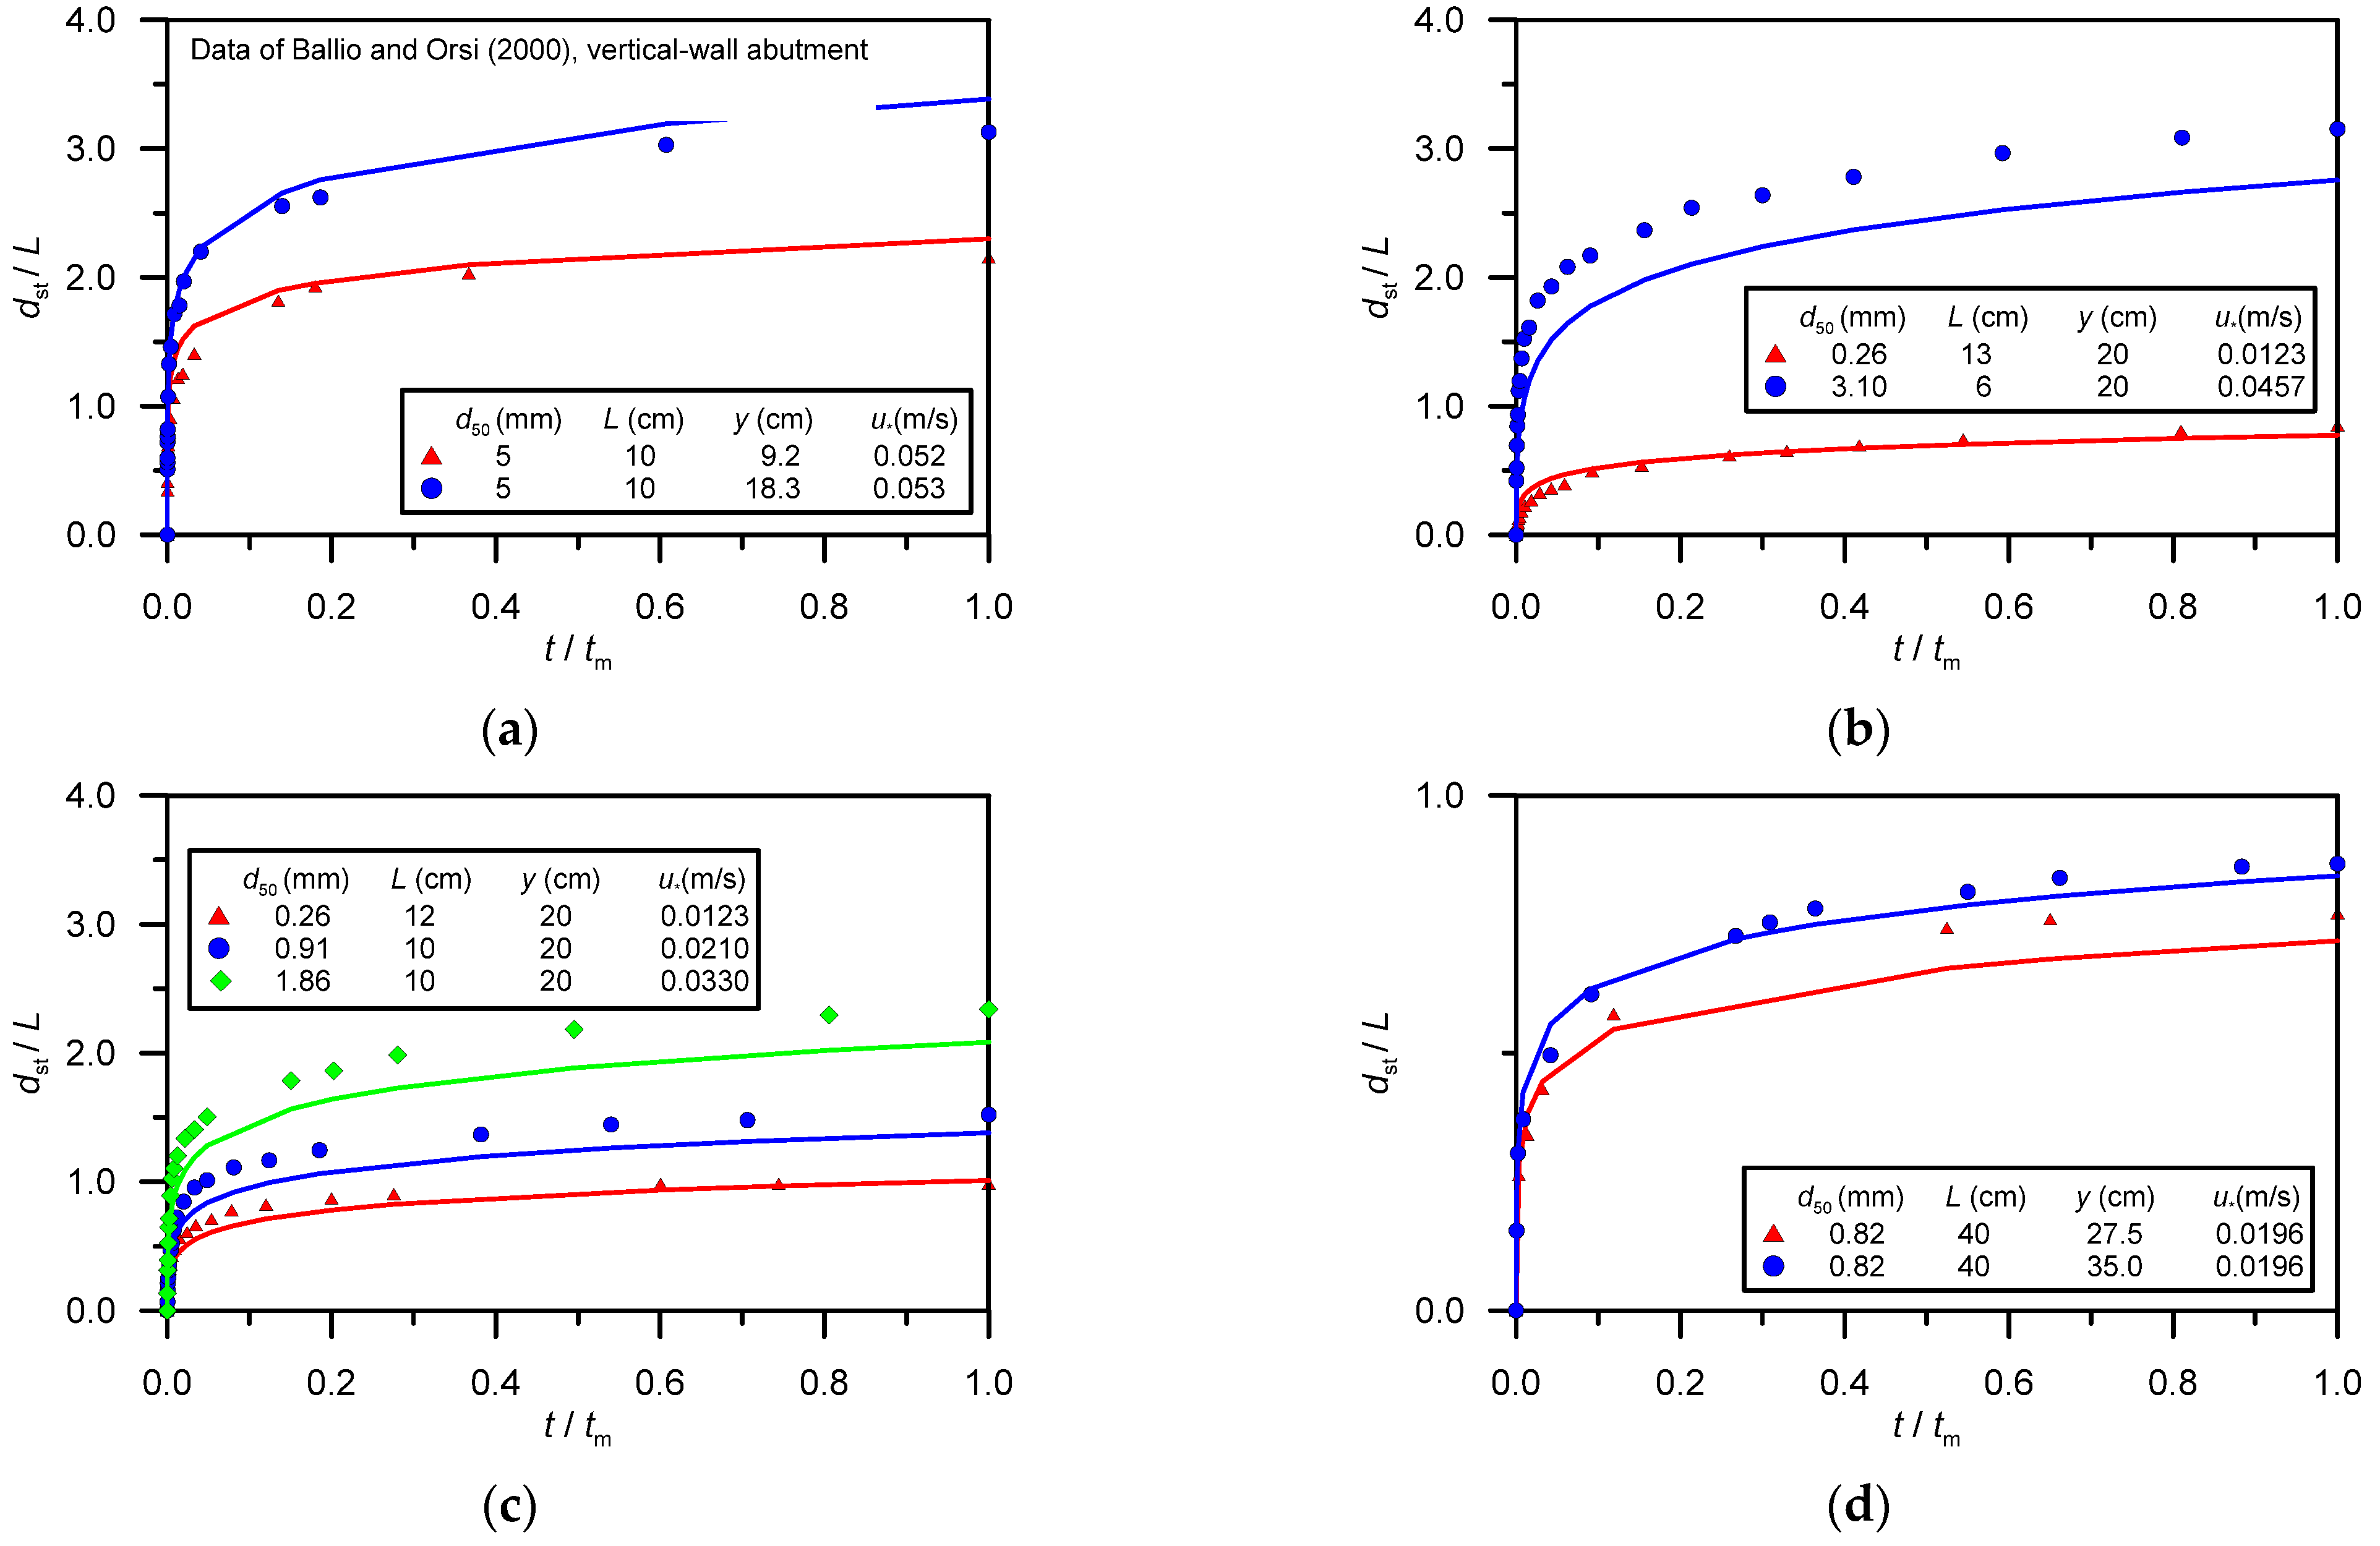
Figure 8a–d illustrate the comparison of the experimental data of Ballio and Oris [16], Dey and Barbhuiya [19], and Tey [14], respectively, with that computed via the present model. The data include the temporal variations of scour depths at vertical-wall (rectangular), semi-circular, and 45° wing-wall abutments. However, these data were not included in the regression analysis as discussed in the previous discussion. The coefficients used in Equation (1) and listed in Table 3 were not changed, except for trapezoidal and semi-circular abutments. For the trapezoidal abutment (45° wing-wall abutment), the coefficient a0,rec (of rectangular abutment) is adjusted as a0,trap = 0.85a0,rec, while for the semi-circular abutment, the coefficient a0,semi is adjusted as a0,semi = 0.75a0,rec. This is similar to the result reported by Melville and Coleman [11] and Dey and Barbhuiya [19]. For the same transverse abutment length (L), approach flow (y, V), and bed sediment (d50) conditions, the abutment scour depth in sequential order is ds,rec > ds,trap > ds,semi. This result is the same as Melville and Coleman [11]. It is because the abutment scour depth mainly depended on the shape of the abutment. As shown in Figure 8a–d, in general, the comparison shows a good agreement between computed and experimental data. The accuracy of the calculated result is reasonably good. The proposed model for the temporal variation of abutment scour depth under clear water with steady flow conditions thus allows a wide range of flow intensity, flow shallowness, sediment coarseness, and abutment dimensions related to the evolution of abutment scour. In the next section, for the comparison of abutment scour depth under unsteady flows, the coefficients were kept the same as previously mentioned and details will also be discussed.
5.2. Comparison Using Unsteady Flow Data
From observation of the unsteady flow experiments, it was found that abutment scour depth increases steadily during the rising limb of the hydrograph, and reaches the maximum at peak flow and then remains unchanged during the recession period. Further, for the same hydraulic and sediment properties, the abutment scour depth varies with the shape of abutment as discussed in an earlier section. The magnitude of the abutment scour depth is in the order of vertical-wall (rectangular) abutment, 45° wing-wall (trapezoidal) abutment, and semi-circular abutment, as shown in Figure 4d–i. The streamline obstruction produces feeble-strength vortices, causing shallow scour depth as compared to the scour depth caused by strong vortices induced by sharp-wall obstacles.
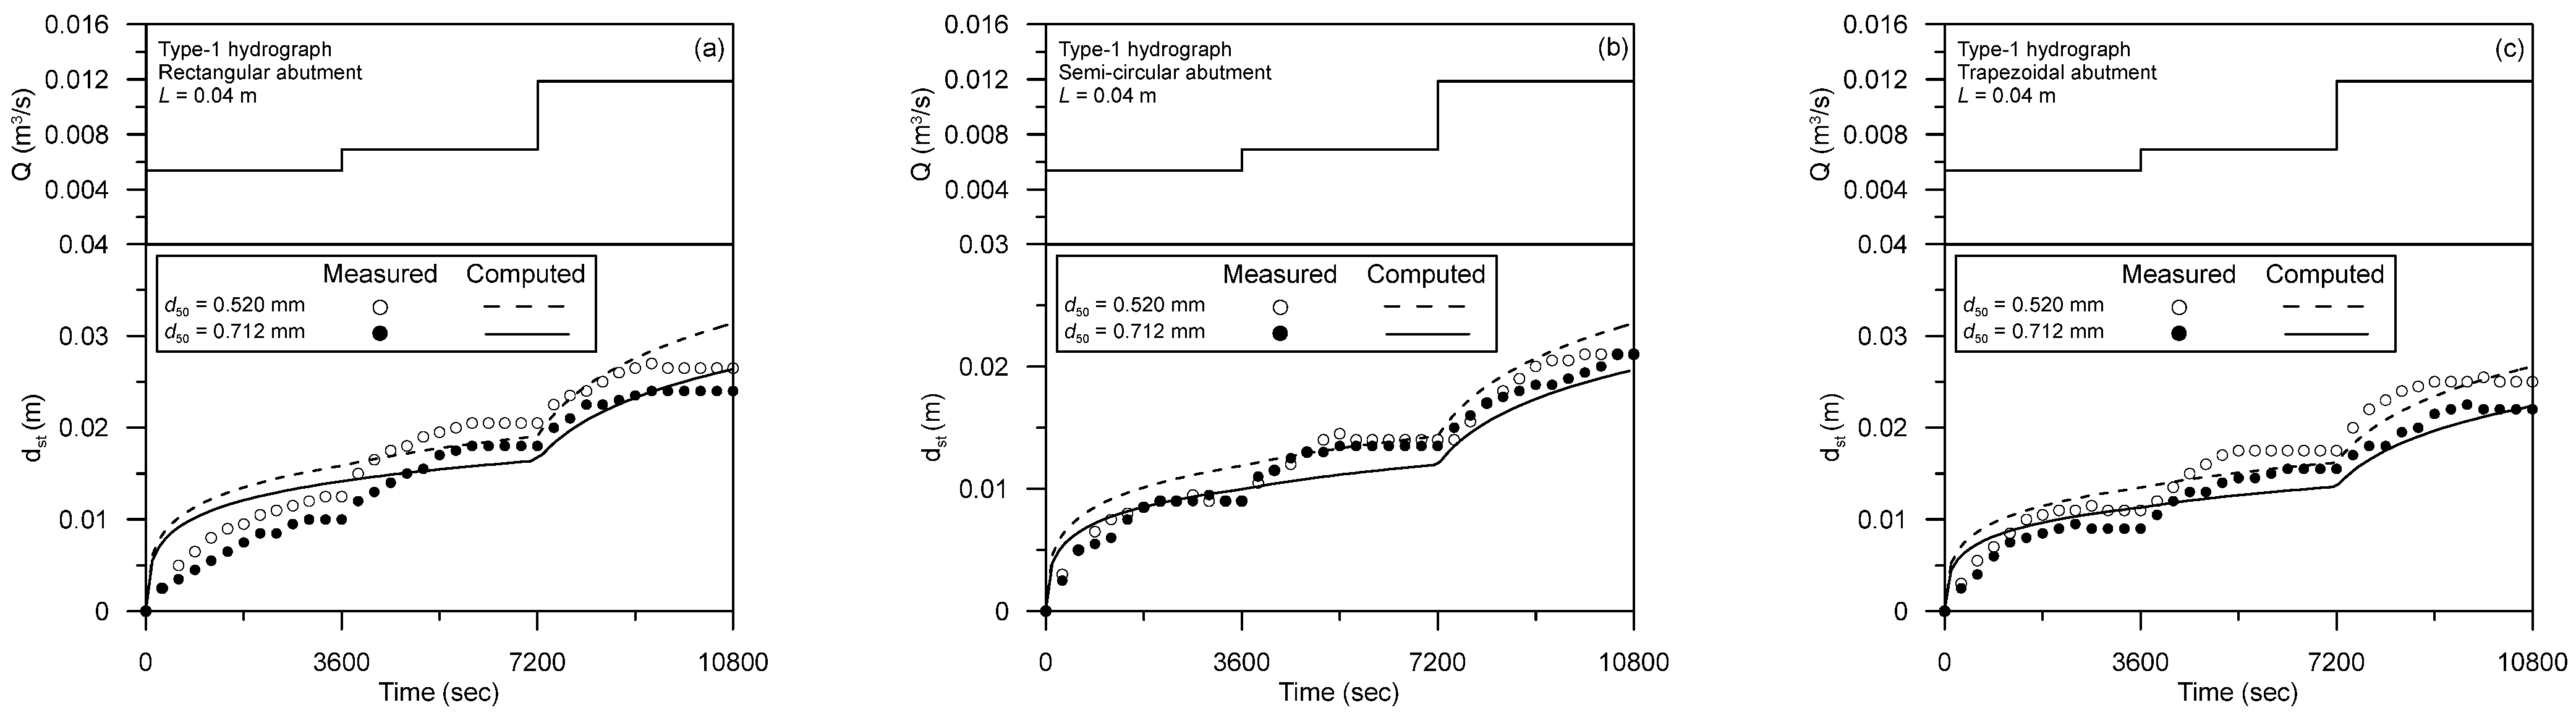
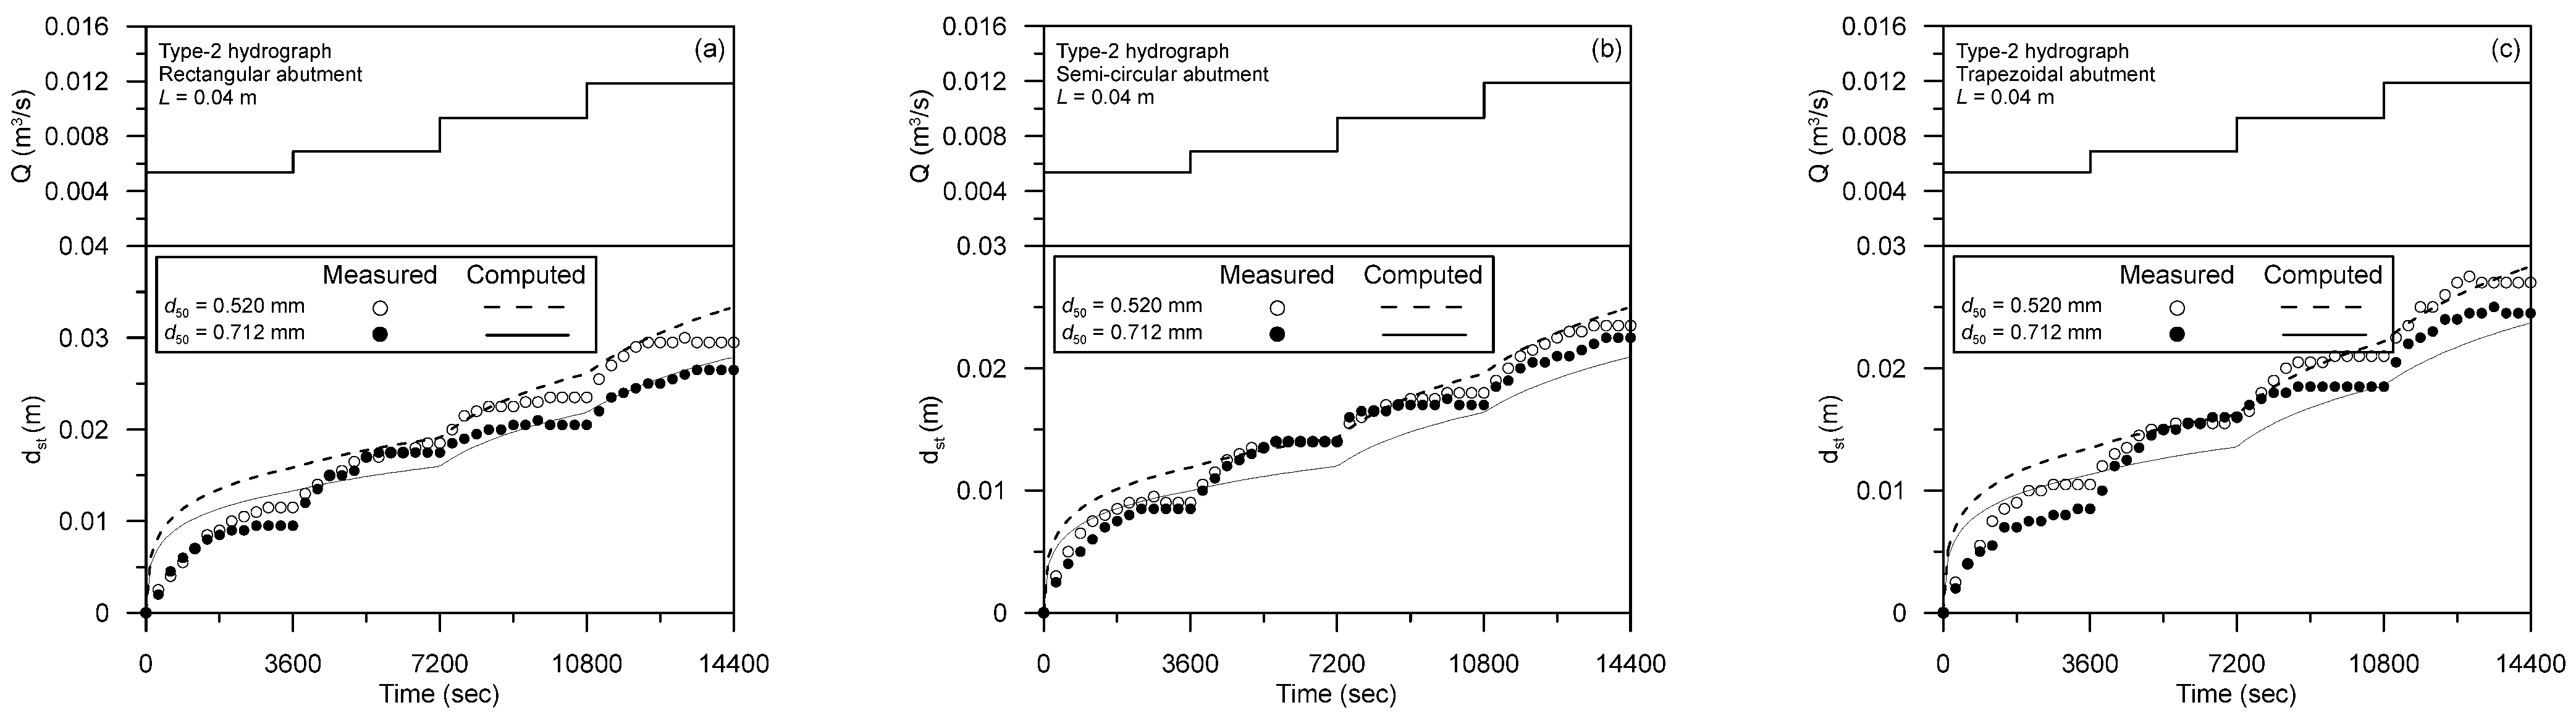
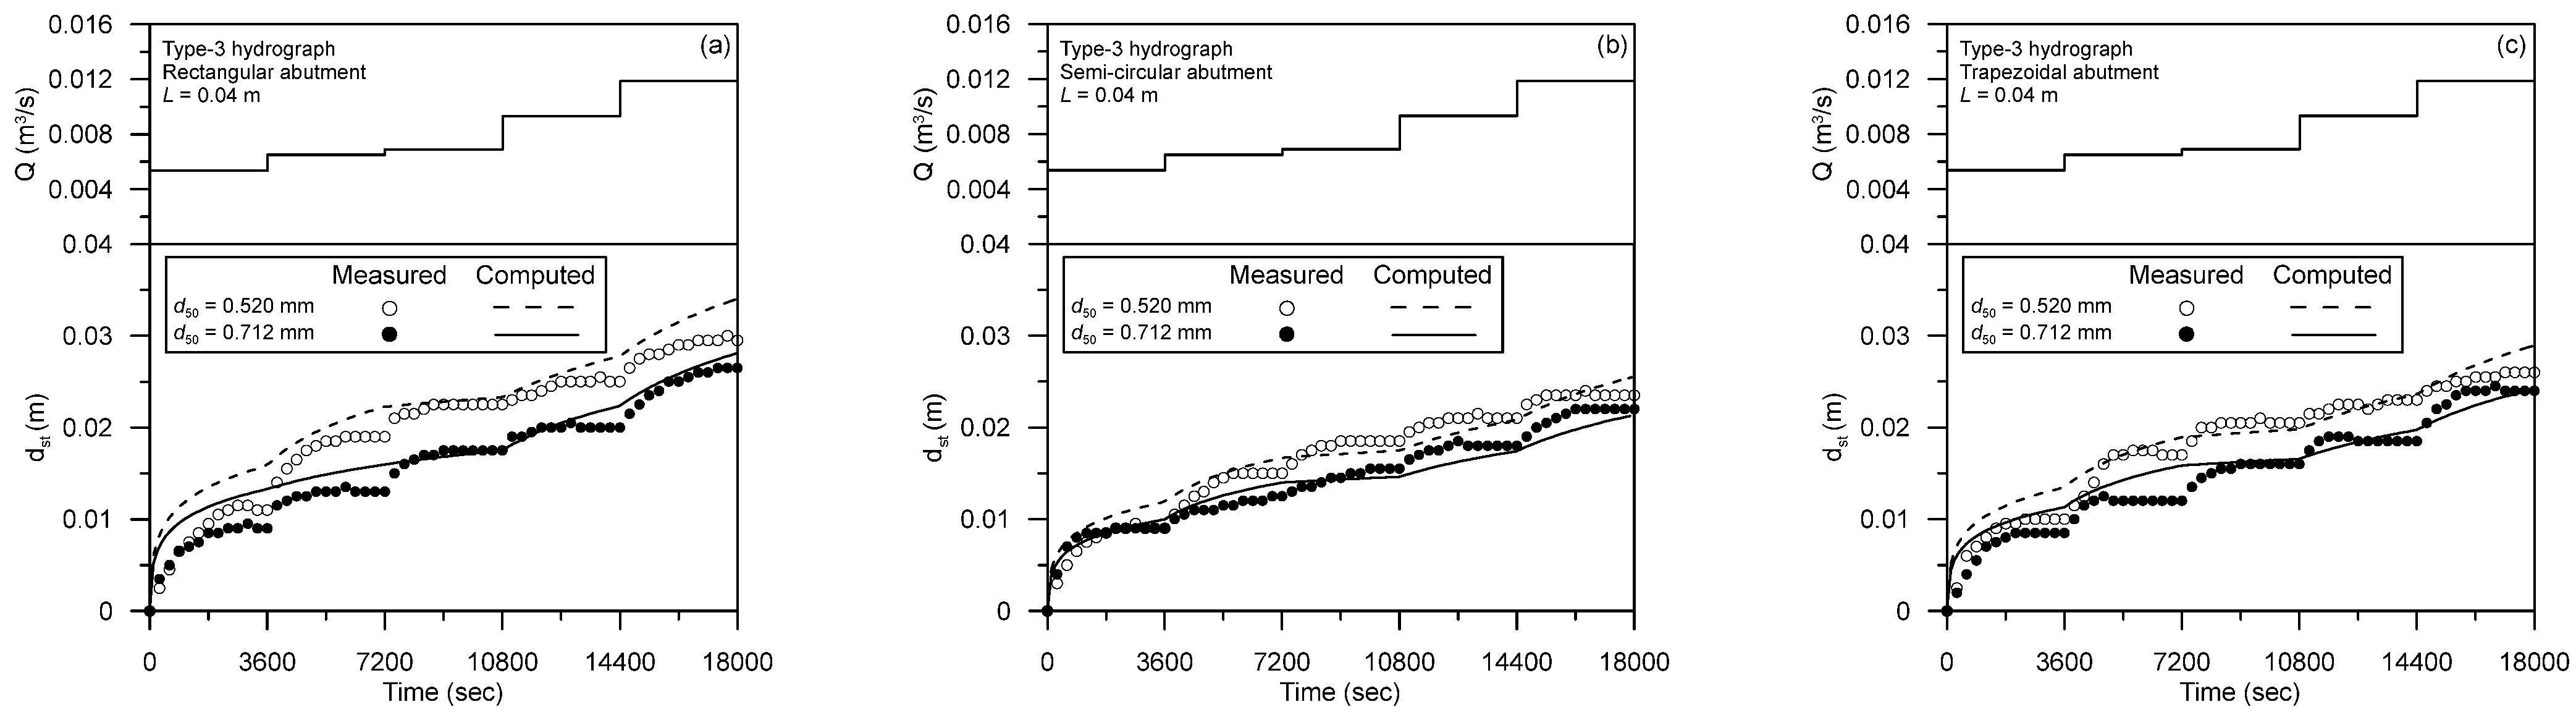
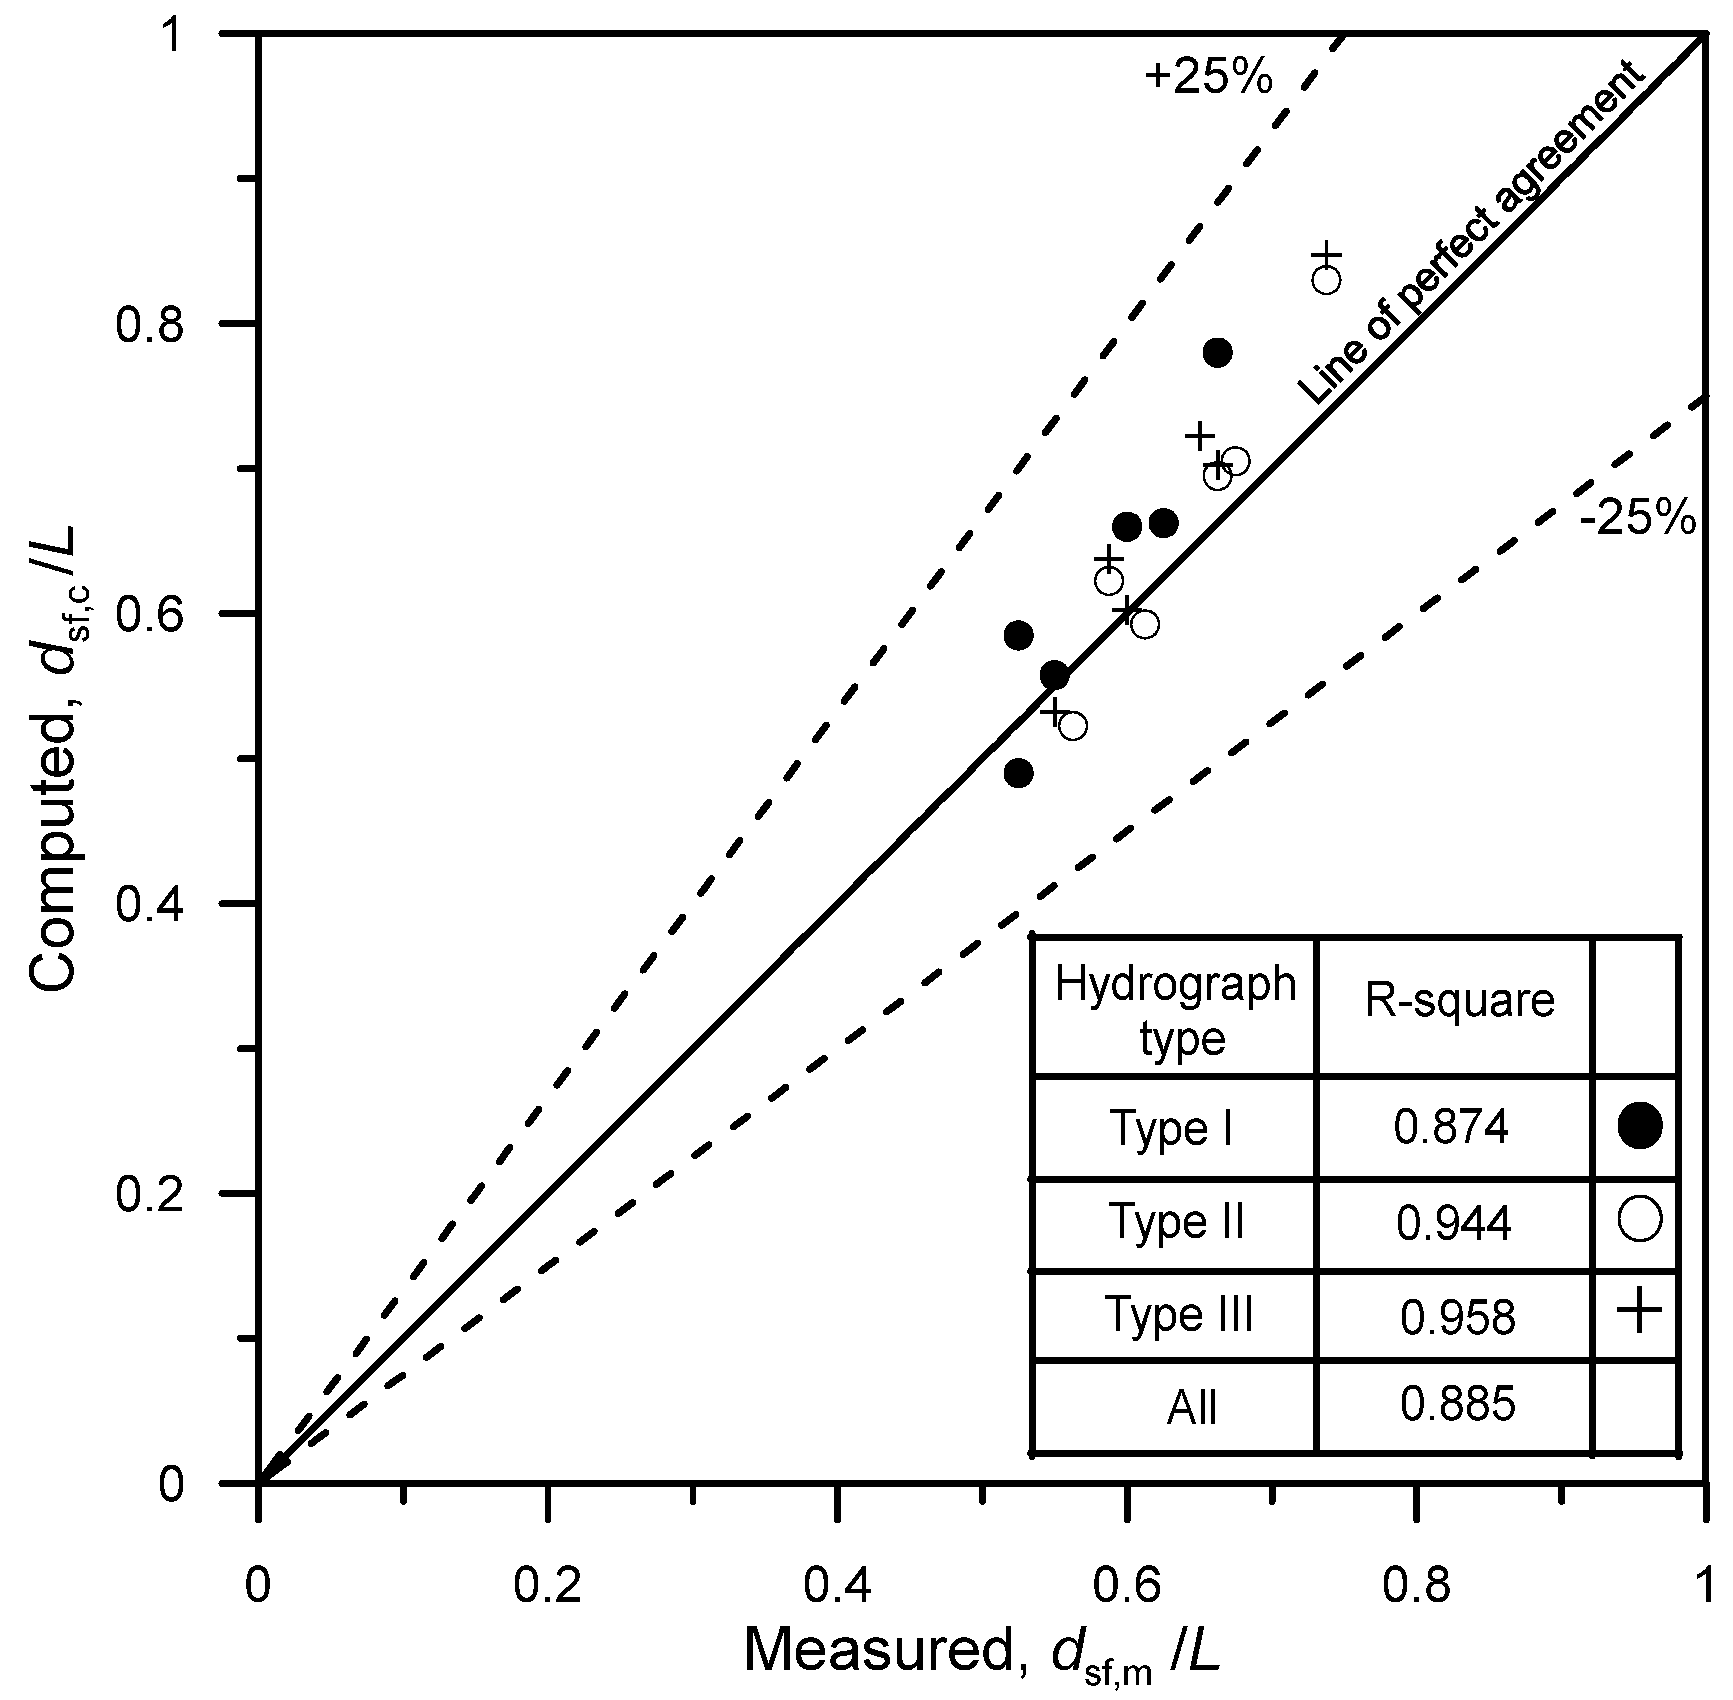
The simulations of abutment scour evolution under stepwise hydrographs were carried out using the computational model described. The computed results are shown in Figure 9, Figure 10 and Figure 11 for Type-I (advanced), Type-II (symmetrical), and Type-III (delayed) flood hydrographs, respectively, together with the experimental data. For each type of hydrograph, three types of abutments, namely rectangular/vertical-wall, semi-circular, and 45° wing-wall (trapezoidal), are used. As seen from Figure 9, Figure 10 and Figure 11, reasonably good agreements between the computed results and the experimental data indicate that the proposed method can be applied to the calculation of abutment scour under unsteady flows. For practical purposes, the final scour depth for a given hydrograph is also important. Table 4 furnishes the comparison between the computed final scour depth using Equation (1) and measured scour depth values, and Figure 12 shows the comparison for different types of hydrographs, indicating acceptable agreement of the proposed model results with the experimental data. All computed final scour depths under unsteady flows fall within ±25% error boundaries. Hence, the proposed model can predict abutment scour depth remarkably well under unsteady clear water flow conditions.
6. Statistical Results
Table 5 lists the statistical results, such as root mean square error (RMSE), mean absolute percentage error (MAPE), and correlation coefficient (R), for the three types of hydrograph when compared to all measured data sets used in this study. The definitions of RMSE, MAPE, and R are as follows:
where mi and pi are the measured and predicted scour depths, respectively; N is the number of data points. In Equation (4), and are the mean values of the measured and predicted scour depths.
From these three indices, it is shown that the proposed model has better performance on the semi-circular and trapezoidal abutments as compared to the rectangular abutment. In general, the proposed model has the best performance of scour depth prediction at semi-circular abutments under all three types of hydrographs.
7. Discussions
In this section, the discussion on the parametric study on scour depth and computational model for scour evolution at bridge abutments under unsteady flow condition is presented. From the laboratory experimental results for all three shapes of the abutments and three types of hydrographs, it is ascertained that the scour depth increases during the rising limb of the hydrograph before reaching the maximum value at the peak discharge and remains constant thereafter. During each step of hydrograph, the scour depth increases sharply and then reaches a steady condition, while in the next step it further increases steeply with increased discharge and becomes steady. This pattern continues until the maximum discharge of the hydrograph is applied. Later the scour depth remains constant during the receding part of the hydrograph.
Further, it is also observed that due to the larger erosive capacity of the vortex system, finer sediments result in larger scour depth than coarser sediment particles. In addition, the scour depth at rectangular abutments is more than that of trapezoidal and semi-circular abutments. This is contributed to strong vortex structures at rectangular abutments as also reported by Melville and Coleman [11] and Barbhuiya and Dey [13]. The type of hydrograph will also influence scour depth. The delayed hydrograph (Type III), having delayed time to peak, enhanced scour depth as compared to the other two types (Type I and Type II).
The computational model proposed based on the method of superposition for the temporal variation of abutment scour depth under clear water with steady flow conditions allows a wide range of flow intensity, flow shallowness, sediment coarseness, and abutment dimensions related to the evolution of abutment scour. The results of the model are satisfactorily comparative to the experimental data. Furthermore, the proposed model was extended to unsteady clear water flow conditions. All computed final scour depths under unsteady flows fall within ±25% error boundaries.
8. Conclusions
The laboratory experimental results on scour at short abutments under unsteady clear water flow condition are used to present the influence of various parameters such as sediment size, abutment shape, and unsteadiness of flow. Three shapes of abutments viz., rectangular, semi-circular, and trapezoidal, which were embedded in two sizes of uniform sand having d50 = 0.52 mm and 0.712 mm were considered in the study. Three types of flood hydrograph were employed to study the unsteadiness of flow: they are advanced (Type I), symmetrical (Type II), and delayed (Type III) flood hydrographs with the clear water flow condition in all cases. The scour depth developed at rectangular abutment was found to be greater than that at trapezoidal and semi-circular abutments. The finer sediment resulted in larger scour depth than the coarser sediment. Further, based on the study of the effect of the three flood hydrographs, it was observed that the delayed flood hydrograph resulted in higher scour depth than the other two hydrographs. Further, a semi-empirical model was proposed for estimating the temporal variation of abutment scour uniform sediments under clear water conditions with steady and unsteady flows. The development of the proposed model uses only the data of rectangular/vertical wall abutment scour under steady flow conditions. After adopting the shape correction factor, the proposed model on time dependent scour depth can be employed to semi-circular and trapezoidal/45° wing-wall abutments. Furthermore, using the concept of superimposition, the proposed model was applied to compute the temporal variation of abutment scour depth at three types of abutments under unsteady flows. The comparisons between the experimental data and the calculated results are reasonably acceptable within ±25% error boundaries. It was demonstrated that the proposed model is accurate, practical, and suitable for computing time dependent scour depth at rectangular/vertical wall abutments and thus may be used in bridge closure for practical purposes. The proposed model does have practical applications in developing warnings at bridge locations. If the flood hydrograph at upstream locations is established from rainfall data, through flood routing the flood hydrograph at bridge sites under consideration can be derived. This will facilitate the prediction of scour depth using the proposed computational model and the design of suitable flood protection systems.
Author Contributions
R.V.R. was responsible for conceptualization of the research, technical supervision and quality control of experimental results. Execution of the tests, data curation was by A.R.D. Mathematical and analysis by J.-H.H. and W.-D.G. The manuscript was written by R.V.R. All the authors contributed to its final version. All authors have read and agreed to the published version of the manuscript.
Funding
This research received no research funding.
Institutional Review Board Statement
Not Applicable.
Informed Consent Statement
Informed consent was obtained from all subjects involved in the study.
Acknowledgments
The financial support from the Ministry of Science and Technology, Taiwan, under Grants MOST 105-2625-M-492-014 and laboratory facilities extended for experimentation from the Management, Rajarshi Shahu College of Engineering, Pune, and Research Center, Department of Civil Engineering, KLE Dr. M.S. Sheshgiri College of Engineering and Technology, Belgaum, India are highly appreciated.
Conflicts of Interest
The authors declare no conflict of interest.
Notations
The follow symbols are used in this paper:
| a0–a4 | regression constants [M0L0T0]; |
| b | longitudinal length of an abutment [M0L1T0]; |
| dsf,c | calculated final scour depth after a hydrograph [M0L1T0]; |
| dsf,m | measured final scour depth after a hydrograph [M0L1T0]; |
| dst | temporal variation of abutment scour depth [M0L1T0]; |
| d50 | median grain size [M0L1T0]; |
| Fd | densimetric particle Froude number, V/(g′d50)0.5 [M0L0T0]; |
| g | gravitational acceleration [M0L1T−2]; |
| g′ | relative gravitational acceleration, [(ρs-ρ)/ρ]g [M0L1T−2]; |
| k1–k2 | constants [M0L0T0]; |
| L | transverse length of an abutment [M0L1T0]; |
| LR | length scale, L(2/3)y(1/3) [M0L1T0]; |
| m | measured quantity (scour depth) |
| mean values of measured quantity (scour depth) | |
| N | number of data points [M0L1T0]; |
| p | predicted quantity (scour depth) |
| mean values of predicted quantity (scour depth) | |
| Q | flow discharge [M0L3T−1]; |
| T | time [M0L0T1]; |
| TR | relative time, t/tR [M0L0T0]; |
| td | base period for hydrograph [M0L0T−1]; |
| tm | final time of scour experiment corresponding to peak discharge [M0L0T1]; |
| tR | reference time scale, LR/[( g′d50)0.5], [M0L0T1]; |
| V | average approach flow velocity [M0L1T−1]; |
| Vc | critical velocity [M0L1T−1]; |
| y | approach flow depth [M0L1T0]; |
| ρ | density of fluid [M1L−3T−1]; and |
| ρs | density of sediment particle [M1L−3T−1]. |
References
- Gill, M.A. Erosion of sand beds around spur dikes. J. Hydraul. Div. ASCE 1972, 98, 1587–1602. [Google Scholar] [CrossRef]
- Laursen, E.M. Analysis of relief bridge scour. J. Hydraul. Div. ASCE 1963, 89, 93–118. [Google Scholar] [CrossRef]
- Melville, B.W. Pier and Abutment scour—An integrated approach. J. Hydraul. Eng. ASCE 1997, 123, 125–136. [Google Scholar] [CrossRef]
- Sturm, T.W.; Janjua, N.S. Bridge abutment scour in a floodplain. In Proceedings of the 1993 National Conference on Hydraulic Engineering ASCE, San Francisco, CA, USA, 25–30 July 1993; pp. 767–772. [Google Scholar]
- Breusers, H.N.C.; Nicollet, G.; Shen, H.W. Local scour around cylindrical piers. J. Hydraul. Res. 1977, 15, 211–252. [Google Scholar] [CrossRef]
- Dargahi, B. Local Scouring around Bridge Piers—A Review of Practice and Theory; Hydraulic Laboratory, Royal Institute of Technology: Stockholm, Sweden, 1982. [Google Scholar]
- Breusers, H.N.C.; Raudkivi, A.J. Scouring. IAHR Hydraulic Design Manual 2; A.A. Balkema: Rotterdam, The Netherlands, 1991. [Google Scholar]
- Dey, S. Local scour at piers, part 1: A review of development of research. Int. J. Sediment Res. 1997, 12, 23–44. [Google Scholar]
- Dey, S. Local scour at piers, part II: Bibliography. Int. J. Sediment Res. 1997, 12, 47–57. [Google Scholar]
- Hoffmans, G.J.C.M.; Verheij, H.C. Scour Manual; A.A. Balkema: Rotterdam, The Netherlands, 1997. [Google Scholar]
- Melville, B.W.; Coleman, S.E. Bridge Scour; Water Resources Publication, LLC.: Highlands Ranch, CO, USA, 2000; p. 550. [Google Scholar]
- Richardson, E.V.; Davis, S.R. Evaluating Scour at Bridges, 4th ed.; Hydraulic Engineering Circular (HEC) 18, Report FHWA NHI 01-001; US Department of Transportation, Federal Highway Administration: Washington, DC, USA, 2001. [Google Scholar]
- Barbhuiya, A.K.; Dey, S. Local scour at abutments: A review. Sadhana 2004, 29, 449–476. [Google Scholar] [CrossRef]
- Tey, C.B. Local Scour at Bridge Abutments; School of Engineering, The University of Auckland: Auckland, New Zealand, 1984. [Google Scholar]
- Cardoso, A.H.; Bettess, R. Effects of time and channel geometry on scour at bridge abutments. J. Hydraul. Eng. ASCE 1999, 125, 388–399. [Google Scholar] [CrossRef]
- Ballio, F.; Oris, E. Time evolution of scour around bridge abutments. Water Eng. Res. 2000, 2, 243–259. [Google Scholar]
- Oliveto, G.; Hager, W.H. Temporal evolution of clear water pier and abutment scour. J. Hydraul. Eng. ASCE 2002, 128, 811–820. [Google Scholar] [CrossRef]
- Coleman, S.E.; Lauchlan, C.S.; Melville, B.W. Clear-water scour development at bridge abutments. J. Hydraul. Res. 2003, 41, 521–531. [Google Scholar] [CrossRef]
- Dey, S.; Barbhuiya, A.K. Time variation of scour at abutments. J. Hydraul. Eng. ASCE 2005, 131, 11–23. [Google Scholar] [CrossRef]
- Yanmaz, A.M.; Kose, O. A semi-empirical model for clear-water scour evolution at bridge abutments. J. Hydraul. Res. 2009, 47, 110–118. [Google Scholar]
- Kothyari, U.C.; Garde, R.J.; Ranga Raju, K.G. Temporal variation of scour around circular bridge piers. J. Hydraul. Eng. 1992, 118, 1091–1106. [Google Scholar] [CrossRef]
- Briaud, J.L.; Chen, H.C.; Kwak, K.W.; Han, S.W.; Ting, F.C.K. Multiflood and multilayer method for scour rate prediction at bridge piers. J. Geotech. Geoenviron. Eng. 2001, 127, 114–125. [Google Scholar] [CrossRef]
- Chang, W.Y.; Lai, J.S.; Yen, C.L. Evolution of scour depth at circular bridge piers. J. Hydraul. Eng. ASCE 2004, 130, 905–913. [Google Scholar] [CrossRef]
- Oliveto, G.; Hager, W.H. Further results to time-dependent local scour at bridge elements. J. Hydraul. Eng. ASCE 2005, 131, 97–105. [Google Scholar] [CrossRef]
- Hong, J.H.; Chiew, Y.M.; Yeh, P.H. Comparisons of time-dependent pier-scour models under unsteady flow conditions. In Proceedings of the 7th International Conference on Scour and Erosion, Perth, Australia, 2–4 December 2014; pp. 473–481. [Google Scholar]
- Kwan, T.F. Study of Abutment Scour; School of Engineering, The University of Auckland: Auckland, New Zealand, 1984. [Google Scholar]
- Laursen, E.M.; Toch, A. Scour around Bridge Piers and Abutments; Iowa Highways Research Board: Ames, Iowa, 1956. [Google Scholar]
- Liu, S.Y.; Chang, F.M.; Skinner, M.M. Effect of Bridge Construction on Scour and Backwater; CER 60 HKL 22; Civil Engineering Section, Colorado State University: Fort Collins, CO, USA, 1961. [Google Scholar]
- Garde, R.J.; Subramanya, K.; Nambudripad, K.D. Closure of Study of scour around spur-dikes. J. Hydraul. Div. ASCE 1963, 89, 167–175. [Google Scholar] [CrossRef]
- Wong, W.H. Scour at Bridge Abutments; School of Engineering, University of Auckland: Auckland, New Zealand, 1982. [Google Scholar]
Figure 1.
Top view of abutment models.

Figure 2.
Three types of hydrographs used in this study.

Figure 3.
Comparison of temporal variation of non-dimensional scour depth dst/L for different sediment sizes and hydrographs.
Figure 3.
Comparison of temporal variation of non-dimensional scour depth dst/L for different sediment sizes and hydrographs.

Figure 4.
Comparison of temporal variation of non-dimensional scour depth dst/L for different abutment shapes and hydrographs.
Figure 4.
Comparison of temporal variation of non-dimensional scour depth dst/L for different abutment shapes and hydrographs.

Figure 5.
Method of superposition for computing the abutment scour evolution under a stepwise hydrograph.
Figure 5.
Method of superposition for computing the abutment scour evolution under a stepwise hydrograph.

Figure 6.
Comparison of temporal variation of scour depth between the proposed model and the experimental data of (a) Kwan [26], (b) Coleman et al. [18], (c) Dey and Barbhuiya [19], and (d) Yanmaz and Kose [20].

Figure 7.
Comparison of final scour depth between the proposed model and the experimental data of KW (Kwan [26]), CO (Coleman et al. [18]), DB (Dey and Barbhuiya [19]), and YK (Yanmaz and Kose [20]).

Figure 8.
Comparison of scour evolution between the proposed model and the experimental data of: (a) Ballio and Oris [16] at a vertical wall abutment, (b) Dey and Barbhuiya [19] at a semi-circular abutment, (c) Dey and Barbhuiya [19] at a 45° wing-wall abutment, (d) Tey [14] at a 45° wing-wall abutment.

Figure 9.
Comparison of computed and measured abutment-scour evolution under Type-I stepwise (advanced) hydrograph. (a) Rectangular abutment (b) Semicircular abutment (c) Trapezoidal abutment.
Figure 9.
Comparison of computed and measured abutment-scour evolution under Type-I stepwise (advanced) hydrograph. (a) Rectangular abutment (b) Semicircular abutment (c) Trapezoidal abutment.

Figure 10.
Comparison of computed and measured abutment-scour evolution under Type-II stepwise (symmetrical) hydrograph. (a) Rectangular abutment (b) Semicircular abutment (c) Trapezoidal abutment.
Figure 10.
Comparison of computed and measured abutment-scour evolution under Type-II stepwise (symmetrical) hydrograph. (a) Rectangular abutment (b) Semicircular abutment (c) Trapezoidal abutment.

Figure 11.
Comparison of computed and measured abutment-scour evolution under Type-III stepwise (delayed) hydrograph. (a) Rectangular abutment (b) Semicircular abutment (c) Trapezoidal abutment.
Figure 11.
Comparison of computed and measured abutment-scour evolution under Type-III stepwise (delayed) hydrograph. (a) Rectangular abutment (b) Semicircular abutment (c) Trapezoidal abutment.

Figure 12.
Comparison of final scour depth under unsteady flow conditions between the proposed model and the present experimental data.
Figure 12.
Comparison of final scour depth under unsteady flow conditions between the proposed model and the present experimental data.


Table 1.
Summary of experimental conditions under clear water with unsteady flow.
| Hydrograph Type | Abutment Type | d50 (mm) | V (m/s) | y (m) | Observed dsf,m (m) |
|---|---|---|---|---|---|
| Type I | Rectangular | 0.520 | 0.20, 0.19, 0.22 | 0.09, 0.12, 0.18 | 0.0265 |
| 0.712 | 0.0240 | ||||
| Semi-circular | 0.520 | 0.0210 | |||
| 0.712 | 0.0210 | ||||
| Trapezoidal | 0.520 | 0.0250 | |||
| 0.712 | 0.0220 | ||||
| Type II | Rectangular | 0.520 | 0.20, 0.19, 0.21, 0.22 | 0.09, 0.12, 0.15, 0.18 | 0.0295 |
| 0.712 | 0.0265 | ||||
| Semi-circular | 0.520 | 0.0235 | |||
| 0.712 | 0.0225 | ||||
| Trapezoidal | 0.520 | 0.0270 | |||
| 0.712 | 0.0245 | ||||
| Type III | Rectangular | 0.520 | 0.20, 0.22, 0.19, 0.21, 0.22 | 0.09, 0.10, 0.12, 0.15, 0.18 | 0.0295 |
| 0.712 | 0.0265 | ||||
| Semi-circular | 0.520 | 0.0235 | |||
| 0.712 | 0.0220 | ||||
| Trapezoidal | 0.520 | 0.0260 | |||
| 0.712 | 0.0240 |
Table 2.
Summary of rectangular/vertical-wall abutment scour under clear water steady flow conditions.
Table 2.
Summary of rectangular/vertical-wall abutment scour under clear water steady flow conditions.
| Expt. Number | L (cm) | d50 (mm) | V/Vc | y (cm) | dsf,m (m) | dsf,c (m) | tm (min) |
|---|---|---|---|---|---|---|---|
| KW-1 | 71.7 | 0.85 | 0.936 | 5 | 0.231 | 0.183 | 6944 |
| KW-2 | 31.4 | 0.85 | 0.936 | 5 | 0.157 | 0.138 | 3095 |
| KW-3 | 16.4 | 0.85 | 0.936 | 5 | 0.084 | 0.124 | 4904 |
| KW-4 | 16.4 | 0.85 | 0.864 | 10 | 0.171 | 0.135 | 1430 |
| CO-1 | 30 | 0.82 | 0.742 | 20 | 0.272 | 0.186 | 4740 |
| CO-3 | 30 | 0.82 | 0.742 | 20 | 0.112 | 0.172 | 2277 |
| CO-8 | 60 | 0.82 | 0.599 | 12 | 0.140 | 0.112 | 3711 |
| CO-14 | 60 | 0.82 | 0.557 | 20 | 0.274 | 0.128 | 4760 |
| CO-17 | 60 | 0.82 | 0.742 | 20 | 0.367 | 0.223 | 5571 |
| CO-23 | 30 | 0.82 | 0.848 | 20 | 0.266 | 0.239 | 4868 |
| CO-25 | 5 | 1.02 | 0.588 | 20 | 0.064 | 0.059 | 3698 |
| CO-30 | 5 | 1.02 | 0.731 | 10 | 0.079 | 0.076 | 4096 |
| CO-34 | 30 | 0.8 | 0.949 | 10 | 0.270 | 0.209 | 5285 |
| CO-37 | 5 | 0.85 | 0.989 | 20 | 0.182 | 0.180 | 5429 |
| CO-40 | 5 | 0.85 | 0.980 | 10 | 0.148 | 0.125 | 3713 |
| DB-1 | 8 | 0.26 | 0.950 | 20 | 0.127 | 0.136 | 6795 |
| DB-2 | 10 | 0.26 | 0.950 | 20 | 0.141 | 0.159 | 4164 |
| DB-3 | 10 | 0.52 | 0.950 | 20 | 0.176 | 0.147 | 3542 |
| DB-4 | 8 | 0.91 | 0.950 | 20 | 0.170 | 0.136 | 4205 |
| DB-5 | 6 | 1.86 | 0.950 | 20 | 0.188 | 0.206 | 3083 |
| DB-6 | 8 | 3.1 | 0.950 | 20 | 0.250 | 0.256 | 3976 |
| YK-1 | 12.5 | 1.8 | 0.777 | 8.9 | 0.126 | 0.133 | 360 |
| YK-2 | 12.5 | 1.8 | 0.777 | 8.3 | 0.123 | 0.128 | 360 |
| YK-3 | 12.5 | 1.8 | 0.741 | 7.5 | 0.118 | 0.106 | 360 |
| YK-4 | 12.5 | 1.8 | 0.713 | 6.8 | 0.116 | 0.097 | 360 |
| YK-5 | 12.5 | 1.8 | 0.682 | 6.1 | 0.105 | 0.084 | 360 |
| YK-6 | 12.5 | 1.8 | 0.640 | 5.3 | 0.074 | 0.069 | 360 |
| YK-7 | 10 | 1.8 | 0.777 | 8.9 | 0.120 | 0.125 | 360 |
| YK-8 | 10 | 1.8 | 0.751 | 8.3 | 0.115 | 0.114 | 360 |
| YK-9 | 10 | 1.8 | 0.741 | 7.5 | 0.110 | 0.105 | 360 |
| YK-10 | 10 | 1.8 | 0.713 | 6.8 | 0.097 | 0.092 | 360 |
| YK-11 | 10 | 1.8 | 0.682 | 6.1 | 0.078 | 0.080 | 360 |
| YK-12 | 10 | 1.8 | 0.640 | 5.3 | 0.050 | 0.065 | 360 |
| YK-13 | 5 | 1.8 | 0.777 | 8.9 | 0.083 | 0.089 | 360 |
| YK-14 | 5 | 1.8 | 0.751 | 8.3 | 0.073 | 0.079 | 360 |
| YK-15 | 5 | 1.8 | 0.741 | 7.5 | 0.062 | 0.070 | 360 |
| YK-16 | 5 | 1.8 | 0.713 | 6.8 | 0.053 | 0.060 | 360 |
| YK-17 | 12.5 | 0.9 | 0.985 | 5.2 | 0.095 | 0.100 | 360 |
| YK-18 | 12.5 | 0.9 | 0.899 | 4.4 | 0.066 | 0.077 | 360 |
| YK-19 | 10 | 0.9 | 0.985 | 5.2 | 0.089 | 0.094 | 360 |
| YK-20 | 10 | 0.9 | 0.899 | 4.4 | 0.063 | 0.073 | 360 |
| YK-21 | 5 | 0.9 | 0.985 | 5.2 | 0.062 | 0.059 | 360 |
Table 3.
Summary of coefficients used in Equation (1).
| Coefficients | |||
|---|---|---|---|
| 0.209 | 0.100 | 0.022 | |
| 0.263 | 0.424 | 0.700 | |
| −0.427 | −0.523 | −0.469 | |
| 1.857 | 2.168 | 2.274 | |
| 1.269 | 1.594 | 1.938 | |
| R2-value | 0.892 | 0.916 | 0.935 |
Table 4.
Comparison of observed and computed (Equation (1)) scour depth at abutment under unsteady flow.
Table 4.
Comparison of observed and computed (Equation (1)) scour depth at abutment under unsteady flow.
| Hydrograph Type | Abutment Type | d50 (mm) | Observed dsf,m (m) | Computed dsf,c (m) |
|---|---|---|---|---|
| Type I | Rectangular | 0.520 | 0.0265 | 0.0312 |
| 0.712 | 0.0240 | 0.0264 | ||
| Semi-circular | 0.520 | 0.0210 | 0.0234 | |
| 0.712 | 0.0210 | 0.0196 | ||
| Trapezoidal | 0.520 | 0.0250 | 0.0265 | |
| 0.712 | 0.0220 | 0.0223 | ||
| Type II | Rectangular | 0.520 | 0.0295 | 0.0332 |
| 0.712 | 0.0265 | 0.0278 | ||
| Semi-circular | 0.520 | 0.0235 | 0.0249 | |
| 0.712 | 0.0225 | 0.0209 | ||
| Trapezoidal | 0.520 | 0.0270 | 0.0282 | |
| 0.712 | 0.0245 | 0.0237 | ||
| Type III | Rectangular | 0.520 | 0.0295 | 0.0339 |
| 0.712 | 0.0265 | 0.0281 | ||
| Semi-circular | 0.520 | 0.0235 | 0.0255 | |
| 0.712 | 0.0220 | 0.0213 | ||
| Trapezoidal | 0.520 | 0.0260 | 0.0289 | |
| 0.712 | 0.0240 | 0.0241 |
Table 5.
Statistical results for the scour-depth performance of the proposed model.
| Hydrograph Type | Abutment Shape | d50 (mm) | RMSE (m) | MAPE (%) | Correlation Coefficient R |
|---|---|---|---|---|---|
| Type-I | Rectangular | 0.520 | 0.00289 | 24.79 | 0.95 |
| 0.712 | 0.00293 | 31.63 | 0.94 | ||
| Semi-circular | 0.520 | 0.00160 | 14.53 | 0.98 | |
| 0.712 | 0.00145 | 13.09 | 0.98 | ||
| Trapezoidal | 0.520 | 0.00181 | 14.94 | 0.97 | |
| 0.712 | 0.00171 | 16.99 | 0.97 | ||
| Type-II | Rectangular | 0.520 | 0.00272 | 22.41 | 0.98 |
| 0.712 | 0.00197 | 17.95 | 0.97 | ||
| Semi-circular | 0.520 | 0.00126 | 10.62 | 0.99 | |
| 0.712 | 0.00189 | 15.36 | 0.97 | ||
| Trapezoidal | 0.520 | 0.00158 | 13.98 | 0.99 | |
| 0.712 | 0.00220 | 20.63 | 0.97 | ||
| Type-III | Rectangular | 0.520 | 0.00265 | 19.43 | 0.98 |
| 0.712 | 0.00200 | 15.33 | 0.98 | ||
| Semi-circular | 0.520 | 0.00143 | 11.04 | 0.98 | |
| 0.712 | 0.00120 | 7.46 | 0.98 | ||
| Trapezoidal | 0.520 | 0.00168 | 12.14 | 0.97 | |
| 0.712 | 0.00180 | 16.13 | 0.98 |
Publisher’s Note: MDPI stays neutral with regard to jurisdictional claims in published maps and institutional affiliations. |
© 2022 by the authors. Licensee MDPI, Basel, Switzerland. This article is an open access article distributed under the terms and conditions of the Creative Commons Attribution (CC BY) license (https://creativecommons.org/licenses/by/4.0/).
Share and Cite
MDPI and ACS Style
Raikar, R.V.; Hong, J.-H.; Deshmukh, A.R.; Guo, W.-D. Parametric Study on Abutment Scour under Unsteady Flow. Water 2022, 14, 1820. https://doi.org/10.3390/w14111820
AMA Style
Raikar RV, Hong J-H, Deshmukh AR, Guo W-D. Parametric Study on Abutment Scour under Unsteady Flow. Water. 2022; 14(11):1820. https://doi.org/10.3390/w14111820
Chicago/Turabian StyleRaikar, Rajkumar V., Jian-Hao Hong, Anandrao R. Deshmukh, and Wen-Dar Guo. 2022. "Parametric Study on Abutment Scour under Unsteady Flow" Water 14, no. 11: 1820. https://doi.org/10.3390/w14111820
Note that from the first issue of 2016, this journal uses article numbers instead of page numbers. See further details here.