
Quantitative Land-Use and Landslide Assessment: A Case Study in Rize, Türkiye


1
Graduate School of Science and Technology, Niigata University, Niigata 950-2181, Japan
2
Faculty of Agriculture, Niigata University, Niigata 950-2181, Japan
3
Civil Engineering Department, Middle East Technical University, Ankara 06800, Türkiye
*
Author to whom correspondence should be addressed.
Water 2022, 14(11), 1811; https://doi.org/10.3390/w14111811
Submission received: 28 April 2022
/
Revised: 30 May 2022
/
Accepted: 2 June 2022
/
Published: 4 June 2022
(This article belongs to the Special Issue Natural Disasters Occurrence, Reduction, and Restoration in Mountain Regions)
Abstract
:Currently, many studies have reported that many landslides occur in tea or rubber plantation areas. In these areas, it is important to make a landslide susceptibility map and to take necessary measures to mitigate landslide damage. However, since historical landslide distribution data and land use data are not available, quantitative landslide assessment measurements have not been made in many countries. Therefore, in this study, landslide distribution maps and land use maps are created with worldwide available satellite imagery and Google Earth imagery, and the relationship between landslides and land use is analyzed in Rize, Türkiye. The results show that landslides are 1.75 to 5 times more likely to occur in tea gardens than in forests. It was also found that land use has the highest contribution to landslides among the landslide conditioning factors. The landslide assessment, using a simple landslide detection method and land use classification method with worldwide available data, enabled us to quantitatively reveal the characteristics of landslides. The results of this study reveal that quantitative landslide assessments can be applied in any location, where relatively high resolution satellite imagery and Google Earth imagery, or its alternatives, are available.
1. Introduction
Rainfall-induced landslides occur worldwide, and they cause economic losses and human casualties every year [1]. Intense or prolonged rainfall induces landslides. Lithology, slope gradient, slope aspect, elevation, vegetation cover, and proximity to drainage line are considered to be influential physical parameters in the occurrence of rainfall-induced landslides [2,3]. Regarding vegetation cover, it is well known that improper land use change affects the landslide frequency [1,4,5,6]. Some studies in Türkiye [7,8], India [9], and Sri Lanka [10,11] have reported that landslides frequently occur in areas where the land use has converted into tea garden or rubber plantation areas. The contributing factors for increasing landslide susceptibility are thought to be: (1) shallower roots of tea or rubber plantations than the original trees [7,9], (2) improper drainage systems around the plantation garden [12,13], and (3) excessive use of fertilizers [9,14].
Effective land use planning and management based on landslide risk assessment is necessary to mitigate damages caused by landslides [15]. Landslide susceptibility can be assessed qualitatively or quantitatively [16]. Qualitative landslide assessment is a subjective assessment based on experience and the knowledge of the experts employed [16,17,18,19]. On the other hand, quantitative landslide risk assessment is an objective and reproducible assessment based on comprehensive historical data [16,17,18,20]. Quantitative landslide risk assessment is useful because it provides a basis for the prioritization of measurement and mitigation actions [16]. However, quantitative landslide risk assessment is still inadequate in many countries [16,17,21,22,23], because financial resources and personnel for allocating baseline information to landslide assessment (e.g., landslide historical data, land use data, rainfall data, data regarding the distribution of soil properties) are limited [24,25].
Remote sensing information is the best alternative source for collecting these limited data [26]. Current satellite images make it possible to obtain accurate time-series information on the earth’s surface over wide areas. If satellite images before and after landslide occurrence are available, it is a powerful tool for detecting landslide areas for landslide susceptibility assessment in many countries [26,27]. Detecting landslides using satellite images has the advantage of reducing the time and cost compared to conventional methods of using field surveys and aerial photos [27,28,29]. Recently, high resolution and highly revisited frequency satellite images have become more easily available, and they are sometimes available for free. For example, the Education and Research Program of Planet Labs provides access to the PlanetScope Imagery and the RapidEye Archive to anyone who belongs to the university [30]. In addition, Google Earth images is a very useful alternative for any user.
To take effective measures to mitigate landslide damages in the area, where quantitative landslide risk assessment is insufficient, it is very important to present an easy method (without a high level of techniques and knowledge) to generate the data necessary for landslide risk assessment, even if there is some compromise in the spatial resolution accuracy of the data obtained.
The objective of this study is to generate the data that is necessary for landslide risk assessment (such as landslide distribution map and the land use map) using globally available satellite images and Google Earth images, to quantitatively assess the relationship between landslide, land use, and topography, and to demonstrate the usefulness of this series of methods.
2. Study Area and Data
The Black Sea region of Türkiye is a highly landslide-prone area, due to its steep topography and heavy annual precipitation [3]. Many rainfall-induced landslides cause damage in the Rize region, which is located in the Eastern Black Sea region, and there have been 1 to 32 casualties every year from 1973 to 2010 [8]. A significant upward trend of fatal landslides was observed in Rize from 1952 to 2019 [31]. Rize is a very famous area for tea production, and tea is an economically valuable plant and essential for farmers [32]. The alder forests were converted to tea gardens, especially in the last 50 years, and the tea plantation area has increased by 32 times between 1940 and 2010 [4,7,33]. Many studies have reported that landslide incidents increase as tea garden areas increase [4,7,8,13]. Although Karsli et al. [7] studied the effect of land use changes on landslides, studies quantitatively evaluating the relationship between land use and landslide in Rize are rather limited.
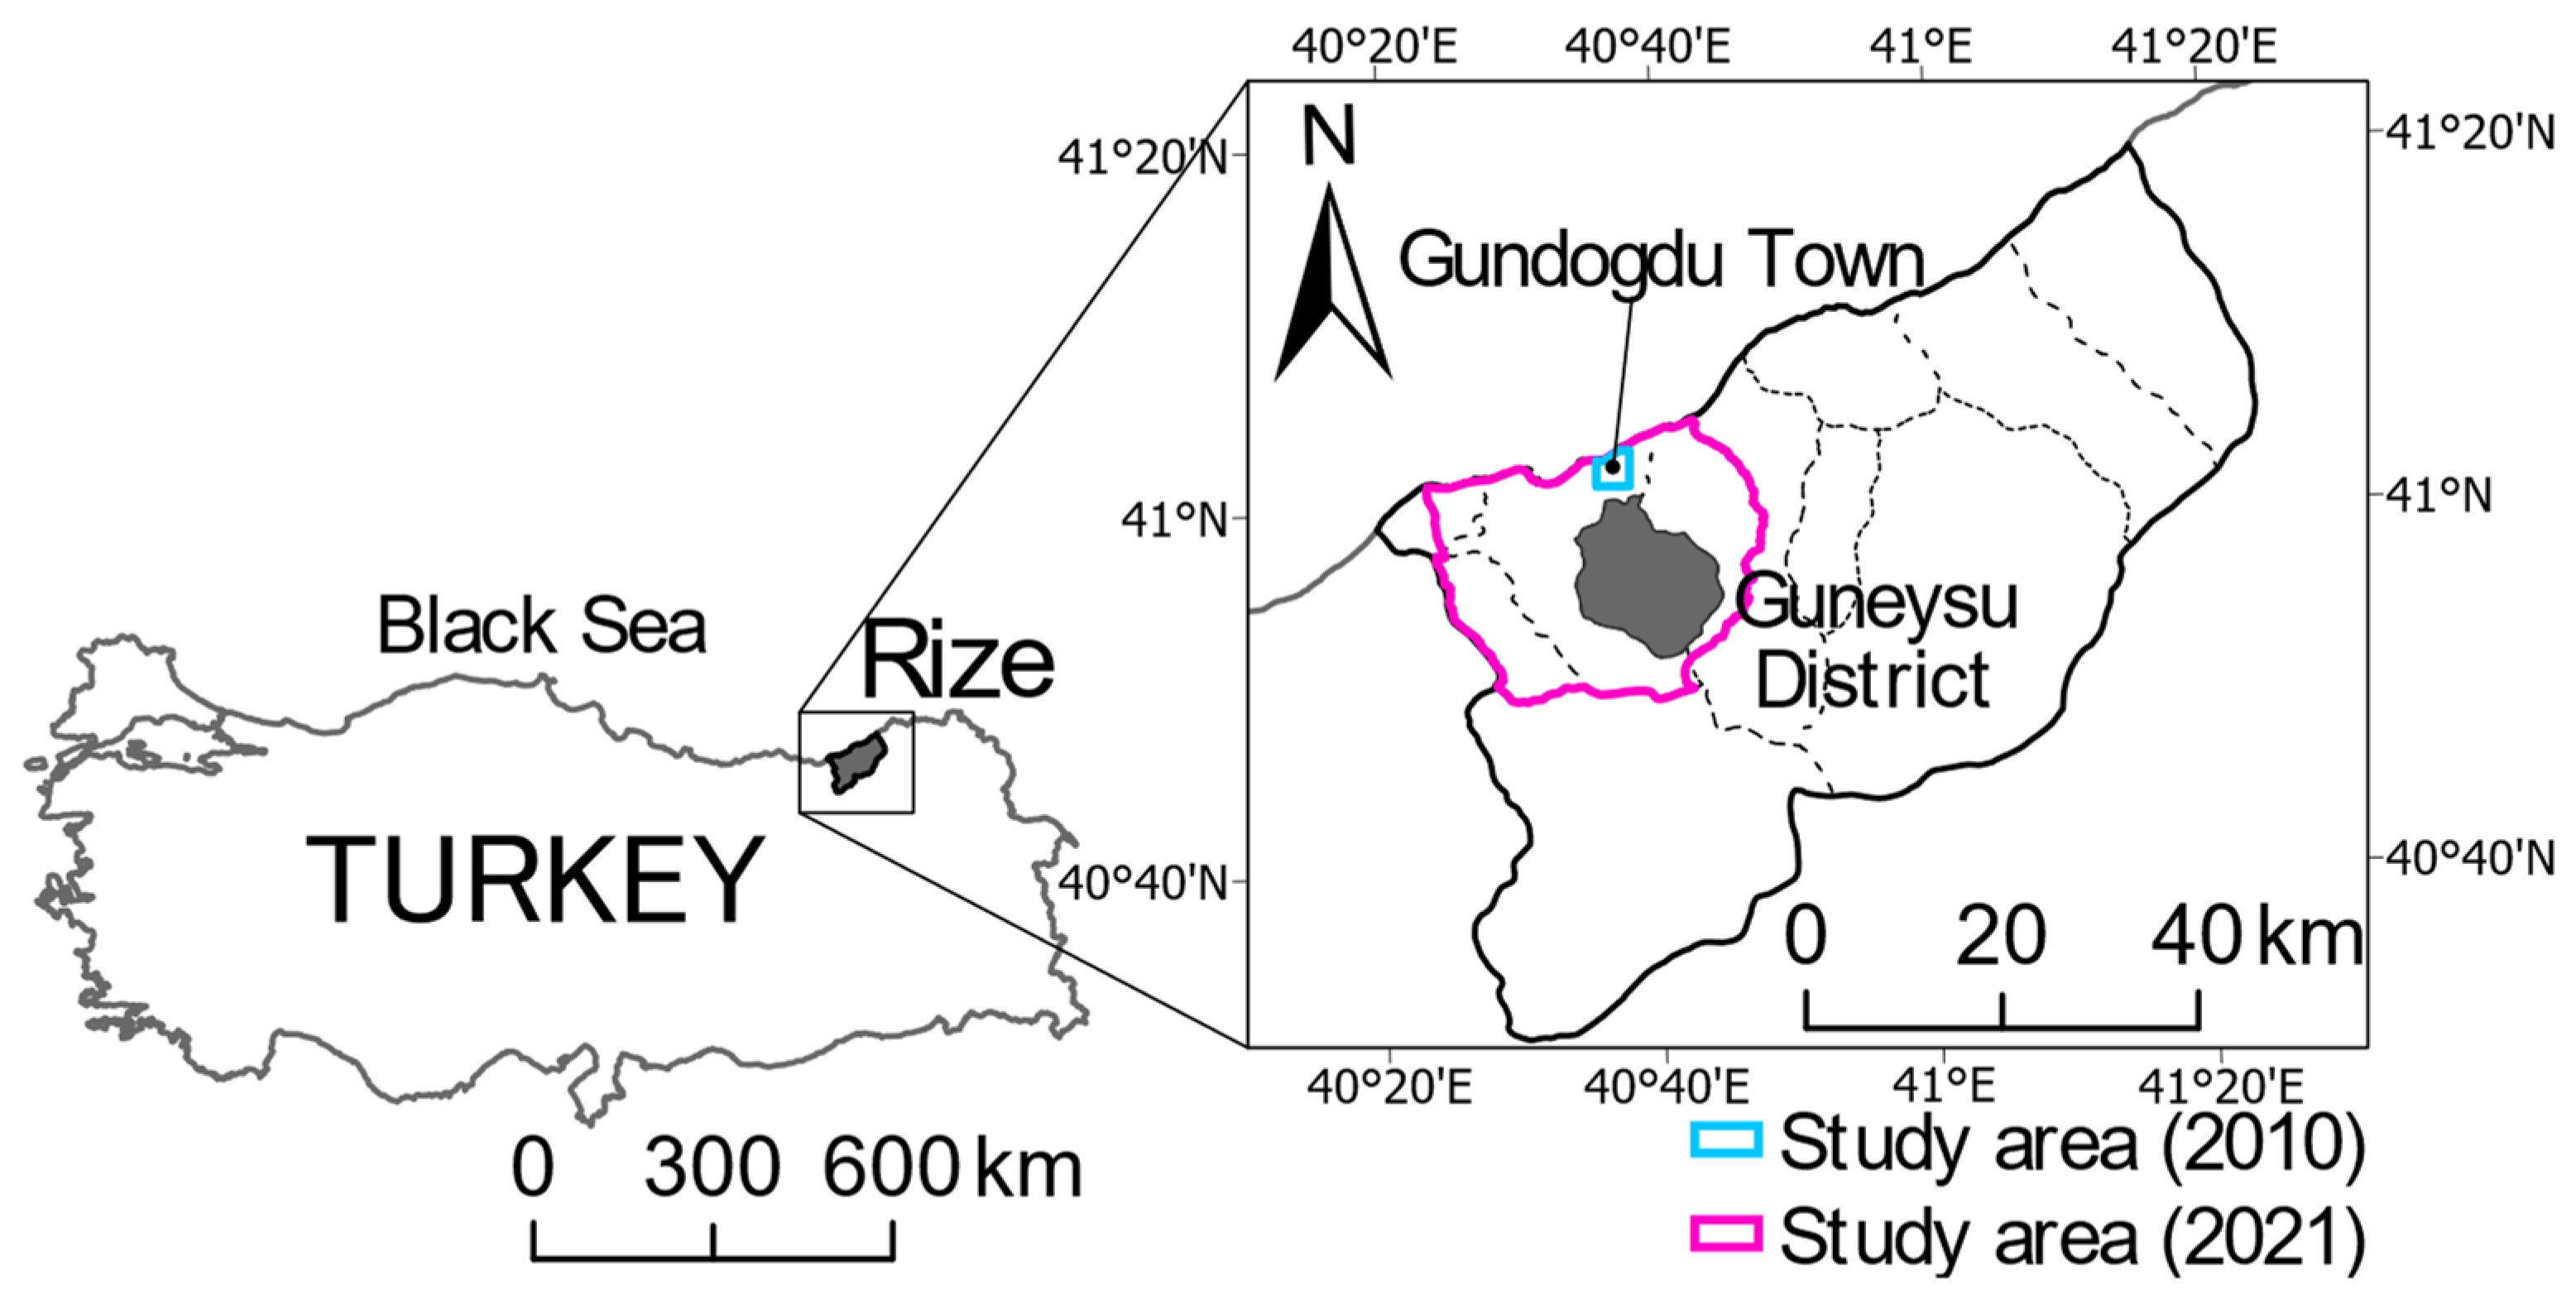
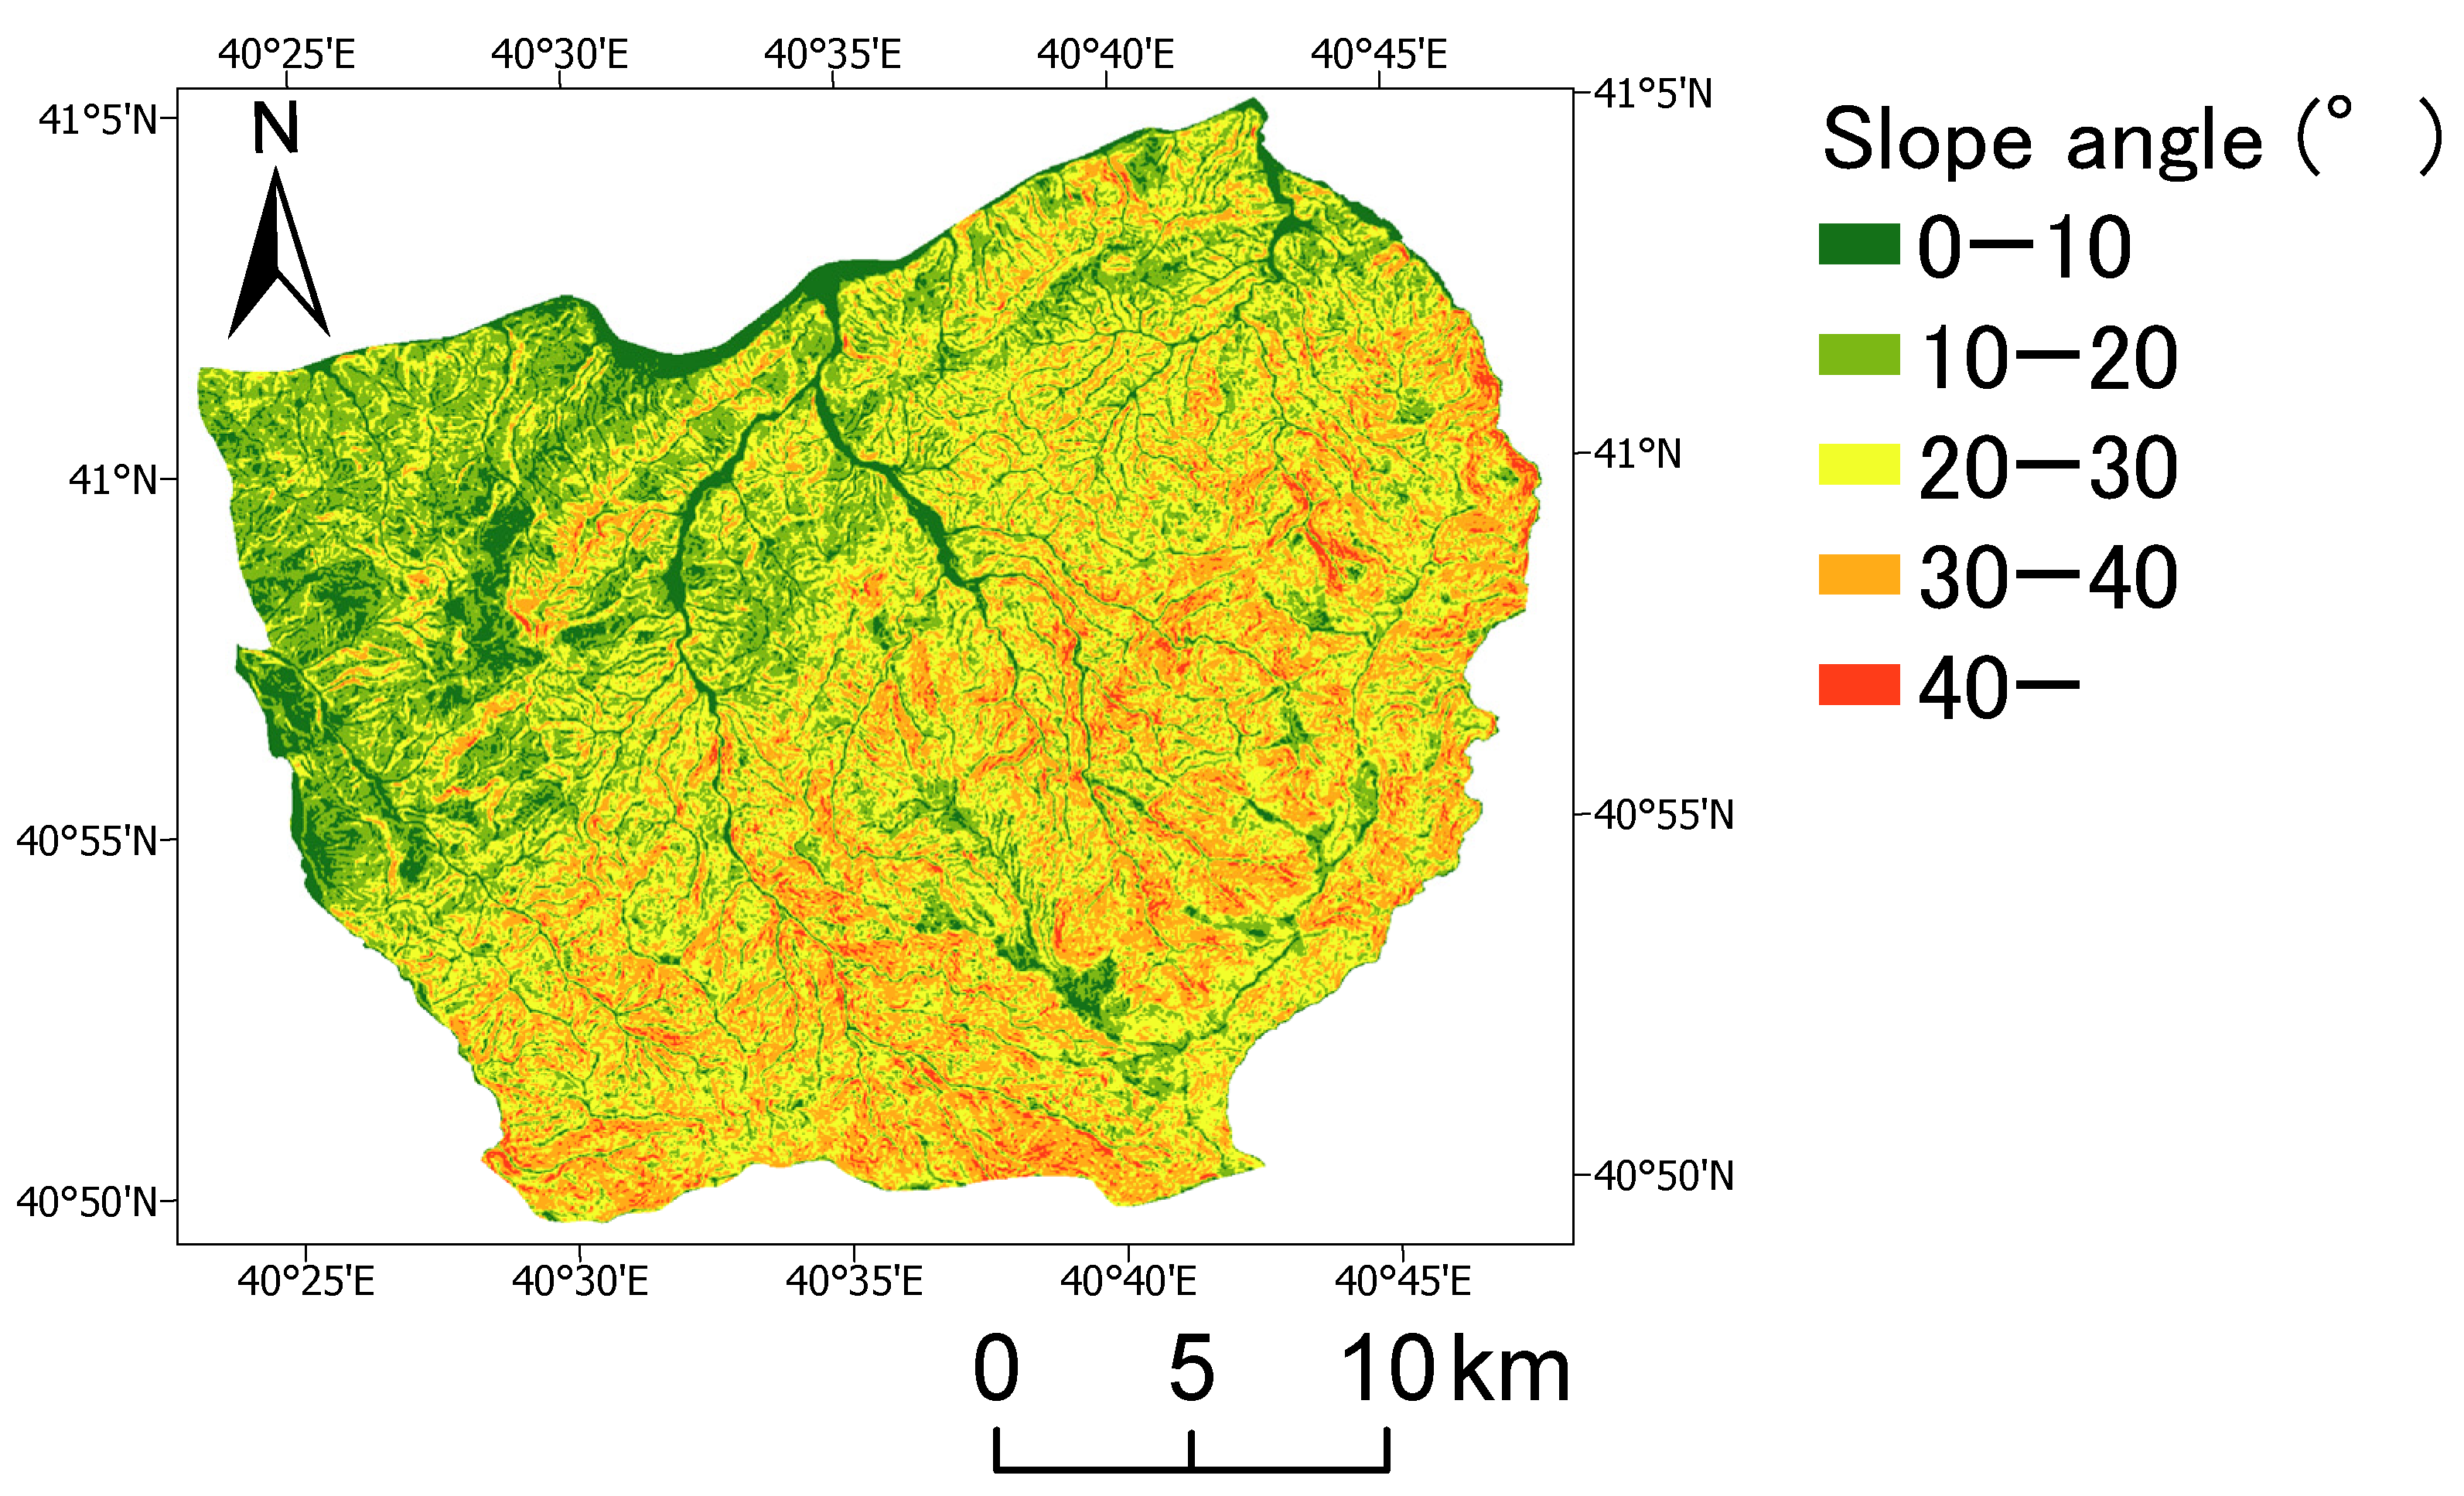
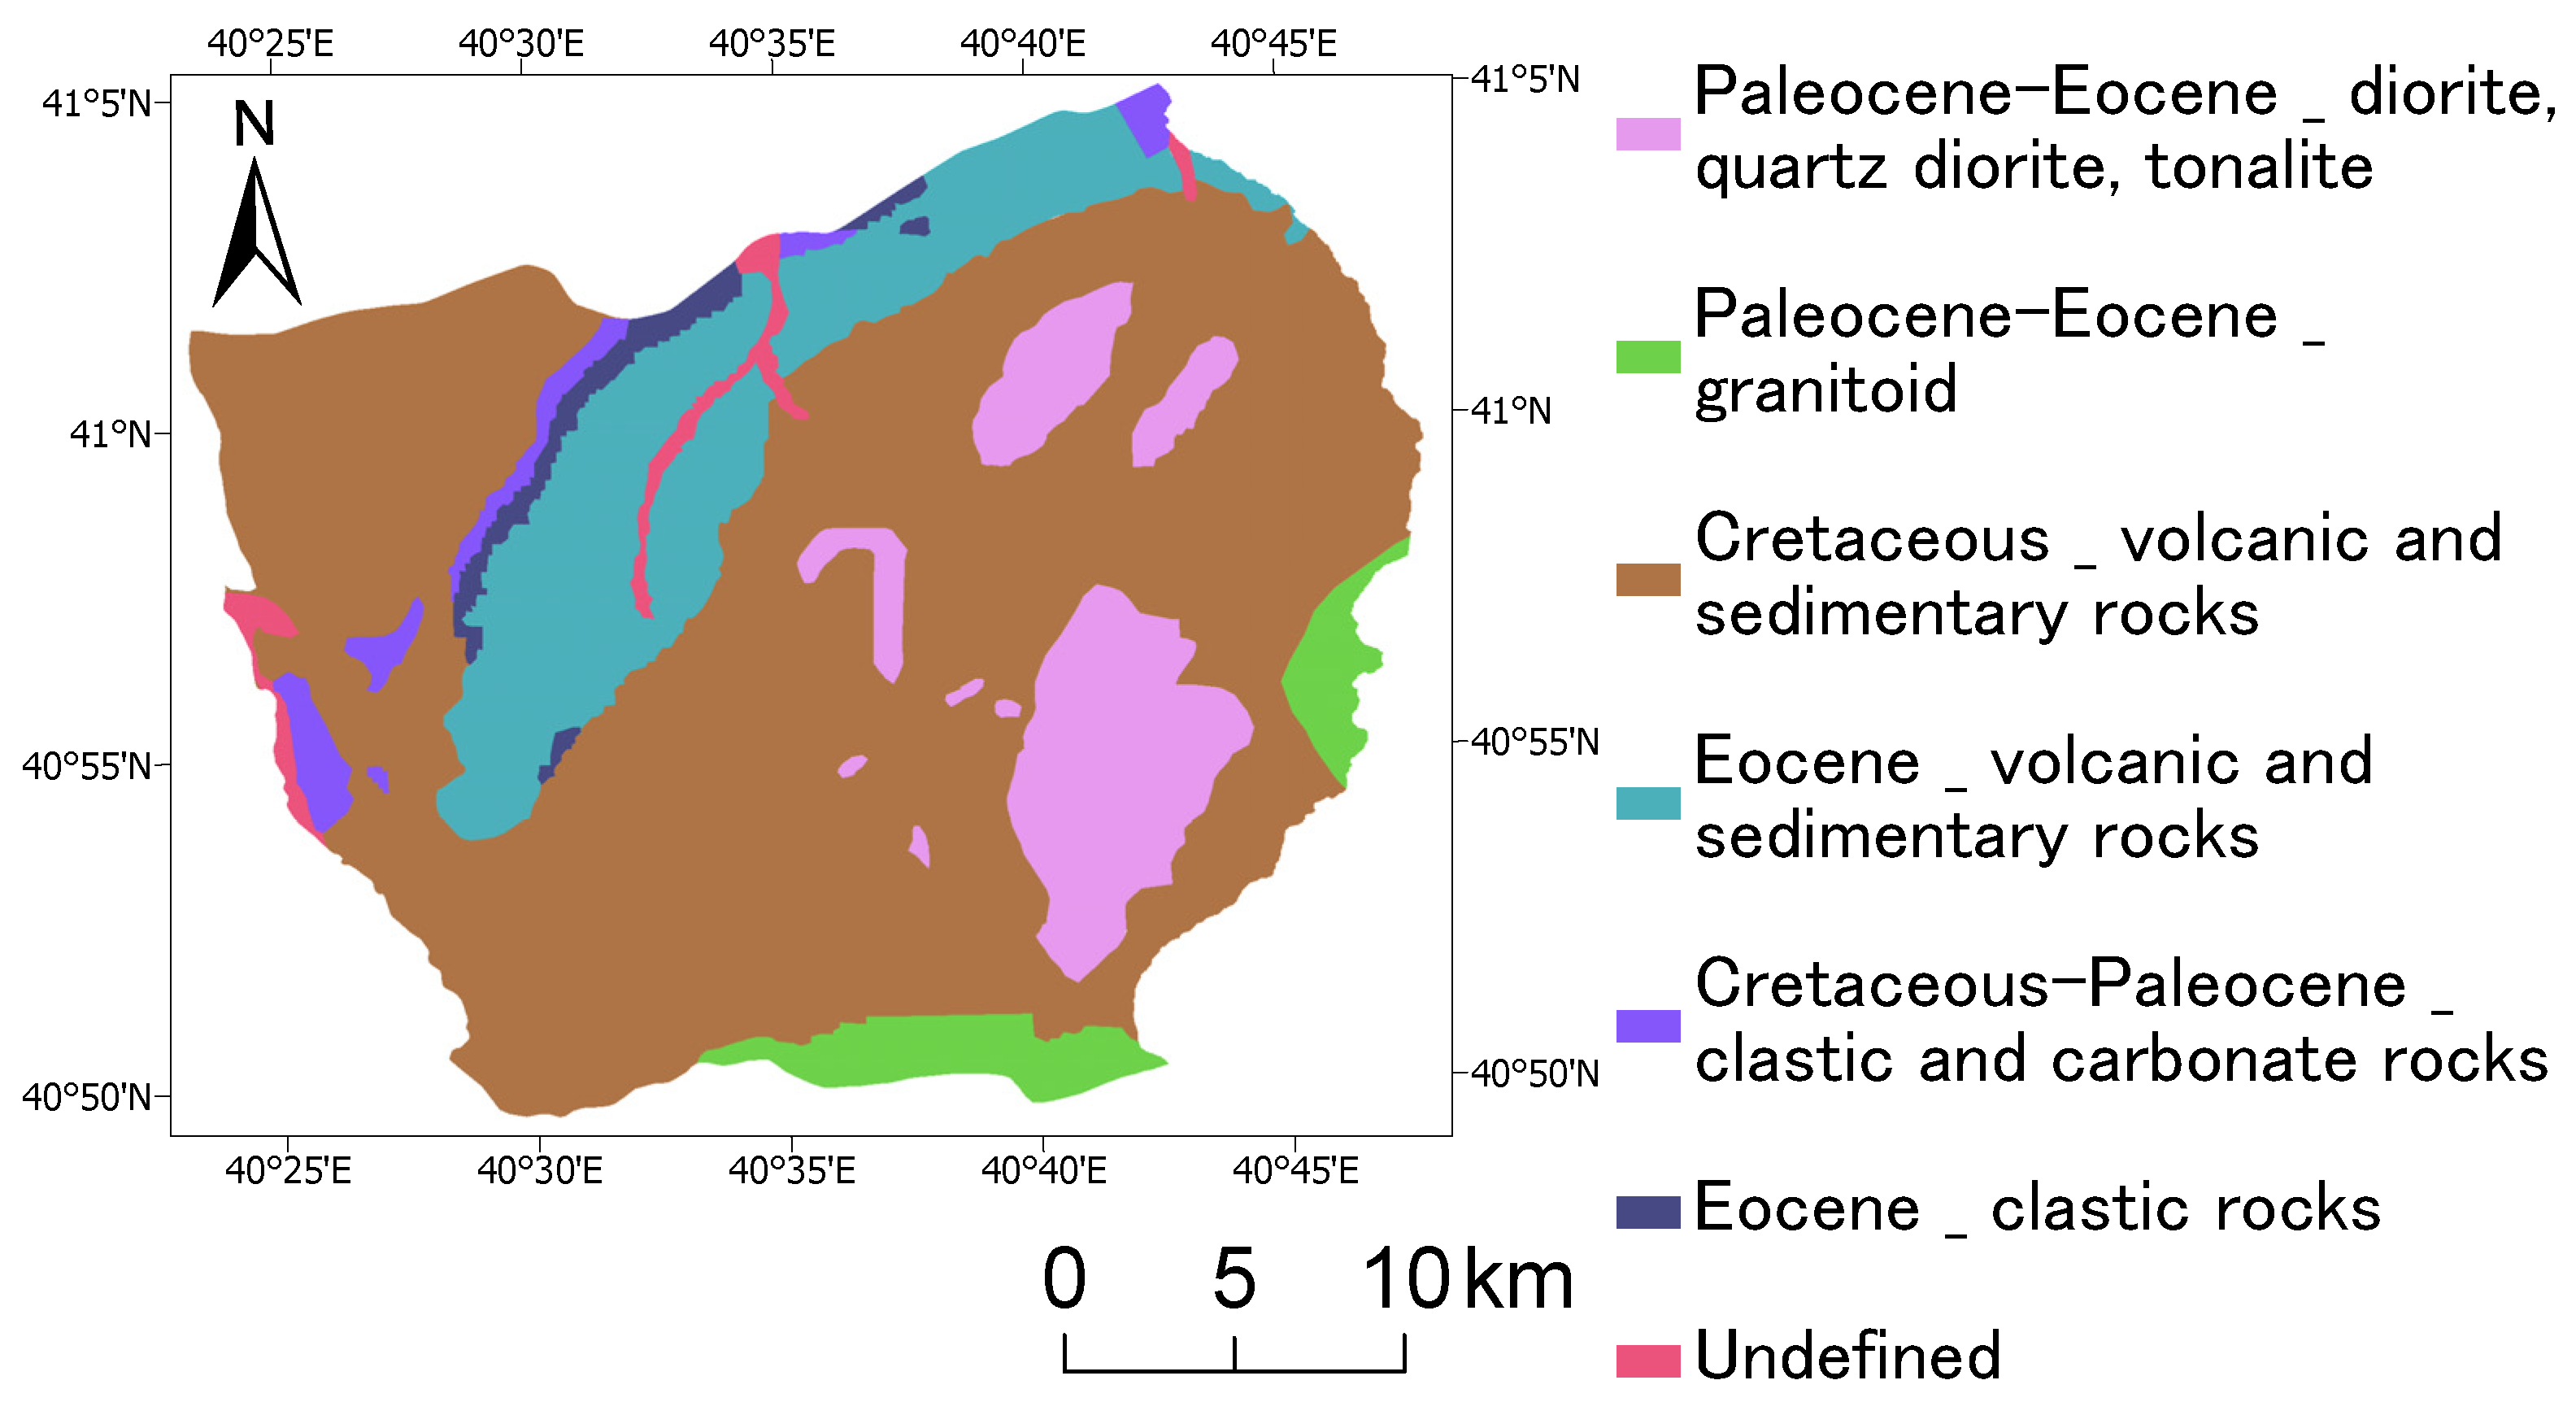
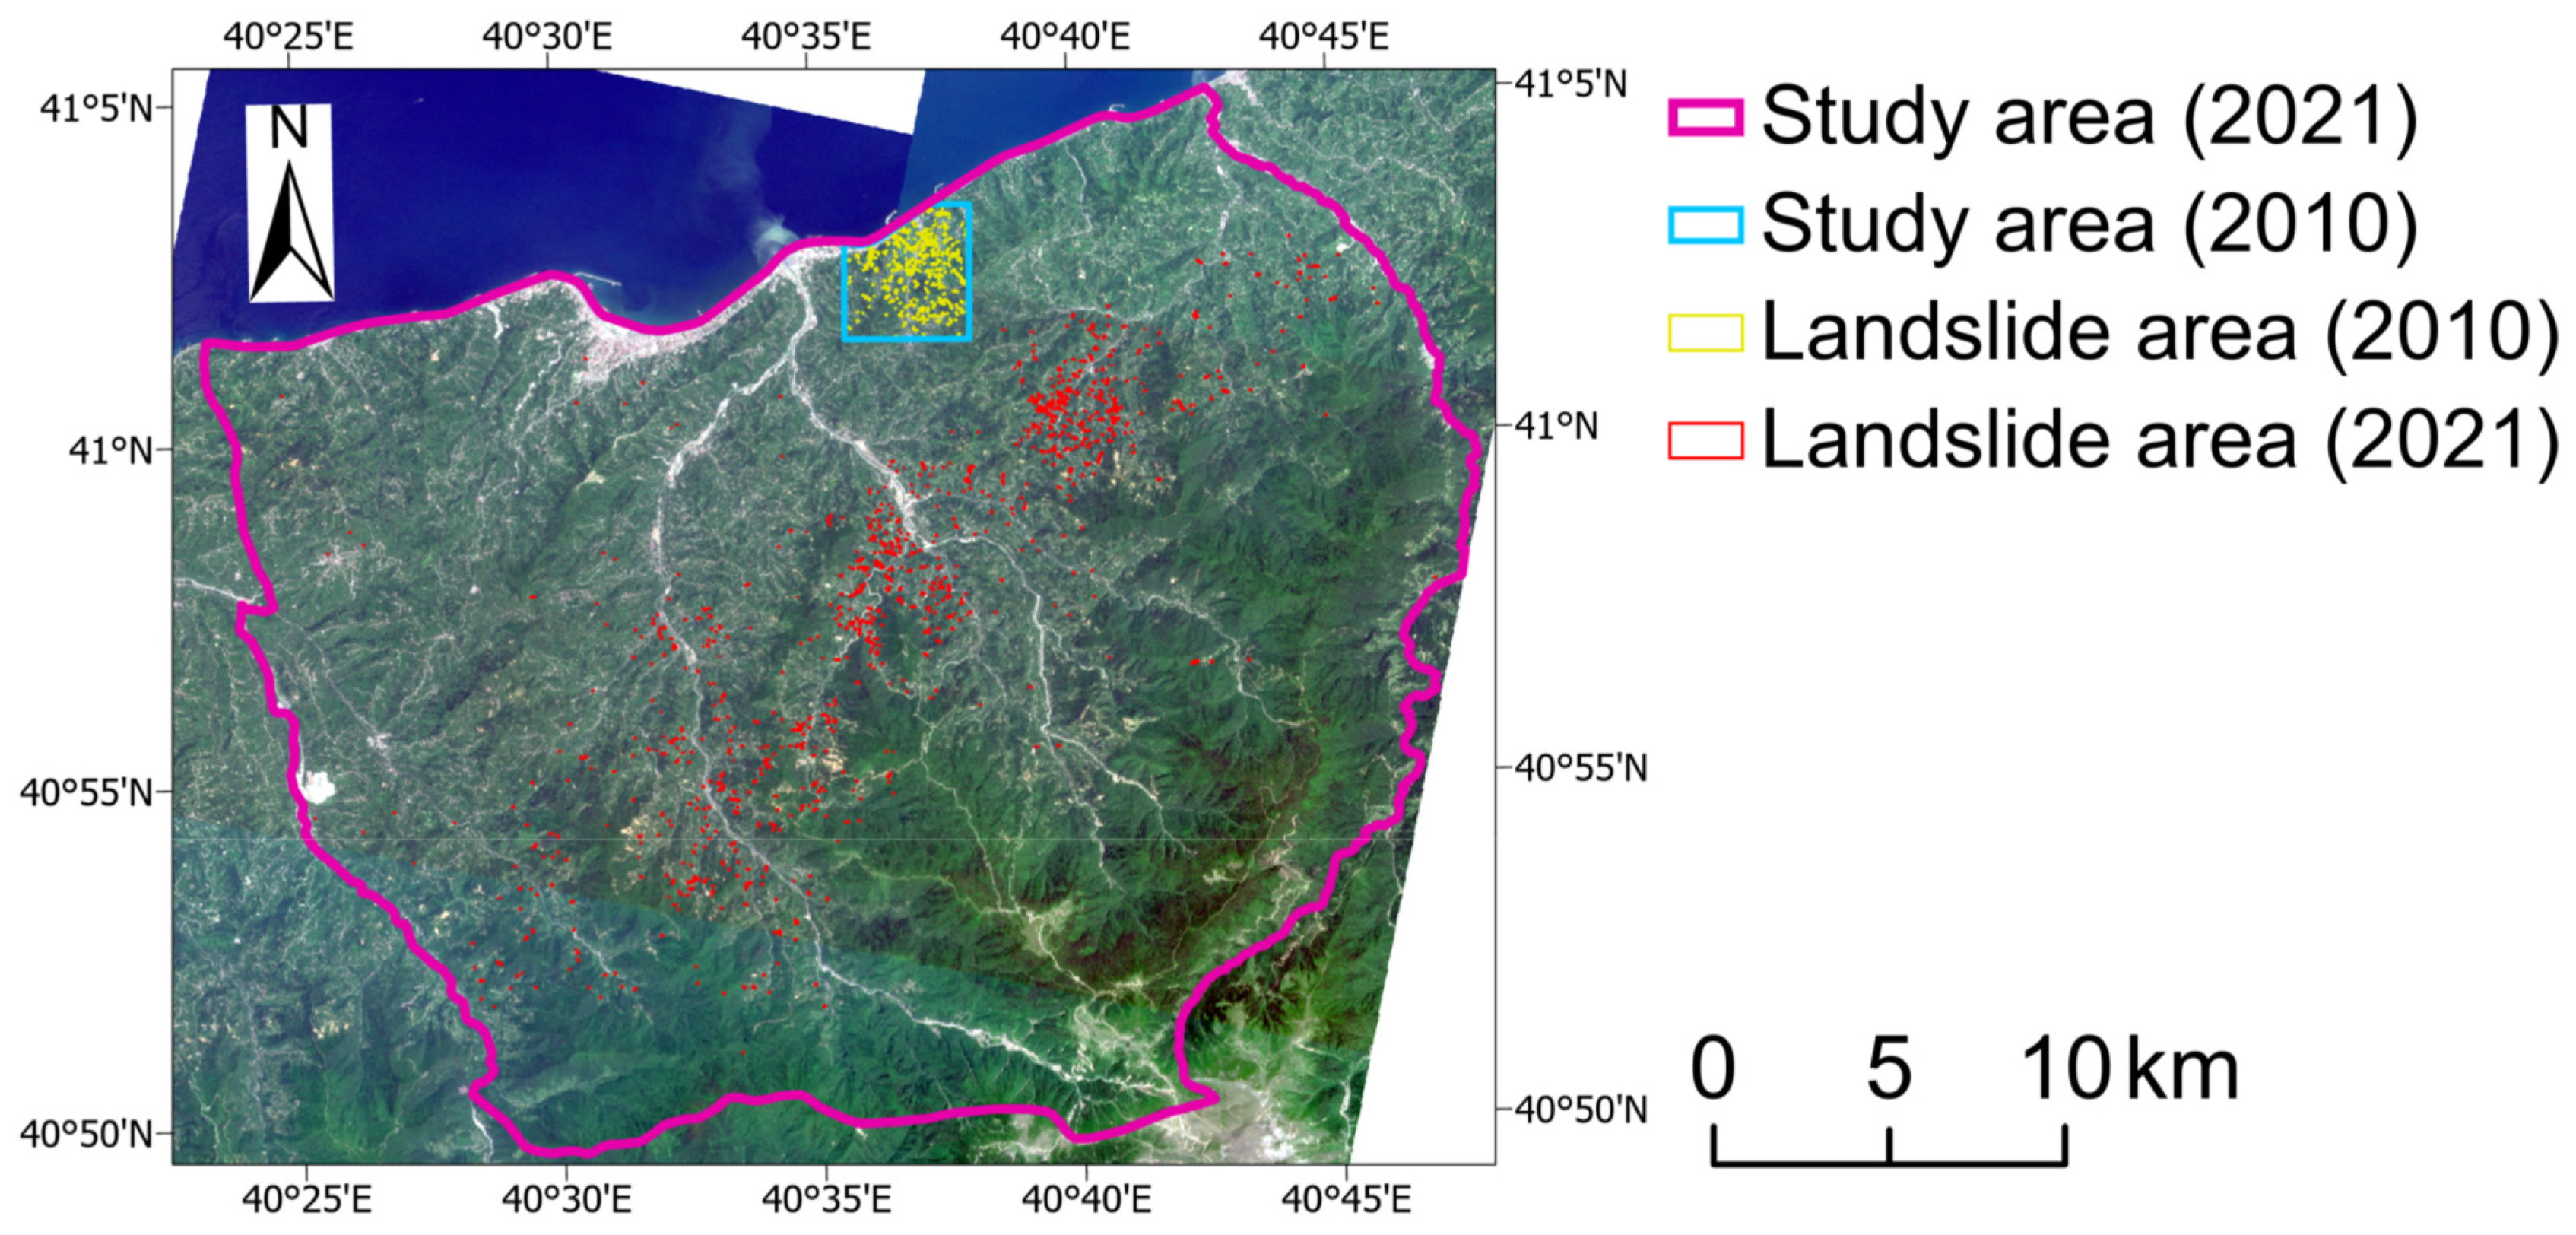
The study area covers 683.1 km2 in Guneysu district, Derepazari district, Merkez district, and a part of Cayeli district in Rize city, which is between a latitude of 40°82′66″ and 41°08′38″ N, and a longitude of 40°38′86″ and 40°79′67″ E (Figure 1). The altitude of the study area ranges from 0 to 2453 m above the mean sea level. The terrain is steep and mountainous, except for the coastal area (Figure 2). The flat coastal areas are populated with houses, while villages and tea gardens spread out in the mountainous areas despite the steep slopes. The geological map of the study area is shown in Figure 3.
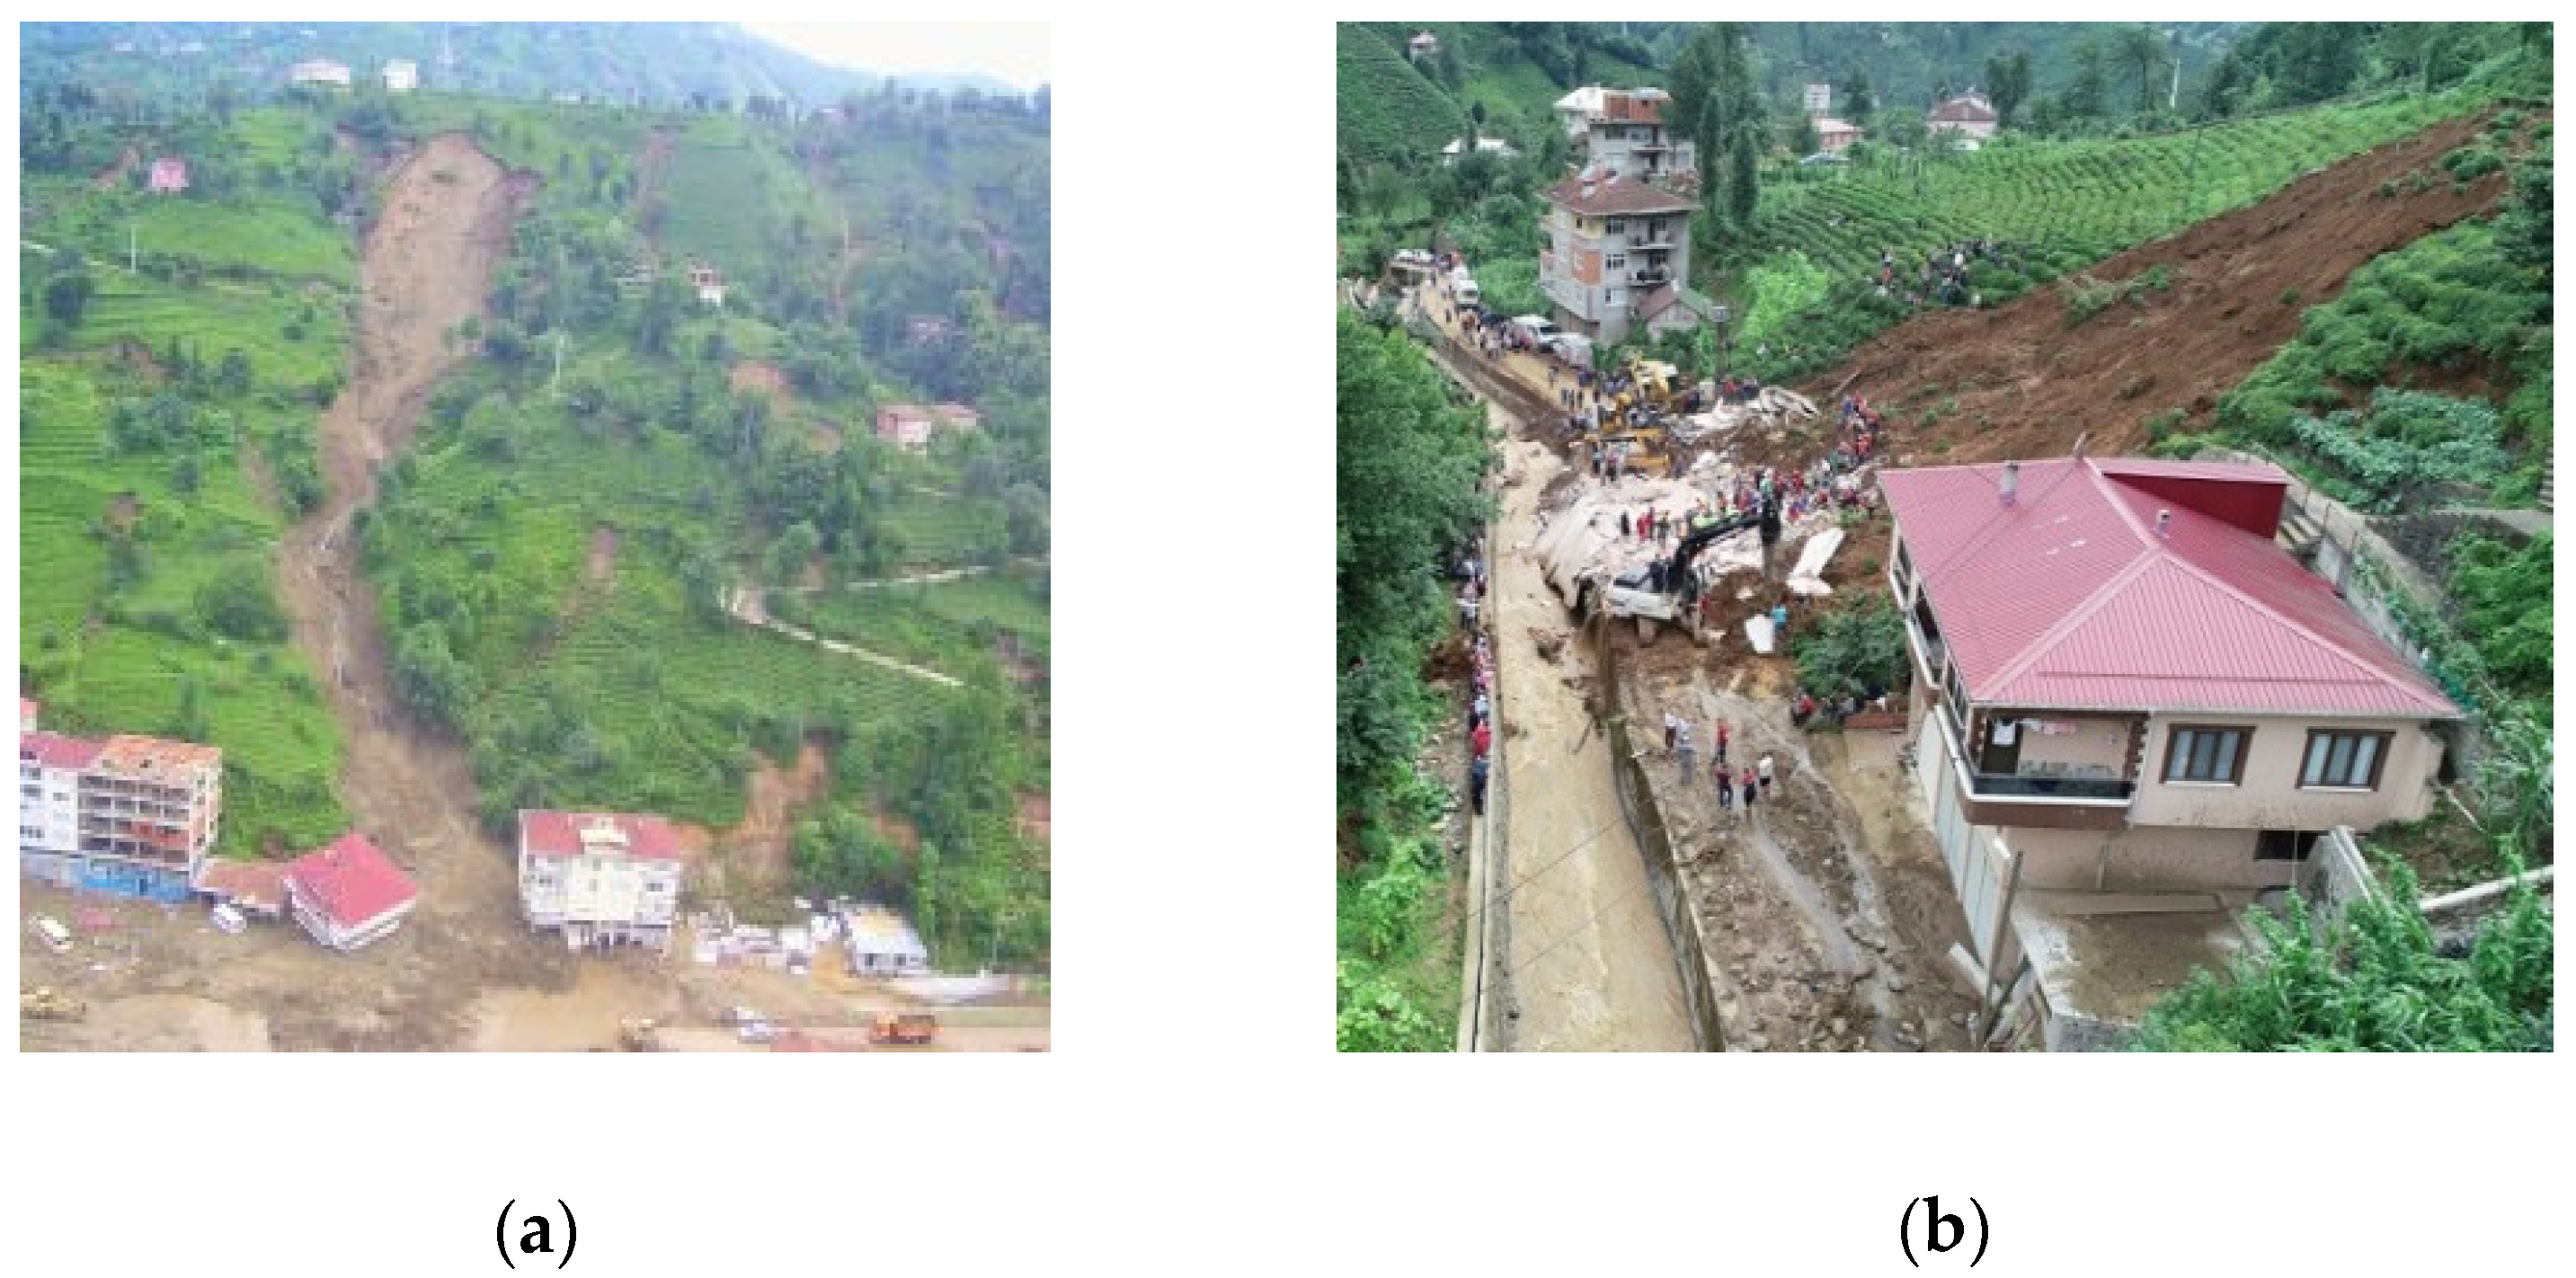
Heavy rainfall on 14 July 2021 triggered many landslides, mainly in Guneysu district (Figure 4), which resulted in six casualties [34]. The average July monthly rainfall was 152 mm according to the Turkish State Meteorological Service (TSMS) of the Ministry of Agriculture and Forestry [35]. However, 220 mm of rainfall was received only in 7 h [36] and it caused these landslides.
In addition, heavy rainfall on 26 August 2010 also triggered many landslides in Gundogdu town (Figure 4), which resulted in 14 casualties [37]. The average monthly rainfall in August is 197 mm [35]. However, 219 mm of rainfall was received within the day and on the day before the disaster [8], causing these landslides. For these landslides, only the concentrated area concerning the landslide, covering 10.6 km2 and located between a latitude of 41°02′40″ and 41°05′64″ N, and a longitude of 40°59′39″ and 40°63′48″ E, is used for analysis (Figure 1).
Figure 3.
Geological map of the study area (adapted from Turkish General Directorate of Mineral Research and Exploration [38]).
Figure 3.
Geological map of the study area (adapted from Turkish General Directorate of Mineral Research and Exploration [38]).


3. Methodology
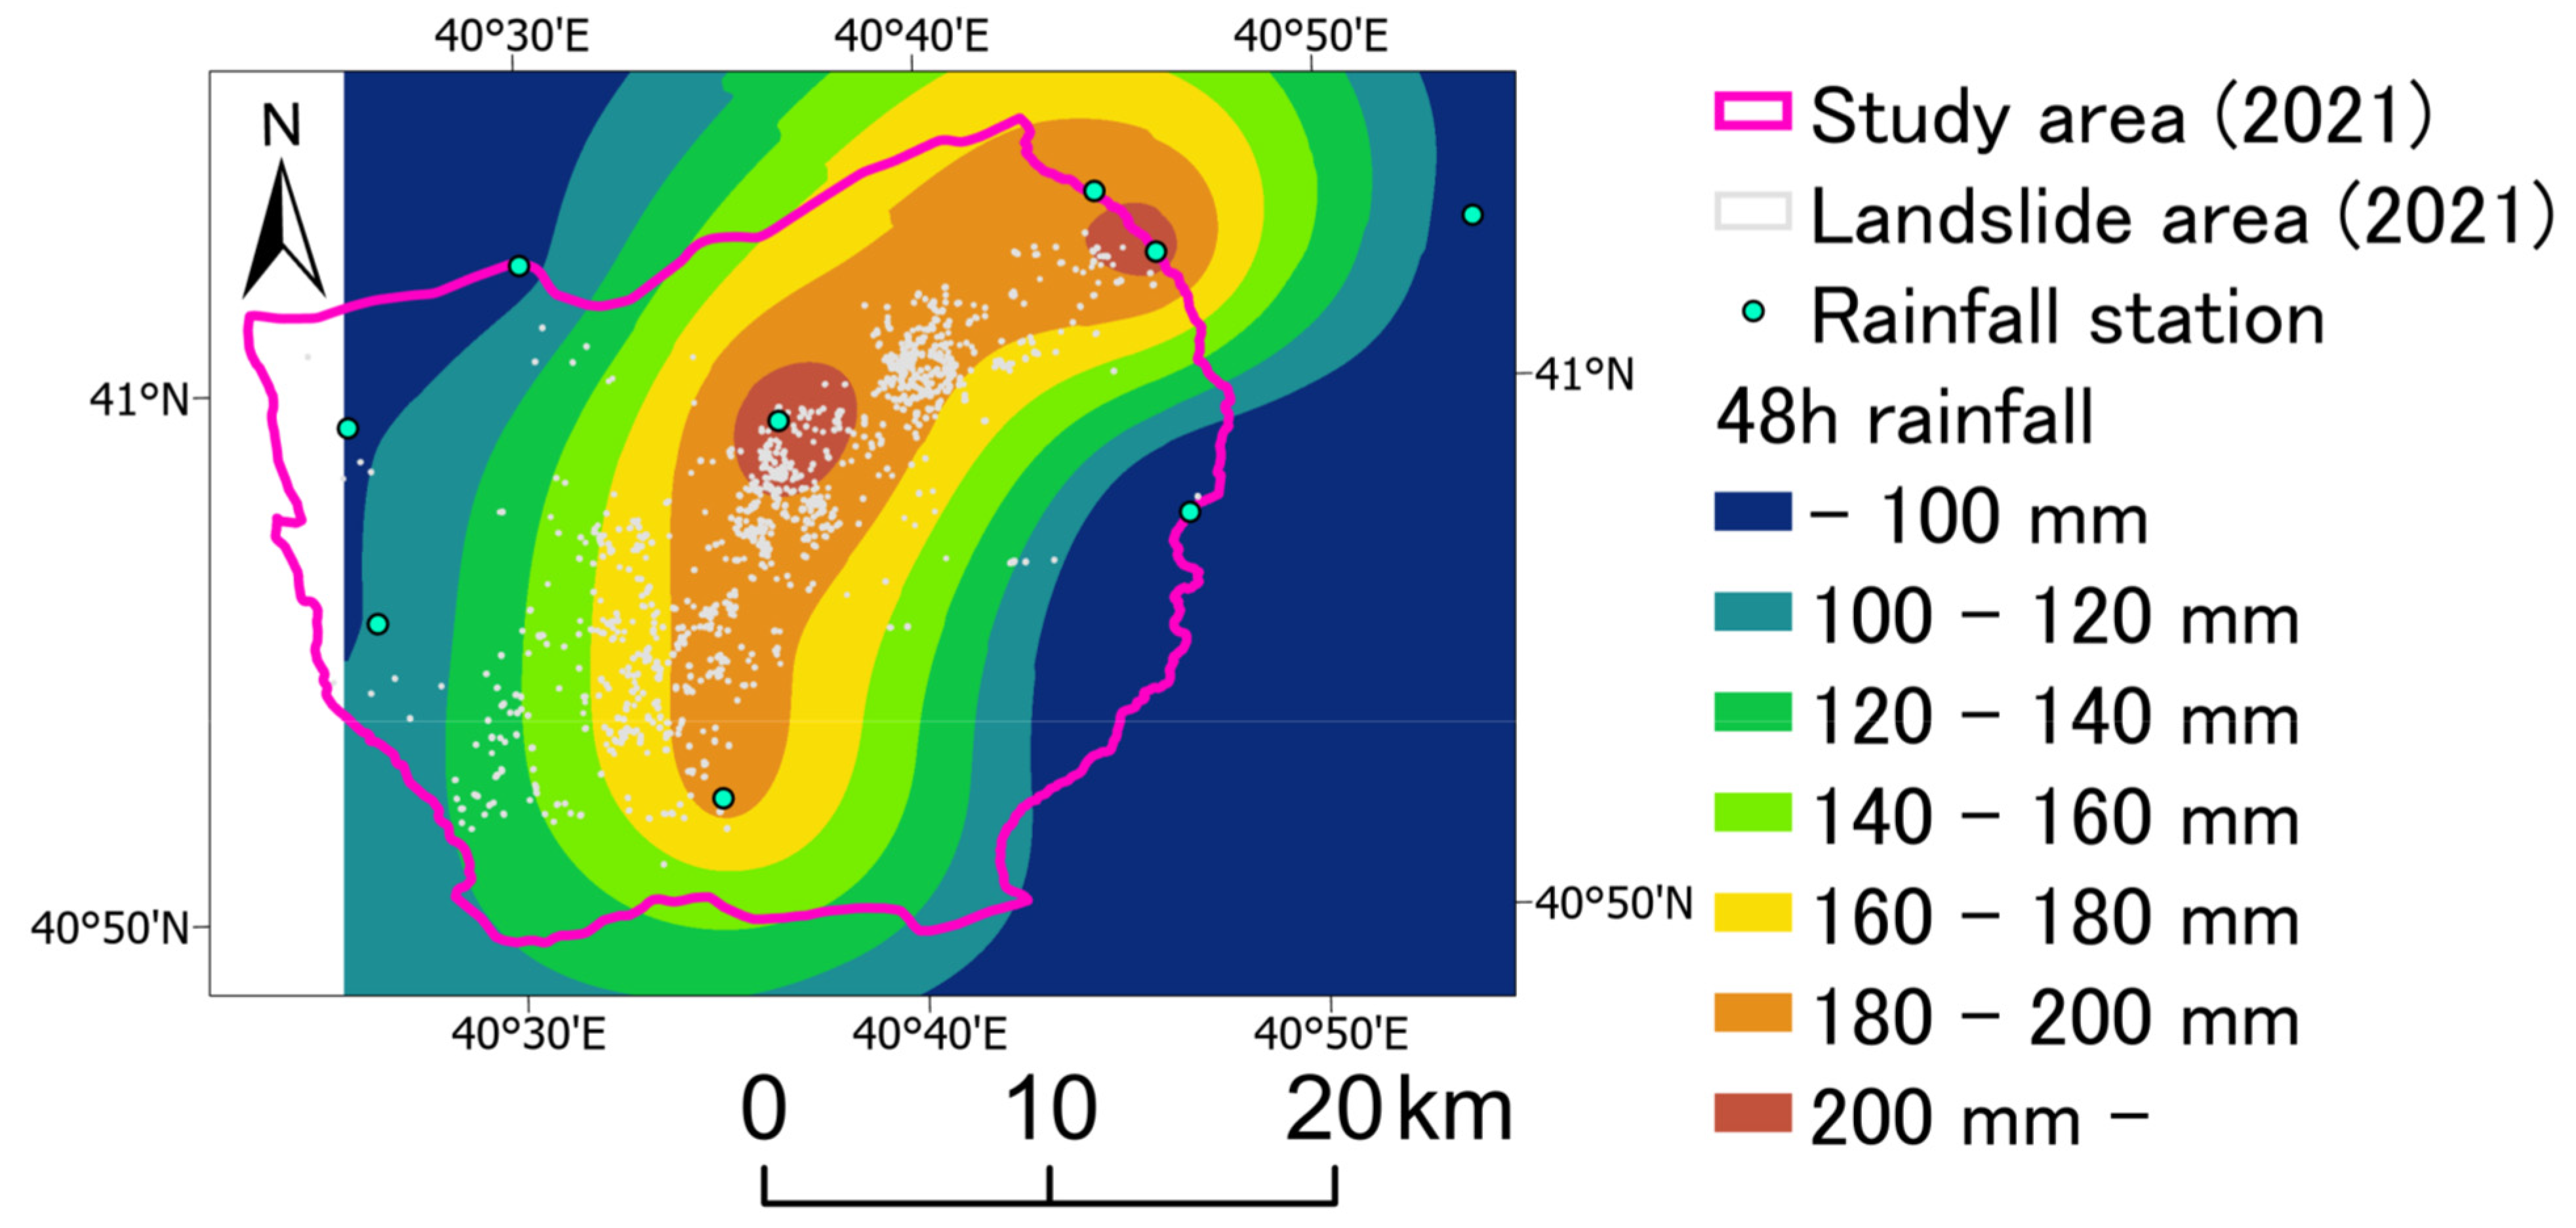
RapidEye imagery, PlanetScope imagery [30], and Google Earth imagery were used in order to detect the landslide area and classify the land use. The details of the satellite images used in this study are shown in Table 1. In addition, the Shuttle Radar Topography Mission (SRTM) DEM with a 30 m resolution was used to obtain topographic parameters such as slope gradient. The image analysis tool in ArcGIS Pro 2.6 was used for creating landslide distribution maps and land use, and for analyzing the relationship between landslide, land use, and other landslide-contributing factors. The rainfall data were acquired at 17 rainfall stations in Rize, and these were provided by TSMS [40]. The spatial variation of the cumulative daily rainfall the day before and the day of the landslide in 2021 (06:00, 13 July 2021–06:00, 15 July 2021 (UTC)) were interpolated using ordinary kriging.
3.1. Landslide Detection
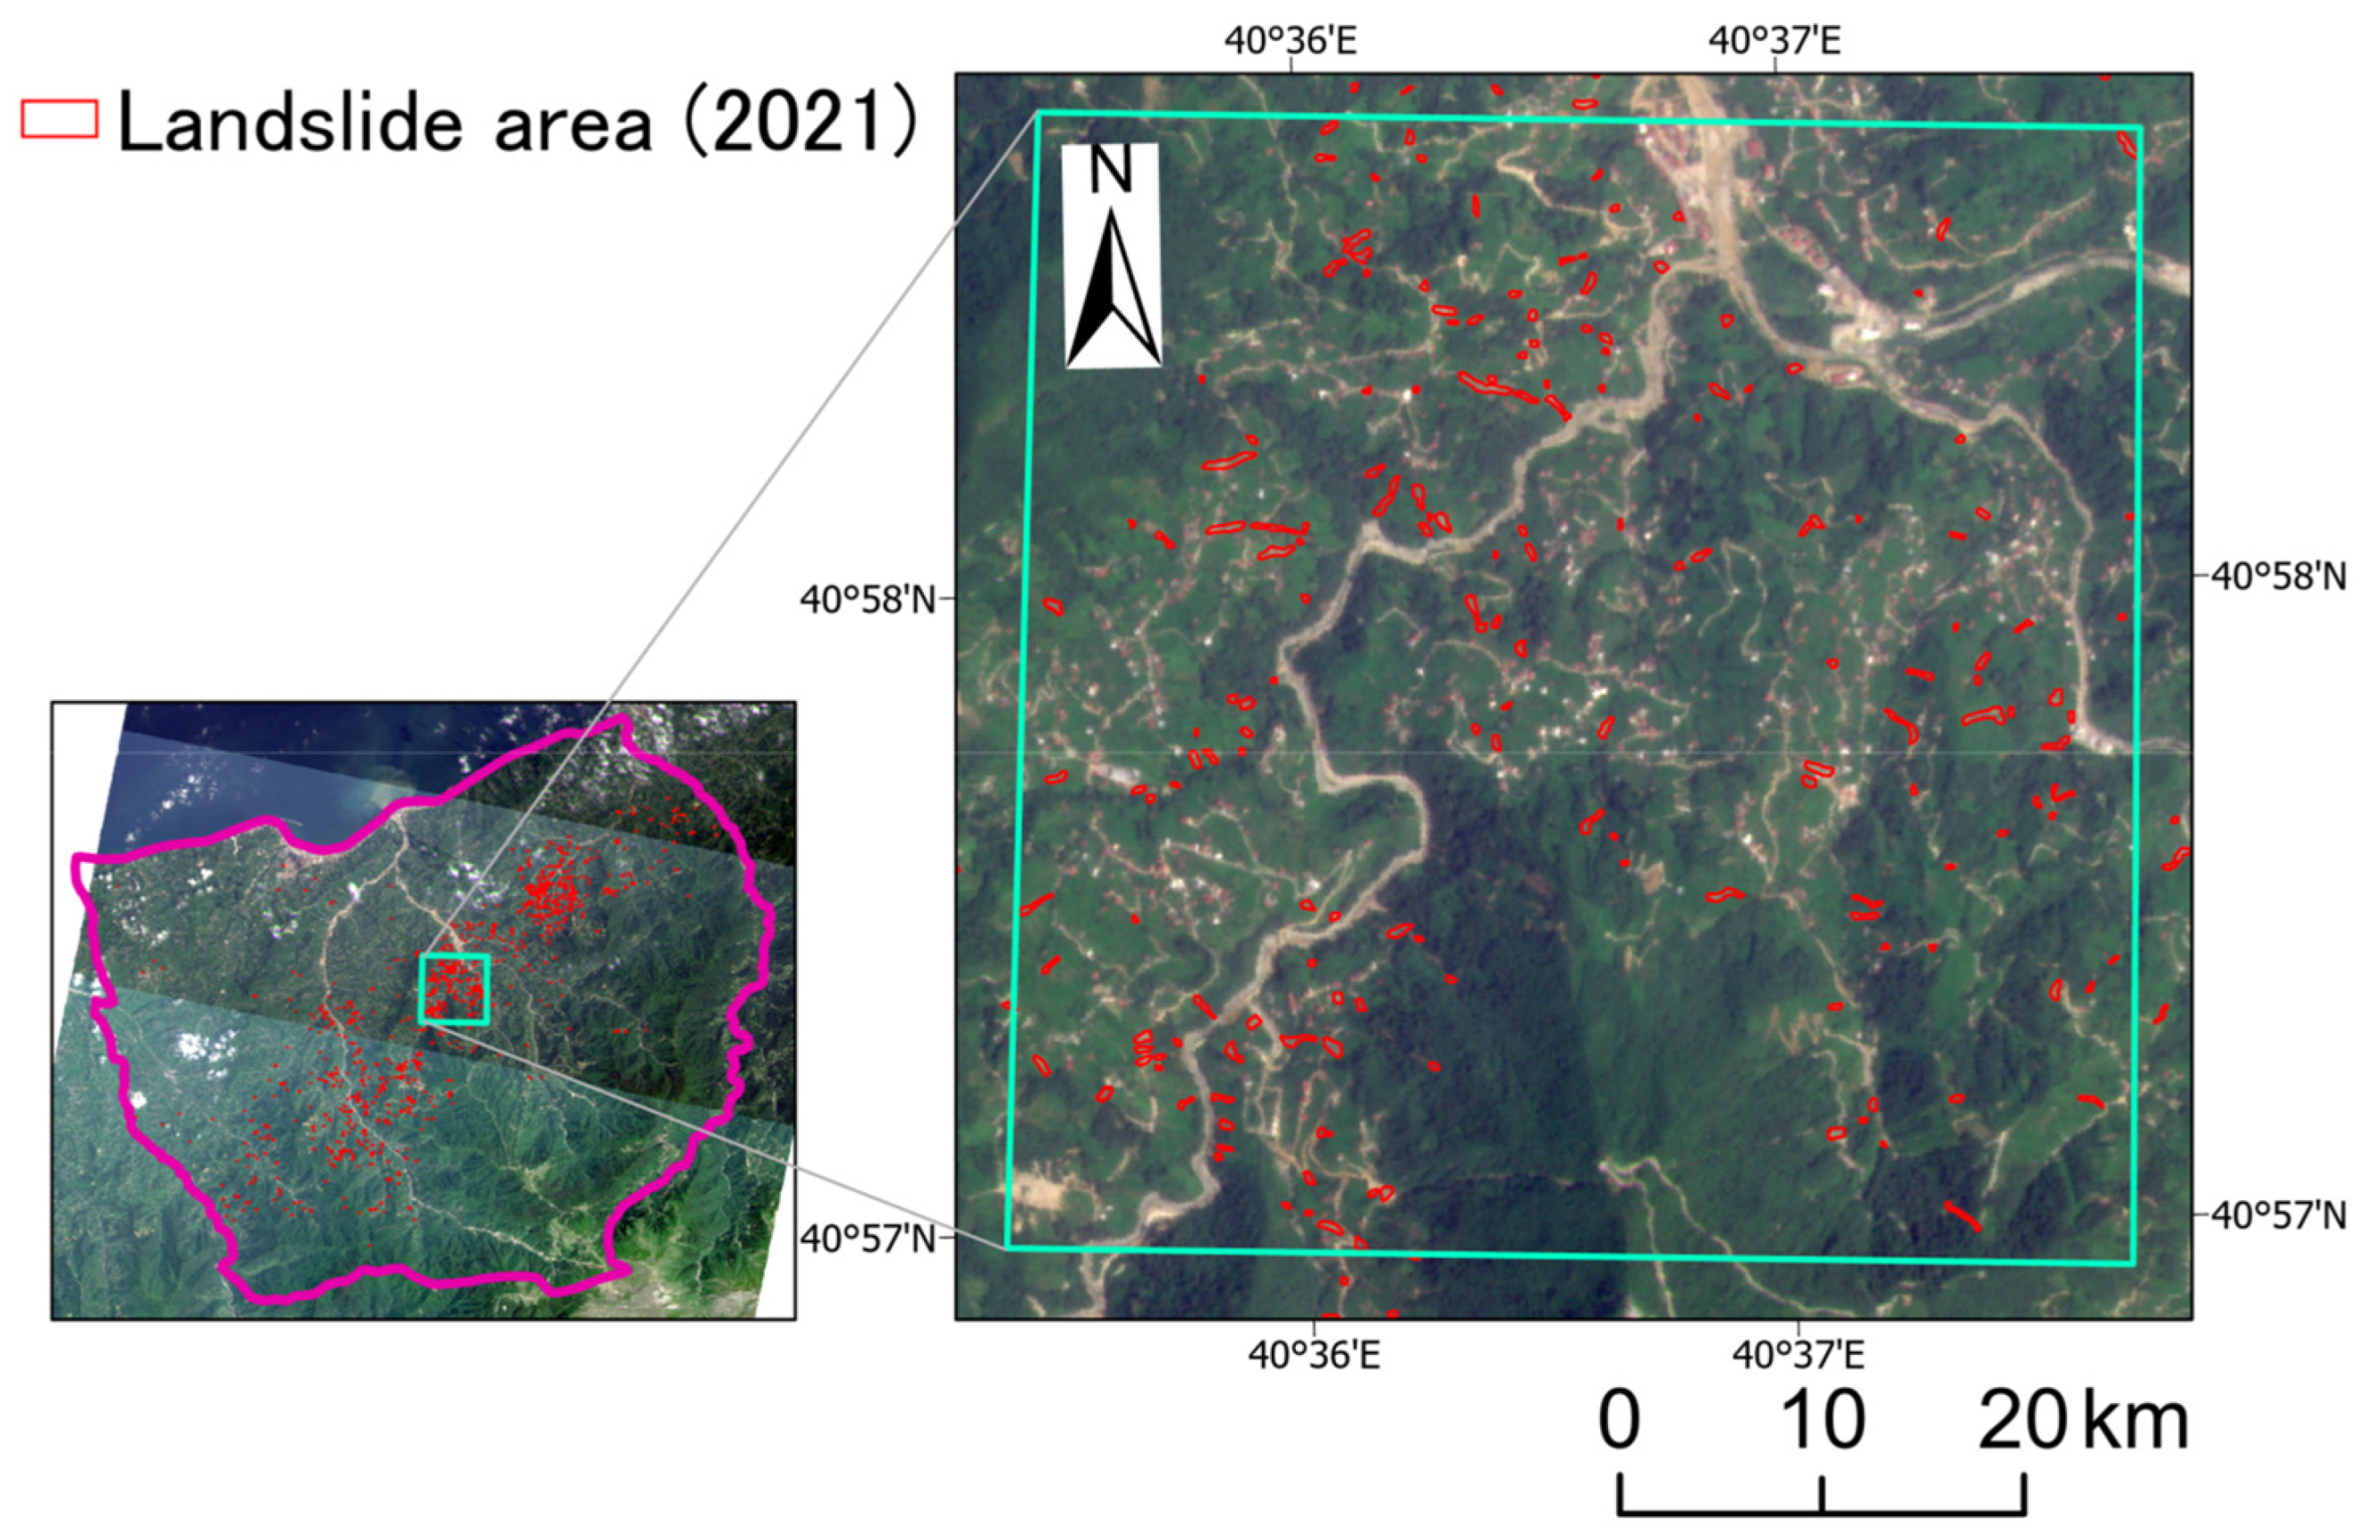
Landslides were detected by visual interpolation or semi-automatic extraction using Google Earth images and satellite images. Although visual interpolation is the most common method for landslide mapping, it requires experience and time, since the landslides are mapped manually by experts [28]. Therefore, semi-automatic landslide detection is important for quick and easy-to-implement analysis. A change detection method, which is a semi-automatic method, was used. This method is the most common landslide detection method since it is simple and easy to apply [41].
In this study, landslides were detected using the change detection method from satellite images once, and then each landslide area was checked visually using Google Earth images or other satellite images. This method reduces the required skill needed compared with the conventional visual interpolation method. It also improves the accuracy of the change detection method. Therefore, it improved the efficiency of landslide detection. Only landslides of more than 100 m2 in area were targeted for detection, since it is relatively difficult to identify small landslide areas.
The supervised classification method of the maximum likelihood classification algorithm was used to detect landslides in 2010. Training samples were gathered from Google Earth imagery. The landslide distribution map was created after visual checking using Google Earth images.
The GSI (Grain Size Index) is the index that has a positive correlation with fine sand content, and the GSI analysis was originally used for detecting desertification [42]. However, in this study, GSI was used to detect landslides in 2021. GSI is calculated as follows:
where, R, B, and G are the reflectance of the red, blue, and green bands of the satellite images. The GSI value was close to 0 in vegetated and water areas, and high in bare soil surfaces [42]. In this study, the landslide area was defined as GSI < 0.2 in the satellite image before the landslide, and GSI ≥ 0.2 in the satellite image after the landslide. The landslide distribution map was created after visual checking with satellite images that were taken after the landslide.
GSI = (R − B)/(R + B + G)
3.2. Land Use Classification
In this study, three land use classes were established: tea garden, forest, and road/house/stream. Land use before the 2010 landslide and the 2021 landslide were classified using a Random Forest (RF) machine learning technique using satellite images. RF is an ensemble learning algorithm that generates multiple decision trees based on random subsets of training data [43], and it is one of the most accurate machine learning algorithms for land use classification [44,45]. The accuracy of land use classification in a landslide area immediately before a landslide occurs has a significant impact on the reliability of the quantitative landslide risk assessment. Therefore, after land use classification by the RF method, land use in a landslide area was checked visually using Google Earth images.
The landslide spreading area in the 2010 rainfall event was relatively small (approximately 10 km2) and covered the coastal area, while the landslide spreading area in the 2021 rainfall event was large (approximately 370 km2) and covered coastal and steep mountainous areas. It is difficult to classify land use in large and heterogeneous landscape areas [46]. Furthermore, the shadows effect on rugged terrain can lead to classification errors [47,48]. Thus, the satellite images were divided into inland and coastal areas when classifying land use in 2021. In addition, each divided image was divided again into sunny parts and shaded parts, using the slope aspect and the azimuth of the sun at the time that satellite image was taken. The land use of each image was classified individually.
3.3. Analysis of the Relationship between Landslide, Land Use, and Other Landslide Contributing Factors
The relationship between landslide and land use was analyzed statistically using a created landslide distribution map and a land use map. The landslide area ratio, which is the ratio of landslide area to the total area, was used for quantitative assessment. (e.g., Landslide area ratio in tea gardens = Landslide area in tea gardens (m2)/Total area of tea gardens (m2) × 100). In general, the ground surface of the ground that experienced landslides was disturbed. For the 2021 landslides, previous landslides could be detected because Google Earth images from before the landslides are available. Therefore, follow-up landslides were excluded from the analysis.
To clarify the difference in landslide characteristics between the tea gardens and the forests, the relationship between landslides and the other factors (such as rainfall amount, geology, elevation, slope aspect, slope angle, plane curvature, profile curvature, flow accumulation, distance to the road, distance to stream, distance to first- or second-order drainage lines) were analyzed in tea gardens and forests, individually.
To reveal the dependency of land use on the occurrence of landslides, the dependence of each landslide conditioning factor on the occurrence of landslides was analyzed using Hayashi’s quantification theory type II. Approximately 680,000 points were extracted from 10 km2 of landslide concentrated area, and Hayashi’s quantification theory type II was applied. Hayashi’s quantification theory type II is a method of multivariate discrimination analysis [49]. Except for rainfall amount, four major landslide conditioning factors (items) that were revealed from preliminary analysis were adopted as landslide contributing factors. Each item is divided into some categories, and the contribution of each item is expressed as category scores and item range. A positive value of category score indicates that the corresponding category will promote occurrences of landslides. On the other hands, negative values indicate that the corresponding category will restrain landslides. The order of contribution to landslide occurrence was judged from the item range. The larger the item range, the more contribution to occurrences of landslides.
4. Result
4.1. Landslides
The landslides detected in 2010 and 2021 are shown in Figure 5. Landslides were concentrated in a small area during the 2010 landslides, while landslides were spread over a large area in the 2021 landslides.
In the 2010 landslides, 415 landslides were detected using the maximum likelihood method, and 348 landslides, after visual checking. In the 2021 landslides, 13,409 landslides were detected using GSI analysis, and 910 landslides, after visual checking (Table 2). It took one person 15 days to visually check the landslide areas. A total of 240 landslides were follow-up landslides, and 670 landslides were new ones. The number of actual landslides was less than 7% of the detected landslides when using GSI analysis in the 2021 landslides, because satellite images were taken immediately (5 days) after landslide occurrences, and sediment flowed areas were also recognized as landslide areas.
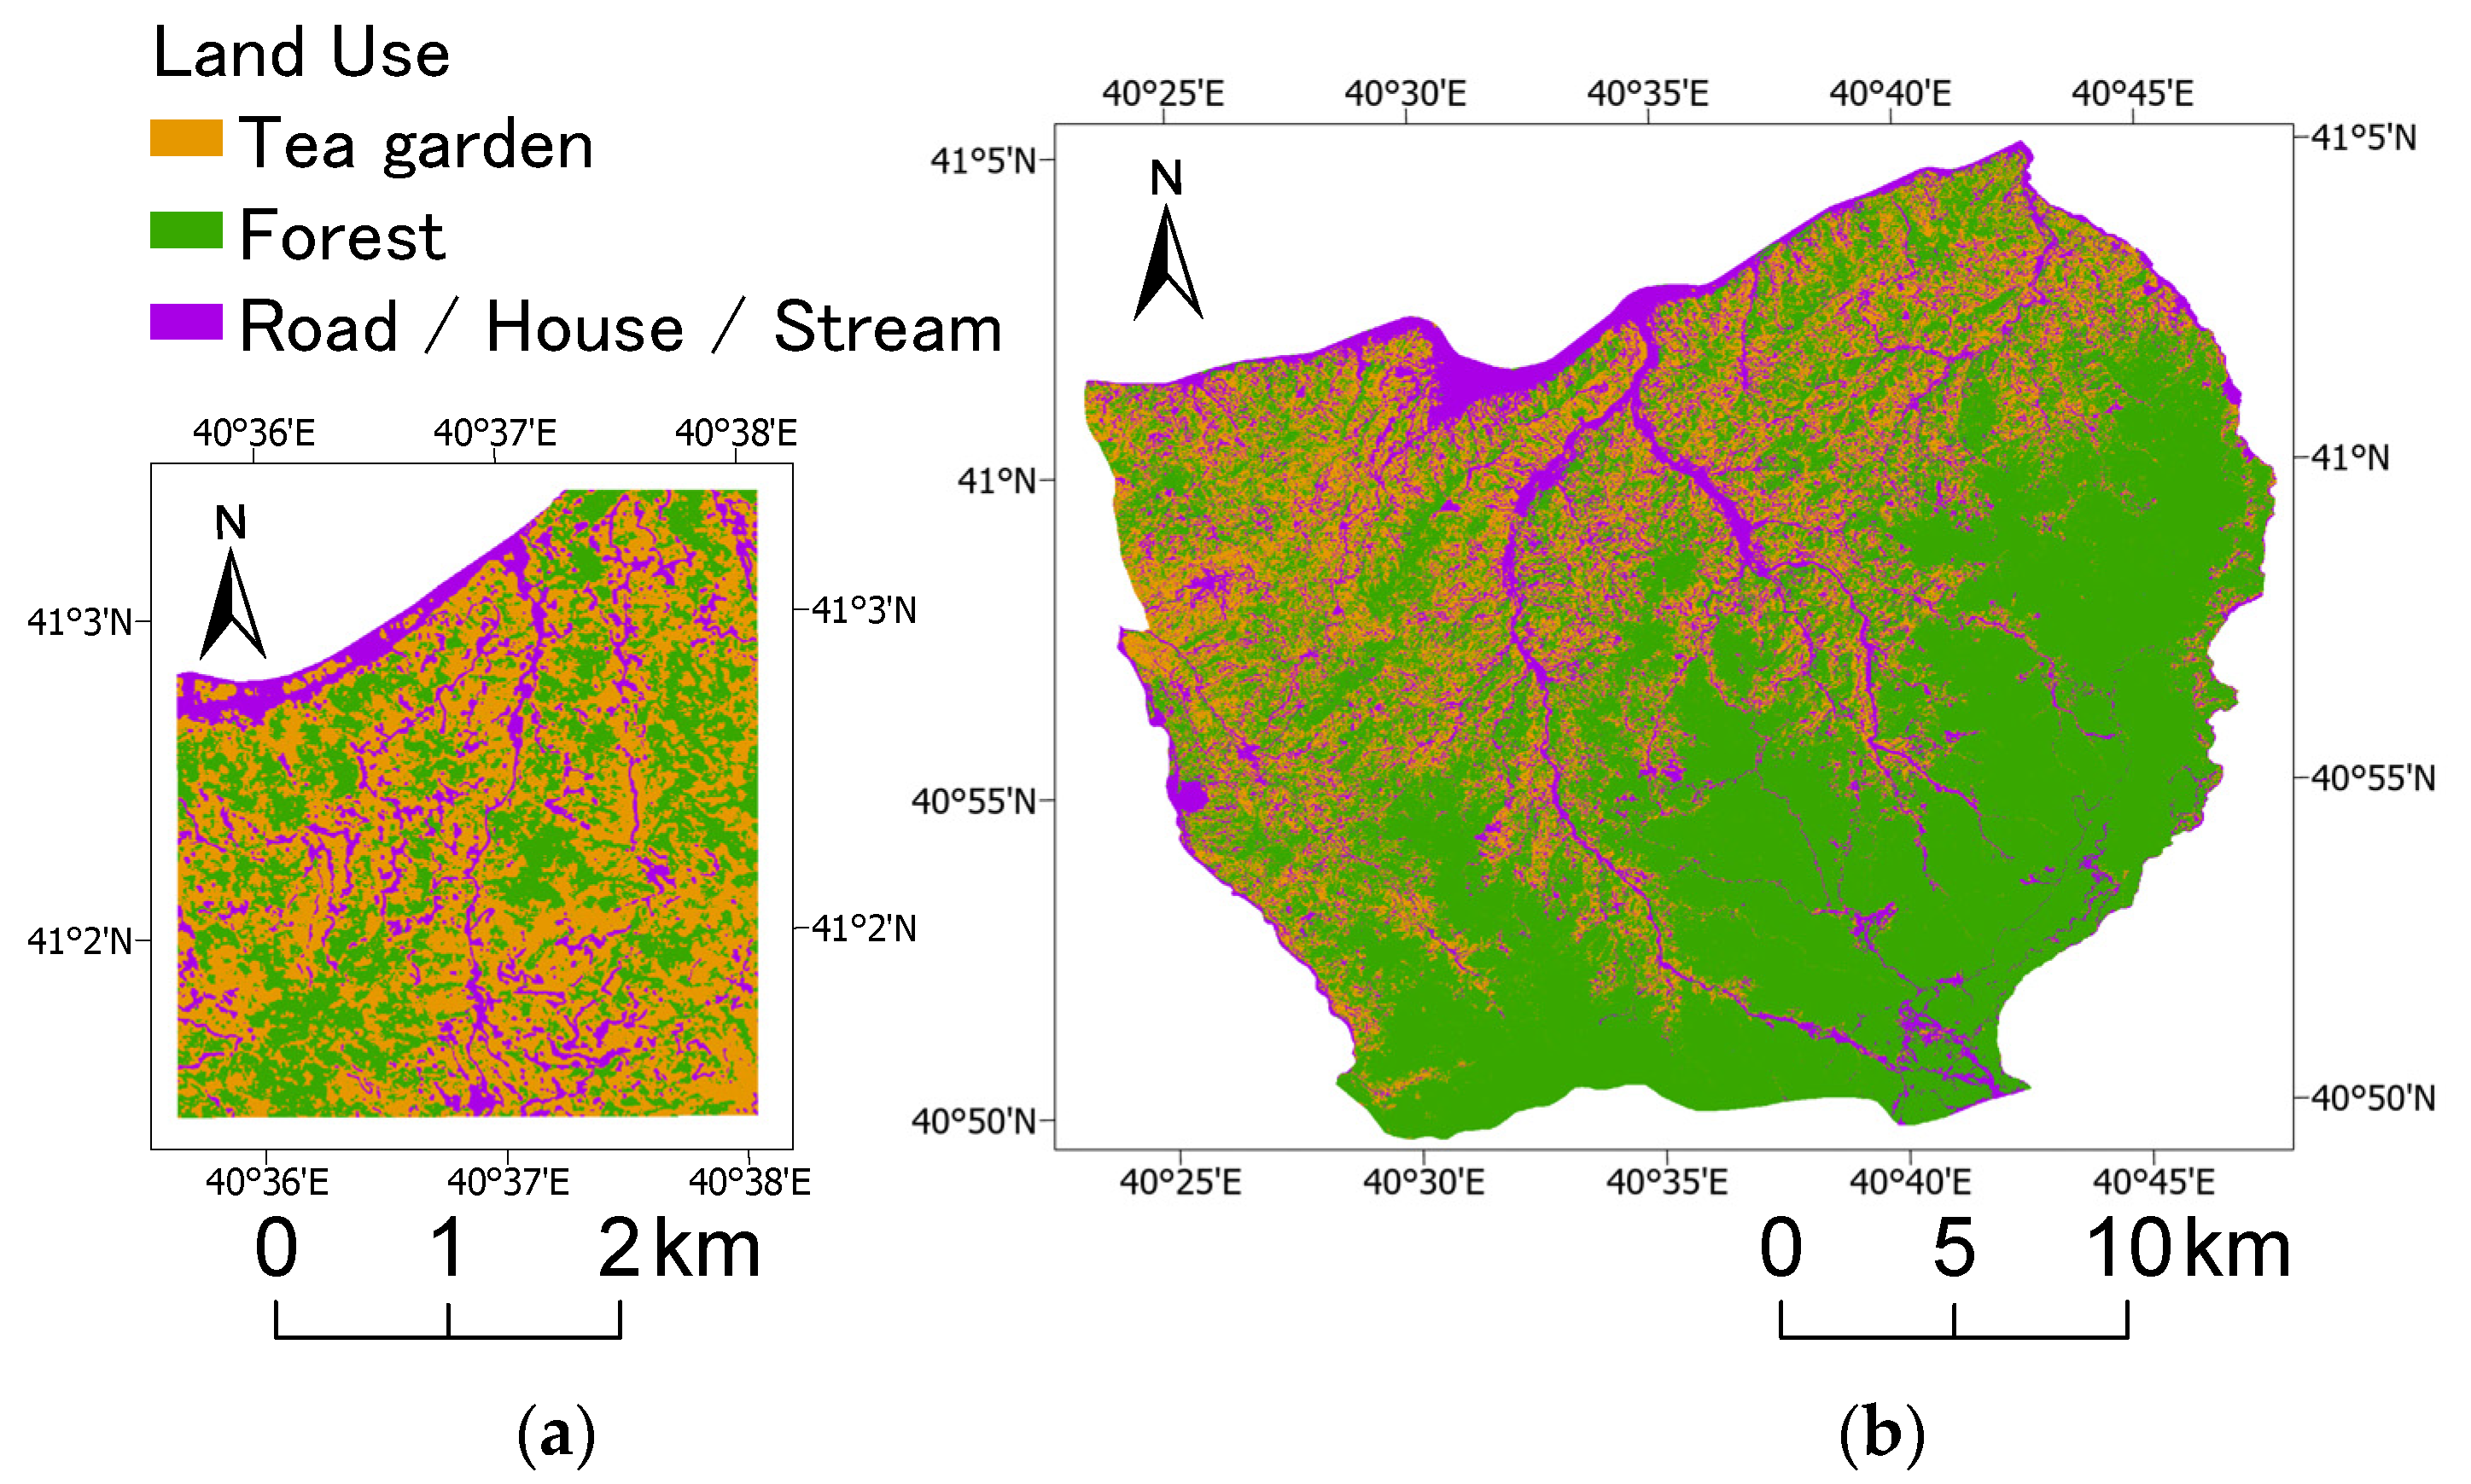
4.2. Land Use
The classified land use in 2010 and 2021 is shown in Figure 6. The land use classification accuracy assessment was performed in the multiple test area. Google Earth images were used for creating the ground truth data. To verify the land use classification accuracy, the homologous points in the land use map and in Google Earth images were compared directly. Confusion matrices were created to calculate the overall accuracy, user’s accuracy, producer’s accuracy, and kappa coefficient (Table 3 and Table 4). These statistical accuracy assessments provide a measure of confidence in the satellite image classification. Each column of the confusion matrix represents a ground truth data, and the values in the column correspond to the land use classification of the ground truth points. The results indicated overall accuracies of 78.6% and 75.1%, and a kappa coefficient of 0.61 and 0.53 for the classified images of 2010 and 2021, respectively. Although the accuracies were lower than the recommended level [50], it was considered sufficiently accuracy to determine the percentages of each land use type in a large area.
4.3. Relationship between Landslide, Land Use, and Other Landslide Contributing Factors
The landslide area ratio in the tea gardens was 1.75 times higher than in forests in the 2010 landslides, and five times higher than in forests, in the 2021 landslides (Table 5). Landslides were more likely to occur in the tea gardens than in the forests, regardless of rainfall events.
The relationship between the slope angle and landslides was analyzed in the tea gardens and forest (Table 6). In the tea garden, the landslide area ratio increased as the slope angle increased. The landslide area ratio reached a peak value at a slope angle of 20–30° in the 2010 landslide, and 30–40° in the 2021 landslide. This result was the same as Yalcin [51], which indicated that almost all of the landslides occurred at angles ranging over 10–40° in the eastern part of Rize. However, in the forest, there was no relation between the slope angle and the landslide area ratio. Therefore, in the slope range of 30–40°, the landslide area ratio in the tea gardens was 3.5 times more than in the forest in the 2010 landslide, and 9.1 times more than in the forest in the 2021 landslide.
Landslide distribution and two-days rainfall distribution in the 2021 landslides are shown in Figure 7. Rainfall data were lacking in the western part of the study area, so it was not possible to interpolate the accumulated rainfall. Figure 7 shows that the landslide concentrated area and the rainfall concentrated area were almost the same. With less than 120 mm 48-hr rainfall, the landslide area ratio in both the tea gardens and the forest was very low (<0.02%; Table 7). It is only in the tea gardens that the landslide area ratio increased significantly when 48-hr rainfall exceeded 120 mm, and the landslide area ratio increased with increasing rainfall. On the other hand, in the forest, the landslide area ratio increased significantly when the 48-hr rainfall exceeded 160 mm. There was a smaller number of rainfall-induced landslides in the tea gardens compared with the forest.
The dependence of each landslide conditioning factor on the occurrence of landslides was analyzed in the area shown in Figure 8. Our preliminary analysis revealed that land use, slope angle, distance to the first- or second-order drainage line, and flow accumulation (i.e., how much area drains water to a given point) are major factors for landslide occurrence. Therefore, these four factors were chosen as items (landslide contributing factor) for analysis using quantification theory type II. The result of quantification theory type II is shown in Table 8. Each landslide conditioning factor can be quantified on the basis of the category score and the item range.
The discriminative ratio was 58.3%. Judging from the range of the category scores, it is clear that land use was the most critical factor for landslide occurrence.
5. Discussion
5.1. Landslide Detection and Land Use Classification
Regarding landslide detection, landslide detection using the maximum likelihood method gave much fewer mis-detections than GSI analysis. However, it is necessary to provide training data of the landslide area to detect landslides when using the maximum likelihood method. Immediately after a landslide occurs, it is not possible to obtain Google Earth images that clearly show the landslide area that are necessary for creating training data. Therefore, to detect landslides soon after a disaster, it is a more effective method to detect landslides using GSI analysis and then to select actual landslide areas using visual checking with another satellite image.
In this study, landslide assessment was conducted without a field survey. The accuracy of landslide detection using the change detection method and land use classification using the RF method were not high. However, visual verification after these measurements enabled us to efficiently generate the landslide distribution map and the land use map.
In countries where quantitative landslide assessment is still inadequate, it is important to objectively reveal the characteristics of landslides, even while using a less accurate method. In addition, to develop studies on landslides, it is essential to accumulate landslide historical data, land use data, and rainfall distribution data, and to make them available to the public [52].
5.2. Landslides and Tea Gardens
It is clear that in tea gardens landslides are more likely to occur in Rize. Some differences might relate to landslide occurrences between tea gardens and forests:
- Tea roots are approximately 50 cm in depth [53]. On the other hand, field research on rainfall-triggered landslides in another district of Rize (Kaptanpasa) with a similar geology as that of this study revealed that the mean depth of landslides is 1.05 m, and 98% of the landslides were less than 3 m in depth [54]. The depth of the slip surface of typical landslides around the study area tends to be deeper than the depth of the tea roots. Even if the tea roots penetrate the slip surface of a landslide, they would have little effect on retaining the landslide occurrence.
- Yüksek et al. [33] indicates that the average saturated hydraulic conductivity from the surface to 50 cm depth is 8.5 mm/h in the tea garden, and 24.7 mm/h in the forest [33]. Üyetürk [55] indicates that the saturated hydraulic conductivity in the tea gardens are in range of 0.54 to 3.96 mm/h. Therefore, it is easy to saturate the surface soil layer in the tea gardens, and greater surface flow can occur in the tea gardens than in the the forest. Yalcin [56] mentions that surface runoff is one of the primary factors leading to a landslide. In addition, some studies have reported that in order to reduce landslide incidences in tea gardens, it is important to make a proper drainage system that can collect rainfall and prevent its infiltration into the soil [8,13,14,56].
- In terms of the soil properties of the tea gardens and the forest, Yüksek et al. [33] indicates that saturated hydraulic conductivity, porosity, soil organic matter, plant available water, and total N are significantly different. The introduction of cultivation techniques using fertilizers has affected soil properties.
However, it is still not comprehensively clear how these differences affect landslide occurrence in the tea gardens. Clarification on the mechanism of landslides in tea gardens is required for future studies.
5.3. Landslides in Tea Gardens in Rize and Other Regions
Japan is also a tea-producing country, and one of the most landslide-prone countries in the world. Heavy rainfalls occur frequently and induce landslides. Heavy rainfall over 11 August 2021–15 August 2021 induced more than 80 landslides in tea gardens in Ureshino city, Saga prefecture (33°06′2″ N and 130°03′31″ E). The accumulated rainfall was 1178 mm, which was four times higher than the average August monthly precipitation [57]. In addition, heavy rainfall on 14 July 2012 induced some landslides in the tea gardens, and more than 40 ha of tea gardens were damaged in Yame city, Fukuoka prefecture (33°21′19″ N latitude and 130°55′79″) [58]. The daily rainfall was 415 mm, which was the highest record in Yame city [59]. However, landslides in forests have been reported much more frequently than in tea gardens in Japan [60,61]. Some differences might relate to the landslide occurrence between the tea gardens in Rize and in Japan:
- A total of 72% of tea gardens were on ground that was inclined more than 15° in Rize. On the other hand, only 32% of tea gardens were on slopes steeper than 15° in Japan [62]. In short, many more tea gardens are on a steep slope in Rize. In addition, the steeper the slope angle, the higher the landslide area ratio, both for Rize and for Japan. However, the landslide area ratio achieves a peak value of around 25–30° in tea gardens in Rize, while it is generally 30–35° in Japan [63]. This means that more landslides tend to occur on smaller slope angle in Rize, as compared to Japan. The synergistic effects of these two differences between Rize and Japan might be the reason for why a collapse is more likely to occur in tea gardens in Rize than in Japanese tea gardens.
- In Japan, it is common practice to pile up stone walls in tea gardens with steep slopes to prevent soil erosion and to stabilize slopes. However, in Türkiye, it seems that such landslide prevention measures are not thoroughly implemented in tea gardens.
However, it is still not clear how the tea gardens in Rize differ from those in Japan, and what the crucial difference are for landslide occurrence. It would be useful, in considering effective landslide mitigation measures in Türkiye, to clarify the differences between tea gardens in Rize and in Japan.
6. Conclusions
This study aimed to quantitatively assess the relationships between land use and landslides, using globally available data. The landslide distribution map and land use map in Rize were prepared using globally available satellite images and Google Earth images. Additionally, it was found that landslides were 1.75 to 5 times more likely to occur in the tea gardens than in the forest. In addition, less rainfall triggers landslides in the tea gardens than in the forest. In addition, the landslide area ratio dramatically increases when the 48-hr rainfall exceeds 120 mm in the tea gardens and 160 mm in the forest. Additionally, in steep sloped areas (where the slope angle is 30–40°), landslides were 3.5 to 9.1 times more likely to occur in the tea gardens than in the forest.
Even if there are no landslide historical records, it is possible to create a landslide distribution map and to quantitatively assess landslide susceptibility using rather high resolution satellite images and Google Earth images, or alternative images. Therefore, there is a possibility for conducting landslide assessments quantitatively in any location, where those images mentioned above are available.
Author Contributions
Conceptualization, Y.G.; investigation, N.K. writing—original draft preparation, N.K.; writing—review and editing, Y.G. and N.H.; supervision, Y.G. funding acquisition, Y.G. All authors have read and agreed to the published version of the manuscript.
Funding
This research was funded by the Asia Air Survey Co., Ltd., Japan.
Acknowledgments
This study was originally initiated as part of the short-term scientific visits via MEXT Re-Inventing Japan Project (Türkiye) GLocal Age 2020, “Global Disaster Risk and Recovery Program”. We appreciate the international collaboration atmosphere provided with this project.
Conflicts of Interest
The authors declare no conflict of interest.
References
- Froude, M.; Petley, D. Global Fatal Landslide Occurrence from 2004 to 2016. Nat. Hazards Earth Syst. Sci. 2018, 18, 2161–2181. [Google Scholar] [CrossRef] [Green Version]
- Dai, F.C.; Lee, C.F.; Li, J.; Xu, Z.W. Assessment of Landslide Susceptibility on the Natural Terrain of Lantau Island, Hong Kong. Environ. Geol. 2001, 40, 381–391. [Google Scholar] [CrossRef]
- Ercanoglu, M.; Gokceoglu, C. Assessment of Landslide Susceptibility for a Landslide-Prone Area (North of Yenice, NW Türkiye) by Fuzzy Approach. Environ. Geol. 2002, 41, 720–730. [Google Scholar] [CrossRef]
- Reis, S. Analyzing Land Use/Land Cover Changes Using Remote Sensing and GIS in Rize, North-East Türkiye. Sensors 2008, 8, 6188–6202. [Google Scholar] [CrossRef]
- Chen, C.Y.; Huang, W.L. Land Use Change and Landslide Characteristics Analysis for Community-Based Disaster Mitigation. Environ. Monit. Assess. 2013, 185, 4125–4139. [Google Scholar] [CrossRef]
- Carrión-Mero, P.; Montalván-Burbano, N.; Morante-Carballo, F.; Quesada-Román, A.; Apolo-Masache, B. Worldwide Research Trends in Landslide Science. Int. J. Environ. Res. Public Health 2021, 18, 9445. [Google Scholar] [CrossRef]
- Karsli, F.; Atasoy, M.; Yalcin, A.; Reis, S.; Demir, O.; Gokceoglu, C. Effects of Land-Use Changes on Landslides in a Landslide-Prone Area (Ardesen, Rize, NE Türkiye). Environ. Monit. Assess. 2009, 156, 241–255. [Google Scholar] [CrossRef]
- Filiz, M.; Avcı, H.; Usta, P. Heyelanların Yerleşim Alanlarına Etkilerinin İncelenmesi (Rize-Gündoğdu Örneği). E-J. New World Sci. Acad. Eng. Sci. 2011, 6, 1200–1211. (In Turkish) [Google Scholar]
- Yunus, A.P.; Fan, X.; Subramanian, S.S.; Jie, D.; Xu, Q. Unraveling the Drivers of Intensified Landslide Regimes in Western Ghats, India. Sci. Total Environ. 2021, 770, 145357. [Google Scholar] [CrossRef]
- Senanayake, S.; Pradhan, B.; Huete, A.; Brennan, J. Assessing Soil Erosion Hazards Using Land-Use Change and Landslide Frequency Ratio Method: A Case Study of Sabaragamuwa Province, Sri Lanka. Remote Sens. 2020, 12, 1483. [Google Scholar] [CrossRef]
- Perera, E.N.C.; Jayawardana, D.T.; Ranagalage, M.; Jayasinghe, P. Spatial Multi Criteria Evaluation (SMCE) Model for Landslide Hazard Zonation in Tropical Hilly Environment: A Case Study from Kegalle. Geoinfor. Geostat. Overv. 2018, S3. [Google Scholar] [CrossRef]
- Vasantha Kumar, S.; Bhagavanulu, D.V.S. Effect of Deforestation on Landslides in Nilgiris District—A Case Study. J. Indian Soc. Remote Sens. 2008, 36, 105–108. [Google Scholar] [CrossRef]
- Hacisalihoglu, S.; Gumus, S.; Kezik, U. Land Use Conversion Effects Triggered by Tea Plantation on Landslide Occurence and Soil Loss. Fresenius Environ. Bull. 2018, 27, 2933–2942. [Google Scholar]
- Yalcin, A. Environmental Impacts of Landslides: A Case Study from East Black Sea Region, Türkiye. Environ. Eng. Sci. 2007, 24, 821–833. [Google Scholar] [CrossRef]
- Dai, F.C.; Lee, C.F.; Ngai, Y.Y. Landslide Risk Assessment and Management: An Overview. Eng. Geol. 2002, 64, 65–87. [Google Scholar] [CrossRef]
- Corominas, J.; van Westen, C.; Frattini, P.; Cascini, L.; Malet, J.P.; Fotopoulou, S.; Catani, F.; Van Den Eeckhaut, M.; Mavrouli, O.; Agliardi, F.; et al. Recommendations for the Quantitative Analysis of Landslide Risk. Bull. Eng. Geol. Environ. 2014, 73, 209–263. [Google Scholar] [CrossRef]
- Lee, E.M. Landslide Risk Assessment: The Challenge of Estimating the Probability of Landsliding. Q. J. Eng. Geol. Hydrogeol. 2009, 42, 445–458. [Google Scholar] [CrossRef]
- Aleotti, P.; Chowdhury, R. Landslide Hazard Assessment: Summary Review and New Perspectives. Bull. Eng. Geol. Environ. 1999, 58, 21–44. [Google Scholar] [CrossRef]
- Quesada Román, A. Landslides and Floods Zonation Using Geomorphological Analyses in a Dynamic Basin of Costa Rica. Rev. Cart. 2021, 102, 125–138. [Google Scholar] [CrossRef]
- Quesada-Román, A. Landslide Risk Index Map at the Municipal Scale for Costa Rica. Int. J. Disaster Risk Reduct. 2021, 56, 102144. [Google Scholar] [CrossRef]
- van Westen, C.J.; van Asch, T.W.J.; Soeters, R. Landslide Hazard and Risk Zonation—Why Is It Still so Difficult? Bull. Eng. Geol. Environ. 2006, 65, 167–184. [Google Scholar] [CrossRef]
- Castellanos Abella, E.A.; Van Westen, C.J. Qualitative Landslide Susceptibility Assessment by Multicriteria Analysis: A Case Study from San Antonio Del Sur, Guantánamo, Cuba. Geomorphology 2008, 94, 453–466. [Google Scholar] [CrossRef] [Green Version]
- Gaprindashvili, G.; Guo, J.; Daorueang, P.; Xin, T.; Rahimy, P. A New Statistic Approach towards Landslide Hazard Risk Assessment. Int. J. Geosci. 2014, 5, 38–49. [Google Scholar] [CrossRef] [Green Version]
- Harp, E.L.; Reid, M.E.; McKenna, J.P.; Michael, J.A. Mapping of Hazard from Rainfall-Triggered Landslides in Developing Countries: Examples from Honduras and Micronesia. Eng. Geol. 2009, 104, 295–311. [Google Scholar] [CrossRef]
- Đurić, D.; Mladenović, A.; Pešić-Georgiadis, M.; Marjanović, M.; Abolmasov, B. Using Multiresolution and Multitemporal Satellite Data for Post-Disaster Landslide Inventory in the Republic of Serbia. Landslides 2017, 14, 1467–1482. [Google Scholar] [CrossRef]
- Hong, Y.; Adler, R.; Huffman, G. Use of Satellite Remote Sensing Data in the Mapping of Global Landslide Susceptibility. Nat. Hazards 2007, 43, 245–256. [Google Scholar] [CrossRef] [Green Version]
- Tofani, V.; Segoni, S.; Agostini, A.; Catani, F.; Casagli, N. Use of Remote Sensing for Landslide Studies in Europe. Nat. Hazards Earth Syst. Sci. 2013, 13, 299–309. [Google Scholar] [CrossRef]
- Guzzetti, F.; Mondini, A.C.; Cardinali, M.; Fiorucci, F.; Santangelo, M.; Chang, K.T. Landslide Inventory Maps: New Tools for an Old Problem. Earth-Science Rev. 2012, 112, 42–66. [Google Scholar] [CrossRef] [Green Version]
- Casagli, N.; Fanti, R.; Nocentini, M.; Righini, G. Assessing the Capabilities of VHR Satellite Data for Debris Flow Mapping in the Machu Picchu Area (C101-1); Sassa, K., Fukuoka, H., Wang, F., Wang, G., Eds.; Landslides; Springer: Berlin/Heidelberg, Germany, 2005. [Google Scholar] [CrossRef]
- Planet Team. Planet Application Program Interface: In Space for Life on Earth. Available online: https://api.planet.com (accessed on 15 March 2022).
- Görüm, T.; Fidan, S. Spatiotemporal Variations of Fatal Landslides in Türkiye. Landslides 2021, 18, 1691–1705. [Google Scholar] [CrossRef]
- Ercisli, S. The Tea Industry and Improvements in Türkiye. In Global Tea Breeding; Advanced Topics in Science and Technology in China; Springer: Berlin/Heidelberg, Germany, 2012. [Google Scholar] [CrossRef]
- Yüksek, T.; Göl, C.; Yüksek, F.; Yüksel, E.E. Long-Term Effects of Conversion From Natural Forest to Tea Cultivation on Soil Properties: Humid Northern Black Sea Region. Afr. J. Agric. Res. 2018, 4, 665–674. [Google Scholar] [CrossRef]
- AFAD. Rize’de Meydana Gelen Aşırı Yağışlar Hakkında. Turkish Disaster and Emergency Management Directorate. Available online: https://www.afad.gov.tr/rizede-meydana-gelen-asiri-yagislar-hakkinda# (accessed on 17 July 2021).
- TSMS. İllere Ait Mevsim Normalleri (1991–2020). Turkish State Meteorological Service of Ministry of Agriculture and Forestry. Available online: https://www.mgm.gov.tr/veridegerlendirme/il-ve-ilceler-istatistik.aspx?m=RIZE (accessed on 18 January 2022).
- AFAD. Ministers Soylu, Kurum and Karaismailoğlu Visit Areas Hit by Flood and Landslide in Riz. Turkish Disaster and Emergency Management Directorate. Available online: https://en.afad.gov.tr/ministers-soylu-kurum-and-karaismailoglu-visit-areas-hit-by-flood-and-landslide-in-rize (accessed on 4 August 2021).
- Yılmaz, S. Rize Bölgesel Heyelan ve Sel Afeti Müdahale ve Iyileştirme Çalışmalar; Unpublished presentation: Rize, Türkiye, 2010. (In Turkish) [Google Scholar]
- Turkish General Directorate of Mineral Research and Exploration. Geological Map of Türkiye TRABZON. Available online: https://www.mta.gov.tr/en/maps/geological-500000 (accessed on 8 December 2021).
- AFAD. Heyelan Albümü. Turkish Disaster and Emergency Management Directorate. Available online: https://heysemp.afad.gov.tr/tr/26149/Heyelan-Albumu (accessed on 22 April 2022).
- TSMS. Gerçekleşen Toplam Yağışlar. Turkish State Meteorological Service of Ministry of Agriculture and Forestry. Available online: https://www.mgm.gov.tr/sondurum/toplam-yagis.aspx (accessed on 17 July 2021).
- Li, Z.; Shi, W.; Myint, S.W.; Lu, P.; Wang, Q. Semi-Automated Landslide Inventory Mapping from Bitemporal Aerial Photographs Using Change Detection and Level Set Method. Remote Sens. Environ. 2016, 175, 215–230. [Google Scholar] [CrossRef]
- Xiao, J.; Shen, Y.; Tateishi, R.; Bayaer, W. Development of Topsoil Grain Size Index for Monitoring Desertification in Arid Land Using Remote Sensing. Int. J. Remote Sens. 2006, 27, 2411–2422. [Google Scholar] [CrossRef]
- Breiman, L. Random Forests. Mach. Learn. 2001, 45, 5–32. [Google Scholar] [CrossRef] [Green Version]
- Akar, Ö.; Güngör, O. Classification of Multispectral Images Using Random Forest Algorithm. J. Geod. Geoinf. 2012, 1, 105–112. [Google Scholar] [CrossRef] [Green Version]
- Talukdar, S.; Singha, P.; Mahato, S.; Pal, S.; Liou, Y.A.; Rahman, A. Land-Use Land-Cover Classification by Machine Learning Classifiers for Satellite Observations—A Review. Remote Sens. 2020, 12, 1135. [Google Scholar] [CrossRef] [Green Version]
- Abdullah, A.Y.M.; Masrur, A.; Gani Adnan, M.S.; Al Baky, M.A.; Hassan, Q.K.; Dewan, A. Spatio-Temporal Patterns of Land Use/Land Cover Change in the Heterogeneous Coastal Region of Bangladesh between 1990 and 2017. Remote Sens. 2019, 11, 790. [Google Scholar] [CrossRef] [Green Version]
- Giles, P.T. Remote Sensing and Cast Shadows in Mountainous Terrain. Photogramm. Eng. Remote Sens. 2001, 67, 833–839. [Google Scholar]
- Sood, V.; Singh, S. Analytical Analysis of Shadow Removing Algorithms over Land Use and Land Cover Classification. Himal. Geol. 2018, 39, 223–232. [Google Scholar]
- Jiang, Y.; Wang, C.; Zhao, X. Damage Assessment of Tunnels Caused by the 2004 Mid Niigata Prefecture Earthquake Using Hayashi’s Quantification Theory Type II. Nat. Hazards 2010, 53, 425–441. [Google Scholar] [CrossRef] [Green Version]
- Foody, G.M. Status of Land Cover Classification Accuracy Assessment. Remote Sens. Environ. 2002, 80, 185–201. [Google Scholar] [CrossRef]
- Yalcin, A. GIS-Based Landslide Susceptibility Mapping Using Analytical Hierarchy Process and Bivariate Statistics in Ardesen (Türkiye): Comparisons of Results and Confirmations. Catena 2008, 72, 1–12. [Google Scholar] [CrossRef]
- Reis, S.; Bayrak, T.; Yalçın, A.; Atasoy, M.; Nişancı, R.; Ekercin, S. Rize Bölgesinde Yağış Heyelan İlişkisi. Jeodezi JeoInf. Arazi Yönetimi Derg. 2008, 2, 5–9. (In Turkish) [Google Scholar]
- Uyeturk, C.E.; Huvaj, N.; Bayraktaroglu, H.; Huseyinpasaoglu, M. Geotechnical Characteristics of Residual Soils in Rainfall-Triggered Landslides in Rize, Türkiye. Eng. Geol. 2020, 264, 105318. [Google Scholar] [CrossRef]
- Muhammet, D. Physically-Based Modeling of Rainfall-Triggered Landslides in Kaptanpasa, Rize. Master’s Thesis, Middle East Technical University, Çankaya/Ankara, Türkiye, 2022. [Google Scholar]
- Üyetürk, C.E. Geotechnical Characterization of Soils Prone to Rainfall-Induced Landslides in Rize (Northern Türkiye). Master’s Thesis, Middle East Technical University, Çankaya/Ankara, Türkiye, 2019. [Google Scholar]
- Yalcin, A. The Effects of Clay on Landslides: A Case Study. Appl. Clay Sci. 2007, 38, 77–85. [Google Scholar] [CrossRef]
- Saga Local Meteorological Office, JMA. Heavy Rainfall in Saga Prefecture 11/8/2021–19/8/2021. Available online: https://www.jma-net.go.jp/fukuoka/chosa/saigai/20210906_saga.pdf (accessed on 19 May 2022).
- Asahiro, K.; Kanekiyo, H.; Tani, M. Research into the distribution of damage to farmland in Yame City, Fukuoka Prefecture, from the heavy rains in the northern part of Kyushu in 2012, and difficulties for the recovery. J. Jpn. Inst. Landsc. Archit. 2014, 77, 649–654. [Google Scholar] [CrossRef] [Green Version]
- Hukuoka Region Headquarters, JMA. North Kyushu Heavy Rainfall Event of July 2012. Available online: https://www.jma-net.go.jp/fukuoka/chosa/kisho_saigai/20120711-14.pdf. (accessed on 19 May 2022).
- Miyabuchi, Y.; Torii, M. Landslide Disaster Triggered by July 2020 Heavy Rainfall in the Southern Part of Kumamoto Prefecture, Southwestern Japan. J. Geogr. 2021, 130, 107–116. [Google Scholar] [CrossRef]
- Kaibori, M.; Hasegawa, Y.; Yamashita, Y.; Sakida, H.; Nakai, S.; Kuwada, S.; Hiramatsu, S.; Jitousono, T.; Irasawa, M.; Shimizu, O.; et al. Sediment Related Disaster Due to Heavy Rainfall in Hiroshima Prefecture in July, 2018. J. Jpn. Soc. Eros. Control Eng. 2018, 71, 49–60. [Google Scholar] [CrossRef]
- Sugawara, J. Landslides in Tea Plantation Fields in Shizuoka, Japan. Int. J. GEOMATE 2013, 4, 495–500. [Google Scholar] [CrossRef]
- Yajima, Y.; Sasaki, Y.; Kurahashi, T. Analysis of Disaster Features Using Slope Disaster Database of National Roads. J. Jpn. Soc. Eng. Geol. 2008, 48, 304–311. [Google Scholar] [CrossRef]
Figure 1.
Location map of study area.

Figure 2.
Distribution of the slope angle in the study area.

Figure 5.
Landslide distribution map (yellow and red lines indicate each landslide area; satellite image is acquired from PlanetScope [30]).
Figure 5.
Landslide distribution map (yellow and red lines indicate each landslide area; satellite image is acquired from PlanetScope [30]).

Figure 6.
Land use map (a) in 2010 and (b) 2021.

Figure 7.
Landslide distribution and two-days rainfall distribution in 2021 (data from TSMS).

Figure 8.
Quantification theory type II analysis of the area (satellite image is acquired from PlanetScope [30]).
Figure 8.
Quantification theory type II analysis of the area (satellite image is acquired from PlanetScope [30]).


Table 1.
Satellite data used for landslide detection and land use classification.
| Landslide Event | Mission | Resolution after Processing | Sensor Type | Spectral Bands (nm) | Acquisition Date | |
|---|---|---|---|---|---|---|
| Pre-Event | Post-Event | |||||
| 26 August 2010 | RapidEye | 5 m | MS | B (440–510) | 22 Jun 2010 | 16 May 2011 |
| G (520–590) | ||||||
| R (630–685) | ||||||
| Red Edge (690–730) | ||||||
| NIR (760–860) | ||||||
| 14 July 2021 | PlanetScope | 4.1 m | MS | B (455–515) | 3 July 2021 | 19 July 2021 |
| G (500–590) | 27 August 2021 | |||||
| R (590–670) | ||||||
| NIR (780–860) | ||||||
Table 2.
Landslides that occurred in 2010 and 2021.
| 26 August 2010 | 14 July 2021 | ||
|---|---|---|---|
| Number of landslides | Before visual check | 415 | 13,409 |
| After visual check | 348 | 910 | |
| Landslide area (m2) | 291,556 | 648,229 | |
| Minimum landslide area (m2) | 104.9 | 104.1 | |
| Maximum landslide area (m2) | 15,720.7 | 8378.2 | |
| Study area (km2) | 10.65 | 683.06 | |
Table 3.
Confusion matrix between ground truth and classified land use in 2010.
| Ground Truth Data | SUM | User’s Accuracy | |||
|---|---|---|---|---|---|
| Classified | Tea Garden | Forest | Road/House/Stream | ||
| Tea garden | 3663 | 589 | 205 | 4457 | 82.2% |
| Forest | 371 | 1246 | 8 | 1625 | 76.7% |
| Road/House/Stream | 287 | 84 | 747 | 1118 | 66.8% |
| SUM | 4321 | 1919 | 960 | 7200 | |
| Producer’s accuracy | 84.8% | 64.9% | 77.8% | ||
| Overall accuracy | 78.6% | ||||
| Kappa coefficient | 0.61 | ||||
Table 4.
Confusion matrix between ground truth and classified land use in 2021.
| Ground Truth Data | SUM | User’s Accuracy | |||
|---|---|---|---|---|---|
| Classified | Tea Garden | Forest | Road/House/Stream | ||
| Tea garden | 16,051 | 5110 | 1403 | 22,564 | 71.1% |
| Forest | 7780 | 35,244 | 921 | 43,945 | 80.2% |
| Road/House/Stream | 1809 | 806 | 2419 | 5034 | 48.1% |
| SUM | 25,640 | 41,160 | 4743 | 71,543 | |
| Producer’s accuracy | 62.6% | 85.6% | 51.0% | ||
| Overall accuracy | 75.1% | ||||
| Kappa coefficient | 0.53 | ||||
Table 5.
Landslides in each land use area in 2010 and in 2021.
| Total Area (ha) | Landslide Area (ha) | Landslide Area Ratio (%) | ||
|---|---|---|---|---|
| 2010 | Tea garden | 366.08 | 13.57 | 3.71 |
| Forest | 223.20 | 4.73 | 2.12 | |
| Road/House/Stream | 94.11 | 0.41 | 0.43 | |
| 2021 | Tea garden | 17,748.30 | 29.11 | 0.16 |
| Forest | 42,879.02 | 14.23 | 0.03 | |
| Road/House/Stream | 9647.04 | 2.58 | 0.03 |
Table 6.
Landslides and slope angles in each land use area in 2010 and in 2021.
| Area (ha) | Landslide Area (ha) | Landslide Area Ratio (%) | |||||
|---|---|---|---|---|---|---|---|
| Slope Angle (°) | Tea Garden | Forest | Tea Garden | Forest | Tea Garden | Forest | |
| 2010 | 0–10 | 52.6 | 12.2 | 1.36 | 0.40 | 2.584 | 3.303 |
| 10–20 | 222.5 | 93.1 | 7.18 | 2.08 | 3.226 | 2.236 | |
| 20–30 | 236.8 | 173.5 | 10.39 | 4.11 | 4.386 | 2.367 | |
| 30–40 | 57.4 | 67.9 | 2.22 | 0.75 | 3.875 | 1.109 | |
| 40– | 1.30 | 1.30 | 0.02 | 0.02 | 1.566 | 1.793 | |
| 2021 | 0–10 | 3197.3 | 2767.3 | 1.28 | 0.93 | 0.040 | 0.034 |
| 10–20 | 10,505.3 | 13,170.5 | 9.59 | 4.23 | 0.091 | 0.032 | |
| 20–30 | 9925.1 | 27060.3 | 23.61 | 10.09 | 0.238 | 0.037 | |
| 30–40 | 3698.8 | 21283 | 10.15 | 6.40 | 0.274 | 0.030 | |
| 40– | 336.1 | 2550.3 | 0.75 | 0.54 | 0.222 | 0.021 | |
Table 7.
Landslide area ratio and cumulative rainfall in 2021 (data from TSMS).
| Landslide Area Ratio (%) | ||
|---|---|---|
| 48-hr Rainfall (mm) | Tea Garden | Forest |
| –100 | 0.003 | 0.000 |
| 100–120 | 0.006 | 0.009 |
| 120–140 | 0.050 | 0.011 |
| 140–160 | 0.062 | 0.009 |
| 160–180 | 0.188 | 0.045 |
| 180–200 | 0.346 | 0.096 |
| 200–220 | 0.561 | 0.162 |
Table 8.
Result of quantification theory type II analysis.
| Item | Category | Category Score | Range |
|---|---|---|---|
| Land use | Tea garden | 1.066 | 1.602 |
| Forest | −0.536 | ||
| Road/House/Stream | −0.511 | ||
| Slope angle | 0°–10° | −0.847 | 1.276 |
| 10°–20° | −0.454 | ||
| 20°–30° | 0.429 | ||
| 30°– | −0.010 | ||
| Flow accumulation | 0 | −0.162 | 0.924 |
| 0–5 | −0.076 | ||
| 5–10 | 0.036 | ||
| 10–20 | −0.062 | ||
| 20–100 | 0.227 | ||
| 100– | 0.762 | ||
| Distance to first or second drainage line | –20 m | 0.308 | 0.423 |
| 20–40 m | −0.115 | ||
| 40–60 m | −0.110 | ||
| 60–80 m | −0.070 | ||
| 80–100 m | −0.051 | ||
| 100 m– | 0.008 |
Publisher’s Note: MDPI stays neutral with regard to jurisdictional claims in published maps and institutional affiliations. |
© 2022 by the authors. Licensee MDPI, Basel, Switzerland. This article is an open access article distributed under the terms and conditions of the Creative Commons Attribution (CC BY) license (https://creativecommons.org/licenses/by/4.0/).
Share and Cite
MDPI and ACS Style
Kasahara, N.; Gonda, Y.; Huvaj, N. Quantitative Land-Use and Landslide Assessment: A Case Study in Rize, Türkiye. Water 2022, 14, 1811. https://doi.org/10.3390/w14111811
AMA Style
Kasahara N, Gonda Y, Huvaj N. Quantitative Land-Use and Landslide Assessment: A Case Study in Rize, Türkiye. Water. 2022; 14(11):1811. https://doi.org/10.3390/w14111811
Chicago/Turabian StyleKasahara, Natsuki, Yutaka Gonda, and Nejan Huvaj. 2022. "Quantitative Land-Use and Landslide Assessment: A Case Study in Rize, Türkiye" Water 14, no. 11: 1811. https://doi.org/10.3390/w14111811
Note that from the first issue of 2016, this journal uses article numbers instead of page numbers. See further details here.