Article

Effect of Shelterbelt Construction on Soil Water Characteristic Curves in an Extreme Arid Shifting Desert

1
Key Laboratory of Plant Nutrition and the Agri-Environment in Northwest China, Ministry of Agriculture, Northwest A&F University, Xianyang 712100, China
2
Taklimakan Desert Research Station, Xinjiang Institute of Ecology and Geography, Chinese Academy of Sciences, Korla 841000, China
*
Author to whom correspondence should be addressed.
Water 2022, 14(11), 1803; https://doi.org/10.3390/w14111803
Submission received: 27 April 2022 / Revised: 26 May 2022 / Accepted: 31 May 2022 / Published: 2 June 2022
(This article belongs to the Special Issue Soil Hydrological Processes in Desert Regions)

Abstract

:
To explore the impact of artificial shelterbelt construction with saline irrigation on the soil water characteristic curve (SWCC) of shifting sandy soil in extreme arid desert areas, three treatments including under the shelterbelt (US), bare land in the shelterbelt (BL) and shifting sandy land (CK) in the hinterland of the Taklimakan Desert were selected. The age of the shelterbelt is 16, and the vegetation cover is mainly Calligonum mongolicum. The soils from different depths of 0–30 cm were taken keeping in view the objective of the study. The SWCCs were determined by the centrifugal method and fitting was performed using various models such as the Gardner (G) model, Brooks–Corey (BC) model and Van Genuchten (VG) model. Then, the most suitable SWCC model was selected. The results showed that electrical conductivity (EC) and organic matter content of BL and US decreased with the increasing soil depth, while the EC and organic matter content of CK increased with the soil depth. The changes in soil bulk density, EC and organic matter of 0–5 cm soil were mostly significant (p < 0.05) for different treatments, and the differences in SWCCs were also significant among different treatments. Moreover, the construction of an artificial shelterbelt improved soil water-holding capacity and had the most significant impacts on the surface soil. The increase in soil water-holding capacity decreased with increasing soil depth, and the available soil water existed in the form of readily available water. The BC model and VG model were found to be better than the G model in fitting results, and the BC model had the best fitting result on CK, while the VG Model had the best fitting result on BL with higher organic matter and salt contents. Comparing the fitting results of the three models, we concluded that although the fitting accuracy of the VG model tended to decrease with increasing organic matter and salinity, the VG model had the highest fitting accuracy when comparing with BC and G models for the BL treatment with high organic matter and salinity. Therefore, the influence of organic matter and salinity should be considered when establishing soil water transfer function.

1. Introduction

Soil moisture is an important factor affecting plant growth and is a major driving force for the sustainability of many terrestrial ecosystems. Moisture changes have significant impacts on vegetation and soil properties [1,2,3]. Especially in arid and semi-arid regions, soil moisture availability is one of main factors limiting the type and quantity of vegetation, and the water deficiency can lead to severe degradation of vegetation and reduce vegetation cover [4,5]. Therefore, it is important to understand the soil moisture change pattern for the maintenance of vegetation in arid desert areas [6].
The Taklamakan Desert is located in the hinterland of the Eurasian continent in Chinese southern Xinjiang, and is the largest desert in China and the second largest shifting desert in the world. Southern Xinjiang is one of the poorest regions with an extreme drought climate in China. To accelerate the development of regional social economy, the Taklimakan Desert Highway (TDH) was completed in 1995. TDH is 522 km long running across the Taklimakan Desert from north to south and is the longest highway crossing a moving desert in the world. However, serious sand disasters are a great threat to TDH. Thus, in 2003, a shelter–forest belt (the Taklimakan Desert Highway Shelterbelt (TDHS)) having a length of 436 km was constructed on both sides along the highway, which was dominated by shrubs to protect the highway from shifting sand [7]. Low-quality saline groundwater is used for irrigation in order to ensure the survival of shelterbelt plants [8,9,10,11]. The regional ecological environment on both sides of the highway has been greatly improved by the fixation of the shifting sand dunes with the artificial shelterbelt [12]. However, saline groundwater irrigation may aggravate soil salinization in future and is harmful for shelterbelt plants [13,14]. Therefore, it is necessary to study the water and salt transport of shelterbelt soils which is helpful for the sustainable utilization and management of TDHS [15].
SWCC, as a component of the unsaturated soil mechanics framework, provides the information needed to characterize the properties of unsaturated soils [16], is an interpretation of the basic constitutive relationships of unsaturated soil phenomena [17], and is an important tool for studying the properties of unsaturated soils [18]. SWCC is one of basic hydraulic properties that simulate water and solute transport under unsaturated conditions [19]; is universally used in agriculture [20], soil physics [21], soil chemistry [22], mineralogy research [23], geotechnical engineering [24]; and is widely used in the soil–plant–atmosphere continuum (SPC) [18,25] and other fields. Due to its importance in soil hydrodynamics and solute transport modeling, many SWCC models, both numerical and theoretical, have been developed [21]. A good SWCC model should have simple and clear parameters and be easy to use. It can satisfy the three characteristics of accuracy, universality and simplicity as much as possible at the same time [26]. The VG model [27], BC model [28] and G model [29] have relatively few parameters, and can accurately describe the SWCC of various soil textures [30,31,32,33,34,35,36,37,38]. SWCC is influenced by soil texture, bulk density, organic matter, salinity, temperature, etc. [19,30,31,32,33,39,40,41,42]. Therefore, the fitting results of the models are often different in various study areas. For example, some scholars [43,44] pointed out that the G model can accurately fit SWCC; however, others [45] came to the opposite conclusion, pointing out that the G model cannot accurately fit SWCC. Matlan et al. [26] compared four models and found that the BC model has the most accurate description of the SWCC of sandy soils. Li et al. [46] also proved this, pointing out that the BC model is more suitable than the VG model on soils with high sand content and low clay content. For the SWCC of aeolian sand covered by biocrust, the fitting effect of the VG model is better than the BC model [47].
The literature on SWCC in arid and semi-arid regions is relatively limited as compared to farmland and forest ecosystems. The influence of artificial shelterbelts and long-term saline irrigation on SWCC of sandy soils and the applicability of SWCC models is still unclear. This hinders our understanding towards the soil water-holding capacity and water availability of shelter forests. In this study, we firstly assumed that artificial shelterbelts and long-term saline irrigation have impacts on the water-holding capacity and water availability of different soil layers. In addition, we assumed that the VG model, BC model, and G model have different accuracies in fitting SWCC. Therefore, our study collected soils from 0 to 30 cm layers under the shelterbelt (US), bare land in the shelterbelt (BL) and shifting sandy land (CK) in the hinterland of the Taklimakan Desert, and their SWCCs were determined by the centrifugal method. Combined with its bulk density, organic matter, salinity and other properties, SWCC, pore distribution and soil moisture were analyzed, and the VG model, BC model and G model were used and compared to fit the SWCCs. We aim to reveal the impact of artificial shelterbelt construction on SWCC on shifting sandy soil in extreme arid deserts under saline drip irrigation, so as to provide a basis for desert shelterbelt construction and sustainable management.

2. Materials and Methods
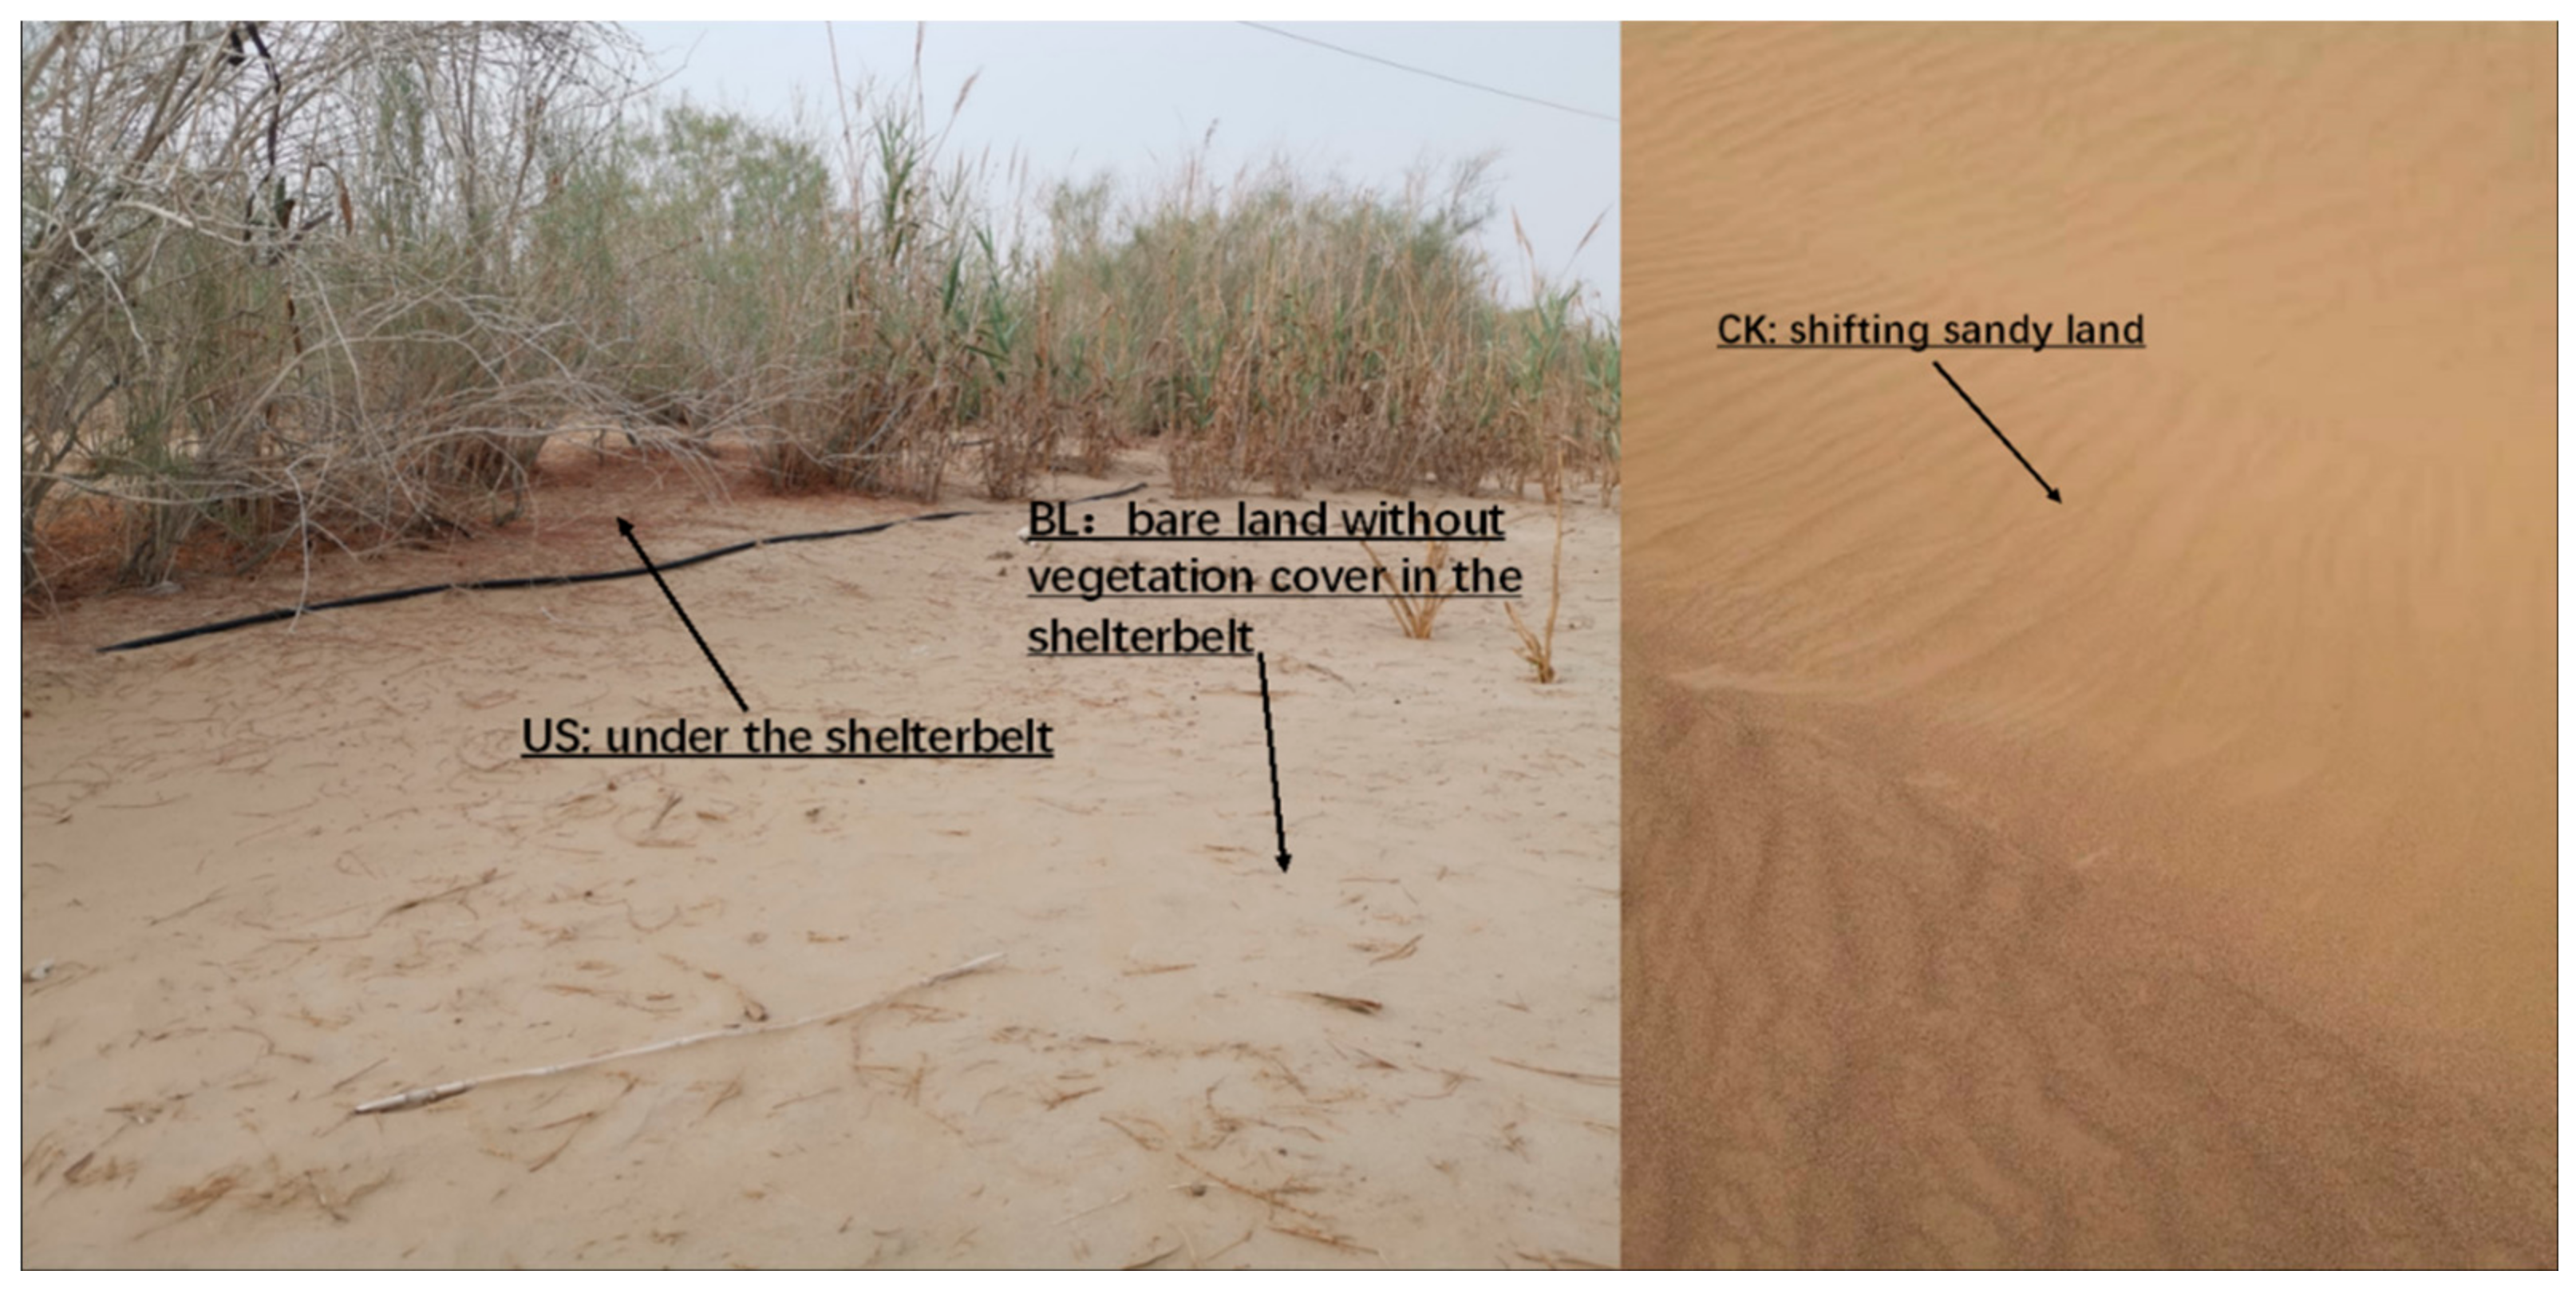
2.1. Study Area

The sampling area is located at the Taklamakan Desert Research Station of the Chinese Academy of Sciences in the hinterland of Taklamakan Desert (39°01′ N, 83°36′ E, 1100 m.a.s.l.), Xinjiang, China (Figure 1). The study area belongs to a warm temperate arid climate. The annual average temperature is 12.4 °C. December is the coldest month with an average monthly temperature of −8.1 °C and July is the hottest month with an average monthly temperature of 28.2 °C. Annual precipitation is 24.6 mm, average relative humidity is 29.4% and annual potential evaporation is up to 3638.6 mm. Annual average wind speed is 2.5 m·s−1, and the maximum instantaneous wind speed is up to 20 m·s−1. The soil type is Xeric Quartzipsamments [48] (Soil Survey Staff 2014), derived from shifting eolian sand, and the basic properties are shown in Table 1.

2.2. Sample Collection and Determination

In August 2020, undisturbed soil samples were collected with a cutting ring of 100 cm3 from the soil layers of 0–5 cm, 5–10 cm, 10–20 cm and 20–30 cm under US, BL and CK, and all samples had three replicates (the pictures of the sampling points are shown in Figure 2). The ring knife (with soil) samples were soaked in deionized water for 24 h until saturation, weighed, and then the SWCCs were determined using a high-speed centrifuge (CR 22G III model, Hitachi, Japan). Suction values were determined in lab using a centrifuge with different speeds and time settings. The selected suction values were 10.2 cm (310 r/min, 10 min), 30.6 cm (540 r/min, 12 min), 51 cm (690 r/min, 17 min), 71.4 cm (820 r/min, 21 min), 102 cm (980 r/min, 26 min), 204 cm (1200 r/min, 28 min), 612 cm (2190 r/min, 49 min), 1020 cm (3100 r/min, 57 min), 4080 cm (6200 r/min, 77 min) and 8160 cm (8770 r/min, 87 min), respectively. The weight of the ring knife sample was weighed after the completion of centrifugation at each suction value. After centrifugation, the ring knife was dried in an oven (105 °C) and then weighed, and the water content at the corresponding suction value was obtained from the difference in weights. The moisture under different suction values was plotted according to the SWCC. Meanwhile, soil samples of corresponding layers were also collected with a soil drill and brought to the laboratory and air dried. Part of the samples was passed through a 2 mm sieve to determine soil pH, EC (with an EC500 pH/Conductivity Meter (ExStik, Boston, MA, USA)), and soil mechanical composition was determined using the hydrometer method and soil texture was classified according to USDA standards. Soil particles were divided into sand particles of 2–0.05 mm, silt particles of 0.05–0.002 mm and clay particles of ≤0.002 mm, and the left soils were used to measure soil organic matter content with potassium dichromate external heating method after passing through a 0.25 mm sieve. The physical and chemical properties of the soil samples are shown in Table 1.

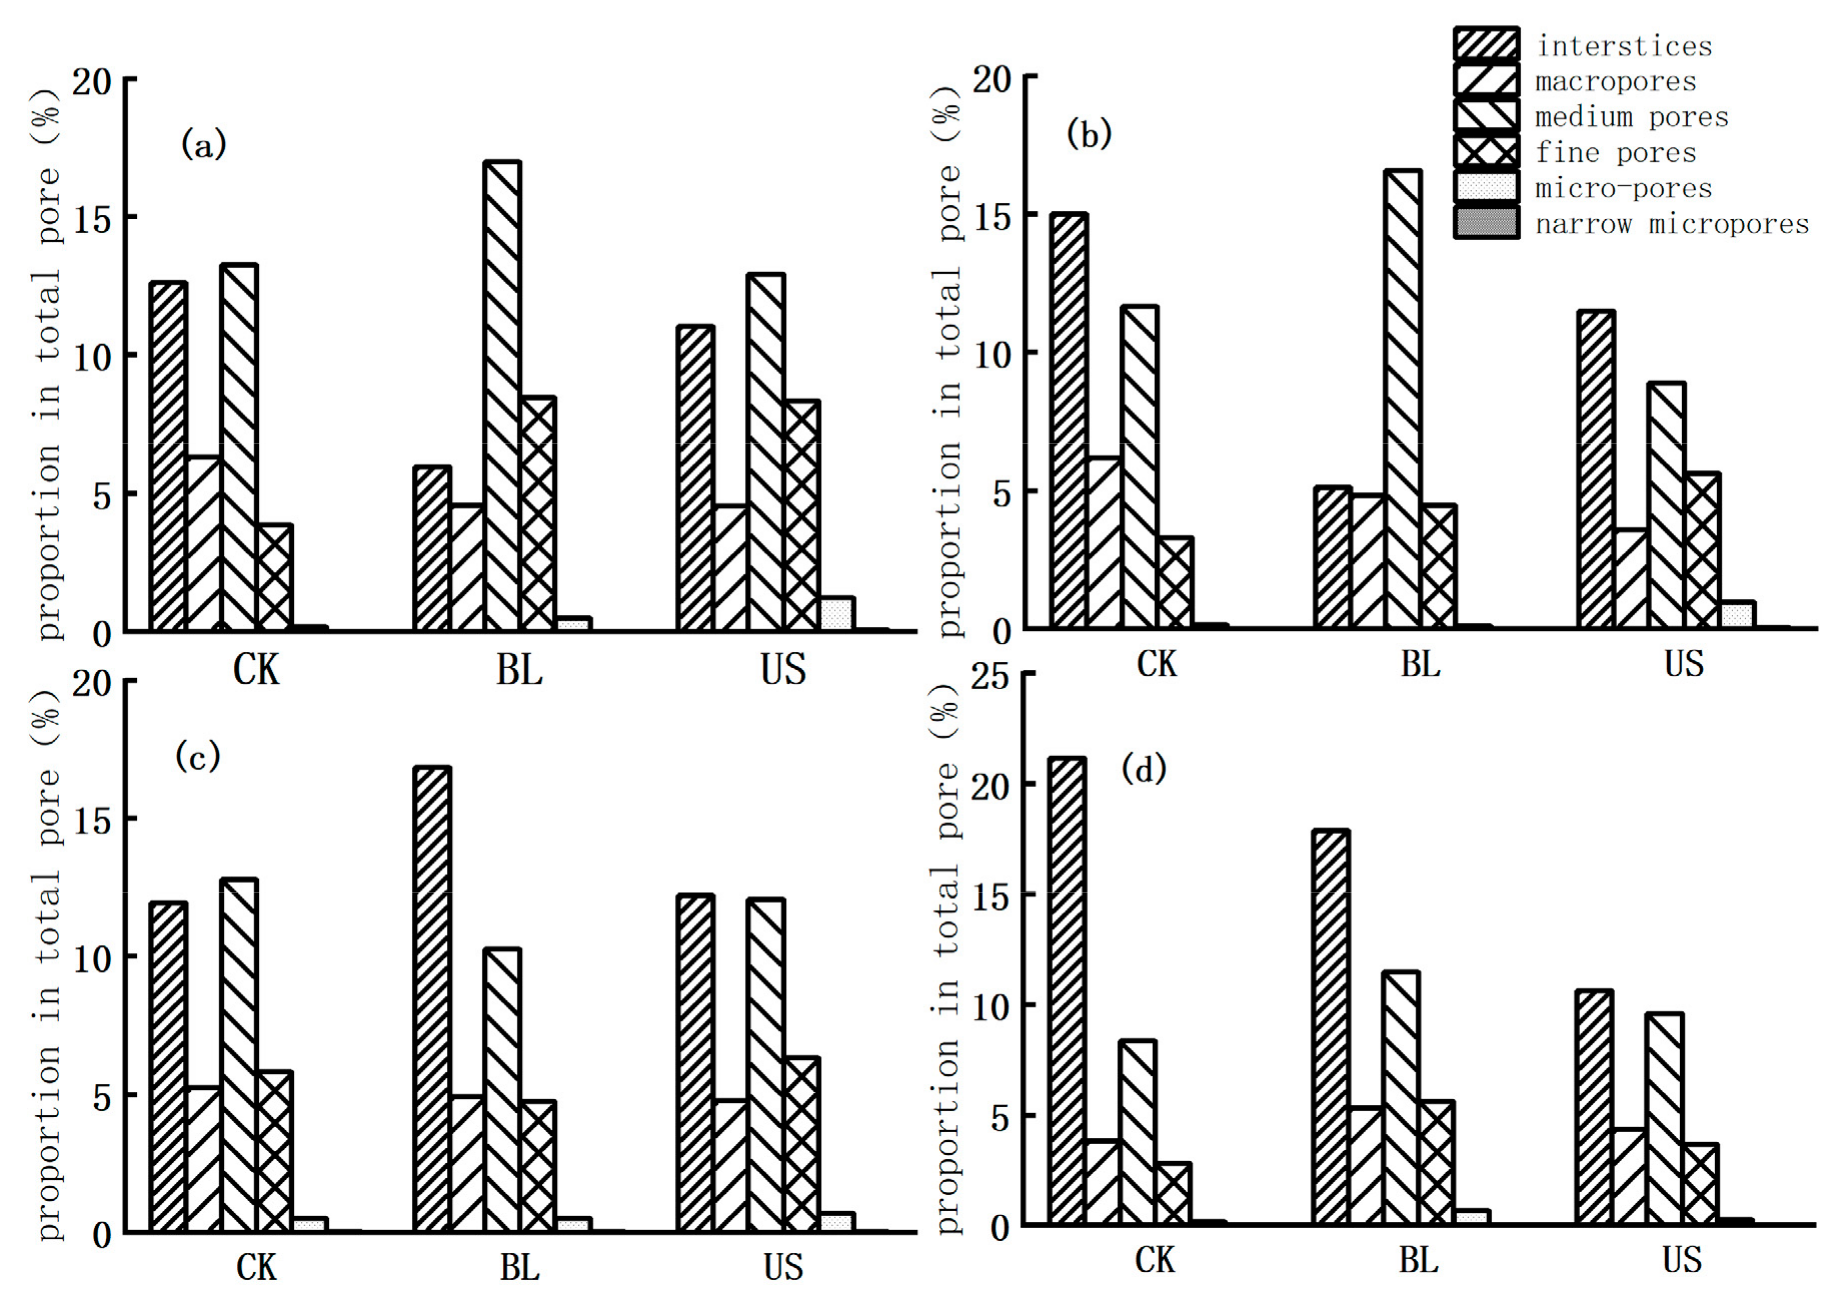
2.3. Calculations of Soil Equivalent Pore Sizes and Moisture Constants

The equivalent pores are divided into six levels based on their diameters, including narrow micropores (≤0.3 μm), micropores (0.3–5 μm), fine pores (5–30 μm), medium pores (30–75 μm), macropores (75–100 μm) and interstices (≥100 μm) [47,49].
Based on the measured and fitted SWCC parameters, saturated water θs, field capacity θf, wilting coefficient θr, available water content θa and readily available water content θra were obtained. While θs is the soil water content when water suction is zero, θf is the soil water content of when pF = 1.8 (pF is expressed as the logarithm of the centimeter height of the water column of the soil water potential), and θr is the soil water content when pF = 4.2, pF = 3.8 represents temporary wilting coefficient. The water content in the range of pF 1.8–4.2 is θa, and the water content in the range of pF 1.8–3.8 is θra [50].

2.4. SWCC Modeling

VG model, G model and BC model were used to describe the SWCC.
VG model:
θ ( h ) = θ r + θ s θ r ( 1 + α h n ) m
where θ(h) is the volume water content, cm3 cm−3; θs is the saturated water content, cm3 cm−3; θr is the residual water content, cm3 cm−3; h is the matric suction, cm; α is a scale parameter that is related to the inverse of the air entry suction, cm−1; m, n are the fitting parameters; m = 1 − 1/n (n > 1).
G model:
θ = α h b
where θ is the volume water content, cm3 cm−3; h is the matric suction, cm; a and b are fitting parameters.
BC model:
S e = θ θ r θ s θ r = α h λ α h > 1 1 α h 1
where Se is the effective saturation; λ is the curve shape parameter; the physical meanings of other parameters are the same as above.

2.5. SWCC Model Fitting Accuray Assesments

The coefficient of determination (R2), root mean square error (RSME) and relative error (RE) were used to quantitatively evaluate the fitting effect of the models. Grey correlation analysis allows ranking the importance between different influencing factors [51,52]. The soil physiochemical properties and model parameters were quantitatively analyzed by grey correlational method, and the correlational degree was sorted. The calculation formulas are as follows:
R 2 = i = 1 N ( θ i θ i ¯ ) 2 i = 1 N ( β i θ i ¯ ) 2
R M S E = i = 1 N ( θ i β i ) 2 N
R E = θ i β i θ i × 100
γ 0 i = 1 n k = 1 n m + ρ M Δ i ( k ) + ρ M
In Equations (4)–(6), N is the total number of samples of matric suction; θ i represents the measured value of soil moisture corresponding to the ith pressure value; θ i ¯ represents the average value of measured soil moisture; β i is the fitted value of soil moisture corresponding to the ith pressure value. In Equation (7), γ 0 i is the correlation degree, Δi(k) is the difference sequence, M is the maximum difference sequence, m is the minimum difference sequence, and ρ is the resolution coefficient, which is generally 0.5 in the models [51,52].
RETC software was used to solve and fit the parameters, Excel2010 and Origin2018 were used for data processing and mapping and SPSS18.0 was used for one-way ANOVA and multiple comparisons (a = 0.05, LSD).

3. Results

3.1. Effects of Artificial Shelterbelt Construction on Soil Physiochemical Properties

Soil physiochemical properties were improved after artificial shelterbelt construction. From Table 1, according to USDA system, it is clearly stated that all soil layers of CK are sandy soil, all soil layers of BL treatment are loamy sandy soil, 0–5 cm soil of US treatment was sandy loam soil and 5–30 cm soil was loamy sandy soil. There were significant differences in bulk density and EC among CK, BL and US in the same soil layer (p < 0.05). Except for CK, the soil bulk density under BL and US treatments increased with the increasing soil depth, and the soil bulk density of 0–5 cm under BL and US treatments was significantly lower than CK; the bulk density of the 5–30 cm soil layer was the highest in BL, except for 10–20 cm; the bulk density of US treatment was lower than that of CK and BL. The bulk density of the 0–5 cm soil layer in US treatment was the smallest (1.25 g/cm3), and the highest bulk density at all was 1.6 g/cm3. With the increase in soil depth, the EC of CK gradually increased, while EC of BL and US treatments decreased with the increasing depth. The difference in EC between BL, US and CK in the 0–5 cm soil layer was the largest, which was 18,764 µS/cm and 9724 µS/cm, respectively. The EC of CK at 10–30 cm was higher than that of BL and US.

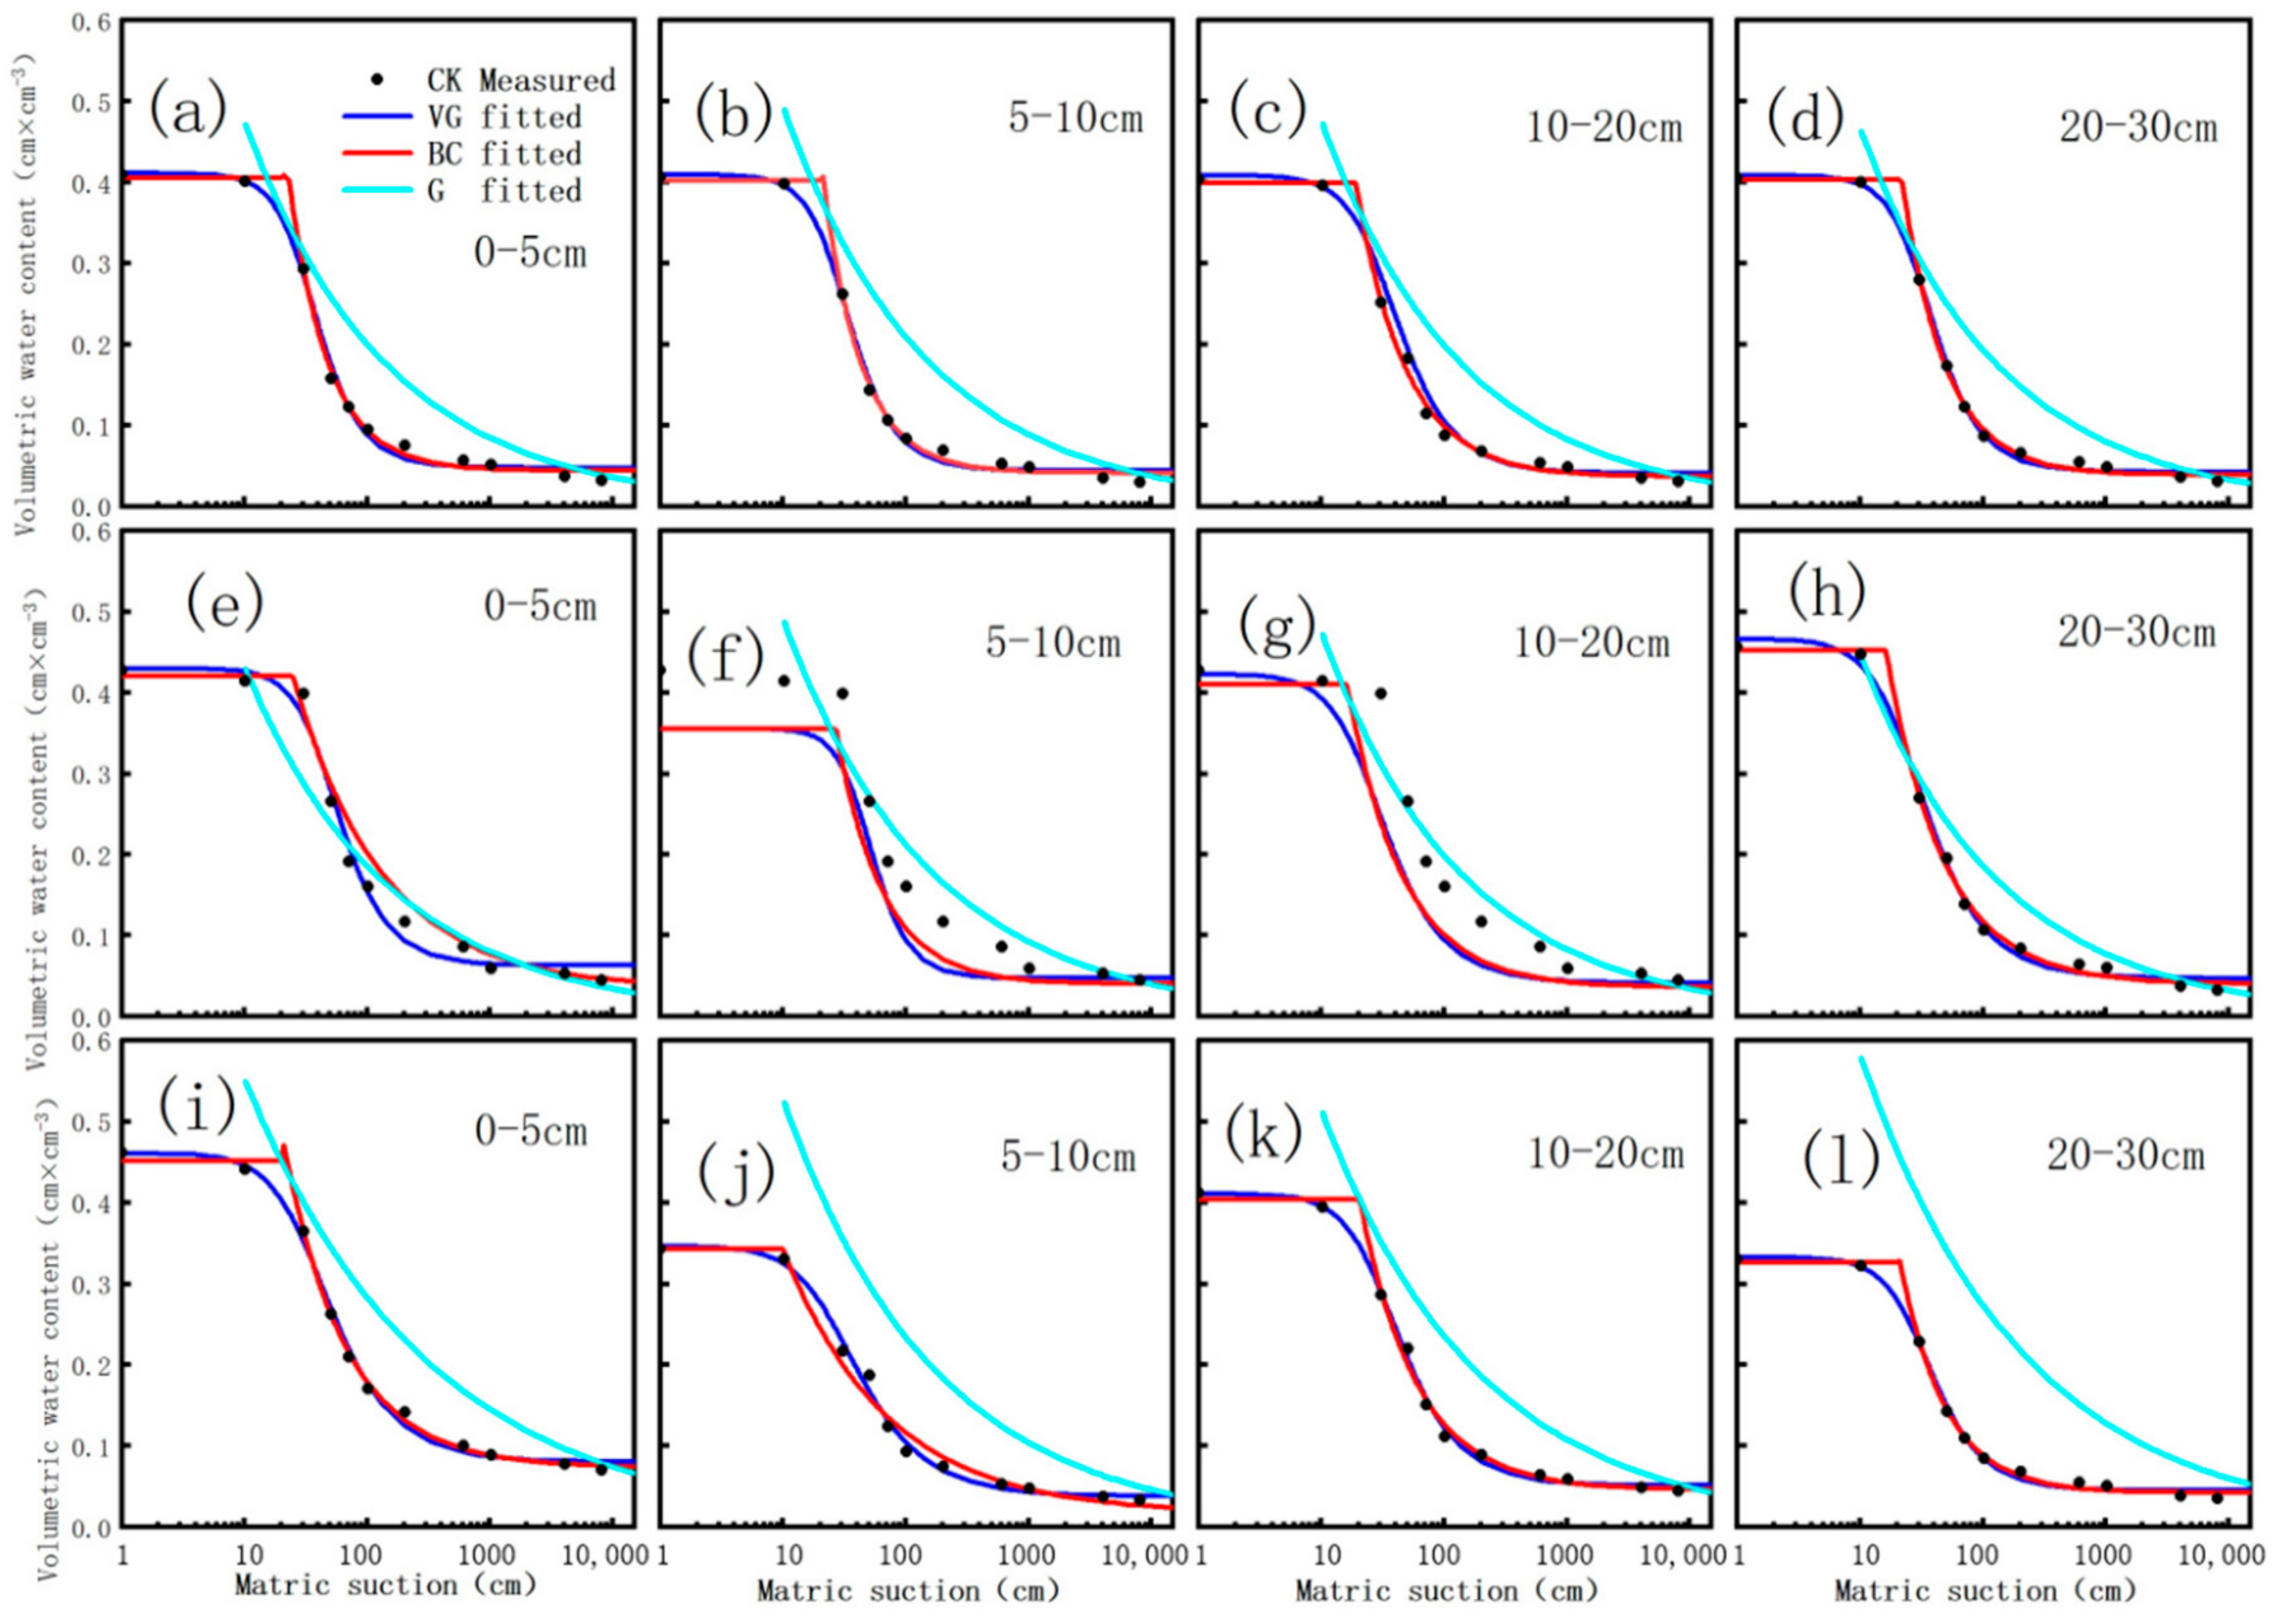
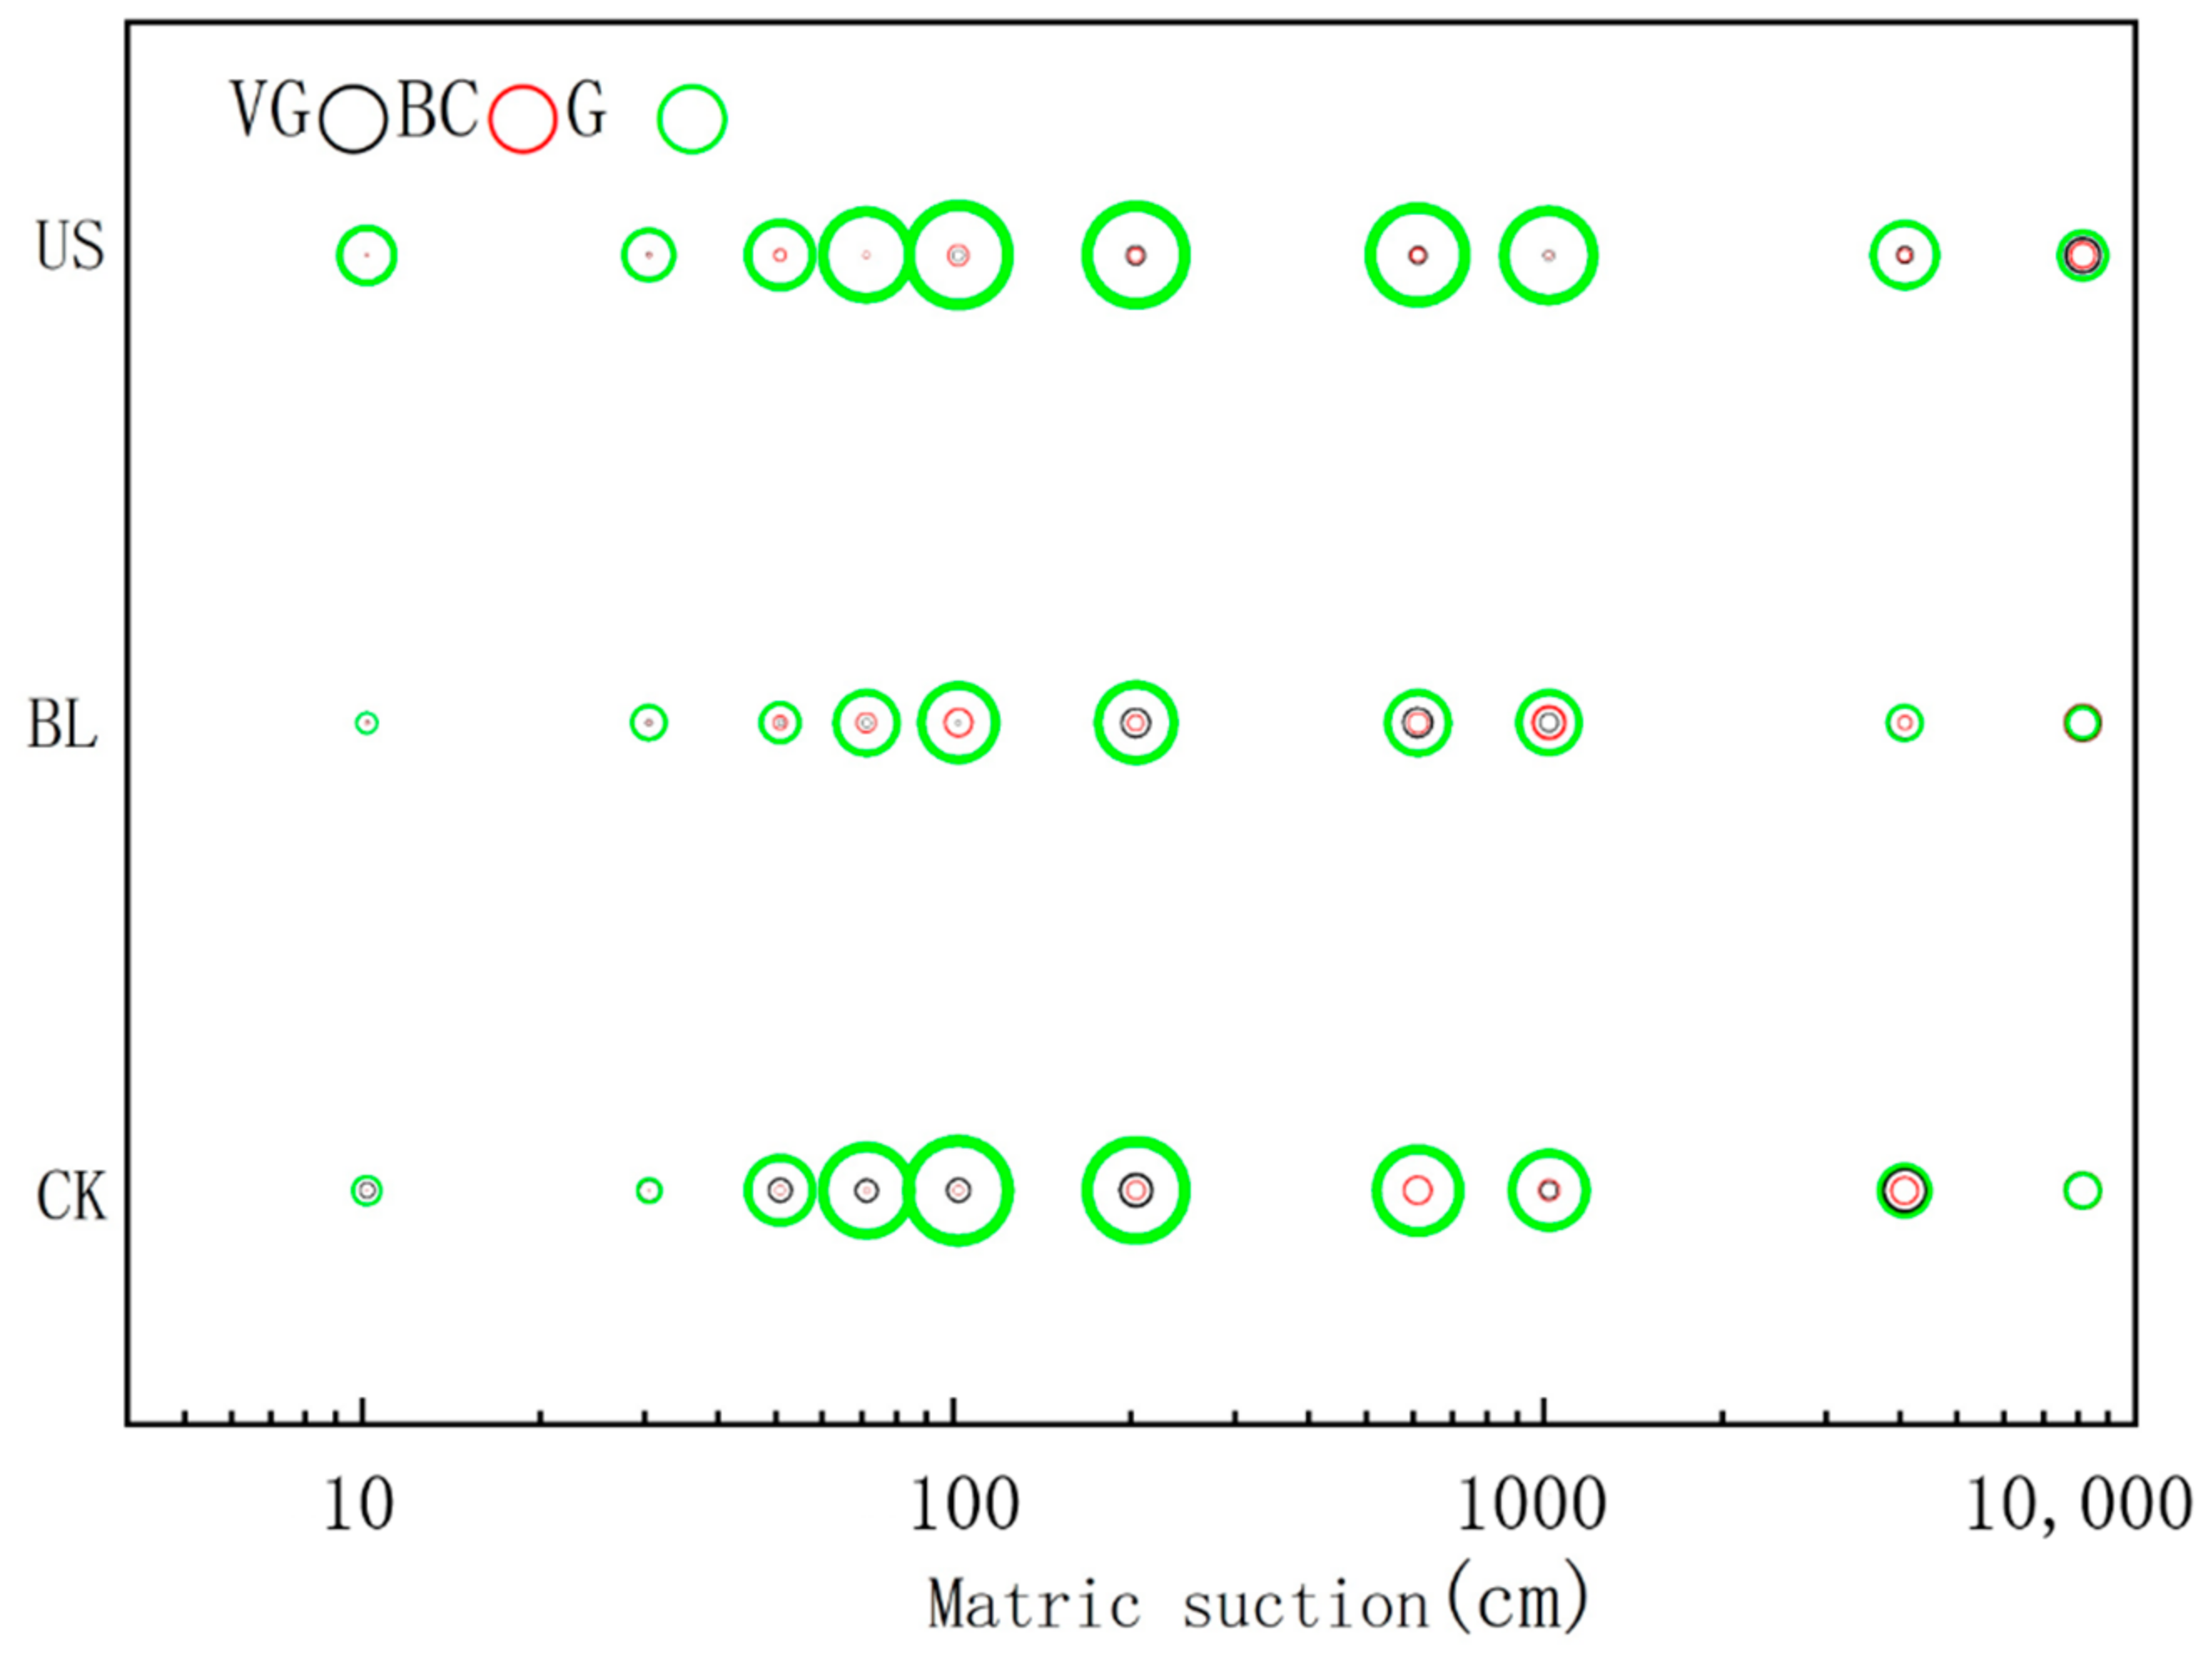
3.2. Screening of Soil Water Characteristic Curve Models

As listed in Table 2, R2 of the fitting values of VG, BC, and G models was ranged between 0.884 and 0.998, which showed the correlations of three models with the measured data were high. As shown in Figure 3, the fitted results of the G model were all higher than the measured points, and the fitted values of the VG model and BC model for BL in the 5–20 cm soil layer were smaller than the measured values.
The fitting effect of the VG model and BC model for different soil layers of various treatments were always better than that of the G model. The fitting effect of the VG model and BC model was similar for the 10–30 cm soil layers of each treatment. The fitting effect of the BC model for the 0–10 cm soil layer of CK was better than the VG model, while the results of BL were opposite. For US, the BC model had a good fitting effect for the 0–5 cm soil layer, but the fitting effect was contradictory for the 5–10 cm soil layer. For all treatments, the fitting errors of three models increased with the increasing water potential and tended to be stable (Figure 4). The relative errors of the VG model and BC model for different treatments and soil layers were always lower as compared with relative error of the G model.
In addition, R2 and RMSE of the VG and BC models showed that the simulating results of CK were better than those of BL and US (Table 2). The results indicated that the increase in salinity and organic matter content may affect the fitness of each model. Table 3 lists the parameters of the three models in SWCC modeling. From grey correlation calculation (Table 4), it could be concluded that VG model parameters a and n have a higher degree of correlation with the soil physiochemical parameters (BC and G models were not included, because the VG model had the best fitting effect). The grey relational degrees between pH, EC, organic matter, bulk density, sand content, silt content, clay content and model parameters (a and n) were all larger than 0.6, and the order of correlation showed as: bulk density > sand content > pH > clay content > organic matter > silt content > EC.

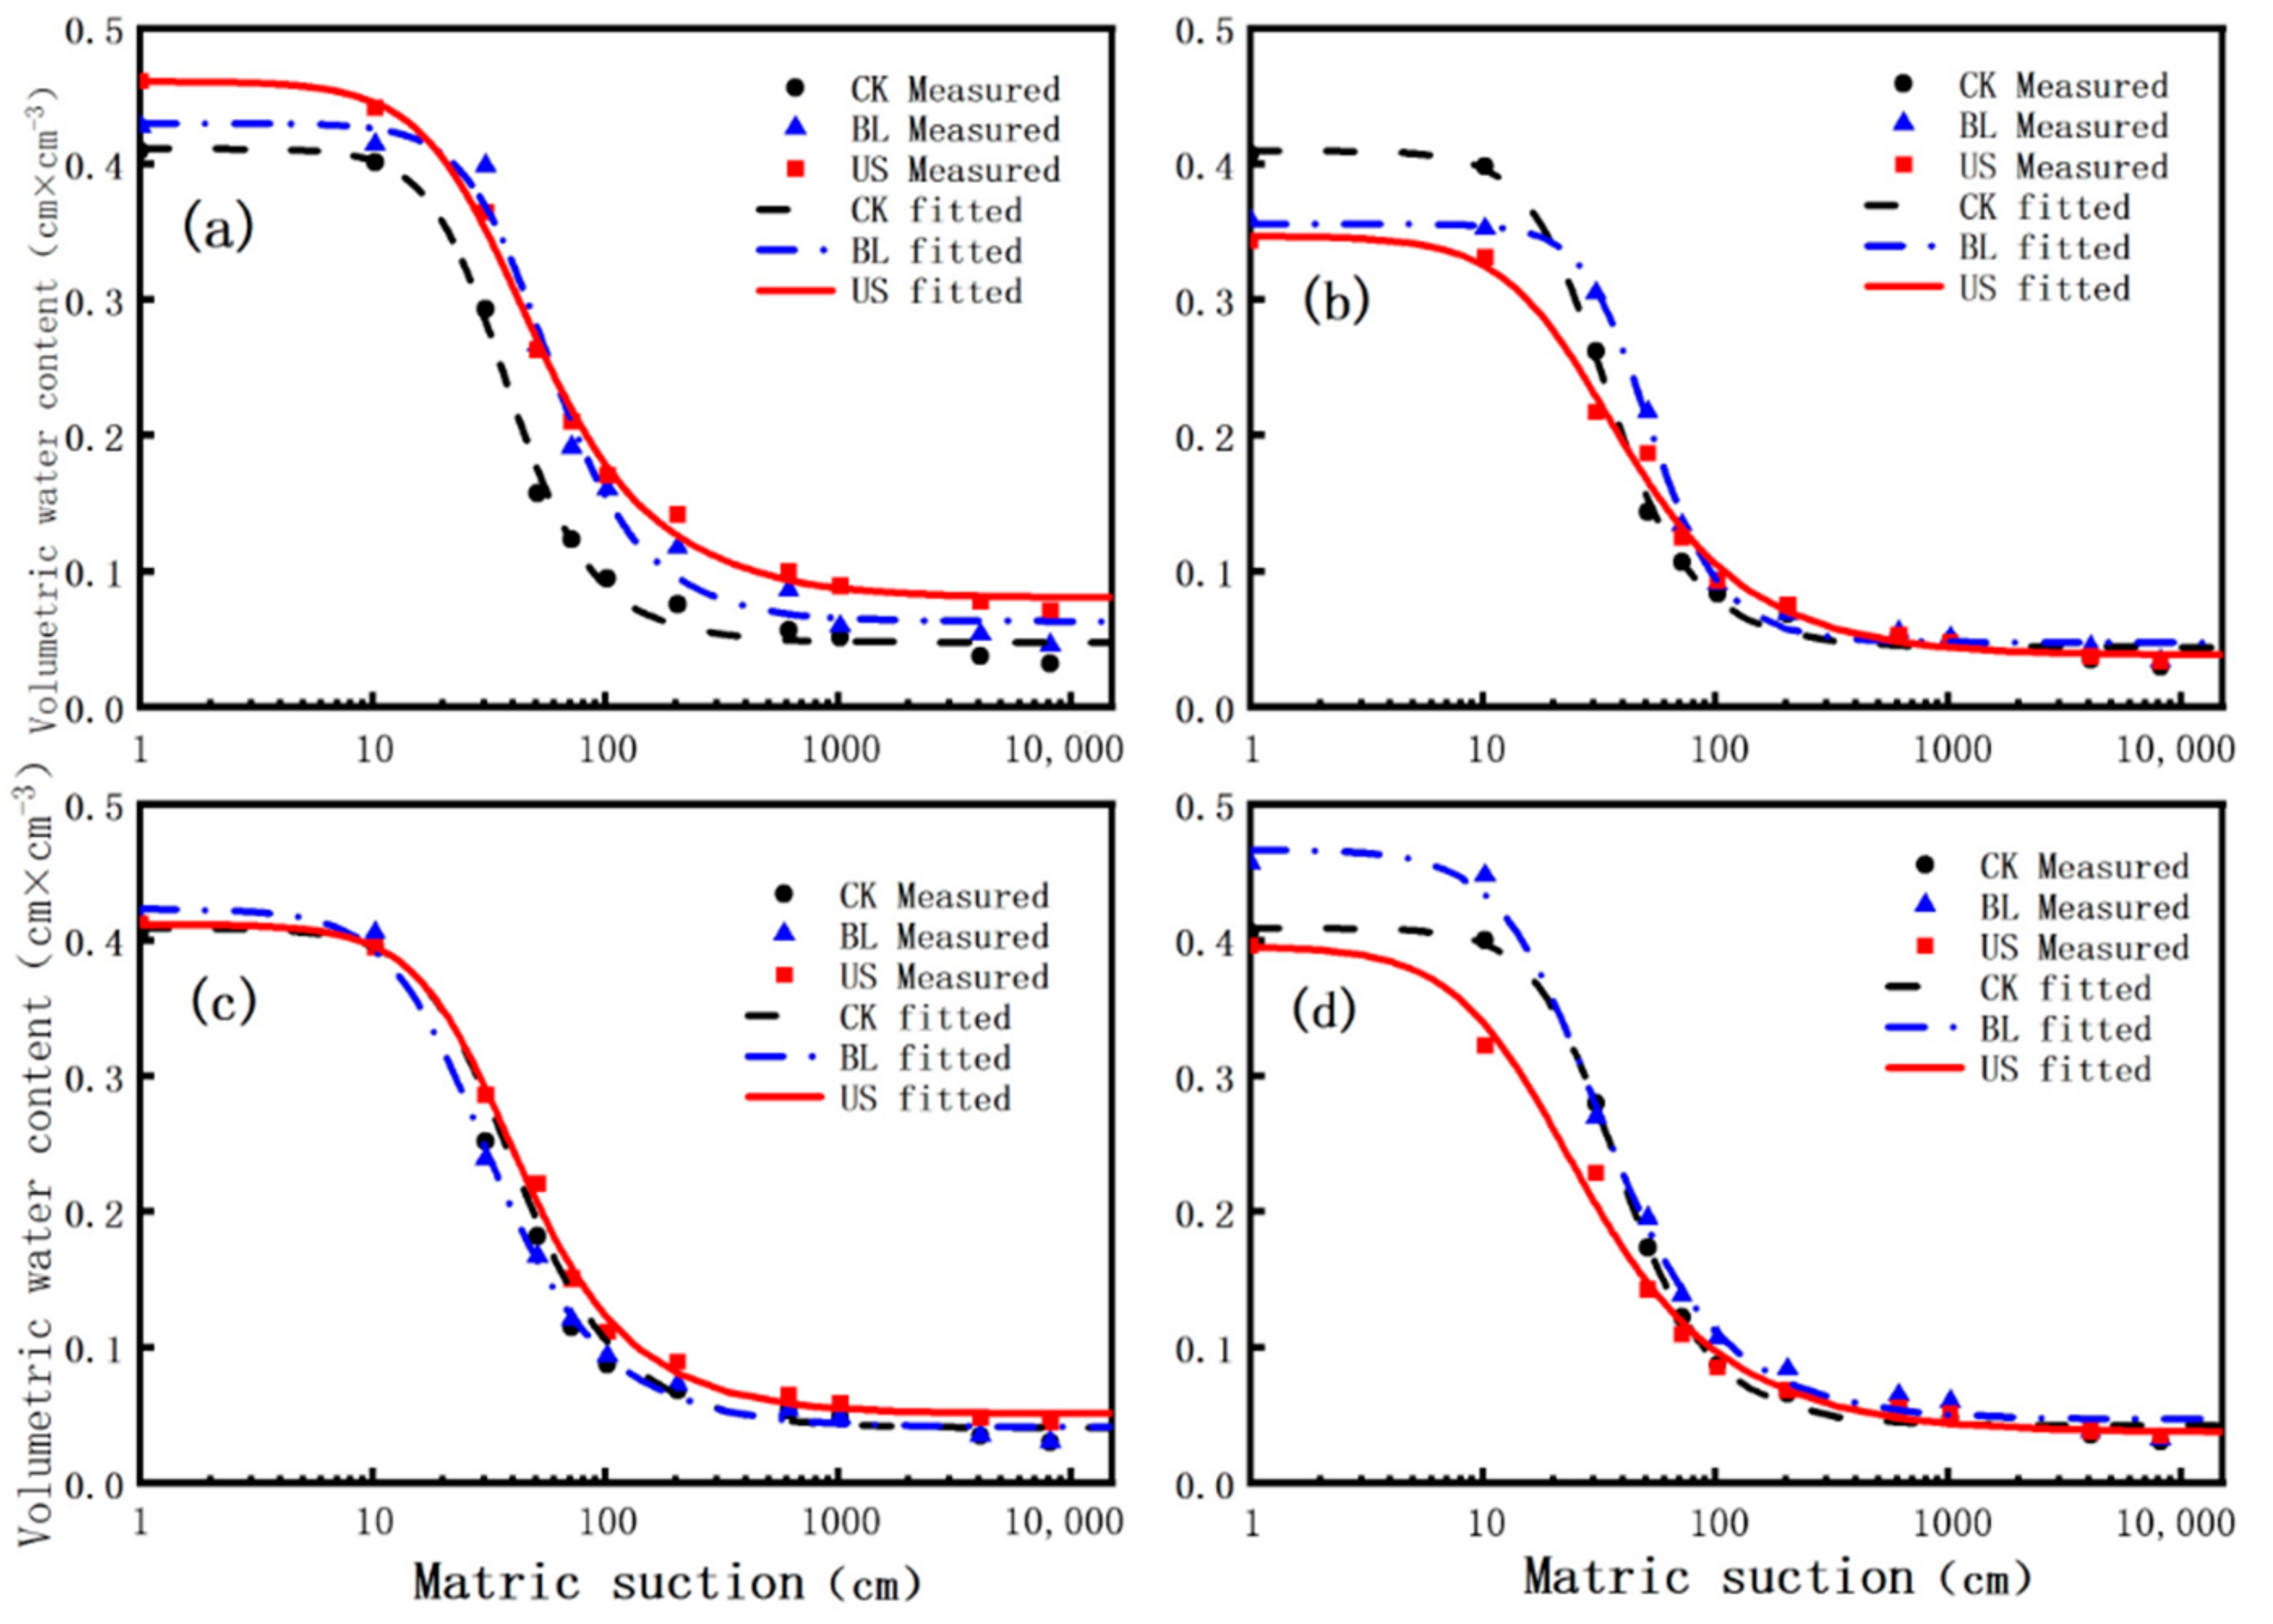
3.3. Effects of Artificial Shelterbelt Construction on Soil Water Retention Performance

Soil porosity was significantly changed after artificial shelterbelt construction. As listed in Figure 5, few micropores were found under all treatments. Compared with CK, the contents of interstices and macropores in the 0–10 cm soil layer under BL and US were much lower, and the contents of fine pores and micropores were higher. The medium pores of the BL increased the most, with 0–5 cm increased by 3.74% and 5–10 cm increased by 4.94%. Fine pores of US increased the most: 0–5 cm increased by 4.54% and 5–10 cm increased by 2.32%.
Soil water parameters of each treatment are shown in Table 5. In the 0–5 cm soil layer, θs, θf, θr, θa and θra under BL and US were higher than those under CK. Compared with CK, θs of BL and US increased by 4.42% and 12.67%, θf increased by 68.9% and 70.41%, θr increased by 32.84% and 69.47%, θa increased by 87.84% and 70.97% and θra increased by 87.73% and 70.43%, respectively. In the 5–10 cm soil layer, θs of CK was the largest, but θf, θr, θa and θra of US and BL were higher than those of CK. In the 10–20 cm soil layer, higher θf, θr, θa and θra were observed under US than in BL and CK. In the 20–30 cm soil layer, higher θs, θf, θr, θa and θra were observed under BL than in US and CK. Meanwhile, the contents of available water in each treatment were almost equal to that of readily available water content.
As shown in Figure 6, the shapes of SWCC of each soil layer were similar, but the variations in soil moisture under per unit suction were clearly different. Under 0–10 cm and 1000–10,000 cm suctions, soil water was lost slowly with the increase in suction. However, under the suction of 10–1000 cm, the curve trended to be steep, and the soil water decreased rapidly with the increase in suction. Figure 6 clearly showed the differences in the course of the water retention curves of the three sampled areas. Soil water-holding capacity of 0–5 cm soil layer was highest under US, followed by BL and CK (Figure 6a). The difference in water-holding capacity among treatments in the remaining soil layers gradually became smaller. At the suction value corresponding to the field water-holding capacity (pF = 1.8, i.e., 63 cm water column), the moisture of the 5–10 cm soil layer was as follows: BL ≥ US≥ CK; 10–20 cm soil layer was as follows: US ≥ CK ≥ BL; and 20–30 cm soil layer was as follows: BL ≥ CK ≥ US. When reaching the suction value corresponding to the temporary wilting coefficient (pF = 3.8, i.e., 6309 cm water column), the water content of the 5–10 cm soil layer behaved as follows: BL ≥ CK ≥ US; the water content of the 10–20 cm soil layer behaved as follows: US ≥ BL ≥ CK; and the water content of the 20–30 cm soil layer behaved as follows: BL ≥ CK ≥ US.

4. Discussion

4.1. Artificial Shelterbelt Construction Greatly Changed the Soil Physiochemical Properties

SWCC is affected by various soil properties such as texture, bulk density, porosity, organic matter and salinity [42,53,54,55]. In our study, compared with shifting sandy land, the soil properties of BL and US changed obviously (Table 1), which caused the transformation of SWCC (Figure 6). Soil physiochemical properties of the 0–5 cm soil layer were changed most significantly. Shelterbelt construction under saline irrigation significantly decreased the soil bulk density, increased EC and organic matter content, and the soil texture changed from sandy soil to loamy sand and sandy loam (Table 1). After shelterbelt construction, the soil bulk density of 0–5 cm decreased significantly as compared with CK, which is primarily due to the continuous input of plant litters in the surface soil that lead to loosening the soil particles [56,57]. The bulk density of BL was the highest in the 5–30 cm soil layer, indicating that long-term saline irrigation would increase the soil bulk density [58,59]. The change in soil texture was mainly reflected by the increase in silt and clay particles. The main reason is that the shelterbelts reduced the wind speed, which promotes the precipitation of sand and the accumulation of dust fall [60,61]. The second reason is the accumulation of litter and the role of microorganisms. The volume and average radius of soil macropores increased with the increase in volumetric rock fragment content [62,63]. This directly led to the reduction in large pores and increase in small pores under BL and US (Figure 5a), which improved soil water-holding capacity and changed the SWCC. In addition to the influence of rock fragments, soil macropores are also controlled by biological factors [64]. Therefore, when the content of rock fragments is similar, the distribution of soil macropores will also be different (Figure 5b–d).
Under long-term saline irrigation, the salts were added into the soil and resulted in surface accumulation due to strong evaporation rate [13,65]. Therefore, the soil ECs of BL and US in the 0–10 cm soil layer were significantly higher than shifting sandy land, and the EC of BL and US decreased with the increasing soil depth. Vegetation cover resulted in less evaporation under US than BL, and more intense surface salt accumulation under BL. Therefore, soil EC of BL was higher than US in the 0–5 cm soil layer, and EC of BL was lower than US in the 0–10 cm soil layer. Wind erosion has an important impact on the cycle of soil organic carbon. The fine particles in the sand and dust adsorb soil organic carbon. Under the action of wind erosion, soil organic carbon is redistributed along with the movement of sand and dust [65,66]. Therefore, the increase in soil organic matter was mainly due to the accumulation of litters, and atmospheric dustfall also played a certain role in promoting it [67].

4.2. Artificial Shelterbelt Construction Increased the Soil Water-Holding Capacity

Soil water moves in pores and its transfer rate is directly determined by the size and distribution of pores. Soil bulk density is negatively correlated with soil porosity. Changes in soil primary particles such as sand, silt and clay also affect the distribution of pores. Organic matter and salinity have a direct impact on soil structure and adsorption. These soil physical properties may directly or indirectly affect soil water conductivity. Therefore, SWCC is affected by bulk density, texture, organic matter, porosity, aggregate stability, salinity and other properties [19,30,31,32,33,40,41,42].
Compared with CK for the 0–5 cm soil layer, vegetation coverage resulted in the decline in bulk density and increase in the salinity, organic matter and silt content under BL and US. On the one hand, salt contents in soil will occupy the pore space, and it will cause some soil particles to flocculate together, increase soil pores and enhance soil water-holding capacity [68]. Plant litters will reduce soil bulk density and increase soil organic matter content, soil saturated water content and water conductivity [69,70]. Therefore, the water contents of BL and US were higher than those of CK under the same suction, and with the increase in suction, the water contents of BL and US decreased, which means the SWCC integrally moved upwards and the trend slowed down. The contents of soil interstices and macropores in the 5–10 cm of CK were more than that in BL and US (Figure 5b). SWCC reflects the dehumidification process of soils, during which water is stored in pores and water retained in macropores is preferentially expelled as suction increases. Therefore, the change in water content per unit suction of CK was higher than that of BL and US. Therefore, the curve was the maximum under 0–10 cm suction, and then decreased rapidly to the minimum. The soil physiochemical properties of each treatment in the 10–20 cm soil layer had little difference, and their water-holding capacities were similar. For the 20–30 cm soil layer, the bulk density of BL was significantly higher than that of CK and US, and the water-holding curve was at its peak. Our results are consistent with Lipiec et al. [54]. Comparing the soil water changes over the entire suction range, the water-holding capacity of the surface 0–5 cm soil increased the most significantly, and the water-holding capacity of BL and US increased over the entire suction range compared to CK. The increase in water retention capacity of shelterbelt soils under long-term saline water irrigation is mainly due to the following reasons. Soil texture controls the physical, hydrological and chemical properties of the soil and has a strong influence on water flow paths, residence times and the magnitude and location of salt accumulation. Soil texture governs the water and solute transport. Under irrigation conditions, finer soils limit water infiltration, and coarse-grained soils retain significantly less water than fine-grained soils [71,72]. The accumulation of soil salts is dominated by sodium salts originated from the irrigation water. Excessive concentration of sodium ions in the soil solution will disperse and swell the soil structure, leading to the reduction and blockage of connected pores, thus reducing the permeability and hydraulic conductivity of the soil [73,74]. The salinity of pore water also affects the development of the diffusion double layer (DDL) around soil particles, which controls the microstructural changes in soil particles during hydration. As the salt content in irrigation water increases, the interlayer space between DDLs expands and soil aggregates are disrupted by swelling and clay dispersion [41,75]. The more significant salinity damages the soil structure and the salt stress results in higher absorption of soil water [76].

4.3. Screening of SWCC Models for Artificial Shelterbelt

The fitting R2 results of VG model and BC model were significantly higher than those of the G model, and the RE was generally lower than that of G model. Therefore, the fitting results of the VG and BC models were better for SWCC, while the BC model had better fitting effect for CK. However, the fitting effects of the VG model were better than the BC model for bare BL and US, especially for the surface soil. This is because the VG model considers more influencing factors when predicting. Therefore, it has a higher accuracy on soils with more complex physiochemical properties. The soil salt content and organic matter content of BL and US were maximum, so the fitting effect of the VG model is better than the BC model. Therefore, comparing the fitting results of the three models, the results concluded that the VG model is the best choice in this regard.
When using RETC software to predict the parameters of the VG model, only the influence of bulk density and texture can be considered. In our study, it can be found that the increase in organic matter and salinity reduce the fitting accuracy of the VG model, and through grey correlation analysis, we found that the soil bulk density, sand content, pH, clay content, organic matter, silt content, EC and other physiochemical indicators of the study area had a larger correlation degree with the parameters a and n of the VG model (Table 4). Meanwhile, the basic parameters such as organic matter, pH and EC were used as input variables to predict the parameters of the VG model, and our results found that the fitting effect of the VG model could be improved [77,78]. Therefore, pH, EC, organic matter and other indicators should also be used as input variables for calculation when predicting the parameters of the VG model.

5. Conclusions

The construction of an artificial shelterbelt with long-term saline water irrigation increased the water retention capacity and the content of fine pores in the soils, and reduced the content of macropores. Artificial shelterbelt construction had the greatest impact on the surface soil, and the impact gradually decreased with the increasing soil depth. Compared with the shifting sandy land (CK) in the 0–5 cm soil layer, the saturated water content θs of the soil under BL and US increased by 4.42% and 12.67%, the field capacity θf increased by 68.9% and 70.41%, and the available water content θa increased by 87.84% and 70.97%. In the 5–10 cm soil layer, the θf, θr, θa and θra of US and BL were higher than those of CK. In the 10–20 cm soil layer, the soil of US had the best water-holding performance. In the 20–30 cm soil layer, the soil water-holding performance of BL was the best. The available water content of each treatment was in the form of readily available water content. Comparing the coefficient of determination (R2), root mean square error (RSME) and relative error (RE) of the three models, it was found that the G model always overestimated the soil water content and had a lower prediction accuracy, while the BC and VG models had higher prediction accuracies. Although both BC and VG models are suitable for fitting SWCC of the shelterbelt, the VG model is more effective. The parameters a and n of the VG model had a higher degree of correlation with the soil EC and organic matter. In summary, the increase in organic matter and salinity reduced the fitting accuracy of the model. When predicting the parameters of the VG model and establishing the soil transfer function, soil EC, organic matter and other indicators should be calculated as input variables.

Author Contributions

Conceptualization, C.M. and J.Z.; Data curation, L.T., M.T.J., Q.C. and J.F.; Formal analysis, C.M. and W.C.; Investigation, C.M., X.L., Q.C. and J.F.; Methodology, C.M., J.Z. and X.L.; Writing—original draft, C.M.; Writing—review and editing, J.Z. All authors have read and agreed to the published version of the manuscript.

Funding

This study was supported by the National Natural Science Foundation of China (No. 41877541, 41471222), Key Scientific and Technological Project of Shaanxi Province (2022ZDLNY02-03).

Institutional Review Board Statement

Not applicable.

Informed Consent Statement

Not applicable.

Data Availability Statement

All data reported here are available from the authors upon request.

Conflicts of Interest

The authors declare no conflict of interest.

References

  1. Kaisermann, A.; de Vries, F.T.; Griffiths, R.I.; Bardgett, R.D. Legacy effects of drought on plant–soil feedbacks and plant–plant interactions. New Phytol. 2017, 215, 1413–1424. [Google Scholar] [CrossRef] [Green Version]
  2. Zhang, Q.; Shao, M.; Jia, X.; Wei, X. Changes in soil physical and chemical properties after short drought stress in semi-humid forests. Geoderma 2019, 338, 170–177. [Google Scholar] [CrossRef]
  3. Mantovani, D.; Veste, M.; Boldt-Burisch, K.; Fritsch, S.; Koning, L.A.; Freese, D. Carbon allocation, nodulation, and biological nitrogen fixation of black locust (Robinia pseudoacacia L.) under soil water limitation. Ann. For. Res. 2015, 58, 259–274. [Google Scholar] [CrossRef]
  4. Yu, T.; Feng, Q.; Si, J.; Xi, H.; Li, Z.; Chen, A. Hydraulic redistribution of soil water by roots of two desert riparian phreatophytes in northwest China’s extremely arid region. Plant Soil 2013, 372, 297–308. [Google Scholar] [CrossRef]
  5. Deng, L.; Wang, K.; Li, J.; Zhao, G.; Shang, G.Z. Effect of soil moisture and atmospheric humidity on both plant productivity and diversity of native grasslands across the Loess Plateau, China. Ecol. Eng. 2016, 94, 525–531. [Google Scholar] [CrossRef]
  6. Li, X.R.; Ma, F.Y.; Xiao, H.L.; Wang, X.P.; Kim, K.C. Long-term effects of revegetation on soil water content of sand dunes in arid region of Northern China. J. Arid Environ. 2004, 57, 1–16. [Google Scholar] [CrossRef]
  7. Lei, J.Q.; Li, S.Y.; Jin, Z.Z.; Fan, J.L.; Wang, H.F.; Fan, D.D.; Zhou, H.W.; Gu, F.; Qiu, Y.Z.; Xu, B. Comprehensive eco-environmental effects of the shelter-forest ecological engineering along the Tarim Desert Highway. Chin. Sci. Bull. 2008, 53, 190–202. [Google Scholar] [CrossRef] [Green Version]
  8. Li, C.; Shi, X.; Mohamad, O.A.; Gao, J.; Xu, X.; Xie, Y. Moderate irrigation intervals facilitate establishment of two desert shrubs in the Taklimakan Desert Highway Shelterbelt in China. PLoS ONE 2017, 12, e0180875. [Google Scholar] [CrossRef] [Green Version]
  9. Dai, Y.; Zheng, X.J.; Tang, L.S.; Li, Y. Stable oxygen isotopes reveal distinct water use patterns of two Haloxylon species in the Gurbantonggut Desert. Plant Soil 2015, 389, 73–87. [Google Scholar] [CrossRef]
  10. Zhang, J.G.; Xu, X.W.; Lei, J.Q.; Sun, S.G.; Fan, J.L.; Li, S.Y.; Qiu, Y.Z.; Xu, B. The salt accumulation at the shifting aeolian sandy soil surface with high salinity groundwater drip irrigation in the hinterland of the Taklimakan Desert. Chin. Sci. Bull. 2008, 53, 63–70. [Google Scholar] [CrossRef] [Green Version]
  11. Feikema, P.M.; Morris, J.D.; Connell, L.D. The water balance and water sources of a Eucalyptus plantation over shallow saline groundwater. Plant Soil 2010, 332, 429–449. [Google Scholar] [CrossRef]
  12. Zhang, J.; Xu, X.; Li, S.; Zhao, Y.; Zhang, A.; Zhang, T.; Jiang, R. Is the Taklimakan Desert Highway Shelterbelt Sustainable to Long-Term Drip Irrigation with High Saline Groundwater? PLoS ONE 2016, 11, e0164106. [Google Scholar] [CrossRef]
  13. Li, C.; Lei, J.; Zhao, Y.; Xu, X.; Li, S. Effect of saline water irrigation on soil development and plant growth in the Taklimakan Desert Highway shelterbelt. Soil Tillage Res. 2015, 146, 99–107. [Google Scholar] [CrossRef]
  14. Wang, R.; Kang, Y.; Wan, S.; Hu, W.; Liu, S.; Liu, S. Salt distribution and the growth of cotton under different drip irrigation regimes in a saline area. Agric. Water Manag. 2011, 100, 58–69. [Google Scholar] [CrossRef]
  15. Zhang, J.G.; Xu, X.W.; Lei, J.Q.; Li, S.Y.; Hill, R.L.; Zhao, Y. The effects of soil salt crusts on soil evaporation and chemical changes in different ages of Taklimakan Desert Shelterbelts. J. Soil Sci. Plant Nutr. 2013, 13, 1019–1028. [Google Scholar] [CrossRef]
  16. Likos, W.J.; Yao, J. Effects of constraints on van Genuchten parameters for modeling soil-water characteristic curves. J. Geotech. Geoenviron. Eng. 2014, 140, 06014013. [Google Scholar] [CrossRef]
  17. Guo, Z.Q.; Lai, Y.M.; Jin, J.F.; Zhou, J.R.; Sun, Z.; Zhao, K. Effect of Particle Size and Solution Leaching on Water Retention Behavior of Ion-Absorbed Rare Earth. Geofluids 2020, 2020, 4921807. [Google Scholar] [CrossRef]
  18. Raghuram, A.S.S.; Basha, B.M.; Moghal, A.A.B. Effect of Fines Content on the Hysteretic Behavior of Water-Retention Characteristic Curves of Reconstituted Soils. J. Mater. Civ. Eng. 2020, 32, 04020057. [Google Scholar] [CrossRef]
  19. Wang, M.; Liu, H.; Lennartz, B. Small-scale spatial variability of hydro-physical properties of natural and degraded peat soils. Geoderma 2021, 399, 115123. [Google Scholar] [CrossRef]
  20. Kalhoro, S.A.; Xu, X.; Ding, K.; Chen, W.; Shar, A.G.; Rashid, M. The effects of different land uses on soil hydraulic properties in the Loess Plateau, Northern China. Land Degrad. Dev. 2018, 29, 3907–3916. [Google Scholar] [CrossRef]
  21. Zhou, H.; Mooney, S.J.; Peng, X. Bimodal Soil Pore Structure Investigated by a Combined Soil Water Retention Curve and X-Ray Computed Tomography Approach. Soil Sci. Soc. Am. J. 2017, 81, 1270–1278. [Google Scholar] [CrossRef]
  22. Alves, R.D.; Gitirana, G.F.N., Jr.; Vanapalli, S.K. Advances in the modeling of the soil–water characteristic curve using pore-scale analysis. Comput. Geotech. 2020, 127, 103766. [Google Scholar] [CrossRef]
  23. Guo, Z.Q.; Zhou, J.R.; Zhou, K.F.; Jin, J.F.; Wang, X.J.; Kui, Z. Soil-water characteristics of weathered crust elution-deposited rare earth ores. Trans. Nonferrous Met. Soc. China 2021, 31, 1452–1464. [Google Scholar] [CrossRef]
  24. Zhao, G.; Zou, W.; Han, Z.; Wang, D.X.; Wang, X.Q. Evolution of soil-water and shrinkage characteristics of an expansive clay during freeze-thaw and drying-wetting cycles. Cold Reg. Sci. Technol. 2021, 186, 103275. [Google Scholar] [CrossRef]
  25. Wu, T.N.; Wu, G.L.; Wang, D.; Shi, Z.H. Soil-hydrological properties response to grazing exclusion in a steppe grassland of the Loess Plateau. Environ. Earth Sci. 2013, 71, 745–752. [Google Scholar] [CrossRef]
  26. Matlan, S.J.; Taha, M.R.; Mukhlisin, M. Assessment of model consistency for determination of soil–water characteristic curves. Arab. J. Sci. Eng. 2016, 41, 1233–1240. [Google Scholar] [CrossRef]
  27. Genuchten, V.; Th, M.A. Closed-form equation for predicting the hydraulic conductivity of unsaturated soils. Soil Sci. Soc. Am. J. 1980, 44, 892–898. [Google Scholar] [CrossRef] [Green Version]
  28. Gardner, W.R. Some steady-state solutions of the unsaturated moisture flow equation with application to evaporation from a water table. Soil Sci. 1958, 85, 228–232. [Google Scholar] [CrossRef]
  29. Brooks, R.H.; Corey, A.T. Hydraulic Properties of Porous Media; Colorado State University Hydrology Paper No. 3 (March); Colorado State University: Fort Collins, CO, USA, 1964. [Google Scholar]
  30. Libutti, A.; Francavilla, M.; Monteleone, M. Hydrological Properties of a Clay Loam Soil as Affected by Biochar Application in a Pot Experiment. Agronomy 2021, 11, 489. [Google Scholar] [CrossRef]
  31. John, A.; Fuentes, H.R.; George, F. Characterization of the water retention curves of Everglades wetland soils. Geoderma 2021, 381, 114724. [Google Scholar] [CrossRef]
  32. Gao, Z.; Hu, X.; Li, X.Y. Changes in soil water retention and content during shrub encroachment process in Inner Mongolia, northern China. Catena 2021, 206, 105528. [Google Scholar] [CrossRef]
  33. Cao, B.; Tian, Y.; Gui, R.; Liu, Y. Experimental Study on the Effect of Key Factors on the Soil–Water Characteristic Curves of Fine-Grained Tailings. Front. Environ. Sci. 2021, 9, 710986. [Google Scholar] [CrossRef]
  34. Ren, X.; Kang, J.; Ren, J.; Chen, X.; Zhang, M. A method for estimating soil water characteristic curve with limited experimental data. Geoderma 2020, 360, 114013. [Google Scholar] [CrossRef]
  35. Andrabi, S.G.; Ghazanfari, E.; Vahedifard, F. An empirical relationship between Brooks–Corey and Fredlund–Xing soil water retention models. J. Porous Media 2019, 22, 1423–1437. [Google Scholar] [CrossRef]
  36. Jahara, M.S.; Muhammad, M.; Raihan, T.M. Performance evaluation of four-parameter models of the soil-water characteristic curve. Sci. World J. 2014, 2014, 569851. [Google Scholar]
  37. Zhou, J.; Yu, J.L. Influences affecting the soil-water characteristic curve. J. Zhejiang Univ. Sci. A 2005, 6, 797–804. [Google Scholar] [CrossRef]
  38. Lai, J.; Wang, Q. Comparison of Soil Water Retention Curve Model. J. Soil Water Conserv. 2003, 17, 137–140. [Google Scholar]
  39. Dang, M.; Chai, J.; Xu, Z.; Qin, Y.; Cao, J.; Liu, F. Soil water characteristic curve test and saturated-unsaturated seepage analysis in Jiangcungou municipal solid waste landfill, China. Eng. Geol. 2020, 264, 105374. [Google Scholar] [CrossRef]
  40. Jiang, X.; Wu, L.; Wei, Y. Influence of Fine Content on the Soil–Water Characteristic Curve of Unsaturated Soils. Geotech. Geol. Eng. 2019, 38, 1371–1378. [Google Scholar] [CrossRef]
  41. Lu, Y.; Abuel-Naga, H.; Leong, E.C.; Bouazza, A.; Lock, P. Effect of water salinity on the water retention curve of geosynthetic clay liners. Geotext. Geomembr. 2018, 46, 707–714. [Google Scholar] [CrossRef]
  42. Xing, X.; Ma, X. Differences in loam water retention and shrinkage behavior: Effects of various types and concentrations of salt ions. Soil Tillage Res. 2017, 167, 61–72. [Google Scholar] [CrossRef]
  43. Dong, Y.Y.; Zhao, C.; Yu, Z.T.; Wang, D.D.; Ban, C.G. Characteristic Curves and Models Analysis of Soil Water in Interdune at the Southern Edge of Gurbantunggut Desert. J. Soil Water Conserv. 2017, 31, 166–171, (In Chinese with English Abstract). [Google Scholar]
  44. Ding, X.Y.; Zhou, Z.B.; Lei, J.Q.; Wang, Y.D.; Lu, J.J.; Li, X.J. Analysis and comparison of models for soil water characteristic curves of Tarim Desert Highway Shelterbelt. Arid Land Geogr. 2015, 38, 985–993, (In Chinese with English Abstract). [Google Scholar]
  45. Bayat, H.; Ebrahimi, E. Effects of various input levels and different soil water retention curve models on water content estimation using different statistical methods. Hydrol. Res. 2016, 47, 312–332. [Google Scholar] [CrossRef]
  46. Li, S.; Xie, Y.; Xin, Y.; Liu, G.; Wang, W.; Gao, X.; Zhai, J.R.; Li, J. Validation and Modification of the Van Genuchten Model for Eroded Black Soil in Northeastern China. Water 2020, 12, 2678. [Google Scholar] [CrossRef]
  47. Sun, F.; Xiao, B.; Li, S.; Kidron, G.J. Towards moss biocrust effects on surface soil water holding capacity: Soil water retention curve analysis and modeling. Geoderma 2021, 399, 115120. [Google Scholar] [CrossRef]
  48. Soil Survey Staff. Kellogg Soil Survey Laboratory Methods Manual; Soil Survey Investigations Report No. 42, Version 5.0; Burt, R., Soil Survey Staff, Eds.; USDA Natural Resources Conservation Service: Lincoln, NE, USA, 2014.
  49. Chen, J.; Chai, H.; Gillerman, L.; Liu, C.; Zhang, L. Impact of treated waste water quality on repellent and wettable soil water characteristic curve. Trans. Chin. Soc. Agric. Eng. 2018, 34, 121–127, (In Chinese with English Abstract). [Google Scholar]
  50. Gao, H.; Guo, S.; Liu, W.; Li, M.; Zhang, J. Spatial Variability of Soil Water Retention Curve under Fertilization Practices in Arid-highland of the Loess Plateau. Trans. Chin. Soc. Agric. Mach. 2014, 45, 161–165+176, (In Chinese with English Abstract). [Google Scholar]
  51. Zhang, J.; Wang, Q.; Wang, W.; Zhang, X. The dispersion mechanism of dispersive seasonally frozen soil in western Jilin Province. Bull. Eng. Geol. Environ. 2021, 80, 5493–5503. [Google Scholar] [CrossRef]
  52. Li, S.; Lu, L.; Gao, Y.; Zhang, Y.; Shen, D. An Analysis on the Characteristics and Influence Factors of Soil Salinity in the Wasteland of the Kashgar River Basin. Sustainability 2022, 14, 3500. [Google Scholar] [CrossRef]
  53. Zhang, G.S.; Chan, K.Y.; Oates, A.; Heenan, D.P.; Huang, G.B. Relationship between soil structure and runoff/soil loss after 24 years of conservation tillage. Soil Tillage Res. 2007, 92, 122–128. [Google Scholar] [CrossRef]
  54. Lipiec, J.; Walczak, R.; Witkowska-Walczak, B.; Nosalewicz, A.; Słowińska-Jurkiewicz, A.; Sławiński, C. The effect of aggregate size on water retention and pore structure of two silt loam soils of different genesis. Soil Tillage Res. 2007, 97, 239–246. [Google Scholar] [CrossRef]
  55. Lan, Z.; Zhao, Y.; Zhang, J.; Yang, X.; Sial, T.A.; Khan, M.N. Effects of the long-term fertilization on pore and physicochemical characteristics of loess soil in Northwest China. Agron. J. 2020, 112, 4741–4751. [Google Scholar] [CrossRef]
  56. Zhang, J.; Zuo, X.; Zhou, X.; Lv, P.; Lian, J.; Yue, X. Long-term grazing effects on vegetation characteristics and soil properties in a semiarid grassland, northern China. Environ. Monit. Assess. 2017, 189, 216. [Google Scholar] [CrossRef]
  57. Keesstra, S.; Pereira, P.; Novara, A.; Brevik, E.C.; Azorin-Molina, C.; Parras-Alcántara, L.; Jordán, A.; Cerdà, A. Effects of soil management techniques on soil water erosion in apricot orchards. Sci. Total Environ. 2016, 551, 357–366. [Google Scholar] [CrossRef] [PubMed] [Green Version]
  58. Yuan, C.; Feng, S.; Wang, J.; Huo, Z.; Ji, Q. Effects of irrigation water salinity on soil salt content distribution, soil physical properties and water use efficiency of maize for seed production in arid Northwest China. Int. J. Agric. Biol. Eng. 2018, 11, 137–145. [Google Scholar] [CrossRef] [Green Version]
  59. Cheng, M.; Wang, H.; Fan, J.; Wang, X.; Sun, X.; Yang, L.; Zhang, S.; Xiang, Y.; Zhang, F. Crop yield and water productivity under salty water irrigation: A global meta-analysis. Agric. Water Manag. 2021, 256, 107105. [Google Scholar] [CrossRef]
  60. Jia, X.H.; Xin-Rong, L.I.; Wang, X.P.; Fan, H.W.; Zhao, J.L. Primary study of spatial heteroge-neity of soil property in processes of shifting sand fixation in south-easter Tengger Desert. J. Soil Water Conserv. 2003, 17, 46–49, (In Chinese with English Abstract). [Google Scholar]
  61. Zhang, S.; Ding, G.D.; Yu, M.H.; Gao, G.L.; Zhao, Y.Y.; Wu, G.H.; Wang, L. Effect of straw checkerboards on wind proofing, sand fixation, and ecological restoration in shifting sandy land. Int. J. Environ. Res. Public Health 2018, 15, 2184. [Google Scholar] [CrossRef] [Green Version]
  62. Shi, Z.J.; Xu, L.H.; Wang, Y.H.; Yang, X.H.; Jia, Z.Q.; Guo, H.; Xiong, W.; Yu, P.T. Effect of rock fragments on macropores and water effluent in a forest soil in the stony mountains of the Loess Plateau, China. Afr. J. Biotechnol. 2012, 11, 9350–9361. [Google Scholar]
  63. Xu, L.H.; Shi, Z.J.; Wang, Y.H.; Chu, X.Z.; Yu, P.T.; Xiong, W. Contribution of rock fragments on formation of forest soil macropores in the stoney mountains of the Loess Plateau, China. J. Food Agric. Environ. 2012, 10, 1220–1226. [Google Scholar]
  64. Wang, Z.; Li, G.; Li, X.; Shan, S.; Zhang, J.; Li, S.; Fan, J. Characteristics of moisture and salinity of soil in Taklimakan Desert, China. Water Sci. Technol. 2012, 66, 1162–1170. [Google Scholar] [CrossRef] [PubMed]
  65. Webb, N.P.; Strong, C.L.; Chappell, A.; Marx, S.K.; McTainsh, G.H. Soil organic carbon enrichment of dust emissions: Magnitude, mechanisms and its implications for the carbon cycle. Earth Surf. Process. Landf. 2013, 38, 1662–1671. [Google Scholar] [CrossRef]
  66. Du, H.; Li, S.; Webb, N.P.; Zuo, X.; Liu, X. Soil organic carbon (SOC) enrichment in aeolian sediments and SOC loss by dust emission in the desert steppe, China. Sci. Total Environ. 2021, 798, 149189. [Google Scholar] [CrossRef] [PubMed]
  67. Chen, S.Y.; Huang, J.P.; Li, J.X.; Jia, R.; Jiang, N.X.; Kang, L.T.; Ma, X.J.; Xie, T.T. Comparison of dust emissions, transport, and deposition between the Taklimakan Desert and Gobi Desert from 2007 to 2011. Sci. China Earth Sci. 2017, 60, 1338–1355. [Google Scholar] [CrossRef]
  68. Hu, C.; Wang, H.; Wu, Y.; Lu, J.; Liu, C. Difference of Soil Water Characteristic Curves of Subtropical Soils with NaCl Solutions Treatments and Models Optimization. Trans. Chin. Soc. Agric. Mach. 2018, 49, 290–296+329, (In Chinese with English Abstract). [Google Scholar]
  69. Wei, Y.; Wang, H.; Yu, W.U.; Jia, R.; Jiang, N.; Kang, L.; Ma, X.; Xie, T. Effect of Biochar on Soil Hydrodynamic Parameters under Different Slopes. Trans. Chin. Soc. Agric. Mach. 2019, 50, 231–240, (In Chinese with English Abstract). [Google Scholar]
  70. Sun, X.; Fang, K.; Fei, Y.; She, D. Structure and Hydraulic Characteristics of Saline Soil Improved by Applying Biochar Based on Micro-CT Scanning. Trans. Chin. Soc. Agric. Mach. 2019, 50, 242–249, (In Chinese with English Abstract). [Google Scholar]
  71. Ortiz, A.C.; Jin, L. Chemical and hydrological controls on salt accumulation in irrigated soils of southwestern U.S. Geoderma 2021, 391, 114976. [Google Scholar] [CrossRef]
  72. Cox, C.; Jin, L.; Ganjegunte, G.; Borrok, D.; Lougheed, V.; Ma, L. Soil quality changes due to flood irrigation in agricultural fields along the Rio Grande in western Texas. Appl. Geochem. 2018, 90, 87–100. [Google Scholar] [CrossRef]
  73. Ferretti, G.; Di, G.D.; Faccini, B.; Coltorti, M. Mitigation of sodium risk in a sandy agricultural soil by the use of natural zeolites. Environ. Monit. Assess. 2018, 190, 646. [Google Scholar] [CrossRef]
  74. Qi, Z.; Feng, H.; Zhao, Y.; Zhang, T.; Yang, A.; Zhang, Z. Spatial distribution and simulation of soil moisture and salinity under mulched drip irrigation combined with tillage in an arid saline irrigation district, northwest China. Agric. Water Manag. 2018, 201, 219–231. [Google Scholar] [CrossRef]
  75. Thyagaraj, T.; Salini, U. Effect of pore fluid osmotic suction on matric and total suctions of compacted clay. Geotechnique 2015, 65, 952–960. [Google Scholar] [CrossRef]
  76. Yang, G.; Liu, S.; Yan, K.; Tian, L.; Li, P.; Li, X.; He, X. Effect of Drip Irrigation with Brackish Water on the Soil Chemical Properties for a Typical Desert Plant (Haloxylon Ammodendron) in the Manas River Basin. Irrig. Drain. 2020, 69, 460–471. [Google Scholar] [CrossRef]
  77. Abbasi, Y.; Ghanbarian-Alavijeh, B.; Liaghat, A.M. Evaluation of Pedotransfer Functions for Estimating Soil Water Retention Curve of Saline and Saline-Alkali Soils of Iran. Pedosphere 2011, 21, 230–237. [Google Scholar] [CrossRef]
  78. Nuth, M.; Laloui, L. Advances in modelling hysteretic water retention curve in deformable soils. Comput. Geotech. 2008, 35, 835–844. [Google Scholar] [CrossRef]
Figure 1. Location of the study area.
Water 14 01803 g001
Figure 2. Photos of sampling points.
Water 14 01803 g002
Figure 3. Fitting curves of soil water characteristics of VG model, BC model and G model. (al) is the serial number of the figure, (ad) is the model fitting result of CK processing 0–5 cm, 5–10 cm, 10–20 cm, 20–30 cm soil layer; (eh) is BL processing 0–5 cm, 5–10 cm, 10–20 cm and the model fitting results of the 20–30 cm soil layer; (il) is the model fitting result of the US treatment of 0–5 cm, 5–10 cm, 10–20 cm and 20–30 cm soil layers.
Water 14 01803 g003
Figure 4. Relative errors of SWCC models under CK, BL and US treatments. (The smaller the circle, the smaller the relative error).
Water 14 01803 g004
Figure 5. Distribution of soil equivalent pores in different soil layers under different treatments. (ad) for 0–5 cm, 5–10 cm, 10–20 cm and 20–30 cm soil layer, respectively. CK: shifting sandy land; BL: bare land without vegetation cover in the shelterbelt; US: under the shelterbelt.
Water 14 01803 g005
Figure 6. Water characteristic curves of each soil layer under different treatments. The fitted values are based on VG model; (a) 0–5 cm soil layer; (b) 5–10 cm soil layer; (c) 10–20 cm soil layer; (d) 20–30 cm soil layer.
Water 14 01803 g006
Table 1. Basic physiochemical properties of the collected soil samples.
Soil Depth (cm)LocationBulk
Density
(g/cm3)
EC
(µS/cm)
pHOrganic
Carbon
(g/kg)
Soil Mechanical Composition (%)Soil
Texture
Sand
(0.05–2 mm)
Silt
(0.002–0.05 mm)
Clay
(0–0.002 mm)
0–5CK1.55 a451 c9.39 a0.208 c89.052.838.12Sandy
BL1.43 b19,215 a8.73 a1.765 b82.389.018.61Loamy sand
US1.25 c10,175 b9.15 a3.222 a65.3325.469.21Sandy loam
5–10CK1.49 b762 c8.69 a0.379 a89.342.737.93Sandy
BL1.53 a4340 b8.8 a1.15 a86.924.818.27Loamy sand
US1.44 c6680 a8.95 a1.715 a87.944.367.7Loamy sand
10–20CK1.47c2455 a8.62 b0.788 a90.171.847.99Sandy
BL1.51a854.5 c8.71 b1.058 a86.094.639.28Loamy sand
US1.5b1157 b9.6 a1.182 a88.483.348.18Loamy sand
20–30CK1.47 b3240 a8.82 c0.83 ab87.974.877.16Sandy
BL1.6 a265 c9.52 b0.412 b87.492.79.81Loamy sand
US1.44 c951.5 b10.11 a0.912 a88.091.3110.6Loamy sand
Note: CK: shifting sandy land; BL: bare land without vegetation cover in the shelterbelt; US: under the shelterbelt. Different lowercase letters represent the significant differences between different treatments (p < 0.05). (Soil texture was classified according to USDA standards based on actual measured soil mechanical composition).
Table 2. R2 and RMSE of different fitting models.
LocationSoil Depth
(cm)
VG ModelBC ModelG Model
R2RMSE (%)R2RMSE (%)R2RMSE (%)
CK0–50.9940.01020.9970.00790.9190.0682
5–100.9960.00820.9980.00710.9060.0862
10–200.9980.01500.9960.00900.9170.0710
20–300.9980.06310.9980.00590.9080.0636
BL0–50.9870.01650.9770.02590.9440.0395
5–100.9970.00670.9920.01170.8840.0787
10–200.9970.00780.9980.00540.9350.0704
20–300.9950.01000.9970.00820.9480.0431
US0–50.9960.00860.9980.00500.9340.0765
5–100.9930.00890.9840.01470.9340.1133
10–200.9970.00730.9950.00950.9130.0822
20–300.9970.00600.9980.00480.9080.1576
mean0.99550.01400.99410.00960.92060.0792
Table 3. Parameters in the modeling of soil water characteristic curves.
LocationSoil Depth
(cm)
VG ModelBC ModelG Model
θr (%)θs (%)a (cm−1)nθr (%)θs (%)a (cm−1)λaba × b
CK0–50.0480.4110.0322.8410.0440.4050.0440.7280.3750.7280.273
5–100.0440.4090.0362.8050.0410.4020.0470.6630.3730.6630.247
10–200.0410.4090.0332.4280.0360.4000.0530.7080.3790.7080.268
20–300.0420.4090.0332.6900.0390.4030.0460.7330.3830.7330.281
BL0–50.0630.4300.0222.6700.0430.4210.0400.9900.3660.9900.362
5–100.0470.3550.0223.2910.0400.3550.0370.7100.3630.7100.258
10–200.0410.4230.0442.3020.0360.4090.0620.7110.3790.7110.269
20–300.0470.4670.0442.2570.0400.4520.0620.8260.3810.8260.315
US0–50.0800.4610.0312.1600.0730.4510.0450.7740.2900.7740.224
5–100.0380.3470.0402.0740.0160.3430.1010.6160.3520.6160.217
10–200.0510.4110.0342.2950.0460.4030.0490.7110.3390.7110.241
20–300.0450.3330.0352.5520.0430.3260.0470.5210.3280.5210.171
Note: θs: saturated water content; θr: wilting coefficient; α is a scale parameter that is related to the inverse of the air entry suction; n is the fitting parameter; λ is the curve shape parameter; a and b are fitting parameters; a × b is the specific water capacity when the soil water suction is 1 Bar.
Table 4. Correlation degree analysis between VG model parameters and soil basic physiochemical parameters.
Correlation DegreepHEC
(µS/cm)
Organic
Carbon
(g/kg)
Bulk
Density
(g/cm3)
Sand
(0.05–2 mm)
Slit
(0.002–0.05 mm)
Clay
(0–0.002 mm)
a0.9250.6840.7830.9300.9260.7440.917
n0.9390.6940.7940.9520.9480.7810.922
Table 5. Soil water parameters calculated from the VG models.
DepthLocationθs (%)θf (%)θr (%)θa (%)θra (%)
0–5CK40.9213.894.759.139.13
BL42.7323.466.3117.1517.14
US46.1123.678.0515.6115.56
5–10CK40.6712.214.407.807.80
BL35.8016.464.7411.7211.72
US34.3214.393.8210.5610.51
10–20CK40.3615.904.0611.8411.83
BL41.4113.654.139.539.51
US41.2017.515.1412.3812.35
20–30CK40.5714.074.249.839.83
BL45.6715.844.7011.1411.12
US39.5912.384.548.598.52
Note: θs: saturated water content; θf: field capacity; θr: wilting coefficient; θa: available water content; θra: readily available water content. (BC and G model were not included because the VG model had the best fitting effect).
Publisher’s Note: MDPI stays neutral with regard to jurisdictional claims in published maps and institutional affiliations.

