
An Operative Framework for the Optimal Selection of Centrifugal Pumps As Turbines (PATs) in Water Distribution Networks (WDNs)


Department of Civil, Architectural and Environmental Engineering, University of Naples Federico II, 80125 Naples, Italy
*
Author to whom correspondence should be addressed.
Water 2022, 14(11), 1785; https://doi.org/10.3390/w14111785
Submission received: 13 May 2022
/
Revised: 29 May 2022
/
Accepted: 31 May 2022
/
Published: 1 June 2022
(This article belongs to the Special Issue Increasing the Efficiency of Urban Water Supply)
Abstract
:The current significant increase in energy consumption has resulted in the need to develop and implement effective approaches for defining alternative and sustainable solutions to couple primary resources with supporting methods of energy generation. In the field of effective water distribution network (WDN) management, the suitability of combining pressure regulation with small-scale hydropower generation is attracting even more interest, given that it can possibly reduce water leakages, as well as produce attractive rates of renewable energy. Specifically, pumps as turbines (PATs) are widely considered a viable solution because they combine hydraulic benefits with affordable investment and management costs. Nevertheless, despite several approaches available in the literature for the optimal selection and management of PATs, choosing the most suitable device to be installed in the network is still a challenge, especially when electrical regulation is arranged to modulate the PAT rotational speed and optimize the produced energy. Several approaches in the literature provide interesting solutions for assessing the effectiveness of electrical regulation when a PAT is installed within a water network. However, most of them require specific knowledge of the PAT mechanical features or huge computational efforts and do not support swift PAT selection. To overcome this lack of tools, in this work, an operative framework for the preliminary assessment of the main features (the head drop and the produced power at the best efficiency point (BEP), the impeller diameter and the rotational speed) of a PAT is proposed, aimed at both maximizing the daily produced energy and performing challenging economic selection. Then, it is assessed by estimations of the corresponding payback period (PP) and the net present value (NPV).
1. Introduction
According to the latest reports on the status of worldwide energy, as a consequence of population growth, economic development and urbanization, energy consumption is predicted to grow by about 28% by 2040 [1], resulting in a pressing need for the proper assessment of potential energy, economic and environmental impacts of sustainable solutions (i.e., small-scale hydropower generation) on the water–energy–food nexus environment [2].
In the context of the current interest in the development of sustainable and economic, viable criteria for water distribution networks (WDNs), different approaches have been employed to limit energy consumption and foster optimal usage of the devices as required for energy purposes. Among them, meta-heuristic approaches have been widely applied for pipeline optimization [3,4], pump scheduling enhancement [5,6,7] and optimal calibration of forcing actions for the design of water systems [8,9].
With specific reference to the effective management of WDNs, given the huge amount of leakages experienced by such systems [10,11], pressure regulation through pressure-reducing valves (PRVs) has been extensively used as a viable solution to limit the loss of significant water volumes [12,13].
In this context, the suitability of coupling pressure regulation with small-scale hydropower generation is attracting even more interest worldwide, its implementation allowing the application of well-known technologies in order to achieve attractive efficiencies and payback periods (PPs) [14].
Specifically, the benefits of replacing PRVs with pumps as turbines (PATs) have been widely assessed, given their capability to achieve significant efficiency and reduce investment and maintenance costs, as well as the ease of their procurement and spare part gathering [15]. Indeed, compared with classic micro-turbines, PATs result in a viable, cheaper approach for hydropower generation in pressurized systems because they consist of commercial pumps that are rather cheap and that work by both inverting the flow direction and applying the motor as an electric generator. PAT applications allow the selection of the most suitable model from a wide range of devices available in the market, without requiring a customized system and, thus, expensive procurement and management costs [16]. This achieves attractive payback periods for small-scale hydropower generation in WDNs serving centers with a low–medium number of inhabitants, given the range of exploitable pressure and, thus, of generated head drop. Conversely, compared with classic micro-turbines, PATs show lower flexibility in managing the variable flow rate and head; however, they are improvable through the implementation of hydraulic (HR) [17] and/or electrical regulation (ER) [18].
The attention of researchers and technicians working in the field of PAT technology has mainly been devoted to overcoming the lack of knowledge about their performance, as they are infrequently made available by manufacturers. Indeed, several authors carried out experimental and numerical analyses to develop predicting models suitable for different PAT devices. Among them, Derakhshan and Nourbakhsh [19] provided the results of a laboratory investigation to calibrate the numerical coefficients of both the head and the power characteristic curves of centrifugal, single-stage PATs in dimensionless terms with respect to PAT operations at the best efficiency point (BEP). A similar approach was then carried out by Pugliese et al. [20], aimed at extending the reliability of formulations from the literature to wider operative ranges, namely for a flow rate number ϕb (-) higher than 0.40 and specific speed in pump mode Ns of up to 60:
where Q (m3/s) is the flow rate, N is the rotational speed (rps), D is the runner’s diameter (m) and H is the head (m).
Later, the same authors [21,22] extended the experimental assessment to both single-stage and multi-stage, vertical-axis, centrifugal PATs, finding a direct correlation between the substantial constancy of the characteristics at the BEP, regardless of the rotational speed N in the range 5–50 rps.
Given the cost and time demands of experimental investigations, an alternative approach requires the implementation of computational fluid dynamics (CFD) models [23,24] to simulate the turbo-machine performance, both reproducing the internal fluid dynamic behavior [25,26] and assessing the influence of the geometric features of the device on its performing features [27].
Dimensionless characteristic curves require the knowledge of PAT characteristics at the BEP when running in turbine mode. Thus, the flow rate Qtb/Qpb and the head ratio Htp/Hpb at the BEP between turbine and pump mode can be set by using different models from the literature, where the subscripts t and p refer to turbine and pump mode, respectively. Among many analytic models from the literature, and extensively discussed by Pugliese et al. [22], the Yang et al. [28] equations (Equations (3) and (4)) are widely applied because they provide the best accuracy for both flow rate and head ratio estimation:
where ηpb (-) is the efficiency in pump mode at the BEP, calculated as follows:
where γ (N/m3) is the specific weight of water, and Hpb and Ppb are the head and the power in pump mode at the BEP, respectively.
As alternative approaches, Barbarelli et al. [29] developed a recursive framework to predict both the flow rate and the head ratios and the characteristic curves of centrifugal PATs, and Stefanizzi et al. [30] proposed an analytic model to assess the flow rate and the head ratios when varying the specific speed in direct mode Ns.
In the literature, a number of approaches also aimed to couple economic assessment and optimization procedures for the optimal selection and location of PATs or microturbines in WDNs [31,32,33]. Among them, Fecarotta and McNabola [34] implemented a novel optimization model to maximize the hydropower generation and the water savings related to leakage reduction, and Giugni et al. [35] developed a genetic algorithm code to evaluate the energy recovery by PATs in a district of the Naples (IT) network, observing interesting payback periods at the expense of suitable investment costs. Morani et al. [14] coupled a novel, mixed-integer, non-linear model and a global optimization solver for the optimal location and setting of PATs and PRVs in WDNs, observing the effectiveness of the proposed approach by comparing short computational efforts [36]. Fernandez Garcia et al. [37] investigated a methodological strategy for the optimal location of PATs, showing interesting results for branched and not-looped networks. Crespo Chacón et al. [38] presented a methodology for the optimal design of a PAT plant in Spain, remarking on the suitability of the proposed solution to both satisfy the hydraulic requirements and assure attractive energy production rates. Ebrahimi et al. [39] proposed an optimization approach to replace PRVs with PATs in WDNs, showing that ER can increase the overall performance of the recovery system; however, it needs greater investment and maintenance costs. Kandi et al. [40], by applying the same optimization procedure, remarked on the effectiveness of pressure regulation through PATs, especially during the hours of greater user consumption.
Nevertheless, many models from the literature are mainly based on the use of either long, time-consuming simulation models or complex, recursive approaches, in some cases, requiring specific setting parameters of the geometric and technical properties of the selected PAT model. Thus, despite the contributions available in the literature, the preliminary, optimal selection of a PAT in WDNs still remains a challenging issue.
In this work, the authors aim to overcome the lack of tools available in the literature, presenting an operative approach to easily detect, from a dataset of pump models available in the market, the main features of PAT devices able to both assure effective pressure regulation and optimize daily energy generation. A simple and effective workflow for the optimal estimation of the main characteristic parameters of PATs is, thus, discussed to both maximize the daily energy production and assure a viable payback period (PP) and net present value (NPV) when a PAT is installed within a water district of a WDN and ER is used to modulate its rotational speed.
2. Materials and Methods
In this work, the authors propose an operative framework for the optimal selection of PATs in WDNs, aiming to select, from a database of models available in the market, the model with the characteristic parameters (flow rate Q, head H and runner’s diameter D) that can maximize energy production consistently within the hydraulic and technical constraints of the system.
The procedure was developed with the expectation of having to perform ER, namely having to install a frequency modulator to vary the electrical frequency and, thus, the PAT rotational speed in the range [Nmin,…,Nmax].
The framework was based on the following assumptions:
- -
- the PAT location is initially set at the inlet branch of the water district, given both the discharge pattern and the pressure range acting on the WDN;
- -
- the daily pattern of user demand and the related flow rate Qi and excess pressure Hav,i are known for each i-th time step;
- -
- a database of characteristic parameters of pumps working in direct operation is available.
Starting from these assumptions, the selection framework contemplates the following steps. Given a j-th pump from the gathered database of commercially available PATs:
- The runner diameter Dj, the rotational speed N, the flow rate Qpb,j and the head Hpb,j are obtained;
- The flow rate Qtb,j, the head Htb,j and the power Ptb,j at the BEP in PAT mode are calculated for the rotational speed ;
- The flow rate number ϕb,j, the head number ψb,j and the power number πb,j dimensionless parameters are given:where g is the acceleration of gravity (m/s2), and ρ is the water density (kg/m3). It is worth mentioning that, according to Pugliese et al. [20,21], for centrifugal PATs ϕb,j, ψb,j and πb,j are constant when varying the rotational speed N;
- The characteristic curves ψi,j(ϕj) and πi,j(ϕj) are derived by applying the predictive models from the literature. Namely, for horizontal-axis, centrifugal PATs, Equations (10) and (11) from Pugliese et al. [20] are used:
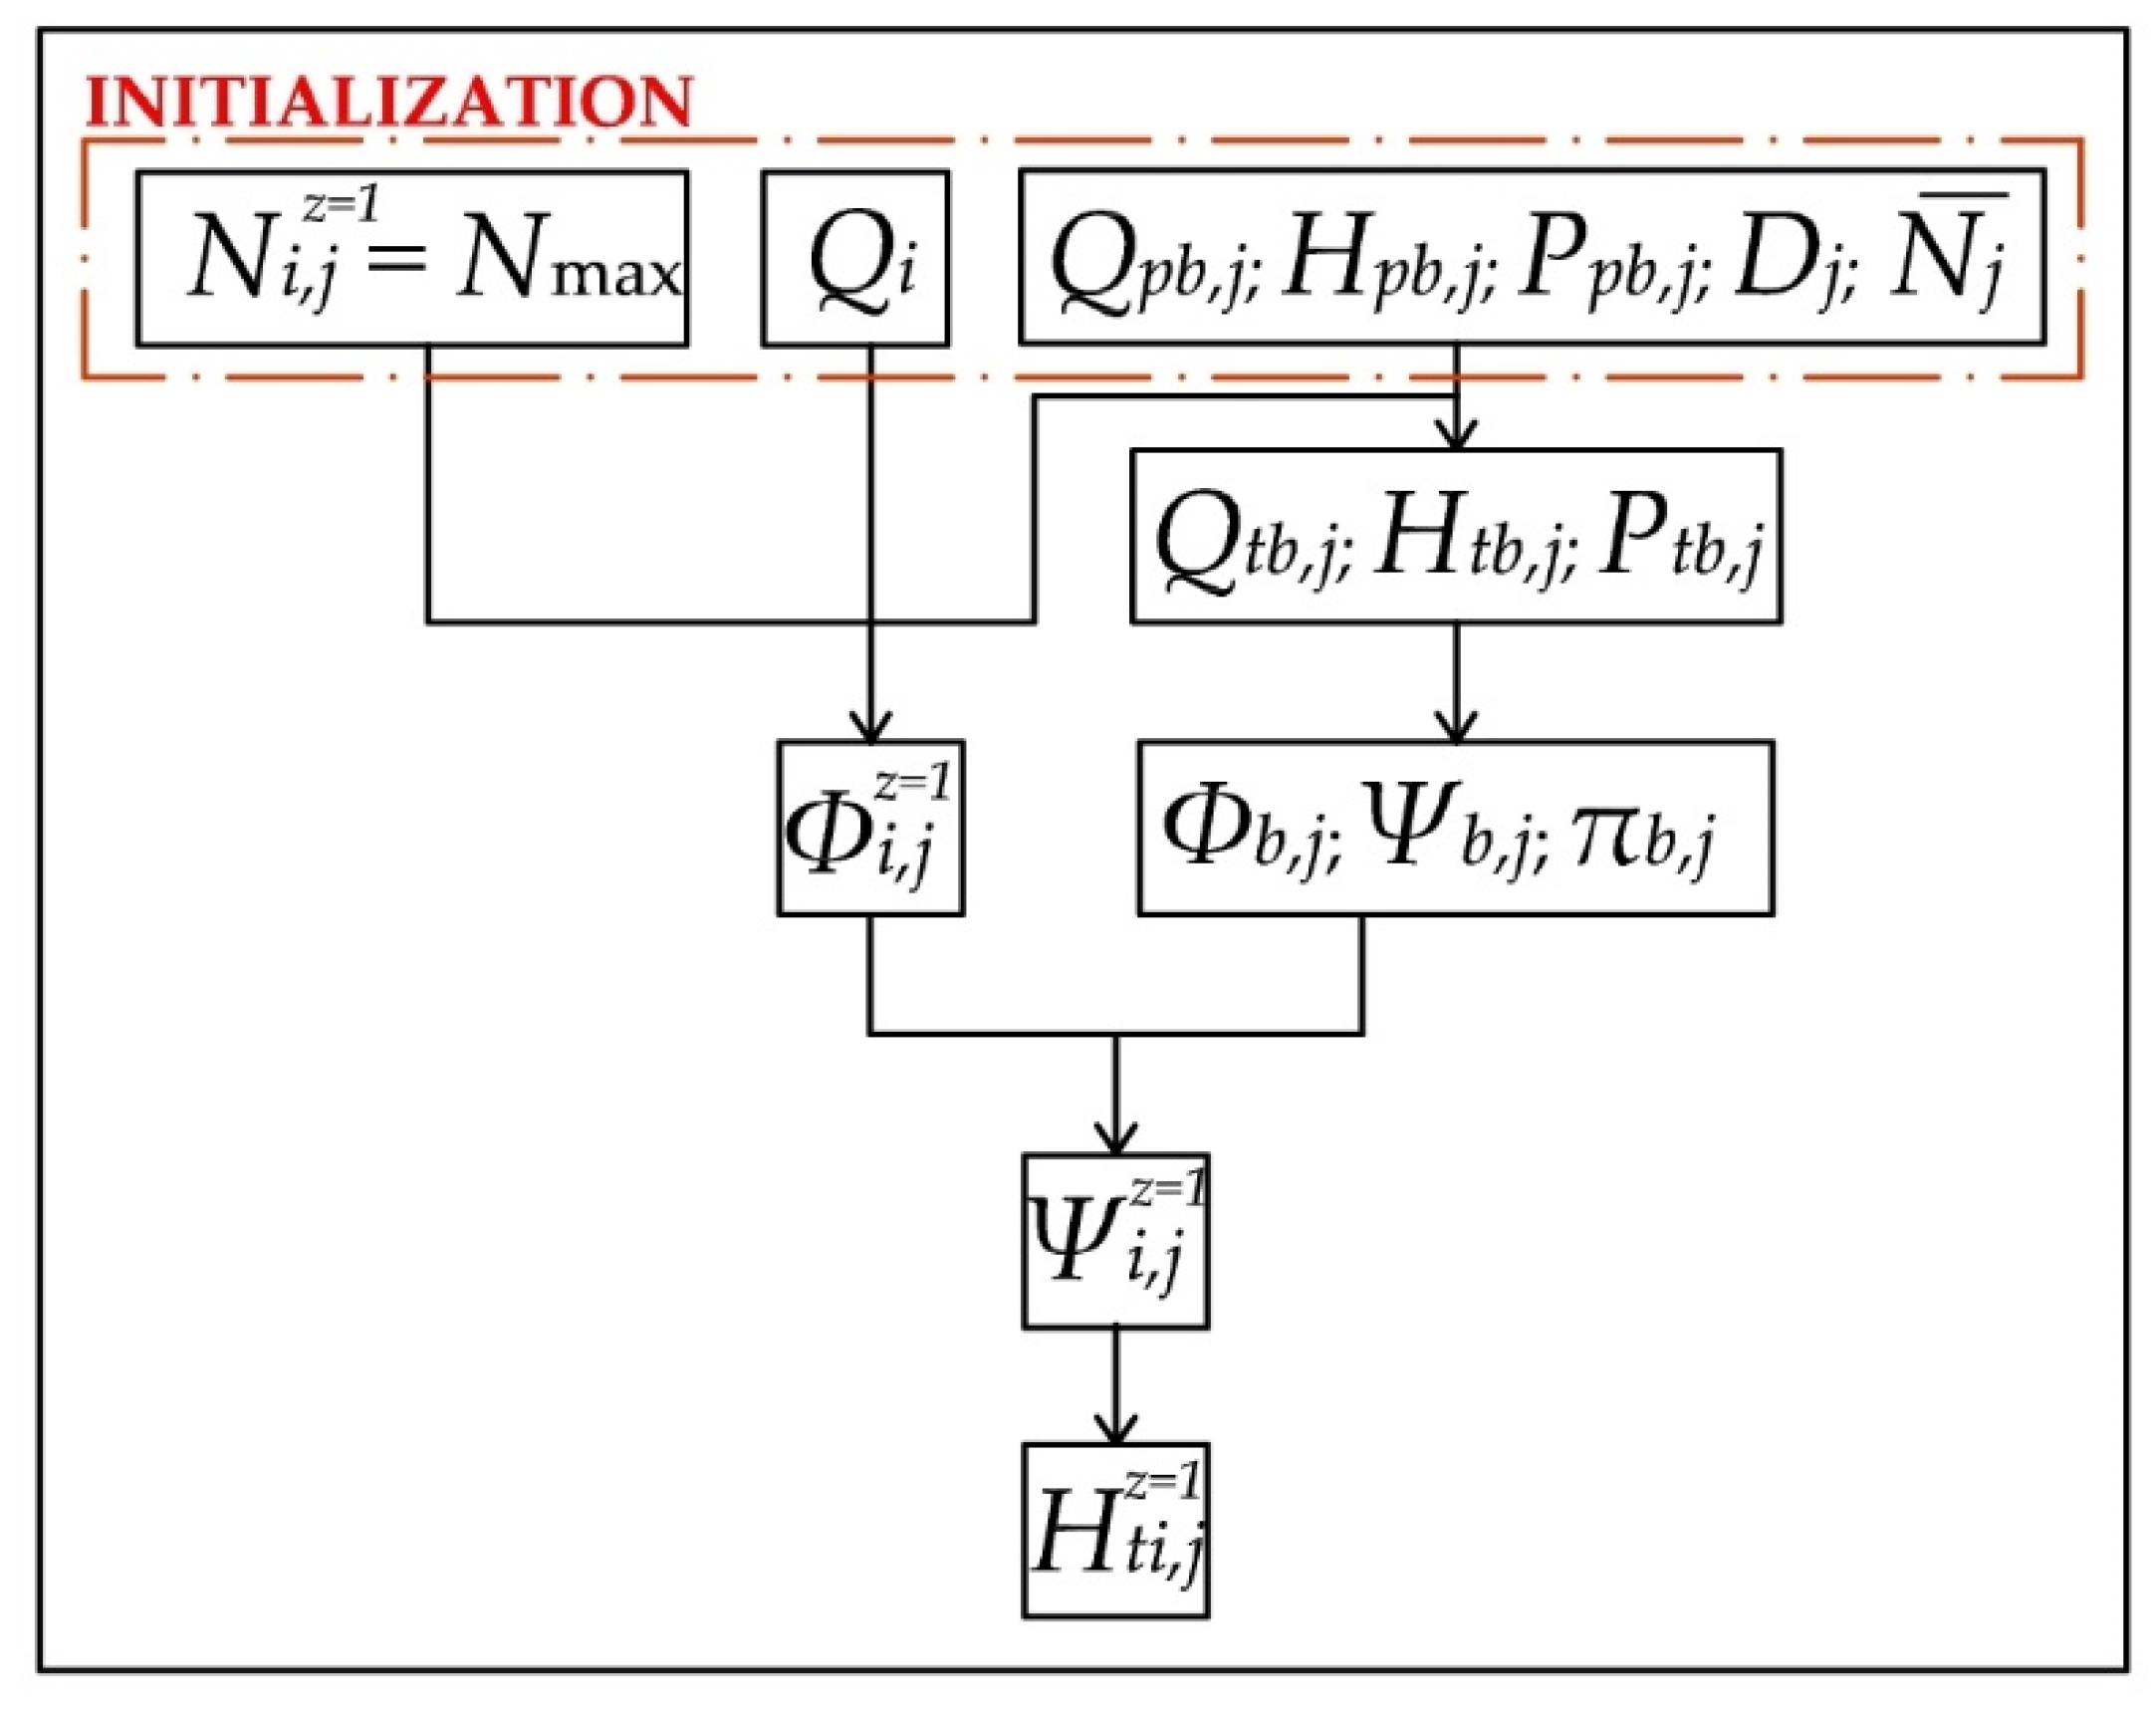
- To initialize the procedure (z = 1), given the flow rate Qi, the maximum rotational speed Ni,j z=1 = Nmax is set, and the flow rate number φi,jz=1 with z = 1…S* and S* is the number of iterations needed to reach the convergence;
- The head number ψi,j z=1 and the head drop Ht,i,j z=1 are estimated using Equations (10) and (11), respectively (Figure 1);
- If Ht,i,jz=1 > Ht,av,i, then the rotational speed Ni,jz+1 is lowered to an allowable value. Else, if Ht,i,jz=1 ≤ Ht,av,i, the power number πi,jk=1 and the power Pt,i,jz=1 are derived from Equation (11) and Equation (9), respectively;
- By varying the rotational speed N in the range [Nmin,…, Nmax], for each N, the power number πi,j is assessed using Equation (11) and the related power Pti,j using Equation (9) in order to find out the maximum value Ptmax,i,j achieved for the fixed Qi at varying N. The rotational speed N*i,j related to Ptmax,i,j, maximizing the produced power for the fixed flow rate Qi and the j-th pump model (Figure 2);
- If Pt,I,jz=1 = Ptmax,i,j, the fixed rotational speed Niz=1 = Nmax is the N*i,j, maximizing the produced power Pt,i,j. Else, the Ni,jz+1 is reduced in the next iteration;
- If N*i,j ≥ Nmax or N*i,j ≤ Nmin, then the Nmax or Nmin values are set, respectively, to maximize the power Pt,i,j in the allowable range of rotational speed N. Conversely, for Nmin < N*i,j < Nmax, the φiz+1 is calculated as a function of N*i,j;
- If the second condition at step 11 is valid, the head number ψi,jz+1 and the head drop Ht,i,jz+1 are obtained by Equations (10) and (8), respectively;
- For the optimal N*i,j, the overall PAT efficiency ηti,j is calculated as:
- If ηti,j ≥ (minimum threshold of allowable efficiency for PAT operations), the next i + 1-th time step is considered, else the PAT model is rejected;
- By performing the abovementioned steps 5–14 for each i-th time step, the maximum daily energy Ed,j generated by the j-th pump model is estimated as:where M is the number of time steps, and ∆ti the time step duration;
- By repeating steps 1–15 for each available j-th pump model, the pump model able to maximize Equation (13) is selected as the most suitable one.
For each pump, a cost–benefit analysis is performed, aiming to both assess the PP and the NPV of the investment. Specifically, the model of Novara et al. [31] is applied to estimate the combined investment cost of radial PAT and generator CPAT+gen (€) when varying the pair poles from 1 to 3:
The rest of the project costs for electrical and technical equipment (including the frequency modulator procurement and installation) Ceq (€) were set equal to 300% of CPAT+gen [42], and the yearly maintenance costs Cmain (€/year) were considered equal to 5% of CPAT+gen [41]. The total costs are, thus, estimated as:
where d is the operational lifetime set, consistent with recent studies [32,34], as equal to 10 years.
According to recent studies in the literature based on statistical analysis in European countries [32,34] and working for the sake of security by limiting the revenues deriving from the energy production, the energy sales to the national grid are assumed equal to 0.10 €/kWh, and the annual income of the water savings related to reduction of excess pressure is calculated using Equation (16):
where cw is set equal to 0.30 €/m3 [32], β is the leakage exponent set equal to 1.18 [43] and α is the leakage coefficient obtained from the following:
where c = 0.0001 L/(s∙m1+β), and Ff is the set of pipes with length Lf linked to the node [34].
The PP is estimated as the ratio between the total cost Ctot and the sum of the annual revenues from energy sales Ep and the annual income for water savings Wp. The NPV of the investment is, thus, calculated as:
where d and λ are the operational lifetime and the discount rate set as 10 years and 0.05, respectively.
3. Results and Discussion
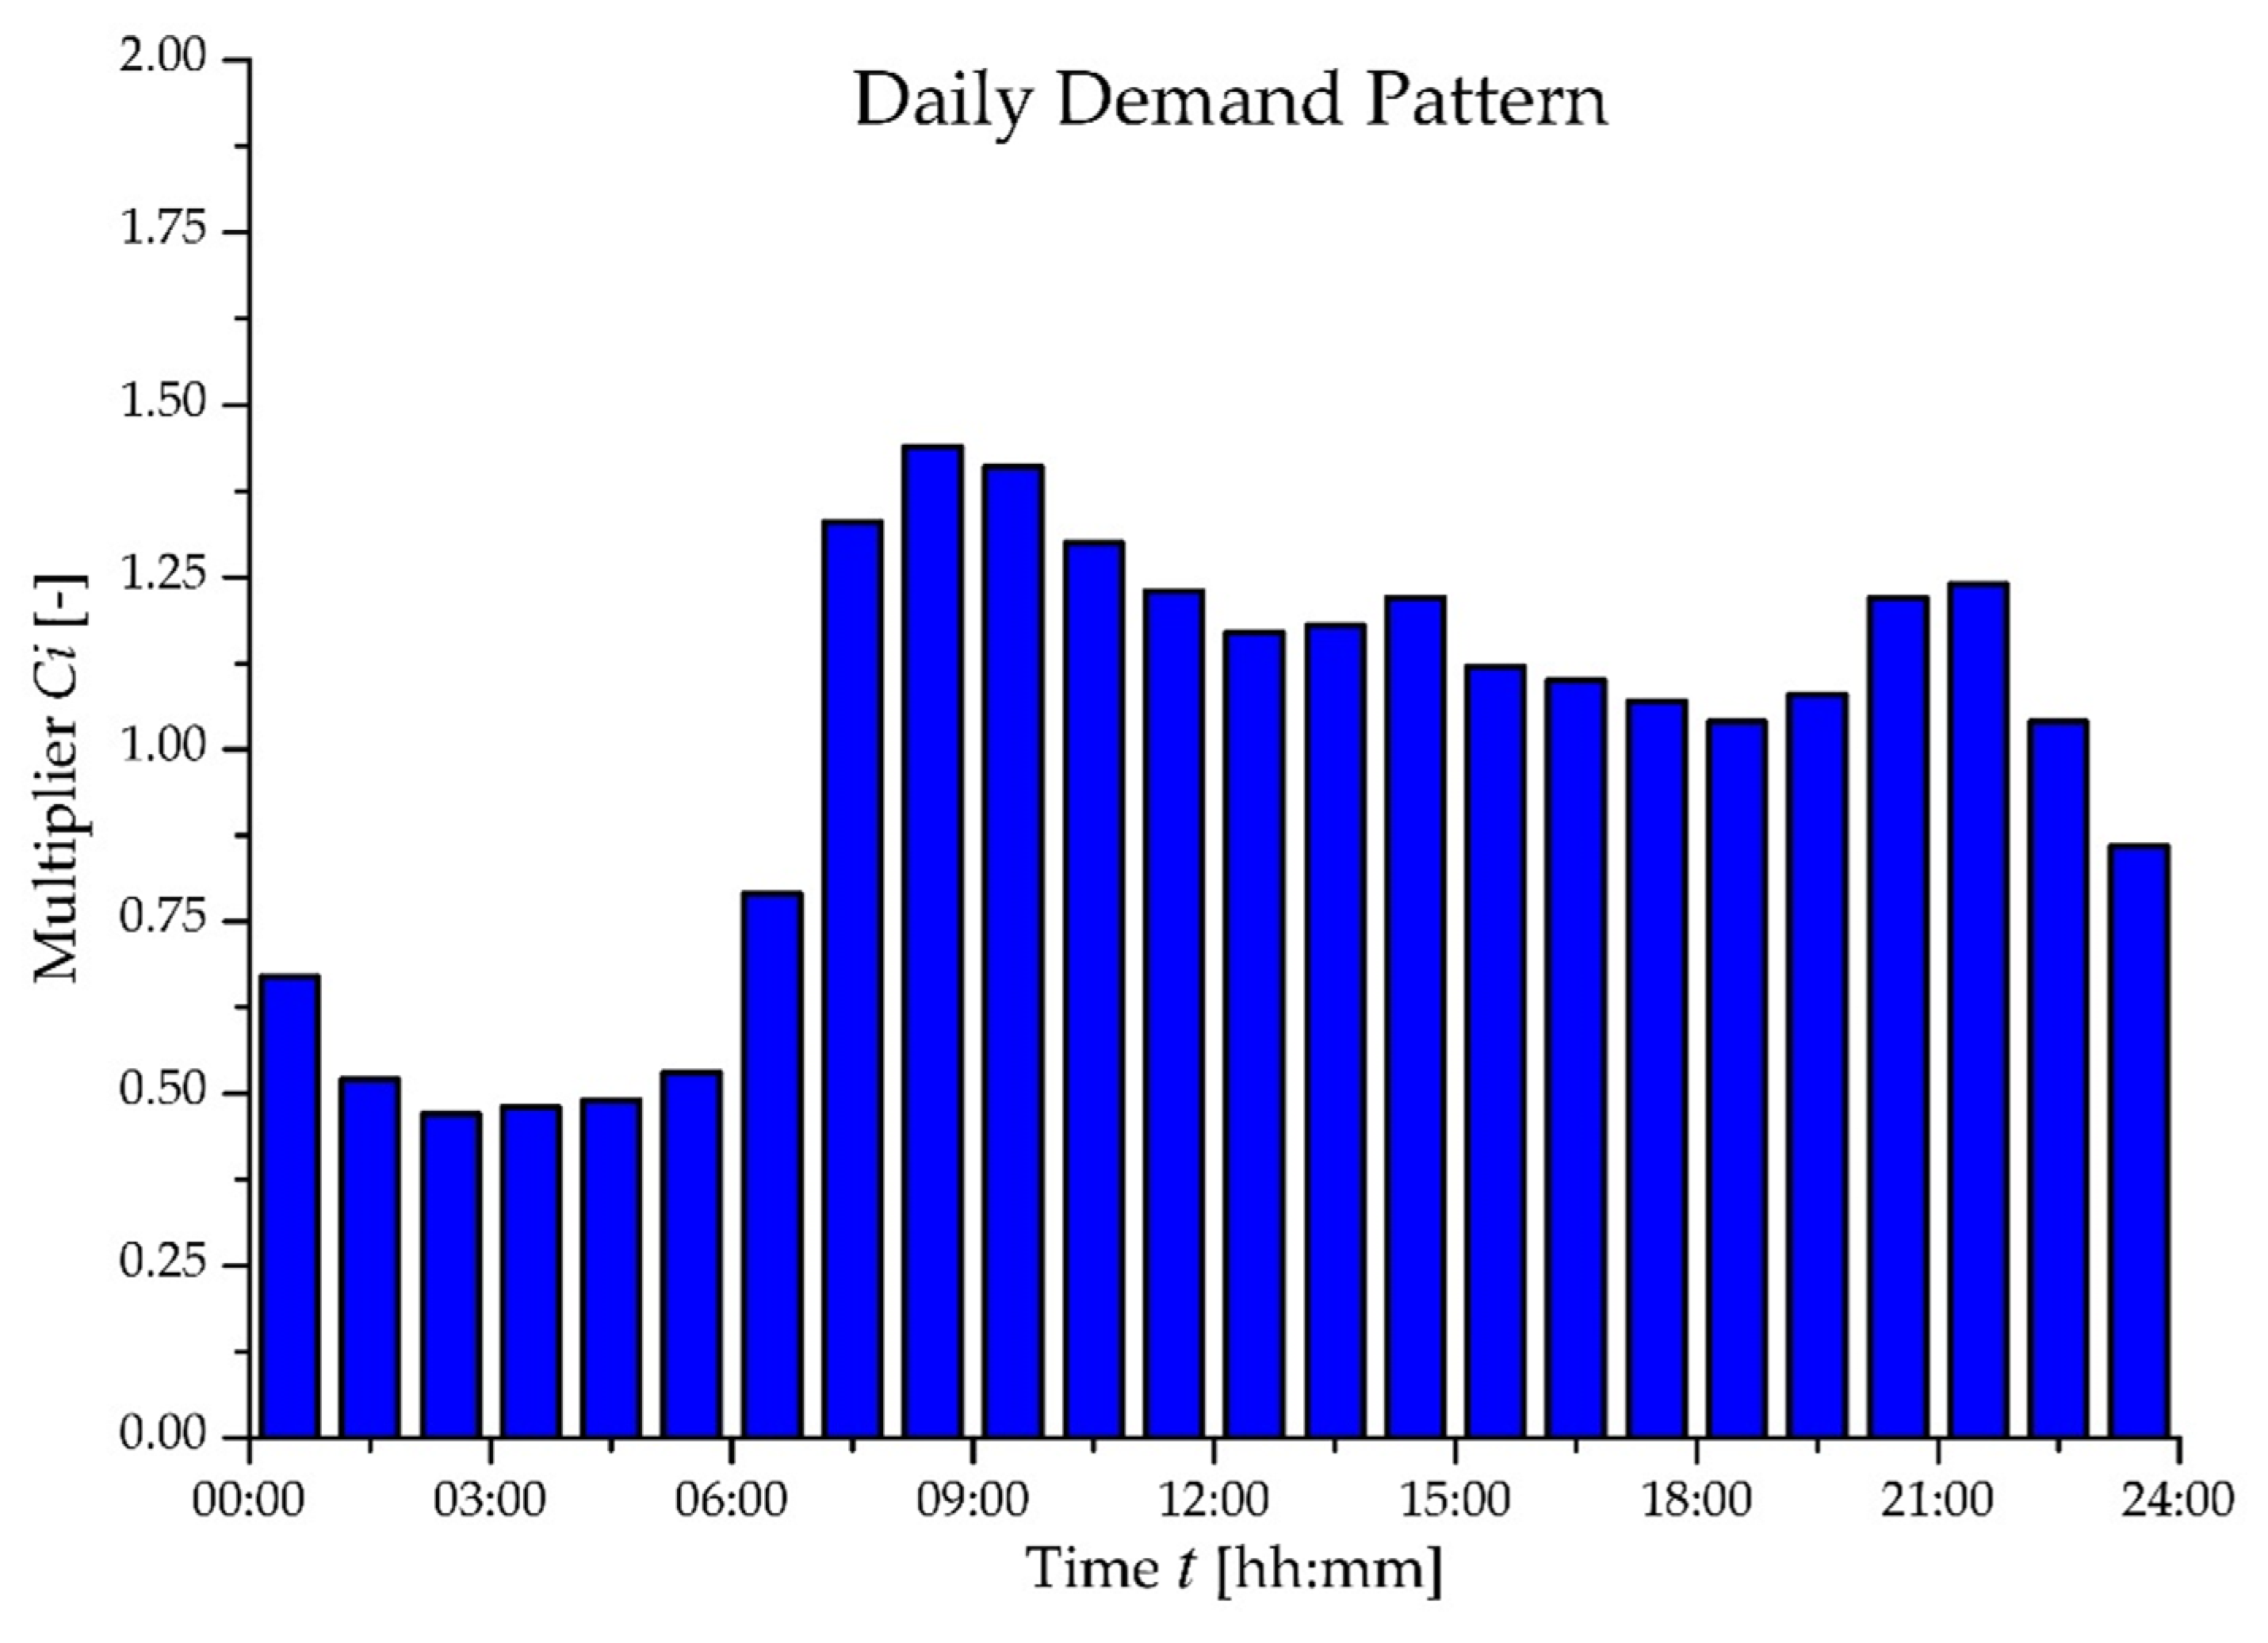
The proposed framework was tested on a simplified WDN district serving 10,000 inhabitants with an average flow rate Qtm = 23.1 L/s and a maximum flow rate Qt,max = 33.3 L/s. The daily demand plotted in Figure 3 was set [35] for simulations.
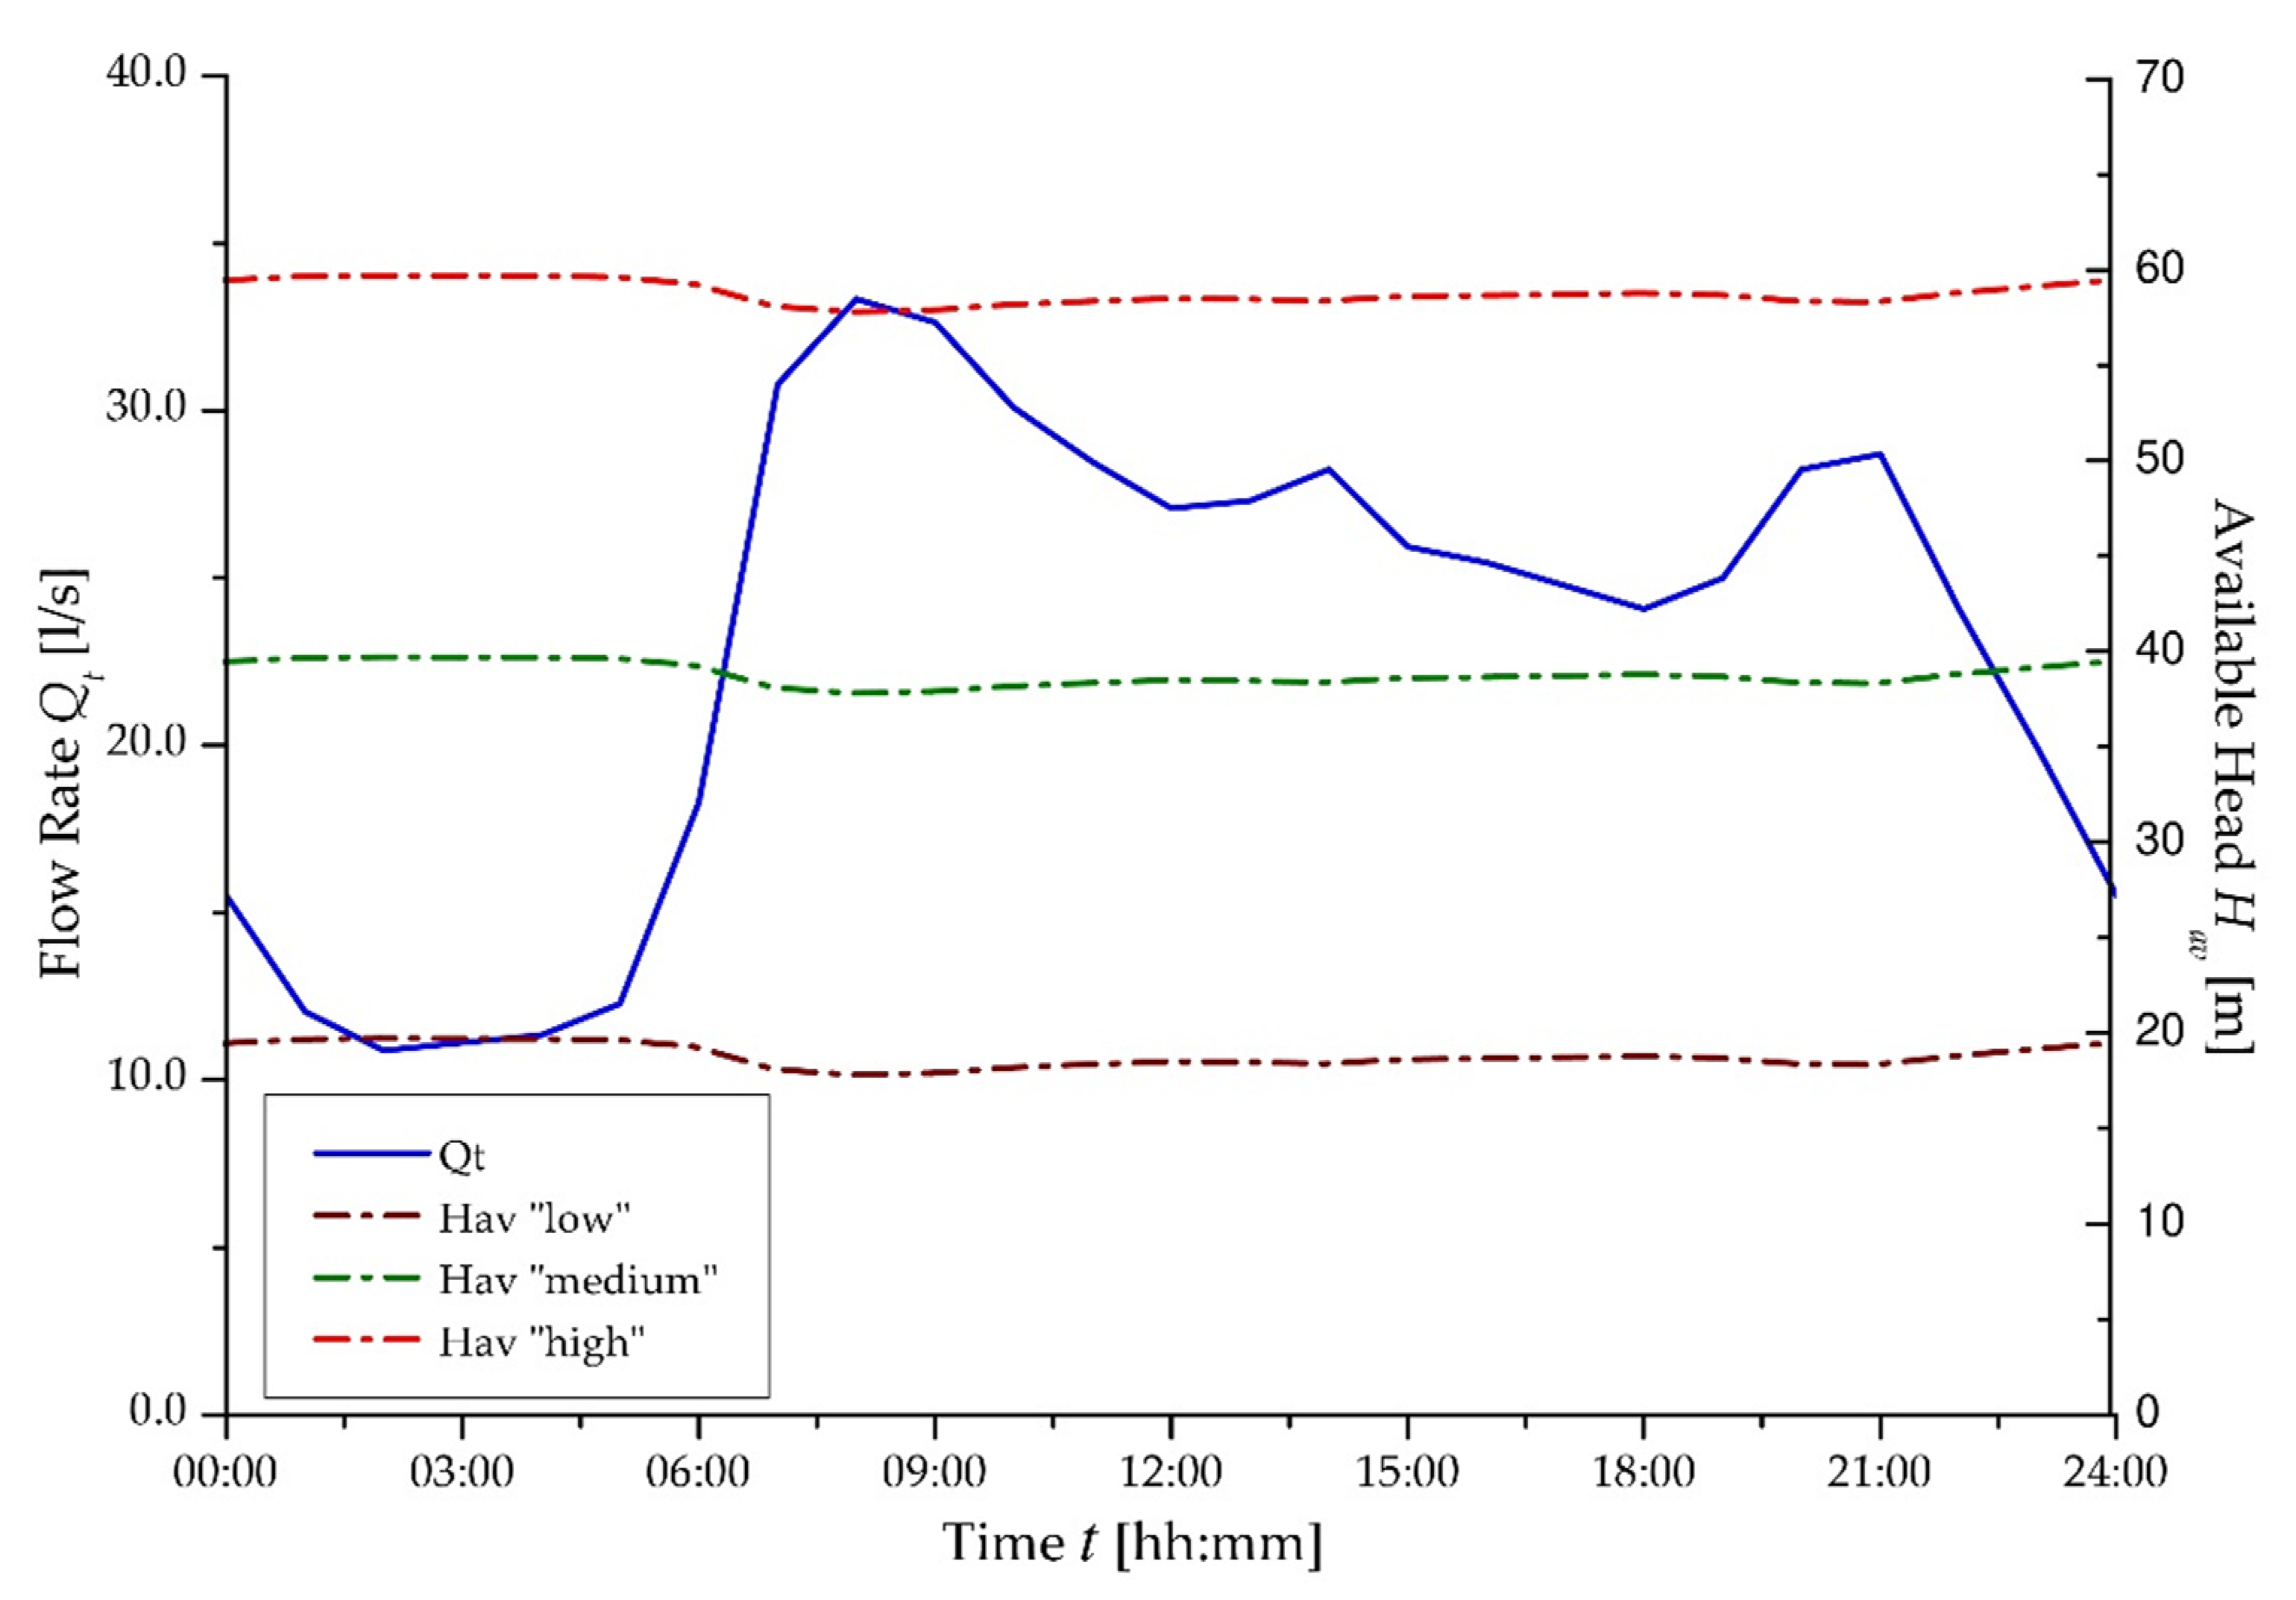
The available head Htav at each hourly time step was estimated considering a pressure set point at the delivery point of 30 m. Three scenarios were tested by varying the available head Htav as follows to assess the reliability of the approach when increasing the exploitable head: “low” scenario (a) with mean Htav = 19 m; “medium” scenario (b) with mean Htav = 29 m; and “high” scenario (c) with mean Htav = 59 m.
In the following Figure 4, the hourly flow rate Qt and the available head Htav for the three tested cases are plotted.
A database of 200 single-stage, centrifugal PATs was gathered from nine pump manufacturers, covering a wide range of operations, as summarized in the following Table 1.
The procedure herein proposed was applied to assess the potential energy recovery of the system and detect the characteristics of the most suitable PAT models. At each time step, given the ER, the PATs worked at suitable efficiency ηt, with none lower than 0.58. It is worth mentioning that, given the variation of PAT rotational speed N through the frequency modulator, the whole set of models from the collected dataset was potentially suitable for this purpose. Some of them (e.g., those providing excess head drop Ht at any time steps) were temporarily shut off in order to satisfy the hydraulic constraints of the network and to always ensure an exploited head Ht that is not higher than the available Hav.
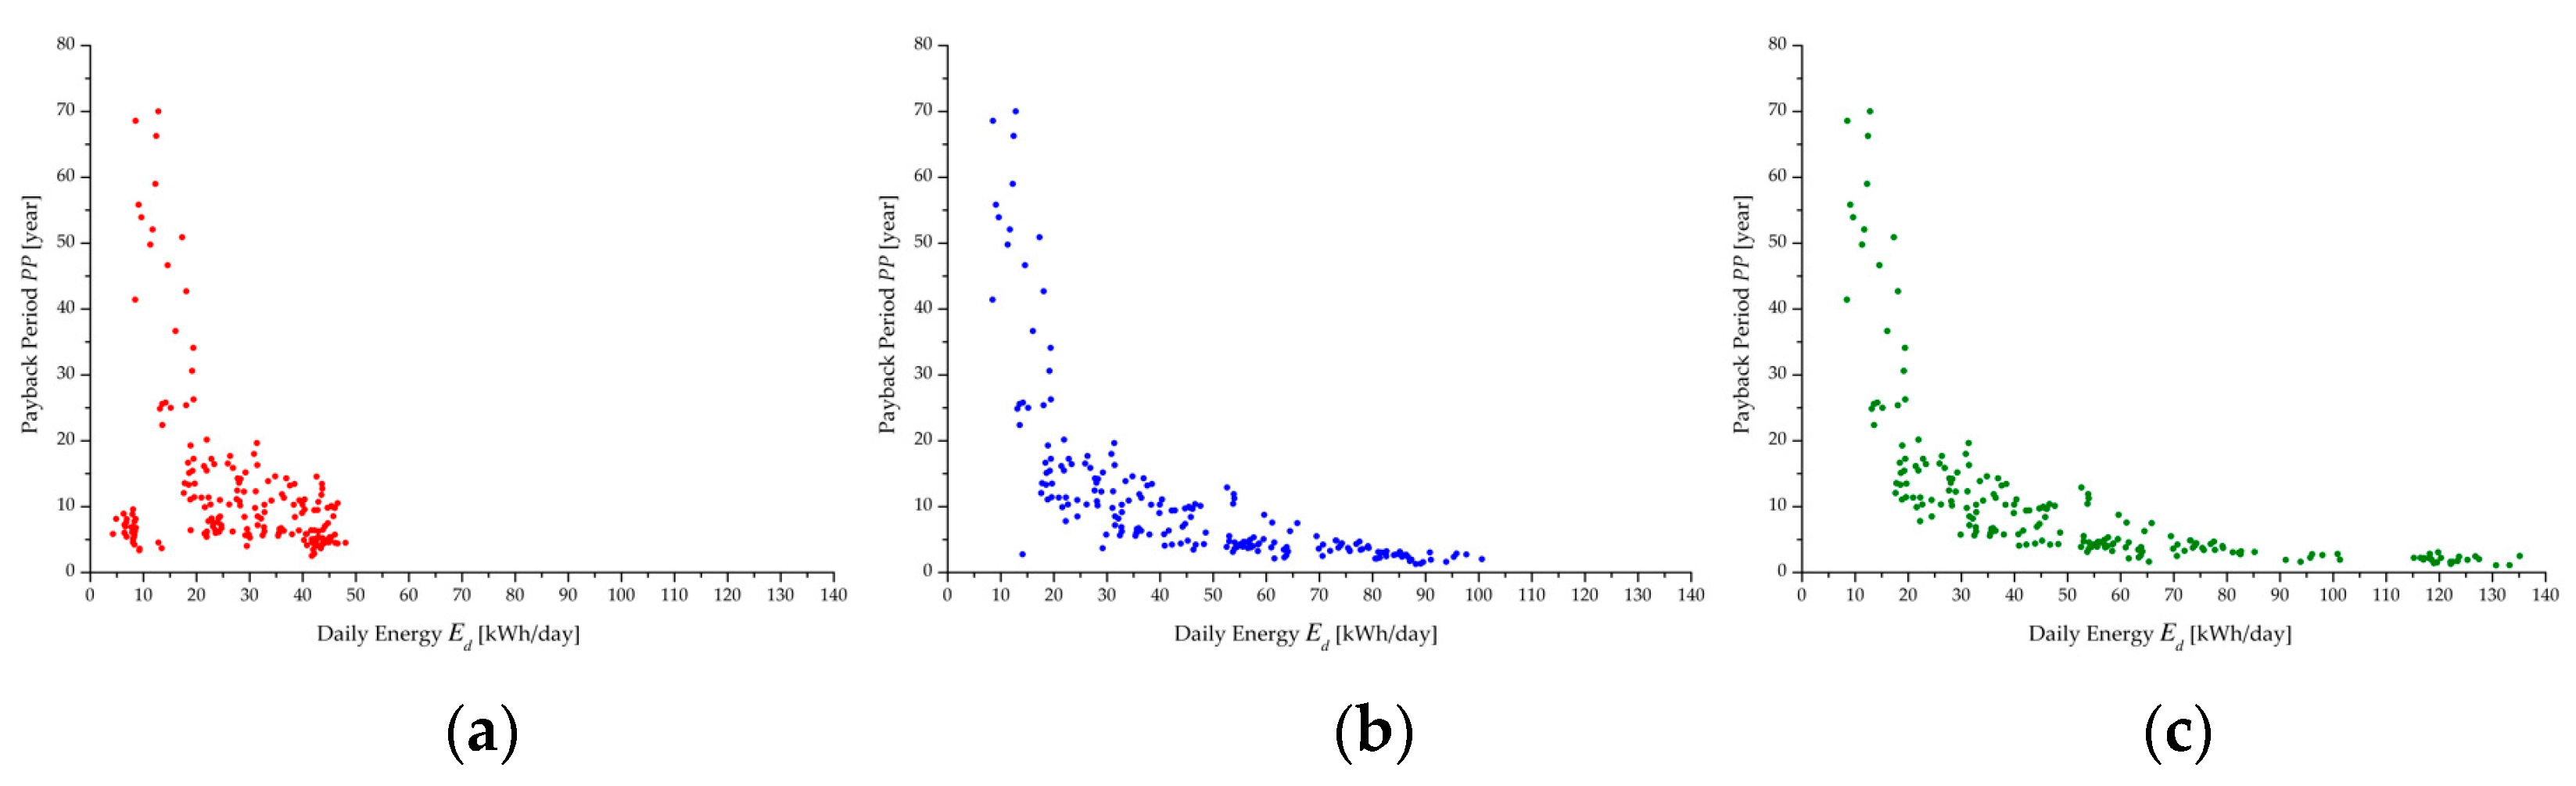
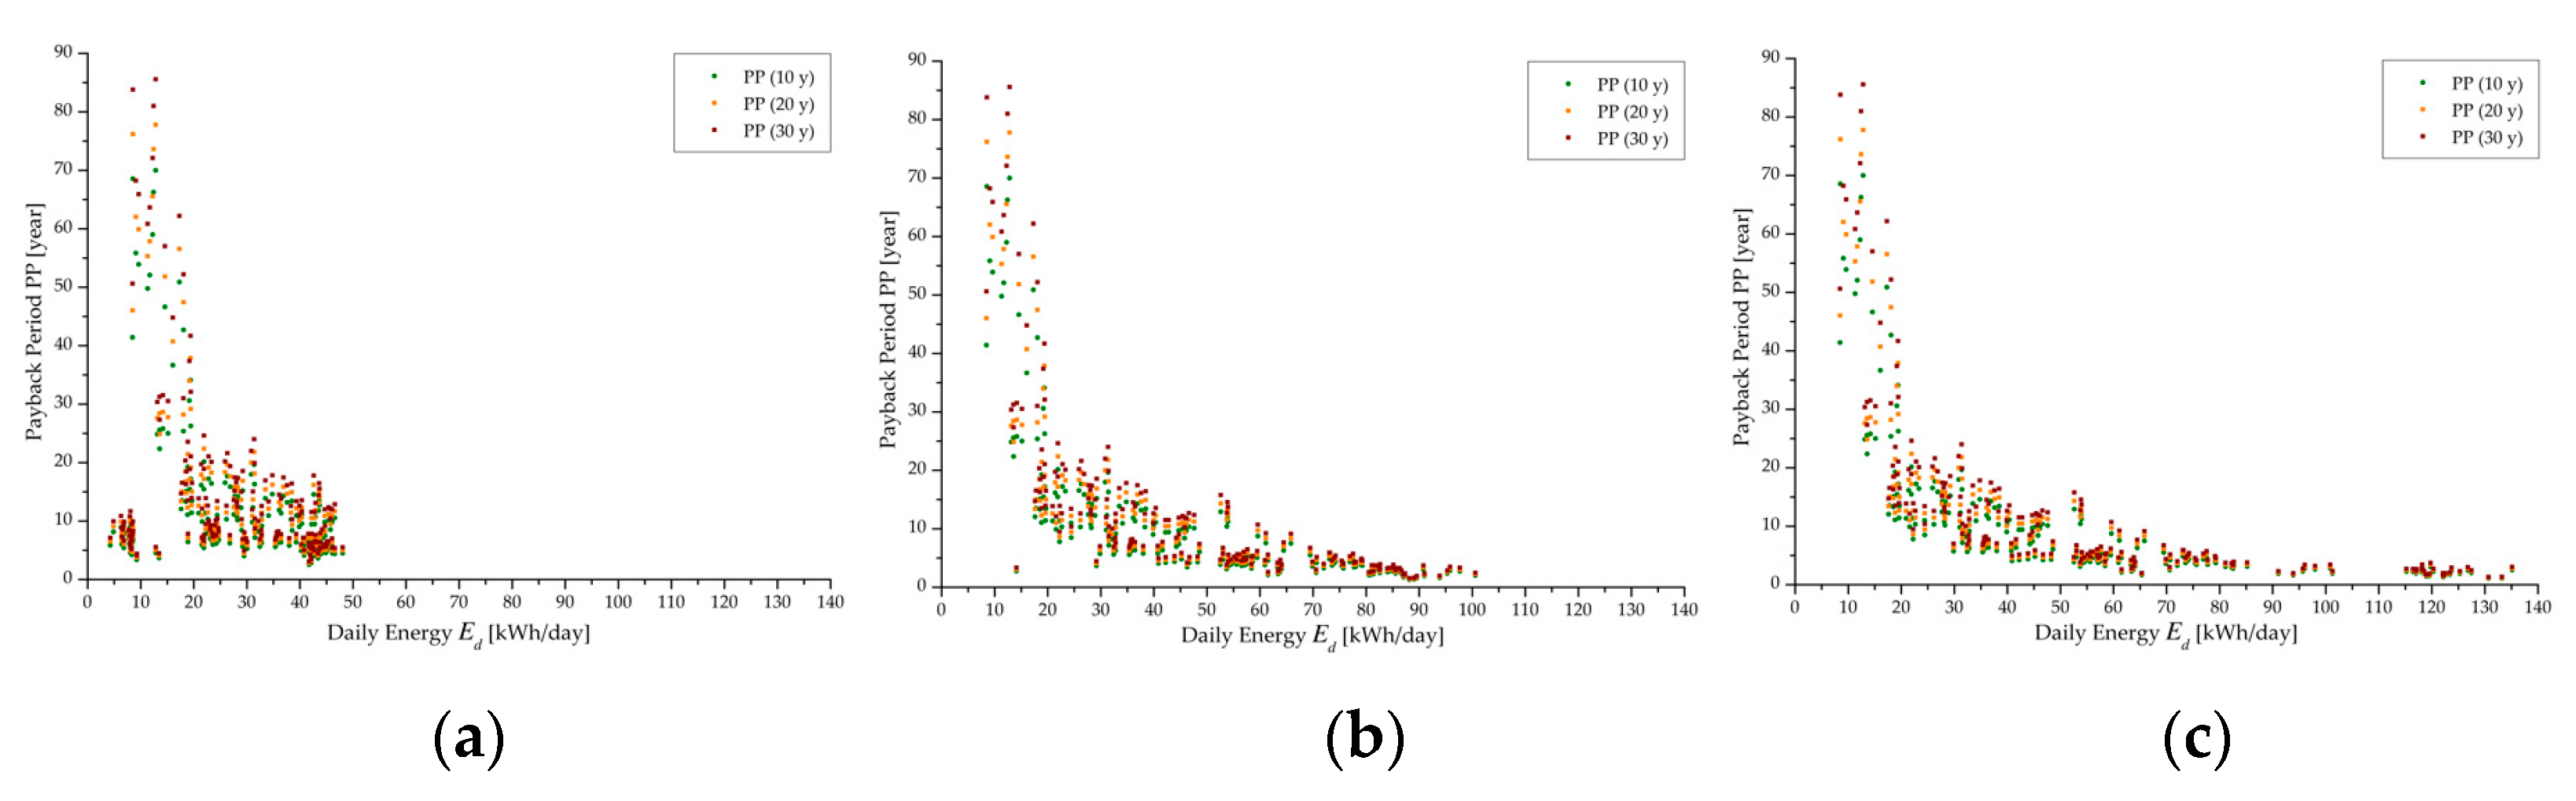
In Figure 5, the payback period PP (year) when varying the daily energy Ed (kWh/day) is plotted for each case study.
Figure 5 shows that the higher the exploitable head, the higher the daily energy production. Indeed, even the worst PAT models were able to achieve energy production of a few tens of kwh per day in each case study, at the expense of a long PP of up to 70 years. Conversely, for the best PAT models that were capable of assuring a PP shorter than 10 years, when the exploitable head Htav was increased, the daily energy production Ed moved from a maximum of about 40 kWh/day for case (a) to about 100 kWh/day for case (b), reaching more than 130 kWh/day for case (c).
Specifically, for case (a), the most effective PAT models had a mean flow rate at the BEP in direct operations Qpb = 50 L/s and head Hpb = 45 m. For case (b), the most suitable models showed a slightly lower flow rate at the BEP Qpb = 41 L/s and higher head Hpb = 63 m, and, in case (c), the flow rate was comparable to case (a), but the head increased up to Hpb = 79 m. In the last case, the PAT’s capability to exploit the head was, in many cases, lower than the actual available head Hav, revealing the suitability of multi-stage PATs when greater heads are exploitable.
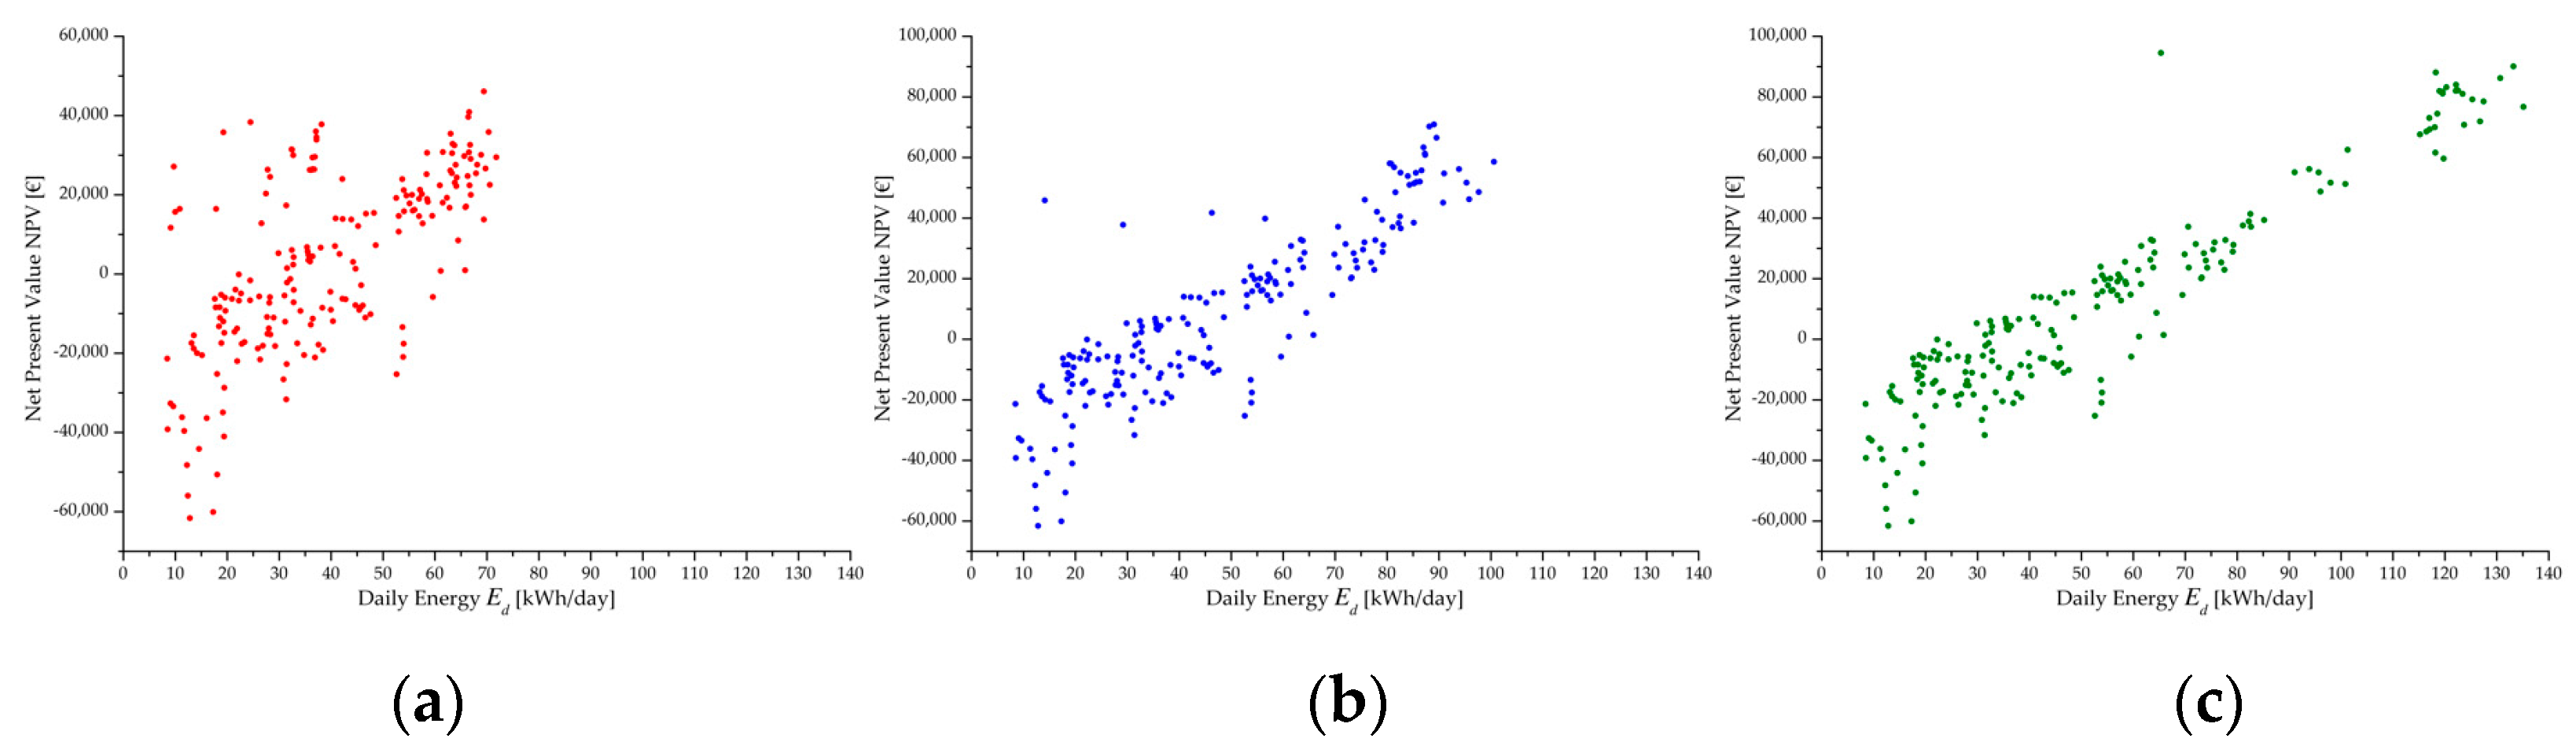
In terms of economic suitability, in the following Figure 5, the NPV is plotted against the varying daily energy production Ed for the three case studies. As expected, the actual suitability of applying PATs for small-scale hydropower generation was observed for the models capable of reaching attractive levels of energy production, thus, assuring a short PP. Specifically, in scenario (a), this was observed for PATs with an NPV greater than EUR 10,000, corresponding to a PP shorter than 5 years. Nevertheless, among the PAT models capable of producing more than 40 kWh/day with a PP < 10 years, those with a PP longer than 8 years presented a negative NPV, thus, resulting in very few attractive solutions. In scenario (b), PATs with Ed > 80 kWh/day returned a NPV greater than EUR 35,000 and a PP shorter than 4 years, whereas, in scenario (c), PATs assuring Ed > 110 kWh/day gave a NPV higher than EUR 60,000 and a PP not longer than 3 years.
In Figure 6, it is worth noting that the higher the available head Hav, the more regular the correlation between the daily produced energy Ed and the NPV. Indeed, scenario (a) returned a scattered region of allowable operation, whereas scenarios (b) and (c) showed a more regular trend, which was essentially linear in scenario (c) where the maximum exploitable head was available.
The PAT models able to maximize the daily produced power for each case study are reported in the following Table 2.
Table 2 shows that, moving from low to high available head, the proposed selection resulted in an increase in both the impeller diameter D and the head Hpb, whereas the nominal rotational speed N was always equal to 48.33 rps. Comparing scenarios (b) and (c), it is worth mentioning that, although the PP of scenario (c) was slightly longer than in scenario (b), significant benefits were detected for the NPV, with an increase of about 31%, despite the fact that efficiency at the BEP ηpb was 8% lower.
Considering an operational lifetime of PAT equipment of longer than 10 years, namely, of 20 to 30 years, a constant increase of PP was observed for each PAT and scenario, equal to 11% and 22%, respectively. This was due to the increase of the maintenance costs given by the longer period of operations (Figure 7).
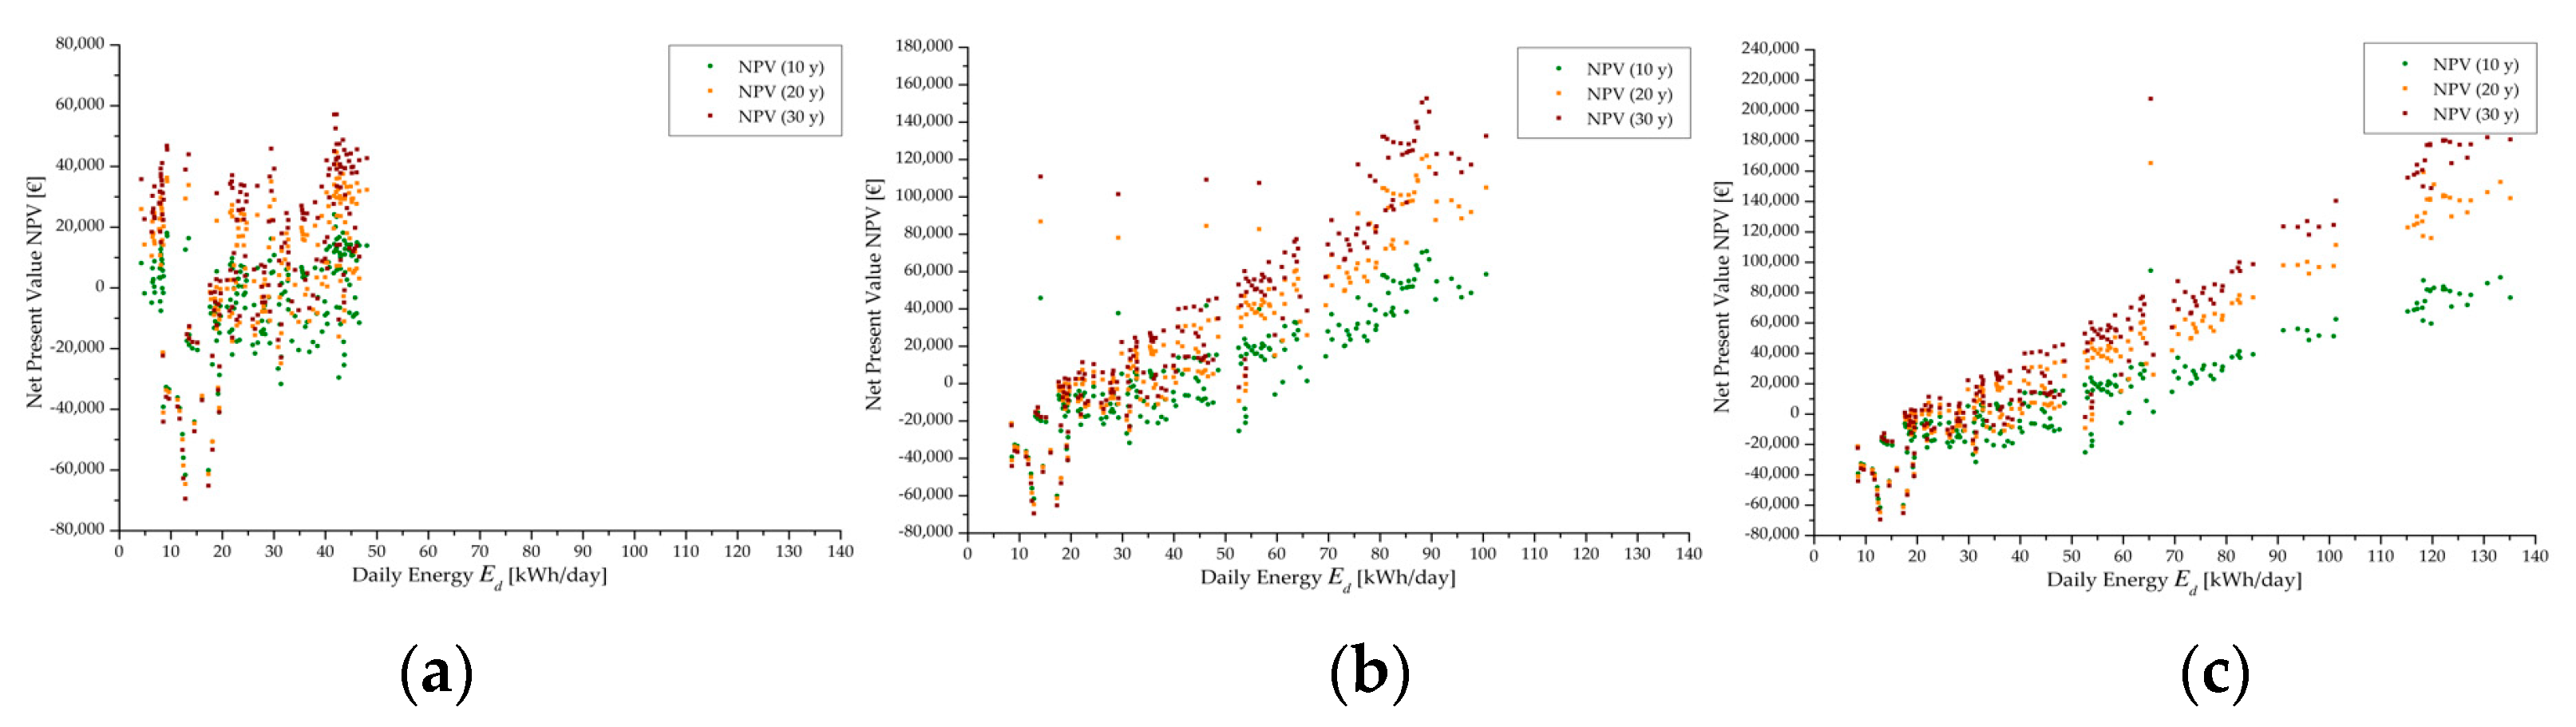
Conversely, the lifetime extension resulted in a beneficial increase of the NPV, which varied with each PAT and scenario. Specifically, in scenario (a), PAT models providing a PP < 5 years for an operational lifetime of 10 years returned an average increase of NPV of 125% and 195% at 20 and 30 years, corresponding to an NPV of EUR 33,700 and EUR 44,200, respectively. For scenario (b), the average increase of NPV was equal to 104% and 164% and, in absolute terms, of EUR 68,800 and EUR 88,400, respectively. Lastly, in scenario (c), the NPV increased by 101% and 160% at 20 and 30 years, namely, by EUR 80,800 and EUR 103,300, respectively.
The lower relative increase of NPV observed in scenarios (b) and (c) compared to that observed in scenario (a) was due to the fact that, in the latter, an attractive NPV was derived even at an operational lifetime of 10 years (Figure 8). This limited the margin for improvement when extending the duration of operations. Indeed, in absolute terms, the greater the exploitable pressure, the higher the NPV increase.
4. Conclusions
The pursuit of optimizing the small-scale hydropower generation in WDNs requires the implementation of operative approaches for the optimal selection and management of PATs in the system. With this aim, the framework proposed in this work is intended to be a suitable approach for the preliminary detection of the main PAT features when the electrical regulation of the system is provided, capable of optimizing the energy production, as well as achieving attractive payback periods and net present values.
The proposed procedure was tested on a simplified network, and we observed the main outcomes when varying the available head from about 20 m to 60 m. It is worth noting that coupling the technical performances of the PATs with cost–benefit analysis is a viable solution because it allows the assessment of the performance capability of the devices along with capital returns. Specifically, the results showed that, given the daily flow pattern when a limited exploitable head is available, no direct correlation between the daily energy production and both the net present value and the payback period is detectable, meaning that devices, although showing attractive energy capability, provide low NPV and, thus, long payback periods. When increasing the available head, a better correlation was observed, revealing attractive net present values and payback periods shorter than 3 years when the daily energy production is greater than 110 kWh/day.
For scenario (c), with high available heads, the use of multi-stage PATs is recommended in order to exploit greater heads and, thus, assure both higher hydropower generation and better pressure regulation.
By increasing the operational lifetime of the PAT equipment beyond the 10 years suggested by several authors in the literature, a constant extension of PP was observed, equal to 11% and 22% for 20 and 30 years, respectively. Conversely, significant improvements in NPV were detected for each PAT and scenario, revealing the strength of this parameter to assess the effectiveness of the studied configuration.
The current work can, thus, be used as the first step of an ongoing study devoted to developing simple procedures for the optimal selection of PATs in WDNs. The main limitation of this work is that it relied on the assumption that the location of PAT was initially set in the main branch of a water district. Thus, future assessments will provide evidence of how to improve the selection when a PAT is installed on a branch belonging to the looped configuration of the network and what happens when more PATs are deployed. Moreover, the next steps will assess the reliability of the proposed approach to further pump models running in reverse mode (e.g., multi-stage devices).
Lastly, to extend this application, we plan to analyze the comparison of hydropower potential and economic viability of the network when hydraulic regulation, no regulation or a combination of electrical and hydraulic regulation of the PAT is applied.
Author Contributions
Conceptualization, F.P. and M.G.; methodology, F.P. and M.G.; software, F.P.; validation, M.G.; investigation, F.P. and M.G.; writing—original draft preparation, F.P.; writing—review and editing, M.G. All authors have read and agreed to the published version of the manuscript.
Funding
The work of the first author (F.P.) was financially supported by the fund ‘PON Ricerca e Innovazione 2014–2020, Asse I, Investimenti in Capitale Umano, Avviso AIM-Attrazione e Mobilità Internazionale, Linea 1′ (CUPE61G18000530007).
Conflicts of Interest
The authors declare no conflict of interest.
Abbreviations
| α | Leakage coefficient (L/s∙m1+β) |
| β | Leakage exponent (-) |
| γ | Specific weight (m3/s) |
| η | Efficiency (-) |
| λ | Discount rate (-) |
| π | Power number (-) |
| ρ | Density (kg/m3) |
| φ | Flow rate number (-) |
| ψ | Head number (-) |
| Δt | Time step (s) |
| C | Cost (€) |
| D | Runner diameter (m) |
| D* | Operational lifetime (year) |
| E | Energy (J) |
| Ep | Energy sales (€) |
| H | Head drop (m) |
| F | Set of pipes (-) |
| L | Length (m) |
| M | Number of time steps (-) |
| N | Rotational speed (rps) |
| Ns | Specific speed (m; m3/s) |
| P | Power (W or kW) |
| Q | Flow rate (m3/s or L/s) |
| Wp | Water savings (€) |
| cw | Unitary cost (€/m3) |
| d | Duration of activities (years) |
| BEP | Best efficiency point |
| CFD | Computational fluid dynamics |
| ER | Electric regulation |
| HR | Hydraulic regulation |
| NPV | Net present value |
| PAT | Pump as turbine |
| PP | Payback period |
| PRV | Pressure-reducing valve |
| WDN | Water distribution network |
| av | Available |
| b | Best efficiency point |
| eq | Equipment |
| f | Pipe index |
| gen | Generator |
| i | Time step index |
| j | PAT Index |
| m | Average |
| main | Maintenance |
| p | Pump |
| t | Turbine |
| tot | Total |
| w | Water |
| z | Iteration index |
References
- Executive Summary—World Energy Outlook 2021—Analysis—IEA. Available online: https://www.iea.org/reports/world-energy-outlook-2021/executive-summary (accessed on 28 May 2022).
- Carravetta, A.; Del Giudice, G.; Fecarotta, O.; Gallagher, J.; Cristina Morani, M.; Ramos, H.M. Potential Energy, Economic, and Environmental Impacts of Hydro Power Pressure Reduction on the Water-Energy-Food Nexus. J. Water Resour. Plan. Manag. 2022, 148, 04022012. [Google Scholar] [CrossRef]
- Kapelan, Z.S.; Savic, D.A.; Walters, G.A. Multiobjective Sampling Design for Water Distribution Model Calibration. J. Water Resour. Plan. Manag. 2003, 129, 466–479. [Google Scholar] [CrossRef]
- Tolson, B.A.; Maier, H.R.; Simpson, A.R.; Lence, B.J. Genetic Algorithms for Reliability-Based Optimization of Water Distribution Systems. J. Water Resour. Plan. Manag. 2004, 130, 63–72. [Google Scholar] [CrossRef] [Green Version]
- López-Ibáñez, M.; Prasad, T.D.; Paechter, B. Ant Colony Optimization for Optimal Control of Pumps in Water Distribution Networks. J. Water Resour. Plan. Manag. 2008, 134, 337–346. [Google Scholar] [CrossRef]
- Jowitt, P.W.; Germanopoulos, G. Optimal Pump Scheduling in Water-Supply Networks. J. Water Resour. Plan. Manag. 1992, 118, 406–422. [Google Scholar] [CrossRef]
- De Paola, F.; Fontana, N.; Giugni, M.; Marini, G.; Pugliese, F. Optimal solving of the pump scheduling problem by using a harmony search optimization algorithm. J. Hydroinform. 2017, 19, 879–889. [Google Scholar] [CrossRef] [Green Version]
- De Paola, F.; Giugni, M.; Pugliese, F. A harmony-based calibration tool for urban drainage systems. Proc. Inst. Civ. Eng. Water Manag. 2018, 171, 30–41. [Google Scholar] [CrossRef]
- De Paola, F.; Giugni, M.; Pugliese, F.; Romano, P. Optimal Design of LIDs in Urban Stormwater Systems Using a Harmony-Search Decision Support System. Water Resour. Manag. 2018, 32, 4933–4951. [Google Scholar] [CrossRef]
- Puust, R.; Kapelan, Z.; Savic, D.A.; Koppel, T. A review of methods for leakage management in pipe networks. Urban Water J. 2010, 7, 25–45. [Google Scholar] [CrossRef]
- Ferraiuolo, R.; De Paola, F.; Fiorillo, D.; Caroppi, G.; Pugliese, F. Experimental and Numerical Assessment of Water Leakages in a PVC-A Pipe. Water 2020, 12, 1804. [Google Scholar] [CrossRef]
- Vicente, D.J.; Garrote, L.; Sánchez, R.; Santillán, D. Pressure Management in Water Distribution Systems: Current Status, Proposals, and Future Trends. J. Water Resour. Plan. Manag. 2016, 142, 04015061. [Google Scholar] [CrossRef]
- Campisano, A.; Creaco, E.; Modica, C. RTC of Valves for Leakage Reduction in Water Supply Networks. J. Water Resour. Plan. Manag. 2010, 136, 138–141. [Google Scholar] [CrossRef]
- Morani, M.C.; Carravetta, A.; D’Ambrosio, C.; Fecarotta, O. A new mixed integer non-linear programming model for optimal PAT and PRV location in water distribution networks. Urban Water J. 2021, 18, 394–409. [Google Scholar] [CrossRef]
- Fontana, N.; Giugni, M.; Glielmo, L.; Marini, G.; Verrilli, F. Real-Time Control of a PRV in Water Distribution Networks for Pressure Regulation: Theoretical Framework and Laboratory Experiments. J. Water Resour. Plan. Manag. 2018, 144, 04017075. [Google Scholar] [CrossRef]
- Binama, M.; Su, W.T.; Li, X.B.; Li, F.C.; Wei, X.Z.; An, S. Investigation on pump as turbine (PAT) technical aspects for micro hydropower schemes: A state-of-the-art review. Renew. Sustain. Energy Rev. 2017, 79, 148–179. [Google Scholar] [CrossRef]
- Fontana, N.; Giugni, M.; Glielmo, L.; Marini, G.; Zollo, R. Operation of a Prototype for Real Time Control of Pressure and Hydropower Generation in Water Distribution Networks. Water Resour. Manag. 2018, 33, 697–712. [Google Scholar] [CrossRef]
- Carravetta, A.; del Giudice, G.; Fecarotta, O.; Ramos, H.M. PAT design strategy for energy recovery in water distribution networks by electrical regulation. Energies 2013, 6, 411–424. [Google Scholar] [CrossRef] [Green Version]
- Derakhshan, S.; Nourbakhsh, A. Experimental study of characteristic curves of centrifugal pumps working as turbines in different specific speeds. Exp. Therm. Fluid Sci. 2008, 32, 800–807. [Google Scholar] [CrossRef]
- Pugliese, F.; De Paola, F.; Fontana, N.; Giugni, M.; Marini, G. Experimental characterization of two Pumps As Turbines for hydropower generation. Renew. Energy 2016, 99, 180–187. [Google Scholar] [CrossRef]
- Pugliese, F.; De Paola, F.; Fontana, N.; Giugni, M.; Marini, G. Performance of vertical-axis pumps as turbines. J. Hydraul. Res. 2018, 56, 482–493. [Google Scholar] [CrossRef]
- Pugliese, F.; Fontana, N.; Marini, G.; Giugni, M. Experimental assessment of the impact of number of stages on vertical axis multi-stage centrifugal PATs. Renew. Energy 2021, 178, 891–903. [Google Scholar] [CrossRef]
- Fecarotta, O.; Messa, G.V.; Pugliese, F. Numerical assessment of the vulnerability to impact erosion of a pump as turbine in a water supply system. J. Hydroinform. 2020, 22, 691–712. [Google Scholar] [CrossRef]
- Fernández, J.; Blanco, E.; Parrondo, J.; Stickland, M.T.; Scanlon, T.J. Performance of a centrifugal pump running in inverse mode. Proc. Inst. Mech. Eng. Part A J. Power Energy 2004, 218, 265–271. [Google Scholar] [CrossRef] [Green Version]
- Xu, C.; Fan, C.; Zhang, Z.; Mao, Y. Numerical study of wake and potential interactions in a two-stage centrifugal refrigeration compressor. Eng. Appl. Comput. Fluid Mech. 2021, 15, 313–327. [Google Scholar] [CrossRef]
- Zhang, X.-Y.; Jiang, C.-X.; Lv, S.; Wang, X.; Yu, T.; Jian, J.; Shuai, Z.-J.; Li, W.-Y. Clocking effect of outlet RGVs on hydrodynamic characteristics in a centrifugal pump with an inlet inducer by CFD method. Eng. Appl. Comput. Fluid Mech. 2021, 15, 222–235. [Google Scholar] [CrossRef]
- Chen, J.; Shi, W.; Zhang, D. Influence of blade inlet angle on the performance of a single blade centrifugal pump. Eng. Appl. Comput. Fluid Mech. 2021, 15, 462–475. [Google Scholar] [CrossRef]
- Yang, S.S.; Derakhshan, S.; Kong, F.Y. Theoretical, numerical and experimental prediction of pump as turbine performance. Renew. Energy 2012, 48, 507–513. [Google Scholar] [CrossRef]
- Barbarelli, S.; Amelio, M.; Florio, G. Experimental activity at test rig validating correlations to select pumps running as turbines in microhydro plants. Energy Convers. Manag. 2017, 149, 781–797. [Google Scholar] [CrossRef]
- Stefanizzi, M.; Torresi, M.; Fortunato, B.; Camporeale, S.M. Experimental investigation and performance prediction modeling of a single stage centrifugal pump operating as turbine. Energy Procedia 2017, 126, 589–596. [Google Scholar] [CrossRef]
- Novara, D.; Carravetta, A.; McNabola, A.; Ramos, H.M. Cost Model for Pumps as Turbines in Run-of-River and In-Pipe Microhydropower Applications. J. Water Resour. Plan. Manag. 2019, 145, 04019012. [Google Scholar] [CrossRef]
- Morani, M.C.; Simão, M.; Gazur, I.; Santos, R.S.; Carravetta, A.; Fecarotta, O.; Ramos, H.M. Pressure Drop and Energy Recovery with a New Centrifugal Micro-Turbine: Fundamentals and Application in a Real WDN. Energies 2022, 15, 1528. [Google Scholar] [CrossRef]
- Carravetta, A.; Del Giudice, G.; Fecarotta, O.; Morani, M.C.; Ramos, H.M. A New Low-Cost Technology Based on Pump as Turbines for Energy Recovery in Peripheral Water Networks Branches. Water 2022, 14, 1526. [Google Scholar] [CrossRef]
- Fecarotta, O.; McNabola, A. Optimal Location of Pump as Turbines (PATs) in Water Distribution Networks to Recover Energy and Reduce Leakage. Water Resour. Manag. 2017, 31, 5043–5059. [Google Scholar] [CrossRef]
- Giugni, M.; Fontana, N.; Ranucci, A. Optimal Location of PRVs and Turbines in Water Distribution Systems. J. Water Resour. Plan. Manag. 2014, 140, 06014004. [Google Scholar] [CrossRef]
- Morani, M.C.; Carravetta, A.; Fecarotta, O.; McNabola, A. Energy transfer from the freshwater to the wastewater network using a PAT-equipped turbopump. Water 2019, 12, 38. [Google Scholar] [CrossRef] [Green Version]
- García, I.F.; Nabola, A.M. Maximizing Hydropower Generation in Gravity Water Distribution Networks: Determining the Optimal Location and Number of Pumps as Turbines. J. Water Resour. Plan. Manag. 2019, 146, 04019066. [Google Scholar] [CrossRef]
- Chacón, M.C.; Rodríguez Díaz, J.A.; Morillo, J.G.; McNabola, A. Evaluation of the design and performance of a micro hydropower plant in a pressurised irrigation network: Real world application at farm-level in Southern Spain. Renew. Energy 2021, 169, 1106–1120. [Google Scholar] [CrossRef]
- Ebrahimi, S.; Riasi, A.; Kandi, A. Selection optimization of variable speed pump as turbine (PAT) for energy recovery and pressure management. Energy Convers. Manag. 2021, 227, 113586. [Google Scholar] [CrossRef]
- Kandi, A.; Moghimi, M.; Tahani, M.; Derakhshan, S. Optimization of pump selection for running as turbine and performance analysis within the regulation schemes. Energy 2021, 217, 119402. [Google Scholar] [CrossRef]
- Novara, D.; McNabola, A. The Development of a Decision Support Software for the Design of Micro-Hydropower Schemes Utilizing a Pump as Turbine. Proceedings 2018, 2, 678. [Google Scholar] [CrossRef] [Green Version]
- Ogayar, B.; Vidal, P.G. Cost determination of the electro-mechanical equipment of a small hydro-power plant. Renew. Energy 2009, 34, 6–13. [Google Scholar] [CrossRef]
- Araujo, L.; Ramos, H.; Coelho, S. Pressure Control for Leakage Minimisation in Water Distribution Systems Management|SpringerLink. Water Resour. Manag. 2006, 20, 133–149. [Google Scholar] [CrossRef]
Figure 1.
Flowchart of the first steps of the proposed procedure for PAT selection.

Figure 2.
Flowchart of the proposed procedure for PAT selection.

Figure 3.
Daily demand pattern [35].
Figure 3.
Daily demand pattern [35].

Figure 4.
Flow rate Qt and available head Hav daily patterns for (a) low head, (b) medium head and (c) high head.
Figure 4.
Flow rate Qt and available head Hav daily patterns for (a) low head, (b) medium head and (c) high head.

Figure 5.
Payback period (PP) when varying the daily energy production Ed for (a) low available head Hav, (b) medium available head Hav and (c) high available head Hav.
Figure 5.
Payback period (PP) when varying the daily energy production Ed for (a) low available head Hav, (b) medium available head Hav and (c) high available head Hav.

Figure 6.
NPV at varying the daily energy production Ed for (a) low available head Hav, (b) medium available head Hav and (c) high available head Hav.
Figure 6.
NPV at varying the daily energy production Ed for (a) low available head Hav, (b) medium available head Hav and (c) high available head Hav.

Figure 7.
PP when varying the operation lifetime from 10 to 30 years for (a) low available head Hav, (b) medium available head Hav and (c) high available head Hav.
Figure 7.
PP when varying the operation lifetime from 10 to 30 years for (a) low available head Hav, (b) medium available head Hav and (c) high available head Hav.

Figure 8.
NPV when varying the operation lifetime from 10 to 30 years for (a) low available head Hav, (b) medium available head Hav and (c) high available head H.
Figure 8.
NPV when varying the operation lifetime from 10 to 30 years for (a) low available head Hav, (b) medium available head Hav and (c) high available head H.


Table 1.
Database of single-stage, centrifugal PATs.
| PATs nr. | Manufacturers | Impeller Diameter D Range | Pump Flow Rate at BEP Qpb Range | Pump Head at BEP Hpb Range | Pump Rotational Speed N Range | Pump Efficiency at BEP ηpb Range |
|---|---|---|---|---|---|---|
| [-] | [-] | [m] | [L/s] | [m] | [rps] | [-] |
| 200 | 9 | 0.135–0.550 | 26.5–136.7 | 15.0–142.7 | 48.33–58.33 | 0.67–0.88 |
Table 2.
Parameters of the PATs producing the maximum daily energy production for (a) low available head Hav, (b) medium available head Hav and (c) high available head Hav.
Table 2.
Parameters of the PATs producing the maximum daily energy production for (a) low available head Hav, (b) medium available head Hav and (c) high available head Hav.
| Scenario | Runner Diameter D Range | Pump Flow Rate at BEP Qpb Range | Pump Head at BEP Hpb Range | Pump Rotational Speed N Range | Pump Efficiency at BEP ηpb Range | Daily Energy Production Ed | Payback Period | Net Present Value |
|---|---|---|---|---|---|---|---|---|
| [m] | [L/s] | [m] | [rps] | [-] | [kWh/day] | [year] | [€] | |
| a “Low” | 0.160 | 45.1 | 32.0 | 48.33 | 0.84 | 48.05 | 4.50 | 13,927 |
| b “Medium” | 0.203 | 38.9 | 51.5 | 48.33 | 0.83 | 100.60 | 2.02 | 58,581 |
| c “High” | 0.329 | 50.8 | 128.0 | 48.33 | 0.75 | 135.14 | 2.50 | 76,728 |
Publisher’s Note: MDPI stays neutral with regard to jurisdictional claims in published maps and institutional affiliations. |
© 2022 by the authors. Licensee MDPI, Basel, Switzerland. This article is an open access article distributed under the terms and conditions of the Creative Commons Attribution (CC BY) license (https://creativecommons.org/licenses/by/4.0/).
Share and Cite
MDPI and ACS Style
Pugliese, F.; Giugni, M. An Operative Framework for the Optimal Selection of Centrifugal Pumps As Turbines (PATs) in Water Distribution Networks (WDNs). Water 2022, 14, 1785. https://doi.org/10.3390/w14111785
AMA Style
Pugliese F, Giugni M. An Operative Framework for the Optimal Selection of Centrifugal Pumps As Turbines (PATs) in Water Distribution Networks (WDNs). Water. 2022; 14(11):1785. https://doi.org/10.3390/w14111785
Chicago/Turabian StylePugliese, Francesco, and Maurizio Giugni. 2022. "An Operative Framework for the Optimal Selection of Centrifugal Pumps As Turbines (PATs) in Water Distribution Networks (WDNs)" Water 14, no. 11: 1785. https://doi.org/10.3390/w14111785
Note that from the first issue of 2016, this journal uses article numbers instead of page numbers. See further details here.