
Experimental Study on the Influence of Pipeline Vibration on Silty Seabed Liquefaction
by
 ,
,
Jishang Xu
1,2,3,*, 
Xingyu Xu
4,*,
Yaqi Zhang
2,
Jinjing Pu
3,
Jiangfeng Dong
2,
Chunlai Wang
2,
Guangxue Li
1,2,3,
Anlong Li
1,2,3,
Shaotong Zhang
1 and
Yaxin Zhang
2 1
Key Laboratory of Submarine Geosciences and Prospecting Techniques (Ministry of Education), Ocean University of China, Qingdao 266100, China
2
College of Marine Geosciences, Ocean University of China, Qingdao 266100, China
3
Engineering Research Center of Marine Petroleum Development and Security Safeguard (Ministry of Education), Ocean University of China, Qingdao 266100, China
4
Shengli Oilfield Technology Inspection Center, SINOPEC, Dongying 257000, China
*
Authors to whom correspondence should be addressed.
Water 2022, 14(11), 1782; https://doi.org/10.3390/w14111782
Submission received: 3 May 2022
/
Revised: 28 May 2022
/
Accepted: 30 May 2022
/
Published: 1 June 2022
(This article belongs to the Special Issue Reliability and Safety in Ocean and Coastal Engineering)
Abstract
:Free-spanning submarine pipelines are usually affected by vortex-induced vibration (VIV). Such vibration could influence the liquefaction of the supporting soil at both ends of the free spans and could have catastrophic consequences, including the failure of the local seabed and the displacing, sinking, or floating of pipelines. The influence of pipeline vibration on soil liquefaction has not been studied sufficiently. Therefore, we explored the influence of vortex-induced pipeline vibration on the excess pore pressure of silty soil around a pipeline using flume experiments. Our results showed that pipeline vibration could induce the buildup of excess pore-water pressure, even without wave loading. A fully liquefied zone was found close to the pipeline, where excess pore pressure reached the soil liquefaction criterion, which was surrounded by a partially liquefied zone. The extent of liquefaction depended on the vibration conditions and the weight and burial depth of the pipeline. The pipeline vibration amplitude increased after soil liquefaction. Unlike wave-induced liquefaction, pipeline-induced vibration liquefaction occurred at a critical value smaller than the initial mean normal effective stress. Considering the possibility of pipeline-vibration-induced seabed liquefaction, conventional approaches could underestimate the potential risks to pipeline stability and result in unsafe maintenance practices.
1. Introduction
Pipelines are used widely in energy industries for transporting oil and gas [1]. When a submarine pipeline is laid on the seafloor, the formation of free spans could be induced owing to seabed unevenness or changes in seabed topography, such as seabed scouring. When exposed to currents or wave loading, such spanning pipelines are possibly subjected to vortex-induced vibration (VIV), which has been widely recognized as a crucial factor causing fatigue damage to pipelines [2,3]. Accordingly, it is of practical importance to understand the vortex-induced vibration of free-spanning pipelines near the seabed.
Over the past few decades, extensive research has been conducted on vortex-induced vibration, using both theoretical and experimental approaches. Several studies have focused on pipeline vibrations either under wall-free conditions or near a rigid boundary [4,5,6,7], whereas others have investigated the interaction of pipeline vibrations and dynamic changes in the sediment bed [8,9,10,11,12]. In the case of the transverse vortex-induced vibrations of a submarine pipeline close to an erodible seabed, it was found that pipe vibrations and the corresponding local scour were often coupled dynamically, resulting in an equilibrium state [8,9,12,13,14]. Pipeline vibrations possibly intensify local seabed scour, thereby increasing the depth and width of the scour around the pipeline [12].
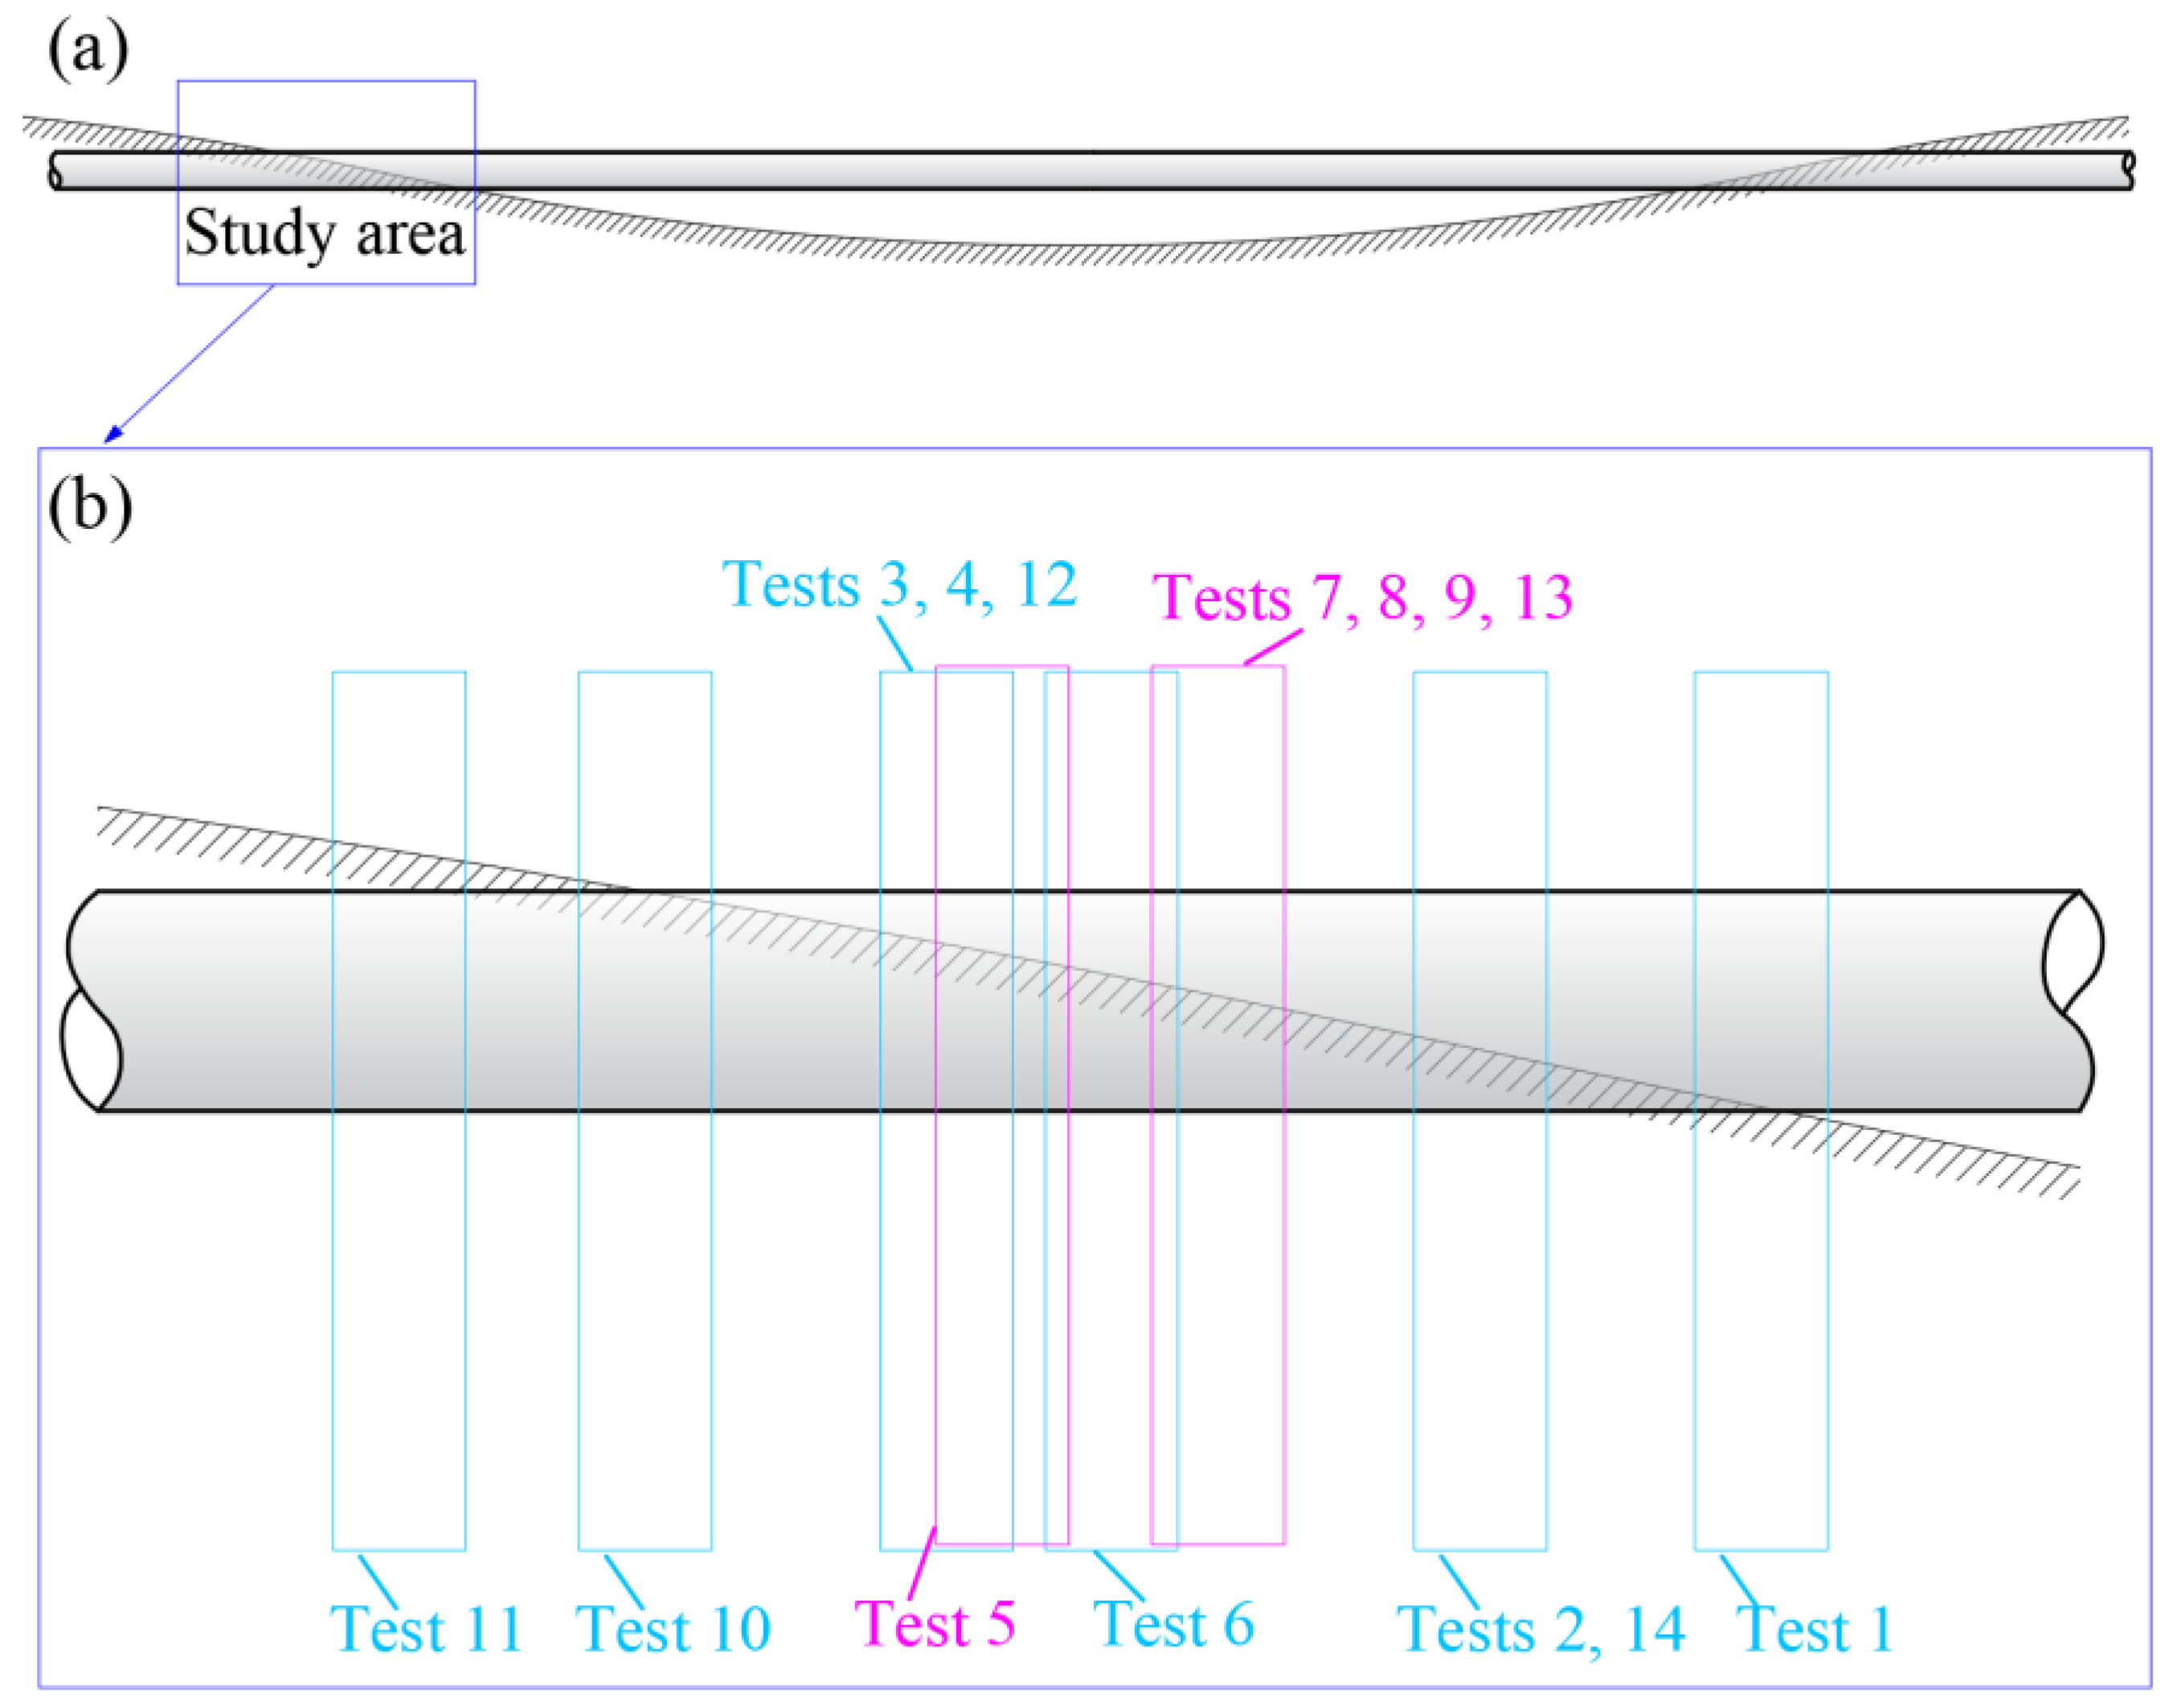
Apart from the scour processes, pipeline failure induced by soil liquefaction has received considerable attention since it was reported by the American Society of Civil Engineers [15] and Christian et al. [16]. Notable studies include investigations of pore-water pressure buildup and soil liquefaction potential around submarine pipelines under the influence of waves [17,18,19,20,21,22,23] and earthquakes [24,25,26] and the stability of submarine pipelines on liquefied soil [27,28,29,30,31,32,33,34]. These studies have focused only on pipelines supported uniformly by the soil. However, for spanning pipelines, the interaction between the vibrating pipe and the soil surrounding it possibly involves both scour and liquefaction processes. When a spanning pipeline vibrates, the section of the pipe in contact with the soil bed (Figure 1) exerts fluctuating pressures on the bed and, under some conditions, could cause an accumulation of excess pore pressure. Such pressure could even lead to liquefaction of the silty seabed, a process that could significantly accelerate the erosion of the local seabed [35,36,37,38,39] as well as the stability of the pipeline [10].
One of the most significant issues in pipeline stability design is evaluating the free-span length and the rate at which a free span develops owing to local scour. These factors depend not only on flow conditions but also on the dynamic properties of the soil at the span shoulder. Soil liquefaction induced by pipeline vibration could reduce the shear strength of the soil, thereby changing the scouring conditions around the span shoulders. Efforts have been directed toward understanding scour processes and related span development; however, the dynamic soil properties of the span shoulders appear not to have attracted much attention, either experimentally or theoretically.
The purpose of the present work was to investigate the pipeline–soil interaction process at the span shoulders by employing a purpose-built experimental system. The investigation focused on the changes in silty soil dynamic properties under different conditions of pipeline vibration. We considered processes such as the development of excess pore-water pressure, liquefaction, the occurrence of quick scour, changes in vibration frequencies, and shear failure of the silty seabed.
2. Materials and Methods
2.1. Experimental Design
To study the interaction between the vibrating pipeline and the seabed, we conducted a series of physical experiments to simulate the behavior of a pipeline system (either partly or completely buried) at the touchdown section of the pipeline span (see Figure 1). In our experiments, a model pipeline unit is set up to represent a section of pipeline at a certain depth in the subsoil (Figure 1). The pipeline unit is considered rigid and without any bending or deformation, i.e., the model pipeline is a horizontal circular cylinder with a uniform burial depth. When the pipeline vibrates, the pipeline unit exerts a periodic dynamic pressure on the ambient soil.
2.2. Experimental Facility
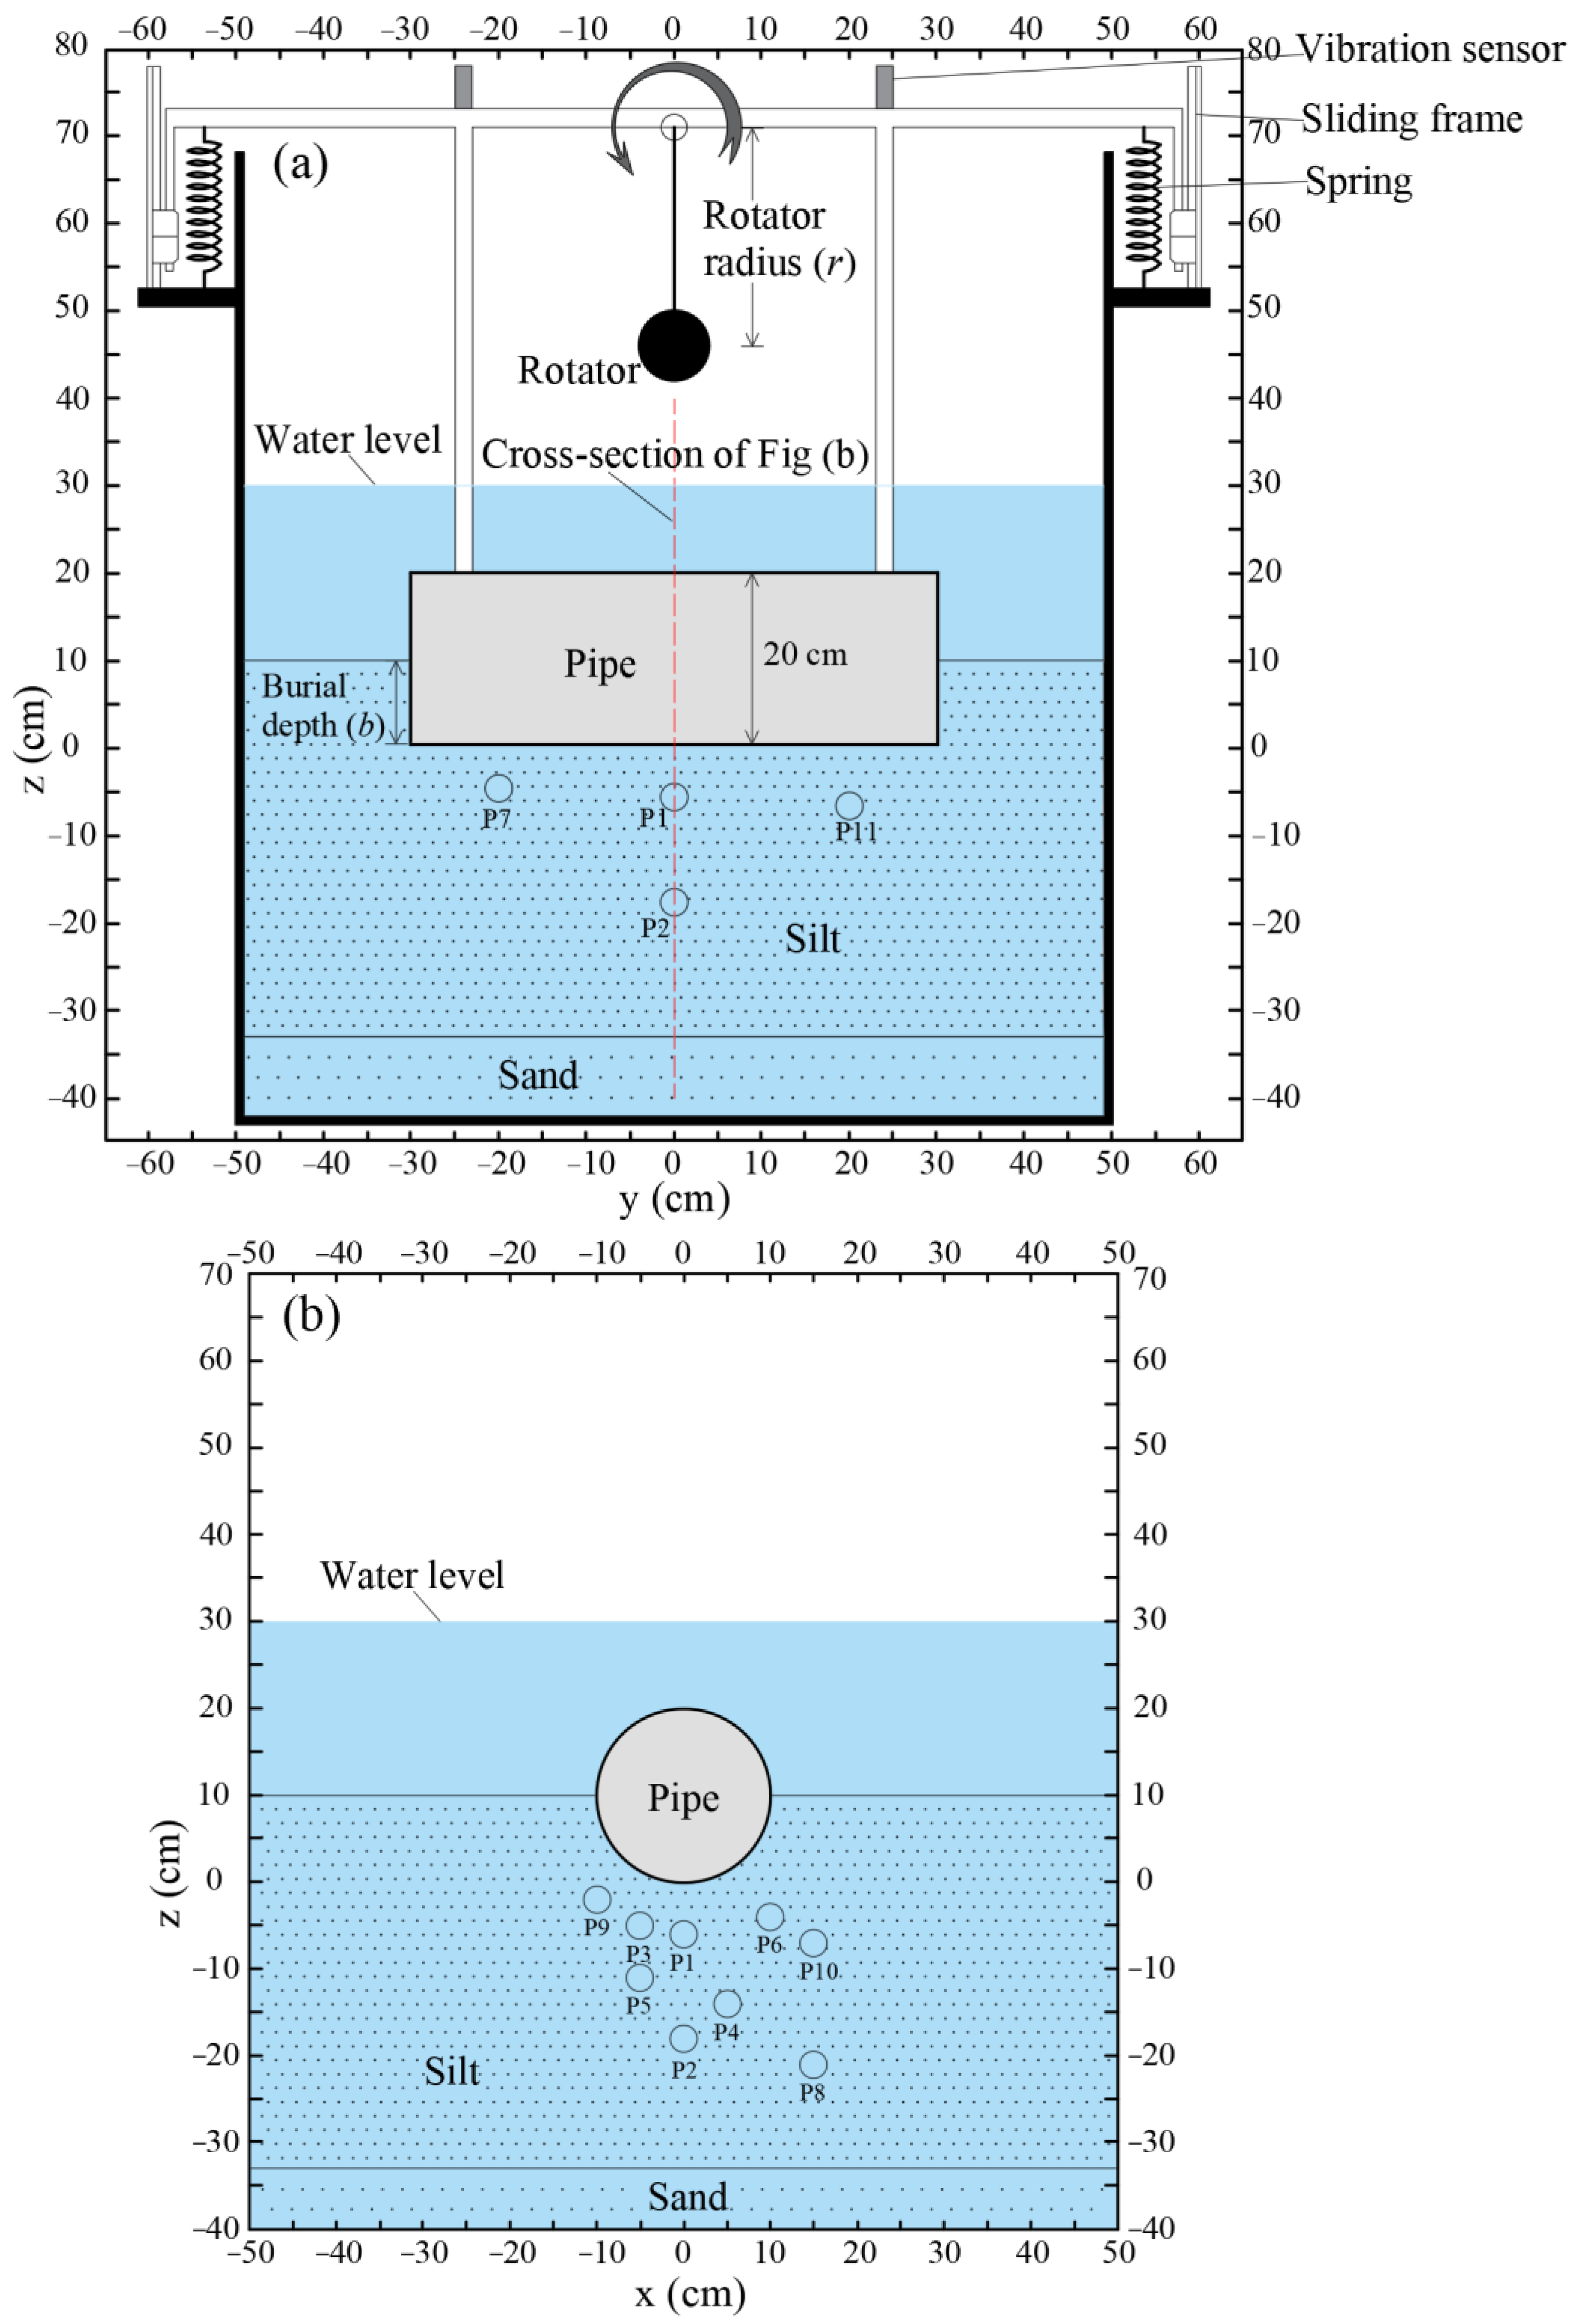
The experiments were conducted in a water tank (1.0 m × 1.0 m × 1.1 m). The experimental set up and instrumentation are shown in Figure 2.
As vortex-induced vibration of a spanning pipeline occurs mainly in the vertical direction [40,41,42], only transverse pipe vibration is simulated in this study. The test pipe is attached to the supporting frame by two vertical slide tracks to constrain its motion (Figure 2). The weight of the pipe and the supporting frame are 31 kg. Four springs, with an individual elastic coefficient of 4100 N/m, are employed to provide a restoring force for the pipeline. A similar test pipe and supporting frame were used by Sumer et al. [13], Yang et al. [8], and Gao et al. [9] to study current-induced seabed scour around a vibrating pipeline.
The vibration of the pipeline is induced by a centrifugal vibrator with different load amplitudes and periods (Figure 2 and Table 1). The magnitude of the centrifugal force, F, created by the rolling vibrator can be calculated as:
where M is the rotator weight, ω is the angular frequency, and r is the rotation radius.
During the experiments, we simultaneously measured the pore-water pressure and the acceleration of the pipeline vibration. The pore-water pressure in the soil was measured using the SR-1-type miniature pressure sensors produced by the Nanjing Hydraulic Research Institute (Nanjing, China), with sampling frequency of 3 Hz and accuracy of 5‰ measured pressure values. Pore pressure sensors were fixed to the bottom of the water tank by rigid wires and distributed throughout the soil depth (the distribution of each sensor is shown in Figure 2). Pore-water pressure signals were amplified through a 16-channel dynamic strain amplifier, with a response frequency of 5 kHz. Each sensor was covered with a filter cap to prevent soil particles entering the sensor cabin, and to ensure that no air is trapped between the sensors and the filter caps. The sensors were positioned at precise depths. Static calibration of pressure sensors was conducted before and after each test.
The vertical vibration of the pipeline was measured using a BZ1109-type piezoelectric accelerometer (produced by Beijing Wave Spectrum Science and Technology Co., Ltd., Beijing, China), with a measurement frequency of 100 Hz and accuracy of 1% measured pressure values. The accelerometer sensors are located at the top of the supporting frame (as shown in Figure 2a). Vibration acceleration signals were amplified through a WS-2401-type Multichannel Charge Amplifier and recorded using a WS-DAQ-type Data Acquisition System (produced by Beijing Wave Spectrum Science and Technology Co., Ltd., Beijing, China).
2.3. Test conditions
Previous studies have shown that silty soil is more susceptible to liquefaction than sand [27,35,38,43]. Silty soil is found widely in the coastal areas of China, particularly in the Yellow River delta [44,45]. Therefore, silty sediment was selected as test soil to illustrate the interaction between soil liquefaction and pipeline vibration. The test soil, with a median particle diameter d50 = 0.049 mm, was obtained from the Yellow River delta. The size distribution of the soil particles is shown in Figure 3.
High-porosity foam material was affixed to the internal wall of the test tank, and the bottom of the tank was filled with coarse sand (which could dissipate excess pore pressure quickly to eliminate the border effect).
A stainless-steel circular pipeline, with a diameter of 20 cm, was set up in the center of the tank. The pipeline in each test was kept at the same position relative to the tank bottom, and the bottom of the model pipe was set to z = 0. The pipeline was buried at different depths by adding test soils to the designated levels. The model pipeline was loaded with periodic forces to create vibrations, with different frequencies from 1 to 3 Hz (Table 1) as vibrations, as frequencies below 4 Hz are known to significantly contribute to fatigue damage of spanning pipelines [46,47]. The still-water depth was maintained at 0.2 m above the soil surface for each experiment. These test parameters, including burial depth on the bottom of the pipe, b; radius of the rotator, r; pipeline vibration frequency, f; magnitude of the centrifugal force created by the rotator, max(F); and specific weight of sediment, γt, are listed in Table 1.
2.4. Test Programs
The test soil was mixed well with water and subsequently placed into the soil tank to form fresh beds. At the start of each experiment, the bed was leveled. Subsequently, the flume was filled with water to 20 cm above the soil surface. The test soil was left to consolidate undisturbed in water for 3 days, before it was subjected to periodic force loading. The pipeline was loaded with periodic forces through the rotator until the soil was liquefied and the pipeline vibrated. Pore-water pressure and vibration acceleration were measured during the entire period of the loading cycle and subsequent pore pressure dissipation.
2.5. Data Processing
The vibration frequencies of the model pipeline in these experiments were 1 to 3 Hz, and the sampling frequency of the pore-water pressures was 3 Hz, which, according to the Nyquist principle, was not sufficient to record the instantaneous response of the soil under the periodic loading of the vibrating pipe. Accordingly, we used a trapezoidal filter to extract the accumulative pore-water pressure under cyclic loading of the vibrating pipeline. One example showing the extracted accumulative pore-water pressure and the original pressures are shown in Figure 4.
3. Results
3.1. General Description
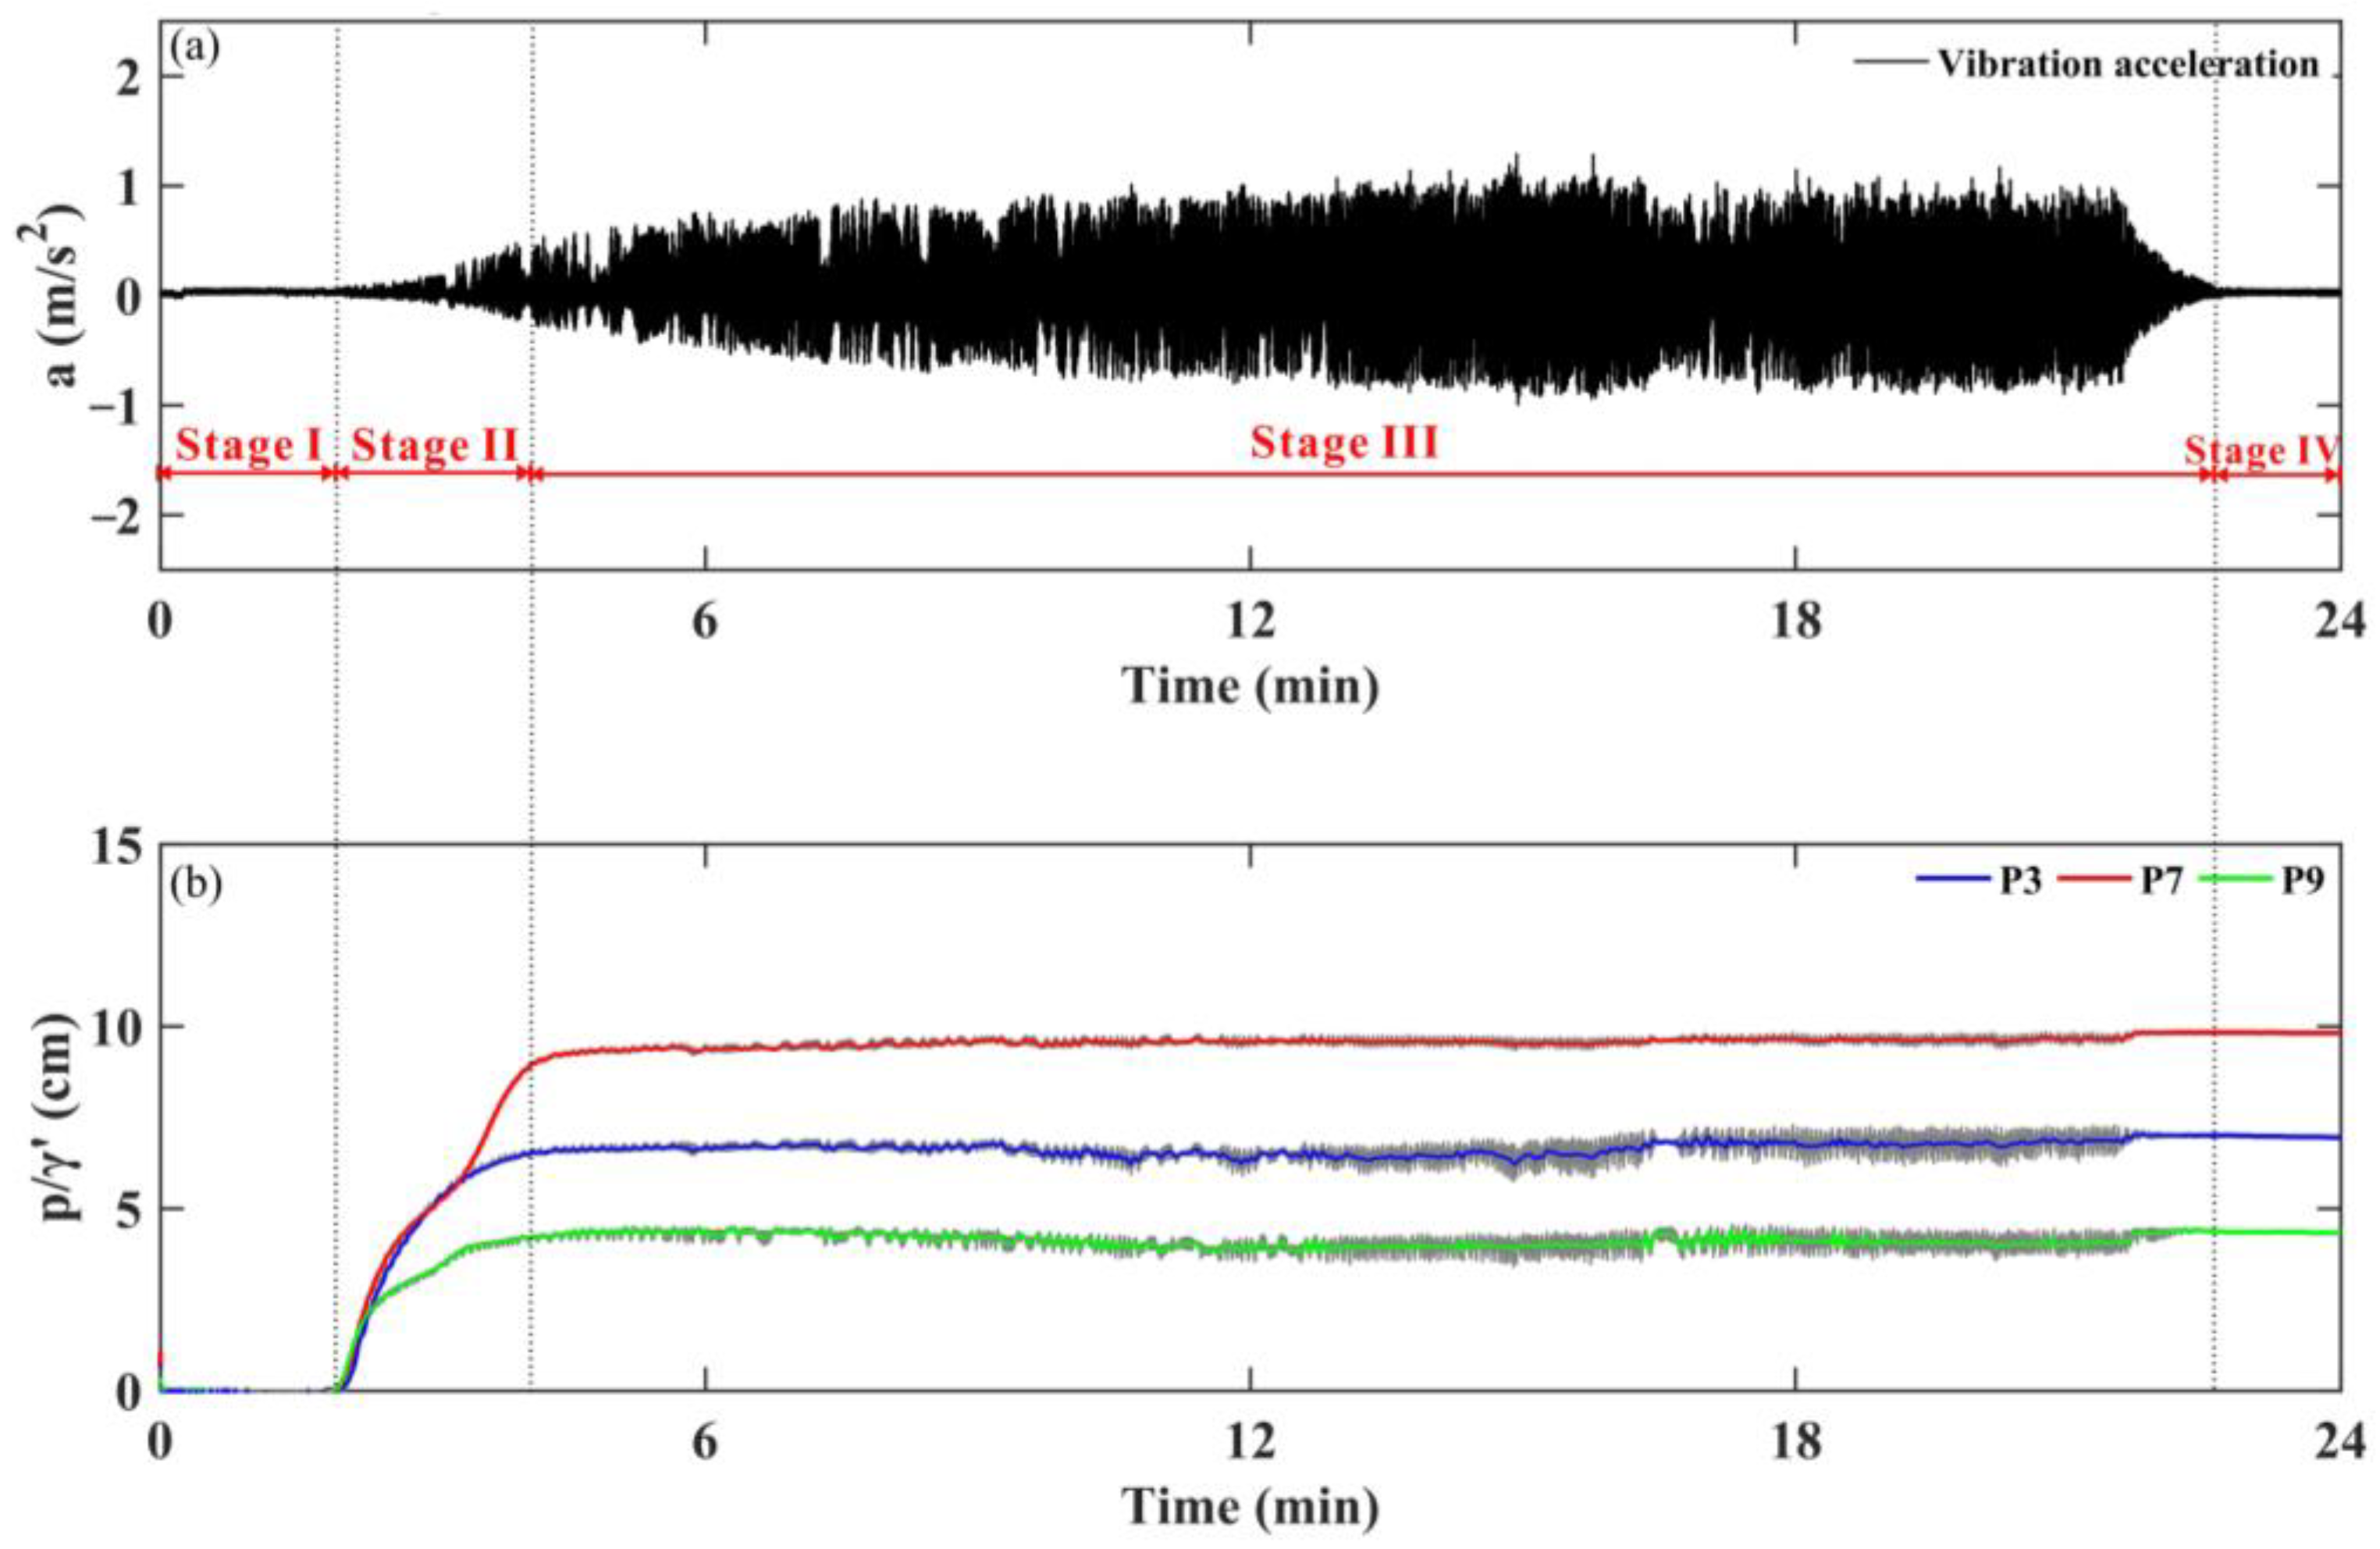
Figure 4 shows the time series of vibration acceleration (Figure 4a) and excess pore pressure (Figure 4b) after the rolling vibrator is switched on in Test 13. The excess pore pressure, p, is the excess pore-water pressure at different depths. The burial depth of the pipeline in Test 13 is b/D = 0.5, and the vibration frequency is 2 Hz (Table 1).
Figure 4 shows that, along with the fluctuating forces acting on the pipeline, the evolution behavior of the excess soil’s pore pressure and the acceleration in the vibration of the pipeline vary with time. The entire process after the rolling vibrator is switched on can be divided into four stages, namely (I) the steady stage, (II) the vibration starts and the pore pressure builds up, (III) the soil liquefaction and pipe vibration stage, and (IV) the vibration stops and the excess pore pressure dissipates. The main features of the soil–pipeline evolutions can be identified as follows:
Stage I (steady stage). In the first stage of the process, as the initially packed soil grains support and constrains the pipe, the pipeline does not vibrate despite the periodic forces acting on it. This means that at the earliest stage after the spanning pipeline vibration starts, the partly buried pipeline at the touchdown section is stable.
Stage II (the vibration starts and the pore-water pressure builds up). With the initiation of pipe vibration, the excess pore pressure starts to build up, possibly because the cyclic shear strains in the sediment causes the rearrangement of the soil grains. This factor causes compression of the pore volume in the sediment, which “pressurizes” the pore water and results in the generation of excess pore pressure [17]. As the vibration action continues, the excess pore pressure accumulates continually until it reaches a maximum value, Pmax. The sequence of the processes is analogous to wave-induced liquefaction, as described by Sumer et al. [17].
Stage III (soil liquefaction and pipe vibration). Along with the progressive accumulation of pore pressure, soil liquefaction occurs when the excess pore pressure reaches a maximum value, Pmax. In the meantime, notable mud waves form and fluctuate along with the periodic force loading. The formation and periodic motion of the mud waves can be used as an indicator of soil liquefaction in the seabed [48,49]. The experimental soil, particularly the surface soil, is liquefied at this stage. After the soil is liquefied, the effective stresses between individual grains in the soil bed vanish, causing the water–soil mixture to behave like a liquid [17]. As a result, the soil pressure fluctuates with the pipeline vibration (Figure 4b) after soil liquefaction. Excess pore pressure close to the pipe tends to build up more rapidly and reaches a maximum value earlier, implying that soil liquefaction initially occurs near the pipeline and, subsequently, spreads downward and sideways. This factor is probably ascribable to the soil close to the pipeline being subjected to shear deformation caused by the vibration of the pipeline, where it is expected to generate pore-water pressures owing to soil deformation. This observation is consistent with those reported by Sumer et al. [17], Kirca et al. [50], and Miyamoto et al. [51].
Stage IV (excess pore pressure dissipation). After the vibration stops, the sediment grains start to settle down in the water–sediment mixture until they come into contact with each other, after which, the generated pore-water pressure diffuses in either a vertical or a horizontal direction [50]. Sumer et al. [17] calls this process ‘‘the soil compaction process’’. As the compaction process continues, the accumulated excess pore pressure dissipates.
3.2. Criterion for Onset of Liquefaction
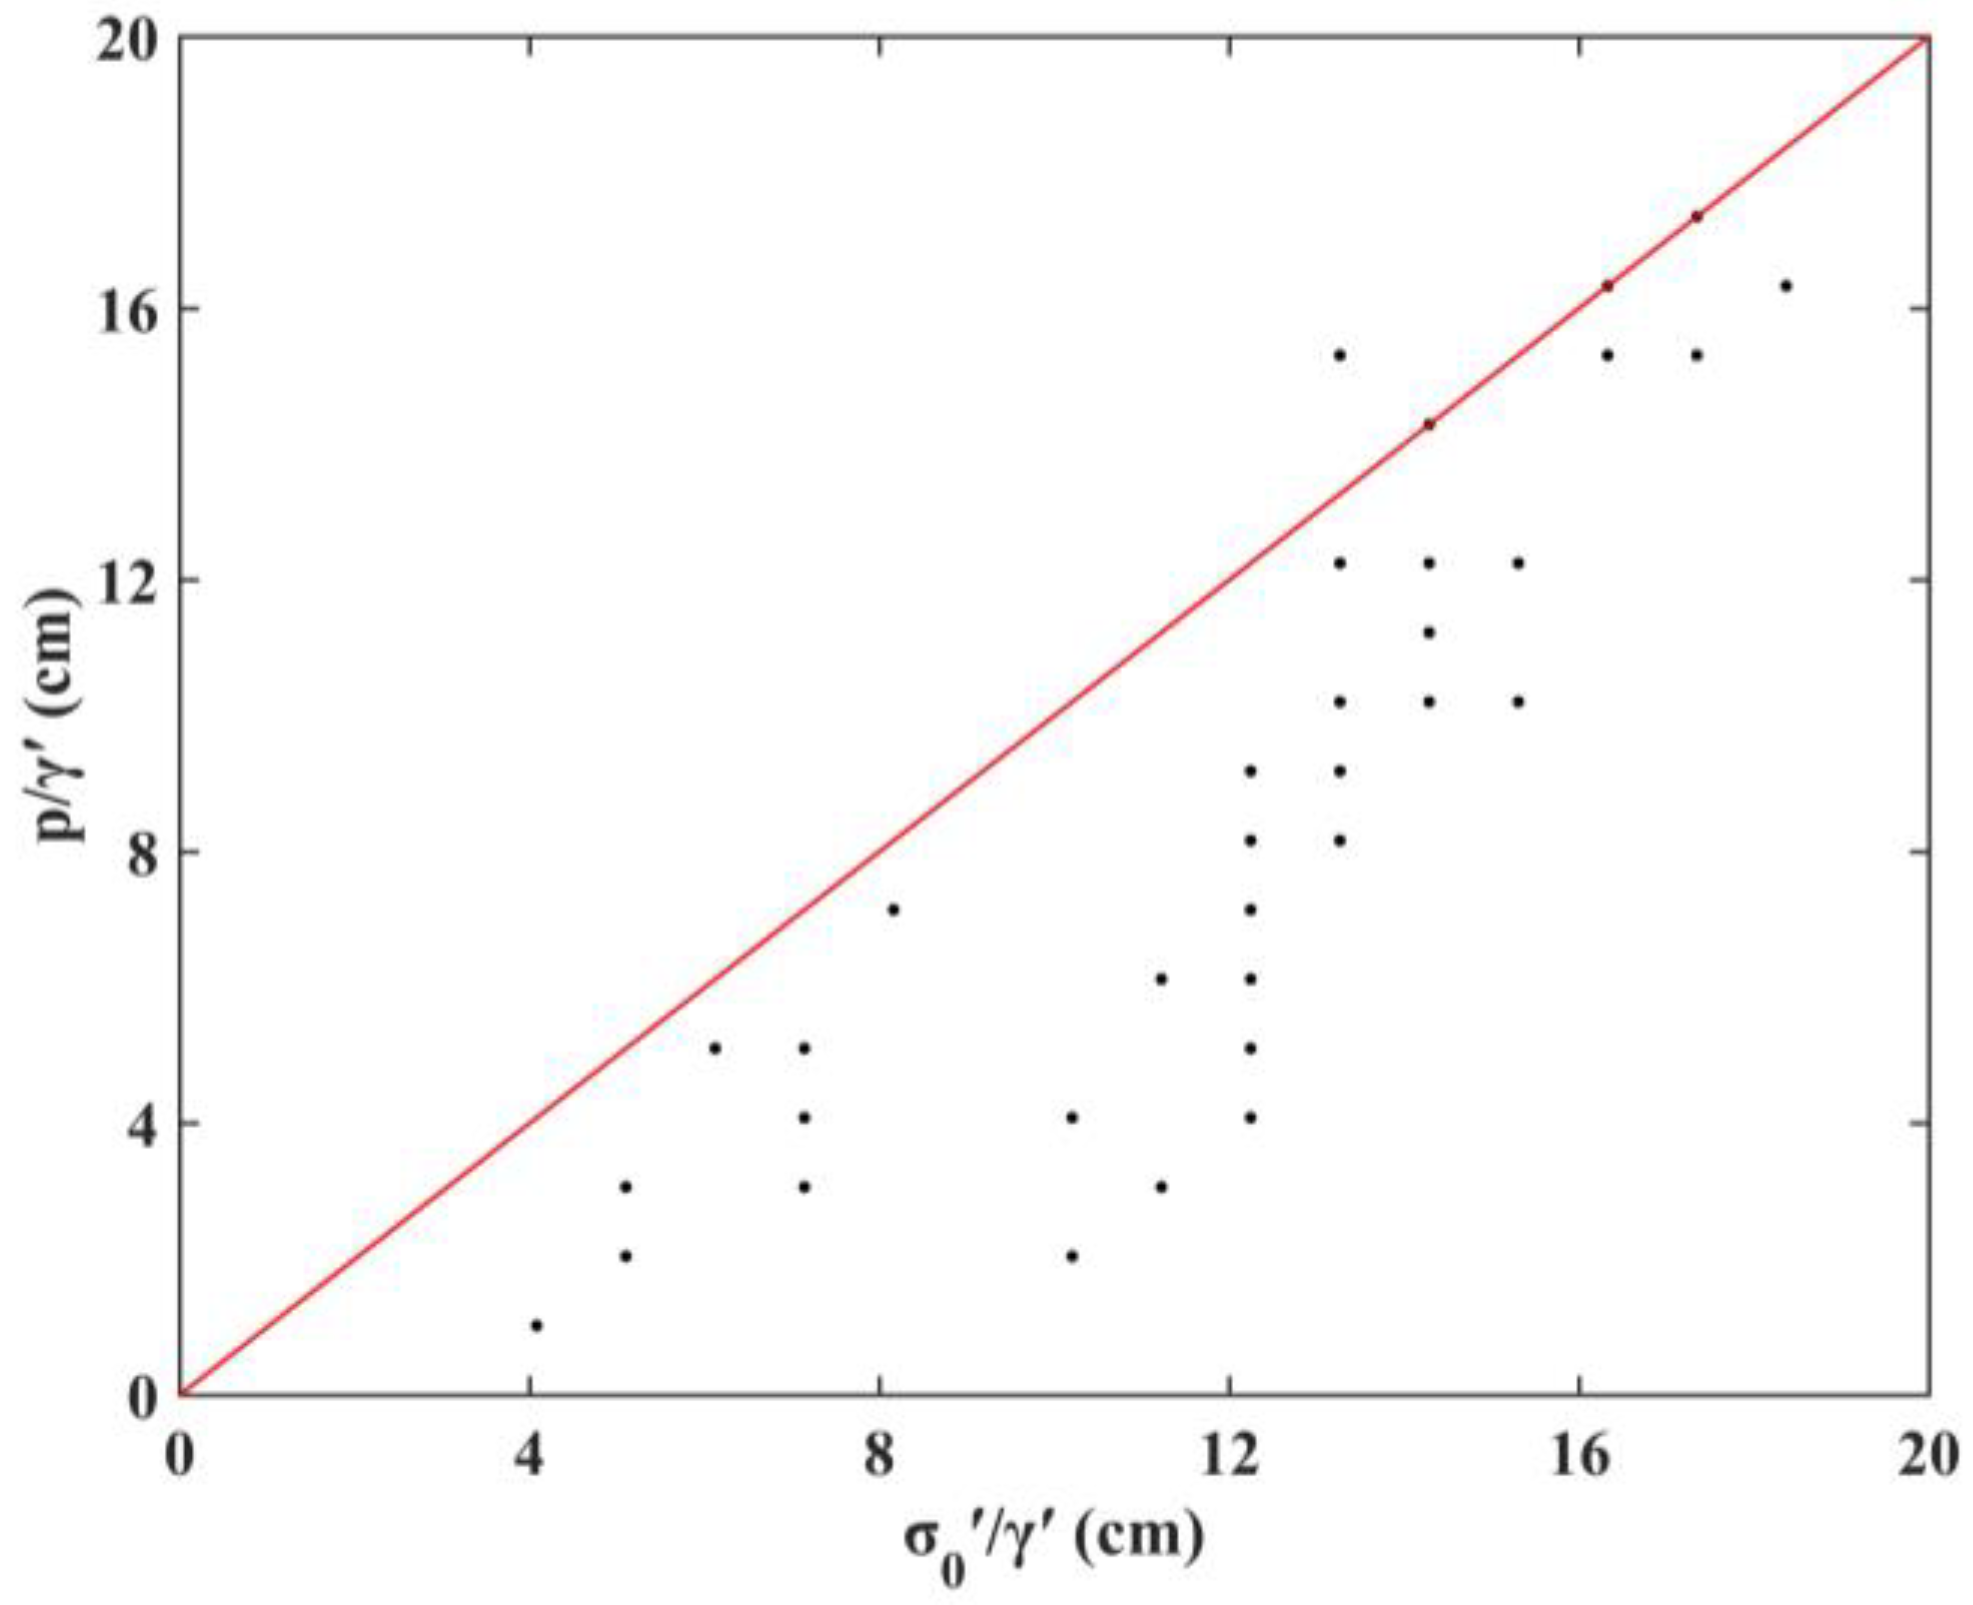
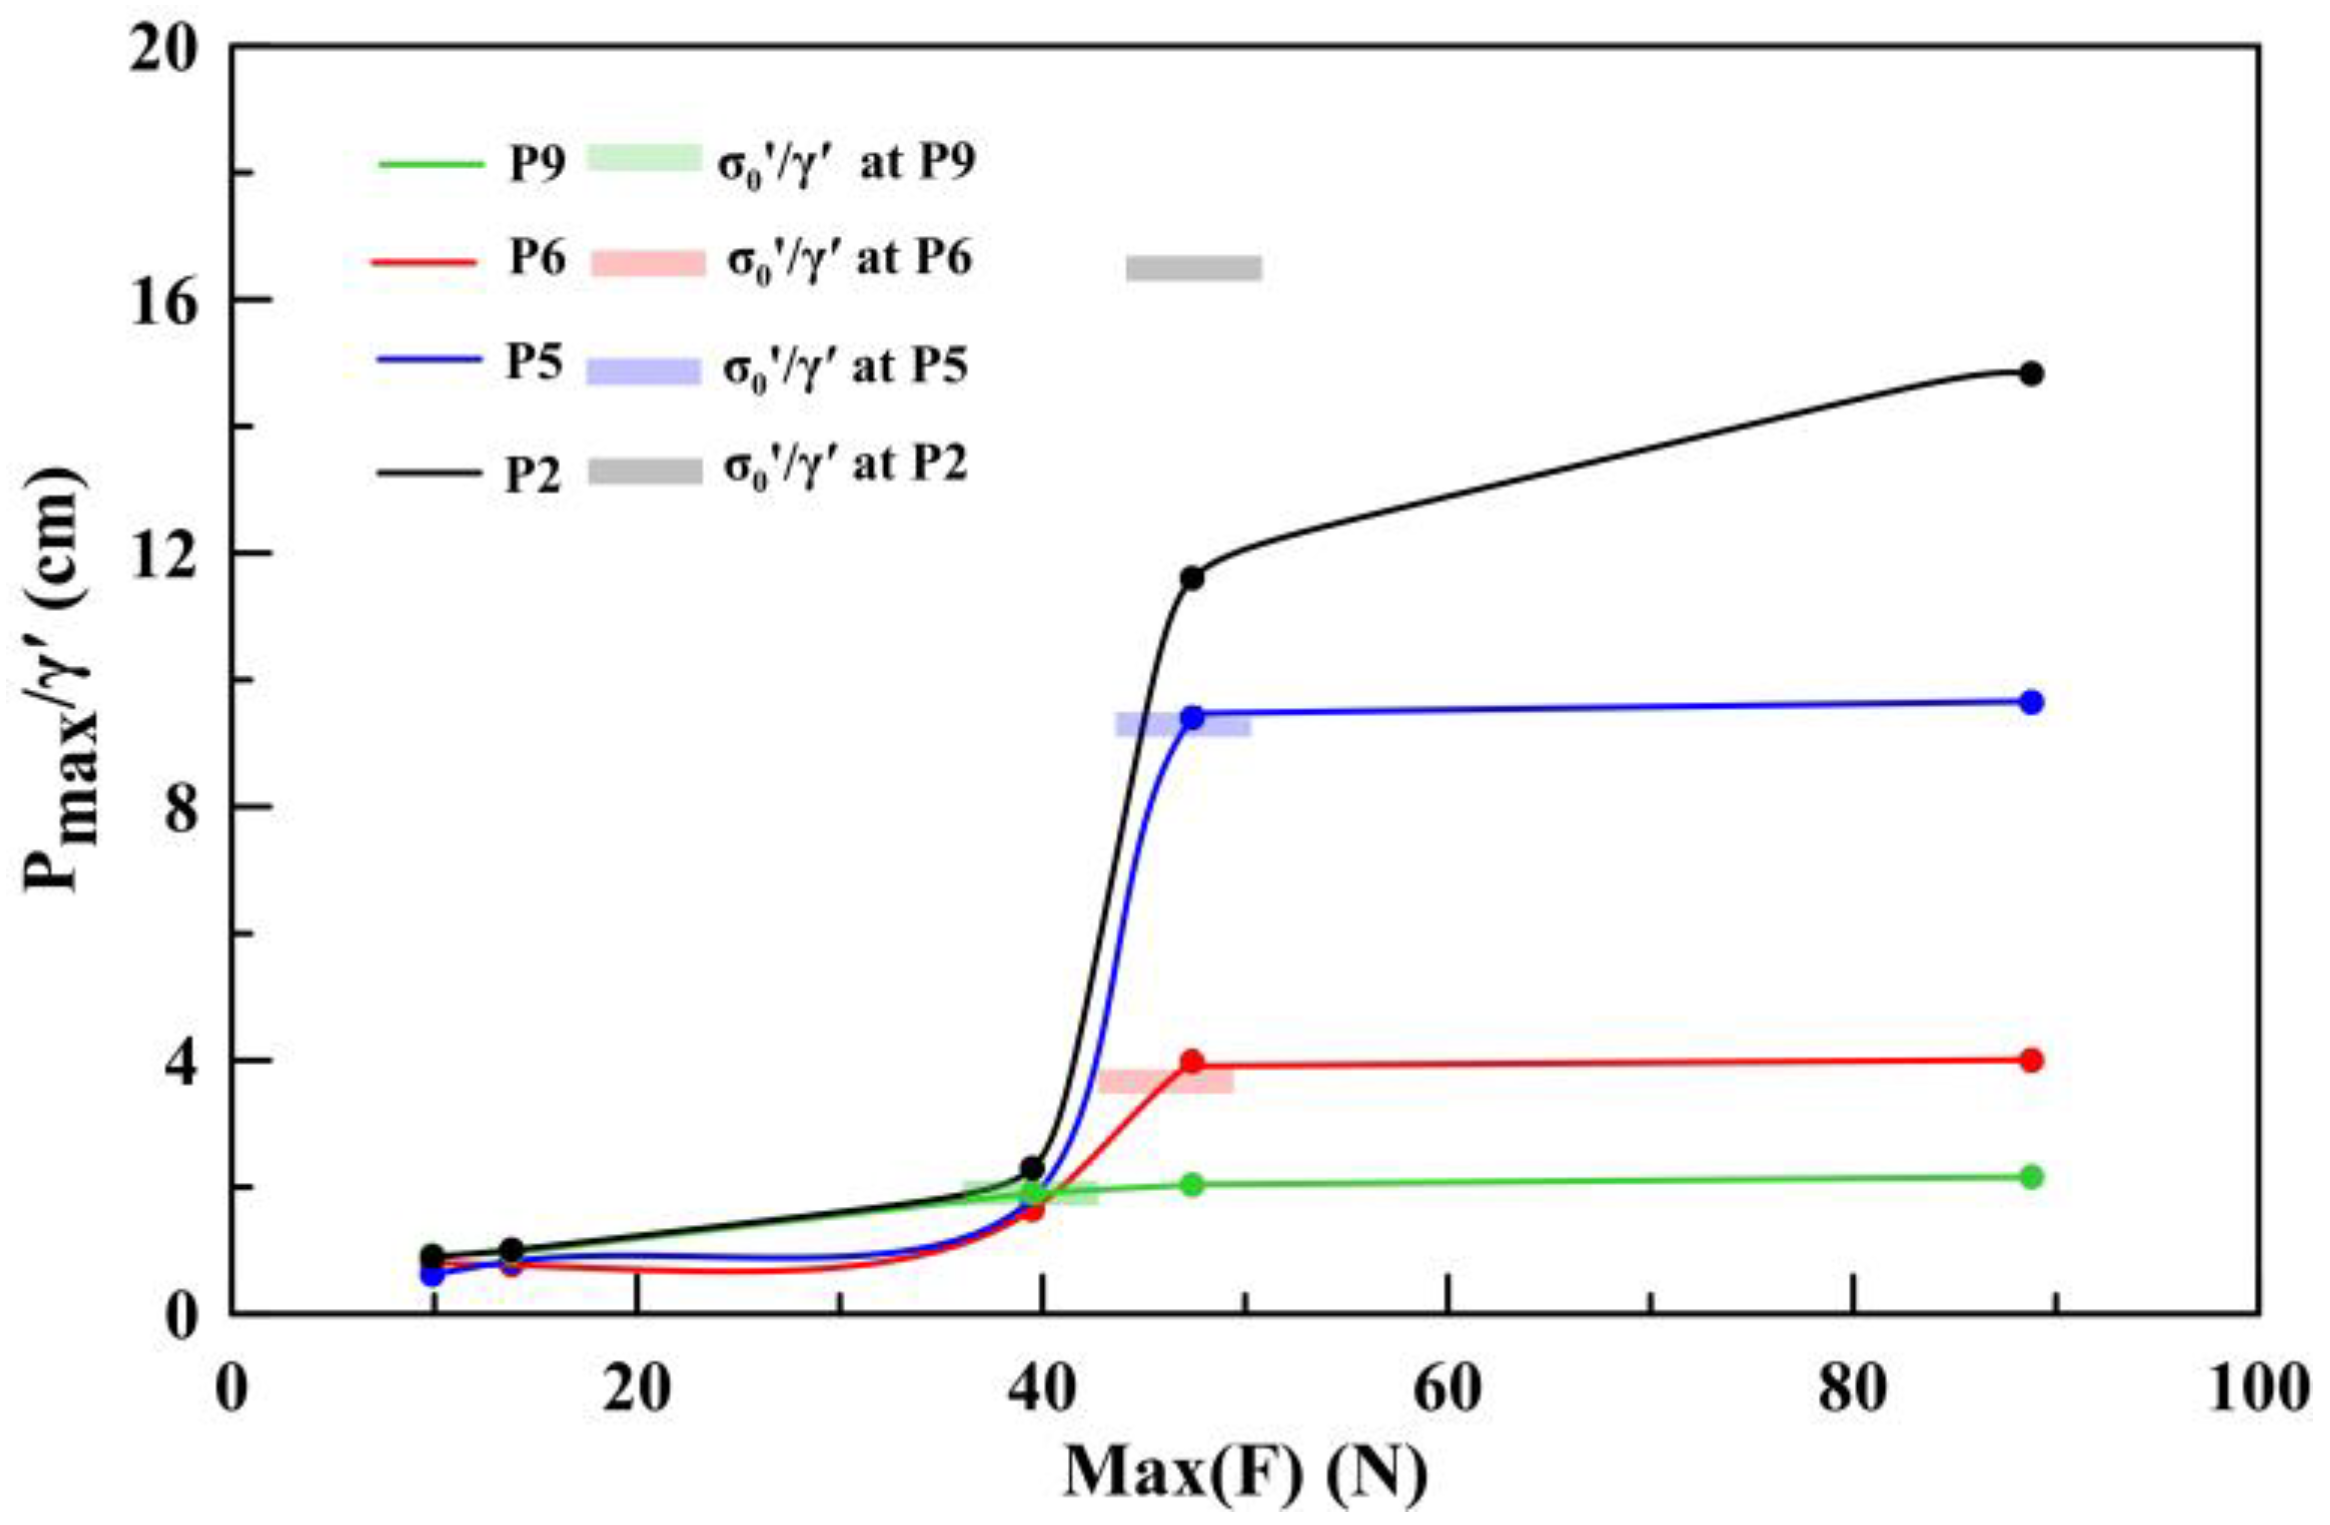
Sumer et al. [17,18], McDougal et al. [52], and Zhou et al. [38] have extensively discussed a criterion for the onset of liquefaction. According to Sumer et al. [17], liquefaction occurs when the pore-water pressure exceeds the initial mean normal effective stress, σ0’, which is defined by
where γ′ is the submerged specific weight of sediment, z is the vertical distance measured downward from the mudline, and K0 is the ratio between the horizontal and vertical effective stresses than can be calculated simply through K0 = 1 − sinφ, according to Jaky’s equation [17], in which φ = 26.8 is the friction angle of the soil. Such a criterion is supported by McDougal et al. [52].
Figure 5 shows a comparison between the measured maximum excess pore pressure, Pmax, and the corresponding initial mean normal effective stress values, σ′, calculated from Equation (2). In most tests, the measured maximum excess pore pressure, Pmax, is smaller than the calculated initial mean normal effective stress, σ′, implying that liquefaction occurs (p reaches Pmax) before the measured excess pore pressure reaches the theoretical initial mean normal effective stress value, σ′. This phenomenon could probably be ascribed to the soil close to the pipe following a complicated undrained (or partially drained) stress path [10] during the lateral pushing of the vibrating pipeline. In this way, a decrease occurs in the initial mean normal effective stresses, related closely to the additional force loads exerted by the vibrating pipeline. Accordingly, the existing local effective stress-based criterion for determining the onset of liquefaction might not be applicable in engineering practice for such loading cases in the vicinity of the pipe.
3.3. Liquefaction Process
To demonstrate the liquefaction process, relatively small forces, (i.e., not large enough to cause liquefaction) were used at the early stages of tests 6 to 10 (Table 1). After liquefaction occurred, different ranges of vibrating force were applied to observe the subsequent pipeline behavior in the liquefied soil.
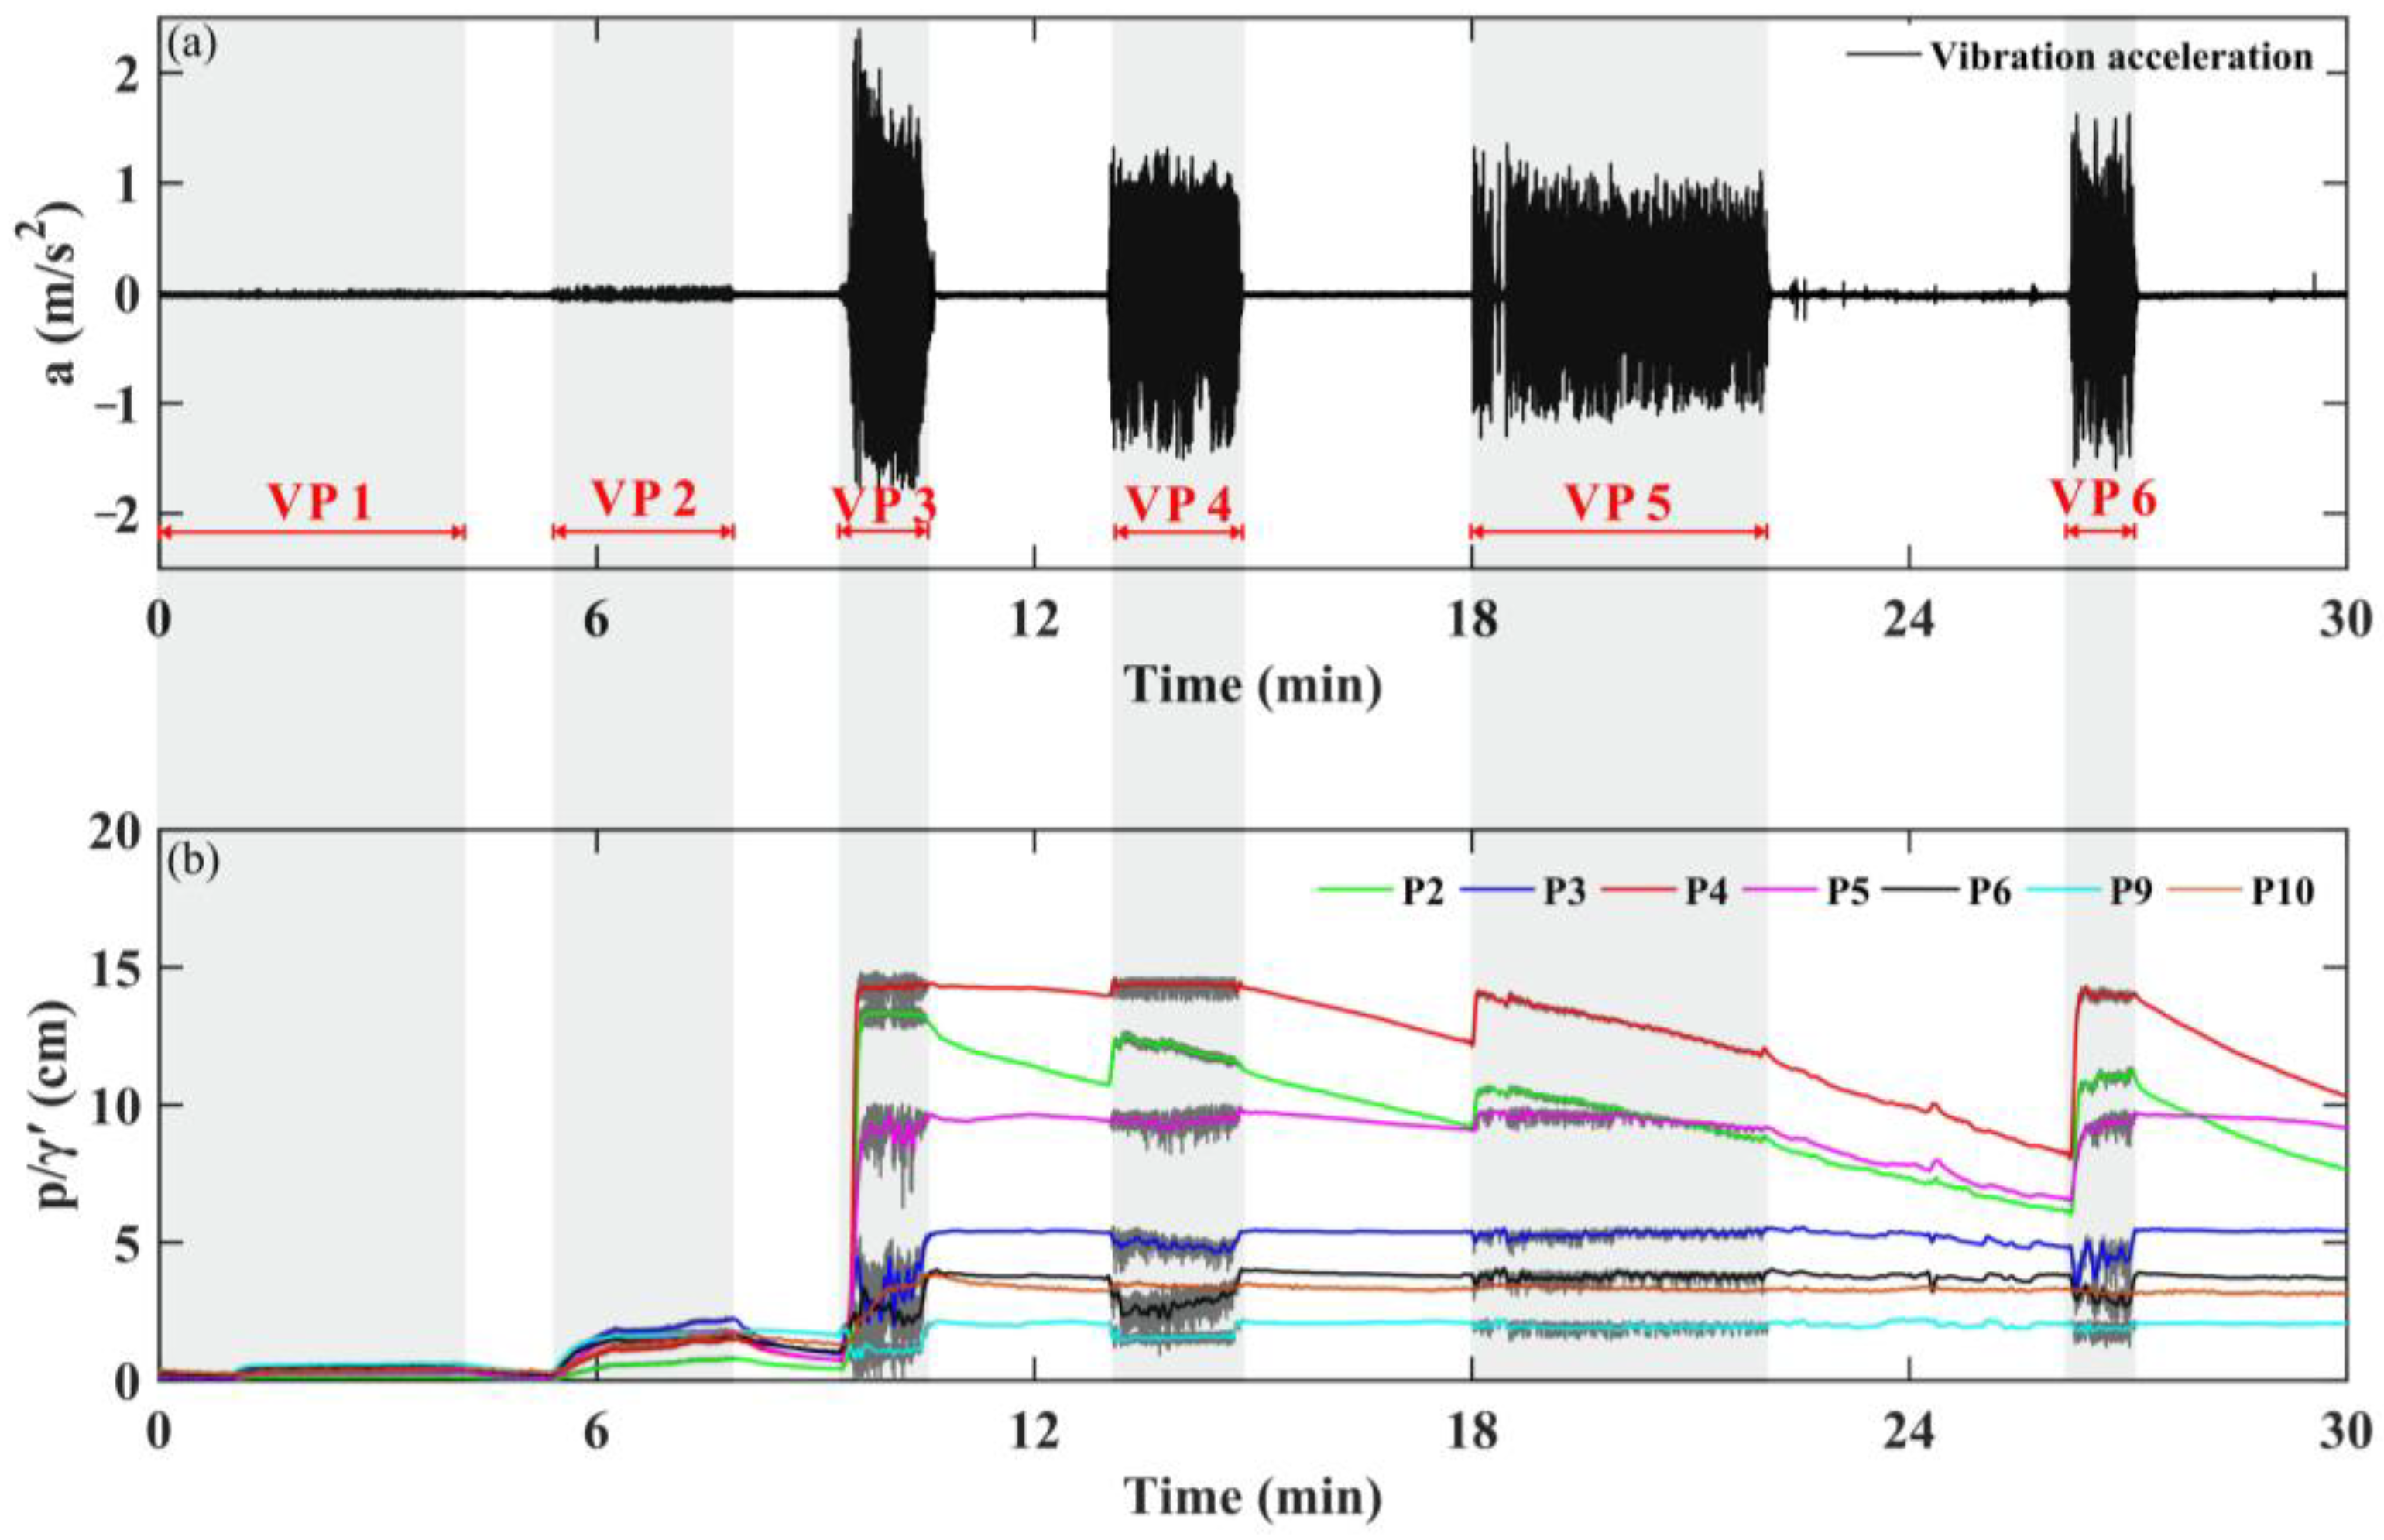
Figure 6 shows the time series of excess pore pressure (b) and vibration acceleration (a) in Test 8. In this test, six vibration processes (abbreviated to VP in Figure 6) were conducted with different magnitudes of force (Table 1).
In Figure 6, the Pmax values in VP 1 are substantially smaller than the calculated initial mean normal effective stress, σ′, indicating that the soil is in a non-liquefaction state. The implication is that relatively small forces (with the magnitude of centrifugal force 9.9 N, VP1 in Figure 6) are not large enough to induce soil liquefaction.
Along with an increase in the vibration force (with the magnitude of centrifugal force is 39.5 N in vibration process VP2 in Figure 6), the pore-water pressure of P9 at z = 3.9 cm reaches its Pmax value, but the pore-water pressures at the other pressure sensors are much smaller than their corresponding Pmax values. Such a phenomenon indicates that soil liquefaction initially occurs in the surface of the seabed or in the local area near the pipeline.
When the vibration force increases even further (with the magnitude of centrifugal force is 88.8 N in vibration process VP3 in Figure 6), the excess pore pressure in deeper soil (up to z = 11 cm at P5) builds up rapidly, and the soils at sensors P1 (not shown in Figure 6), P3, P5, P6, and P9 liquefy in an extremely short time, whereas those at P2, P4, P8, and P10 do not. This process indicates that, along with more severe vibration situation, liquefaction develops downward after surface liquefaction, with the maximum liquefaction depth being approximately P5 at z = 11 cm.
After the shallow soil is liquefied, the reduction of cyclic loading from the vibrating pipeline (VP4–VP6 in Figure 6) does not reduce the pore pressure in the liquefied soil (see P3, P6, P9, and P10 in Figure 6b) but reduces the pore pressure by dissipating the pore water in the deep soil (see P2 and P4 in Figure 6b); the increase in cyclic loading from the vibrating pipeline does not enhance the accumulative pore pressure in the liquefied soil as it reaches its liquefication criterion (indicated by the red and blue lines in Figure 7), and the pore pressure in deeper soil also does not show a distinct increase along with larger cyclic loading, although the liquefication criterion has not been reached (the black line in Figure 7). Such occurrence could probably be ascribed to the energy of periodic loading from the vibrating pipeline was absorbed by the liquefied soil through the movement of mud waves. Accordingly, an ultimate liquefaction depth probably exists, which is approximately P5 when the burial depth of the pipeline is 10 cm. Larger cyclic loading from the vibrating pipeline cannot induce the liquefaction of the deeper soil beyond the ultimate liquefaction extent.
3.4. Liquefaction Extent
The extent of sediment liquefaction around a submarine pipeline is vitally important for pipeline stability. We used the liquefaction index, Y, to intuitively describe the soil liquefaction degree, which is defined as [49,53]:
where p is the measured excess pore pressure and σ0’ is the initial mean normal effective stress. The calculated Y varies between 0 and 100, with a greater value of Y indicating that the soil is closer to the liquefied state, and Y = 100% indicating complete liquefaction, as described by Foray et al. [10].
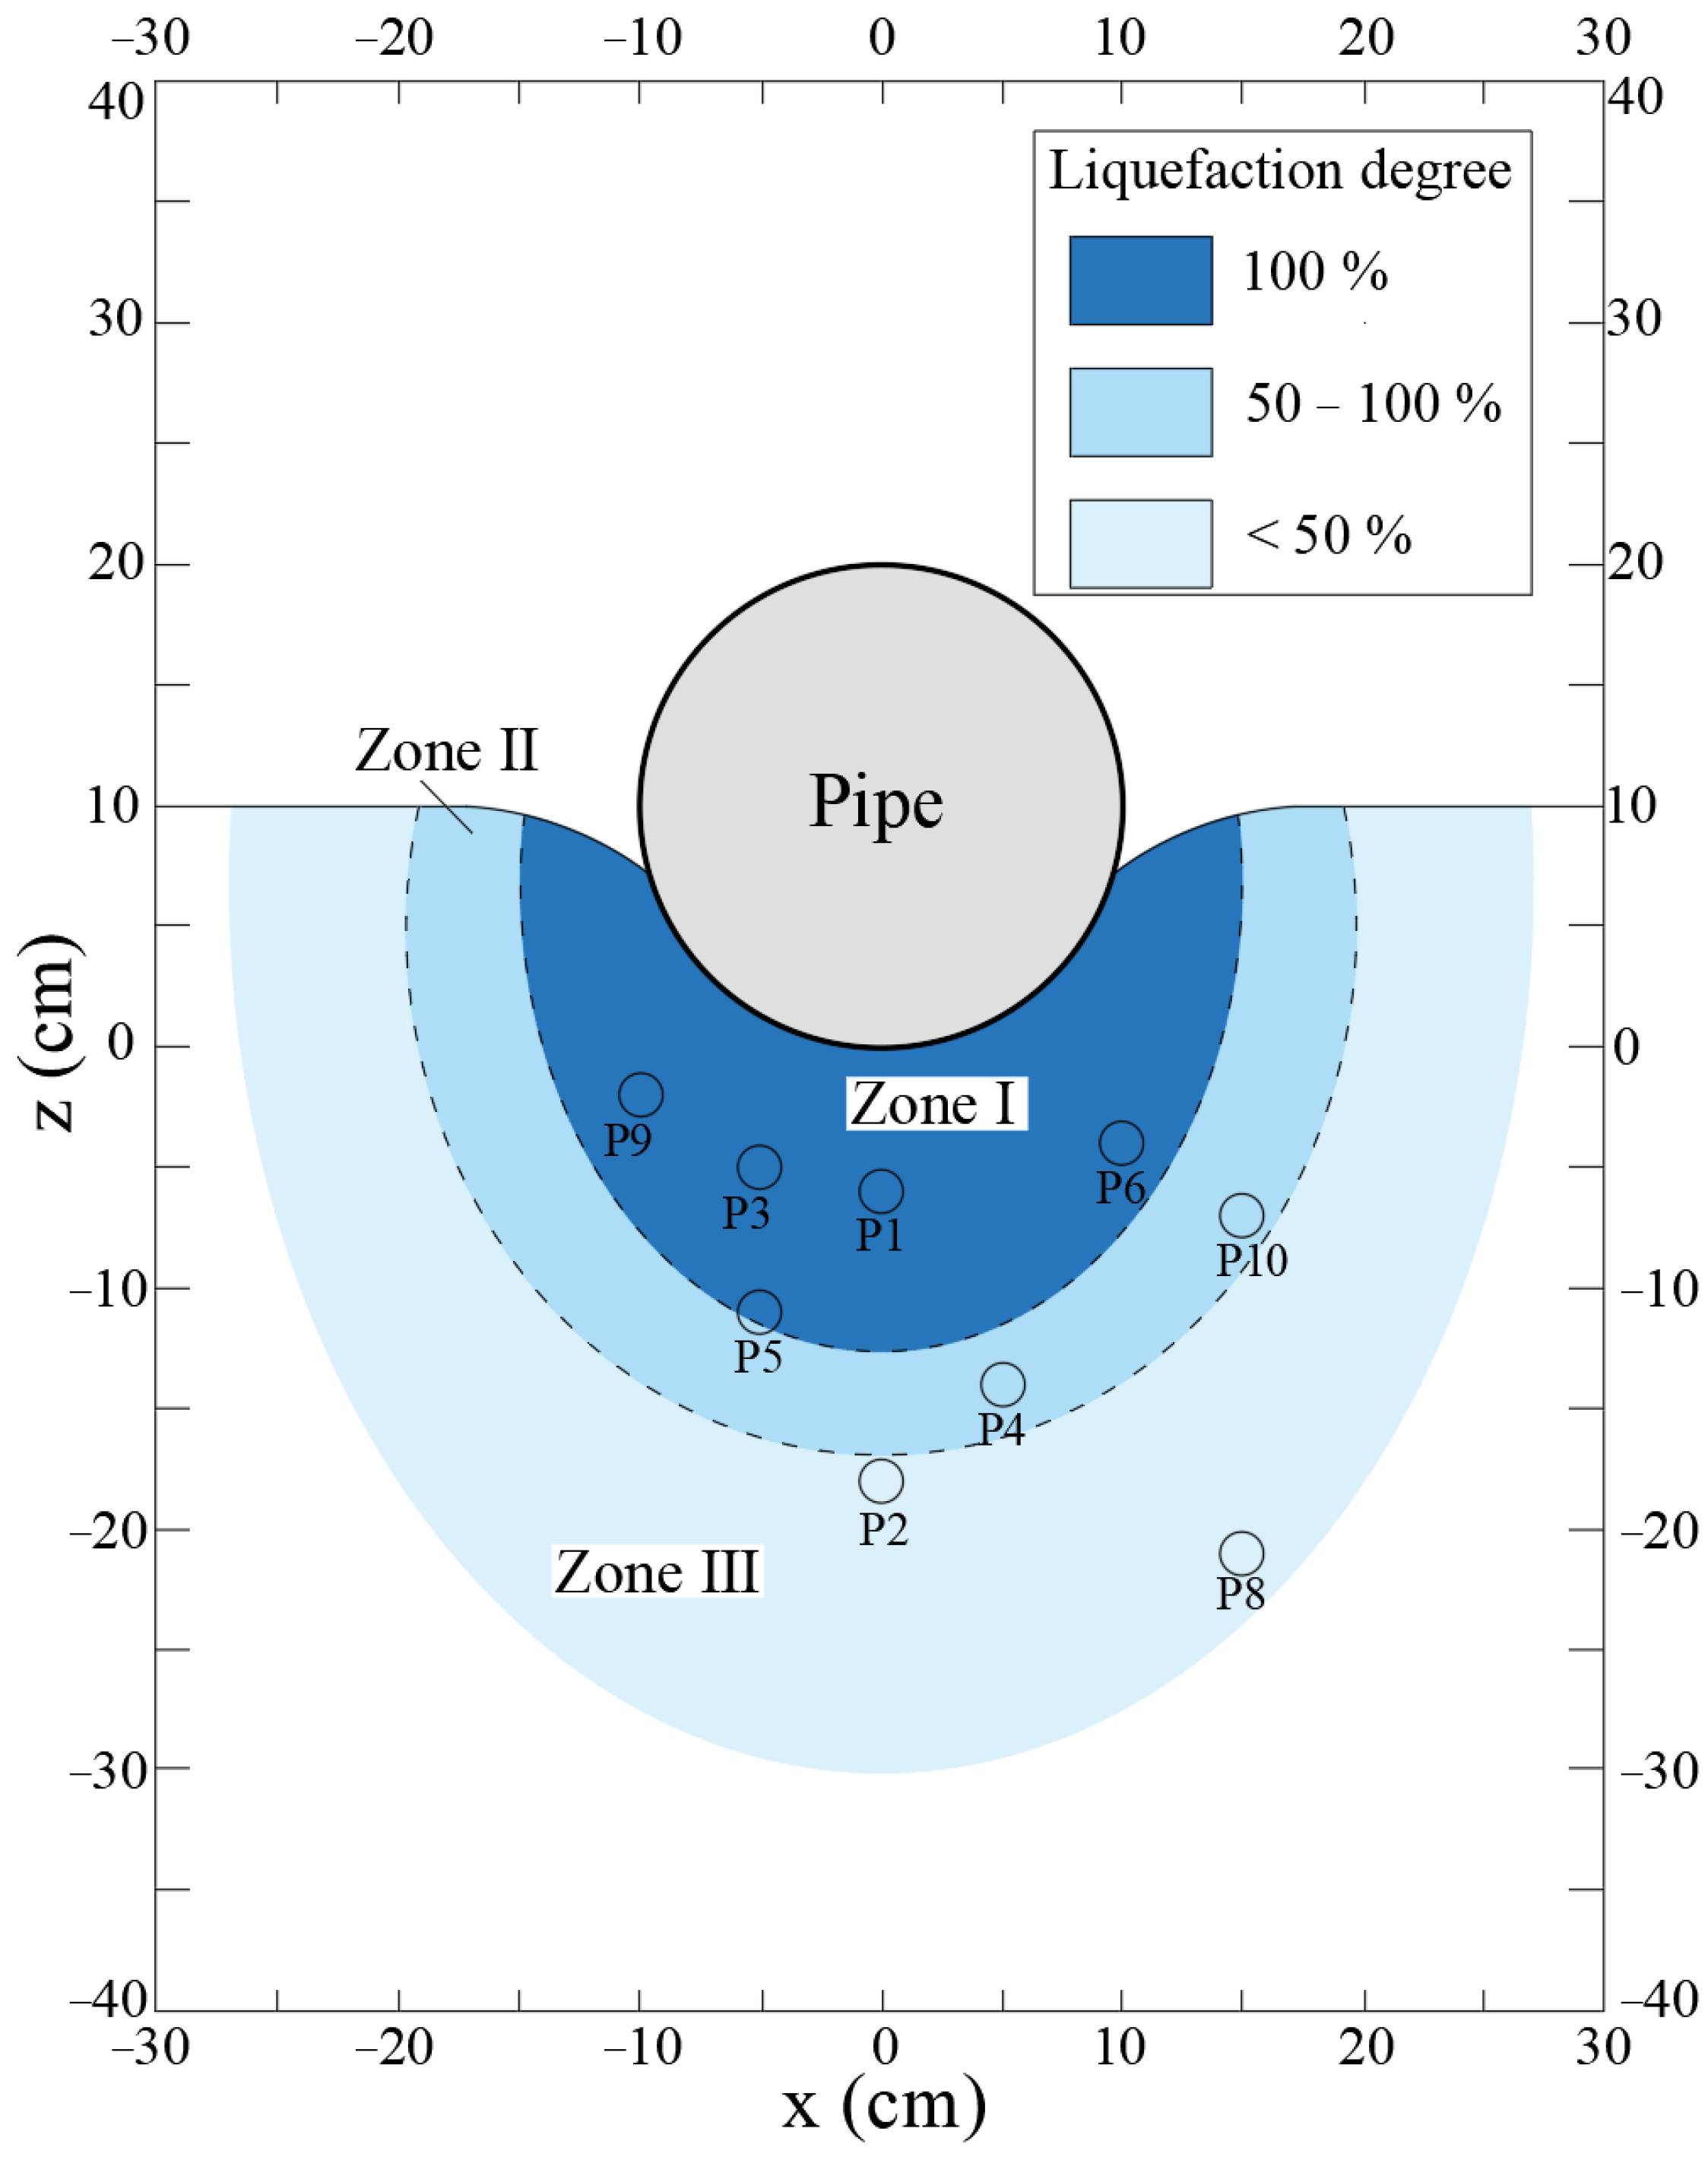
Three zones of the extent of the liquefaction can be identified according to the measured value of excess pore pressure and the calculated values of the degree of soil liquefaction, Y (Figure 8). These zones are Ys of 100%, 50–100%, and <50%, respectively.
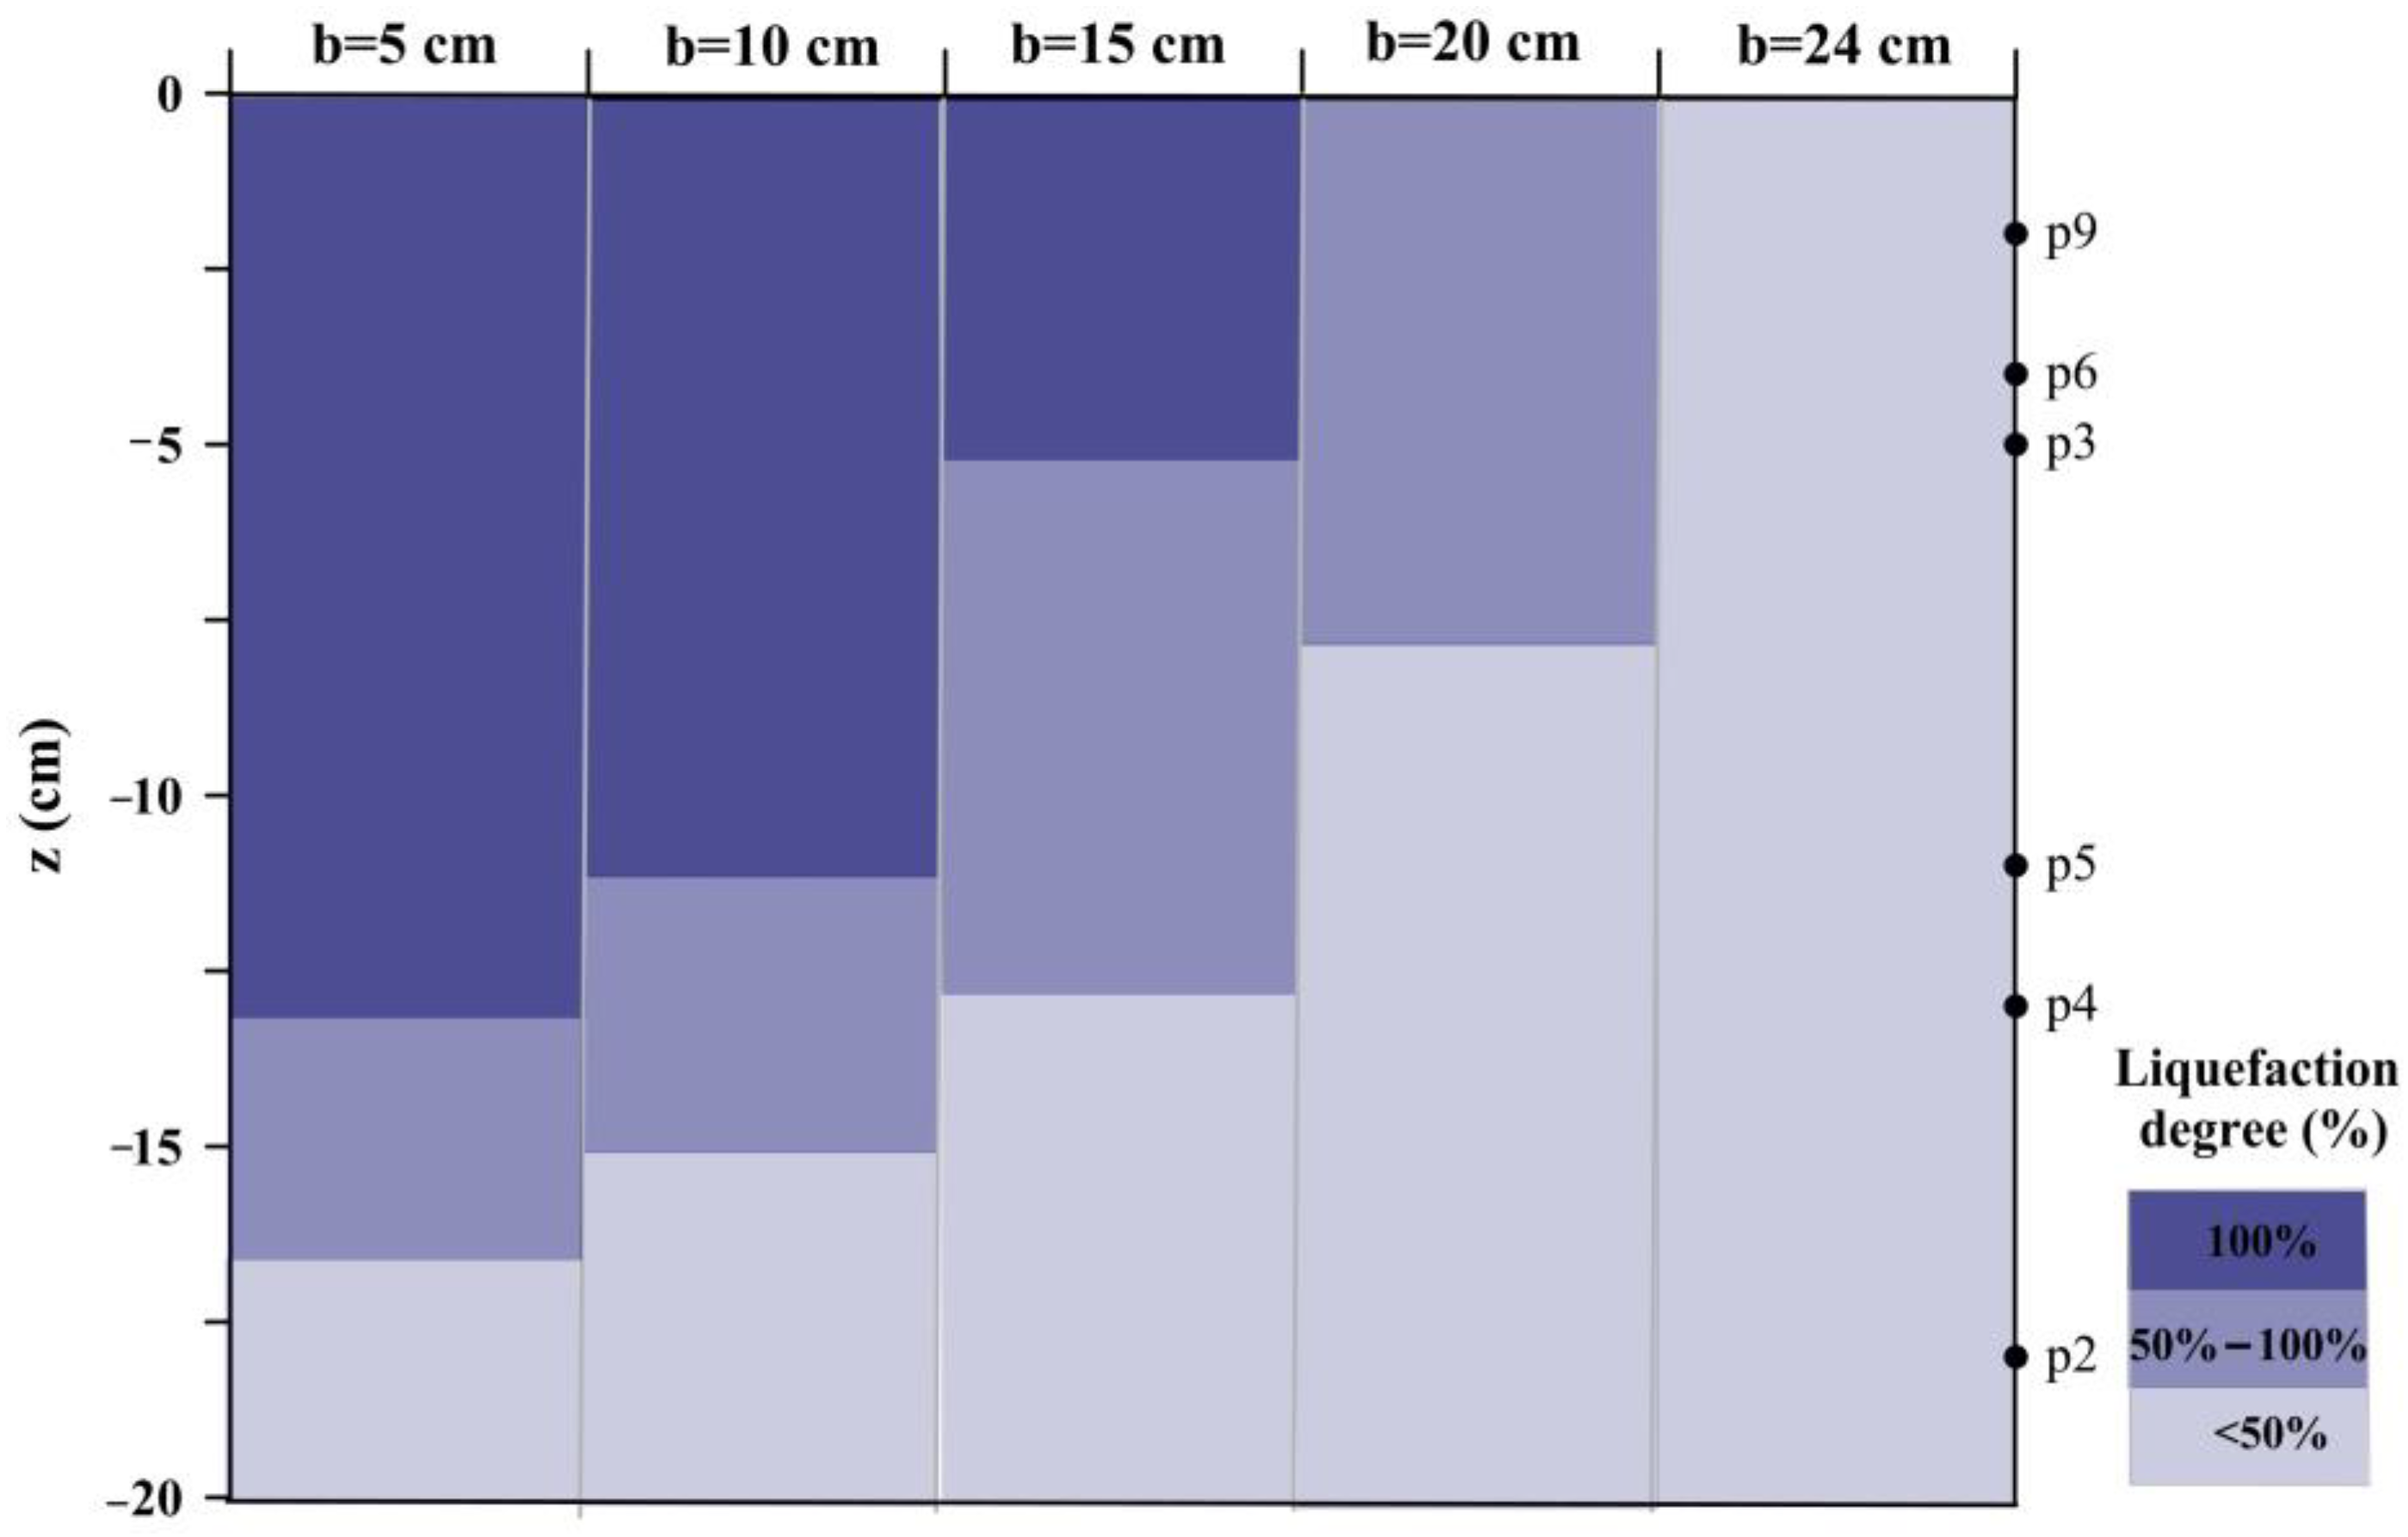
Zone I is close to the pipeline, where the excess pore pressure reaches Pmax, i.e., the soil in Zone I is in a state of “complete liquefaction”. The liquefied soil in this zone has completely lost its strength and shows strong plastic deformations, including obvious fluctuations of instantaneous excess pore pressure. Zones II and III mainly show elastic deformations combined with excess pore pressure buildup, with the soil strength being reduced rather than completely lost, attributable to the relatively long distances to the pipeline. The boundary between the three zones is inconstant and moves downward and sideways from the surface of the pipeline along with the enhanced loading magnitude and shallower burial depth of the pipeline (Figure 9). The maximum complete liquefaction depth is 13.8 cm below the bottom of the pipeline when its burial depth is 5 cm, as recorded by pressure sensor P4 in Test 14. The depth of complete liquefaction becomes shallower when the burial depth of the pipeline is deeper, indicating that burial depth is a significant factor in the stability of submarine pipelines.
3.5. Dissipation of Accumulated Pore Pressure and Soil Compaction
In the final stage of the test sequence, when pipeline vibration ceases, the accumulated excess pore pressure dissipates and the sediment is compacted.
Figure 10 shows the time series of the dissipation of excess pore pressure in Test 14. The excess pore pressure in the deeper soil dissipates much more rapidly than that in the shallow soil. This phenomenon can be explained as follows: (1) The accumulated excess pore pressure is larger in deeper soil and smaller in shallow sediment (Figure 6b and Figure 10b), generating an upward pressure gradient which drives the pore water upward while the soil grains settle down in the soil–water mixture until they come into contact with each other [17]. (2) The excess pore pressure in the deep soil probably dissipates through the porous sandy bottom in the experimental tank.
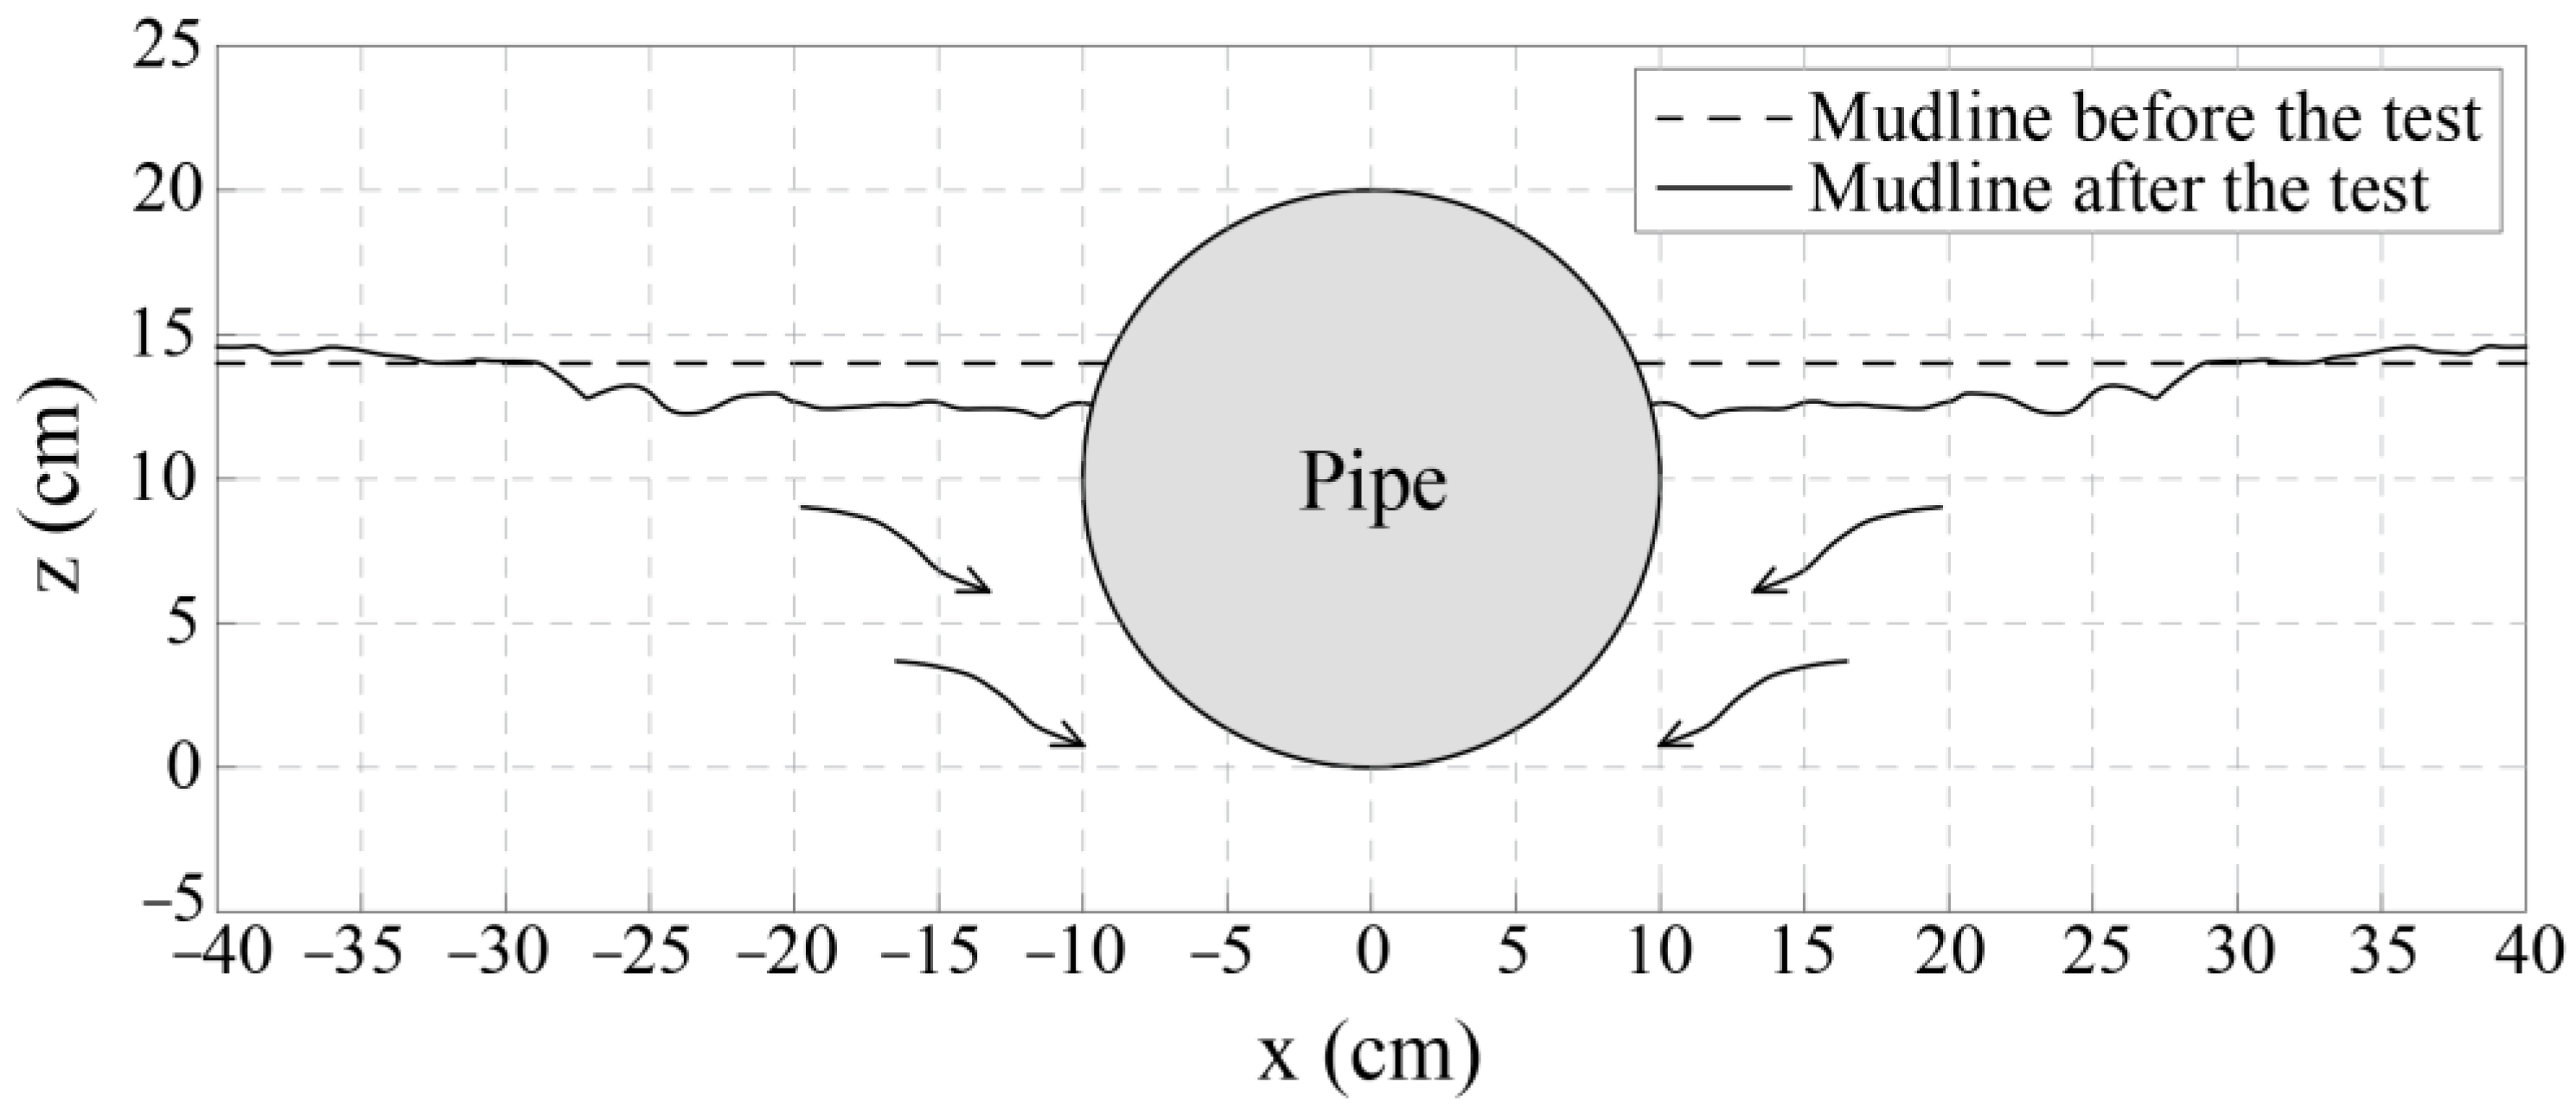
After dissipation of the accumulated pore pressure, the soil bed becomes progressively denser as the soil grains are rearranged, leading to soil compaction and mudline subsidence (Figure 11). The compacted soil increases its resistance to liquefaction during the subsequent loading cycles [54]. Ultimately, the seabed probably does not experience further liquefaction unless more severe pipeline vibration occurs.
4. Discussion
4.1. Influence of Span Shoulder Liquefaction on Pipeline Stability
The residual pore-water pressure accumulation and soil liquefaction at the span shoulders influence the instability of a pipeline in several ways. First, the support that the soil skeleton provides to the pipeline is weakened. After the soil is liquefied, notable mud waves form and the pore pressure of the liquefied soil fluctuates under the periodic loading of the vibrating pipeline (Figure 4b), probably because it acts like a liquid [31,50,53]. In such situations, the liquefied soil ceases to support the pipeline, which causes the effective supporting area of the spanning pipeline to move outward from the initial contact points of the free span (Figure 12). Such a process is analogous to increasing the span length, causing the effective supporting area of the spanning pipeline to move outward in opposite directions from the original ends of the span, thereby increasing the actual spanning length (Figure 12). The extended span possibly moves, floats, or sinks, depending on the hydrodynamic conditions and the specific gravity of the pipe [31,37,50].
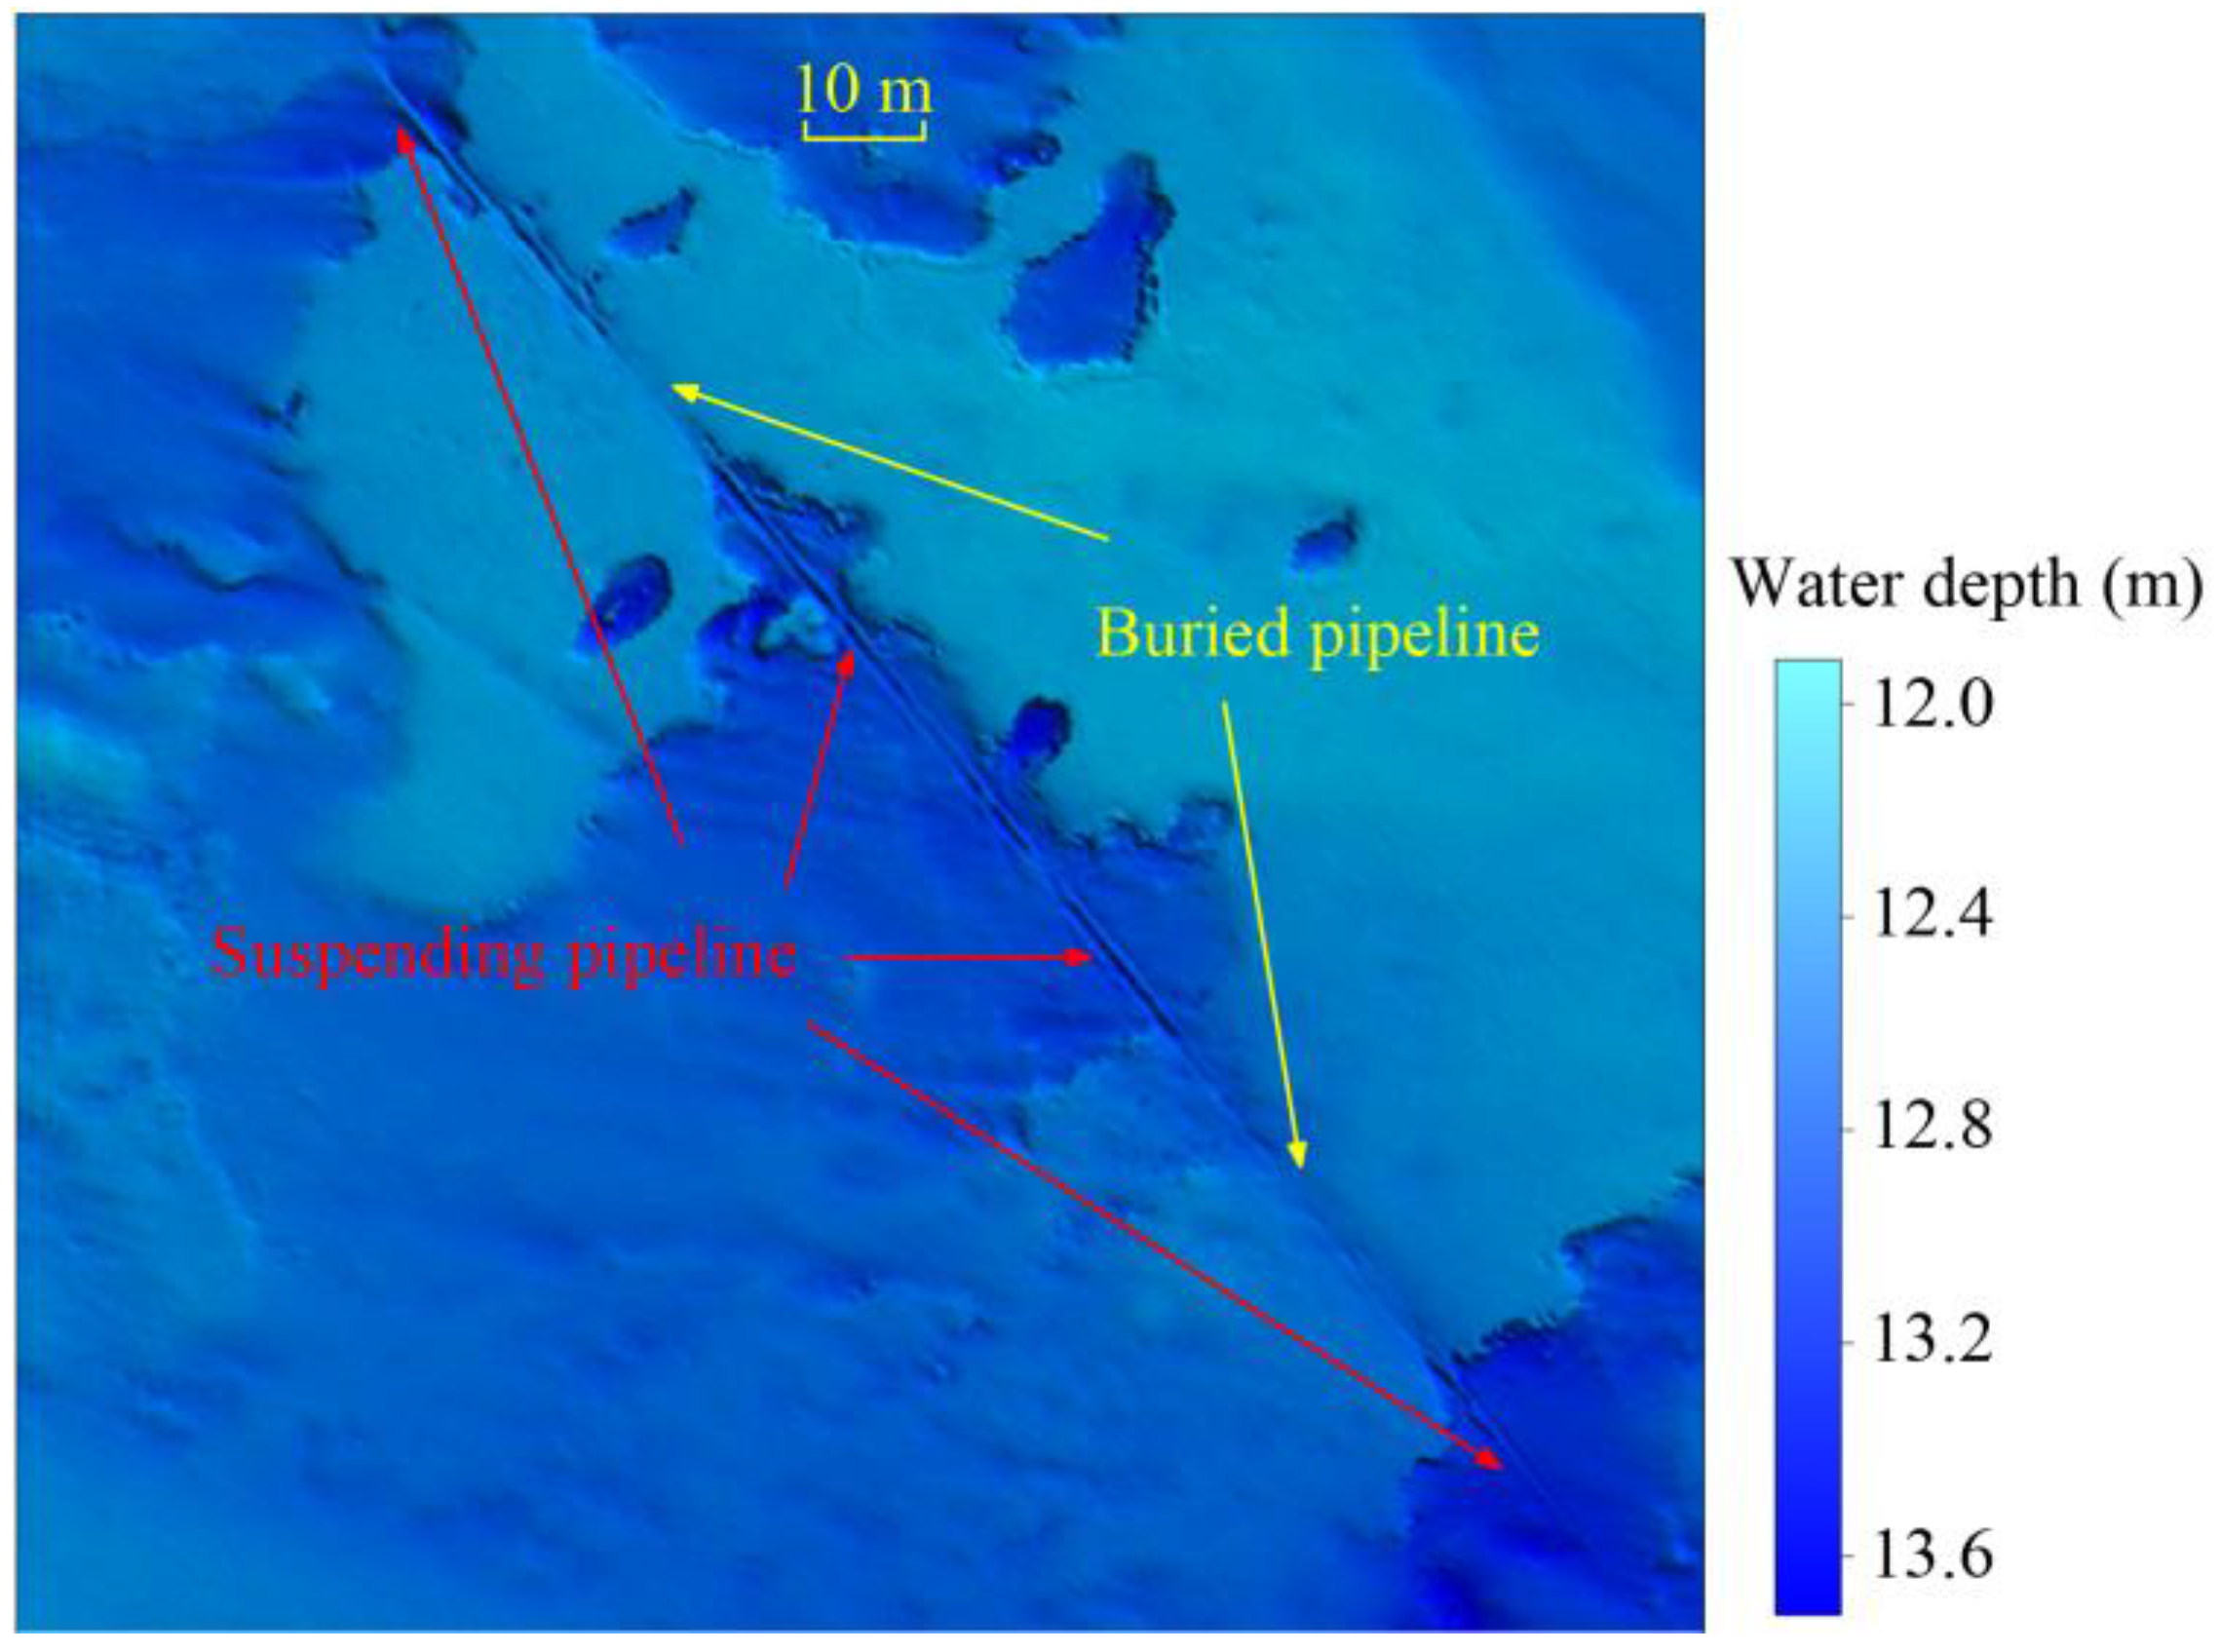
Second, seabed liquefaction could accelerate sediment resuspension in three ways. These are (1) reducing the critical velocity required to initiate sediment transport [35,48,55]; (2) forming mud waves and leading to an increase in turbulent kinetic energy; and (3) dissipating excess pore pressure and forming seepage channels inside the seabed soil, which results in the pore-water carrying fine-grained sediment upward into the water body and causing an increase in suspended sediment concentration (SSC) [48]. As a result, the sediment at the span shoulders could be scoured more rapidly and the span length enlarged in a shorter time. This scientific hypothesis can be proven by the field investigations of submarine pipelines in the subaqueous Yellow River Delta (a typical case is shown in Figure 13). As the figure shows, the erosion of the seabed is more severe around the shoulders of the spanning pipeline, indicating that the supporting regions of the spanning pipeline were probably scoured away rapidly once the vibration of the pipeline occurred.
Third, the bending deflection of the spanning pipeline could be increased (Figure 12) by the two processes discussed above, thereby increasing the risk of pipeline rupture before the center of the spanning pipe descends to the seabed.
Finally, the boundary conditions at the span shoulders could change from the initially fixed support to viscoelastic support. The natural frequency of the span system would, therefore, be expected to change [56]. The pipeline span could also be subjected to changing vortex-induced vibrations, depending on the soil state of the span shoulders [55,57].
4.2. Remarks on Practical Applications
Our experimental studies emphasize the influence of pipeline vibration on pore pressure accumulation and seabed liquefaction. As these experiments did not involve wave loading, the experimental results are applicable to a silty seabed with negligible wave load, such as a seabed with the water depth deeper than the wave base. In such environments, unidirectional flow could induce the transverse vortex-induced vibrations of submarine pipelines [8,9,12,13,14]. However, the natural seabed in a nearshore seabed is usually subjected to wave action, which is recognized as a significant reason for the seabed liquefaction and erosion around pipelines [17,18,19,20,21,22,23,38,58]. Soil liquefaction is probably more severe when the seabed is subjected to the combined effects of wave action and pipeline vibration. This aspect requires further investigation.
We used silt as test soil in our experiments. Silt tends to liquefy when subjected to the accumulation of pore pressure under cyclic loading, such as waves, earthquakes, and pipeline vibration [17,18,19,20,21,22,23,24,25,26]. The performance of a sandy seabed probably differs from that of silt as sand has superior drainage conditions. Therefore, a sandy seabed would probably not show the accumulation of pore pressure and accumulative liquefaction under the waves [59,60]. Furthermore, we used fresh silt in our experiments. This sediment was exposed to cyclic force loading for the first time, whereas the sediment in the field would have a long history of wave action and is, therefore, normally in a stiffer state. The liquefaction conditions of such sediment probably differ from those of the test soil we used [31].
Boundary conditions probably affect the buildup and dissipation process of pore-water pressure, as a rigid boundary could act as a fully reflecting boundary during the accumulation of pore pressure [50]. To eliminate this boundary effect, the sides of the test tank in our study were covered with a porous material and the bottom was covered by coarse sand. However, the porous boundary probably served as a “sink” condition for the generated pore-water pressure, possibly causing the cumulative pore pressure to dissipate from the borders of the model. In field conditions, neither rigid nor porous boundaries exist, except in special conditions, e.g., impermeable soil or porous sand underlying the silt layer. In such situations, the extent of Zones I and II is expected to differ significantly. In further studies on soil liquefaction, in situ observations should be conducted or larger test tanks used.
Despite these considerations, the various influences of soil liquefaction at the span shoulders on pipeline stability identified in our experiments imply that the traditional approach of evaluating the safety of spanning pipelines according to the detected spanning length could underestimate the potential risk of pipeline instability.
5. Conclusions
We simulated the coupling process between a vibrating pipeline and silty soil dynamics using a physical model. Based on our experimental results, the following conclusions can be drawn:
- (1)
- Along with the introduction of pipeline vibration, excess pore pressure accumulates and is followed by soil liquefaction, during which the vibrating amplitude is enhanced as a result of reduced effective soil stresses. After the period of liquefaction, the accumulated excess pore pressure gradually dissipates, and the sediment becomes more compacted.
- (2)
- For a given silty soil, liquefaction occurs when the excess pore pressure reaches its maximum value, Pmax. The measured Pmax was found to be much smaller than the theoretical values calculated based on the initial mean normal effective stress.
- (3)
- Soil liquefaction initially occurs in the top layer or in the area proximal to the pipeline and develops downward and sideways under more severe vibration situations. The extent of liquefaction depends on the vibration conditions and the weight and burial depth of the pipeline.
- (4)
- The conventional approach for assessing the safety of a suspended pipeline is based on detecting the spanning length and assuming normal soil properties for evaluating the safety of spanning pipelines in fine sediments that are susceptible to liquefaction. However, such an approach could underestimate the risks of pipeline instability and result in unsafe maintenance practices.
Author Contributions
Conceptualization, J.X. and J.P.; methodology, J.X. and Y.Z. (Yaqi Zhang); software, J.X., J.D. and C.W.; validation, J.X., X.X., S.Z., A.L. and G.L.; formal analysis, J.X., X.X. and S.Z.; investigation, J.X. and J.P.; resources, J.X., S.Z. and G.L.; data curation, J.X. and S.Z.; writing—original draft preparation, J.X.; writing—review and editing, J.X., A.L. and S.Z.; visualization, J.X., J.D., C.W. and Y.Z. (Yaxin Zhang); supervision, G.L.; project administration, J.X. and G.L.; funding acquisition, J.X., S.Z. and G.L. All authors have read and agreed to the published version of the manuscript.
Funding
This experimental research was funded by the National Natural Science Foundation of China, grant number 41976198; the National Key Research and Development Program of China, grant number 2017YFE0133500; The Natural Science Foundation of Shandong Province, grant number ZR2019BD009; and the Taishan Scholar grant to Guangxue Li.
Institutional Review Board Statement
Not applicable.
Informed Consent Statement
Not applicable.
Conflicts of Interest
The authors declare no conflict of interest. The sponsors had no role in the design of the study; in the collection, analyses, or interpretation of data; in the writing of the manuscript; or in the decision to publish the results.
References
- Feng, Y.; Yang, F.; Zhang, L.; Zheng, W.; Liu, H. A novel ACFM probe for oil and gas pipe in-line inspection. Energy Rep. 2021, 7, 1594–1600. [Google Scholar] [CrossRef]
- Blevins, R.D.; Scanlan, R.H. Flow-induced vibration. J. Appl. Mech.-Trans. ASME 1977, 44, 802. [Google Scholar] [CrossRef]
- Manan, A.; Kamal, K.; Ratlamwala, T.A.H.; Sheikh, M.F.; Abro, A.G.; Zafar, T. Failure classification in natural gas pipe-lines using artificial intelligence: A case study. Energy Rep. 2021, 7, 7640–7647. [Google Scholar] [CrossRef]
- Sumer, B.M.; Fredsøe, J.M. A review on vibrations of marine pipelines. Int. J. Offshore Polar Eng. 1995, 5, 81–90. [Google Scholar]
- Williamson, C.H.K.; Govardhan, R. A brief review of recent results in vortex-induced vibrations. Int. J. Offshore Polar Eng. 2008, 96, 713–735. [Google Scholar] [CrossRef]
- Zhu, H.; Zhao, H.; Srinil, N. Experimental investigation on vortex-induced vibration and solid-structure impact of a near-bottom horizontal flexible pipeline in oblique shear flow. J. Fluids Struct. 2021, 96, 713–735. [Google Scholar] [CrossRef]
- Xu, W.; Jia, K.; Ma, Y.; Wang, Y.; Song, Z. Multispan classification methods and interaction mechanism of submarine pipelines undergoing vortex-induced vibration. Appl. Ocean Res. 2022, 120, 103027. [Google Scholar] [CrossRef]
- Yang, B.; Gao, F.P.; Jeng, D.S.; Wu, Y.X. Experimental study of vortex-induced vibrations of a pipeline near an erodible sandy seabed. Ocean Eng. 2008, 35, 301–309. [Google Scholar] [CrossRef]
- Gao, F.P.; Yang, B.; Wu, Y.X.; Yan, S.M. Steady current induced seabed scour around a vibrating pipeline. Appl. Ocean Res. 2006, 28, 291–298. [Google Scholar] [CrossRef] [Green Version]
- Foray, P.; Bonjean, D.; Michallet, H.; Mory, M. Fluid-soil-structure interaction in liquefaction around a cyclieally moving cylinder. J. Waterw. Port Coast. Ocean Eng. 2006, 132, 289–299. [Google Scholar] [CrossRef] [Green Version]
- Zang, Z.; Chen, Y.; Zhang, J.; Tian, Y.; Esteban, M.D. Experimental study on local scour and onset of VIV of a pipeline on a silty seabed under steady currents. Appl. Ocean Res. 2021, 109, 102560. [Google Scholar] [CrossRef]
- Liu, M.M.; Wang, H.C.; Shao, F.F.; Jin, X.; Tang, G.Q.; Yang, F. Numerical investigation of local scour around a vibration pipeline under free surface wave condition. Ocean Eng. 2022, 245, 110556. [Google Scholar] [CrossRef]
- Sumer, B.M.; Mao, Y.; Fredsøe, J. Interaction between vibrating pipe and erodible bed. J. Water Port Coast. Ocean Eng. 1988, 114, 81–92. [Google Scholar] [CrossRef]
- Luan, Y.; Liang, D.; Rana, R. Scour depth beneath a pipeline undergoing forced vibration. Theor. Appl. Mech. Lett. 2015, 5, 97–100. [Google Scholar] [CrossRef] [Green Version]
- The American Society of Civil Engineers (ASCE). ASCE preliminary research on pipeline flotation: Report of the pipeline flotation research council. J. Pipeline Div. 1966, 92, 27–74. [Google Scholar] [CrossRef]
- Christian, J.T.; Taylor, P.K.; Yen, J.K.C.; Erali, D.R. Large diameter underwater pipeline for nuclear plant designed against soil liquefaction. In Proceedings of the Offshore Technology Conference, Houston, TX, USA, 5 May 1974; pp. 597–606. [Google Scholar] [CrossRef]
- Sumer, B.M.; Hatipoglu, F.; Fredsøe, J.; Sumer, S.K. The sequence of sediment behaviour during wave-induced liquefaction. Sedimentology 2006, 53, 611–629. [Google Scholar] [CrossRef]
- Sumer, B.M.; Truelsen, C.; Fredsøe, J. Liquefaction around Pipelines under Waves. J. Water Port Coast. Ocean. Eng. 2006, 132, 266–275. [Google Scholar] [CrossRef]
- Dunn, S.L.; Vun, P.L.; Chan, A.H.C.; Damgaard, J.S. Numerical modelling of wave-induced liquefaction around pipelines. J. Water Port Coast. Ocean. Eng. 2006, 132, 276–288. [Google Scholar] [CrossRef]
- Zhou, X.L.; Zhang, J.; Guo, J.J.; Wang, J.H.; Jeng, D.S. Cnoidal wave induced seabed response around a buried pipeline. Ocean Eng. 2015, 101, 118–130. [Google Scholar] [CrossRef]
- Zhao, H.Y.; Jeng, D.S.; Liang, C.C. Parametric study of the wave-induced residual liquefaction around an embedded pipeline. Appl. Ocean Res. 2016, 55, 163–180. [Google Scholar] [CrossRef]
- Liang, Z.; Jeng, D.S.; Liu, J. Combined wave–current induced seabed liquefaction around buried pipelines: Design of a trench layer. Ocean Eng. 2020, 212, 107764. [Google Scholar] [CrossRef]
- Zhao, H.Y.; Liu, X.L.; Jeng, D.S.; Zheng, J.H.; Zhang, J.S.; Liang, Z.D. Numerical investigation into the vulnerability to liquefaction of an embedded pipeline exposed to ocean storms. Coast. Eng. 2022, 172, 104056. [Google Scholar] [CrossRef]
- Reimnitz, E.; Marshall, N.F. The effects of the Alaskan earthquake and tsunami on recent deltaic sediments. J. Geophys. Res. 1965, 70, 2363–2376. [Google Scholar] [CrossRef]
- Luan, M.T.; Zhang, X.L.; Yang, Q.; Guo, Y. Numerical analysis of liquefaction of porous seabed around pipeline fixed in space under seismic loading. Soil Dyn. Earthq. Eng. 2009, 29, 855–864. [Google Scholar] [CrossRef]
- Saeedzadeh, R.; Hataf, N. Uplift response of buried pipelines in saturated sand deposit under earthquake loading. Soil Dyn. Earthq. Eng. 2011, 31, 1378–1384. [Google Scholar] [CrossRef]
- Damgaard, J.S.; Palmer, A.C. Pipeline stability on a mobile and liquefied seabed: A discussion of magnitudes and engineering implications. In Proceedings of the 20th International Conference on Offshore Mechanics and Arctic Engineering, ASME, Rio de Janeiro, Brazil, 28 October 2001; pp. 1–9. [Google Scholar]
- Damgaard, J.S.; Sumer, B.M.; Teh, T.C.; Palmer, A.C.; Foray, P.; Osorio, D. Guidelines for pipeline on-bottom stability on liquefied noncohesive seabeds. J. Waterw. Port Coast. Ocean Eng. 2006, 132, 300–309. [Google Scholar] [CrossRef]
- Teh, T.C.; Palmer, A.C.; Damgaard, J.S. Experimental study of marine pipelines on unstable and liquefied seabed. Coast. Eng. 2003, 50, 1–17. [Google Scholar] [CrossRef]
- Teh, T.C.; Palmer, A.C.; Bolton, M.D.; Damgaard, J.S. Stability of submarine pipelines on liquefied seabeds. J. Waterw. Port Coast. Ocean Eng. 2006, 132, 244–251. [Google Scholar] [CrossRef] [Green Version]
- Sumer, B.M.; Fredsøe, J.; Christensen, S.; Lind, M.T. Sinking/floatation of pipelines and other objects in liquefied soil under waves. Coast. Eng. 1999, 38, 53–90. [Google Scholar] [CrossRef]
- Sumer, B.M.; Hatipoglu, F.; Fredsøe, J.; Hansen, N.E.O. Critical flotation density of pipelines in soils liquefied by waves and density of liquefied soils. J. Water Port Coast. Ocean Eng. 2006, 132, 252–265. [Google Scholar] [CrossRef]
- Tian, Y.H.; Youssef, B.; Cassidy, M.J. Assessment of pipeline stability in the Gulf of Mexico during hurricanes using dynamic analysis. Theor. Appl. Mech. Lett. 2015, 50, 47–57. [Google Scholar] [CrossRef] [Green Version]
- Zhao, K.; Wang, Q.; Chen, S.; Zhuang, H.; Chen, G. Dynamic response of pipelines in liquefiable seabed under nature loadings: Waves and currents. Ocean Eng. 2021, 230, 74–79. [Google Scholar] [CrossRef]
- Clukey, E.C.; Kulhawy, F.H.; Liu, P.L.F.; Tate, G.B. The impact of wave loads and pore-water pressure generation on initiation of sediment transport. Geo-Mar. Lett. 1985, 5, 177–183. [Google Scholar] [CrossRef]
- Zhang, S.; Jia, Y.; Wang, Z.; Wen, M.; Lu, F.; Zhang, Y.; Liu, X.; Shan, H. Wave flume experiments on the contribution of seabed fluidization to sediment resuspension. Acta Oceanol. Sin. 2018, 37, 80–87. [Google Scholar] [CrossRef]
- Zhang, S.; Jia, Y.; Zhang, Y.; Shan, H. Influence of seepage flows on the erodibility of fluidized silty sediments: Parameterization and mechanisms. J. Geophys. Res.-Oceans 2018, 123, 3307–3321. [Google Scholar] [CrossRef]
- Zhou, C.; Li, G.; Dong, P.; Shi, J.; Xu, J. An experimental study of seabed responses around a marine pipeline under wave and current conditions. Ocean Eng. 2010, 38, 226–234. [Google Scholar] [CrossRef]
- Sassa, S.; Takayama, T.; Mizutani, M.; Tsujio, D. Field observations of the build-up and dissipation of residual pore water pressures in seabed sands under the passage of storm waves. J. Coast. Res. 2006, 39, 410–414. [Google Scholar]
- Lei, C.; Cheng, L.; Kavanagh, K. Re-examination of the effect of a plane boundary on force and vortex shedding of a circular cylinder. J. Wind Eng. Ind. Aerodyn. 1999, 80, 263–286. [Google Scholar] [CrossRef]
- Kim, W.J.; Perkins, N.C. Two-dimensional vortex-induced vibration of cable suspensions. J. Fluids Struct. 2002, 16, 229–245. [Google Scholar] [CrossRef]
- Pan, Z.Y.; Gui, W.C.; Zhang, X.C. An overview on VIV of slender marine structures. J. Ship Mech. 2005, 9, 135–154. [Google Scholar]
- Andrews, D.C.A.; Martin, G.R. Criteria for liquefaction of silty soils. In Proceedings of the 12th World Conference on Earthquake Engineering, Auckland, New Zealand, 30 January–4 February 2000; pp. 1–8. [Google Scholar]
- Prior, D.B.; Suhayda, J.N.; Lu, N.Z.; Bornhold, B.D.; Keller, G.H.; Wiseman, W.J.; Wright, L.D.; Yang, Z.S. Storm wave reactivation of a submarine landslide. Nature 1989, 341, 47–50. [Google Scholar] [CrossRef]
- Li, G.X.; Zhuang, K.L.; Wei, H.L. Sedimentation in the Yellow River delta. Part III. Seabed erosion and diapirism in the abandoned subaqueous delta lobe. Mar. Geol. 2000, 168, 129–144. [Google Scholar] [CrossRef]
- DNV-RP-D101; Structural Analysis of Piping Systems. Recommended practice DNV-RP-D101. Det Norske Veritas, DNV: Høvik, Norway, 2008.
- DNV-RP-F204; Riser Fagitue. Recommended practice DNV-RP-F204. Det Norske Veritas, DNV: Høvik, Norway, 2010.
- Dong, J.; Xu, J.; Li, G.; Li, A.; Zhang, S.; Niu, J.; Xu, X.; Wu, L. Experimental study on silty seabed liquefaction and its impact on sediment resuspension by random waves. J. Mar. Sci. Eng. 2022, 10, 437. [Google Scholar] [CrossRef]
- Jia, Y.; Zhang, L.; Zheng, J.; Liu, X.; Jeng, D.S.; Shan, H. Effects of wave-induced seabed liquefaction on sediment re-suspension in the Yellow River Delta. Ocean Eng. 2014, 89, 146–156. [Google Scholar] [CrossRef]
- Kirca, V.S.O.; Sumer, B.M.; Fredsøe, J. Influence of clay content on wave-induced liquefaction. J. Waterw. Port Coast. Ocean Eng. 2013, 140, 04014024-1–04014024-11. [Google Scholar] [CrossRef]
- Miyamoto, J.; Sassa, S.; Sekiguchi, H. Progressive solidification of a liquefied sand layer during continued wave loading. Geotechnique 2004, 54, 617–629. [Google Scholar] [CrossRef]
- McDougal, W.G.; Tsai, Y.T.; Liu, P.L.F.; Clukey, E.C. Wave-induced pore-water pressure accumulation in marine soils. J. Offshore Mech. Arct. Eng. Trans. ASME 1989, 111, 1–11. [Google Scholar] [CrossRef]
- Kirca, V.S.O. Sinking of irregular shape blocks into marine seabed under wave-induced liquefaction. Coast. Eng. 2013, 75, 40–51. [Google Scholar] [CrossRef]
- De Groot, M.B.; Bolton, M.D.; Foray, P.; Meijers, P.; Palmer, A.C.; Sandven, R.; Sawicki, A.; Teh, T.C. Physics of liquefaction phenomena around marine structures. J. Waterw. Port Coast. Ocean Eng. 2006, 132, 227–243. [Google Scholar] [CrossRef]
- DNV-RP-F105; Free Spanning Pipelines. Recommended practice DNV-RP-F105. Det Norske Veritas, DNV: Høvik, Norway, 2006.
- Pu, J.; Xu, J.; Li, G. Experimental study on damping characteristics of pipe vibration in liquefied silt. In Proceedings of the 23rd International Offshore and Polar Engineering, Anchorage, AK, USA, 30 June–4 July 2013; pp. 266–271. [Google Scholar]
- Mehdi, Y.; Said, M.; Ebrahim, J. Determining natural frequency of free spanning offshore pipelines by considering the seabed soil characteristics. J. Persian Gulf 2012, 3, 25–34. [Google Scholar]
- Xu, J.; Li, G.; Dong, P.; Shi, J. Bedform evolution around a submarine pipeline and its effects on wave-induced forces under regular waves. Ocean Eng. 2010, 37, 304–313. [Google Scholar] [CrossRef]
- Sun, K.; Zhang, J.S.; Gao, Y.; Jeng, D.S.; Guo, Y.K.; Liang, Z.D. Laboratory experimental study of ocean waves propagating over a partially buried pipeline in a trench layer. Ocean Eng. 2019, 173, 617–627. [Google Scholar] [CrossRef] [Green Version]
- Zhang, Q.B.; Zhai, H.L.; Wang, P.D.; Wang, S.H.; Duan, L.L.; Chen, L.Y.; Liu, Y.F.; Jeng, D.S. Experimental study on irregular wave-induced pore-water pressures in a porous seabed around a mono-pile. Appl. Ocean Res. 2020, 95, 102041. [Google Scholar] [CrossRef]
Figure 1.
(a) Schematic diagram showing the touchdown section of a pipeline. (b) Simulation range of each experiment.
Figure 1.
(a) Schematic diagram showing the touchdown section of a pipeline. (b) Simulation range of each experiment.

Figure 2.
(a) Experimental set up. (b) Location of pore-water pressure sensors, designed to have varying distances from the pipeline center. The coordinates of each sensor are p1 (0, 0, −6); p2 (0, 0, −18); p3 (−5, 0, −5); p4 (5, 0, −14); p5 (−5, 0, −11); p6 (10, 0, −4); p7 (0, −20, −5); p8 (15, 0, −21); p9 (−10, 0, −2); p10 (15, 0, −7); and p11 (0, 20, −7).

Figure 3.
Particle-size distribution curve of the test soil.

Figure 4.
Time series of vibration acceleration (a) and excess pore pressure (b) in Test 13, where a is the measured vibration acceleration, p is the excess pore pressure, and γ is the specific weight of water.
Figure 4.
Time series of vibration acceleration (a) and excess pore pressure (b) in Test 13, where a is the measured vibration acceleration, p is the excess pore pressure, and γ is the specific weight of water.

Figure 5.
Measured maximum excess pore pressure, Pmax, plotted against the calculated initial mean normal effective stress using Equation (2) in each test.
Figure 5.
Measured maximum excess pore pressure, Pmax, plotted against the calculated initial mean normal effective stress using Equation (2) in each test.

Figure 6.
Time series of vibration acceleration (a) and excess pore pressure (b) in Test 8.

Figure 7.
Measured accumulative pore pressure, Pmax, under different magnitudes of cyclic loading of the vibrating pipeline in Tests 7 and 8 at the same burial depth.
Figure 7.
Measured accumulative pore pressure, Pmax, under different magnitudes of cyclic loading of the vibrating pipeline in Tests 7 and 8 at the same burial depth.

Figure 8.
Contour of liquefaction degree around the model pipeline when the pipeline was loaded with the magnitude of periodic force F = 88.8 N in Test 8.
Figure 8.
Contour of liquefaction degree around the model pipeline when the pipeline was loaded with the magnitude of periodic force F = 88.8 N in Test 8.

Figure 9.
Variation in degree of soil liquefaction over soil depth and the burial depth of the pipeline in all the experimental tests. The pipeline was loaded with equivalent periodic loading (F = 55.3 N) in Tests 3 and 9–14 in this figure.
Figure 9.
Variation in degree of soil liquefaction over soil depth and the burial depth of the pipeline in all the experimental tests. The pipeline was loaded with equivalent periodic loading (F = 55.3 N) in Tests 3 and 9–14 in this figure.

Figure 10.
Time series of vibration acceleration (a) and excess pore pressure (b) in Test 14.

Figure 11.
Soil deformation and mudline subsidence after dissipation of excess pore pressure in Test 5. The arrows show the soil was compressed after soil liquefaction and pore water dissipation.
Figure 11.
Soil deformation and mudline subsidence after dissipation of excess pore pressure in Test 5. The arrows show the soil was compressed after soil liquefaction and pore water dissipation.

Figure 12.
Schematic map showing the touchdown points of a spanning pipeline (a) before and (b) after soil liquefaction, indicating the touchdown point of the span move backward after soil liquefaction. The extended span possibly floats or sinks, depending on the specific gravity of the pipe.
Figure 12.
Schematic map showing the touchdown points of a spanning pipeline (a) before and (b) after soil liquefaction, indicating the touchdown point of the span move backward after soil liquefaction. The extended span possibly floats or sinks, depending on the specific gravity of the pipe.

Figure 13.
Seabed topography around a submarine pipeline in the subaqueous Yellow River Delta, as detected by a multi-beam sounding system.
Figure 13.
Seabed topography around a submarine pipeline in the subaqueous Yellow River Delta, as detected by a multi-beam sounding system.


Table 1.
Test conditions.
| Test | Burial Depth (b) (cm) | Rotator Radius (r) (cm) | Vibration Frequency of Pipeline (f) (Hz) | Magnitude of Centrifugal Force (F) (N) | Specific Weight of Sediment (γt) (kN/m3) |
|---|---|---|---|---|---|
| 1 | 0 | 25 | 1 | 9.9 | 23.3 |
| 2 | 5 | 25 | 1 | 9.9 | 23.3 |
| 3 | 15 | 35 | 1.5 | 31.1 | 19.8 |
| 35 | 2 | 55.3 | |||
| 4 | 15 | 25 | 2 | 39.5 | 19.8 |
| 5 | 14 | 25 | 2 | 39.5 | 19.8 |
| 6 | 12 | 25 | 1 | 9.9 | 19.8 |
| 25 | 2 | 39.5 | |||
| 7 | 10 | 30 | 1 | 11.8 | 20.1 |
| 30 | 2 | 47.4 | |||
| 8 | 10 | 25 | 1 | 9.9 | 20.1 |
| 25 | 2 | 39.5 | |||
| 25 | 3 | 88.8 | |||
| 25 | 2 | 39.5 | |||
| 25 | 1 | 9.9 | |||
| 30 | 2 | 47.4 | |||
| 9 | 10 | 35 | 1 | 13.8 | 20.1 |
| 35 | 2 | 55.3 | |||
| 10 | 20 | 35 | 1 | 13.8 | 17.3 |
| 35 | 2 | 55.3 | |||
| 35 | 3 | 124.4 | |||
| 11 | 24 | 35 | 2 | 55.3 | 17.3 |
| 12 | 15 | 35 | 2 | 55.3 | 17.3 |
| 13 | 10 | 35 | 2 | 55.3 | 17.3 |
| 35 | 1 | 13.8 | |||
| 14 | 5 | 35 | 2 | 55.3 | 17.3 |
| 35 | 1 | 13.8 |
Publisher’s Note: MDPI stays neutral with regard to jurisdictional claims in published maps and institutional affiliations. |
© 2022 by the authors. Licensee MDPI, Basel, Switzerland. This article is an open access article distributed under the terms and conditions of the Creative Commons Attribution (CC BY) license (https://creativecommons.org/licenses/by/4.0/).
Share and Cite
MDPI and ACS Style
Xu, J.; Xu, X.; Zhang, Y.; Pu, J.; Dong, J.; Wang, C.; Li, G.; Li, A.; Zhang, S.; Zhang, Y. Experimental Study on the Influence of Pipeline Vibration on Silty Seabed Liquefaction. Water 2022, 14, 1782. https://doi.org/10.3390/w14111782
AMA Style
Xu J, Xu X, Zhang Y, Pu J, Dong J, Wang C, Li G, Li A, Zhang S, Zhang Y. Experimental Study on the Influence of Pipeline Vibration on Silty Seabed Liquefaction. Water. 2022; 14(11):1782. https://doi.org/10.3390/w14111782
Chicago/Turabian StyleXu, Jishang, Xingyu Xu, Yaqi Zhang, Jinjing Pu, Jiangfeng Dong, Chunlai Wang, Guangxue Li, Anlong Li, Shaotong Zhang, and Yaxin Zhang. 2022. "Experimental Study on the Influence of Pipeline Vibration on Silty Seabed Liquefaction" Water 14, no. 11: 1782. https://doi.org/10.3390/w14111782
Note that from the first issue of 2016, this journal uses article numbers instead of page numbers. See further details here.