
Evaluation of Pandanus Trees as a Means of Eco-DRR against Storm Surge Wave on Saint Martin’s Island, Bangladesh

1
Graduate School of Science and Technology, Department of Civil and Environmental Engineering, Kumamoto University, Kumamoto 860-0862, Japan
2
Faculty of Environmental and Symbiotic Sciences, Kumamoto Prefectural University, Kuamoto 862-8570, Japan
3
Faculty of Advanced Science and Technology, Department of Civil and Environmental Engineering, Kumamoto University, 2-39-1 Kurokami, Chuo-ku, Kumamoto 860-8555, Japan
*
Author to whom correspondence should be addressed.
Water 2022, 14(11), 1781; https://doi.org/10.3390/w14111781
Submission received: 11 April 2022
/
Revised: 23 May 2022
/
Accepted: 25 May 2022
/
Published: 1 June 2022
(This article belongs to the Special Issue Water Resources Management and Extreme Events)
Abstract
:Saint Martin’s Island is a tiny island located in Bangladesh that is rich in biodiversity but threatened by many natural disasters, and it is often neglected due to being far from the mainland. Ecosystem-based disaster risk reduction (Eco-DRR) is the most urgently required provision for Bangladesh as it is a very easy and inexpensive way to survive natural adversities. In this study, attempts were made to quantify the capacity of an existing Pandanus forest on Saint Martin’s Island to reduce the storm surge disaster risk. For this, satellite images were processed with ErdasImagine and ArcGIS software, and land use and land cover changes were analyzed to determine the changes related to Pandanus trees over time. Storm surge wave height reduction was analyzed using the Bao regression model equation. The results show that the Pandanus tree population increased almost 3-fold from 2010 to 2021, and that the Pandanus trees can reduce the surge height, which will ultimately preserve 75% of the area of the island (2021). The minimum required patch width for the Pandanus tree belt was identified as 4.53 m. The areas highly vulnerable to flooding were also identified in this study.
1. Introduction
Bangladesh is a small South Asian country with a large population and is very vulnerable to various types of natural disasters. The topography of the country, its geographical position, and climate change all mean that natural disasters are regular phenomena in Bangladesh [1]. Environmental disasters such as floods, cyclones, nor’westers, tornadoes, and droughts ravage the country almost every year [2], and they cause colossal loss of life and property [3]. According to scholars, climate change intensifies these hazardous events. These events have unfavorable effects on socioeconomic growth and existing communities [4,5,6]. There is a high probability that these extreme weather events, such as cyclones and floods, will increase in magnitude and frequency, and that this may further exaggerate the effects of climate change [7], accompanied by strong onshore winds and storm surge conditions [8]. This country is one of the most severely affected by climate-change-induced extreme events. The coastal districts of Bangladesh are situated near the Bay of Bengal, and they are low in elevation and extremely susceptible to extreme climate conditions, such as coastal floods, high tides, storm surges caused by tropical cyclones, riverbank erosion, salinity intrusion, and sea level rise [9].
Saint Martin’s Island is situated in the southernmost corner of Bangladesh; it is the only coral reef island in the area, and it is threatened by several types of natural disasters. The island is very small, and it is enriched with biodiversity and scenic beauty, but it is often ignored in governmental policies as it is far from the mainland. There is a natural Pandanus forest, which is also at risk due to the increasing population size and uncontrolled tourism. The existing forest is very important as it acts as a barrier to cyclonic storm surges, winds, etc. The local people plant trees as a means to break the wind, and these trees have been planted extensively near homesteads and coastlines as fences and windbreaks.
The Pandanus tree is very beneficial, and on Saint Martin’s Island, it is perhaps the second most valuable tree after the coconut tree. The Pandanus is a shrub with support roots, beautiful flowers, and edible fruits. It is also native to coastal areas around the Pacific Ocean. It has the capacity to spread and colonize coastal vegetation communities. These trees have a dense, bushy appearance and are highly esteemed for the various products and services they provide [10].
The trees are disappearing from the island due to over-exploitation related to cutting for fuel and furniture, and the selling and consumption of the fruits. According to Molony (2006) [11], the elimination of the plant entirely would be a serious problem, as its root system stabilizes beaches and dune sediments. The plants can propagate both vegetatively and via seeds, and the collection of their fruits should not seriously affect their natural regeneration.
The study area is very small and is exposed to a high risk of natural disasters as it is an open sea island. There seems to be no other barrier against the strong winds and surges induced by cyclones and the high tides besides the Pandanus forest. The Bangladesh government declared the island an Ecologically Critical Area (ECA) in 1999 (DoE 2015) [12]. As it is considered an ecologically sensitive area, one non-government organization (NGO) called “Poush” has facilitated the conservation and plantation of Pandanus. Mangroves have also been proven effective in attenuating storm surges, but on this island, mangrove trees are cleared by the over-exploitation of the local people. According to Tomascik (1997) [13], the island may have once had a substantial area of mangrove vegetation that has been destroyed and degraded over time. In 1996, mangrove forests covered only 2.4 ha of the island (MoEF, 2001) [14]. Only a few scattered mangroves can be found on the island. There is also a natural Pandanus forest, which is effective for surge height reduction as well, but this too faces the threat of extinction. Pandanus is unique natural vegetation, called the “Keya tree” by the native people. There are two species of Pandanus and one species of Streblus that grow naturally on this island, and they are the most dominant [12]. Pandanus is highly beneficial to the environment and plays an essential role in conserving the biodiversity of the area. Considering its environmental role, easy propagation, low maintenance requirements, and important capacity to act as a barrier against cyclonic storm surges and wind, the NGO Poush facilitates the conservation and plantation of Pandanus trees.
Saint Martin’s Island contributes USD 33.6 million annually to the economy of Bangladesh [15]. The sources of income on the island include the coral reef and its associated habitats, which also offer tourism, seaweed, shoreline protection, and opportunities to gather intertidal crustaceans [15]. The major sectors of income generation on the island are tourism and fisheries, which contribute USD 19.4 million and USD 13 million per year, respectively. There are also some other miscellaneous sources of income, such as entrance fees paid by visitors (USD 1 million annually) and shoreline protection (USD 0.2 million annually) [15]. The island has collected about USD 545 million over a 25-year period (with a 6.5% concession rate) from all these resources [15].
The South Asian seas and associated regions face risks related to sea level rise, which is induced by climate change. The IPCC has also estimated that the sea level will rise, on average, by 0.52 to 0.98 m by 2100, and this rate in 2081–2100 is expected to be 8 to 16 mm/year (IPCC 2013) [16]. Extreme events, such as high-temperature stress, could lead to coral “bleaching”—the departure of the colorful, interdependent algae that corals depend on for endurance, growth, and reproduction [17].
Saint Martin’s Island has many resources and broad biological diversity [18] but is vulnerable to different types of natural hazards. The coral reef is also threatened and at risk of extinction [19]. Saint Martin’s Island supports a unique assemblage of fauna and flora species, some of which are globally significant. Although it is a continental island, it also supports a wide variety (66 species) of corals and associated fauna and flora (Tomascik, 1997) [13], and it is a vital stepping stone along the migratory route of many globally significant migratory birds (BOBLME 2015) [18]. It is the most attractive tourist spot in Bangladesh. Unplanned tourism causes significant environmental degradation and contributes to making this island fragile. Approximately 3000 people visit the island every day during the peak tourism season (November–March) [20].
Studies have proven that mangrove forests and coastal vegetation can reduce the surge height via the energy dissipation process related to their branches and roots [10]. This process is also low-cost and friendly to the environment.
At present, the frequency of extreme events is increasing. According to Doswald, N. et al. (2014), the “Ecosystem-based approach to disaster risk reduction”, or “Eco-DRR”, is the method most commonly used to reduce disaster risk, with the foundational concept of preserving human lives and property from exposure to natural hazards by keeping the ecosystem conserved, restored, or maintained [21], and to respond to natural disasters by utilizing the ecosystem as a buffer zone with various functions, such as food and water supply. As a developing country, Bangladesh cannot undertake the necessary measures to prevent the negative consequences of natural disasters. Nature-based solutions are gradually being implemented as suitable approaches to reducing the risk and vulnerability of social and ecological systems to hydro-meteorological hazards.
It has been revealed in past studies that seaside vegetation can act to significantly reduce tsunamis’ energy and the damage they do to people and property; for example, Shuto (1987) [22], Tsuji et al. (2003) [23], Synolakis et al. (2002) [24], Lynett et al. (2003) [25], Danielsen et al. (2005) [26], Kathiresan and Rajendran (2005) [27], Tanaka et al. (2007) [28], Mascarenhas and Jayakumar (2008) [29], Menendez, P. et al. (2018) [30], and Tanaka, N. et al. (2018) [31] reported that mangroves act as bioshields, with villages located behind them suffering less damage than ones directly exposed to the coast. Blankespoor, B. et al. (2017) [32] found that the degree of storm surge attenuation by mangroves differs from country to country due to storm surge height variations, the extent of the mangroves, and the elevation of the susceptible regions between countries. Thus, the areas deriving advantages from mangrove or coastal vegetation protection during storm surges also vary between countries.
According to Tanaka, N. (2011) [33], Pandanus odoratissimus can reduce tsunami energy more effectively than Casurina equisetifolia due to its complex aerial root structures. The combination of P. odoratissimus and C. equisetifolia can constitute a better green belt that will protect against cyclone and tsunami hazards, as a result of the tree breakage phenomenon. Narayan, S. et al. (2016) [34]—following the findings of Ferrario, F. et al. (2014) [35] and Pinsky, M.L. et al. (2013) [36]—found that, on average, coastal habitats reduce wave heights by between 35% and 71%. Mangroves reduce wave heights by 31% (95% confidence interval (CI): 25–37%), seagrass/kelp beds by 36% (95% CI: 25–45%), coral reefs by 70% (95% CI: 54–81%), and salt marshes by 72% (95% CI: 62–79%). However, it is not clear how much the disaster mitigation capacity has changed due to plantation activity on Saint Martin’s Island.
Eco-DRR is the most commonly used approach in developed countries, but it is a brand-new concept in Bangladesh. Ecosystem-based solutions are very economical and offer many benefits, including upgrading the natural environment and providing safety during and after disasters [21]. Nature-based or eco-friendly solutions to some hydro-meteorological hazards in coastal areas must be implemented in order to reduce disaster risks and save resources. Some research has been conducted on the topic in Bangladesh. However, these studies do not quantify the effects of each element of Eco-DRR during disasters. It is essential to determine the most vulnerable areas of the island so as to take the necessary precautions and suggest suitable land uses.
In this study, attempts were made to determine the potential extent of disaster reduction due to the plantation of Pandanus trees and to identify the flood-affected areas. We set the following goals:
- Define land use and tree cover changes over time in order to evaluate the Pandanus trees’ effect;
- Investigate the degree to which surge is reduced by Pandanus trees, and calculate the patch width of the Pandanus forest that is required to protect the island.
2. Methods
2.1. Study Area Profile
Saint Martin’s Island is tiny, with an area of 3.4 km2, and it is situated within the southernmost region of Bangladesh (Figure 1a). It is the only coral reef island in Bangladesh. The length and width are, respectively, 1524 m and 518 m. It is called Narikel Jinjira (Coconut Island) by the native people. The island is situated in the Bay of Bengal, about 9 km south of Cox’s Bazar–Teknaf Peninsula and northwest of the Myanmar coast, and at the mouth of the Naf River. The longitudes of the island are 92°18′ E and 92°21′ E, and the latitudes are 20°34′ and 20°39′ N. There are two high tides and two low tides that occur in every tidal period of 24 h and 52 min (Banglapedia 2008) [37]. There are two islands. The biggest one is shaped like a dumbbell and is divided into four parts: Uttarpara, Galachipa, Dakshinpara, and Chera Dweep. It is approximately 8 km long in the northern part and has a minimum length of 100 m in the middle, near Galachipa. The average height of the island is 2.5 m from mean sea level (MSL), with a maximum of 6 m at the cliffs [38]. There is another very small island that is disconnected from the main island during “high tide”. This tiny island is known as “Chera Dweep”, and it is regarded as the southernmost part of Bangladesh.
The population of the island is increasing. There were originally around 3700 people, belonging to 535 families (Paiker, 1996, in MoEF, 2001b) [39]; in 2000, this rose to 4766 (791 households) (Islam, 2001) [40], and in 2005, the population increased to 5726 (818 households) (POUSH, 2006a) [41]. The island now has a total of 7000 inhabitants. The population density was predicted to be 700 people per km2 by the late 2000s (Alam, 2018) [42]. There are several agricultural land areas on this island. Some fallow lands, domestic vegetation patches, wild bushlands, and cultivated trees are also found on this island.
The most dominant plant on the island is the screw pine, also known as the umbrella tree or Pandanus (locally called Keya). The existing Pandanus trees were developed as a defensive shield surrounding the island (Figure 1b,c). The trees are shaggy, prickly, nicely settled, and located on the upper ridges. Pandanus trees are also planted by the residents for use as thatching and shading in the immediate vicinities of their homesteads and walkways [43].
2.2. Methods to Clarify the Changes in Land Use over Time
2.2.1. Data Acquisition and Preparation
Satellite images were acquired to classify changes in land use and trees from 2010 (high-resolution images of the island are only available from 2010) to today (2021). The island is extremely small, and a very high resolution satellite image was required to perform a land use and land cover change (LULC) analysis on it. Two cloud-free Planet Images were acquired (www.planet.com; accessed on 4 April 2021) for the years 2010 (RapidEye-2 ortho tile, accessed on 1 February 2010, 4 bands, pixel resolution 5 m) and 2021 (Planetscope PSScene4Band, accessed on 17 February 2021, 4 bands, pixel resolution 3 m). Other years during the study period were not added due to perceiving the whole changes over an eleven-year period. Since 2006, Pandanus plantation and conservation have been performed by the NGO Poush. Adding other years may not show any significant changes as the Pandanus trees are small and difficult to detect by the satellite images.
The study area is on the border between four Planet Rows, so four scenes were required for each year. All the images were enhanced and merged using the ErdasImagine14 software. Finally, the study area was clipped with the help of an area of interest (AOI) file. The AOI file was obtained from a vector dataset of the study area’s boundary, and a natural color composite was applied (band combination 3, 2, 1).
2.2.2. Satellite Image Analysis
A hybrid or combined classification technique was adopted to categorize each class digitally using ErdasImagine14 software, and this technique was proven to provide better results than the previously used supervised or unsupervised classification approaches alone [44,45,46]. Firstly, each image was classified by the unsupervised classification technique with 300 spectral signatures. The signatures were rearranged, merged, deleted, and renamed. Finally, supervised classification was adopted, and the training sites were selected based on the areas identified from all image sources [47]. In this study, thirty training sites were identified. After this, the next step was to create the signature editor, the aim of which was to create a signature profile for each class. Approximately five training samples were defined for each class. After defining the training classes, supervised classification was adopted. Then, “classify” was selected from the Editor Menu bar, and the non-parametric rule [47] was applied to this classification. Finally, six land cover classes were identified (Table 1).
2.2.3. Accuracy Assessment
Accuracy assessment is the most important step of the classification process, and the goal is to quantitatively assess how effectively the pixels are sampled into the correct land cover classes. For this, pixels were selected from areas that could be identified in both high-resolution images from Google Earth and Google Maps [47]. A total of 100 (50 points from the 2010 image and 50 points from the 2021 image) points (locations) were created in the classified image. In this study, the accuracy assessment involved the producer accuracy, user accuracy, overall accuracy, and kappa value [48]. The overall classification accuracy values were 86% (2021 image) and 74% (2010 image). Table 2 and Table 3 show a theoretical confusion matrix (error matrix) of the LULC classification [47] (details of the calculation: Appendix A). The diagonal shows the pixels that were classified correctly [47]. Pixels that were not assigned to the proper class did not fall into the diagonal region, and these indicate the confusion between the different land cover classes that arose in the class assignment process [47]. The kappa coefficient values were 83% and 67% in 2021 and 2010, respectively (Appendix A).
2.3. Evaluation of Pandanus Trees
2.3.1. Finding the Pandanus Distribution
From the final LULC’s output, the mangrove and coconut distribution could be identified. Mangroves could not be identified separately because this requires very high resolution images, as the island is so tiny. High-resolution images are very expensive and not widely available. The available sources often neglect the island, as it is very small. In order to determine the distribution of Pandanus trees, a GPS survey was performed and plotted on a map. In this way, the tree density and distribution were found for the year 2021. In order to determine the approximate tree distribution in 2010, the LULC map of 2010 and the Pandanus tree distribution map of 2021 were compared and correlated in ArcGIS10.5. Finally, an approximate Pandanus tree distribution map for 2010 was prepared. In order to represent canopy cover changes over time, NDVI index maps were prepared using the ArcGIS10.5 software.
2.3.2. Model Selection
First, the most suitable model was selected, and parameters were input to perform the calculation that determines the reduced surge heights. In order to select a suitable model, various criteria were considered such as the basin characteristics, geographical setup, coastal vegetation properties, and cyclone and low pressure characteristics, as well as the available data of the study area. After assessing different models, the Bao regression model (2011 [49]) was selected.
The parameters required for this regression model were the initial sea level height (Iwh), tree heights (H), the tree density (N), canopy closure % (CC), and the surge height behind the tree patches (Wh). The regression equation is as follows:
Wh = (0.9899 × Iwh + 0.3526) + e(0.048 − 0.0016 × H − 0.00178 × ln(N) − 0.0077ln(CC))
2.3.3. Digital Elevation Model (DEM) Preparation
The digital elevation model (DEM) of the study area was prepared using Google Earth. Some points were taken using the “Add Path” option. The points were then saved as a kml file. The kml file was converted into a gpx file using the GPSVisualizer website. The gpx file was converted into ArcGIS using the option “GPX to feature”. The feature file was then clipped with the boundary, and the IDW interpolation technique was applied. Then, the IDW output was clipped with the boundary. The final DEM was then prepared.
2.3.4. Measuring the Flood
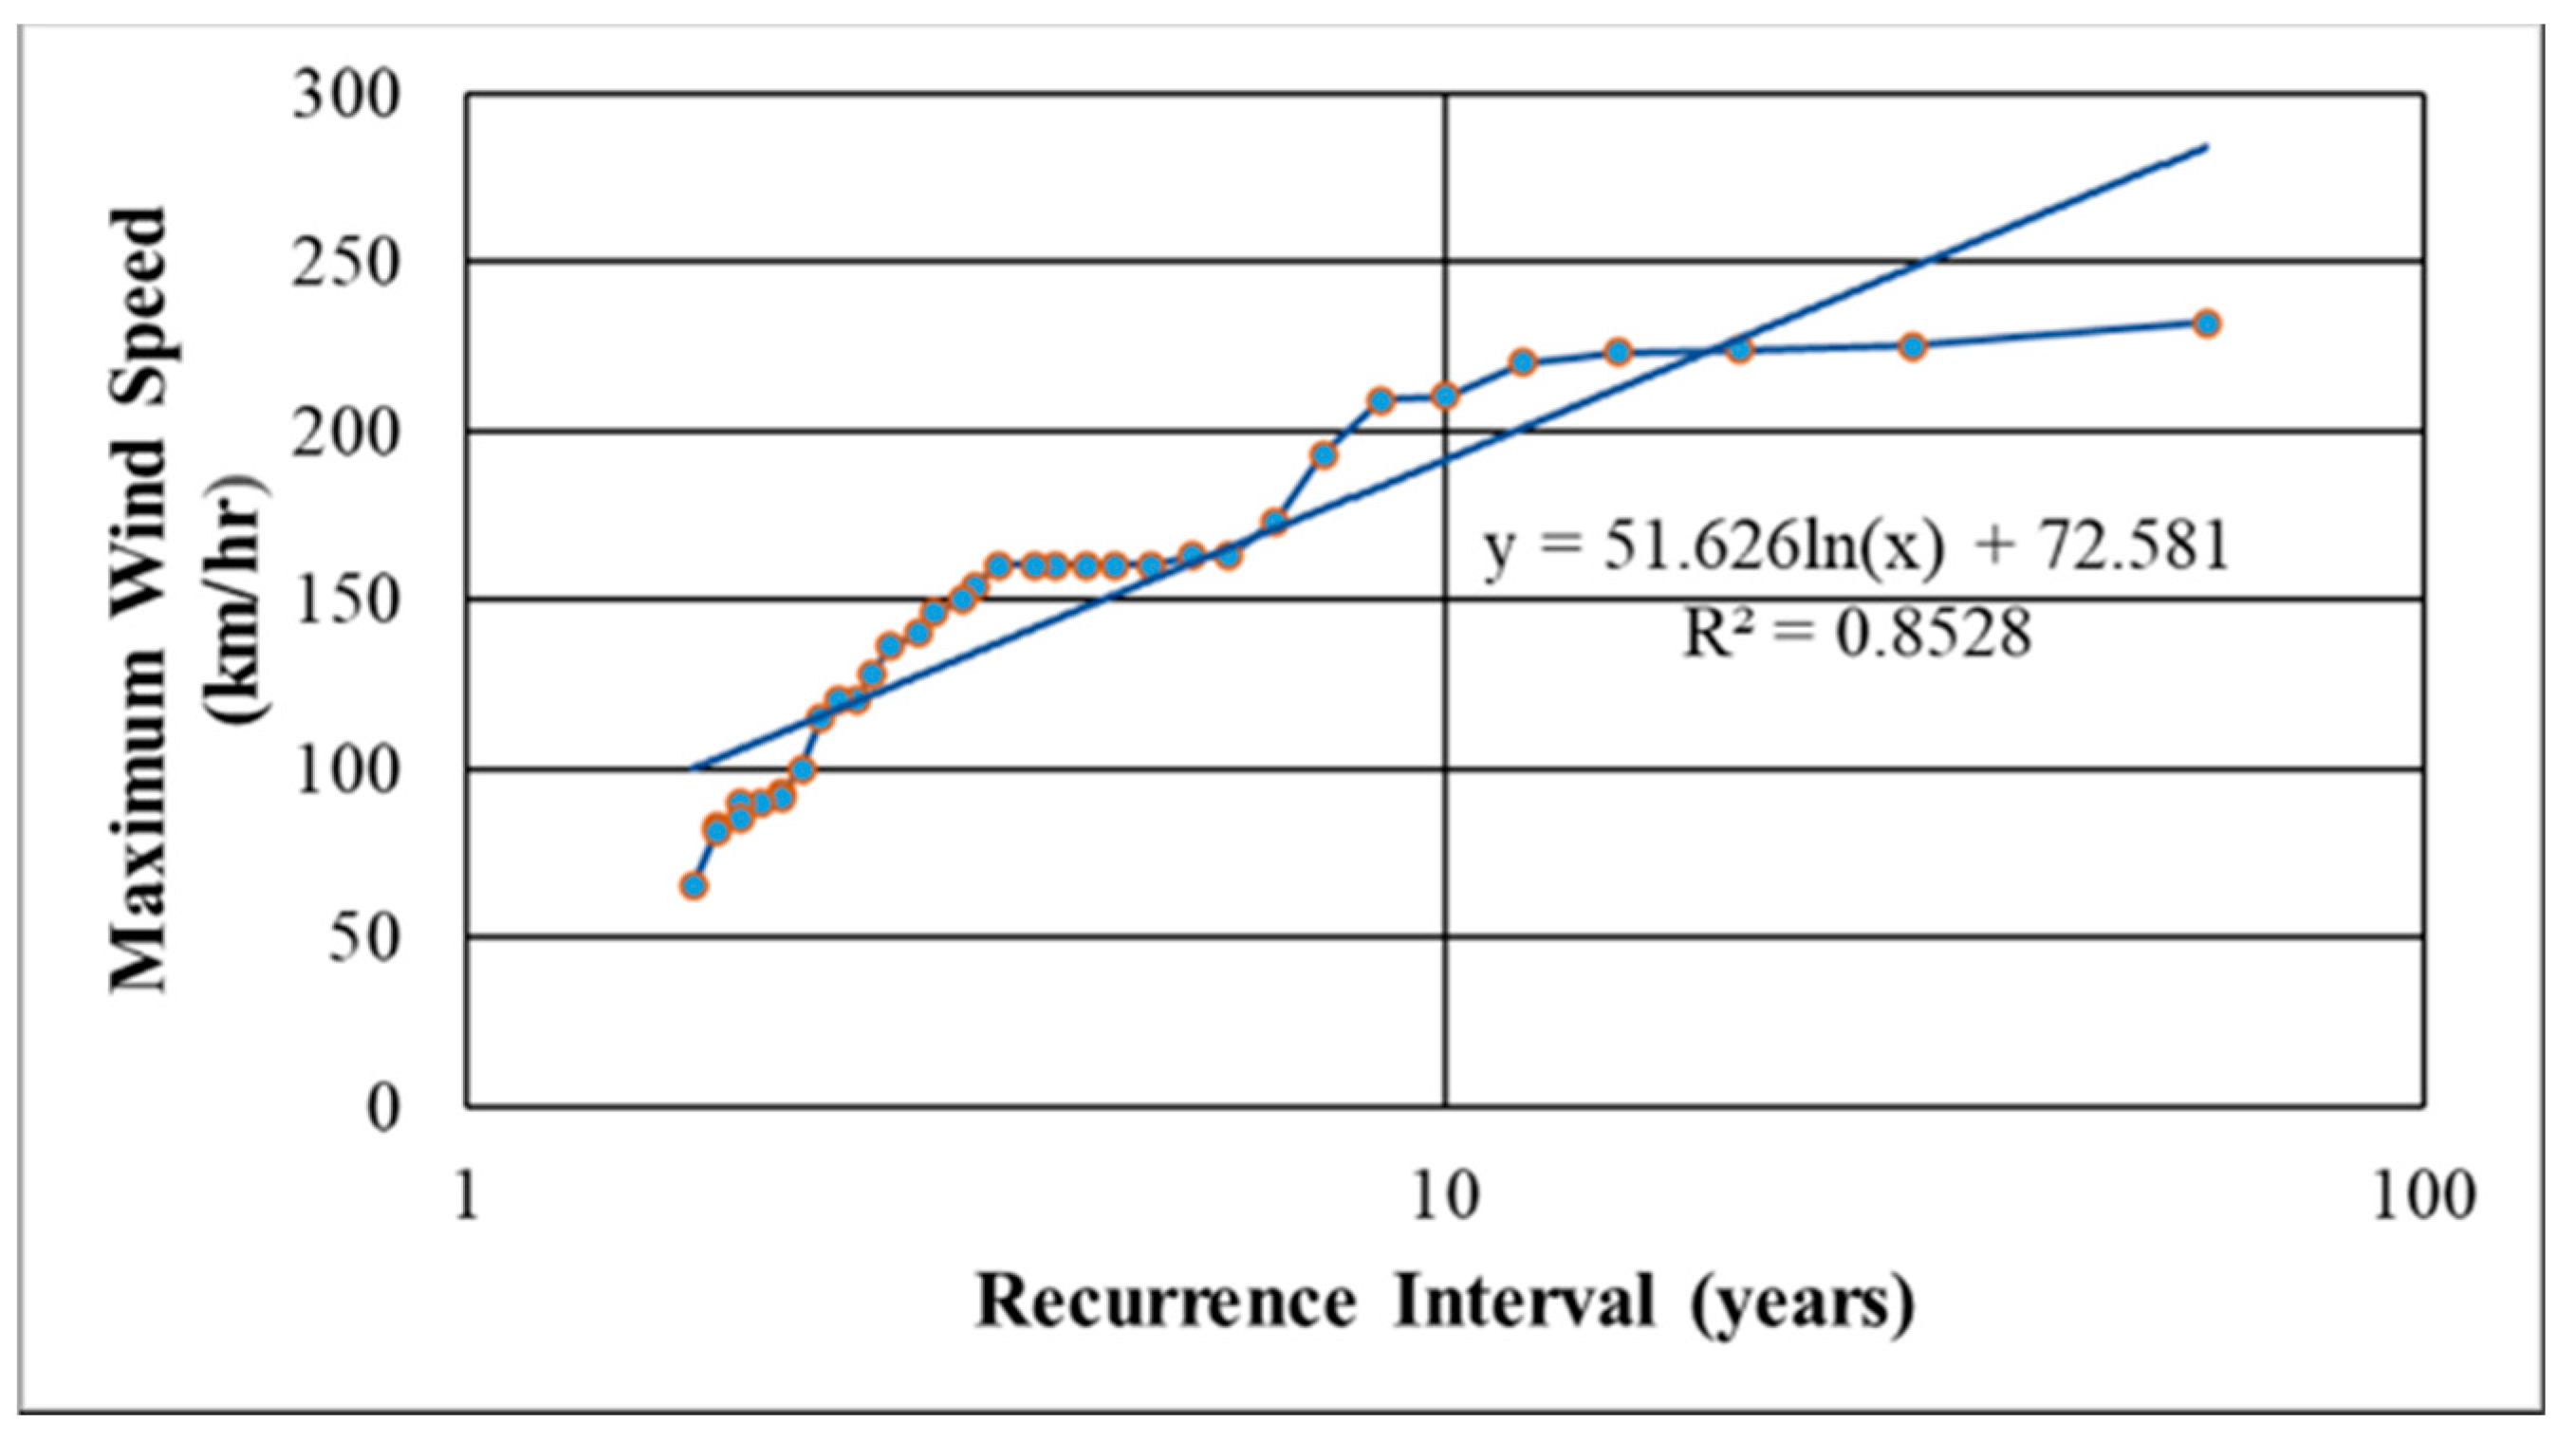
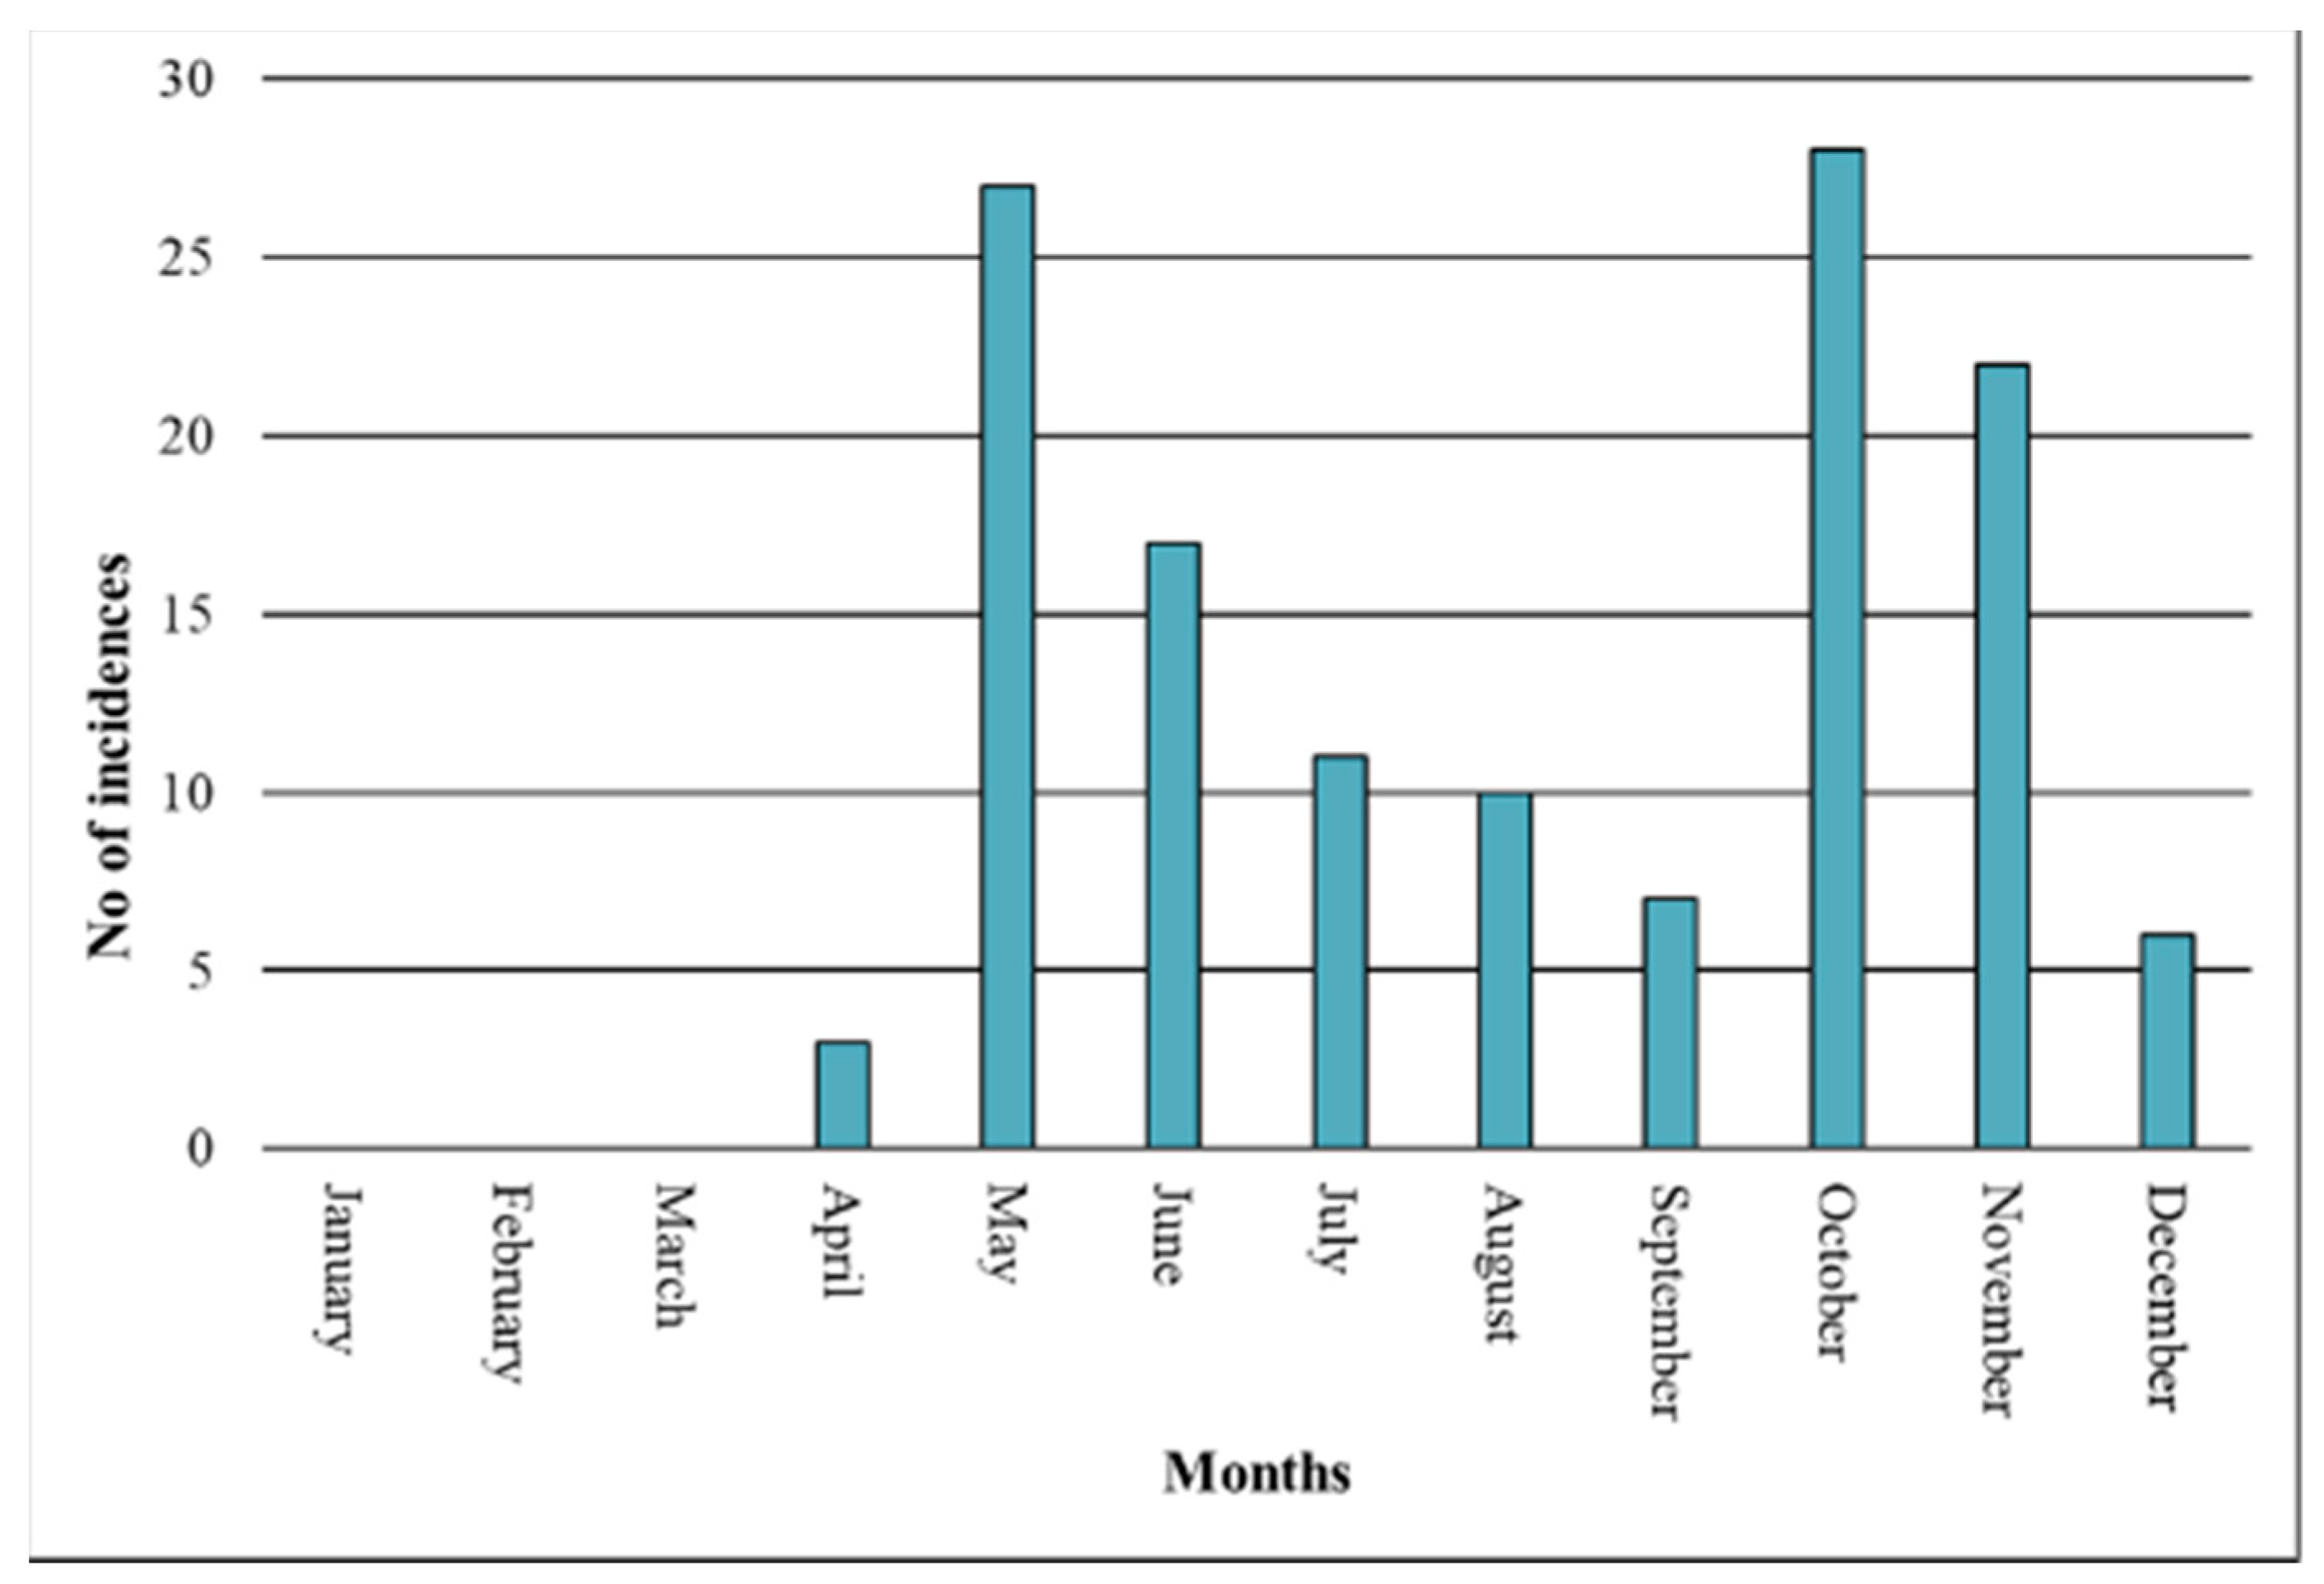
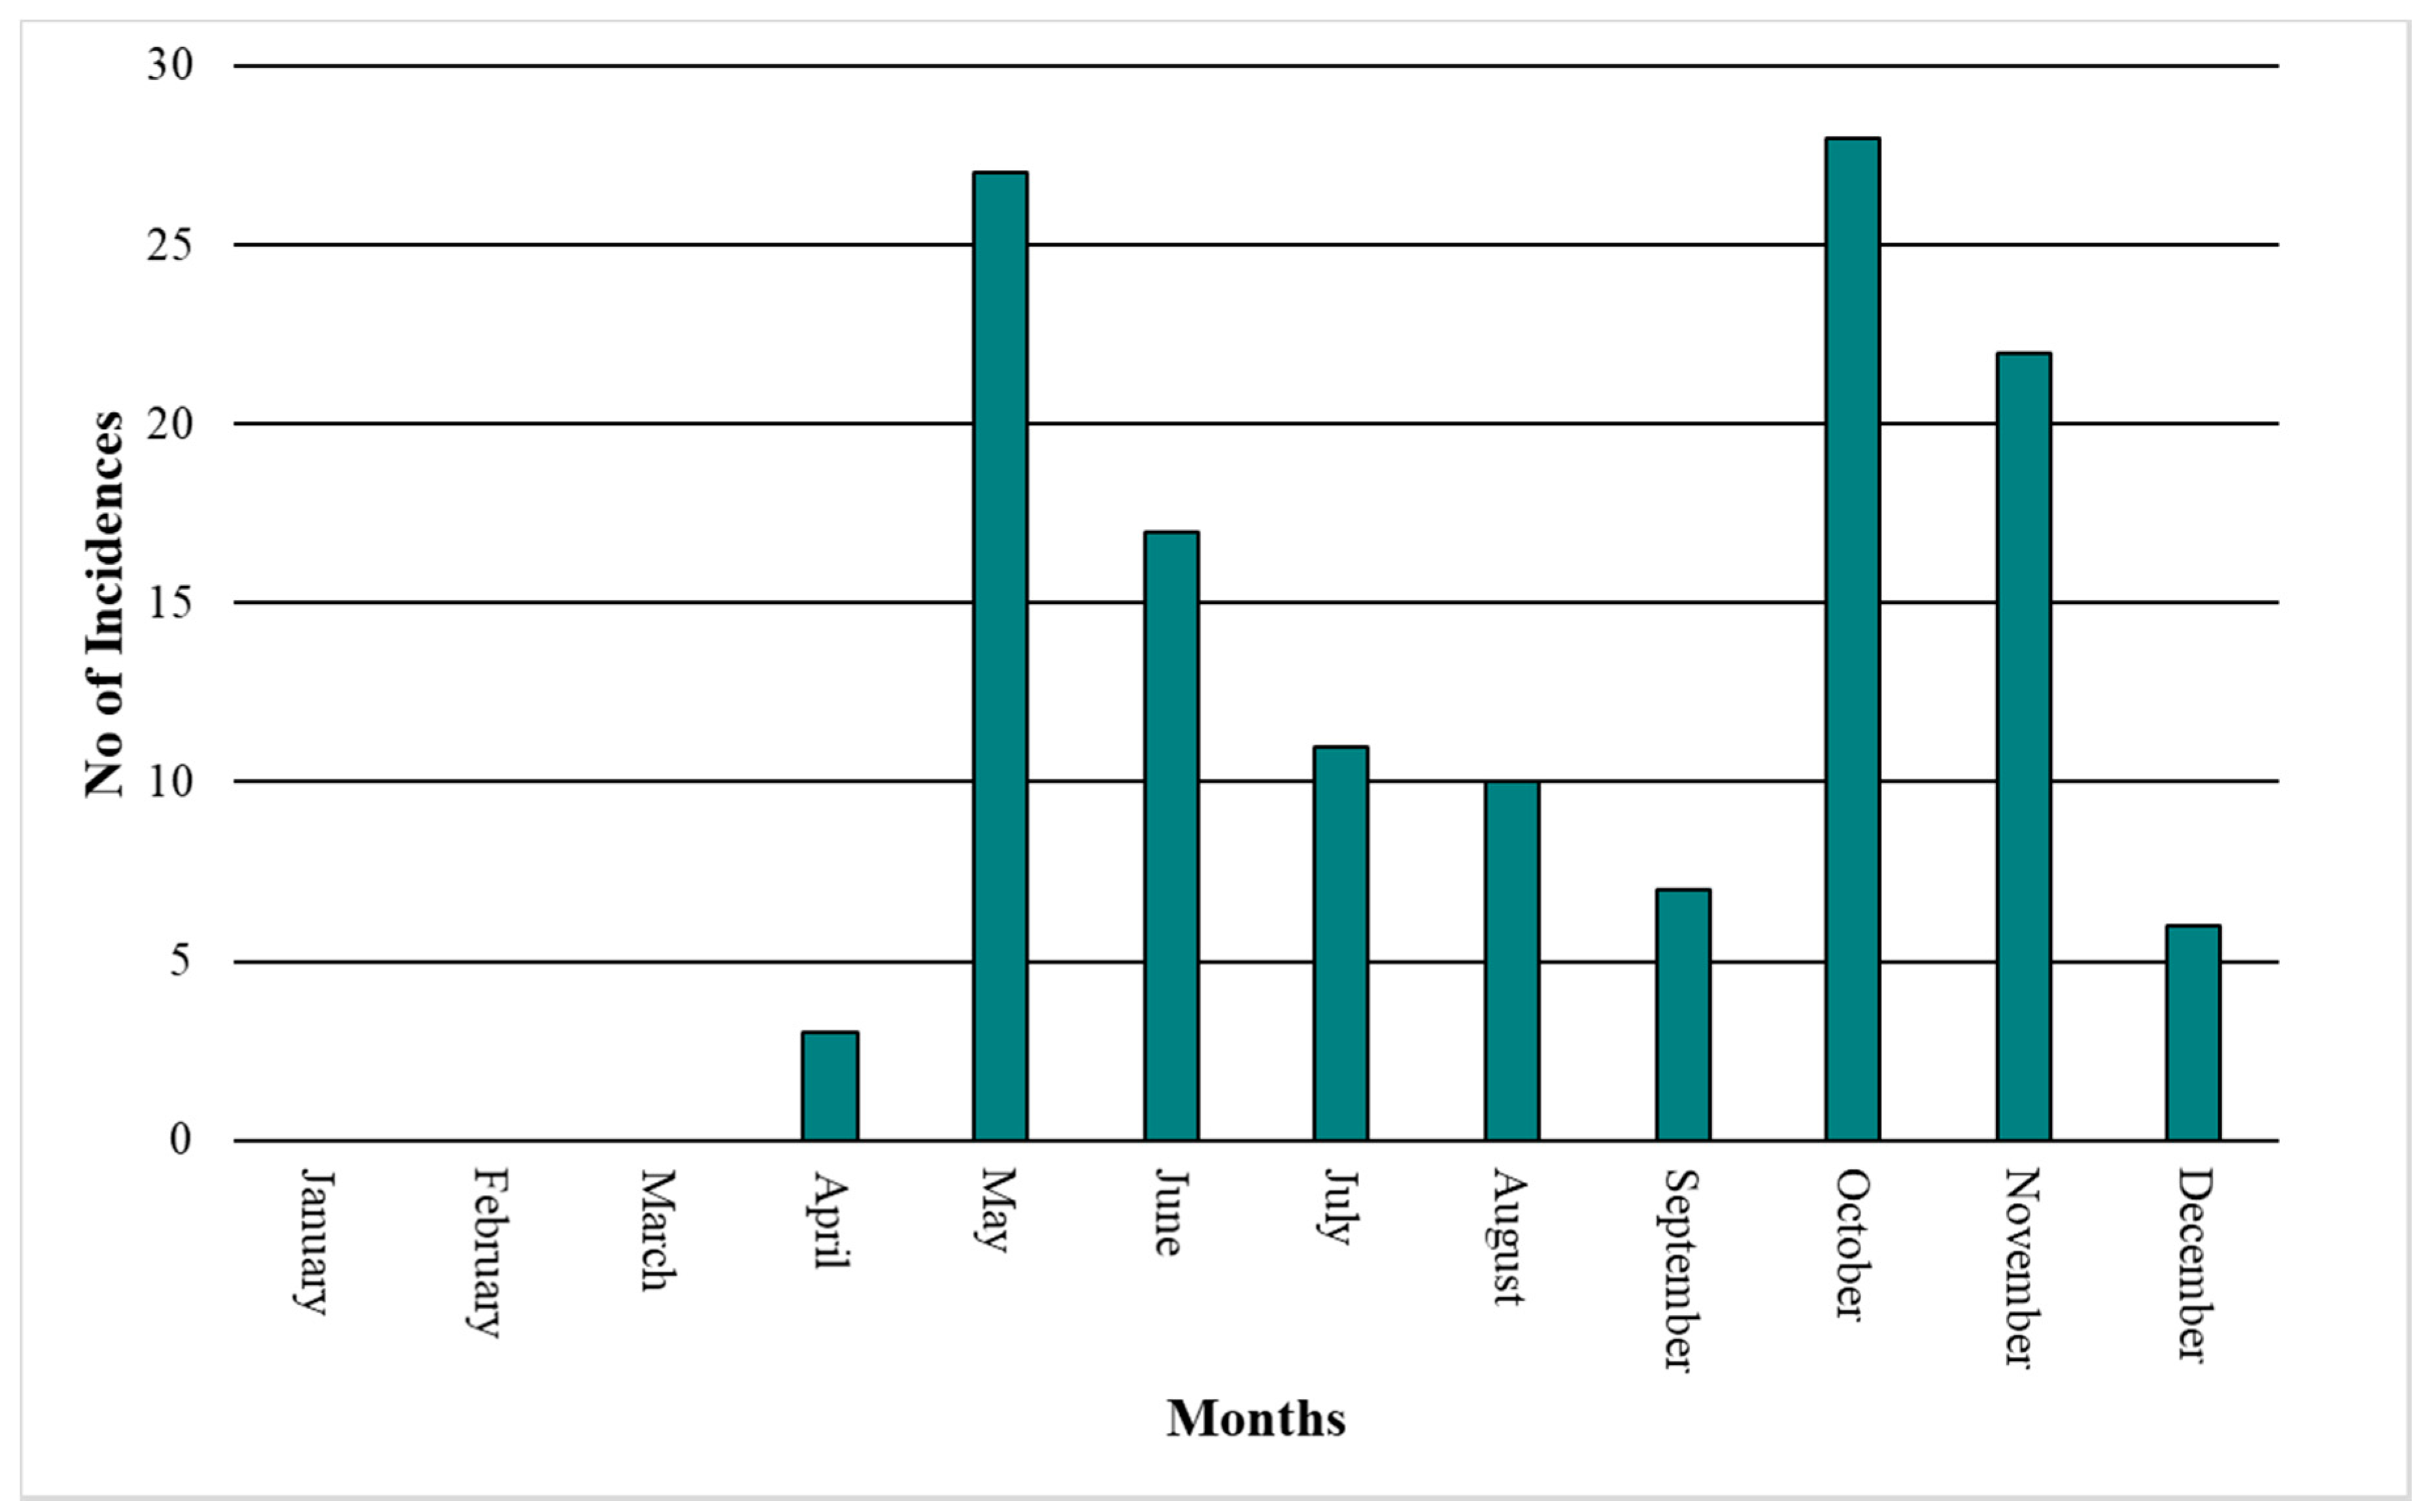
Around 153 tropical cyclones made landfall in the vicinity of Saint Martin’s Island between 1877 and 2020 (EM-DAT). This analysis was performed using the available data sources (BMD, EM-DAT, IBtracks V4.0 database), and the frequency and return period were computed with the popular Weibull formula [50] (Attached in Appendix A). The study area is considered the most vulnerable to the highest maximum wind speeds of cyclones [51]. The Bay of Bengal is expected to be subjected to four tropical cyclones each year. The BMD data show that May to June and October to November are the peak periods for tropical cyclones in the vicinity of the study area (Figure 2). In 2017, Cyclone Mora, which was a Category 1 cyclone according to the Saffir–Simpson scale, made landfall in Cox’s Bazar district (the study area is within this district). The return period of a cyclone with the same wind speed is around 3 years (Figure 3). The maximum cyclone surge height in the study area was found to be 5.18 m, and the average cyclone surge height is around 3.885 m (BMD). The return period of a cyclone with this average surge height is around 5 years.
The DEM file of the study area was classified into two ranges using a symbology table. The historical data show that the highest surge height in the vicinity of the island was 5.18 m, and the most frequently suffered surge height was around 3.885 m (source: Bangladesh Meteorological Department (BMD), Appendix A). Without the trees, there will be no significant reduction in the wave height. Using the Bao regression model (2011) [49], we found that the 3.885 m surge height will be reduced to 3.58 m when Pandanus trees are present. In order to determine the reduction in disaster risk associated with Pandanus trees, three cases were considered. The first case involved no Pandanus trees on the island; the second case pertained to the Pandanus trees present in 2010; and the third case involved the trees present in 2021. For each case, the submerged areas were identified and calculated. In order to identify the flood-affected areas, NDWI index maps were also prepared for 2010 and 2021.
2.3.5. Animation of Flood
The mean sea level (MSL) and DEM were calculated and incorporated into ArcScene. The MSL was prepared by merging it with the boundary and waterbody shapefiles, dissolved, and then converted to a raster file of the same cell size as the DEM. The Animation Manager was opened and 12 tracks were created. In the Transition, the Z column value was set for every rise in the MSL of 0.4 m. Next, the Animation Property was set for duration and others. Finally, the animation was saved as an AVI file (Attached in the Supplementary Materials).
2.3.6. Vulnerable Area Identification
In this step, a map was prepared to show the flood inundation in 2021. The raster file was then converted into a polygon. The area was calculated from the polygon file. In this way, the inundated areas were identified (km2).
2.3.7. Calculating the Required Minimum Patch Width of Pandanus Trees
The thickness or width of a tree patch, or grove, is referred to as the patch width. The Pandanus width required to ensure a safe surge height was calculated with the help of the Bao regression model equation [49]. This equation involved the calculation of the wave height from the cross-shore distance (patch width), mangrove assemblies, and preliminary wave height [49]. The band width of the trees was identified using the equation below, which resulted from the preceding equation. The equation to determine the patch width required for a given predicted wave height (i.e., safe wave height) and the initial wave height depends on the forest structure [49]:
where Bw denotes the forest patch width (m), Wh refers to a wave height behind the forest that is safe (cm), “a” is the initial wave height function, and “b” is the forest structure function [49].
Bw = (ln (Wh) − ln(a))/b
Here,
a = 0.9899 × Iwh + 0.3526
b = 0.048 − 0.0016 × H − 0.00178 × ln(N) − 0.0077 × ln(CC)
2.3.8. Sensitivity Analysis
Sensitivity analysis is a very crucial procedure in determining the effects that model variation and uncertainties have on the predictions of the model. This technique is often used to address model realism, input parameters, design variation, etc. [52]. There are many methods and applications related to this technique. The differential sensitivity analysis (DSA) method was implemented in this study. The DSA method requires a base simulation, in which the input parameters are the best estimates [52]. Then, the simulation is repeated with one input parameter being changed from S to S + δS, and the effects on the output parameter(s) of interest are measured. This was carried out for each parameter, in turn giving a total of N + 1 simulations that could be used to analyze the effects of N uncertain parameters [52].
3. Results
3.1. Land Use Changes on Saint Martin’s Island
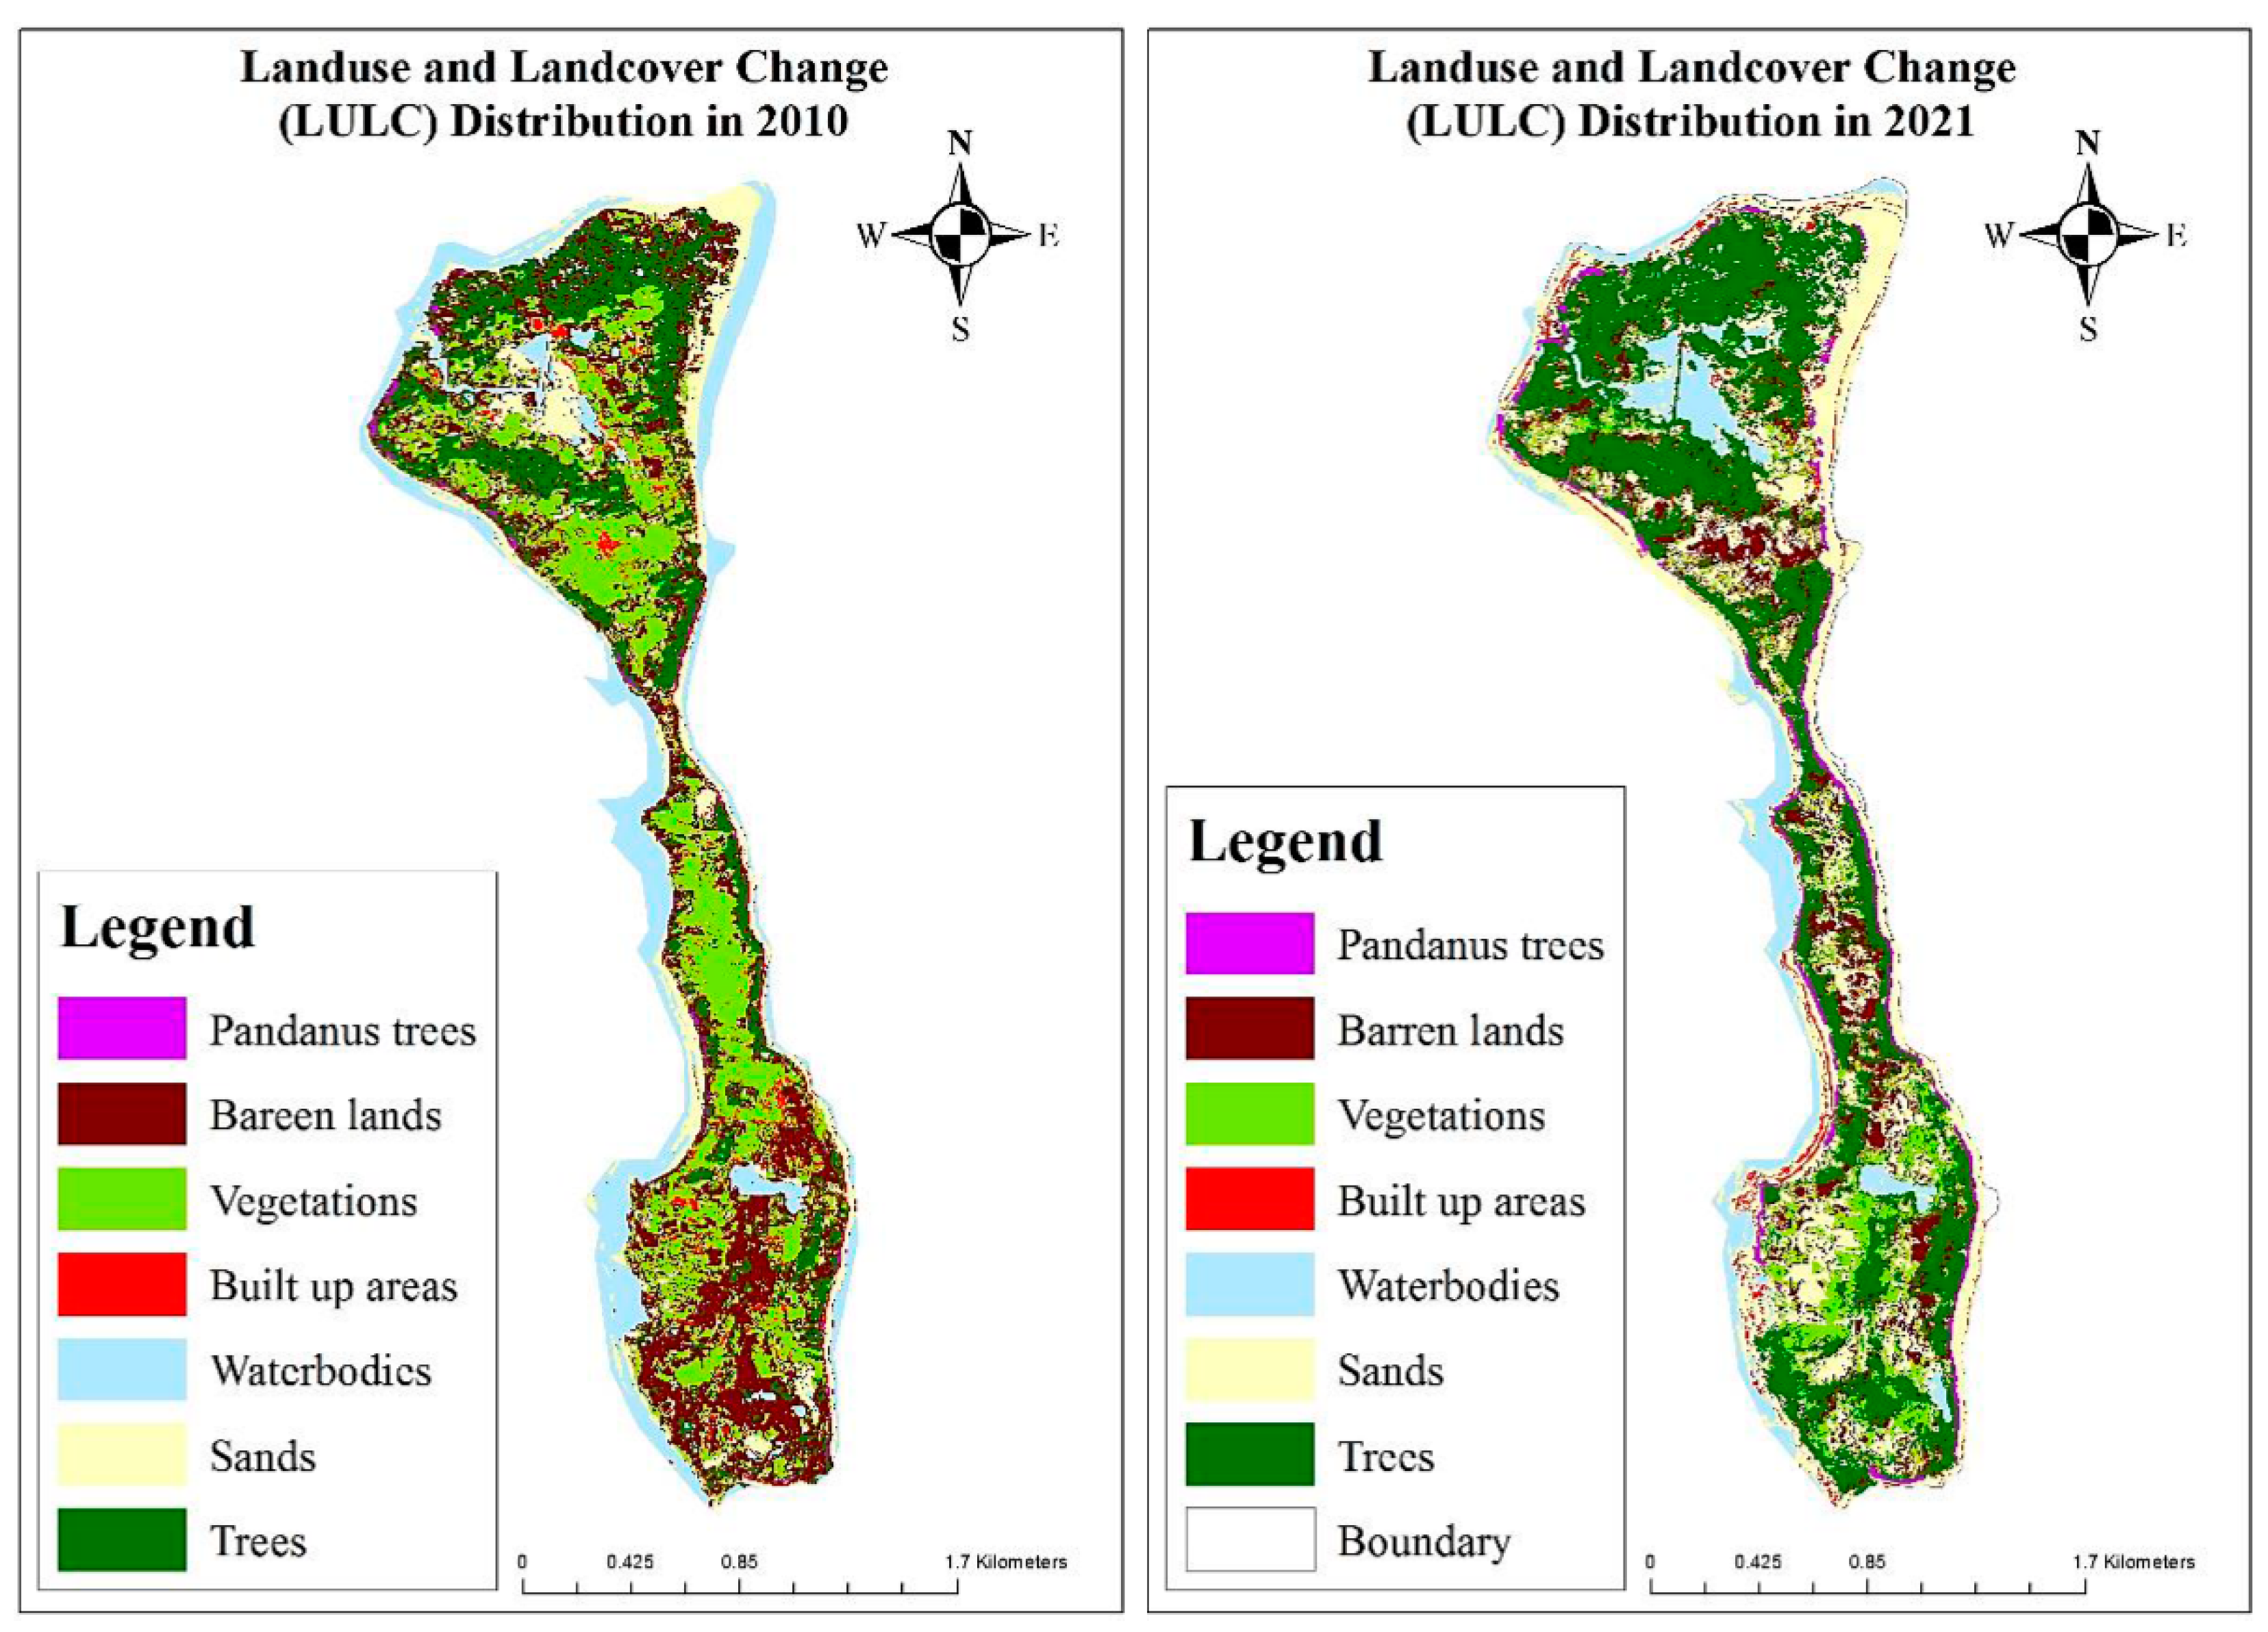
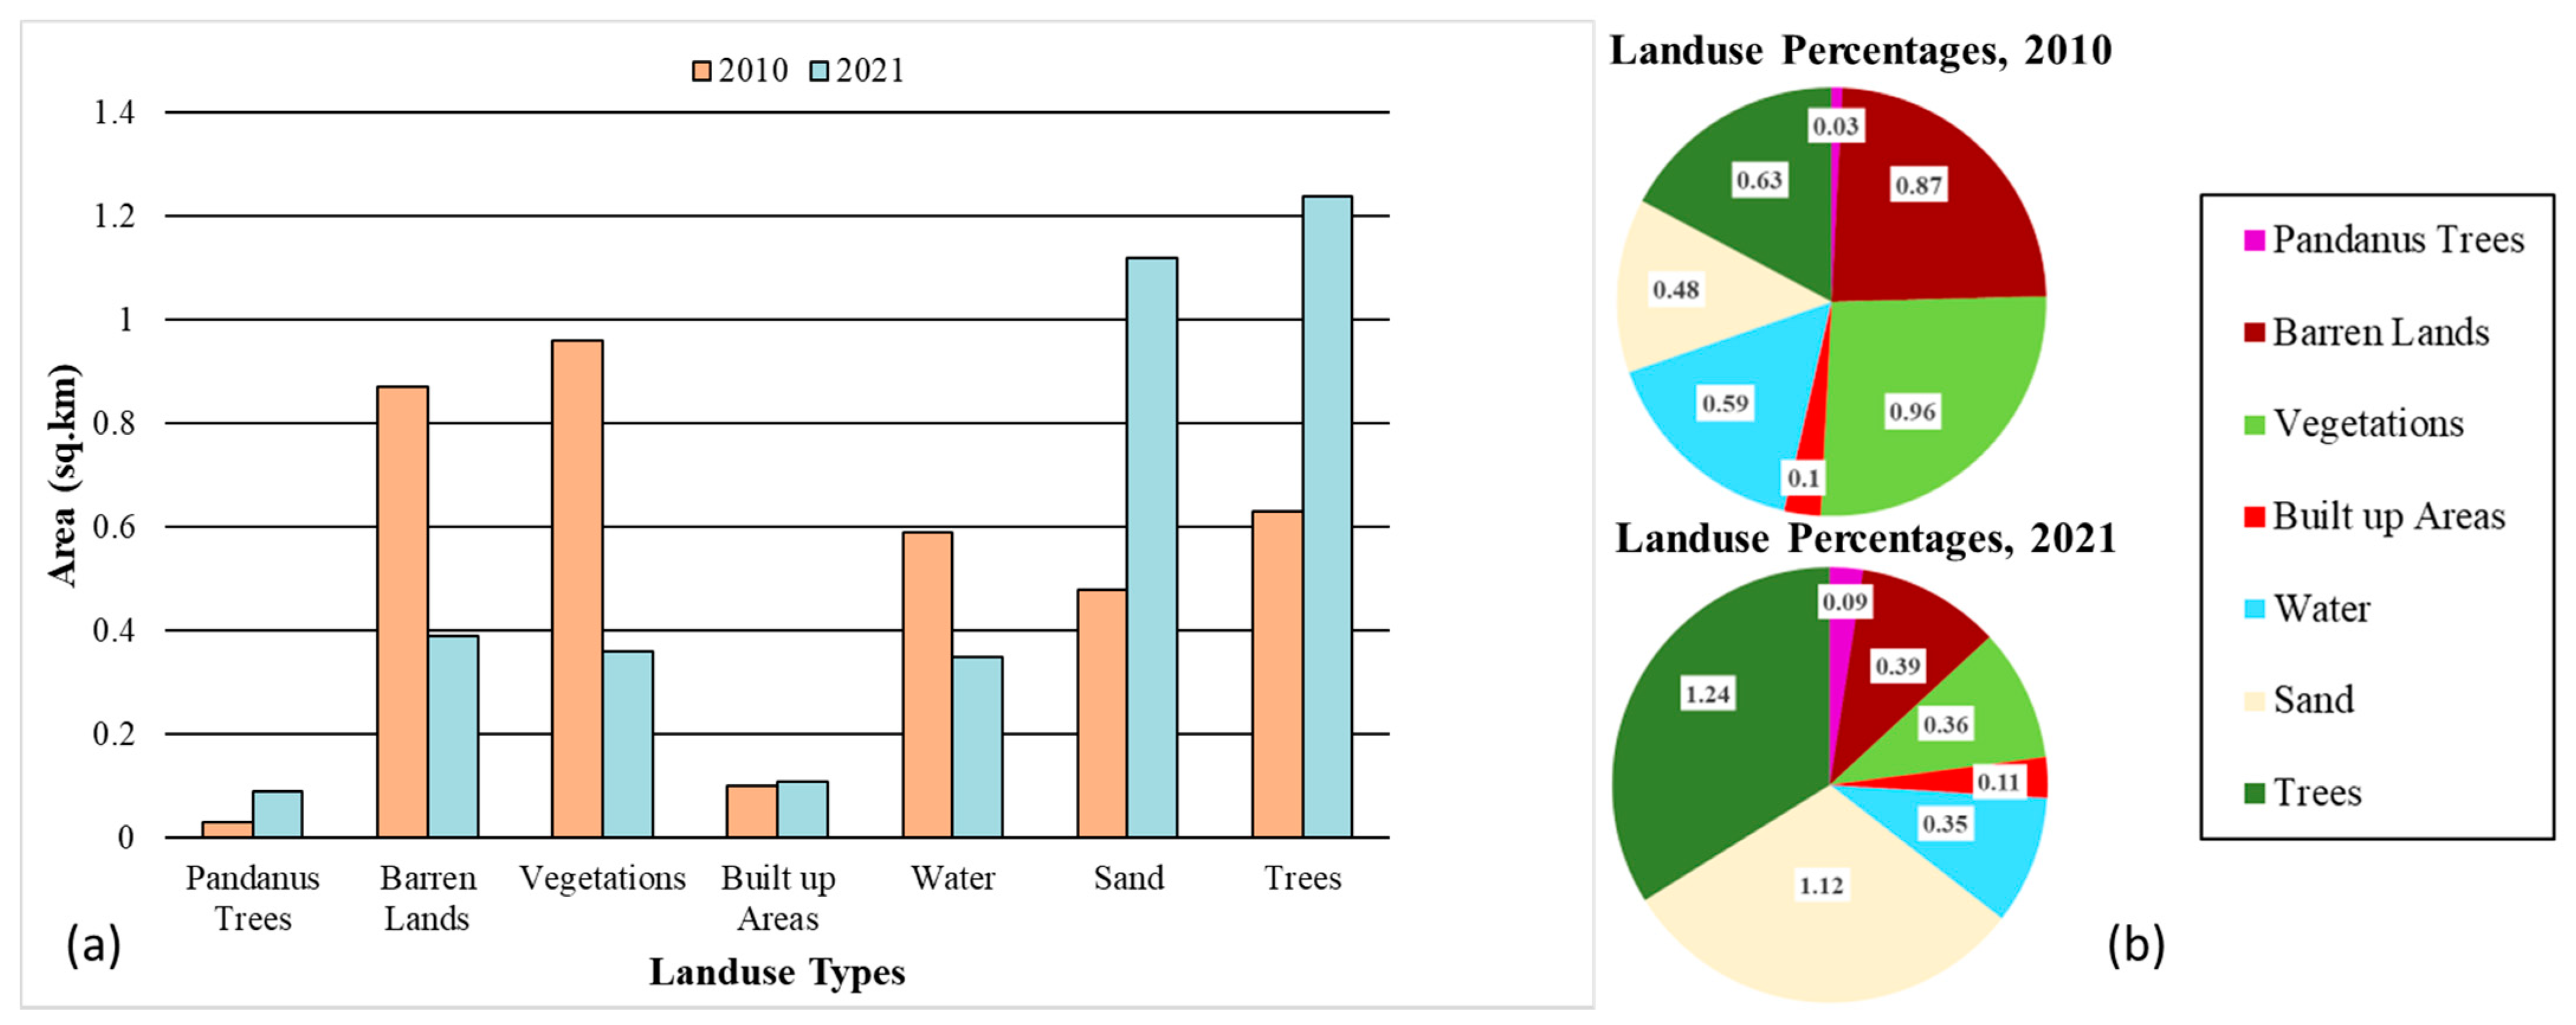
Figure 4 shows the land use maps for 2010 and 2021, and Figure 5 displays the land use changes on the island. The maps reveal that the area of Saint Martin’s Island remained the same. This means that no significant erosion occurred during the period. Both images were taken in February, which is within the dry season in Bangladesh. The inland waterbody area increased during this time. The LULC analysis showed that the mangrove and coconut tree areas doubled between 2010 and 2021 (0.66 km2 in 2010 and 1.32 km2 in 2021) due to the plantation of new trees by an NGO. Vegetation, sands, and agriculture decreased. The built-up area remained the same during the period of image analysis.
3.2. Finding the Pandanus Distribution
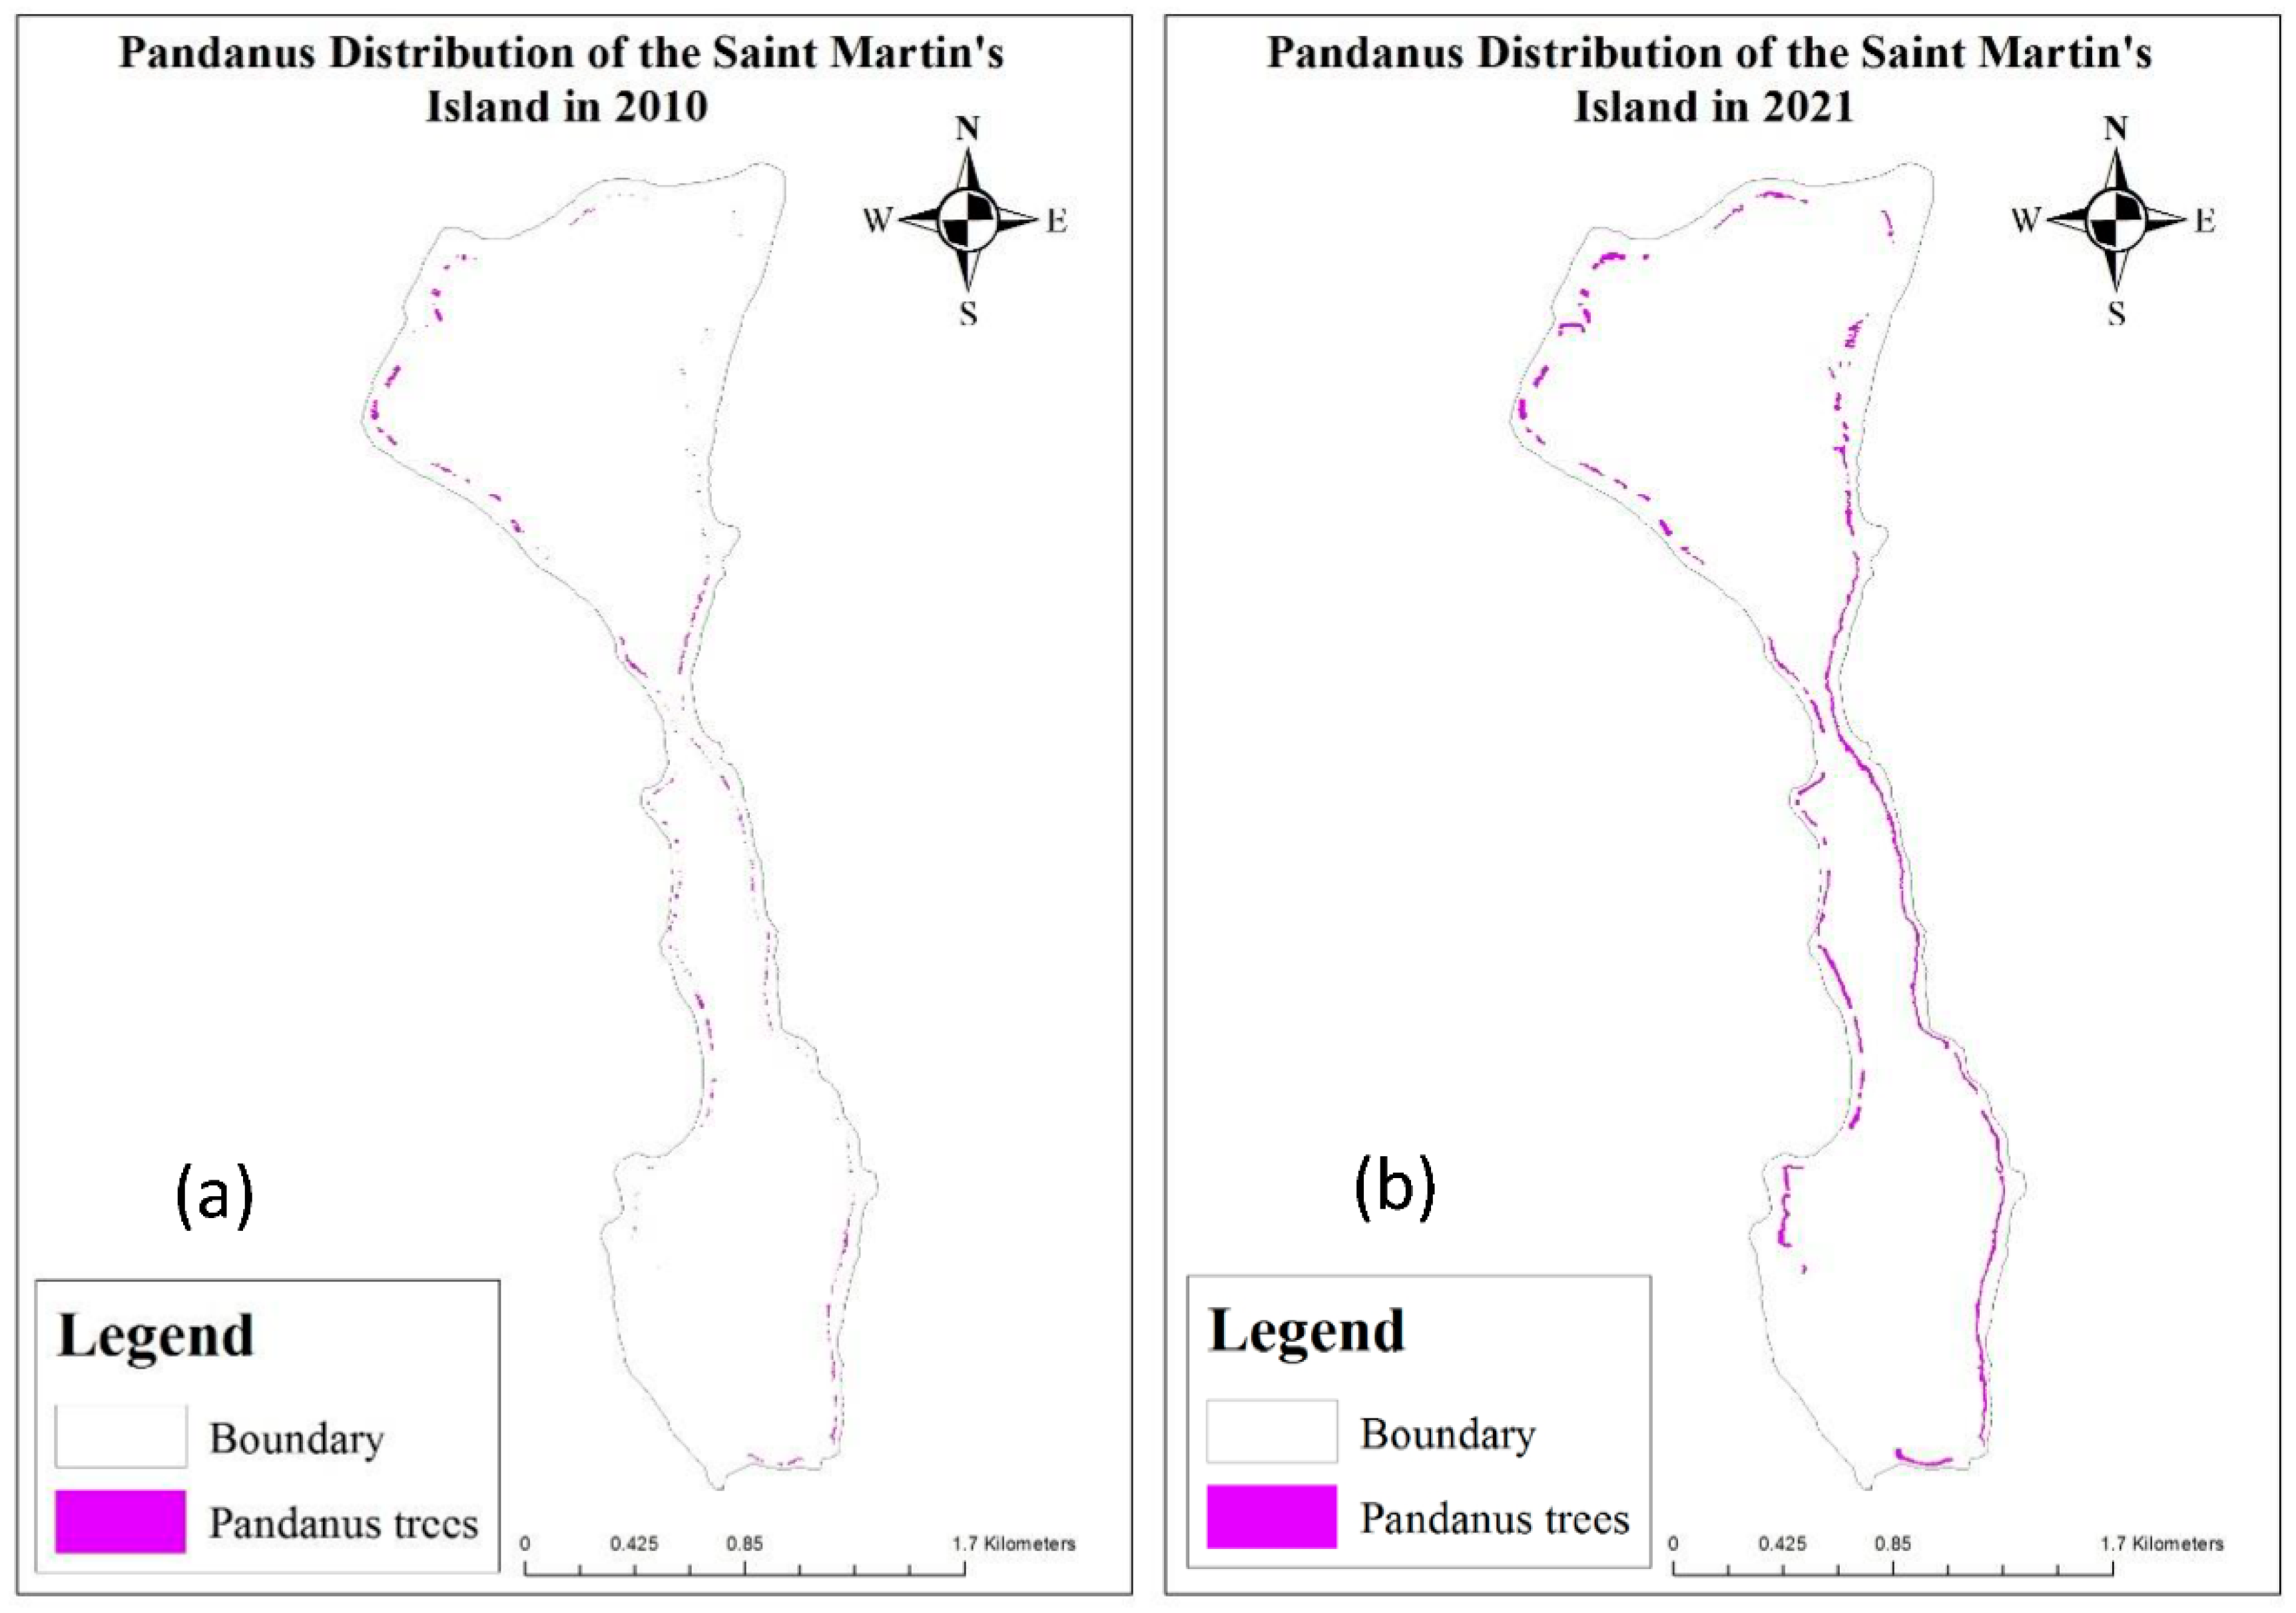
Figure 6 shows the Pandanus tree distributions in 2010 (Figure 6a) and 2021 (Figure 6b). In 2010, the total area covered by Pandanus trees was approximately 0.03km2 (25,007 m2). In 2021, this area increased to 0.09 km2 (87,007 m2, or 8.7 hectares). The area increased 3.4-fold during the period.
The NGO Poush has facilitated the conservation and plantation of Pandanus trees over the years, and during the last ten years, the total number of trees has increased.
3.3. Evaluation of Pandanus Trees
3.3.1. Flood Analysis
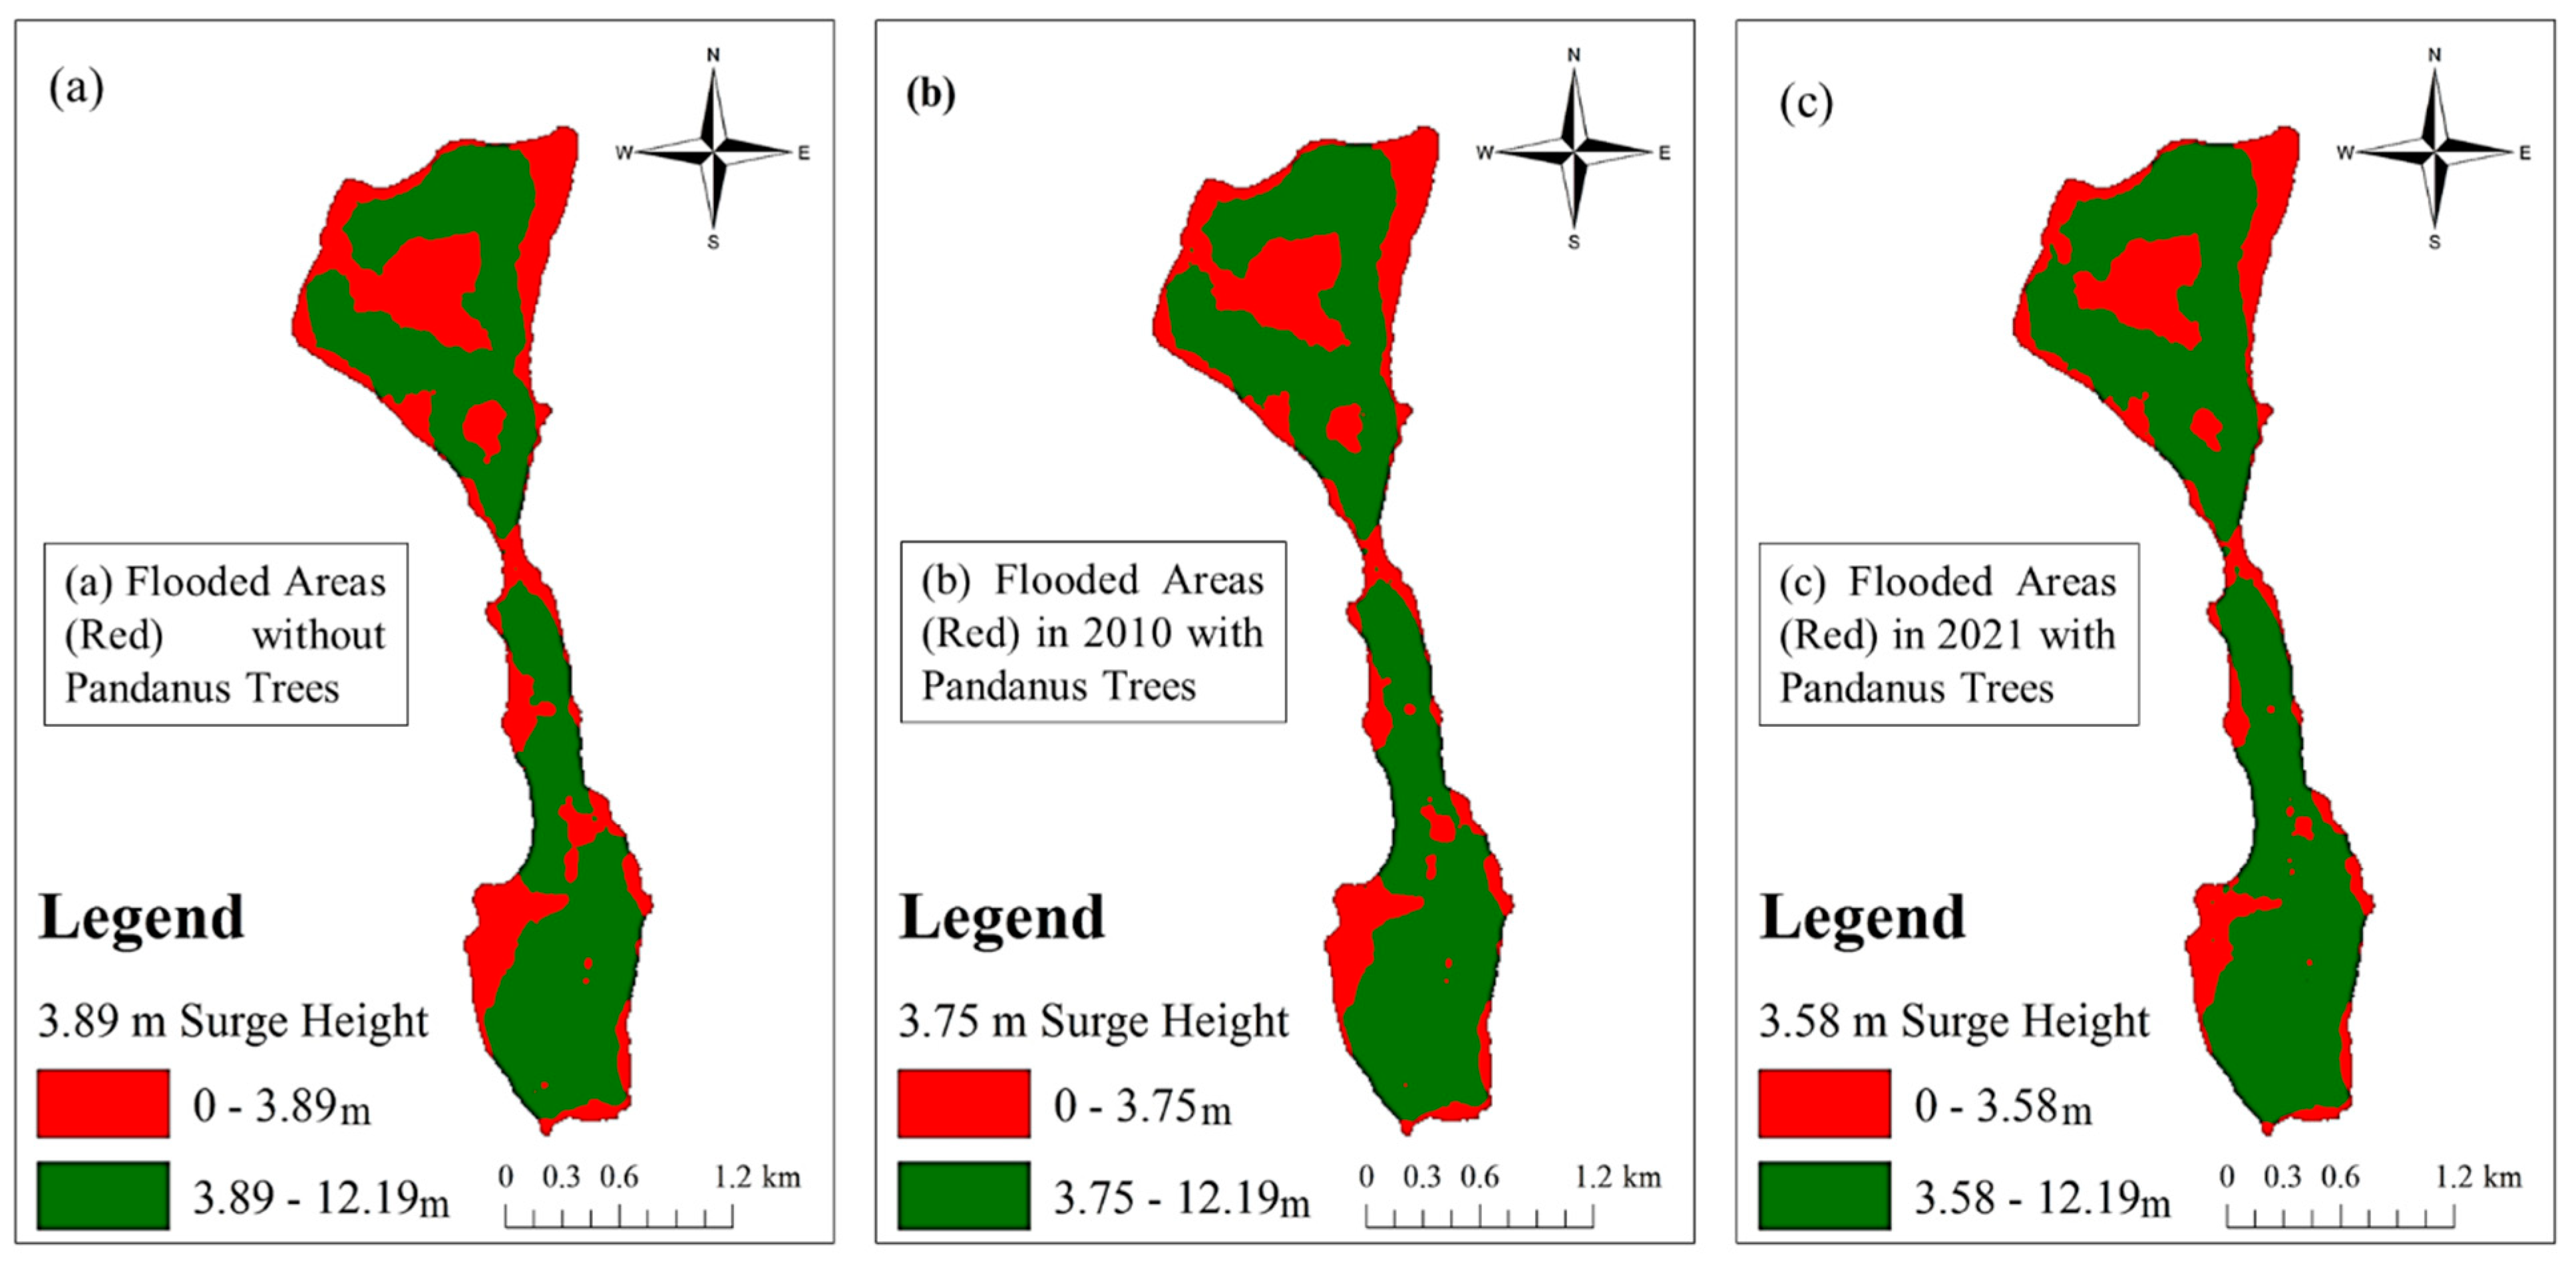
For flood analysis, three cases were considered, as mentioned in the section on methods for flood analysis. The maximum surge height related to tropical cyclones in the vicinity of the island was 3.885 m, as inferred from the records of tropical cyclones collected by the Bangladesh Meteorological Department (BMD). The first case assumed there were no Pandanus trees, and the submerged area was analyzed with the model; we found that without any Pandanus trees, a 3.885 m surge will inundate almost 1.19 km2 of the island (35%), which will lead to the inundation of some households near the shore, and floods in inland water bodies (Figure 7a). Here, it was also implied that there would be no significant decrease in the surge height, as it was seen to only slightly reduce while making landfall. This inundation also covers the narrow part of the island and disrupts evacuation to the cyclone shelter, which is situated in the wider part of the island. The southern coastline of the island will also be flooded in many places. The next case considered was based on the Pandanus population present in 2010. Here, with a limited amount of small and newly planted Pandanus trees, the 3.885 m surge is reduced to 3.75 m and inundates almost 31% of the land of the island (Figure 7b). In this scenario, as the Pandanus forest is in decline due to human destruction, and the newly planted plants are too small with little canopy coverage, they are not very effective in protecting the island from the surge. In this scenario, the degree of flooding in inland waterbodies will be decreased. The southern coastline will also be flooded, but to a lesser extent.
The next step was to consider the trees present in 2021. Here, the 3.885 m surge is reduced to 3.58 m given the presence of more Pandanus trees than in 2010, and eventually, this will submerge 0.92 km2 (26.7%) of the island (Figure 7c). Here, the newly planted Pandanus trees are mature, and the canopy is higher (Figure 8b). The patch width and size of the trees also increase. Although there is some human destruction, the trees present in 2021 will reduce the effect of a 3.885 m surge. The inland waterbody in the northern part will be flooded, but to a lesser extent (Figure 7c). The flood of inland water into the southern part will be reduced, and the southern coastline will be flooded less severely. The middle narrow section will also be flooded, but the overall flooded area will be reduced.
3.3.2. Vulnerable Area Identification
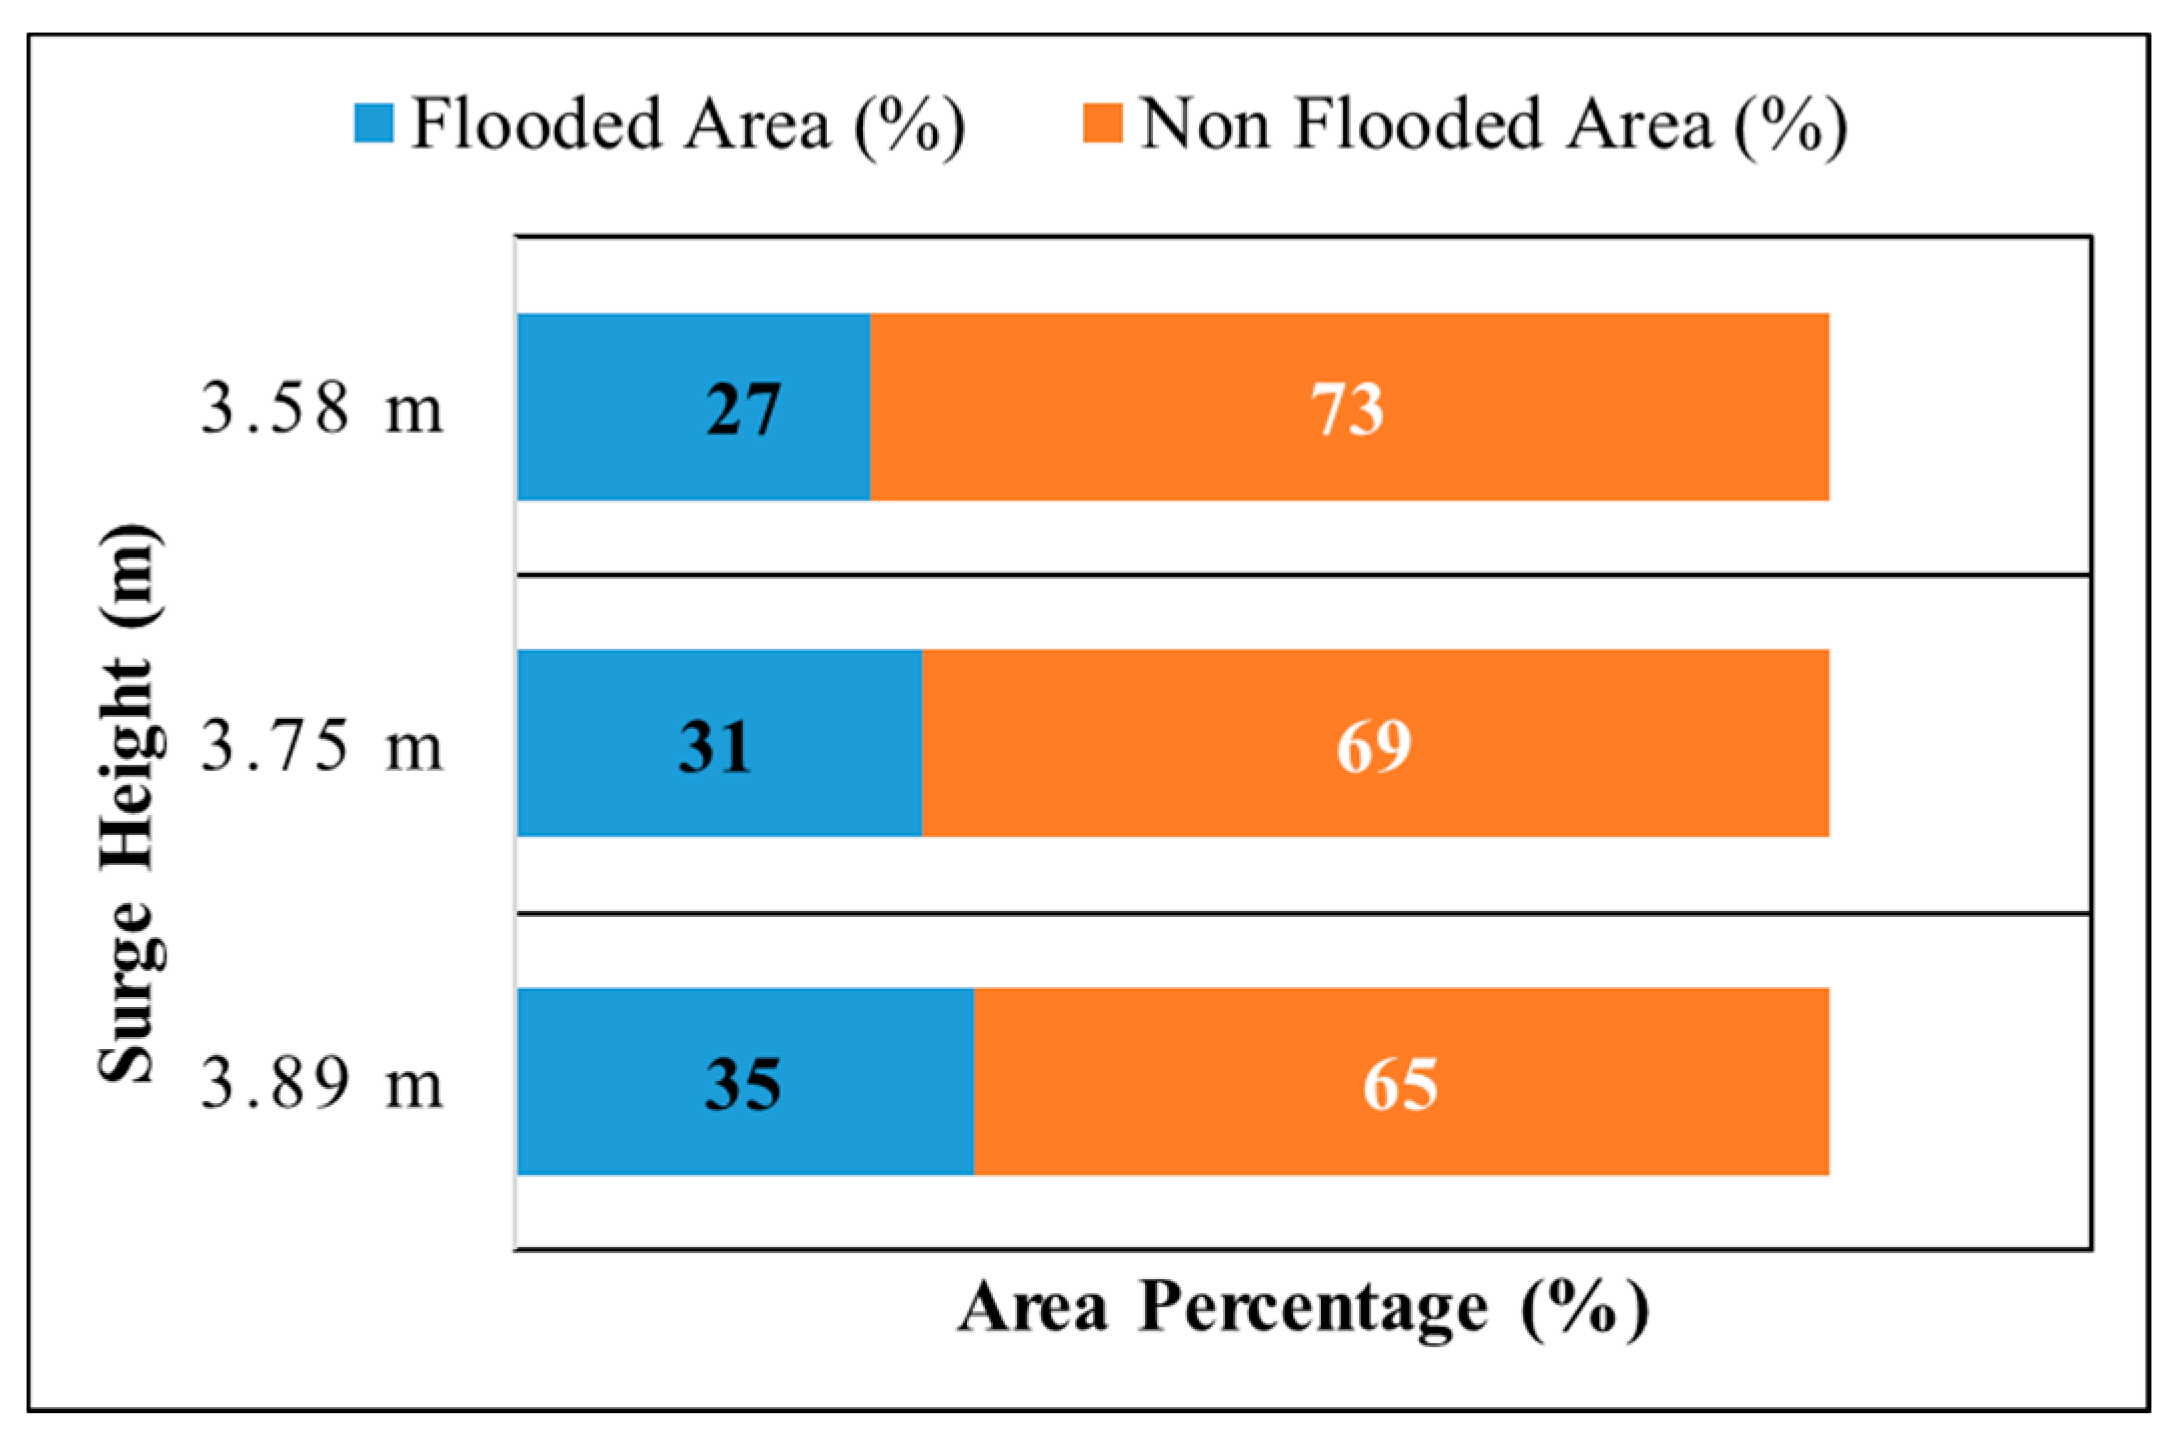
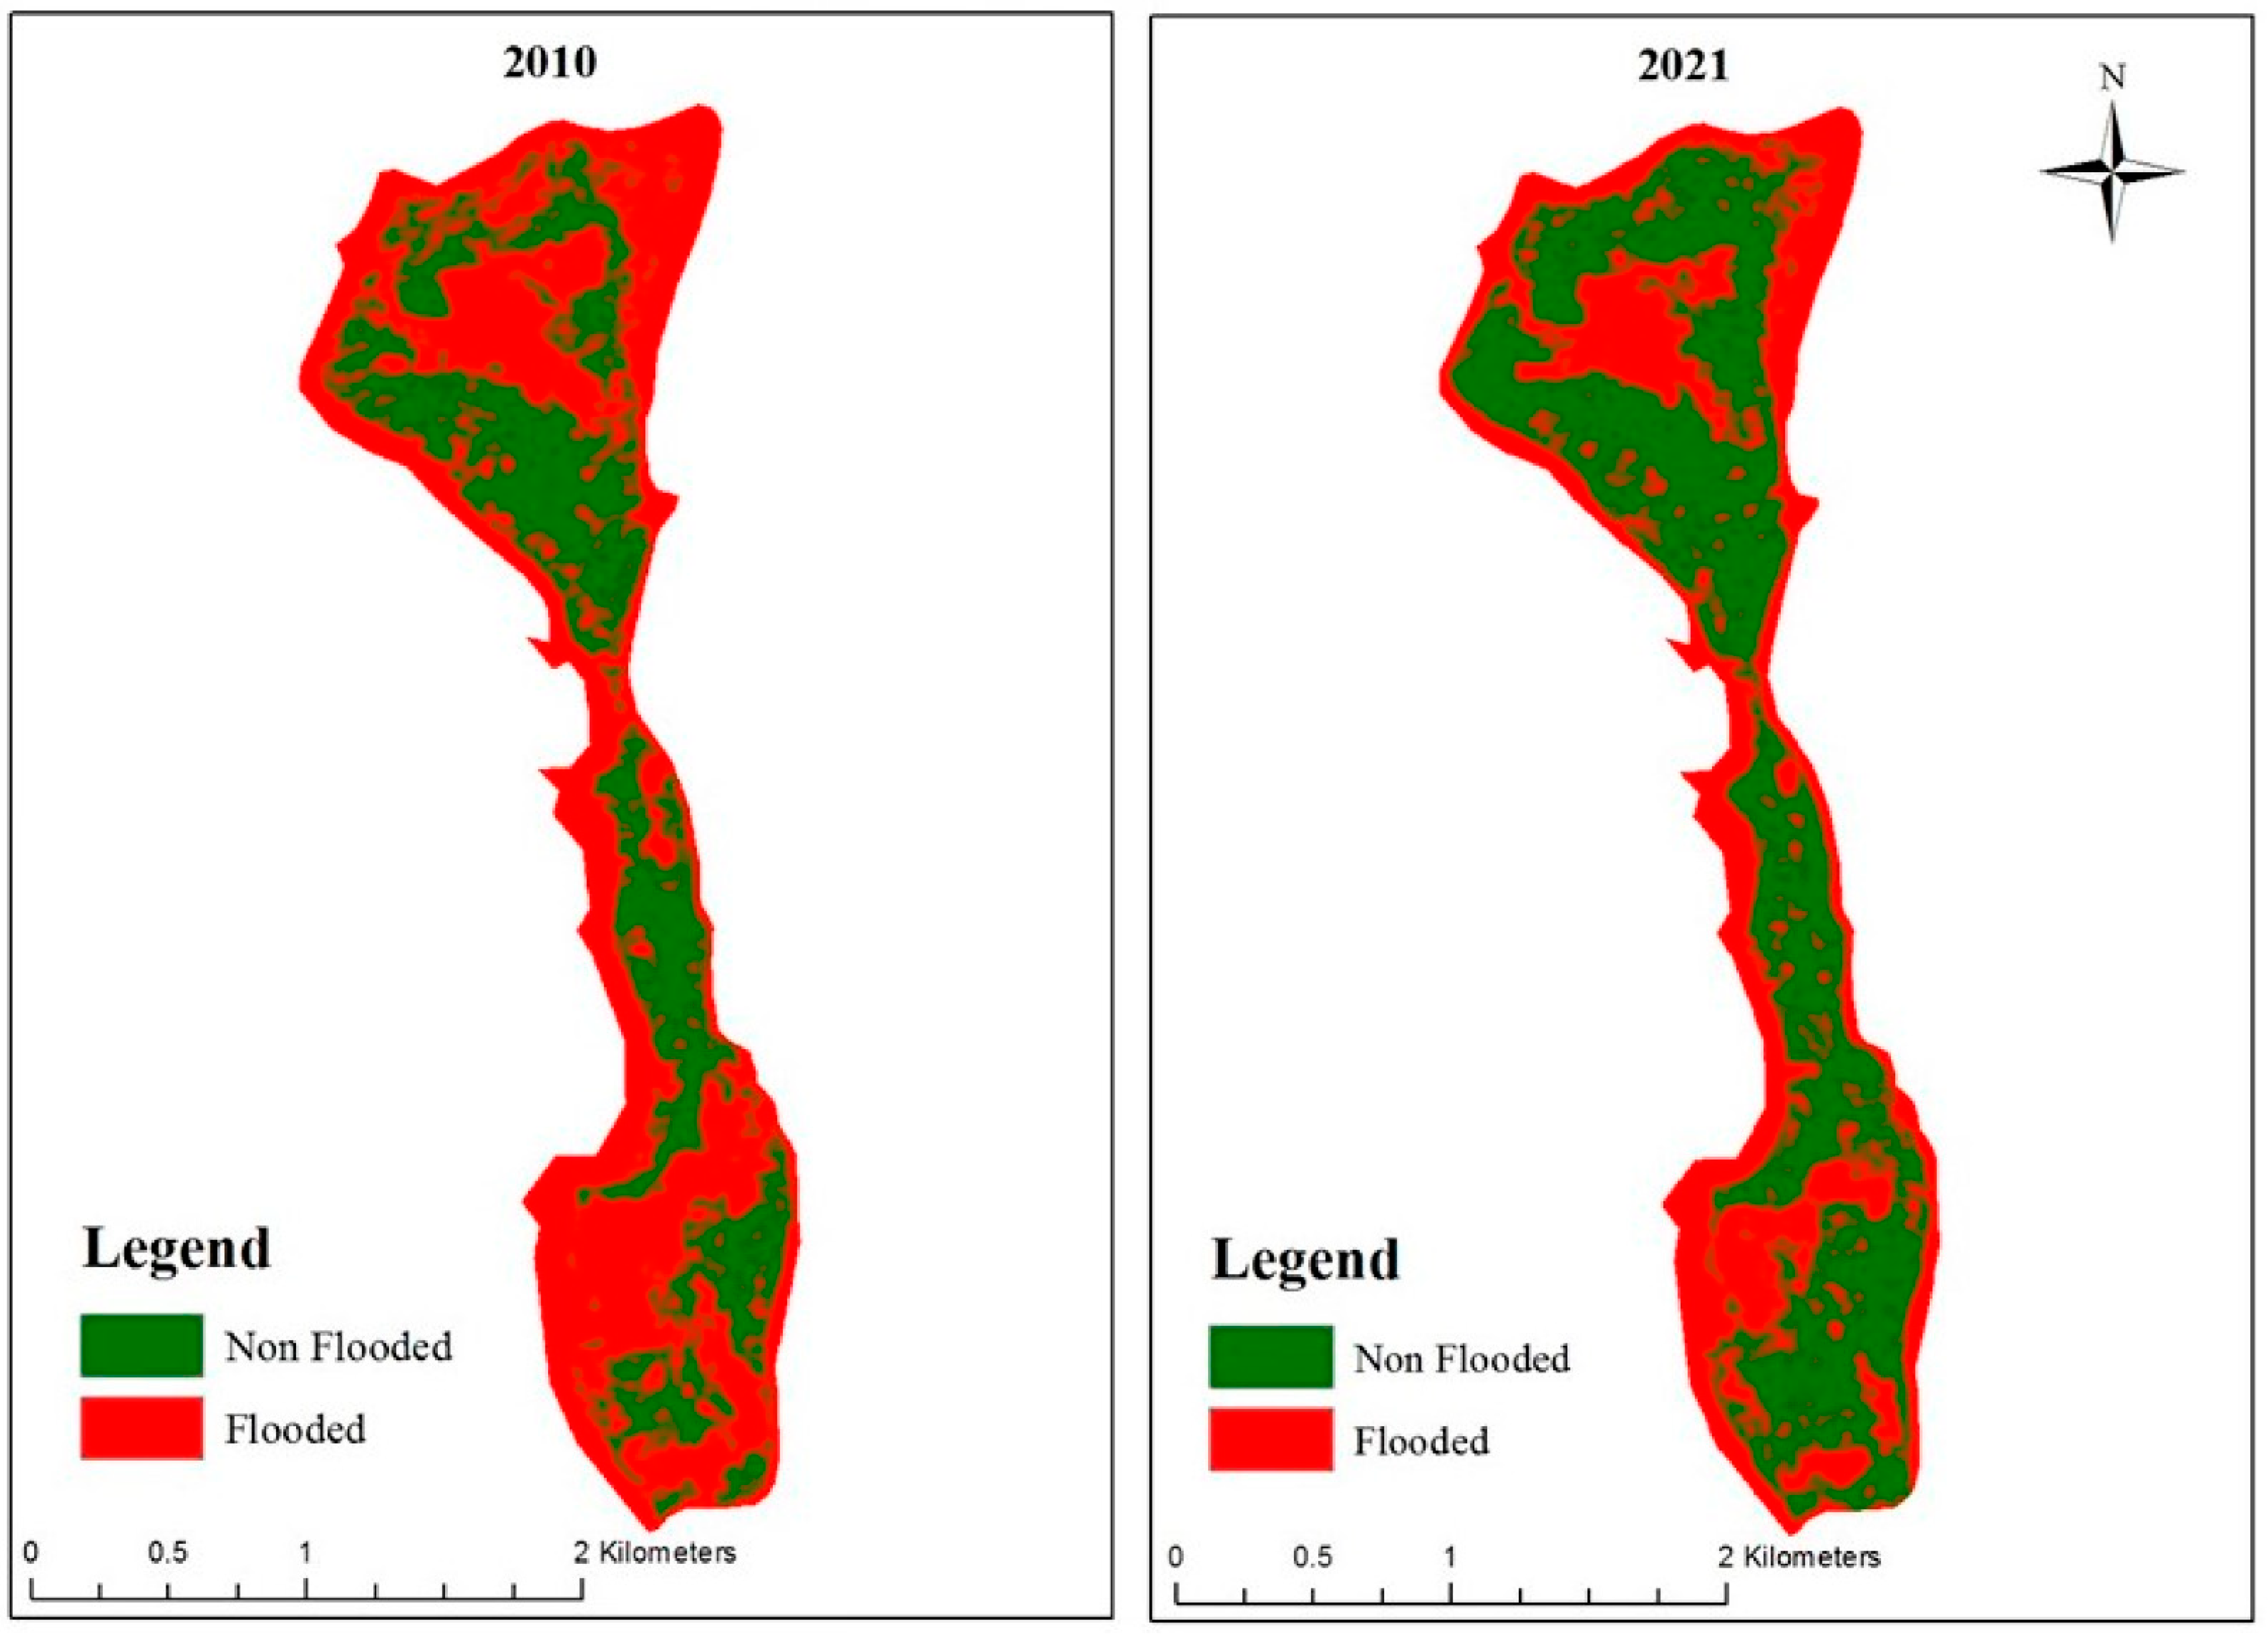
From the maps (Figure 7a–c), the vulnerable areas of the island can be identified and calculated. According to the scenario based on 2021, as mentioned above, only 26.7%, or 0.92 km2 (Figure 9 and Table 4), of the island will be flooded when subjected to a surge height of 3.885 m, which will ultimately be reduced to 3.58 m once it has passed the Pandanus trees. From the map, the most vulnerable area could be identified as the middle narrow part of the island. The other most vulnerable area is the southwestern part, which is the tortoise breeding and nesting area. The next vulnerable area is the low-lying northeastern side. There are many household structures here, and there is a high probability of this area being flooded. To confirm the flood inundation coverage, NDWI index maps were also prepared (Figure 10).
3.3.3. Minimum Patch Width
The heights of waves related to storms depend on the characteristics of storm events. Strong winds and heavy rain can also influence the wave height. On Saint Martin’s Island, the safe height of waves behind the Pandanus patch is considered to be 3.2 m, as implied by the historic data and analysis. For a surge height of 3.2 m, the minimum required patch width (as inferred from the equation) is 4.53 m. The existing width is 2.8 m, so the band width of the trees must be increased by another 1.73 m to make the island safe from cyclonic storm surges.
3.3.4. Sensitivity Analysis
The uncertainty of the wave height reduction was hierarchically partitioned into various primary components. The initial wave height (Iwh) and tree height (H) factors were the main sources of uncertainty in the prediction of the surge height reduction. In the Bao regression model, the reduced surge height is traditionally taken as a function of the initial wave height, tree density, tree height, and canopy coverage. The uncertainty of the initial wave height factor was 1%, and that of the tree height was 2%.
4. Discussion
Overall, the findings of this study agree with the common conception that mangroves and coastal vegetation can significantly decrease the susceptibility of adjacent coastal areas to storm surge waves. As expected, the results of this study delineated the area that will receive advantages in storm surge height reduction from the Pandanus. Blankespoor, B. et al. (2017) [30] reported that the degree of storm surge reduction by mangroves varies between countries, owing to differences in the extent of mangroves, the original height of the storm surge, and the elevation of the associated areas, and they found that mangroves reduce the wave-affected area by less than 10% in Bangladesh. The findings of this study show that a 3.885 m surge will be reduced to 3.58 m behind the Pandanus band, using the data from 2021; this indicates a nearly 7.9% reduction.
Tanaka (2008) [26] stated that during Cyclone Sidr in Bangladesh in November 2007, the 150 m band of the riverside vegetation neighboring Mathbaria may have caused a 0.5 to 1.0 m alteration in the water level (considering the effects of wind and swell waves) behind the trees. Menendez, P. et al. (2018) [28] reported a reduction in the flood height of more than 20% in the Philippines due to mangroves. Shuto (1987) [20] examined the effectiveness of tsunami control forests and found a reduction in the inundation depth behind the forest compared to the area not protected by the forest.
4.1. Land Use Changes on the Island
There was no erosion from 2010 to 2021. The inland waterbody increased in volume. Mangrove and coconut areas also increased. Vegetation, sands, and agriculture decreased. The built-up area was the same during the period of image analysis. In reality, the population of the island has increased, meaning there are now many newly built temporary houses. Most of these have been built with bamboo fences, wood, and materials from trees (mangroves, coconuts, etc.), rather than concrete. Therefore, in our image analysis, these houses did not appear as built-up areas and were classified as barren land, due to the overhead canopies of trees making it difficult to identify these houses as separate from vegetation. There are also paved roads around the islands for tourists, and these appeared clearly in the image analysis.
There are several areas of agricultural land, fallow land, domestic vegetation, wild bushland, and cultivated trees on this island. Agricultural practices have decreased as the occupations of the islanders have switched to fishing and work associated with tourism.
4.2. Pandanus Distribution on the Island
The area of Pandanus trees increased 3.4-fold in the period 2010–2021. According to Tomascik (1997) [13], the Pandanus population has been reduced, which has caused the erosion of dunes and local beaches. Tomascik also reported that in this process, the entire tree is removed, along with its roots, and the root removal causes the destabilization of dune sediments and beaches, which might undermine the current efforts to conserve the Pandanus trees.
The NGO Poush has facilitated the conservation and plantation of Pandanus trees over the years, and during the last ten years, the total number of trees has increased.
4.3. Evaluation of Pandanus Trees against Storm Surge
Without any Pandanus trees, the maximum surge height could inundate the narrow part of the island and interrupt evacuations to the cyclone shelter, which is situated in the wider part of the island. The southern coastline of the island will also experience frequent flooding in many places. In the scenario based on 2010, with the presence of a limited amount of small and newly planted Pandanus trees, the 3885 m surge height is reduced to 3.75 m. In this scenario, as the Pandanus forest is in decline due to human destruction, and the newly planted plants are too small with little canopy coverage, they are not effective in protecting the island from the surge. In this scenario, the degree of flooding in the inland waterbody will be decreased. The southern coastline will also be flooded, but to a lesser extent. In the scenario based on 2021, the 3.885 m surge is reduced to 3.58 m with the presence of more Pandanus trees than in 2010, and this will ultimately submerge 0.92 km2 (26.7%) of the island (Figure 9). Here, the newly planted Pandanus trees are mature, and the canopy is higher (Figure 8). The patch width is also increased. Though there is some human-made destruction, the trees present in 2021 reduce the effect of a 3885 m surge (Figure 7 and Figure 10). The inland waterbody in the northern part will be flooded, but less so (Figure 7 and Figure 10). The flooding in the southern area will be reduced, and the southern coastline will be flooded to a lesser extent. The middle narrow part will also be flooded, but the overall flooded area will be reduced.
From the flood analysis, the most vulnerable area was identified as the middle narrow part of the island. The other most vulnerable area is the southwestern part, which is the tortoise breeding and nesting area. The next most vulnerable area is the low-lying northeastern side. There are many household structures here, and there is a high probability of this area being flooded.
The historic data identify the safe wave height as 3.2 m, and the required minimum patch width of Pandanus trees was calculated to be 4.53 m. The existing width of Pandanus trees (2.8 m) is not sufficient and must be increased by 1.73 m to protect the island from cyclonic storm surges.
4.4. Imminent Research Requirements and Directions
Much more research is required to improve our understanding of the role of Pandanus trees and mangroves in storm surge reduction. Further investigations of water levels and flood extents in coastal vegetation areas during storm surges are essential to confirm numerical storm surge models. On the other hand, different types of coastal vegetation, and mangroves with different vegetation indices and structures, may affect storm surge height reduction rates. Data on the different geographical locations of coastal vegetation and mangroves, and their particular characteristics, should be incorporated into the numerical models. The effects of coastal vegetation and mangroves on wave height reduction during storm surge situations are hypothetically huge, but the current understanding of this has been derived entirely from numerical models. Another important factor is wind. It is extremely difficult to directly quantify the effects of vegetation-induced wind speed reductions (and associated surge height reductions) because the effects of reduced wind speeds cannot be separated from other factors, such as the drag on the water flow caused by the vegetation. Proper research is required to determine the effects of wind speed reduction caused by Pandanus trees and mangroves, and how these reduced wind speeds could reduce storm surge heights.
4.5. Limitations
Pandanus trees could be classified as a separate class in the image analysis. Very high resolution images were required for this, and the available sources could not offer high-quality images for the earlier period (2010). A GPS survey aided the detection of Pandanus in 2021, and an approximate Pandanus area was inferred, which might not reflect the actual condition. However, the machine learning process can help to clarify this, and thus it should be considered for use in future research on the same topic. The literature has proven that corals can significantly reduce wave heights. The combined effects of corals and tree barriers might help to produce an even more resilient Eco-DRR system. Detailed data on corals are not available for the study area. Additionally, the record of cyclone surge heights is incomplete for the study area. Some research has been conducted on Eco-DRR and wave attenuation in Bangladesh; however, there is no specific research on Pandanus trees. This is the first attempt to fill this gap, meaning there was no straightforward formula available to measure the degree of wave attenuation by Pandanus trees.
5. Conclusions
The land use changes and changes in the area of Pandanus trees from 2010 to the present (2021) were determined using image analysis on Saint Martin’s Island, Bangladesh, in order to infer the role Pandanus trees play in reducing the storm surge height during disasters. The combined area of Pandanus and coconut trees increased 2-fold between 2010 and 2021, while the area of Pandanus trees alone increased 3.4-fold during the period. Suitable land uses and the areas that must be protected have been suggested in this study. We found that Pandanus trees could reduce the surge height, which also reduces the area that will be inundated. The trees will protect almost 75% of the area of Saint Martin’s Island from a surge height of 3.885 m. High-elevation land should be used for all necessary infrastructure and for general use. The southwestern part of the island has no buffer forest and is extremely vulnerable to storm surges. A buffer belt of Pandanus trees is strongly recommended in this area. Pandanus trees are very effective at protecting the island from cyclonic storm surges and other disasters. They are also very beneficial to the environment and propagate easily. Given their natural benefits and disaster reduction effects, along with being very inexpensive to install and maintain, Pandanus trees are highly recommended as a means of Eco-DRR in the coastal areas and islands of Bangladesh.
Supplementary Materials
The following supporting information can be downloaded at: https://www.mdpi.com/article/10.3390/w14111781/s1, Video S1: Flood animation of the study area.
Author Contributions
Conceptualization, T.M.; methodology, S.K.; software, S.K.; validation, S.K.; formal analysis, S.K.; investigation, T.M.; resources, T.M.; writing—original draft preparation, S.K.; writing—review and editing, T.M. and Y.S.; supervision, T.M. and Y.S.; project administration, Y.S. All authors have read and agreed to the published version of the manuscript.
Funding
This research received no external funding.
Institutional Review Board Statement
Not Applicable.
Informed Consent Statement
Not Applicable.
Data Availability Statement
Not applicable.
Acknowledgments
Special thanks to Abu Sayeed Muhammad Sharif (Senior Scientific Officer, Biological Oceanography Division (Ministry of Science and Technology), Bangladesh Oceanographic Research Institute, Ramu, Cox’s Bazar—4730) for the GPS survey of the Pandanus trees on the island. The authors also give their heartiest thanks to the Bangladesh Meteorological Department (BMD) for providing the historical cyclone data.
Conflicts of Interest
The authors declare no conflict of interest.
Appendix A
Accuracy assessment calculations of Landuse, 2021 and Landuse, 2010
Accuracy Assessment Calculation
2021 Landuse

Table A1.
Error Matrix of Landuse classification of 2021.
| 2021 | Barren Lands | Vegetations | Built Up Areas | Water | Sand | Tree | Total |
|---|---|---|---|---|---|---|---|
| Barren Lands | 4 | 1 | 0 | 0 | 0 | 0 | 5 |
| Vegetations | 2 | 6 | 0 | 0 | 0 | 0 | 8 |
| Built up Areas | 3 | 0 | 10 | 0 | 0 | 0 | 13 |
| Water | 1 | 0 | 0 | 5 | 0 | 0 | 6 |
| Sand | 0 | 0 | 0 | 0 | 7 | 0 | 7 |
| Tree | 0 | 0 | 0 | 0 | 0 | 11 | 11 |
| Total | 10 | 7 | 10 | 5 | 7 | 11 | 50 |
User Accuracy Calculation
Barren Lands = (4/5) × 100 = 80%
Vegetations = (6/8) × 100 = 75%
Built up Areas = (10/13) × 100 = 77%
Water = (5/6) × 100 = 83%
Sand = (7/7) × 100 = 100%
Tree = (11/11) × 100 = 100%
Producer Accuracy Calculation
Barren Lands = (4/10) × 100 = 40%
Vegetations = (6/7) × 100 = 86%
Built up Areas = (10/10) ×100 = 100%
Water = (5/5) × 100 = 100%
Sand = (7/7) × 100 = 100%
Tree = (11/11) × 100 = 100%
Here, TS = Total Sample = 50
2010 Landuse
Table A2.
Error Matrix of Landuse classification of 2010.
| 2010 | Barren Lands | Vegetations | Built Up Areas | Water | Sand | Tree | Total |
|---|---|---|---|---|---|---|---|
| Barren Lands | 5 | 0 | 0 | 0 | 0 | 2 | 7 |
| Vegetations | 0 | 2 | 0 | 0 | 0 | 0 | 2 |
| Built up Areas | 1 | 0 | 4 | 1 | 3 | 1 | 10 |
| Water | 1 | 0 | 0 | 3 | 2 | 0 | 6 |
| Sand | 1 | 0 | 0 | 0 | 10 | 0 | 11 |
| Tree | 1 | 0 | 0 | 0 | 0 | 13 | 14 |
| Total | 9 | 2 | 4 | 4 | 15 | 16 | 50 |
User Accuracy Calculation
Barren Lands = (5/7) × 100 = 71%
Vegetations = (2/2) × 100 = 100%
Built up Areas = (4/10) × 100 = 40%
Water = (3/6) × 100 = 50%
Sand = (10/11) × 100 = 91%
Tree = (13/14) × 100 = 93%
Producer Accuracy Calculation
Barren Lands = (5/9) × 100 = 56%
Vegetations = (2/2) × 100 = 100%
Built up Areas = (4/4) ×100 = 100%
Water = (3/4) × 100 = 75%
Sand = (10/15) × 100 = 67%
Tree = (13/16) × 100 = 81%
Here, TS = Total Sample = 50
BMD Cyclone data with surge heights.
GOVERNMENT OF THE PEOPLE’S REPUBLIC OF BANGLADESH BANGLADESH METEOROLOGICAL DEPARTMENT METEOROLOGICAL COMPLEX,
E-24 AGARGAON, DHAKA-1207.
E-Mail: [email protected]
Table A3.
List of Major Cyclonic Storms from 1960 to 2019.
| Date of Occurrence | Nature of Phenomenon | Landfall Area | Maximum Wind Speed in km/hr. | Direction of the Max. Wind Speed | Tidal Surge Height in ft. | Central Pressure (mbs) |
|---|---|---|---|---|---|---|
| 11.10.60 | Severe Cyclonic Storm | Chittagong | 160 | South-East | 15 | - |
| 31.10.60 | Severe Cyclonic Storm | Chittagong | 193 | South-East | 20 | - |
| 09.05.61 | Severe Cyclonic Storm | Chittagong | 160 | South-East | 8–10 | - |
| 30.05.61 | Severe Cyclonic Storm | Chittagong (Near Feni) | 160 | South-South-East | 6–15 | - |
| 28.05.63 | Severe Cyclonic Storm | Chittagong-Cox’s Bazar | 209 | South-East | 8–12 | - |
| 11.05.65 | Severe Cyclonic Storm | Chittagong-Barisal Coast | 160 | South-South-East | 12 | - |
| 05.11.65 | Severe Cyclonic Storm | Chittagong | 160 | South-East | 8–12 | - |
| 15.12.65 | Severe Cyclonic Storm | Cox’s Bazar | 210 | South-East | 8–10 | - |
| 01.11.66 | Severe Cyclonic Storm | Chittagong | 120 | South-East | 20–22 | - |
| 23.10.70 | Severe Cyclonic Storm with Hurricane intensity | Khulna-Barisal | 163 | South-West | - | - |
| 12.11.70 | Severe Cyclonic Storm with a core of hurricane wind | Chittagong | 224 | South-East | 10–33 | - |
| 28.11.74 | Severe Cyclonic Storm | Cox’s Bazar | 163 | South-East | 9–17 | - |
| 10.12.81 | Cyclonic Storm | Khulna | 120 | South-West | 7–15 | 989 |
| 15.10.83 | Cyclonic Storm | Chittagong | 93 | South-East | - | 995 |
| 09.11.83 | Severe Cyclonic Storm | Cox’s Bazar | 136 | South-East | 5 | 986 |
| 24.05.85 | Severe Cyclonic Storm | Chittagong | 154 | South-East | 15 | 982 |
| 29.11.88 | Severe Cyclonic Storm with a core of hurricane wind | Khulna | 160 | South-West | 2–14.5 | 983 |
| 18.12.90 | Cyclonic Storm (crossed as a depression) | Cox’s Bazar Coast | 115 | South-East | 5–7 | 995 |
| 29.04.91 | Severe Cyclonic Storm with a core of hurricane wind | Chittagong | 225 | South-East | 12–22 | 940 |
| 02.05.94 | Severe Cyclonic Storm with a core of hurricane wind | Cox’s Bazar-Teknaf Coast | 220 | South-East | 5–6 | 948 |
| 25.11.95 | Severe Cyclonic Storm | Cox’s Bazar | 140 | South-East | 10 | 998 |
| 19.05.97 | Severe Cyclonic Storm with a core of hurricane wind | Sitakundu | 232 | South-East | 15 | 965 |
| 27.09.97 | Severe Cyclonic Storm with a core of hurricane wind | Sitakundu | 150 | South-South-East | 10–15 | - |
| 20.05.98 | Severe Cyclonic Storm with core of hurricane winds | Chittagong Coast near Sitakunda | 173 | South-South-East | 3 | |
| 28.10.00 | Cyclonic Storm | Sundarban Coast near Mongla | 83 | South-South-West | - | - |
| 12.11.02 | Cyclonic Storm | Sundarban Coast near Raimangal River | 65–85 | South-South-West | 5–7 | 998 |
| 19.05.04 | Cyclonic Storm | Teknaf-Akyab Coast | 65–90 | South-East | 2–4 | 990 |
| 15.11.07 | Severe Cyclonic Storm with core of hurricane winds (SIDR) | Khulna-Barisal Coast near Baleshwar river | 223 | South-West | 15–20 | 942 |
| 25.05.09 | Cyclonic Storm (AILA) | West Bengal-Khulna Coast near Sagar Island | 70–90 | South-South-West | 4–6 | 987 |
| 16.05.13 | Cyclonic Storm (MAHASEN) | Noakhali-Chittagong Coast | 100 | South-South-East | - | - |
| 30.07.15 | Cyclonic Storm (KOMEN) | Chittagong-Cox’s Bazar Coast | 65 | South-East | 5–7 | 988 |
| 21.05.16 | Cyclonic Storm (ROANU) | Barisal-Chittagong Coast near Patenga | 128 | West-South-West | 4–5 | 992 |
| 30.05.17 | Severe Cyclonic Storm (MORA) | Chittagong-Cox’s Bazar Coast near Kutubdia | 146 | South-East | - | - |
| 04.05.19 | Very Severe Cyclonic Storm (FANI) | Odisha Coast of India, then moved towards Bangladesh | 81 | South-South-West | - | - |
| 10.11.19 | Very Severe Cyclonic Storm (BULBUL) | Sagar Island of India, then moved towards Bangladesh | 91 | South-South-West | 3–5 | - |
Frequency and Return Period Calculation
Table A4.
Frequency of Landfalling Cyclones of Bangladesh (1877–2020).
| Months | No of Incidences |
|---|---|
| January | 0 |
| February | 0 |
| March | 0 |
| April | 3 |
| May | 27 |
| June | 17 |
| July | 11 |
| August | 10 |
| September | 7 |
| October | 28 |
| November | 22 |
| December | 6 |
| Total | 131 |
Figure A1.
Frequency of Landfalling Cyclones of Bangladesh (1877–2020).

References
- Alam, M.S.; Mikhailovna, R.O.; Vasilevich, G.V. The Aftermath of Natural Disasters in Bangladesh and a Proposal to Minimise Casualty. ICTACT J. Manag. Stud. 2020, 6, 1166–1169. [Google Scholar]
- Choudhury, A.M. Managing natural disasters in Bangladesh. In Proceedings of the Dhaka Meet on Sustainable Development in Bangladesh: Achievements, Opportunities and Challenges at Rio, Rio de Janeiro, Brazil, 16–18 March 2002; pp. 16–18. [Google Scholar]
- Rahman, M.H.; Rahman, M.S.; Rahman, M.M. Disasters in Bangladesh: Mitigation and Management. Barisal Univ. J. Part 2017, 4, 139–163. [Google Scholar]
- Islam, S.M.D.; Bhuiyan, M.A.H. Exploring climate change adaptation in coastal communities of Bangladesh using Adaptation Capability Index (ACI). Jahangirnagar Univ. Environ. Bull. 2016, 5, 11–23. [Google Scholar] [CrossRef] [Green Version]
- Panthi, J.; Aryal, S.; Dahal, P.; Bhandari, P.; Krakauer, N.Y.; Pandey, V.P. Livelihood vulnerability approach to assessing climate change impacts on mixed agro-livestock smallholders around the Gandaki River basin in Nepal. Reg. Environ. Chang. 2016, 16, 1121–1132. [Google Scholar] [CrossRef]
- Simotwo, H.K.; Mikalitsa, S.M.; Wambua, B.N. Climate change adaptive capacity and smallholder farming in trans-Mara East sub-County, Kenya. Geoenviron. Disasters 2018, 5, 5. [Google Scholar] [CrossRef] [Green Version]
- Raper, S.C.B. Observational data on the relationships between climatic change and the frequency and magnitude of severe tropical storms. In Climate and Sea Eve Change: Observations, Projections and Impications; Warrick, R.A., Barrow, E.M., Wigey, T.M., Eds.; Cambridge University Press: Cambridge, UK, 1993; pp. 192–212. [Google Scholar]
- Jooley, M.; Howes, D.D. Coastal and sea level changes, storms and floods. In Disaster and the Silent Gender. Contemporary Studies in Geography; Bangladesh Geographical Society: Dhaka, Bangladesh, 2004. [Google Scholar]
- Dasgupta, S.; Huq, M.; Khan, Z.H.; Ahmed, M.M.Z.; Mukherjee, N.; Khan, M.F.; Pandey, K. Cyclones in a changing climate: The case of Bangladesh. Clim. Dev. 2014, 6, 96–110. [Google Scholar] [CrossRef]
- Thomson, L.A.; Englberger, L.; Guarino, L.; Thaman, R.R.; Elevitch, C.R. Pandanus tectorius (Pandanus). In Species Profiles for Pacific Island Agroforestry, version 1.1; Permanent Agriculture Resources: Holualoa, Hawaii, 2006; p. 28. [Google Scholar]
- Molony, L.A. National Project Professional Personnel. In St. Martin’s Island ECA Conservation Management Plan, Coastal and Wetland Biodiversity Management Project; Department of Environment: Dhaka, Bangladesh, 2006. [Google Scholar]
- DoE. The Fifth National Report of Bangladesh to the Convention on Biological Diversity; Department of Environment, Ministry of Environment and Forests, Government of the People’s Republic of Bangladesh: Dhaka, Bangladesh, 2015; 50p. [Google Scholar]
- Tomascik, T. Management Plan for coral resources of Narikel Jinjira (St. Martin’s Island). In National Conservation Strategy Implementation Project-1; Ministry of Environment and Forest: Dhaka, Bangladesh, 1997. [Google Scholar]
- MoEF. Survey of Flora. In National Conservation Strategy Implementation Project-1; Ministry of Environment and Forests: Dhaka, Bangladesh, 2001. [Google Scholar]
- Rani, S.; Ahmed, M.K.; Xiongzhi, X.; Yuhuan, J.; Keliang, C.; Islam, M.M. Economic valuation and conservation, restoration & management strategies of Saint Martin’s coral island, Bangladesh. Ocean. Coast. Manag. 2020, 183, 105024. [Google Scholar]
- IPCC. Climate Change 2013: The Physical Science Basis. In Contribution of Working Group I to the Fifth Assessment Report of the Intergovernmental Panel on Climate Change; IPCC: Geneva, Switzerland, 2013. [Google Scholar]
- BOBLME. Survey of St. Martin’s Island: Summary Report of Resource and Socio-Economic Information; BOBLME-2015-Socioec-15; IUCN: Gland, Switzerland, 2015. [Google Scholar]
- Ahmed, M. An overview on the coral reef ecosystem of Bangladesh. Bangladesh J. Environ. Sci. 1995, 1, 67–73. [Google Scholar]
- Khan, M.A.R. St. Martin, a vanishing coral island of Bangladesh. Tigerpaper 1985, 12, 6–12. [Google Scholar]
- Islam, M.S. Participatory action research for habitat conservation of coral community. In Coastal and Wetland Biodiversity Management Project (CWBMP); Department of Environment (DoE), Government of the People’s Republic of Bangladesh: Dhaka, Bangladesh, 2008. [Google Scholar]
- Doswald, N.; Munroe, R.; Roe, D.; Giuliani, A.; Castelli, I.; Stephens, J.; Möller, I.; Spencer, T.; Vira, B.; Reid, H. Effectiveness of ecosystem-based approaches for adaptation: Review of the evidence-base. Clim. Dev. 2014, 6, 185–201. [Google Scholar] [CrossRef]
- Shuto, N. The effectiveness and limit of tsunami control forests. Coast. Eng. Jpn. 1987, 30, 143–153. [Google Scholar] [CrossRef]
- Tsuji, Y.; Imamura, F.; Matsutomi, H.; Synolakis, C.E.; Nanang, P.T.; Harada, S.; Han, S.S.; Arai, K.I.; Cook, B. Field survey of the East Java earthquake and tsunami. Pageoph 2003, 144, 839–854. [Google Scholar] [CrossRef]
- Synolakis, C.E.; Bardet, J.P.; Borrero, J.C.; Davies, H.L.; Okal, E.A.; Silver, E.A.; Sweet, S.; Tappin, D.R. The slump origin of the 1998 Papua New Guinea tsunami. Proc. R. Soc. London. Ser. A Math. Phys. Eng. Sci. 2002, 458, 763–789. [Google Scholar] [CrossRef]
- Lynett, P.J.; Borrero, J.C.; Liu, P.L.F.; Synolakis, C.E. Field survey and numerical simulations: A review of the 1998 Papua New Guinea tsunami. In Landslide Tsunamis: Recent Findings and Research Directions; Springer: Berlin/Heidelberg, Germany, 2003; pp. 2119–2146. [Google Scholar]
- Danielsen, F.; Sørensen, M.K.; Olwig, M.F.; Selvam, V.; Parish, F.; Burgess, N.D.; Hiraishi, T.; Karunagaran, V.M.; Rasmussen, M.S.; Hansen, L.B.; et al. The Asian tsunami: A protective role for coastal vegetation. Science 2005, 310, 643. [Google Scholar] [CrossRef] [PubMed] [Green Version]
- Kathiresan, K.; Rajendran, N. Coastal mangrove forests mitigated tsunami. Estuar. Coast. Shelf Sci. 2005, 65, 601–606. [Google Scholar] [CrossRef]
- Tanaka, N.; Sasaki, Y.; Mowjood, M.I.M.; Jinadasa, K.B.S.N.; Homchuen, S. Coastal vegetation structures and their functions in tsunami protection: Experience of the recent Indian Ocean tsunami. Landsc. Ecol. Eng. 2007, 3, 33–45. [Google Scholar] [CrossRef]
- Mascarenhas, A.; Jayakumar, S. An environmental perspective of the post-tsunami scenario along the coast of Tamil Nadu, India: Role of sand dunes and forests. J. Environ. Manag. 2008, 89, 24–34. [Google Scholar] [CrossRef]
- Menéndez, P.; Losada, I.J.; Beck, M.; Torres-Ortega, S.; Espejo, A.; Narayan, S.; Díaz-Simal, P.; Lange, G.-M. Valuing the protection services of mangroves at national scale: The Philippines. Ecosyst. Serv. 2018, 34, 24–36. [Google Scholar] [CrossRef]
- Tanaka, N.; Jinadasa, K.B.S.N.; Mowjood, M.I.M.; Fasly, M.S.M. Coastal vegetation planting projects for tsunami disaster mitigation: Effectiveness evaluation of new establishments. Landsc. Ecol. Eng. 2011, 7, 127–135. [Google Scholar] [CrossRef]
- Blankespoor, B.; Dasgupta, S.; Lange, G.-M. Mangroves as a protection from storm surges in a changing climate. Ambio 2016, 46, 478–491. [Google Scholar] [CrossRef]
- Thuy, N.B.; Tanaka, N.; Tanimoto, K. Tsunami mitigation by coastal vegetation considering the effect of tree breaking. J. Coast. Conserv. 2012, 16, 111–121. [Google Scholar] [CrossRef]
- Narayan, S.; Beck, M.; Reguero, B.; Losada, I.J.; Van Wesenbeeck, B.; Pontee, N.; Sanchirico, J.N.; Ingram, J.C.; Lange, G.-M.; Burks-Copes, K.A. The Effectiveness, Costs and Coastal Protection Benefits of Natural and Nature-Based Defences. PLoS ONE 2016, 11, e0154735. [Google Scholar] [CrossRef] [PubMed] [Green Version]
- Ferrario, F.; Beck, M.W.; Storlazzi, C.D.; Micheli, F.; Shepard, C.C.; Airoldi, L. The effectiveness of coral reefs for coastal hazard risk reduction and adaptation. Nat. Commun. 2014, 5, 3794. [Google Scholar] [CrossRef] [PubMed]
- Pinsky, M.L.; Guannel, G.; Arkema, K.K. Quantifying wave attenuation to inform coastal habitat conservation. Ecosphere 2013, 4, 1–16. [Google Scholar] [CrossRef]
- Chowdhury, S.Q. St. Martin’s Island. Banglapedia the National Encyclopedia of Bangladesh. 2006. Available online: http://en.banglapedia.org/index.php?title=St_Martin%27s_Island (accessed on 14 September 2021).
- Kabir, S.M. Report on Soil Status and Rock and Sedimentations of St. Martin’s Island. In Conservation of Bio-Diversity, Marine Park Establishment and Ecotourism Development Project at St. Martin’s Island; Department of Environment: Dhaka, Bangladesh, 2006. [Google Scholar]
- MoEF. Survey of Fauna. In National Conservation Strategy Implementation Project-1; Ministry of Environment and Forests: Dhaka, Bangladesh, 2001. [Google Scholar]
- Islam, M.Z. St. Martin Pilot Project, National Conservation Strategy (NCS) Implementation Project-1, Final Report; Ministry of Environment & Forest, Government of the Peoples Republic of Bangladesh: Dhaka, Bangladesh, 2001. [Google Scholar]
- Poush. Land Use Survey Report. Coastal and Wetland Biodiversity Management Projects; Department of Environment: Dhaka, Bangladesh, 2006. [Google Scholar]
- Alam, S.M.M. St. Martins Island–A Tourist Paradise Has Landed in the Middle of the Ocean along the Bay of Bengal. Int. J. Econ. Bus. Manag. Res. 2018. ISSN 2456-7760. Available online: www.ijebmr.com (accessed on 13 August 2021).
- Hossain, M.S.; Chowdhury, S.R.; Rashed-Un-Nabi, M. Resource Mapping of Saint Martin’s Island using satellite image and ground observations. J. For. Environ 2007, 5, 23–36. [Google Scholar]
- Mas, J. Monitoring land-cover changes: A comparison of change detection techniques. Int. J. Remote Sens. 1999, 20, 139–152. [Google Scholar] [CrossRef]
- Xiao, H.; Weng, Q. The impact of land use and land cover changes on land surface temperature in a karst area of China. J. Environ. Manag. 2007, 85, 245–257. [Google Scholar] [CrossRef]
- Garcia, M.; Alvarez, R. TM digital processing of a tropical forest region in southern Mexico. Int. J. Remote Sens. 1994, 15, 1611–1632. [Google Scholar] [CrossRef]
- Rwanga, S.S.; Ndambuki, J.M. Accuracy assessment of land use/land cover classification using remote sensing and GIS. Int. J. Geosci. 2017, 8, 611. [Google Scholar] [CrossRef] [Green Version]
- Congalton, R.G.; Green, K. Assessing the Accuracy of Remotely Sensed Data: Principles and Practices; Lewis Publishers: Boca Raton, FL, USA, 1999. [Google Scholar]
- Bao, T.Q. Effect of mangrove forest structures on wave attenuation in coastal Vietnam. Oceanologia 2011, 53, 807–818. [Google Scholar]
- Selaman, O.S.; Said, S.; Putuhena, F.J. Flood frequency analysis for Sarawak using Weibull, Gringorten and L-moments formula. J. Inst. Eng. 2007, 68, 43–52. [Google Scholar]
- Akther, S.; Kayum, S.; Jahan, K.N.; Rokanuzzaman, S. Cyclone wind hazard assessment in coastal regions of Bangladesh. In Proceedings of the ICSBE-2012: International Conference on Sustainable Built Environment, Kandy, Sri Lanka, 14–16 December 2012. [Google Scholar]
- Macdonald, I.; Strachan, P. Practical application of uncertainty analysis. Energy Build. 2001, 33, 219–227. [Google Scholar] [CrossRef]
Figure 1.
(a) Location of Saint Martin’s Island. (b) Location of Pandanus trees on Saint Martin’s Island. (c) Pandanus patches are located in the colored part (b,c): ArcGIS Satellite Base Map (edited on 20 May 2022).
Figure 1.
(a) Location of Saint Martin’s Island. (b) Location of Pandanus trees on Saint Martin’s Island. (c) Pandanus patches are located in the colored part (b,c): ArcGIS Satellite Base Map (edited on 20 May 2022).

Figure 2.
Frequency of cyclones making landfall in the study area.

Figure 3.
Recurrence interval of cyclones making landfall in the study area.

Figure 4.
Land use map of Saint Martin’s Island in 2010 and 2021.

Figure 5.
(a) Land use of Saint Martin’s Island (2010–2021). (b) Land use changes in percentages (2010–2021).
Figure 5.
(a) Land use of Saint Martin’s Island (2010–2021). (b) Land use changes in percentages (2010–2021).

Figure 6.
(a) Pandanus tree distribution map of 2010. (b) Pandanus tree distribution map of 2021.

Figure 7.
Flooded areas: (a) without Pandanus trees; (b) with the Pandanus trees present in 2010; (c) with the Pandanus trees present in 2021.
Figure 7.
Flooded areas: (a) without Pandanus trees; (b) with the Pandanus trees present in 2010; (c) with the Pandanus trees present in 2021.

Figure 8.
(a) NDVI index of Saint Martin’s Island, 2010. (b) NDVI index of Saint Martin’s Island, 2021.
Figure 8.
(a) NDVI index of Saint Martin’s Island, 2010. (b) NDVI index of Saint Martin’s Island, 2021.

Figure 9.
Flooded areas in percentage for different surge heights.

Figure 10.
NDWI indices of the study area.

Table 1.
Description of land use types.
| Land Cover | Descriptions |
|---|---|
| Barren lands | Lands with visible soil, sand or rocks, and non-vegetated cover at any time of the year. |
| Vegetation | Lands covered with permanent and temporary crops, grass fields, and woody vegetation less than 2 m tall. |
| Built-up areas | Land covered by buildings and other human-made structures, roads, etc. |
| Water | Oceans, canals, wetlands, swamps, etc. |
| Sands | Sandy coastal beaches. |
| Trees | Lands with trees with a percentage of cover of >60% and a height exceeding 2 m, deciduous forest land, evergreen forest land, etc. |
Table 2.
Error matrix of land use classification for 2021.
| 2021 | Barren Lands | Vegetation | Built-Up Areas | Water | Sand | Tree | Total |
|---|---|---|---|---|---|---|---|
| Barren Lands | 4 | 1 | 0 | 0 | 0 | 0 | 5 |
| Vegetation | 2 | 6 | 0 | 0 | 0 | 0 | 8 |
| Built-up Areas | 3 | 0 | 10 | 0 | 0 | 0 | 13 |
| Water | 1 | 0 | 0 | 5 | 0 | 0 | 6 |
| Sand | 0 | 0 | 0 | 0 | 7 | 0 | 7 |
| Tree | 0 | 0 | 0 | 0 | 0 | 11 | 11 |
| Total | 10 | 7 | 10 | 5 | 7 | 11 | 50 |
Table 3.
Error matrix of land use classification for 2010.
| 2010 | Barren Lands | Vegetation | Built-Up Areas | Water | Sand | Tree | Total |
|---|---|---|---|---|---|---|---|
| Barren Lands | 5 | 0 | 0 | 0 | 0 | 2 | 7 |
| Vegetation | 0 | 2 | 0 | 0 | 0 | 0 | 2 |
| Built-up Areas | 1 | 0 | 4 | 1 | 3 | 1 | 10 |
| Water | 1 | 0 | 0 | 3 | 2 | 0 | 6 |
| Sand | 1 | 0 | 0 | 0 | 10 | 0 | 11 |
| Tree | 1 | 0 | 0 | 0 | 0 | 13 | 14 |
| Total | 9 | 2 | 4 | 4 | 15 | 16 | 50 |
Table 4.
Flooded and non-flooded areas with different surge heights and conditions.
| Condition | Surge Height (m) | Reduced Surge Heights (m) | Flooded Areas (km2) | Non-Flooded Areas (km2) |
|---|---|---|---|---|
| No Pandanus trees | 3.89 | 3.85 | 1.19 | 2.24 |
| Pandanus trees present in 2010 | 3.89 | 3.75 | 1.07 | 2.36 |
| Pandanus trees present in 2021 | 3.89 | 3.58 | 0.92 | 2.51 |
Publisher’s Note: MDPI stays neutral with regard to jurisdictional claims in published maps and institutional affiliations. |
© 2022 by the authors. Licensee MDPI, Basel, Switzerland. This article is an open access article distributed under the terms and conditions of the Creative Commons Attribution (CC BY) license (https://creativecommons.org/licenses/by/4.0/).
Share and Cite
MDPI and ACS Style
Kayum, S.; Shimatani, Y.; Minagawa, T. Evaluation of Pandanus Trees as a Means of Eco-DRR against Storm Surge Wave on Saint Martin’s Island, Bangladesh. Water 2022, 14, 1781. https://doi.org/10.3390/w14111781
AMA Style
Kayum S, Shimatani Y, Minagawa T. Evaluation of Pandanus Trees as a Means of Eco-DRR against Storm Surge Wave on Saint Martin’s Island, Bangladesh. Water. 2022; 14(11):1781. https://doi.org/10.3390/w14111781
Chicago/Turabian StyleKayum, Shakila, Yukihiro Shimatani, and Tomoko Minagawa. 2022. "Evaluation of Pandanus Trees as a Means of Eco-DRR against Storm Surge Wave on Saint Martin’s Island, Bangladesh" Water 14, no. 11: 1781. https://doi.org/10.3390/w14111781
Note that from the first issue of 2016, this journal uses article numbers instead of page numbers. See further details here.