
Experimental Investigation on Post-Peak Permeability Evolution Law of Saturated Sandstone under Various Cyclic Loading–Unloading and Confining Pressure

 , , , ,
Abstract
:1. Introduction
2. Experiment Materials and Methods
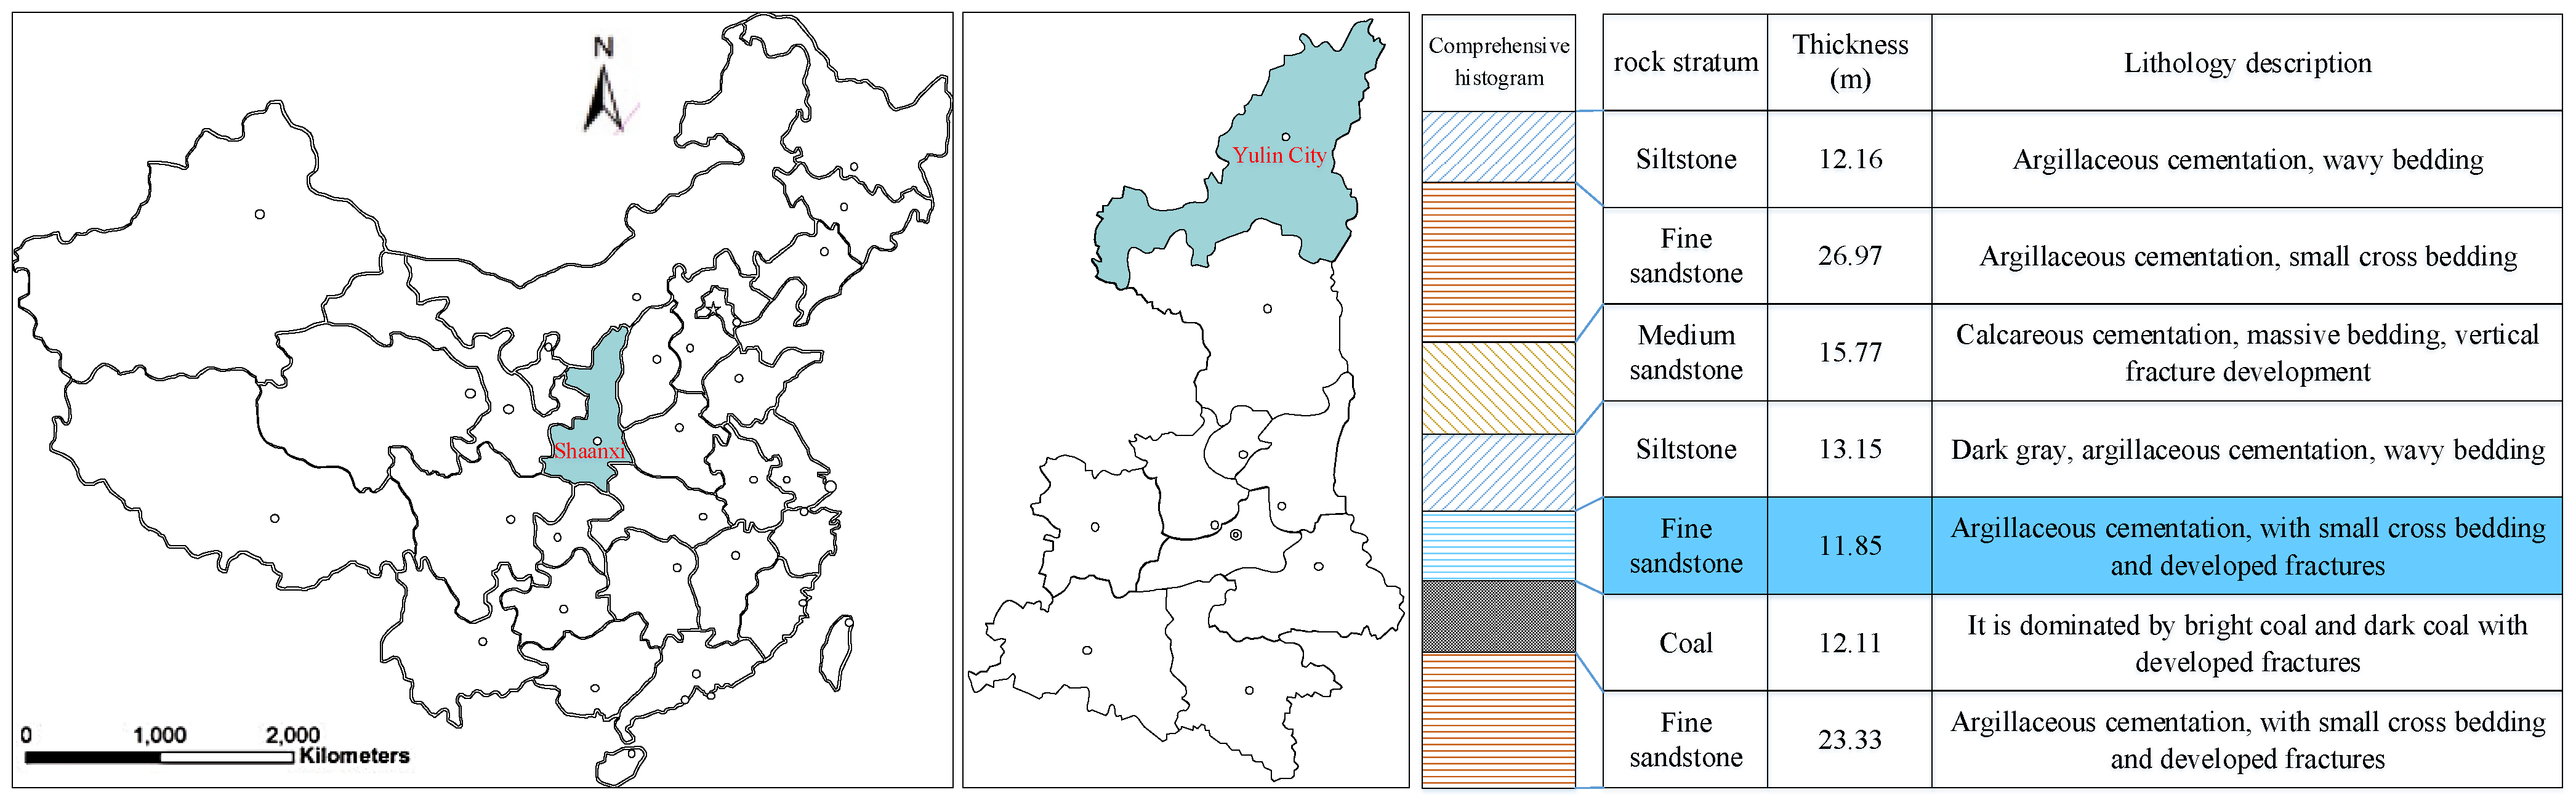
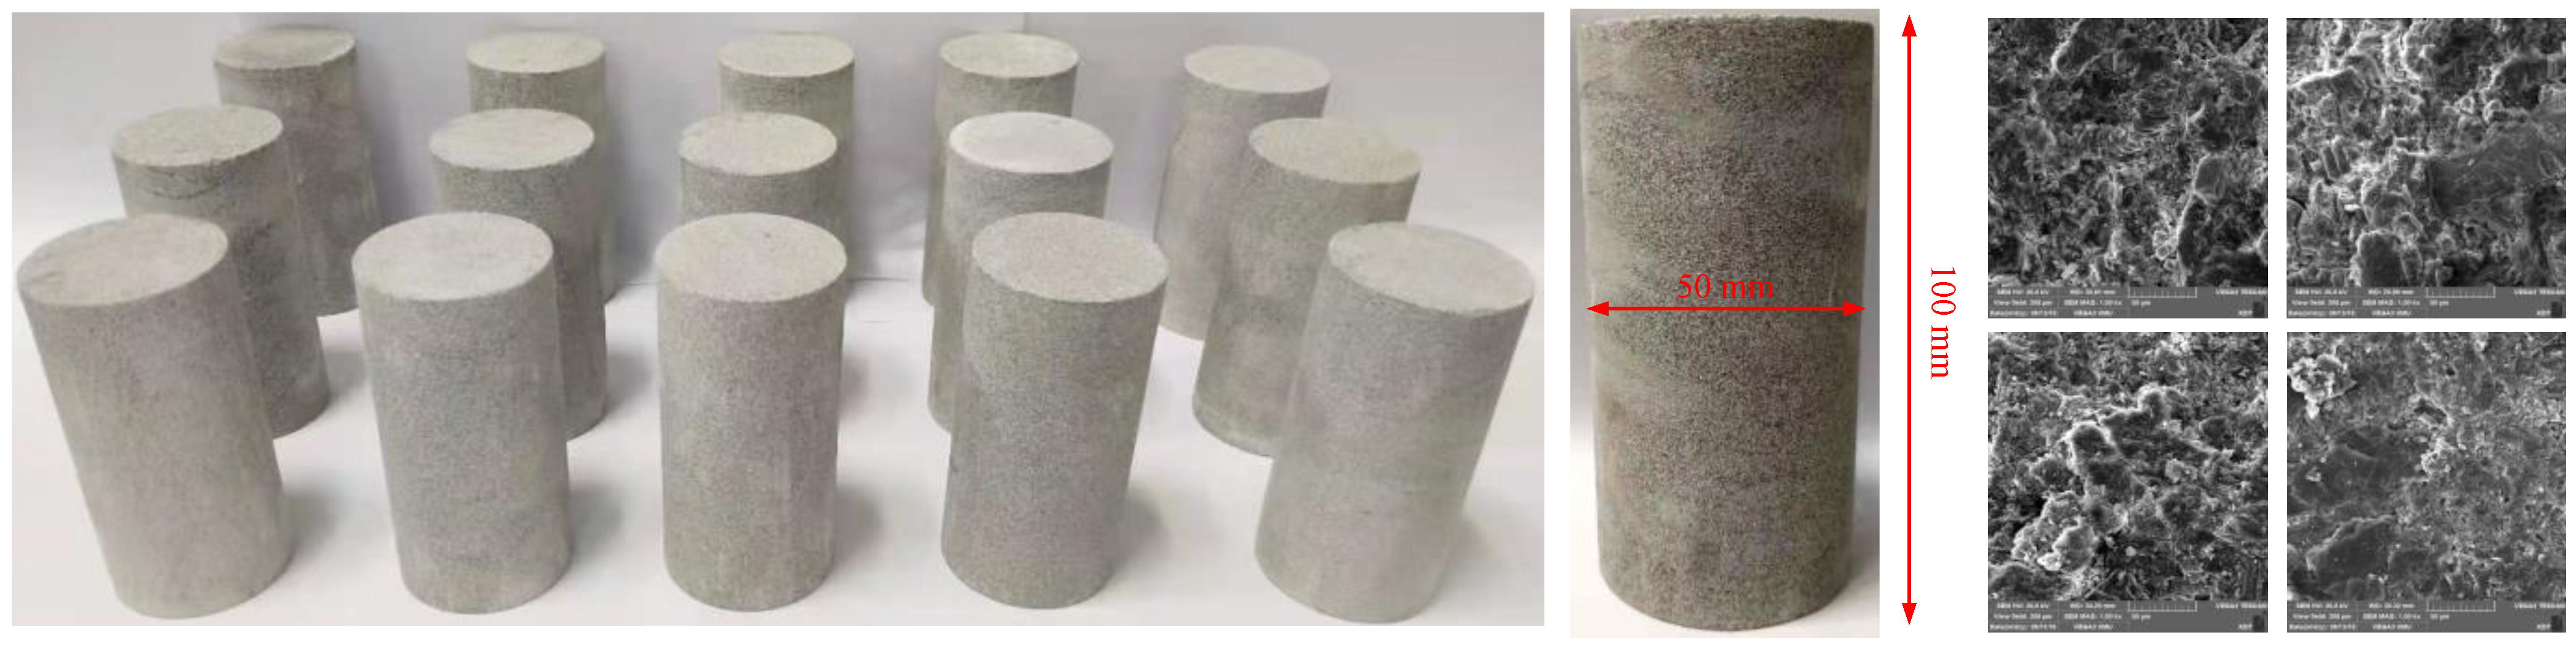
2.1. Sample Properties and Preparation
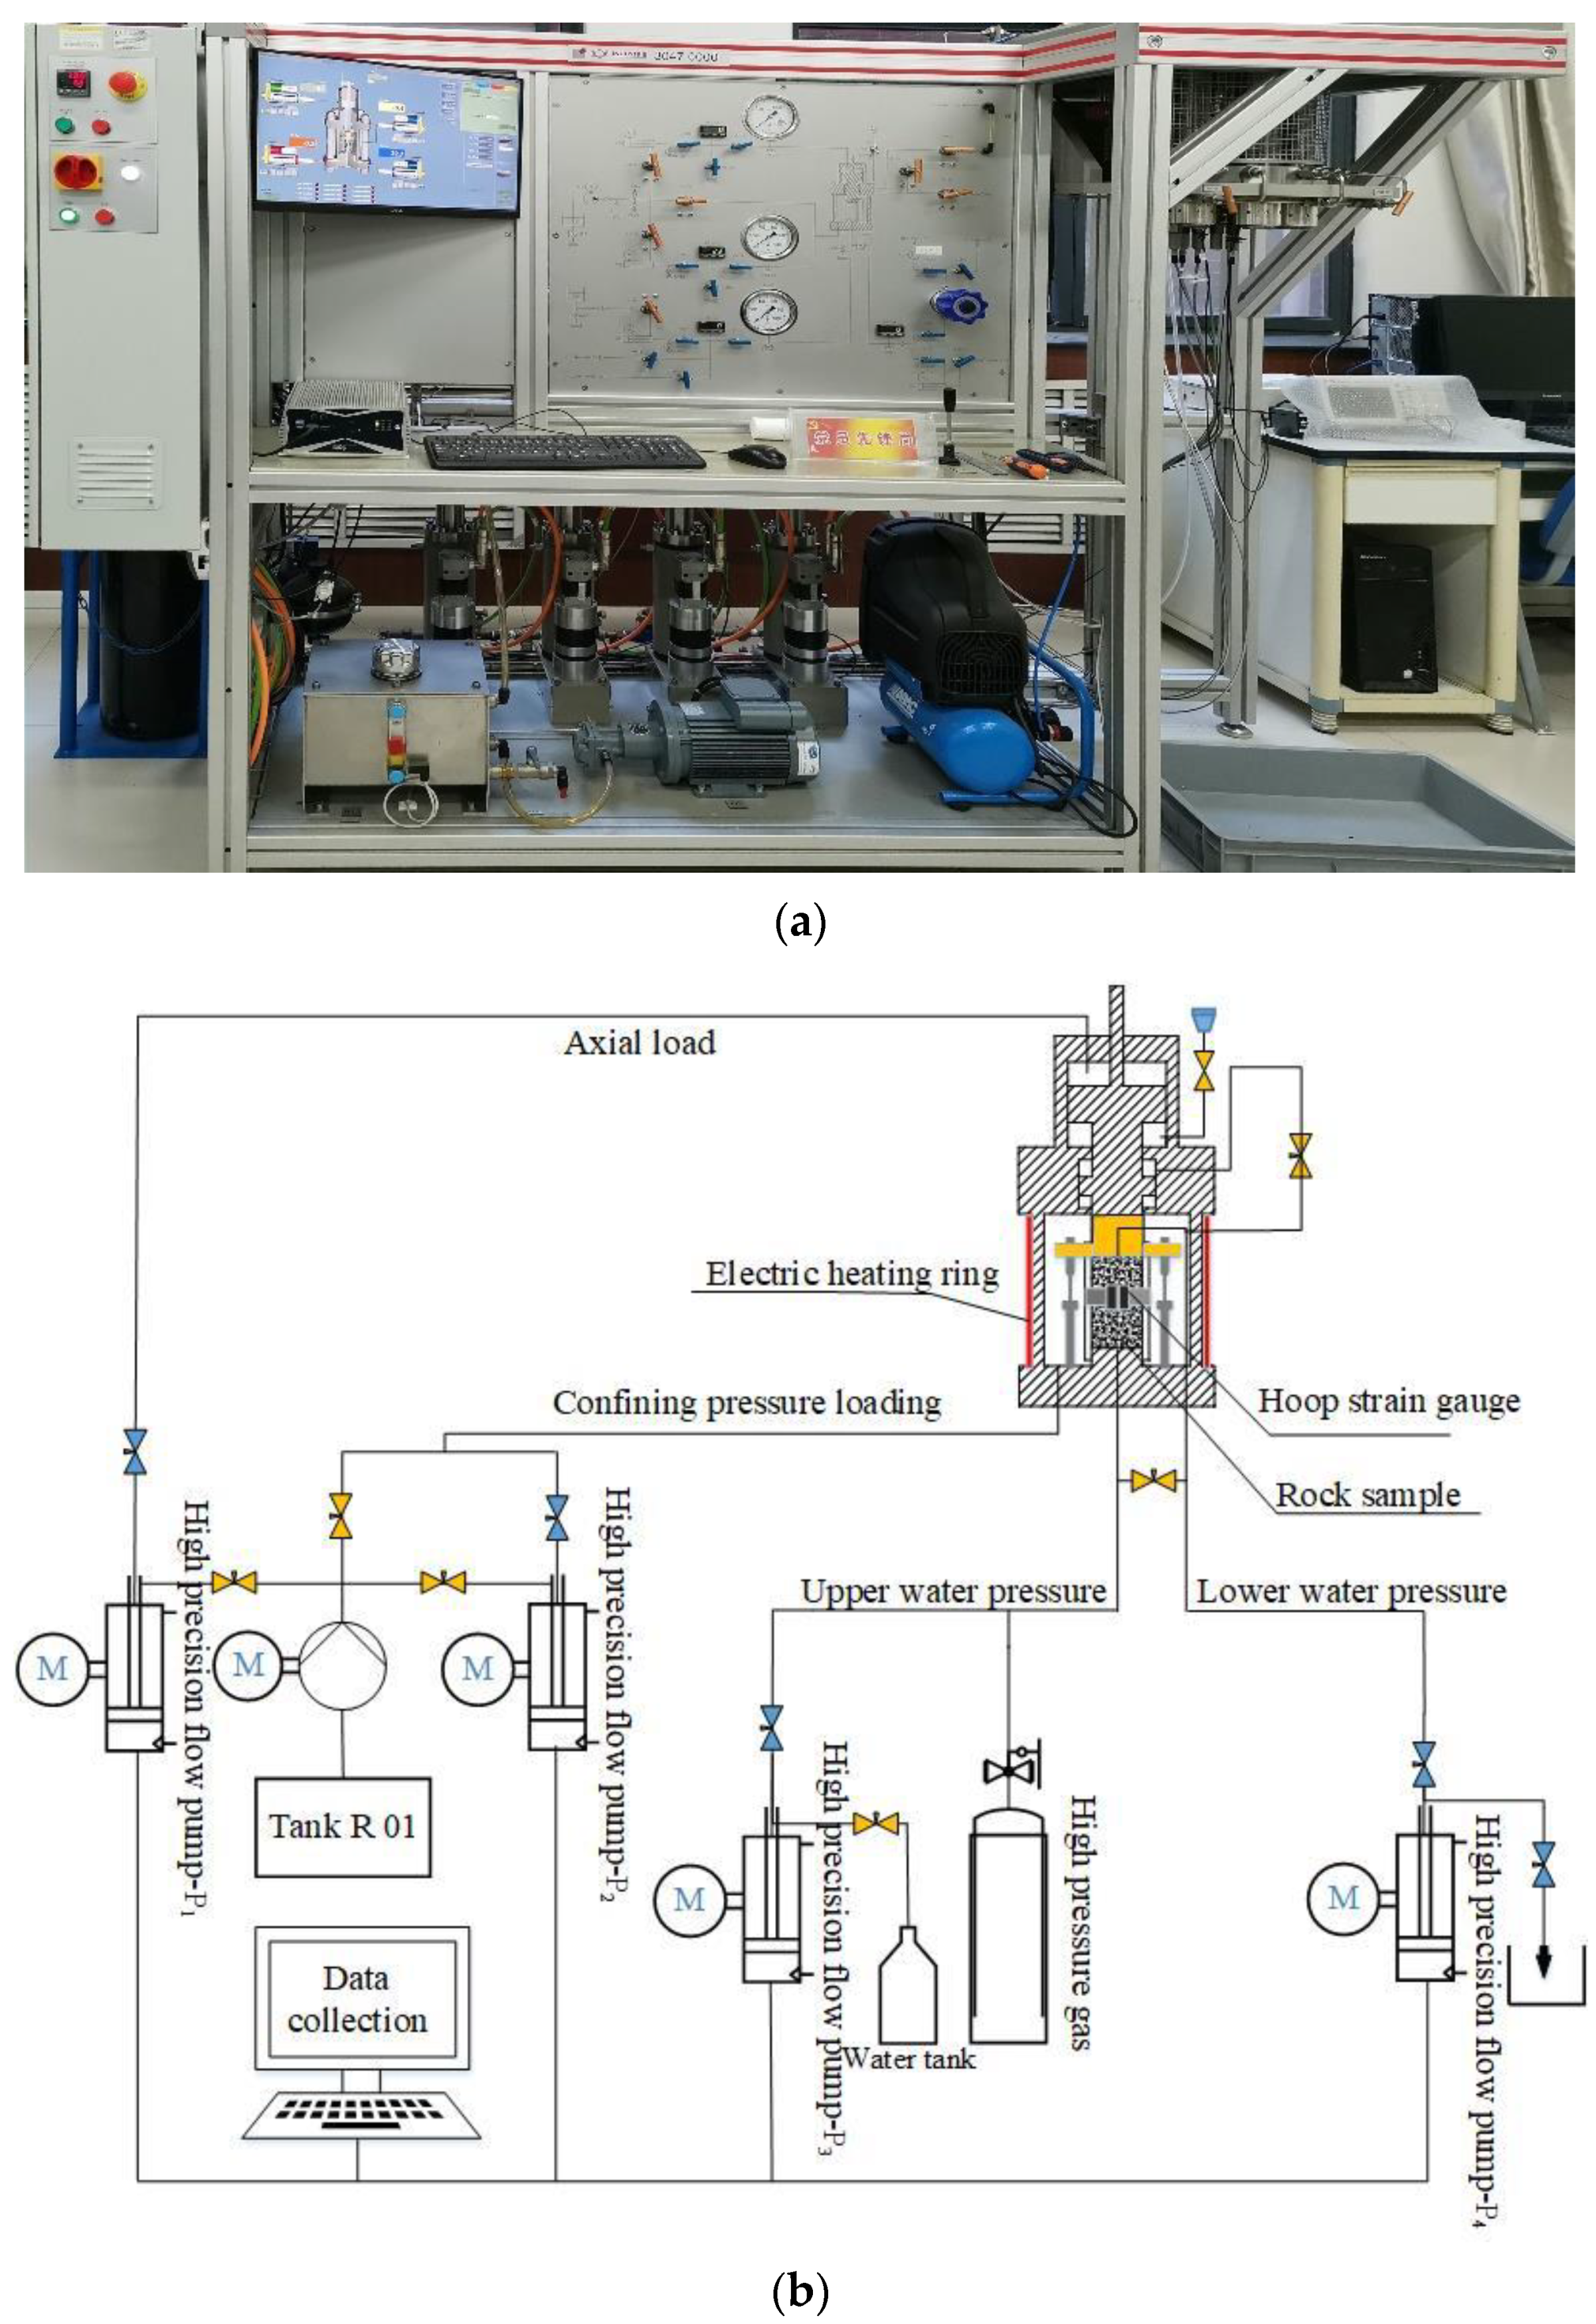
2.2. Test System and Principle
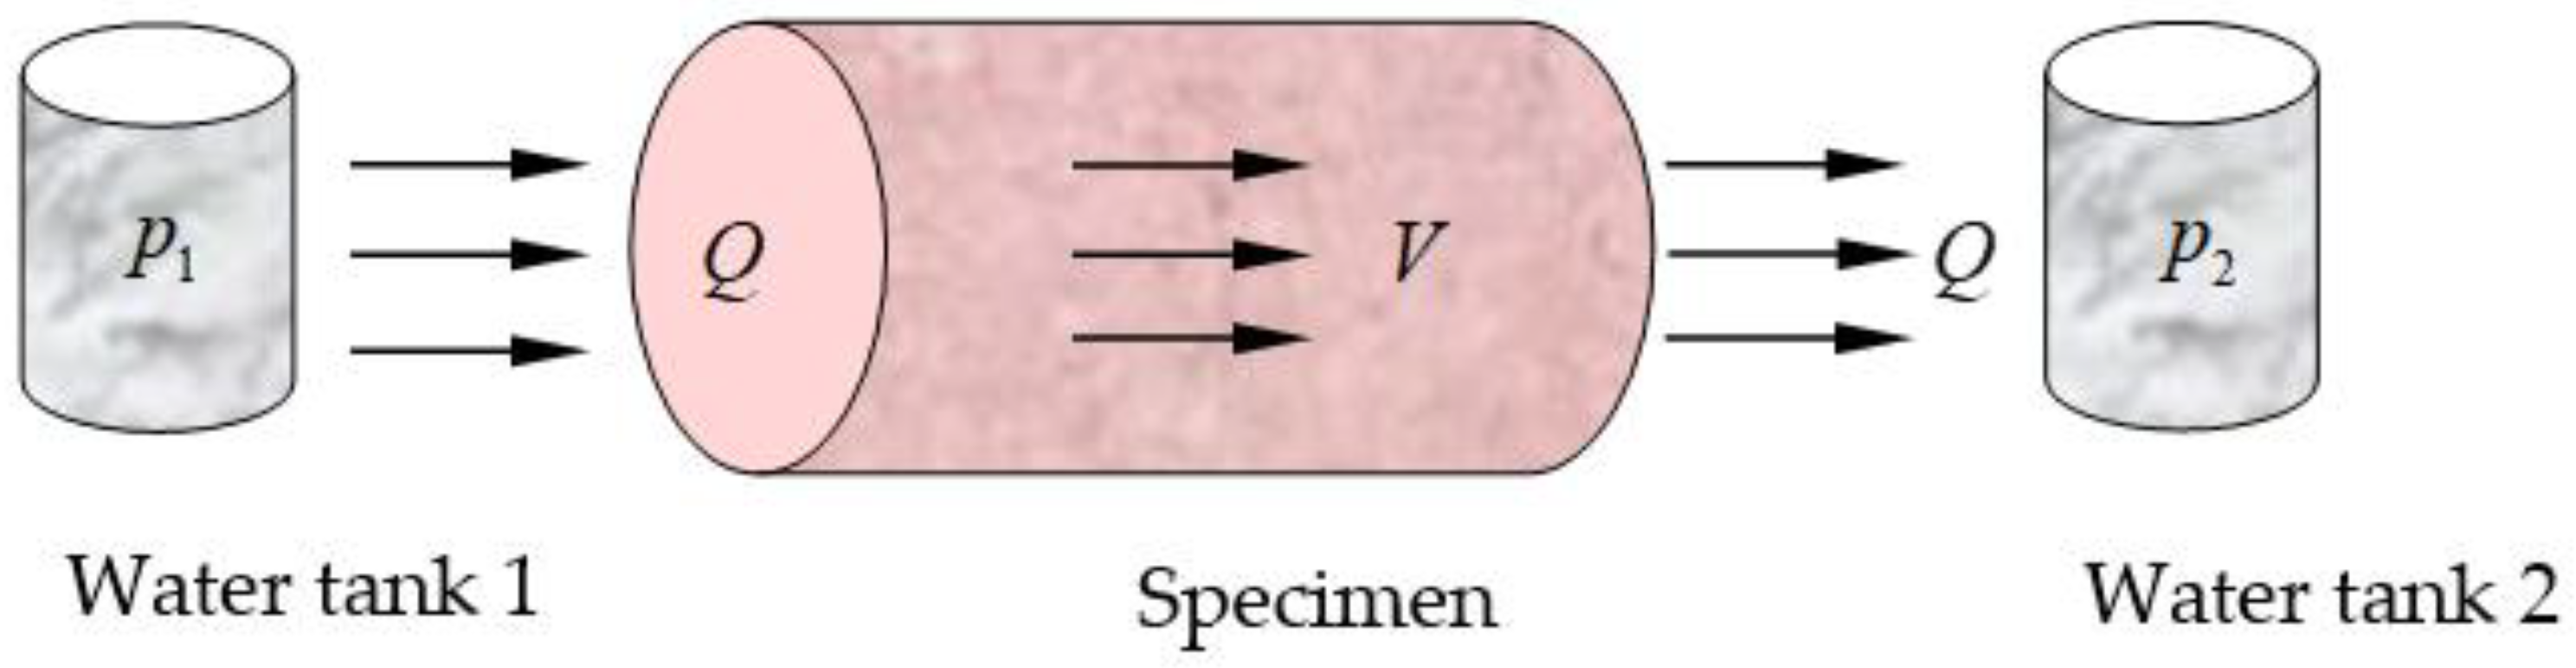
2.3. Principle of Calculating Sandstone Permeability Based on Non-Darcy’s Law
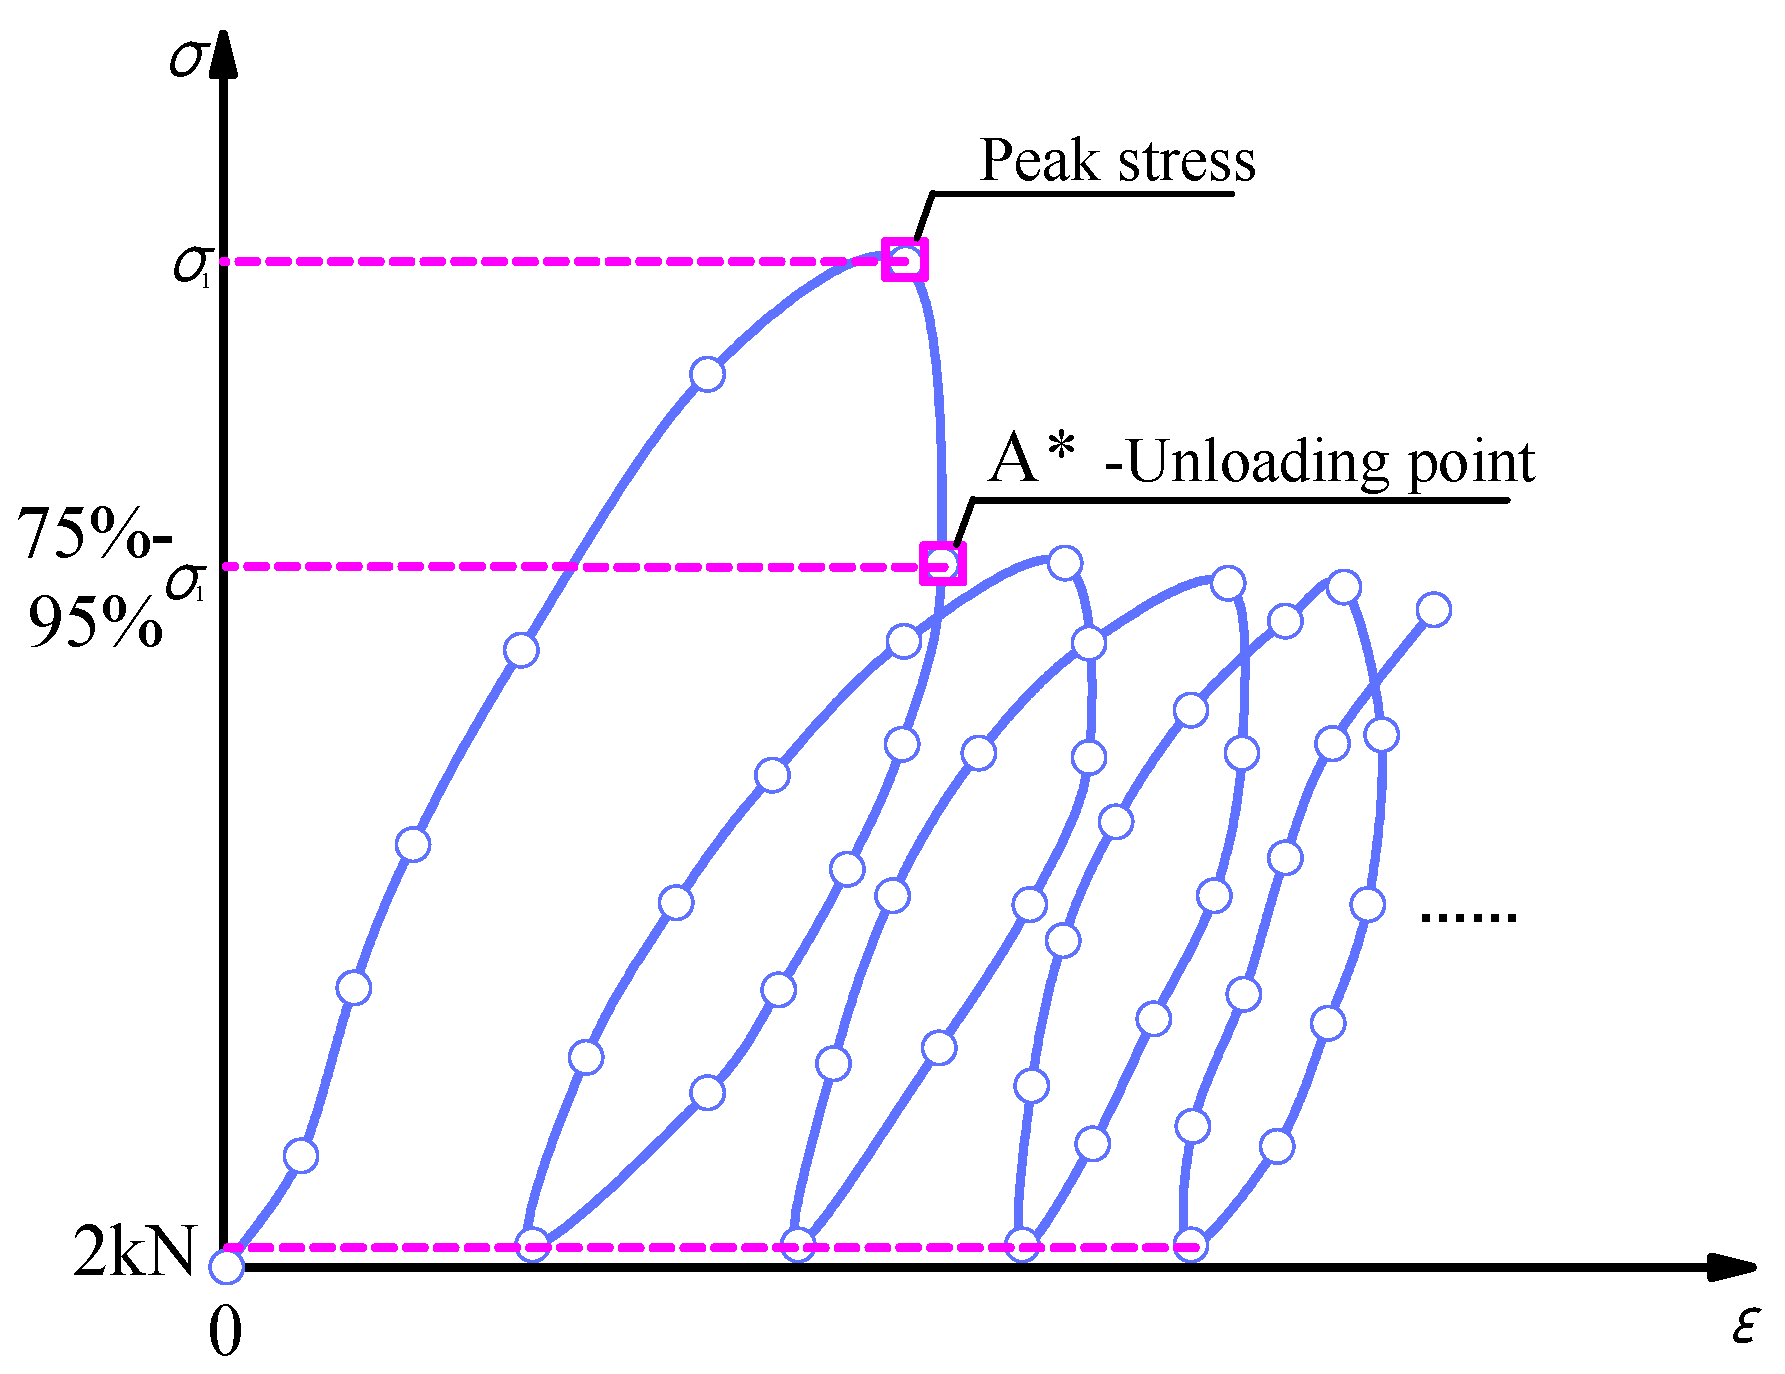
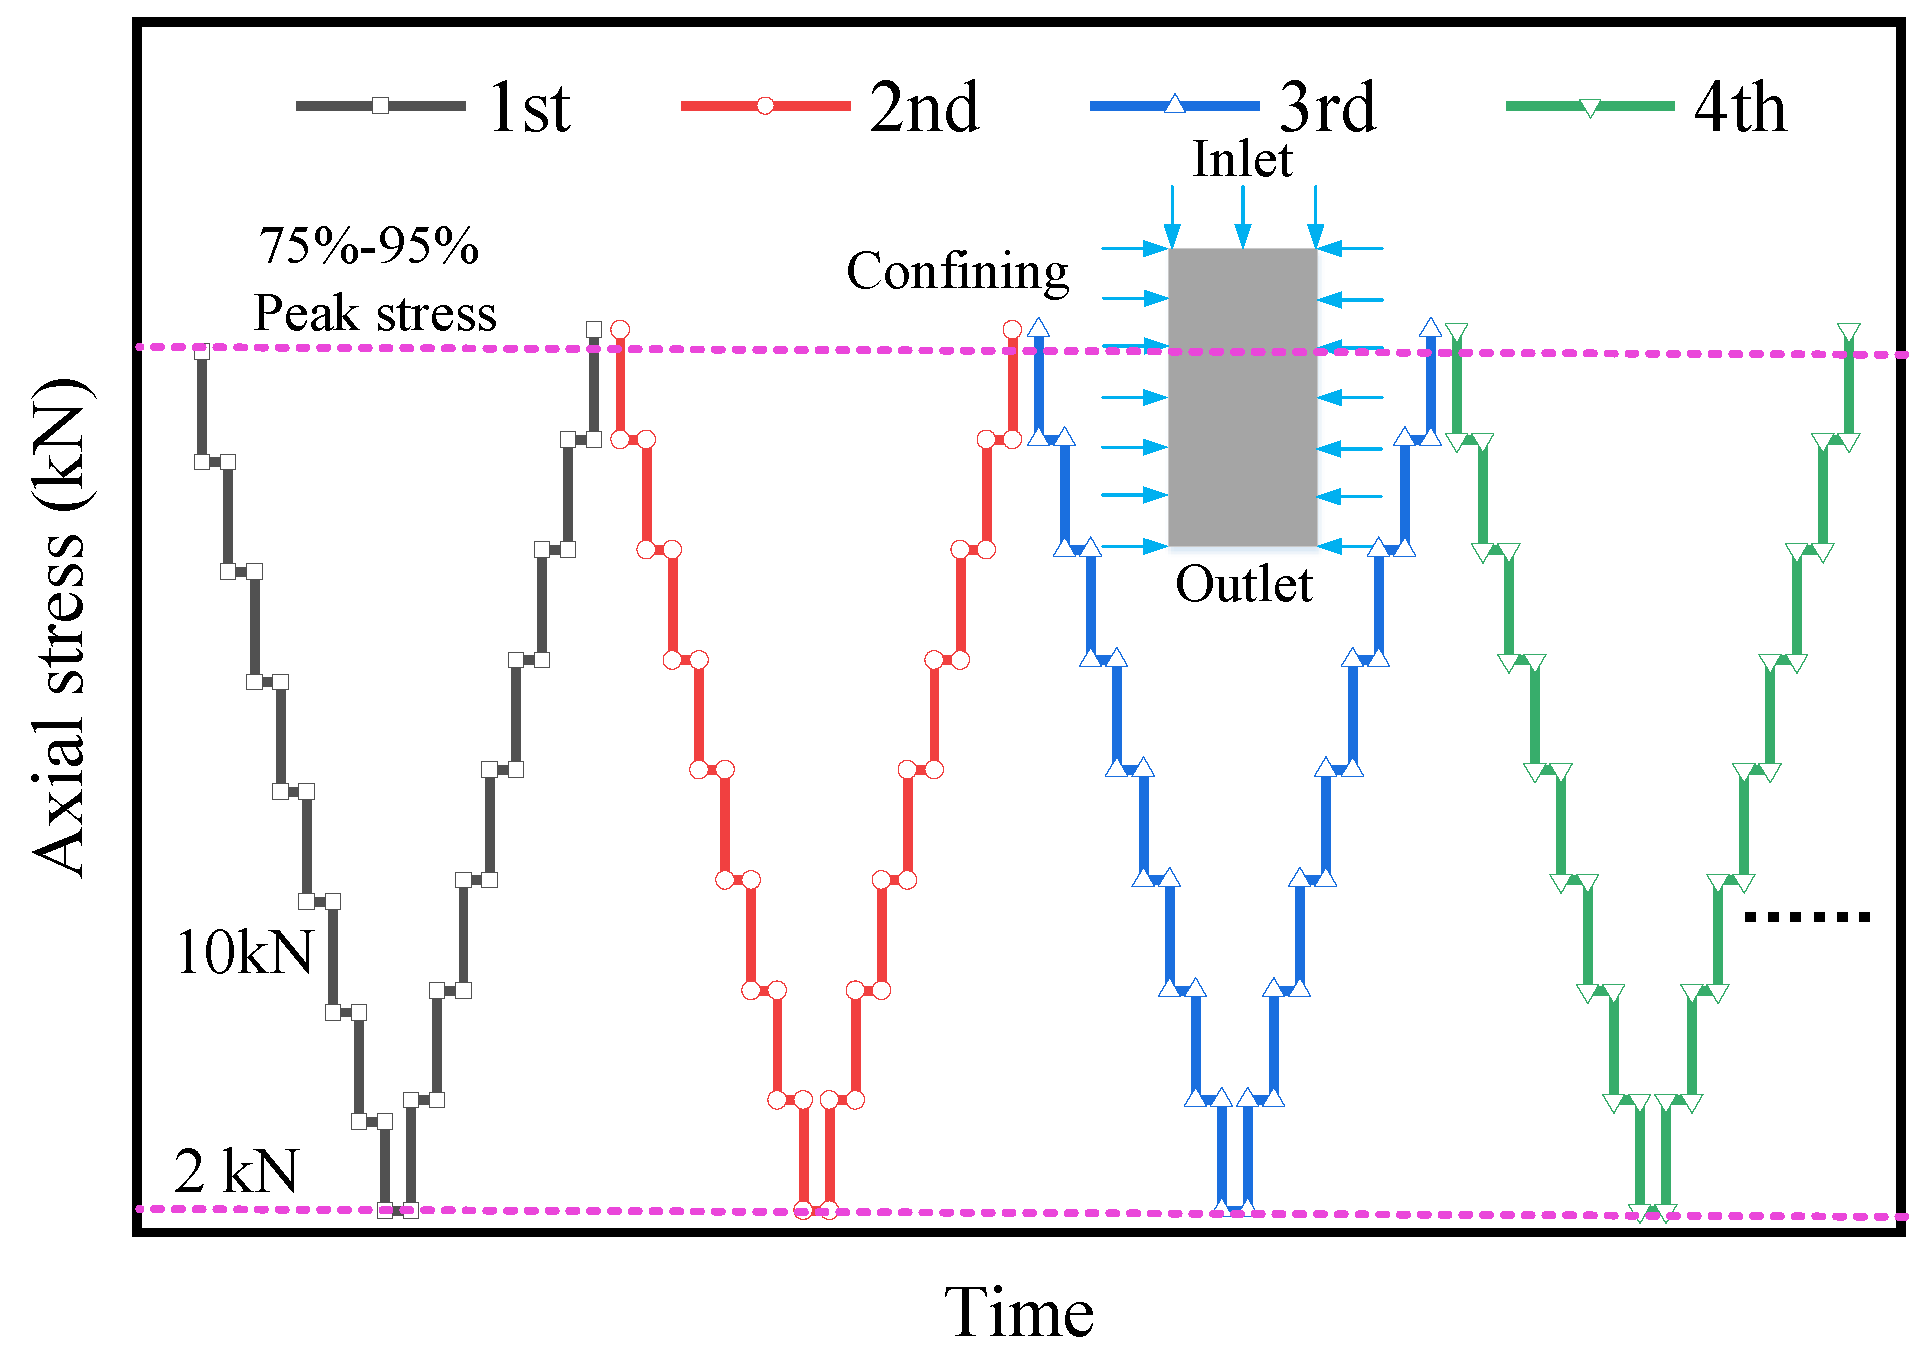
2.4. Test Scheme and Procedure
3. Experiment Results and Analysis
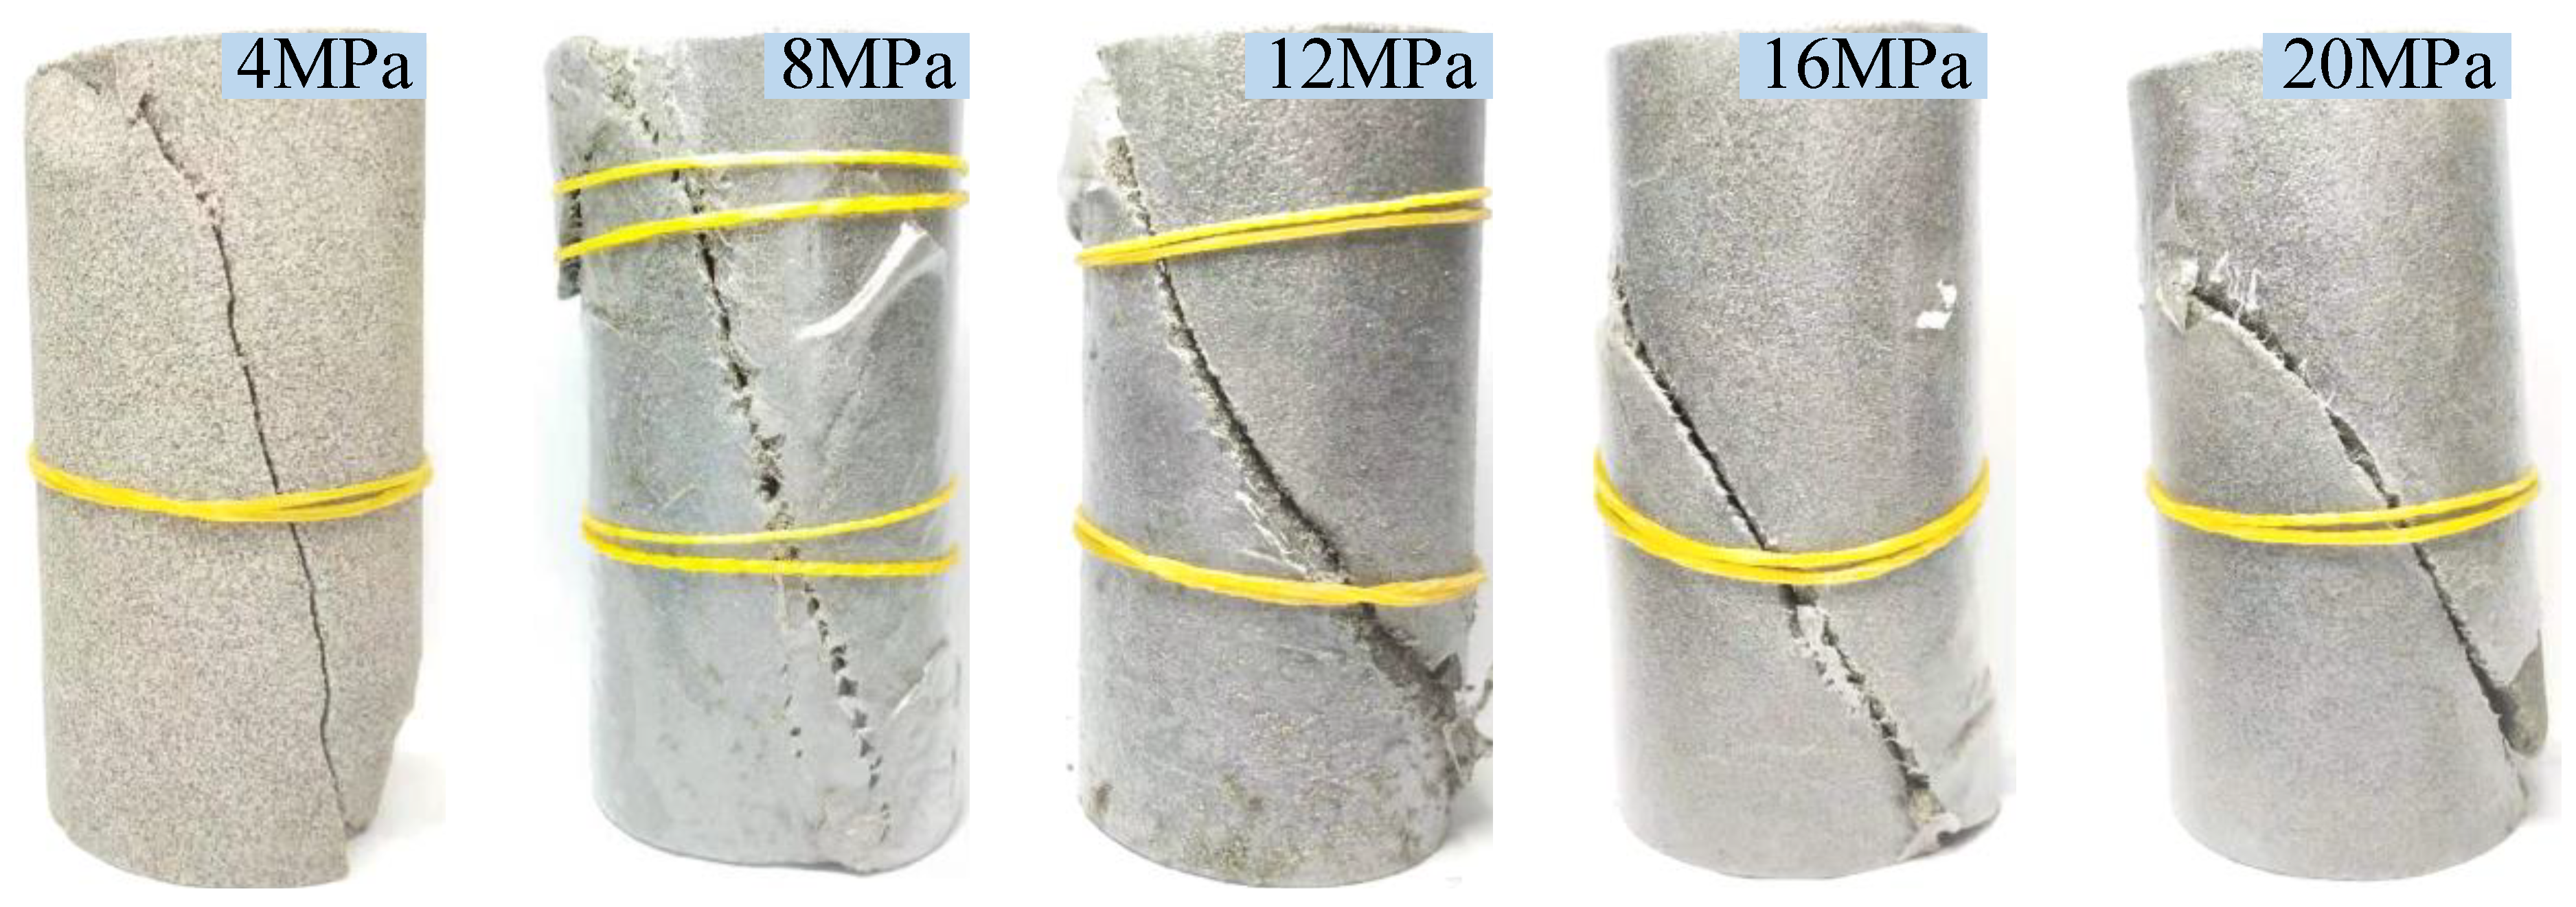
3.1. Peak Strength and Failure Morphology
3.2. Influence of Volumetric Strain on Permeability
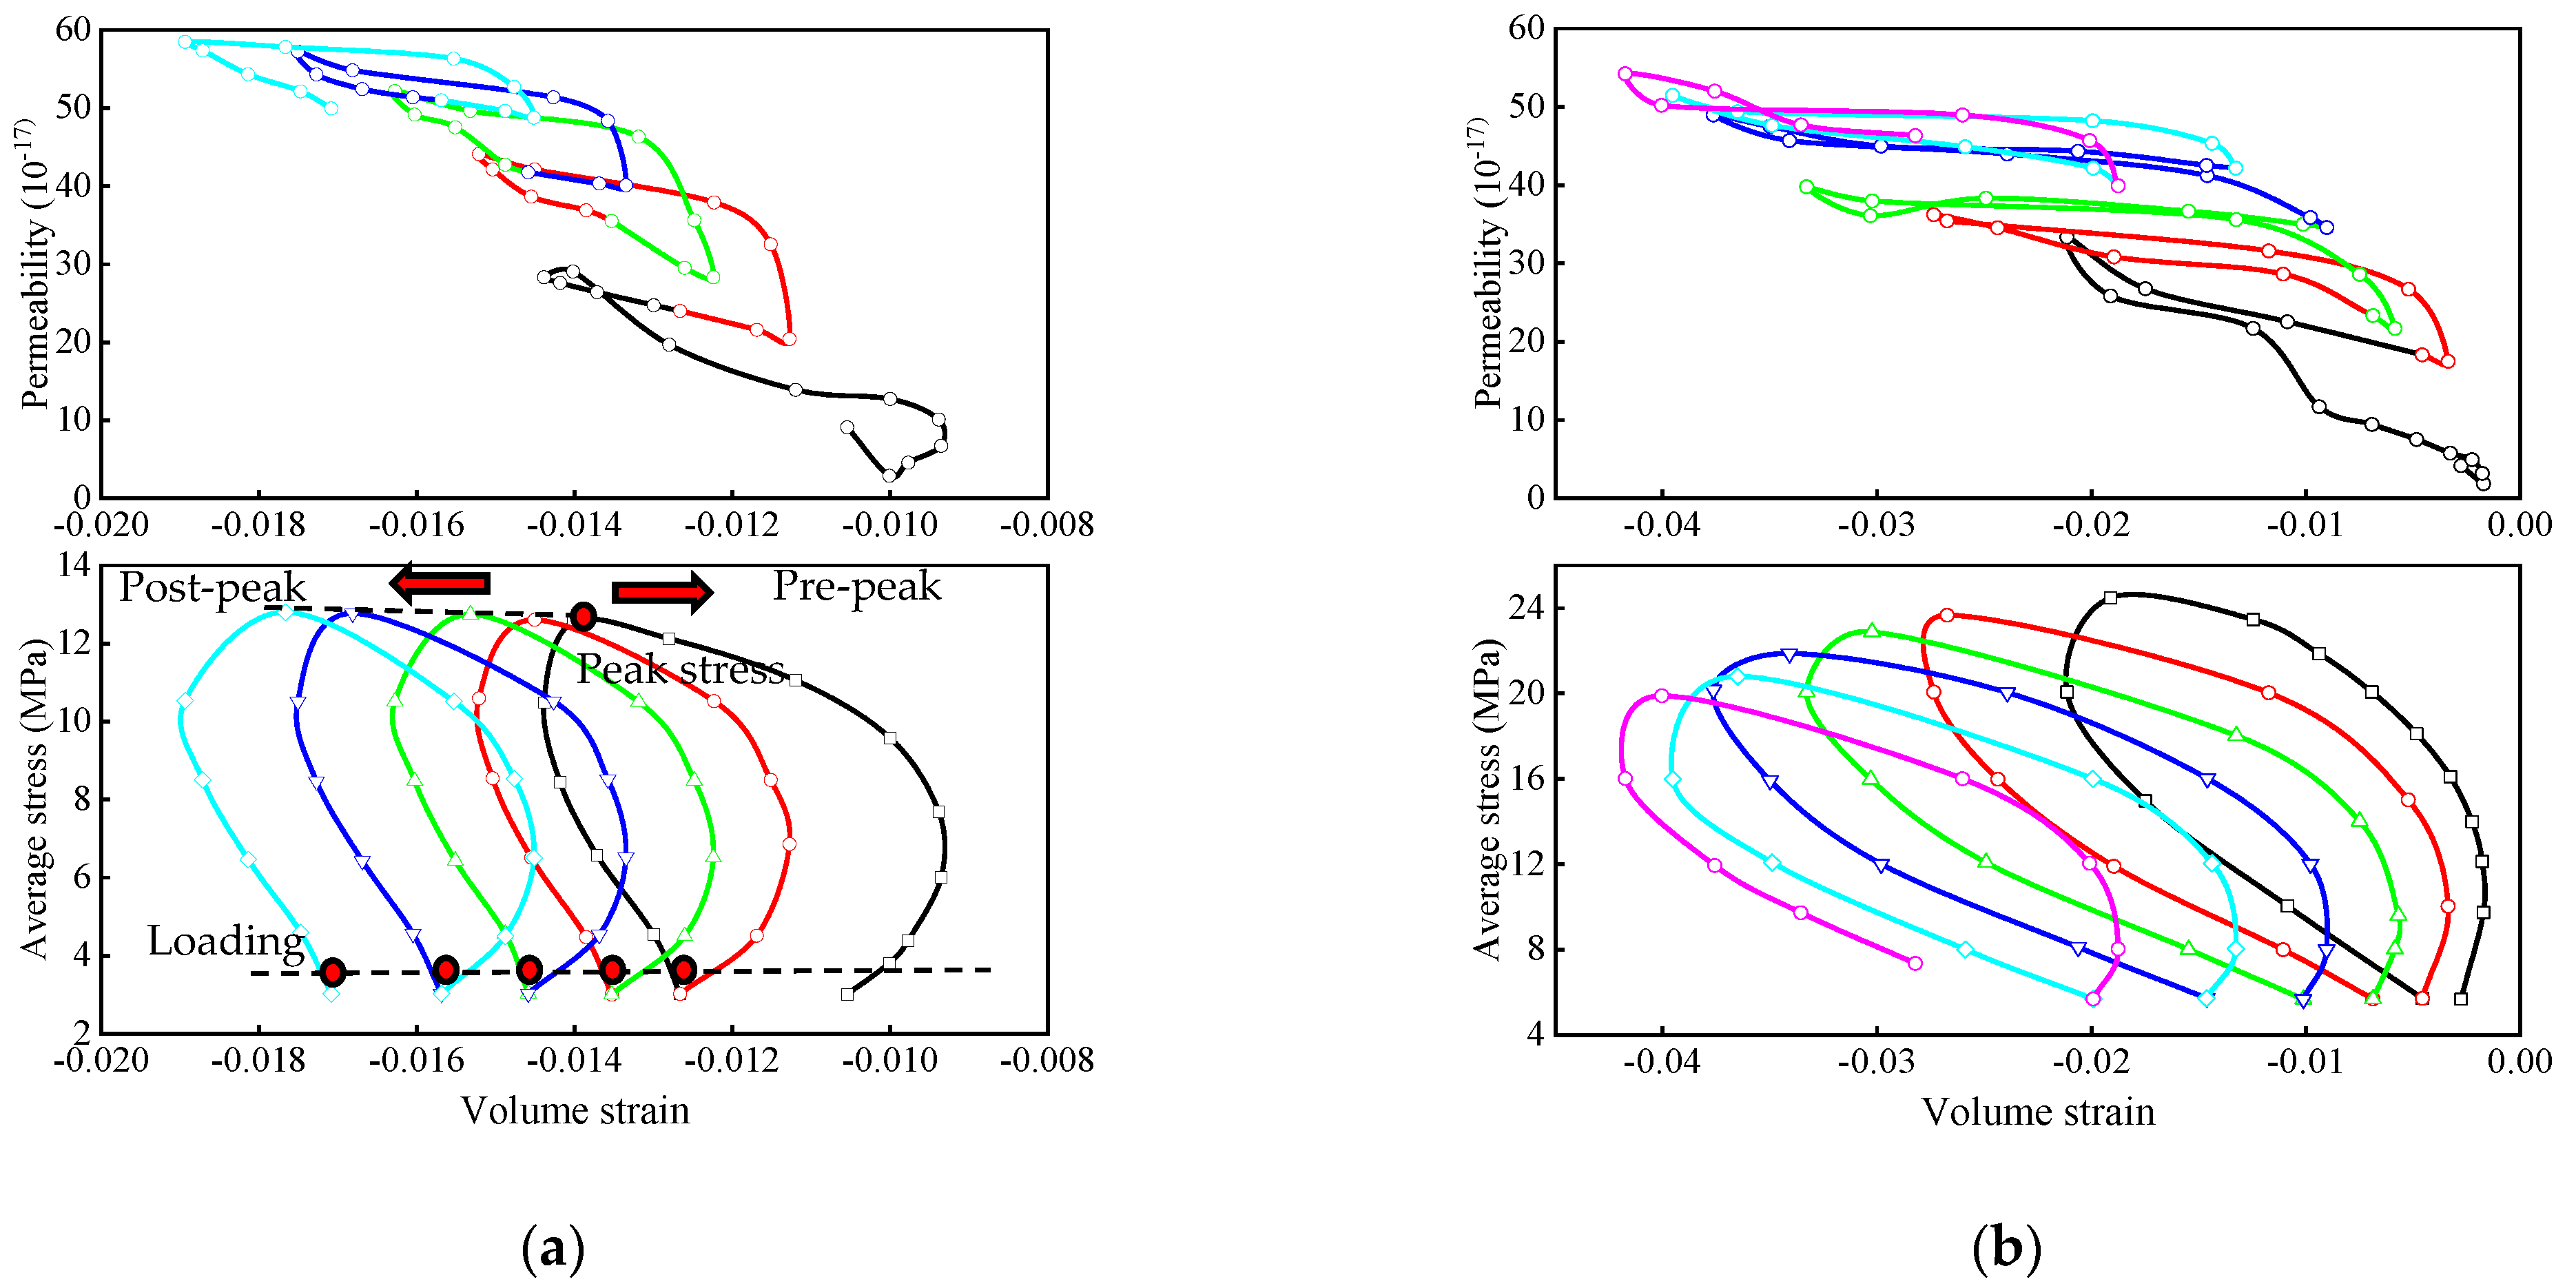
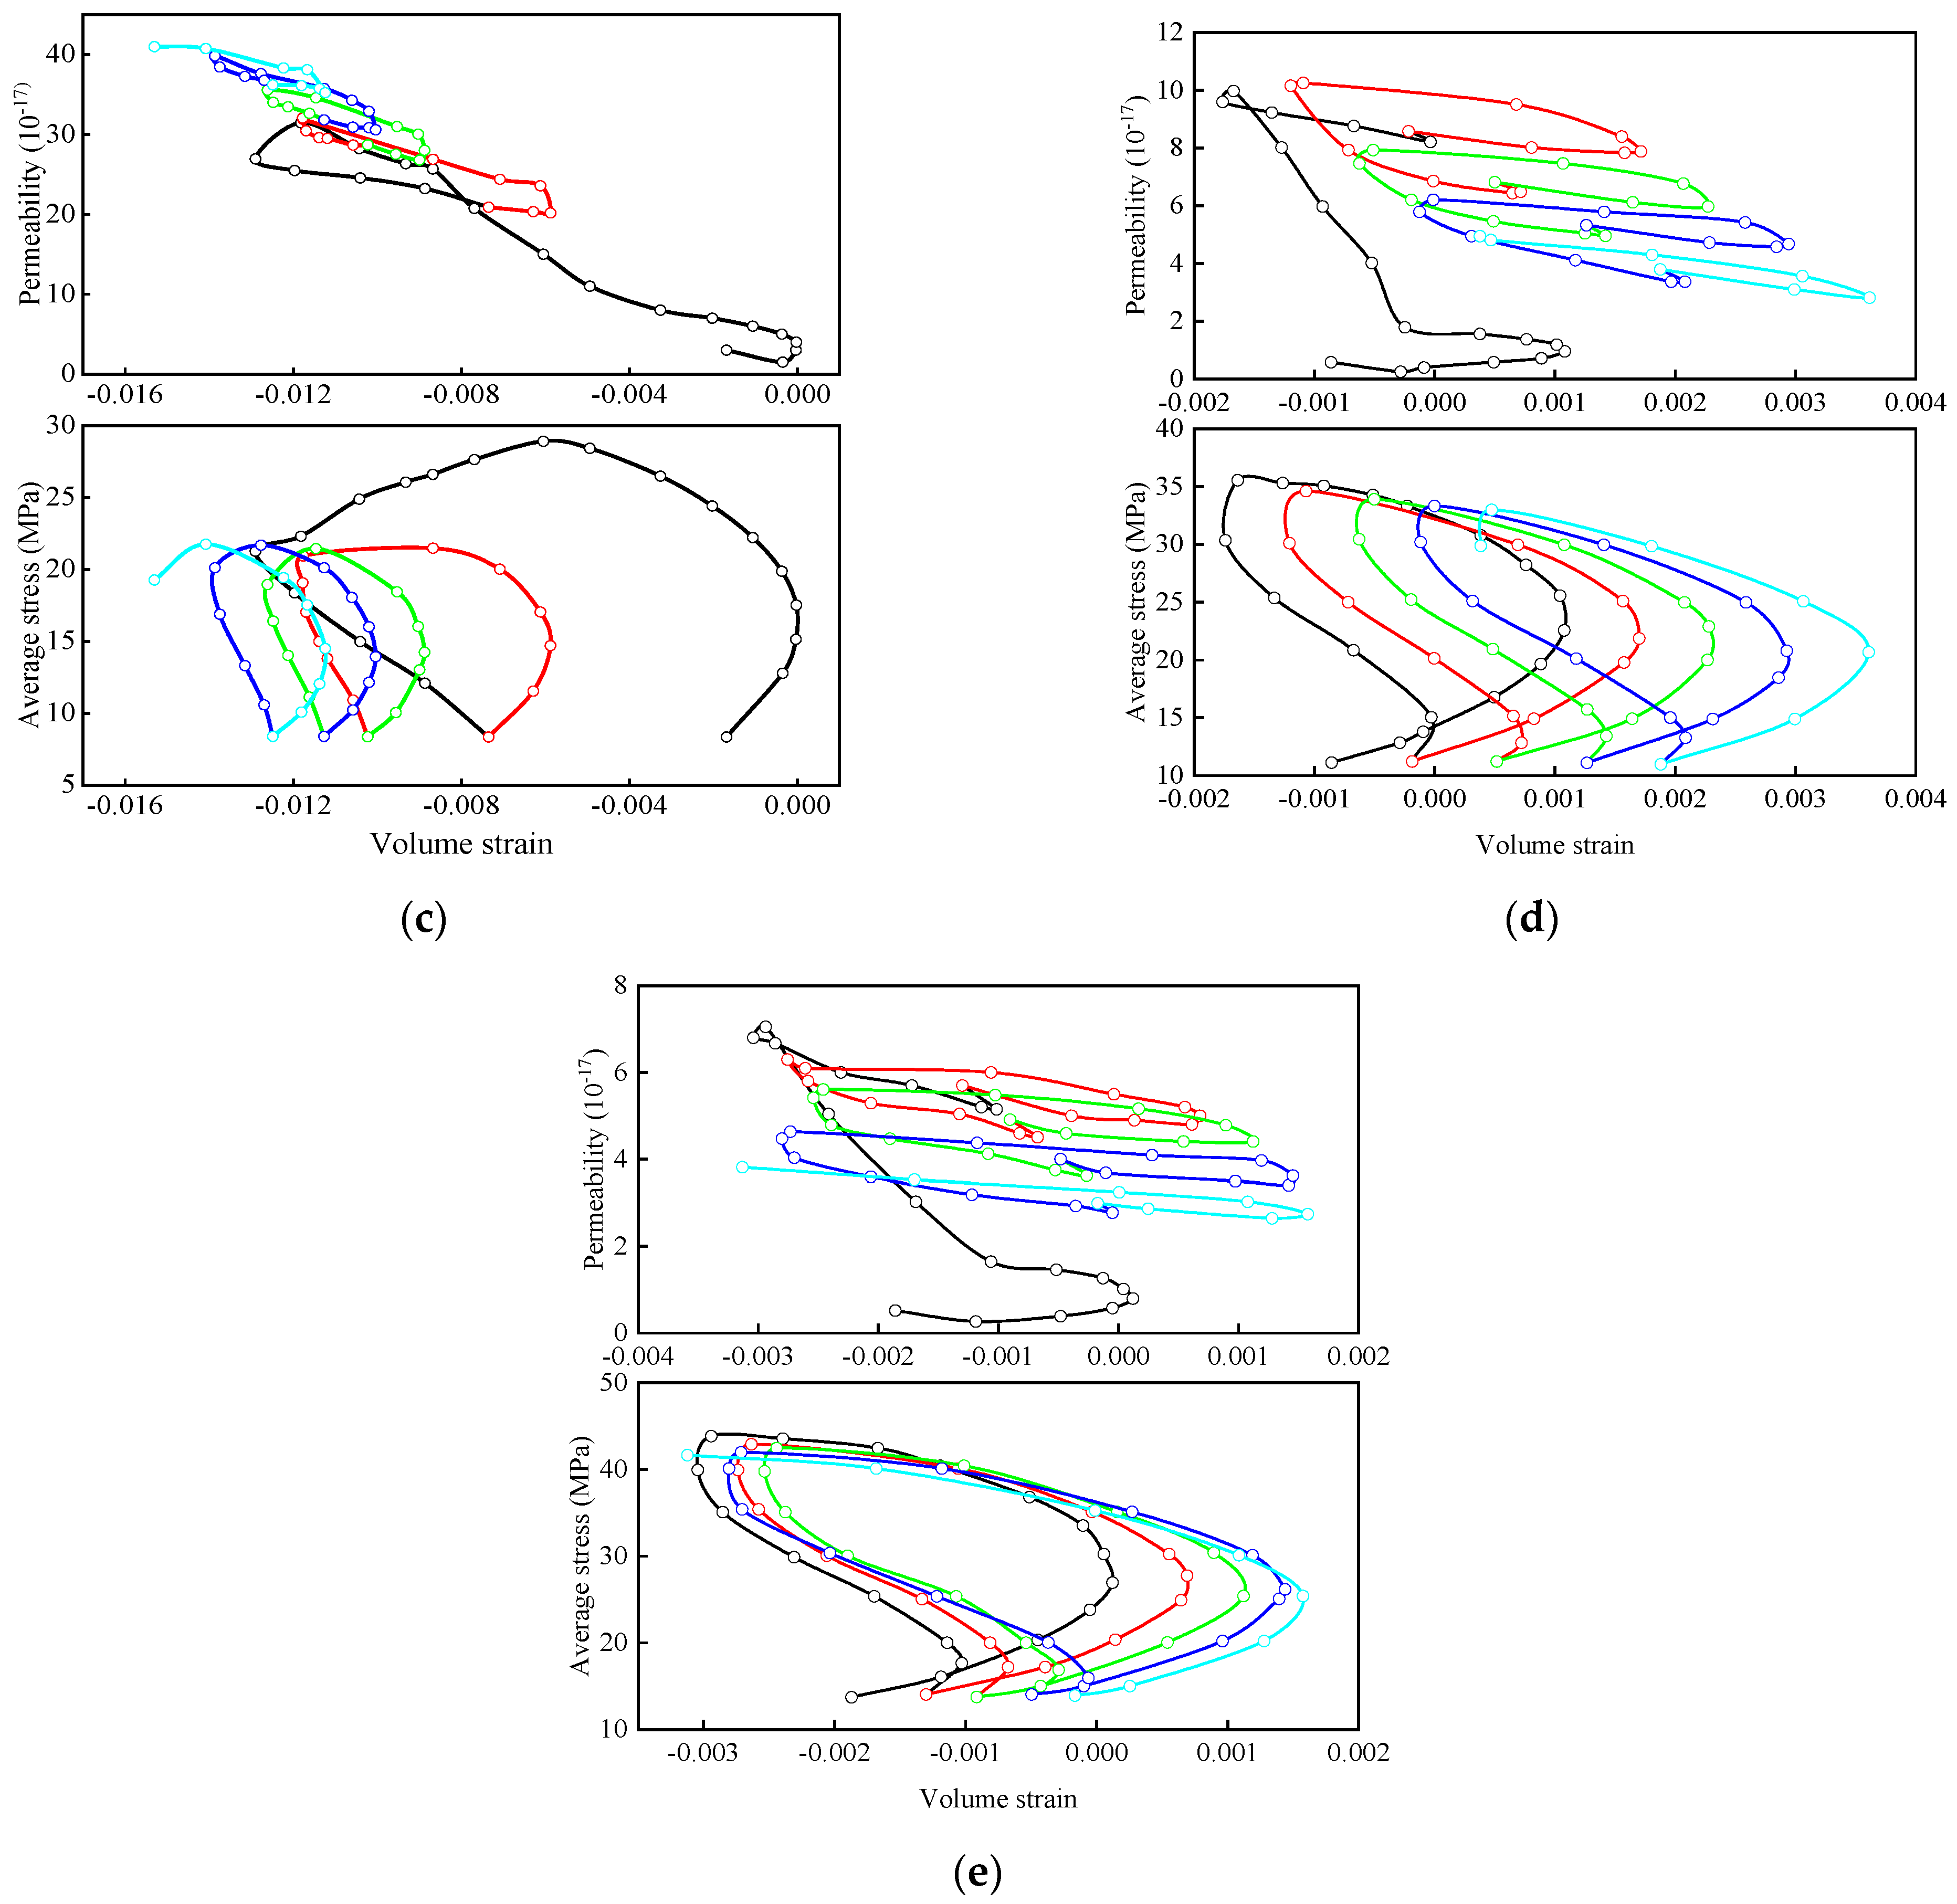
- The volume strain has an extremely significant effect on the permeability before the initial unloading point. No matter what the confining pressure was, the pre-peak permeability experienced five stages approximately with the variation of volume strain, an orderly including a slightly initial reduction stage, a slowly increasing stage, a rapid growth stage, an instantaneous drop stage, and a strain softening stage. The above five stages correspond closely to the characteristics of deformation and compression of the specimen before the initial unloading point. During the initial loading phase, the volumetric strain value of the specimen gradually decreased with the compression of the initial crack inside the specimen, which led to a slight decrease in permeability. As the deformation entered the linear elastic stage, the volumetric strain value of the sample started to increase gradually with the development of a new crack, which caused a slow increase of permeability. Next, the new fractures inside the sandstone became expanded and connected with the original fractures as the volumetric strain increased, resulting in a greater rate of permeability growth. Then, once the compressive and deformation state of the sample was close to the peak point, large penetrating cracks were formed inside the sample, and the permeability suddenly increased to the maximum value which lagged the peak stress due to the rapid decrease of the deformation resistance after the peak stress. Meanwhile, the permeability of the specimen entered the instantaneous drop stage when the seepage pressure became stable. Finally, the sample fractures after failure closed again and the permeability decreased as the volumetric strain decreased. At this point, the permeability of the specimen began to enter the strain softening stage. The above analysis belongs to the permeability process for the whole stress–strain stage and many scholars have reached similar conclusions.
- In the post-peak cyclic loading–unloading stage, the volumetric strain is negatively correlated with permeability. At the unloading stage, when the axial strain increment was less than that of two times the circumferential strain, the volumetric strain showed an increasing trend. Since the confining pressure remained unchanged at this stage, the permeability decreased because the axial unloading was equivalent to the sample compression. At the initial loading stage, the axial strain increment was also less than that of two times the circumferential strain, the volume strain gradually increased and the sample was compacted, which led to a permeability decrease. Subsequently, the axial strain increment exceeded two times the circumferential strain increment, the volumetric strain curve shifted to the left and showed a decreasing trend. The main fracture across the sample was re-opened, resulting in an obviously increase in permeability. The above analysis showed that the post-peak cyclic loading–unloading process had a significant impact on its permeability, so the change of roof seepage or water inrush after mining needs to take the stress state into account.
3.3. Influence of Confining Pressure and CLT on Permeability
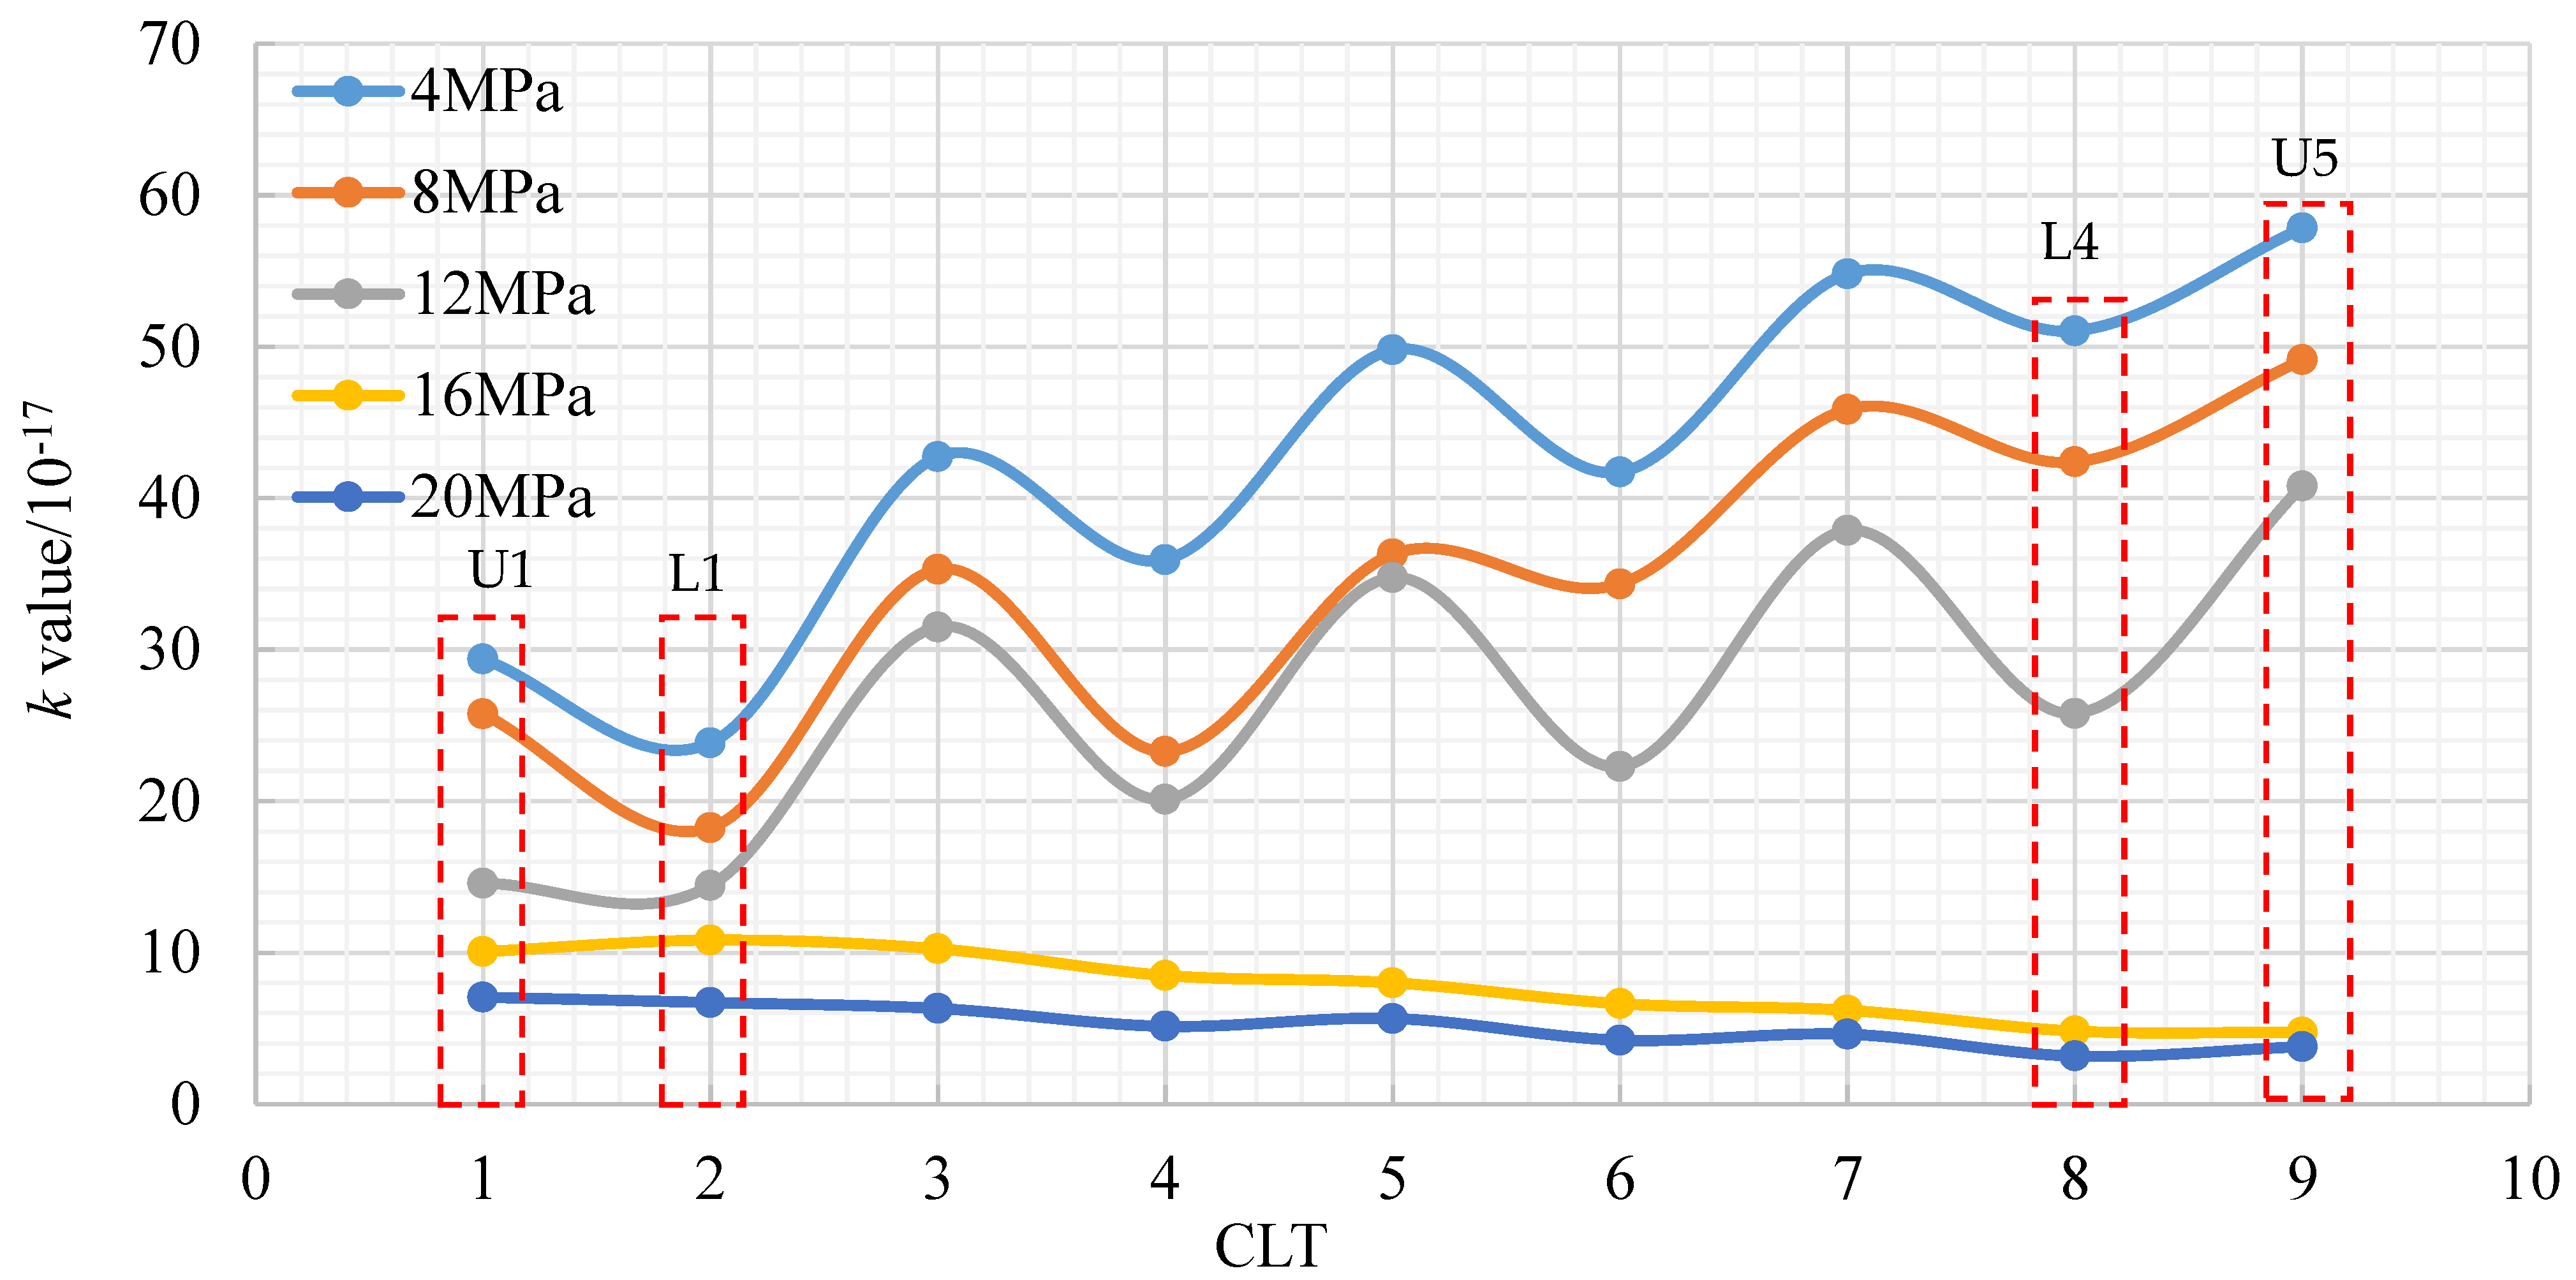
- The influence of CLT on k is closely related to the confining pressure level. When the confining pressure changed from 4 MPa to 12 MPa, the circumferential strain gradually decreased as the axial strain increased and the final volumetric strain also decreased, which caused the volumetric strain–average stress hysteretic curve to shift to the left in turn and the corresponding permeability gradually increased. When the confining pressure increased to 16 MPa and 20 MPa, the influence of the confining pressure on the volumetric strain was greater than that of the axial stress as CLT increased. The volumetric strain–average stress hysteretic curve shifted to the right in turn and the corresponding permeability showed a decreasing trend.
- The confining pressure has an extremely significant effect on the post-peak permeability of specimens. No matter what the value of CLT, the magnitude of the sandstone permeability gradually decreased and the decreasing trend became flat as the confining pressure increased, especially for σ3 = 16 MPa and 20 MPa. This was due to the larger confining pressure, the denser pores and the cracks which were compressed. The water flow channel in the rock medium contained cracks and pores, the stress surface of the pore part was arched, and the stress was compressive stress, therefore the pore volume did not change much, resulting in a flat decreasing trend. Compared with pores, cracks were more prone to compression deformation and closure due to the lack of rock skeleton matrix support. Therefore, the whole seepage process was first fracture compression deformation and closure, and then extrusion deformation of some pores. Under high confining pressures, the deformation and closure of flow channels such as fractures and effective pores were more and more difficult to achieve as the confining pressure increased. Therefore, the higher the confining pressure, the smoother was the permeability variation.
3.4. Influence of CLT on Recovery Rate of Permeability
4. Microscopic Mechanism Analysis
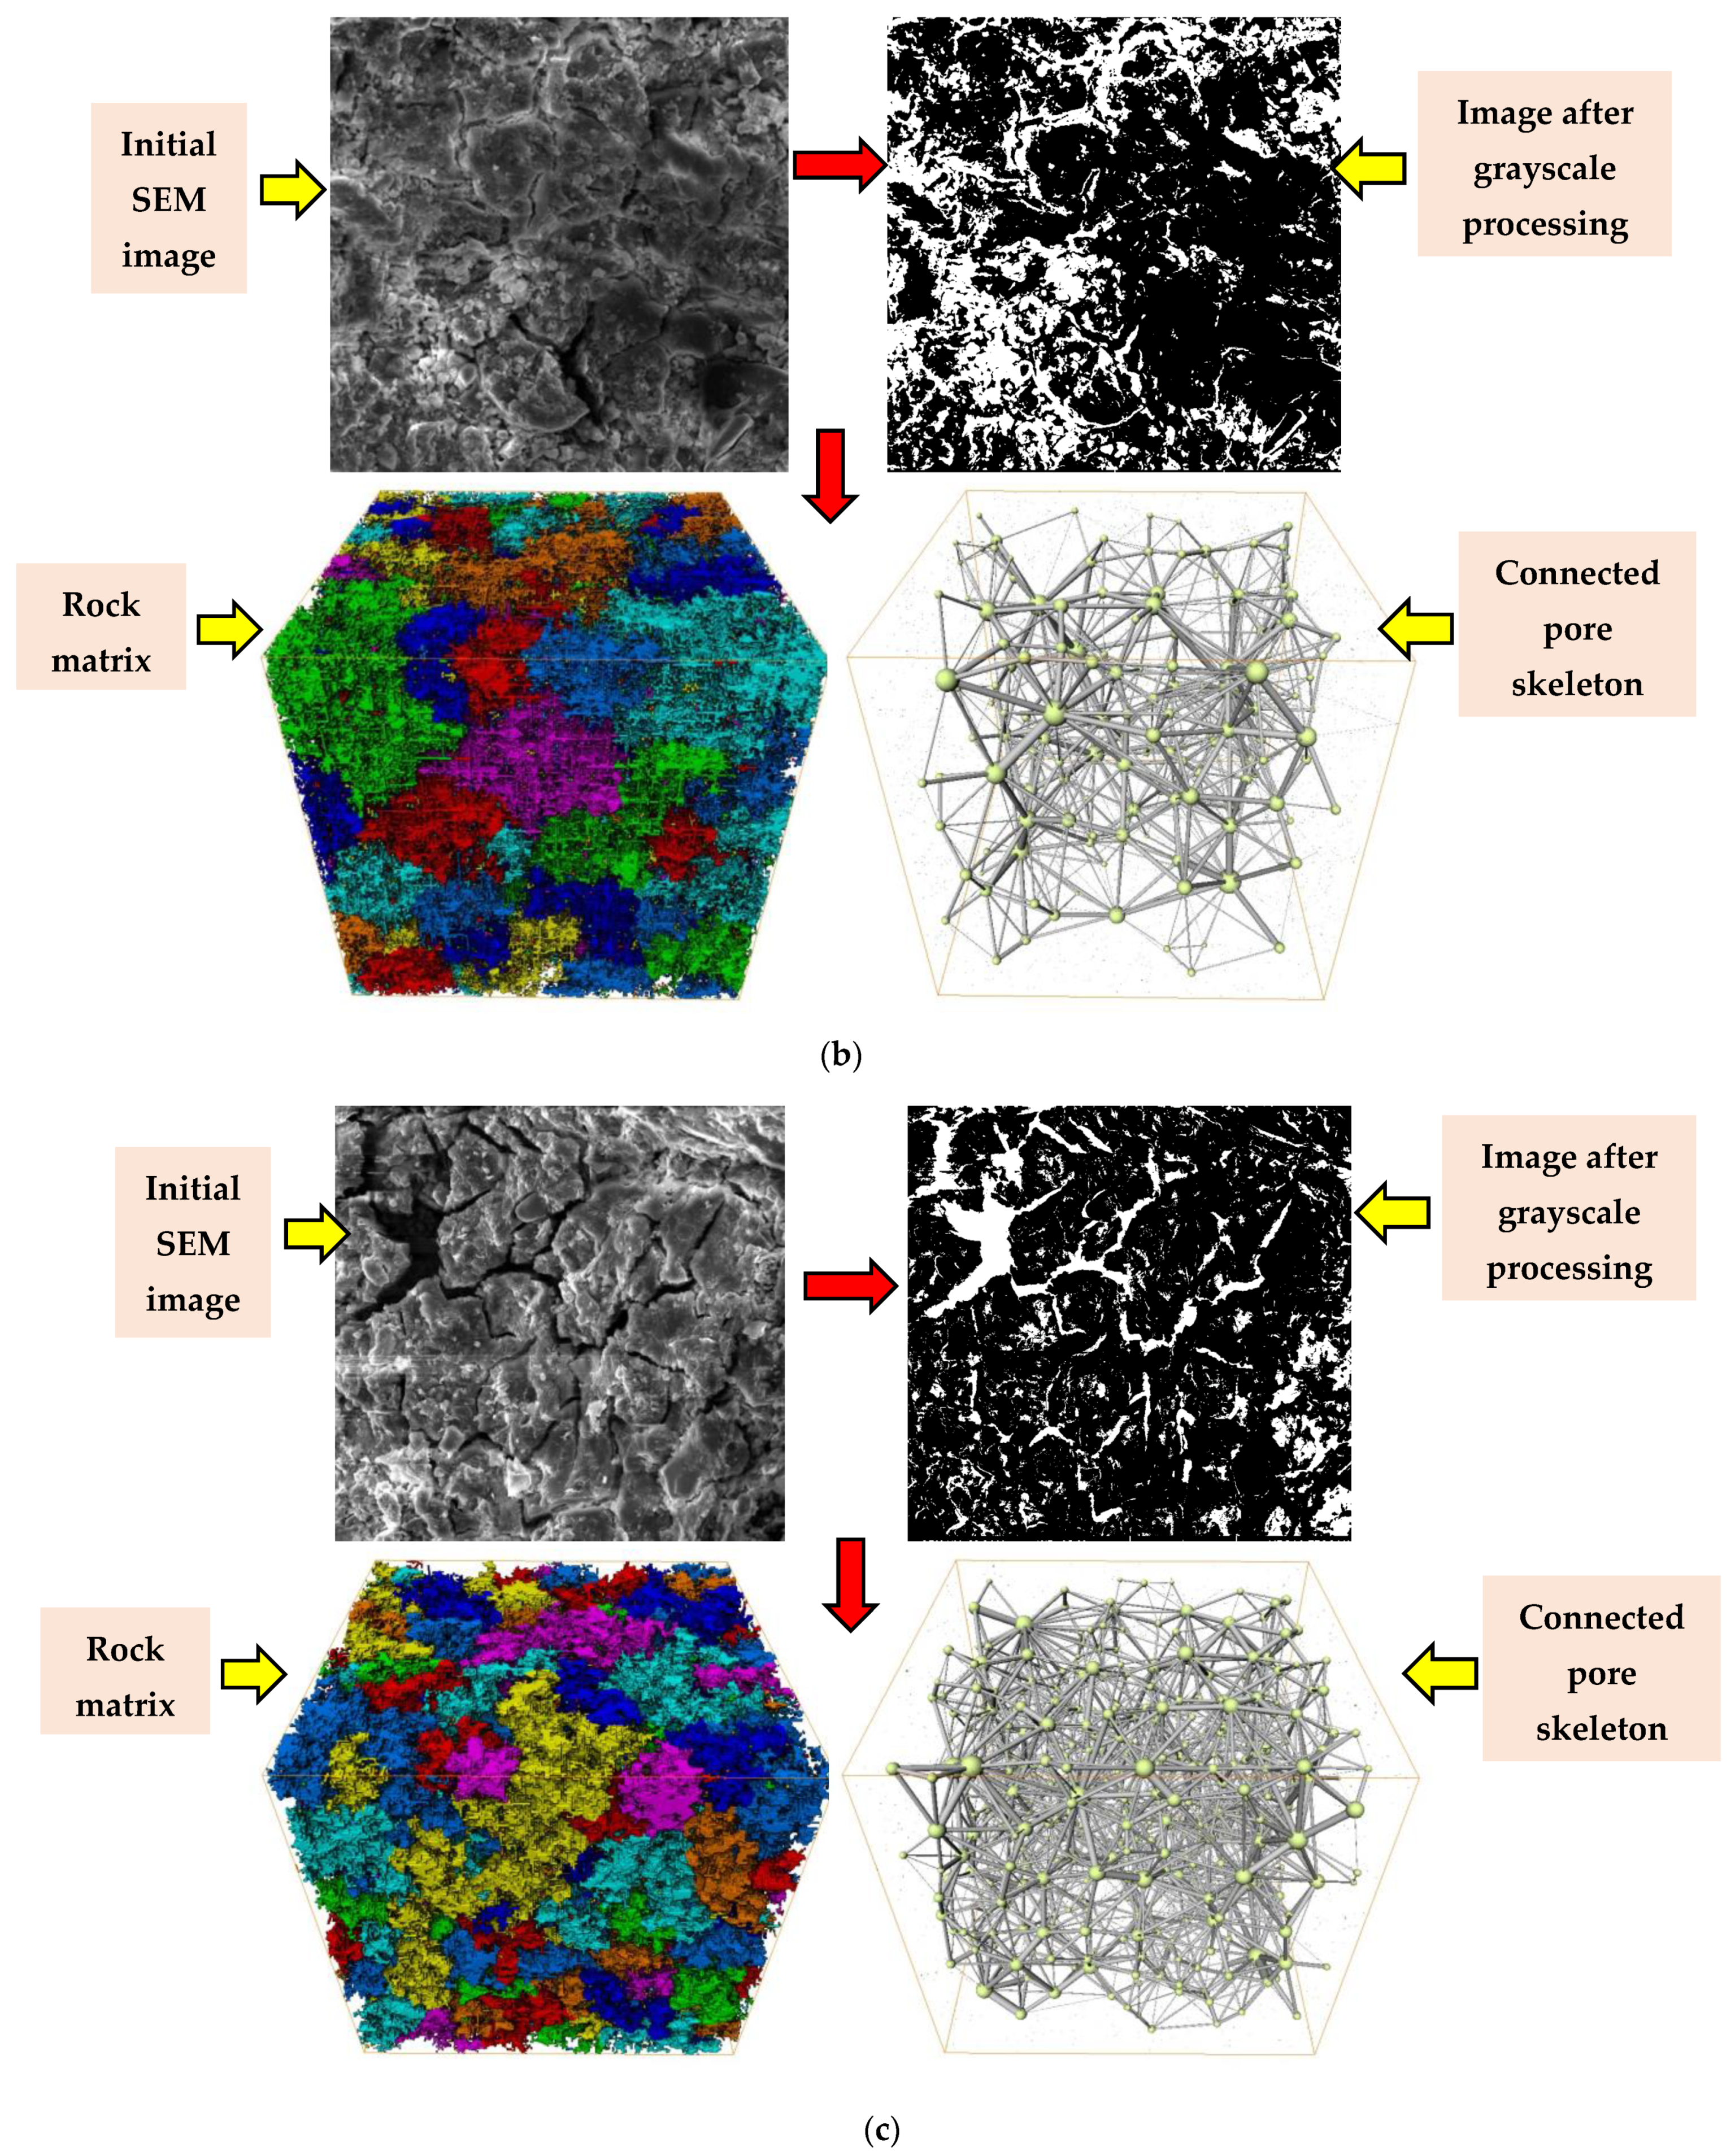
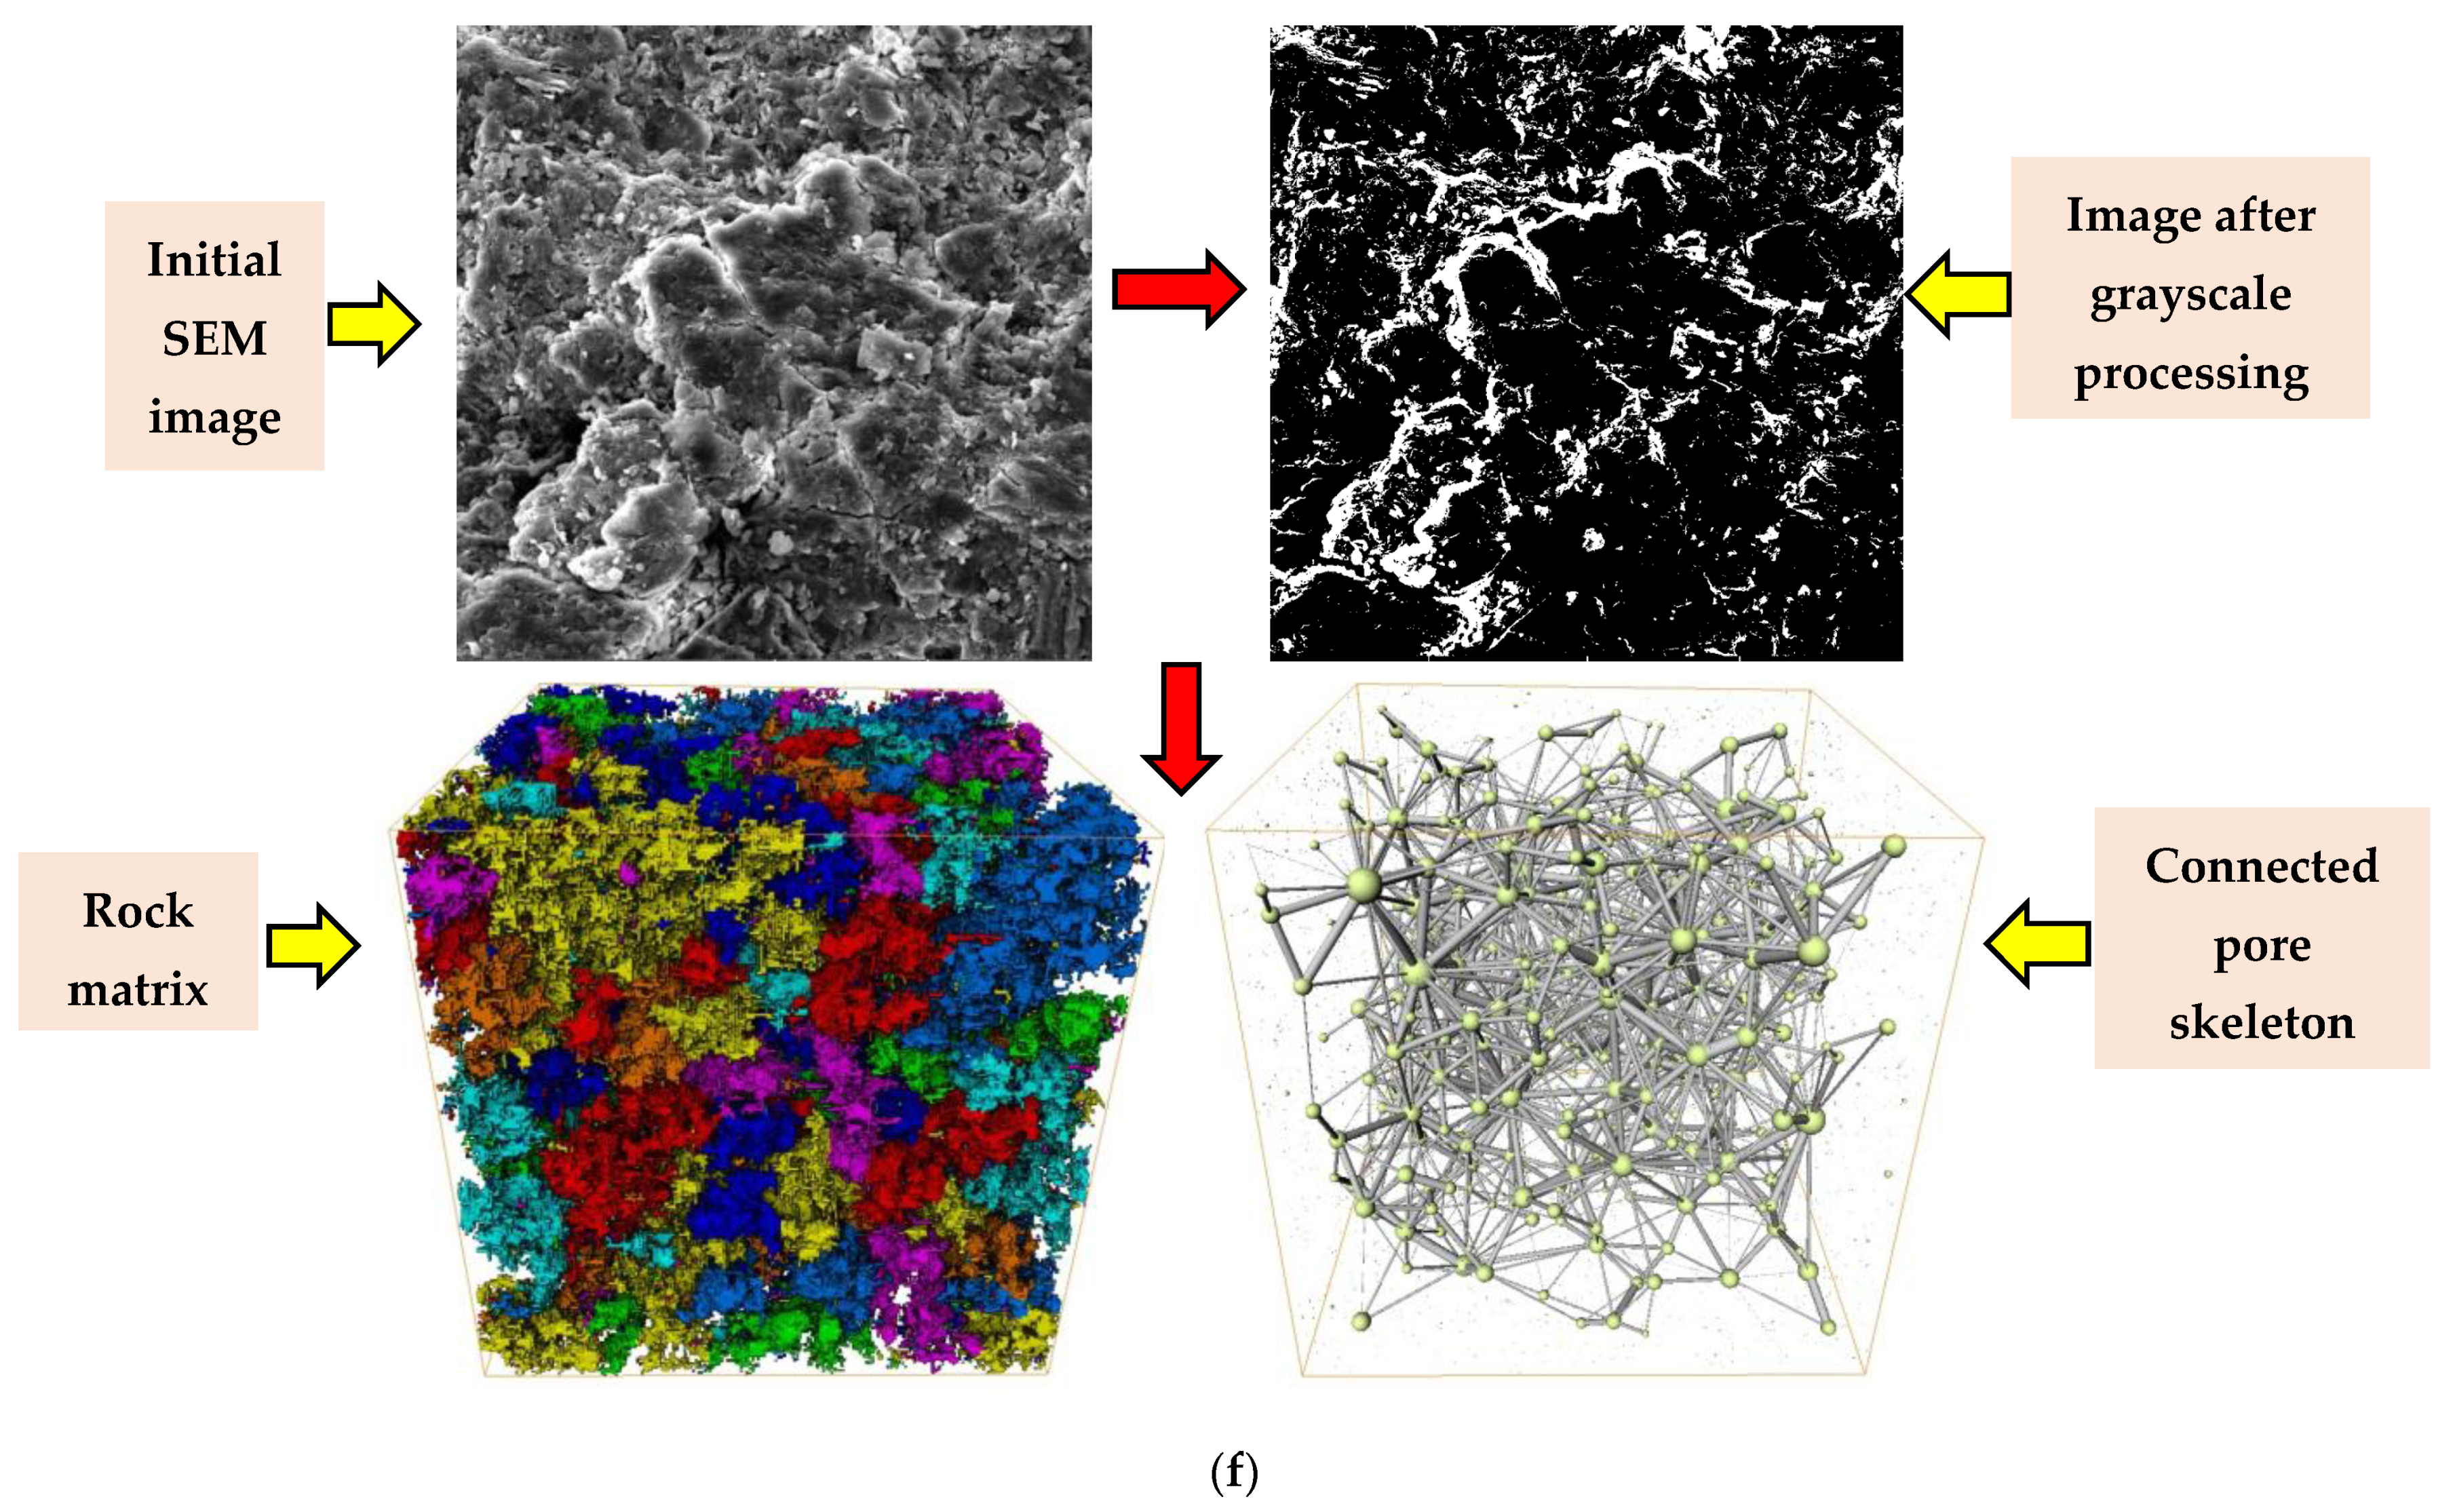
4.1. D Reconstruction Principle
4.2. Characterization Parameters of 3D Pore and Fracture Model
4.3. 3D Reconstruction Results and Characterization of Pore and Fracture Model
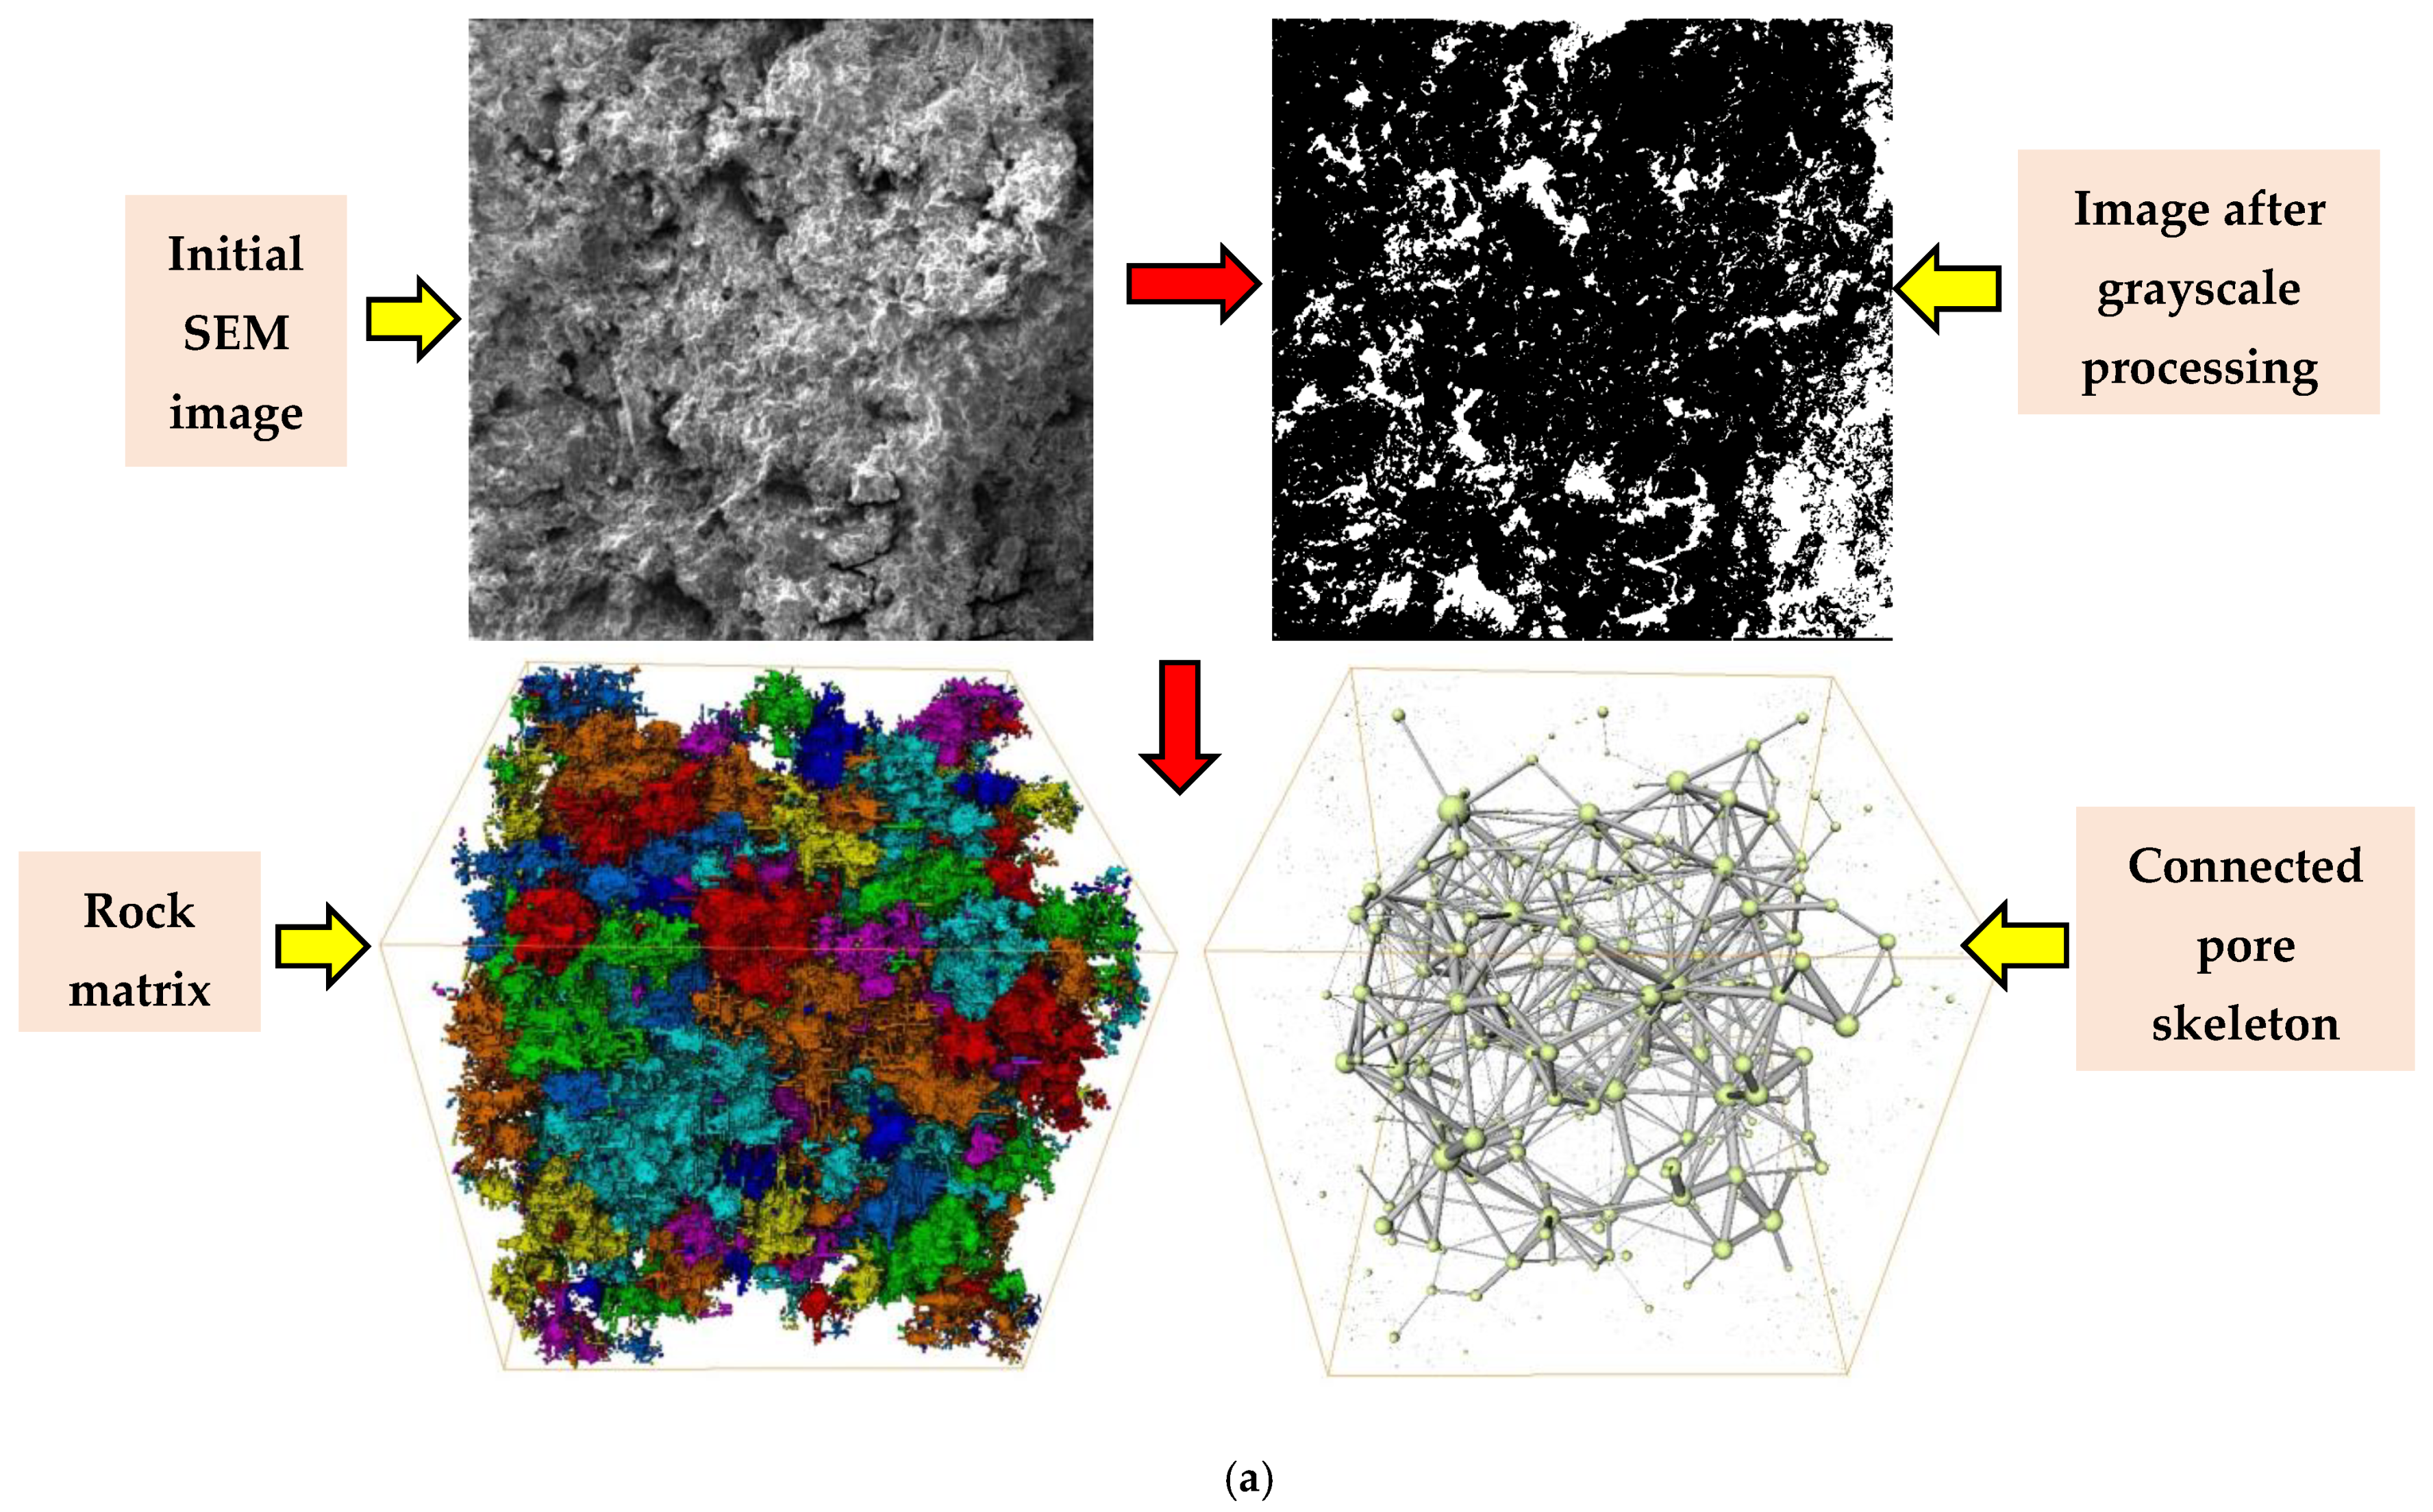
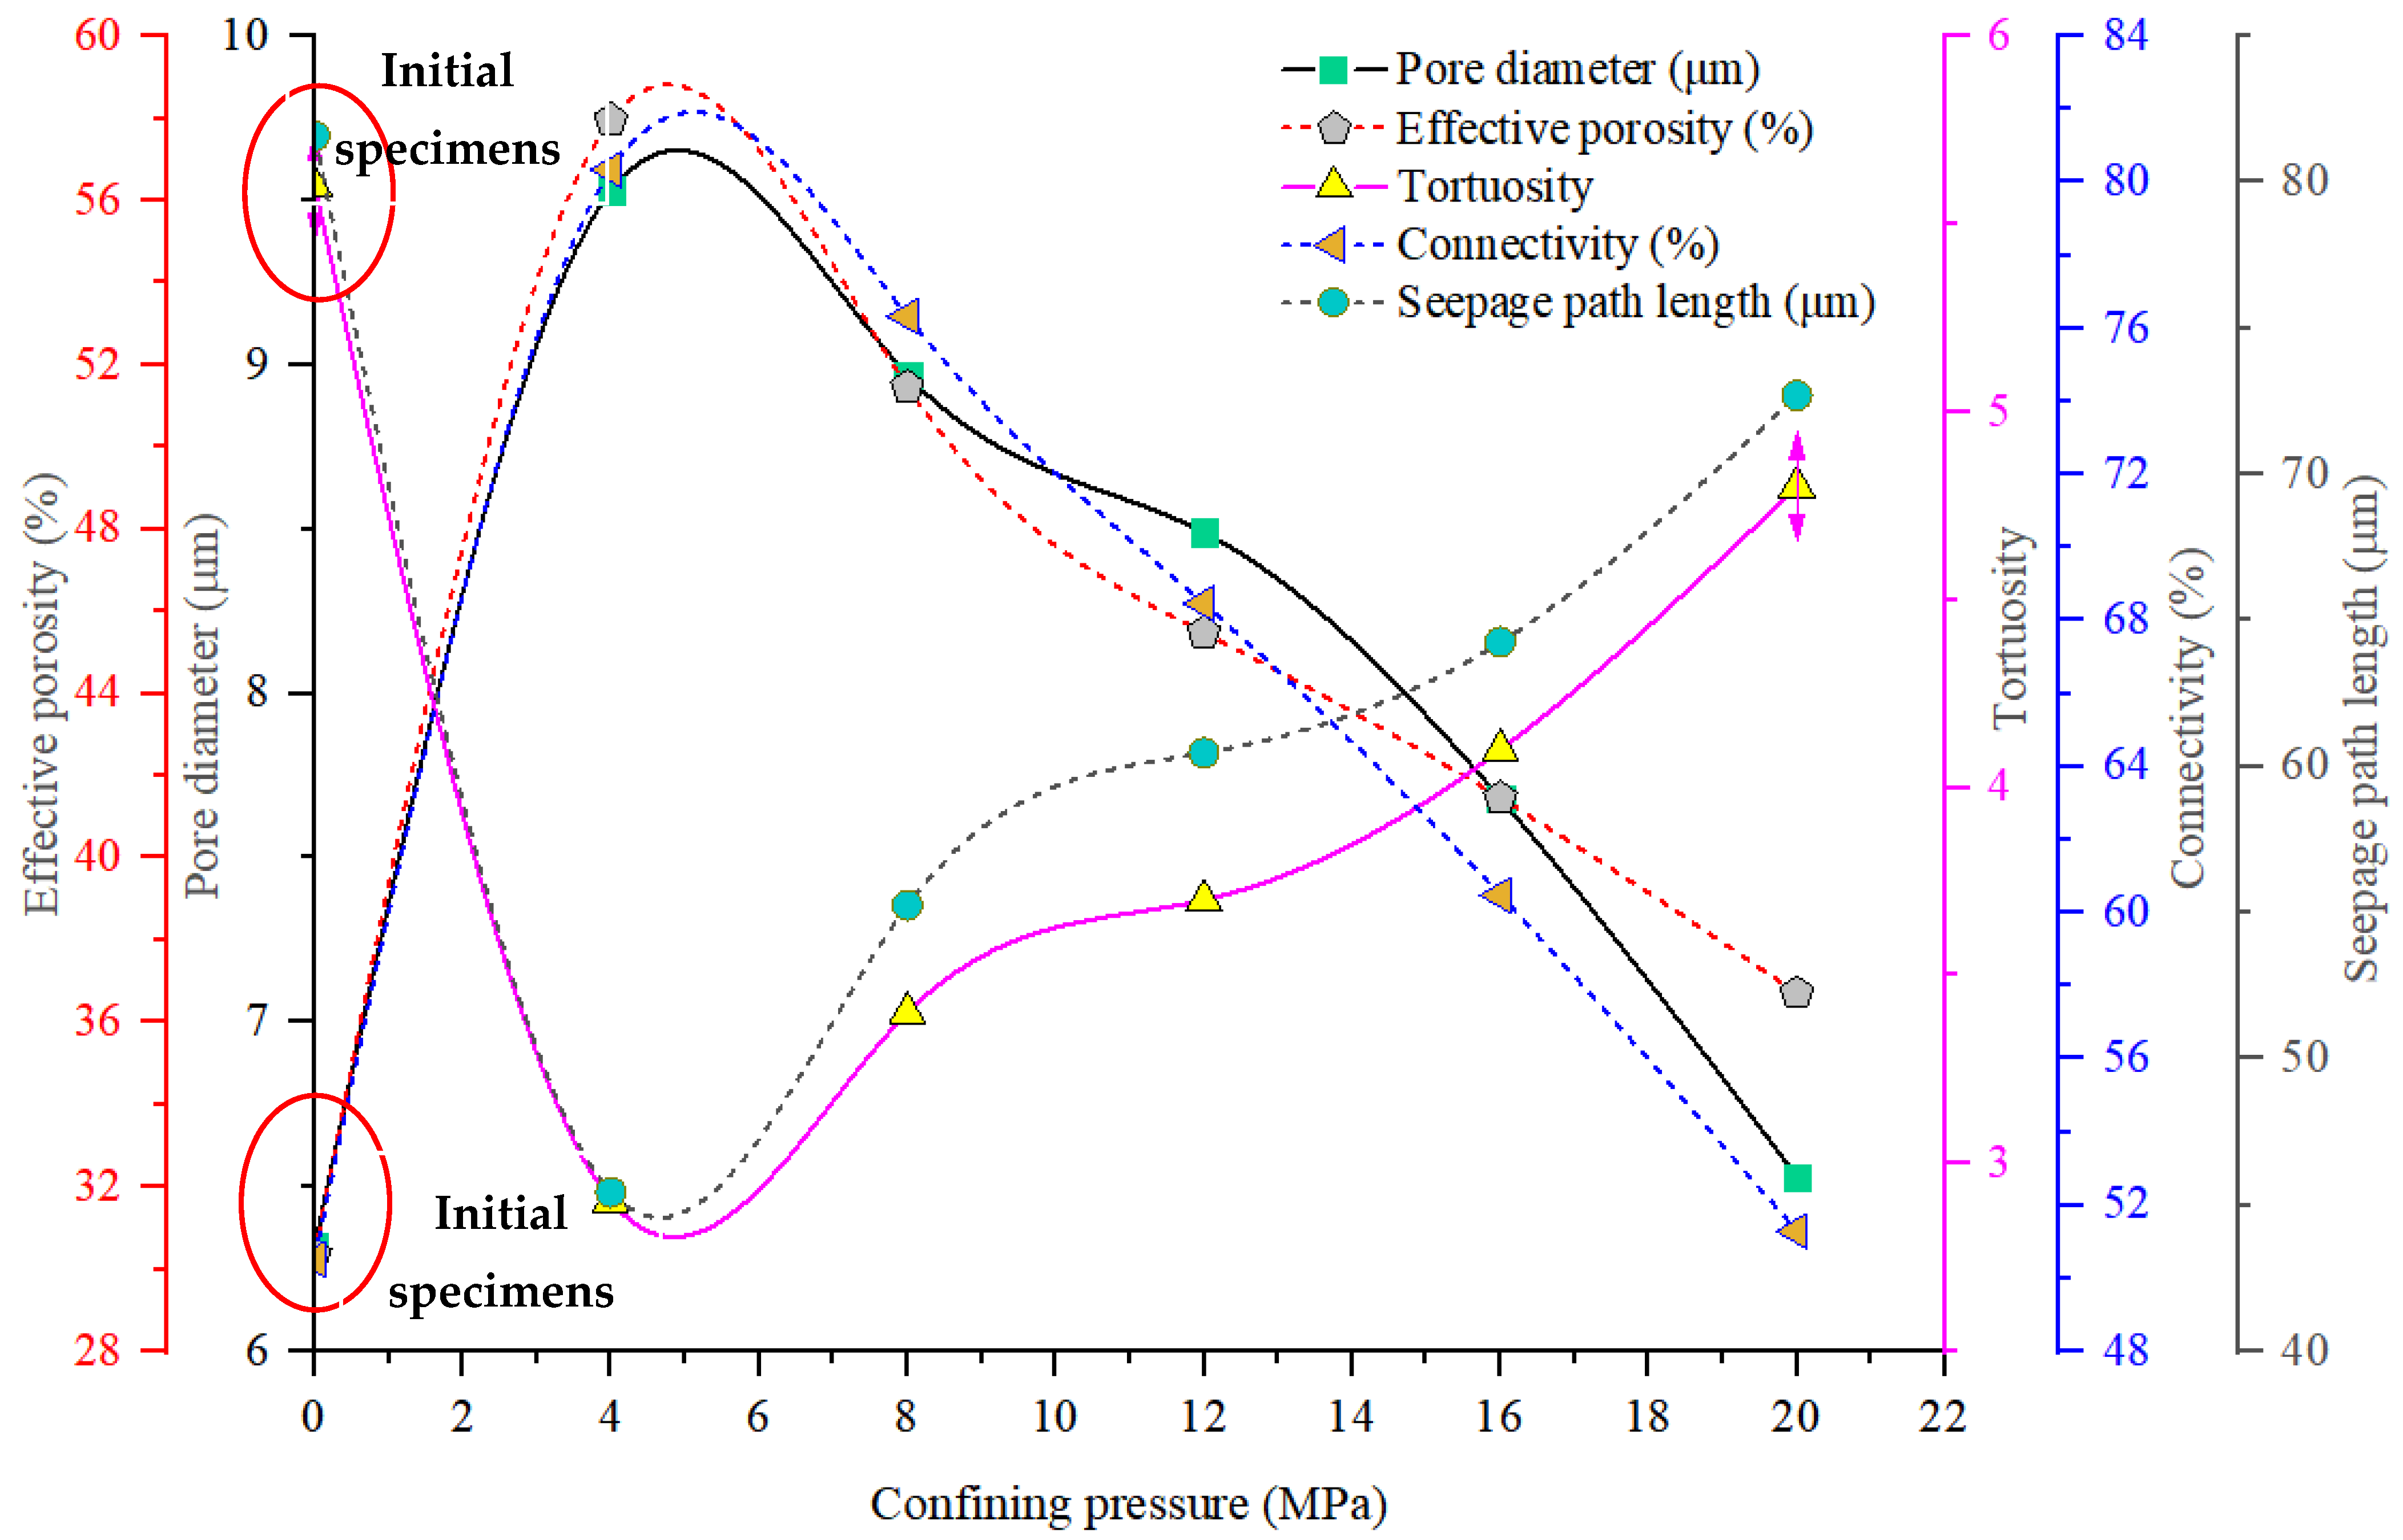
- The pore diameter, effective porosity, and the connectivity of the initial samples were obviously less than that of the post-experiment samples, and the seepage path length and tortuosity of the initial samples were visibly longer and larger than that of the post-experiment samples, which showed that the pores and cracks in the post-experimental samples significantly increased, so the permeability obviously increased compared with the initial samples.
- The confining pressure level has a significant effect on the seepage parameter of sandstone. As the confining pressure increased, the parameters of pore diameter, effective porosity, and connectivity show an approximately linear decreasing trend while the seepage path length and tortuosity increased nonlinearly. For instance, when σ3 changes from 4 MPa to 20 MPa, the pore diameter, effective porosity, and connectivity of the specimen decreased from 9.53 μm to 6.53 μm, from 57.96% to 36.71%, and from 80.35% to 51.29%, respectively. While the seepage path length and tortuosity of the specimen increased from 45.43 μm to 72.69 μm and from 2.9 to 4.8, respectively. The above analysis indicates that with the increase of confining pressure, the shear failure of the specimen becomes more pronounced, and the tortuosity and seepage path become larger and longer, respectively. It means that the pores inside the sample were easier to be compacted, and the fractures formed during failure were easier to be closed, which eventually led to decreasing permeability. Therefore, the rationality of the above permeability variation with confining pressure was verified from a micro-perspective.
5. Conclusions
- (a)
- Under a certain confining pressure, with the increase of axial strain, the pre-peak permeability experienced approximately five stages with the variation of volume strain, an orderly including a slightly initial reduction stage, a slowly increasing stage, a rapid growth stage, an instantaneous drop stage, and a strain softening stage. In the post-peak cyclic loading–unloading stage, the volumetric strain was negatively correlated with permeability. At the unloading and initial loading stage, the volumetric strain showed a gradually decreasing trend as the specimen was slowly compressed. However, at the middle and final loading stages, the axial strain increment exceeded two times the circumferential strain increment, while the volumetric strain curve shifted to the left and showed a decreasing trend, resulting in an obvious increase in permeability.
- (b)
- The influence of CLT on k is closely related to the confining pressure level. When the confining pressure changed from 4 MPa to 12 MPa, the volumetric strain–average stress hysteretic curve shifted to the left in turn and the corresponding permeability gradually increased. When the confining pressure increased to 16 MPa and 20 MPa, the volumetric strain–average stress hysteretic curve shifted to the right in turn and the corresponding permeability showed a decreasing trend. No matter what the value of CLT, the magnitude of sandstone permeability gradually decreased and the decreasing trend became flat as the confining pressure increased, especially for σ3 = 16 MPa and 20 MPa.
- (c)
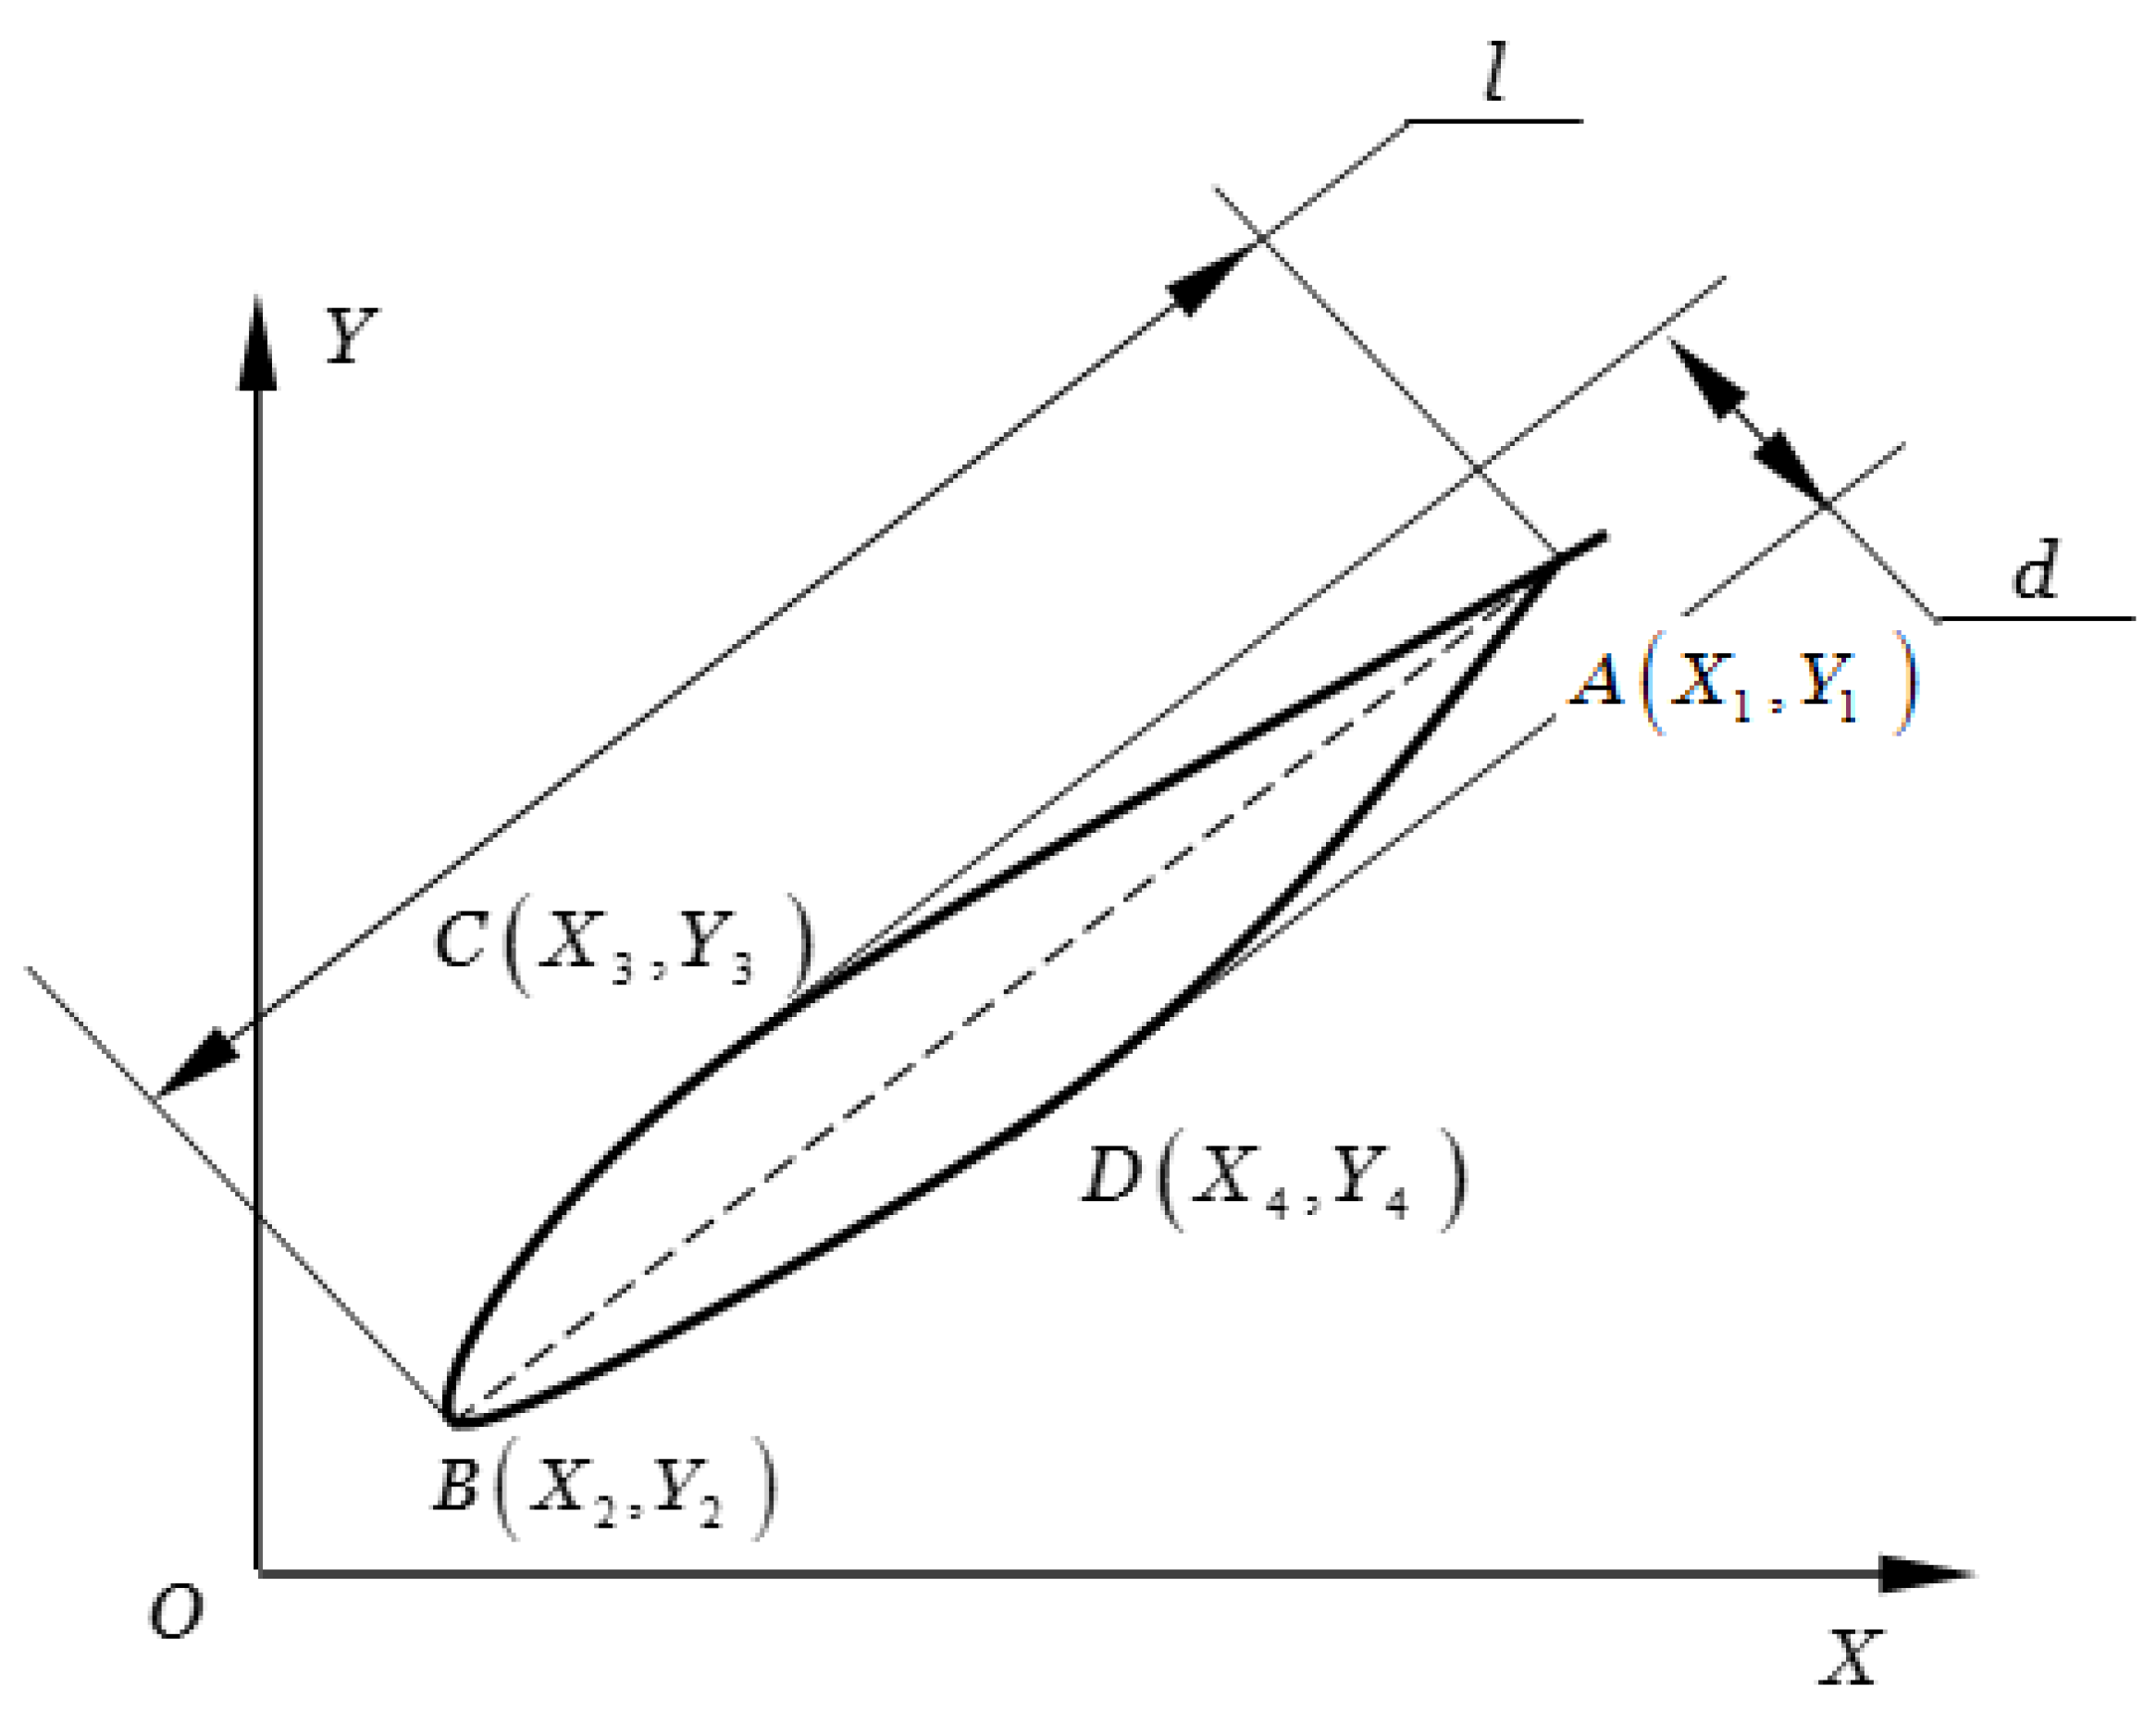
- A method to characterize the recovery rate of post-peak permeability was proposed by calculating the breadth–length ratio of volumetric strain–average stress hysteretic curve under different CLT and confining pressures. No matter what the value of the confining pressure, the hysteresis area of the first cycle was larger than that of the last three cycles. The hysteresis areas of last three cycles are basically equal, indicating that the plastic deformation generated in the first cycle was larger than that generated in the last three cycles. This indicated that the sample mainly produced elastic deformation after plastic deformation and the recovery rate of the permeability increased with the increase of CLT.
- (d)
- Based on 3D reconstruction results of the sandstone’s internal structure before and after the experiment, pore diameter, effective porosity, and connectivity of the initial sample were smaller than those after the experiment, while seepage path length and tortuosity were larger than those after the experiment. As the confining pressure increased, the pore diameter, effective porosity, and connectivity all decreased due to the more easily compacted pores and cracks under the high confining pressure, lower connectivity, and permeability; but the length and tortuosity of the seepage path increased due to a more significant shear failure phenomenon where the seepage path became more tortuous, that is, the greater the tortuosity, the longer the seepage path.
Author Contributions
Funding
Institutional Review Board Statement
Informed Consent Statement
Data Availability Statement
Acknowledgments
Conflicts of Interest
References
- Wang, W.X.; Sui, W.H.; Faybishenko, B.; Stringfellow, W.T. Permeability variations within mining-induced fractured rock mass and its influence on groundwater inrush. Environ. Earth Sci. 2016, 75, 326. [Google Scholar] [CrossRef]
- Shi, X.; Meng, Z. Coupling effect of mining-induced strain field and permeability coefficient field in surrounding rock of working face. Coal Geol. Explor. 2018, 46, 143–150. [Google Scholar]
- Wang, L.; Kong, H.; Karakus, M. Hazard assessment of groundwater inrush in crushed rock mass: An experimental investigation of mass-loss-induced change of fluid flow behavior. Eng. Geol. 2020, 277, 105812. [Google Scholar] [CrossRef]
- Wang, J.A.; Park, H.D. Fluid permeability of sedimentary rocks in a complete stress–strain process. Eng. Geol. 2002, 63, 291–300. [Google Scholar] [CrossRef]
- Wang, G.; Xue, D.; Gao, H.L.; Zhou, H.W. Study on permeability characteristics of coal rock in complete stress-strain process. J. China Coal Soc. 2012, 37, 107–112. [Google Scholar]
- Guo, Q.; Xian, X.; Zhou, J. Effect of Volumetric Strain on Permeability of Coal in Complete Stress-strain Process. Chin. J. Undergr. Space Eng. 2015, 11, 1137–1143. [Google Scholar]
- Zhang, C.; Gao, M.; Zhang, Z.; Zhang, R.; Li, G. Research on permeability characteristics of raw coal in complete stress-strain process under different gas pressure. J. China Coal Soc. 2015, 40, 836–842. [Google Scholar]
- Zhang, B.; Bai, H.; Zhang, K. Research on permeability characteristics of karst collapse column fillings in complete stress-strain process. J. Min. Saf. Eng. 2016, 33, 734–740. [Google Scholar]
- Zhang, D.W.; Dong-He, Y.U.; Che, H.; Liu, G.H.; Zhu, J.; Jian-Zhao, L.I.; Wang, Z.G. Experimental Research and Application on Permeability Characteristics of Coal Rock in Complete Stress-Strain Process for High Rank Coal. Coal Technol. 2018, 37, 181–183. [Google Scholar]
- Zhang, X.M.; Zhang, D.M.; Leo, C.J.; Yin, G.Z.; Feng, D.; Liyanapathirana, D.S. Damage Evolution and Post-peak Gas Permeability of Raw Coal Under Loading and Unloading Conditions. Transp. Porous Media 2017, 117, 465–480. [Google Scholar] [CrossRef]
- Guo, J.; Liu, J.; Li, Q.; Xu, C.; Chen, S. Variation law of coal permeability under cyclic loading and unloading. Therm. Sci. 2019, 23, 215. [Google Scholar] [CrossRef] [Green Version]
- Guo, J.; Liu, J.; Li, Q.; Chen, Z. Study on the Permeability Evolution and Its Formation Mechanism of Xiaojihan Aquifer Coal Seam under Plastic Flow. Geofluids 2020, 2020, 2147503. [Google Scholar] [CrossRef]
- Guo, J.; Liu, J.; Li, Q.; Chen, Z. Experimental study on the failure law of water-bearing coal and the evolution of permeability under plastic flow. Environ. Earth Sci. 2020, 79, 349. [Google Scholar] [CrossRef]
- Zhang, Z.; Nemcik, J.; Ma, S. Micro- and macro-behaviour of fluid flow through rock fractures: An experimental study. Hydrogeol. J. 2013, 21, 1717–1729. [Google Scholar] [CrossRef]
- Fan, M.; Liu, Y.K.; Liang, S. The Characterization of the Rock Microscopic Pore Structure before and after Strong Base ASP Flooding. Adv. Mater. Res. 2014, 941–944, 2596–2600. [Google Scholar] [CrossRef]
- Yan, G.; Sun, J.; Liu, X.; Jiang, L.; Geosciences, S.O. Characterization of Microscopic Pore Structure of Reservoir Rock and Its Effect on Permeability. Well Logging Technol. 2014, 38, 28–32. [Google Scholar]
- Desbois, G.; Hhne, N.; Urai, J.L.; Bésuelle, P.; Viggiani, G. Cataclastic deformation of triaxially deformed, cemented mudrock (Callovo Oxfordian Clay): An experimental study at the micro/nano scale using BIB-SEM. Solid Earth Discuss. 2016. [Google Scholar] [CrossRef]
- Botha, P.; Sheppard, A.P. Mapping permeability in low-resolution micro-CT images: A multiscale statistical approach. Water Resour. Res. 2016, 52, 4377–4398. [Google Scholar] [CrossRef] [Green Version]
- Liu, Z.; Wu, H. Pore-scale study on flow and heat transfer in 3D reconstructed porous media using micro-tomography images. Appl. Therm. Eng. 2016, 100, 602–610. [Google Scholar] [CrossRef]
- Starnoni, M.; Pokrajac, D.; Neilson, J.E. Computation of fluid flow and pore-space properties estimation on micro-CT images of rock samples. Comput. Geosci. 2017, 106, 118–129. [Google Scholar] [CrossRef] [Green Version]
- Abu-Al-Saud, M.; Gmira, A.; Al-Enezi, S.; Yousef, A. Pore-Scale Simulation of Fluid Flow in Carbonates using Micro-CT Scan Images: International Petroleum Technology Conference [C]. OnePetro 2020. [Google Scholar] [CrossRef]
- Adler, P.M.; Jacquin, C.G.; Quiblier, J.A. Flow in simulated porous media. Int. J. Multiph. Flow 1990, 16, 691–712. [Google Scholar] [CrossRef]
- Levitz, P. Off-lattice reconstruction of porous media: Critical evaluation, geometrical confinement and molecular transport. Adv. Colloid Interface Sci. 1998, 76–77, 71–106. [Google Scholar] [CrossRef]
- Quiblier, J.A. A New Three-Dimensional Modeling Technique for Studying Porous Media. J. Colloid Interface Sci. 1993, 98, 84–102. [Google Scholar] [CrossRef]
- Yeong, C.L.Y.; Torquato, S. Reconstructing random media. Phys. Rev. E 1998, 57, 495–506. [Google Scholar] [CrossRef] [Green Version]
- Yeong, C.; Torquato, S. Reconstructing random media. II. Three-dimensional media from two-dimensional cuts. Phys. Rev. E Stat. Phys. Plasmas Fluids Relat. Interdiscip. Top. 1998, 58, 224–233. [Google Scholar] [CrossRef] [Green Version]
- Hazlett, R.D. Statistical characterization and stochastic modeling of pore networks in relation to fluid flow. Math. Geol. 1997, 29, 801–822. [Google Scholar] [CrossRef]
- Okabe, H.; Blunt, M.J. Prediction of permeability for porous media reconstructed using multiple-point statistics. Phys. Rev. E Stat. Nonlinear Soft Matter Phys. 2004, 70, 66135. [Google Scholar] [CrossRef] [Green Version]
- Okabe, H.; Blunt, M.J. Pore space reconstruction using multiple-point statistics. J. Pet. Sci. Eng. 2005, 46, 121–137. [Google Scholar] [CrossRef]
- Arpat, G.B.; Caers, J. Conditional Simulation with Patterns. Math. Geol. 2007, 39, 177–203. [Google Scholar] [CrossRef]
- Strebelle, S. Conditional Simulation of Complex Geological Structures Using Multiple-Point Statistics. Math. Geol. 2002, 34, 1–21. [Google Scholar] [CrossRef]
- Song, S. An improved simulated annealing algorithm for reconstructing 3D large-scale porous media. J. Pet. Sci. Eng. 2019, 182, 106343. [Google Scholar] [CrossRef]
- Sbsa, B.; Jfla, B.; Hyn, A.; Xlc, A.; Hai, P.A.; Bxh, C. A new automatic thresholding algorithm for unimodal gray-level distribution images by using the gray gradient information. J. Pet. Sci. Eng. 2020, 190, 107074. [Google Scholar]
- Gong, P.; Ni, X.; Chen, Z.; Wu, Y.; Wu, J. Experimental Investigation on Sandstone Permeability under Plastic Flow: Permeability Evolution Law with Stress Increment. Geofluids 2019, 2019, 2374107. [Google Scholar] [CrossRef]


| Confining Pressure (MPa) | Hydraulic Pressure (MPa) | |
|---|---|---|
| Upper Water Pressure | Lower Water Pressure | |
| 4 | 3 | 1.5 |
| 8 | 7 | 5.5 |
| 12 | 11 | 9.5 |
| 16 | 15 | 13.5 |
| 20 | 19 | 17.5 |
| Number | Axial Strain ε1 (%) | Hoop Strain ε3 (%) | Volume Strain εV (%) | Permeability k (10−16 m2) |
|---|---|---|---|---|
| 1 | 0.0000225 | −0.00527 | −0.01054 | 0.91 |
| 2 | 0.000657 | −0.00533 | −0.01001 | 0.288 |
| 3 | 0.00425 | −0.0091 | −0.01402 | 2.91 |
| 4 | 0.00629 | −0.00939 | −0.01127 | 2.04 |
| 5 | 0.00747 | −0.0113 | −0.01521 | 4.41 |
| 6 | 0.00476 | −0.00851 | −0.01224 | 2.83 |
| 7 | 0.00824 | −0.0123 | −0.01628 | 5.22 |
| 8 | 0.00559 | −0.00947 | −0.01335 | 4.01 |
| 9 | 0.00966 | −0.0136 | −0.01755 | 5.72 |
| 10 | 0.00667 | −0.0106 | −0.0145 | 4.88 |
| 11 | 0.0101 | −0.0145 | −0.01894 | 5.85 |
| 12 | 0.005691 | −0.01139 | −0.01708 | 4.94 |
| σ3/MPa | k/10−17 | |||||
| U1 | U2 | U3 | U4 | U5 | ||
| Unloading | 4 | 29.383 | 42.741 | 49.792 | 54.820 | 57.837 |
| 8 | 25.755 | 35.307 | 36.305 | 45.866 | 49.134 | |
| 12 | 14.580 | 31.493 | 34.761 | 37.869 | 40.804 | |
| 16 | 10.061 | 10.247 | 8.007 | 6.187 | 4.740 | |
| 20 | 7.056 | 6.308 | 5.644 | 4.608 | 3.790 | |
| σ3/MPa | k/10−17 | |||||
| L1 | L2 | L3 | L4 | L5 | ||
| Loading | 4 | 23.850 | 35.943 | 41.731 | 51.049 | 49.523 |
| 8 | 18.235 | 23.267 | 34.343 | 42.393 | 40.364 | |
| 12 | 14.432 | 20.111 | 22.283 | 25.785 | - | |
| 16 | 10.825 | 8.491 | 6.624 | 4.816 | - | |
| 20 | 6.699 | 5.130 | 4.215 | 3.169 | - | |
| Confining Pressure (MPa) | Cyclic Loading–Unloading Time | |||
|---|---|---|---|---|
| 1 | 2 | 3 | 4 | |
| 4 | 0.00134 | 0.00127 | 0.00122 | 0.00123 |
| 8 | 0.00269 | 0.00242 | 0.00251 | 0.00248 |
| 12 | 0.0049 | 0.0035 | 0.0032 | 0.0037 |
| 16 | 0.0065 | 0.0051 | 0.0057 | 0.0054 |
| 20 | 0.0076 | 0.0061 | 0.0059 | 0.0064 |
| Experimental Condition | Confining Pressure (MPa) | Pore Diameter (μm) | Effective Porosity (%) | Connectivity (%) | Seepage Path Length (μm) | Tortuosity |
|---|---|---|---|---|---|---|
| Before testing | 0 | 6.32 | 30.36 | 50.52 | 81.58 | 5.6 |
| After testing | 4 | 9.53 | 57.96 | 80.35 | 45.43 | 2.9 |
| 8 | 8.97 | 51.47 | 76.32 | 55.24 | 3.4 | |
| 12 | 8.49 | 45.48 | 68.46 | 60.47 | 3.7 | |
| 16 | 7.68 | 41.46 | 60.47 | 64.25 | 4.1 | |
| 20 | 6.53 | 36.71 | 51.29 | 72.69 | 4.8 |
Publisher’s Note: MDPI stays neutral with regard to jurisdictional claims in published maps and institutional affiliations. |
© 2022 by the authors. Licensee MDPI, Basel, Switzerland. This article is an open access article distributed under the terms and conditions of the Creative Commons Attribution (CC BY) license (https://creativecommons.org/licenses/by/4.0/).
Share and Cite
Chen, L.; Zhang, D.; Zhang, W.; Guo, J.; Yao, N.; Fan, G.; Zhang, S.; Wang, X.; Wu, P. Experimental Investigation on Post-Peak Permeability Evolution Law of Saturated Sandstone under Various Cyclic Loading–Unloading and Confining Pressure. Water 2022, 14, 1773. https://doi.org/10.3390/w14111773
Chen L, Zhang D, Zhang W, Guo J, Yao N, Fan G, Zhang S, Wang X, Wu P. Experimental Investigation on Post-Peak Permeability Evolution Law of Saturated Sandstone under Various Cyclic Loading–Unloading and Confining Pressure. Water. 2022; 14(11):1773. https://doi.org/10.3390/w14111773
Chicago/Turabian StyleChen, Liang, Dongsheng Zhang, Wei Zhang, Jingna Guo, Nan Yao, Gangwei Fan, Shizhong Zhang, Xufeng Wang, and Peng Wu. 2022. "Experimental Investigation on Post-Peak Permeability Evolution Law of Saturated Sandstone under Various Cyclic Loading–Unloading and Confining Pressure" Water 14, no. 11: 1773. https://doi.org/10.3390/w14111773