
Physical Model Study of an Intermittent Rainfall-Induced Gently Dipping Accumulation Landslide


1
Institute of Mountain Hazards and Environment, Chinese Academy of Sciences, Chengdu 610041, China
2
School of Civil Engineering, Henan Polytechnic University, Jiaozuo 454000, China
*
Author to whom correspondence should be addressed.
Water 2022, 14(11), 1770; https://doi.org/10.3390/w14111770
Submission received: 7 April 2022
/
Revised: 22 May 2022
/
Accepted: 28 May 2022
/
Published: 31 May 2022
(This article belongs to the Section Soil and Water)
Abstract
:Many slope failures have been observed in deep-cutting gorges in Southwest China due to rainfall events. This study conducted model-based tests of the failure of a gently dipping accumulation slope caused by intermittent rainfall. The physical model was established by configuring soil samples based on similarity theory and direct shear test data. Intermittent rainfall was simulated by supplying surface runoff and bottom pressure water of the slope. The deformation, earth pressure, and pore pressure were observed during the test using a series of transducers. The results of this research showed that slope failure was first initiated at the toe of the slope. Staged sliding failure then occurred, which spread the unstable zone to the trailing edge of the slope. As infiltration of rainwater continued, the pore pressure increased and the matric suction and effective stress at the bedrock surface decreased, causing failure of the slope.
1. Introduction
Gently dipping accumulation slopes are widely distributed in deep-cut canyons in southwestern China [1,2,3,4]. The slope inclination is about 0° to 10°, which is less than the internal friction angle of the soil body. According to the traditional limit equilibrium theory, the safety factor of the slope is high, and it is difficult to trigger sliding under normal circumstances, but the gently dipping accumulation landslides frequently occur under rainfall. For example, in September 2011, more than 1000 gently dipping landslides occurred in Nanjiang County, Sichuan, China, severely affecting local villages and farmland [5]. In September 2014, four gently dipping landslides occurred in Jiangkou Town, Yunyang County, Chongqing, China. Forty-five houses were razed to the ground, fields were turned into barren slopes, roads were washed away, and infrastructure was severely damaged [6]. In May 2022, a landslide occurred from Jiantuo Bay to Luoqi K1728 in Chongqing, China. The landslide volume was about 300 m3, blocking road traffic.
Rainstorms are the most frequent cause of landslides in China [7,8,9]. Guo et al. (2019) showed that accumulation slopes may be subject to successive failure with increasing water content[10]. Cho et al. (2014) showed that there was a rapid increase in the moisture content of unsaturated soils due to rainfall, and suggested that this resulted in a decrease in matric suction, leading to landslides [11]. Scaringi et al. (2018) concluded that the shear strength of the soil-bedrock interface of the accumulation layer may decrease with an increase in the creep slip rate of the slope [12]. Continuous infiltration of rainwater will increase the pore water pressure and can induce soil liquefaction, leading to flow slide [13,14,15]. In general, there is a relatively impervious layer inside the gently dipping accumulation layer slope which causes the build-up of high pore water pressure areas in some parts of the slope [16]. Tohari et al. (2007) conducted a series of experiments on a model slope[17]; the results showed that the foot of the slope would become saturated first under the action of rainfall, and local failure would then occur in the saturated zone. Many theoretical methods have been developed to reveal the temporal and spatial dependence of rainfall-induced landslides and to monitor the process of movement in large-scale landslides. However, the physical process of initiation of a gently dipping accumulation landslide under the action of intermittent rain is still unclear.
Physical modelling has become one of the most effective methods for solving such landslide problems and can achieve a high level of similarity with a natural slope. In addition, the rainfall-induced successive failures of accumulation layer slopes have been extensively studied using physical model tests [18,19]. In particular, in research by Ram et al. (2014), the configuration of the physical model was composed of a transparent rectangular sink with an adjustable slope [9]. The soil in this model was medium-grained silica sand S6, and the model allowed for the use of different inclinations. Ram et al. (2014) found that when the moisture content near the toe was almost at full saturation, the shear strength decreased due to an increase in pore pressure, resulting in the sudden failure of the toe of the slope [9]. This was then extended upwards retrogressively, over multiple slides. The initial failure characteristics of this slope are similar to those found by [20].
Most studies of rainfall-induced landslides consider the sliding mechanism, deformation characteristics, and rainfall types; however, they rarely consider the influence of intermittent rainfall on the deformation and failure characteristics of gently dipping accumulation landslides. In this paper, a typical intermittent rainfall-induced landslide of a gently dipping accumulation slope was chosen for a physical modelling test. Intermittent rainfall conditions were used in the test. This study involved detailed observation of the successive failure processes and the collection of monitoring data including displacement, earth pressure, and pore water pressure. The deformation characteristics and mechanisms of intermittent rainfall-induced gently dipping accumulation landslides were investigated.
2. Case History
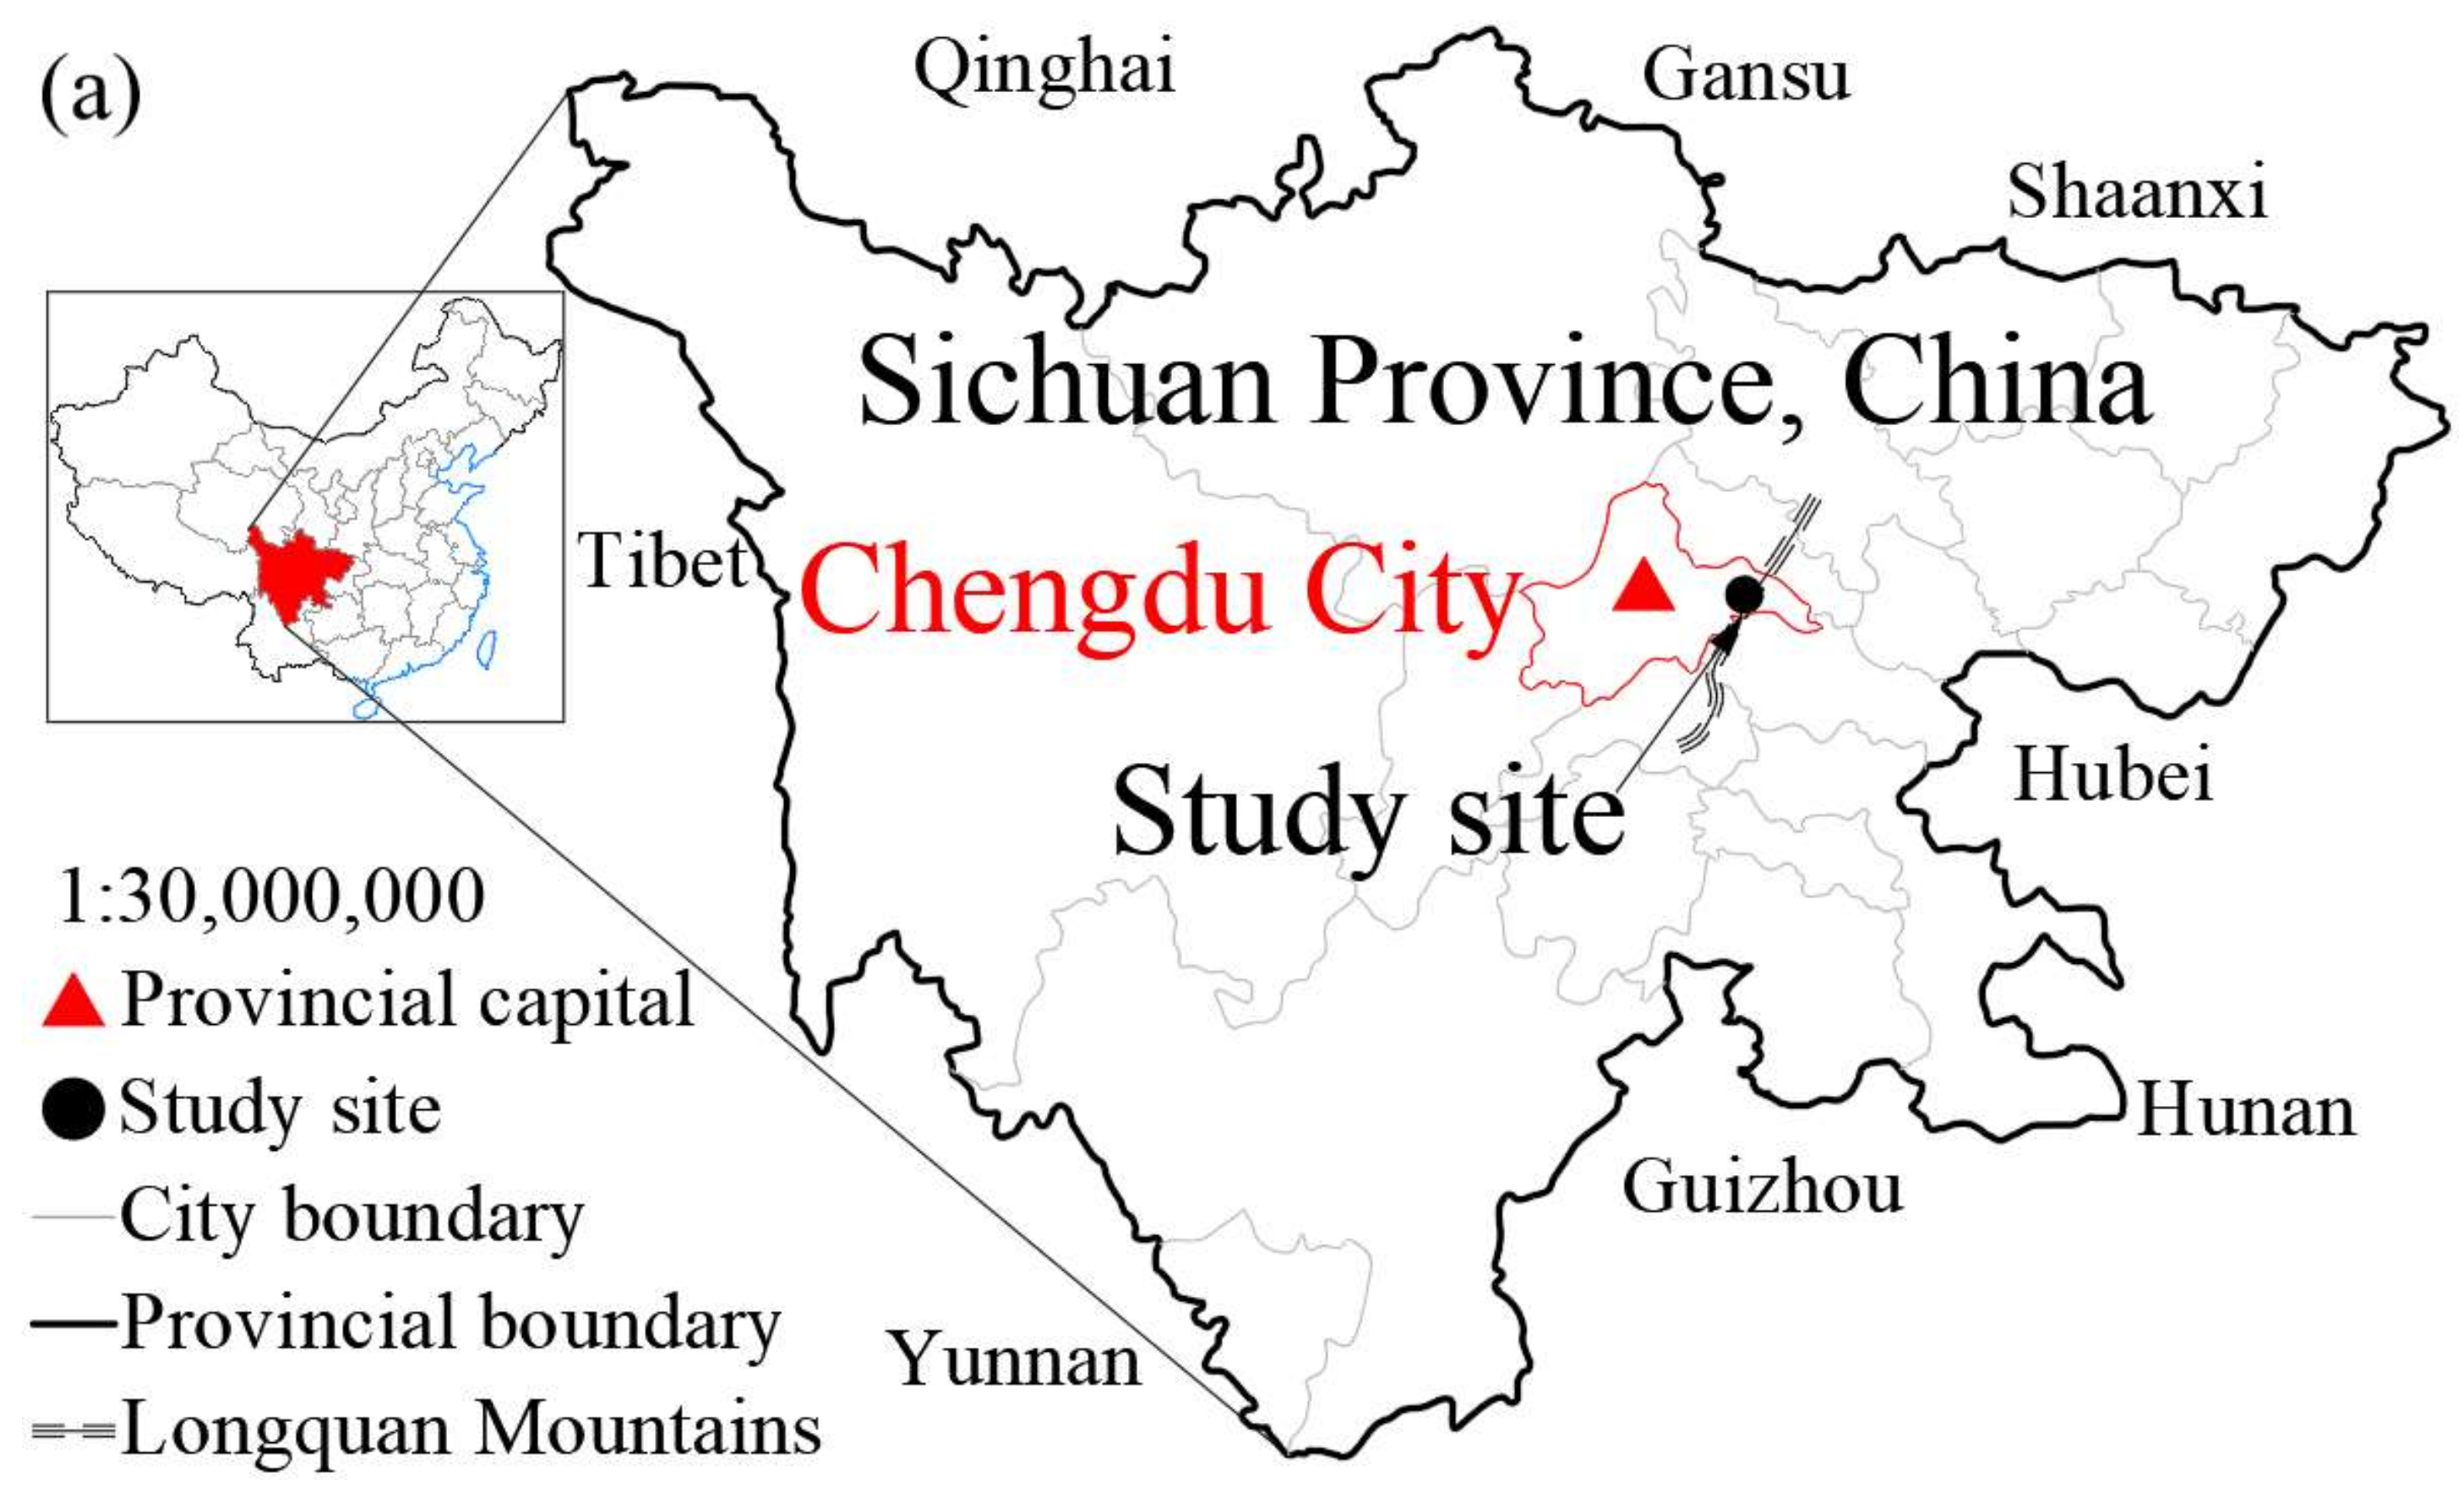
Longquanyi District is located in the middle of the Longquan Mountains, 28 km east of Chengdu City (Figure 1a). In this region, the mountainous area is about 12 km wide, and the ridge is 20 km long, accounting for 40% of the area. Landslide hazards are frequent and very destructive in this area. More than 30 landslides of gently dipping accumulation slopes have occurred over the past eight years. The locations of these landslides are mainly distributed over the front side of the mountain. For instance, Zhongjiashan landslide has a slope length of 192 m, width of 70 m, and a volume of 87.360 m3 [21].
In this area, the average annual rainfall is 1077 mm, while the average annual evaporation is 668 mm. May to September are the months with the highest rainfall [1] (Figure 2a), therefore a large number of landslides of gently dipping accumulation slopes would occur during and after this period of time. The occurrence of landslides after heavy rainfall indicates that the shear strength of the accumulation layer changes throughout the infiltration of rainwater.
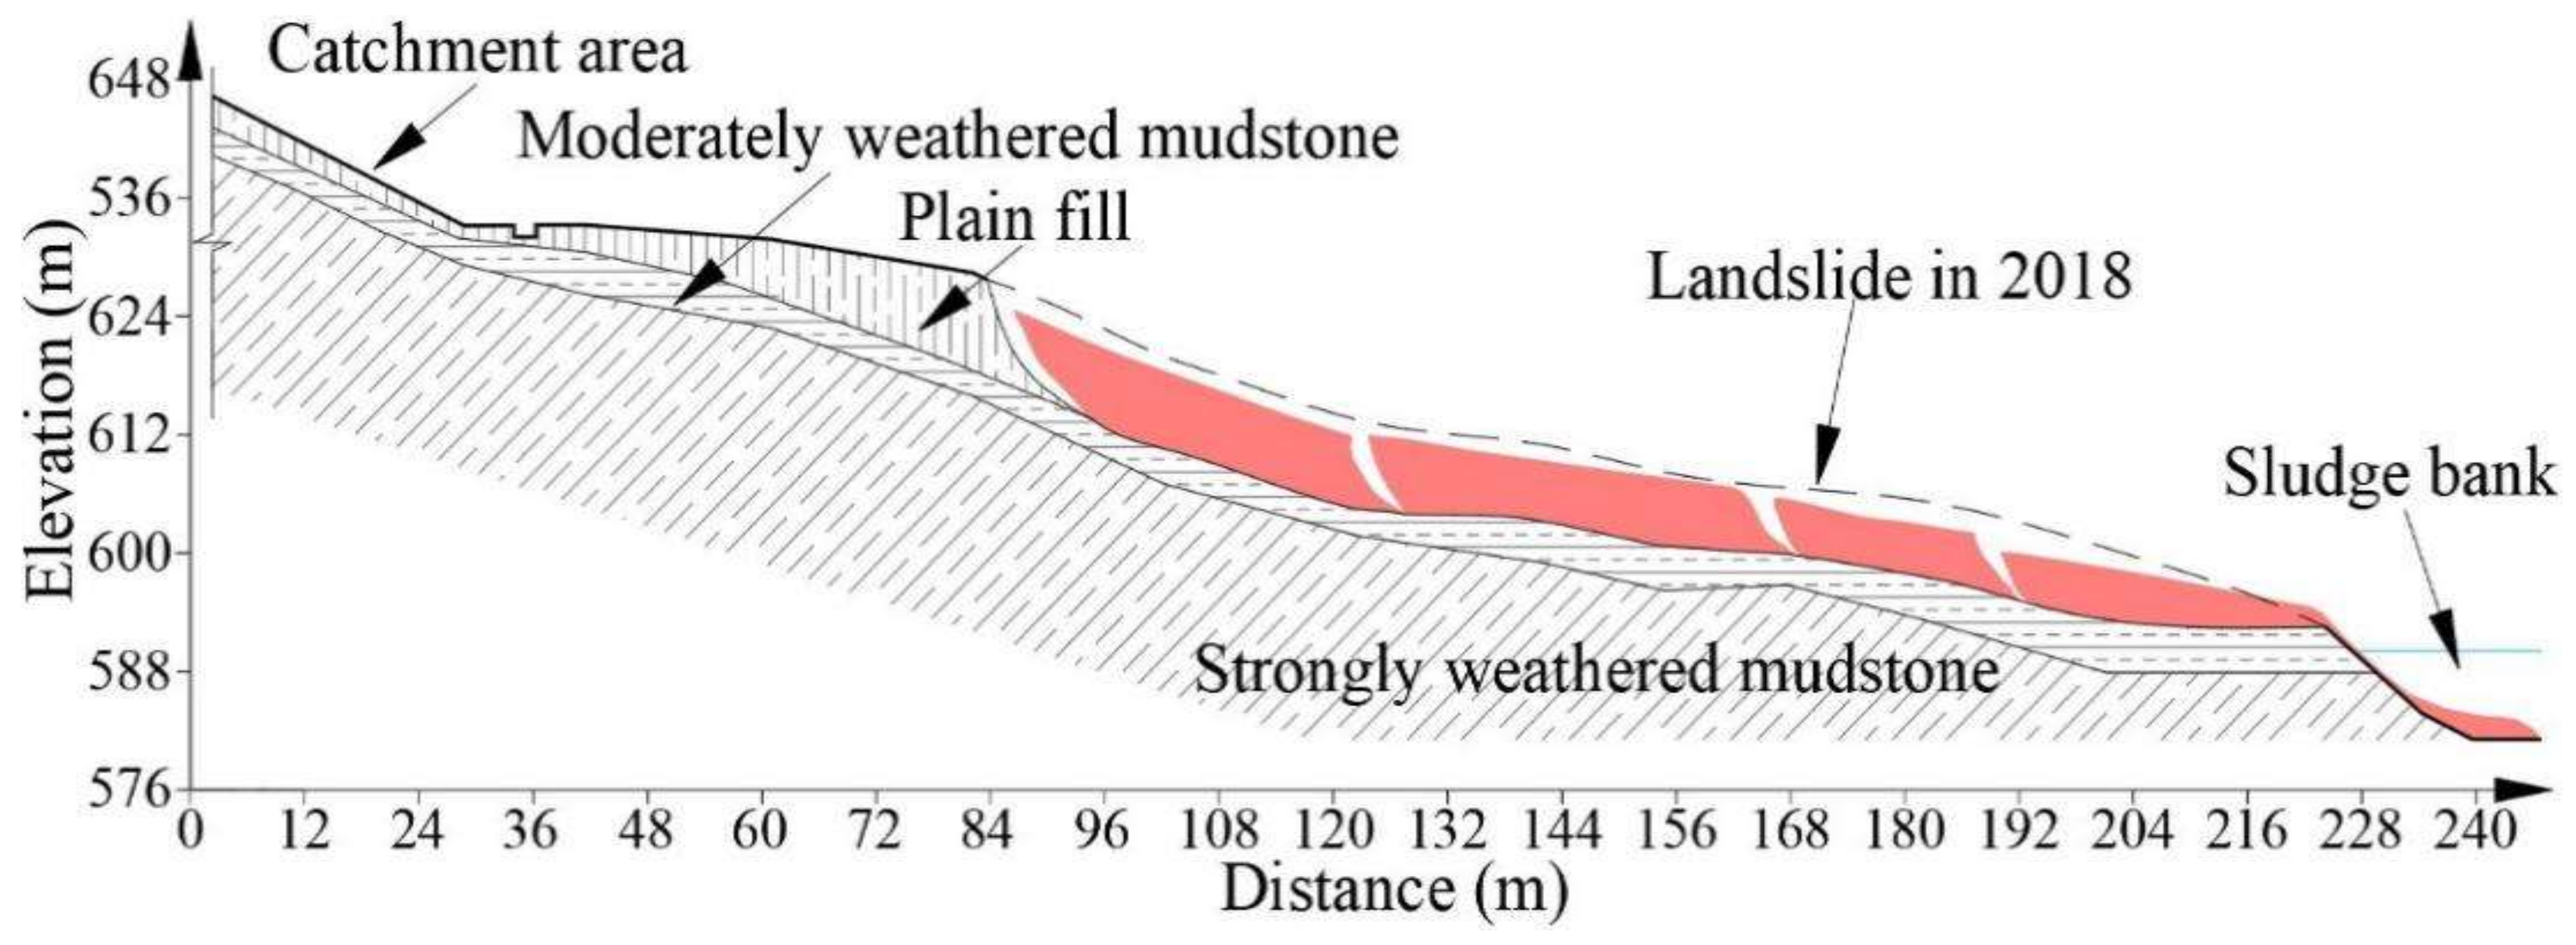
A new gently dipping accumulation landslide occurred at Yingtaogou on 23 June 2018. This landslide was located on a gentle slope (gradient: 0°–16°) on the east side of the sludge reservoir in Longquanyi District (location: N 30°39′07″, E 104°21′39″) (Figure 1b–d). Figure 2b shows the daily rainfall data for Yingtaogou in 2018 and water table data obtained using numerical simulation [1]. This landslide was a typical retrogressive failure caused by intermittent rainfall, with an overall length of 200 m and height of 47 m. The deposition buried the exposed bedrock at the foot of the slope and further sliding occurred down to the sludge reservoir (Figure 3). The remaining deposition was distributed along the gradient slip zone in blocks (Figure 1d). The accumulation was composed of the Quaternary Holocene artificial fill layer and slope residual layer. The main components were silty clay, weathered sand, and mudstone fragments, with an average thickness of 6 m. The bedrock was composed of argillaceous sandstone from the Penglaizhen Formation of the Upper Jurassic. The main sliding zone was a thin clay layer (Figure 3). Several transverse tension cracks and landslide steps were observed at the surface of the landslide.
3. Experimental Methodology
3.1. Model Facility and Materials
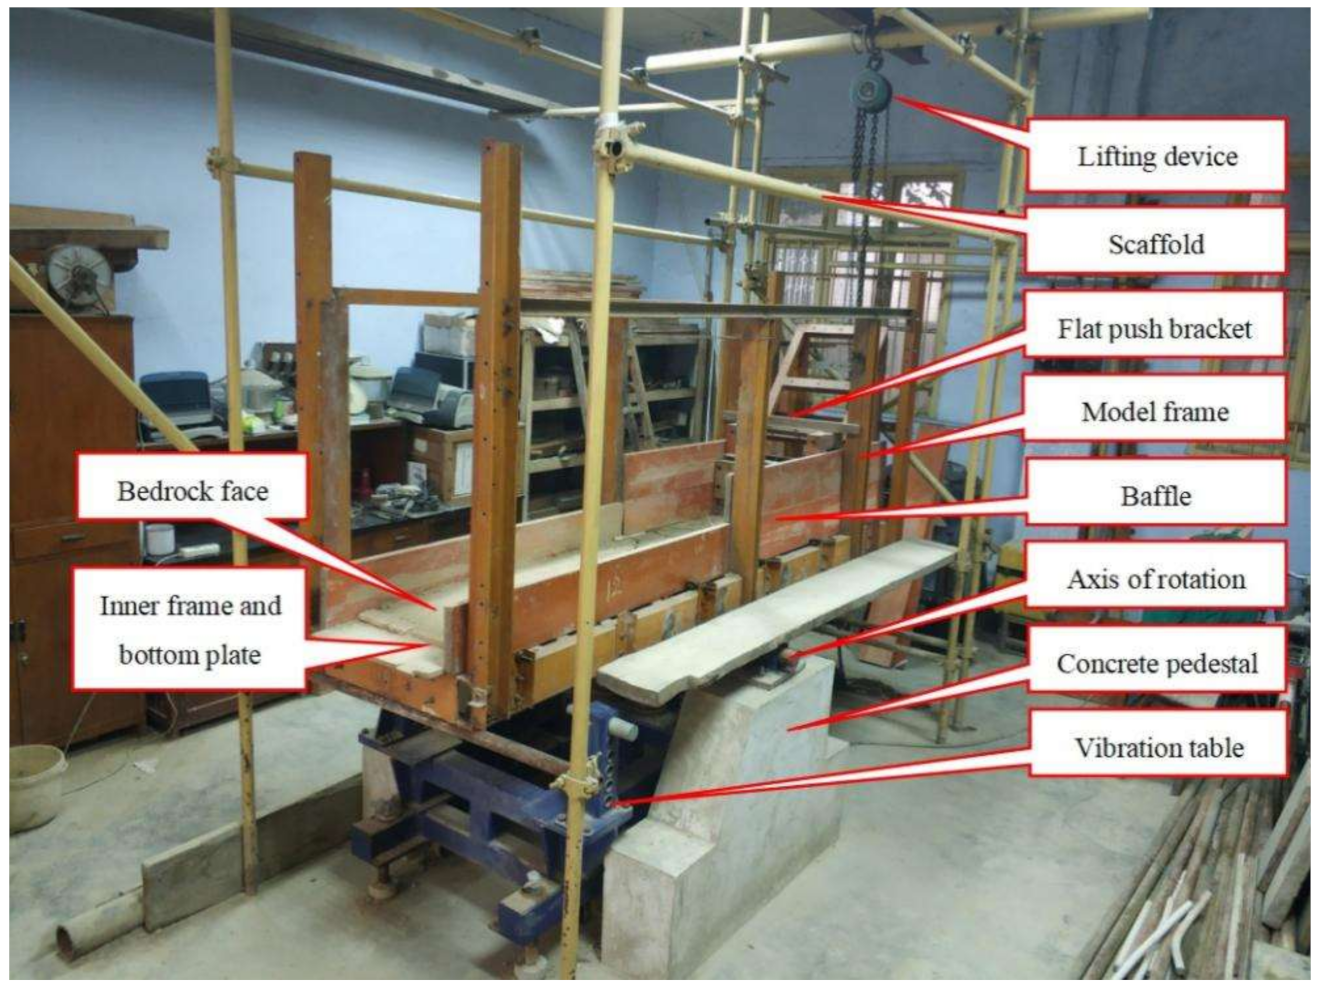
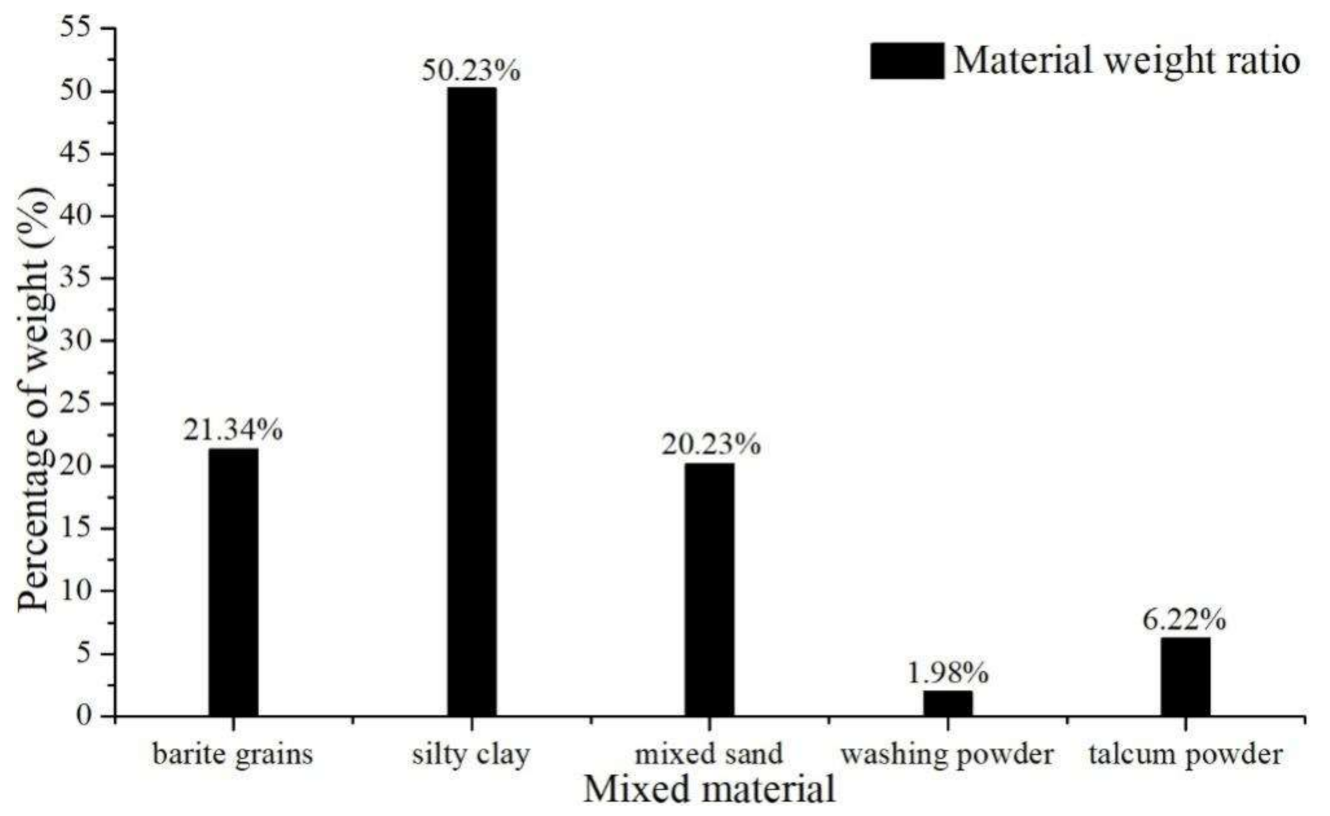
Physical model tests were conducted using the self-designed landslide model test bench facility at the Key Laboratory of Mountain Surface Processes and Ecological Regulation, Chinese Academy of Sciences at the Institute of Mountain Hazards and Environment (CAS) (Figure 4). A rectangular soil box of length 3 m, width 0.5 m and depth 1 m with an adjustable longitudinal slope was used for the test. The axis of rotation and a lifting device were used to adjust the longitudinal slope of the soil box. The borders on both sidewalls of the model were made of transparent plexiglass and baffle. The test soil mix included barite grains, silty clay, mixed sand, surfactant, and talcum. Figure 5 shows the material composition ratio of the test soil. At the bottom of the test box, wood grids and silty clay were used instead of bedrock (Figure 6). A groundwater simulator was installed at the bottom of the soil box to control the water table. A slope surface runoff simulator was installed on the back wall of the tank to control the water flow on the slope surface. The upper accumulation layer was constructed using test soil with a moisture content of 30%. The model was assembled to form the final slope geometry (as shown in Figure 6), i.e., a slope model of length 2.3 m, width 0.52 m, height 0.3 m, and with 14° inclination angle.
3.2. Model Similarity
Based on the similarity principle, the similarity relationship was established as follows [22]:
where is bulk density; is cohesion; is internal friction angle; is thickness of accumulation; is elastic modulus; is Poisson’s ratio; is shear strength; is stress; is strain; and is displacement. Similar criteria are as follows: , , , , , , , . Based on the size of the landslide prototype and the earth box, we set the geometric similarity ratio to , the severity similarity ratio to , and the other similarities as follows.
The test soil sample with a moisture content of 30% and actual soil sample meet a similar properties. The properties of the test and real soils with the moisture content of 30% are summarised in Table 1.
3.3. Instrumentation
The measurement system included an observation system, transducers, and an image capture system. The observation system used nine paper tapes and 45 monitoring points to monitor the displacement of the soil, and the exact locations are shown in Figure 7. The displacement of the paper tape and paper points was regularly measured to determine the deformation characteristics of the slope. Three pore pressure transducers (S1–S3), three inclinometers and six earth pressure transducers were embedded in the model over three longitudinal sections (Figure 7).
The pore pressure transducers were cylindrical, with a length of 150 mm and a water inlet aperture of 18 mm. They were able to measure pore pressures of up 300 kPa, with a resolution of 0.1 kPa. The steel belt underwent bending with the deformation of the soil, and the relative displacement of the soil layers could be obtained from the strain gauges on the steel belt (Figure 6). The earth pressure sensor was a cylinder 25 mm in diameter and 15 mm in thickness, with a maximum measurement value of 200 kPa. Three digital cameras were used to capture the slow deformation and transient failure of the slope, and these were placed at the front, side and top of the soil box (Figure 6).
3.4. Intermittent Rainfall Modelling
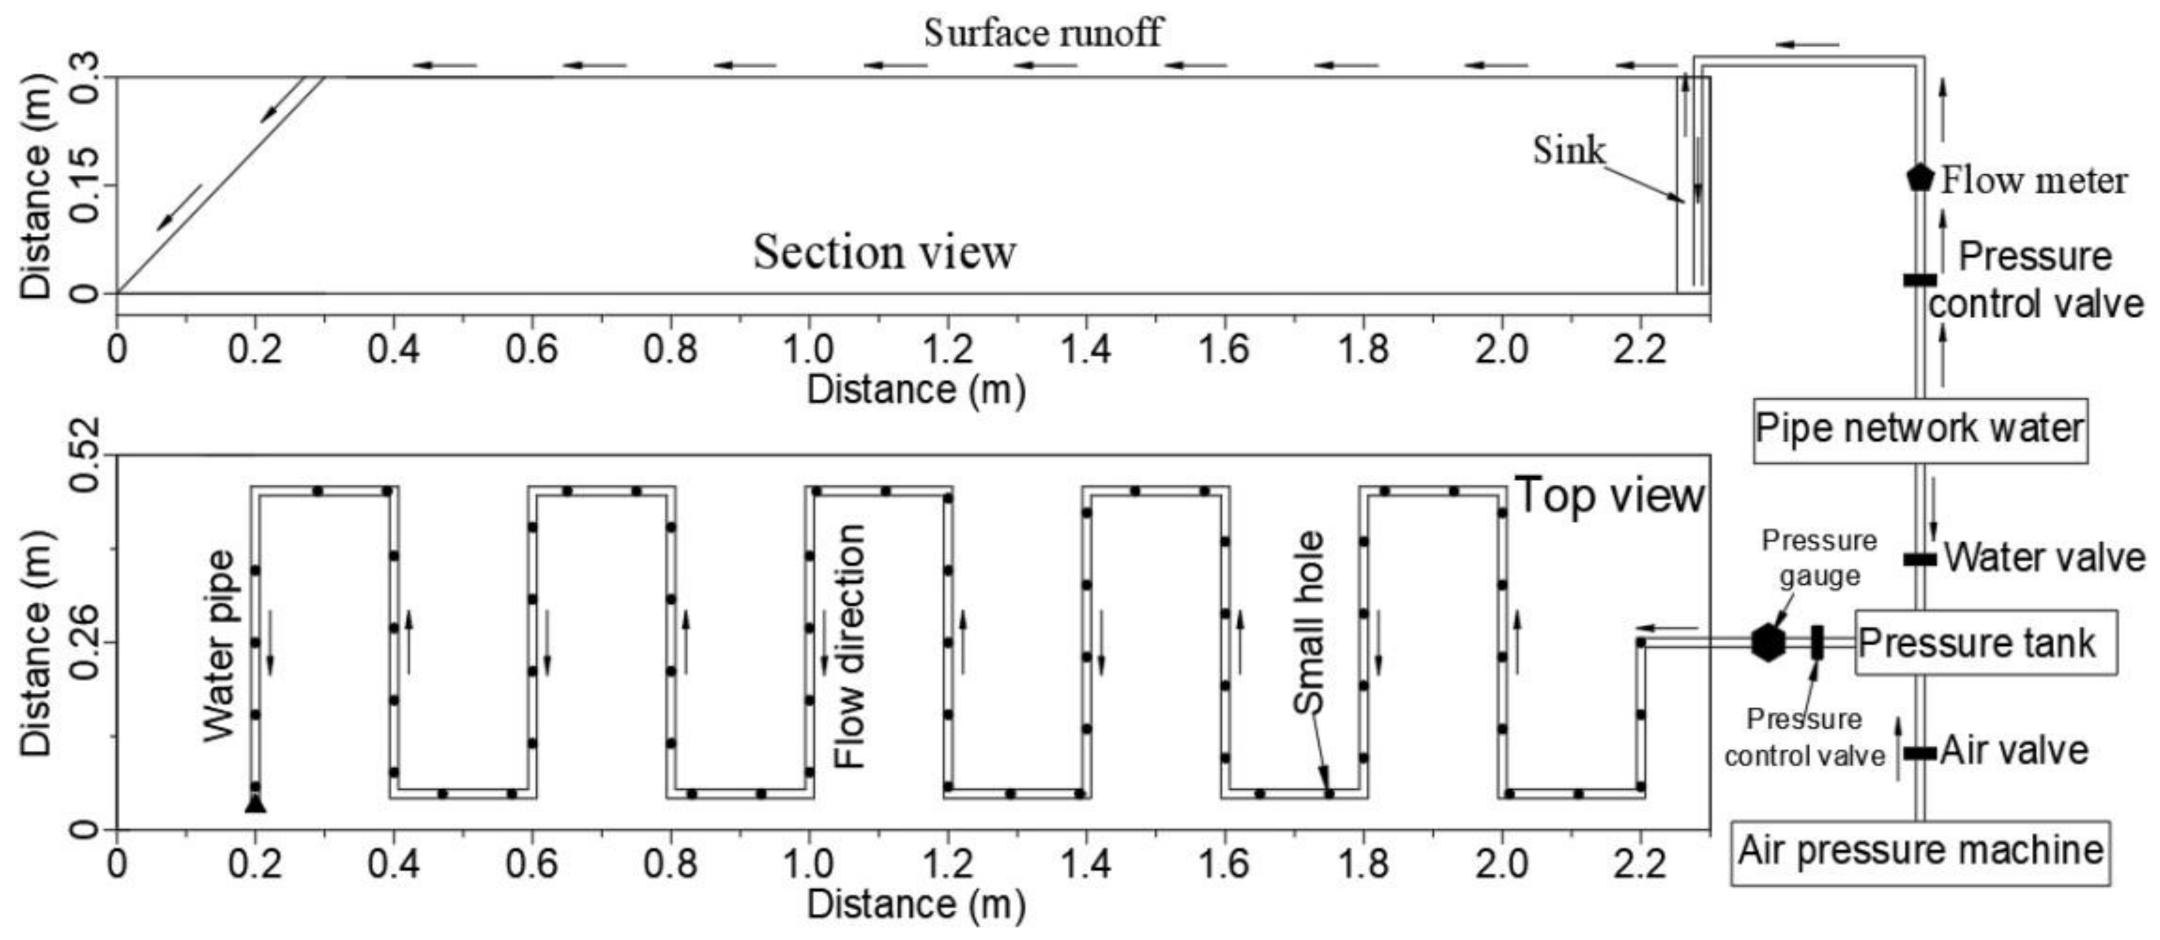
The back of the Yingtaogou slope is a round, chair-shaped catchment area, of which the lithology was mainly weathered argillaceous sandstone. Rainfall tends to gather at the steep rear edge to form slope surface runoff (Figure 1d). Surface water infiltrates downward along the cracks and flows within the basal layer until it emerges at the foot of slope. This has a strong influence on the water table of the accumulation layer slope under the action of intermittent rainfall (Figure 2b). Therefore, slope surface runoff and the water table are controlled instead of the impact of rainfall on a slope. (Figure 6). To simulate surface runoff caused by rainfall, a sink of length 52 cm, height 60 cm and thickness 3 cm was designed and placed at the back of the model slope (Figure 8). Rectangular holes 5 cm long and 1 cm wide were distributed over the upper wall of the sink. These holes were distributed so water in the sink could be discharged to the slope surface. The amount of overflow runoff could be controlled by the flow meter and pressure valve (Figure 8). To simulate the water table caused by rainfall, a perforated pipe of 10 mm in diameter was designed and embedded under the model slope (Figure 8). Two rows of holes 1 mm in diameter were distributed on both sides of the pipe, through which water in the pipe could be introduced to the slope. The water pressure in the porous pipe could be adjusted by air compressors, pressure tanks, and pressure valves to control the water table.
According to the rainfall characteristics of the rainy season in 2018 and the field survey data, the effect of rainfall on the slope of the accumulation layer is mainly manifested as rainfall converges in the chair-shaped steep slope area behind the accumulation layer slope to form the slope surface runoff to provide a sufficient water source for rainfall infiltration; a large number of the slopes' surface runoff quickly infiltrates along the pull-flood interception ditch and the slope surface cracks and converges on the bedrock surface to form a transient groundwater level. Therefore, according to the influence of rainfall on the slope, the rainfall is divided into two control methods, namely slope surface runoff control and groundwater level control.
The eight rains in Yingtaogou were generalised into a peak shaped intermittent rainfall. Each time the torrential rain slope soil reached a saturated state, the average thickness from the impervious bedrock to the slope surface was 6 m, i.e., the pore pressure of the bedrock surface was 60 kPa.
Calculate slope surface runoff based on rainfall and catchment area
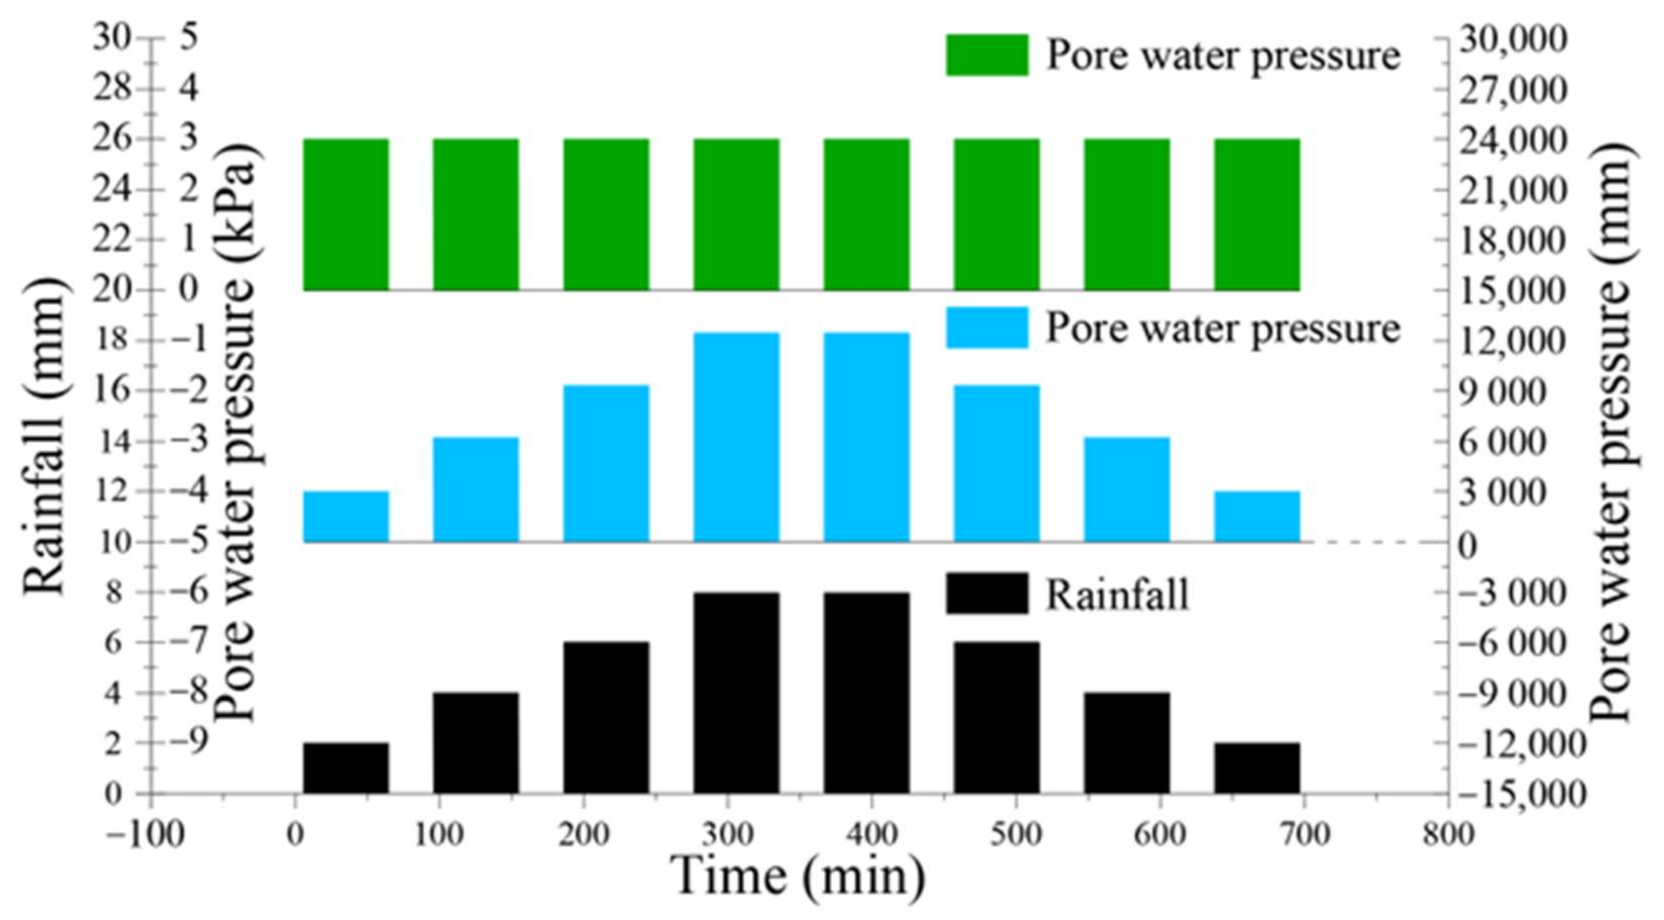
The runoffs for the model slope were calculated as 3120 mm3/min, 6240 mm3/min, 9360 mm3/min and 124,800 mm3/min, and the water table control pressure was 3 kPa (Figure 9).
There was no groundwater in the model prior to the physical test. Firstly, all of the runoff and pressure valves were closed, and the model slope was left for 24 h to reach equilibrium. After this resting stage, it was assumed that the model slope was in a steady state. The test was started by adding water to the sink to a height of 30 cm, and the pore pressure at the boundary line of the base cover in the middle of the slope reached 3 kPa. The test was carried out according to the test program shown in Figure 8. In this program the duration of the rainfall was 1 h and the time between rainfall events was 30 min.
4. Test Results
4.1. Deformation and Failurecharacteristic
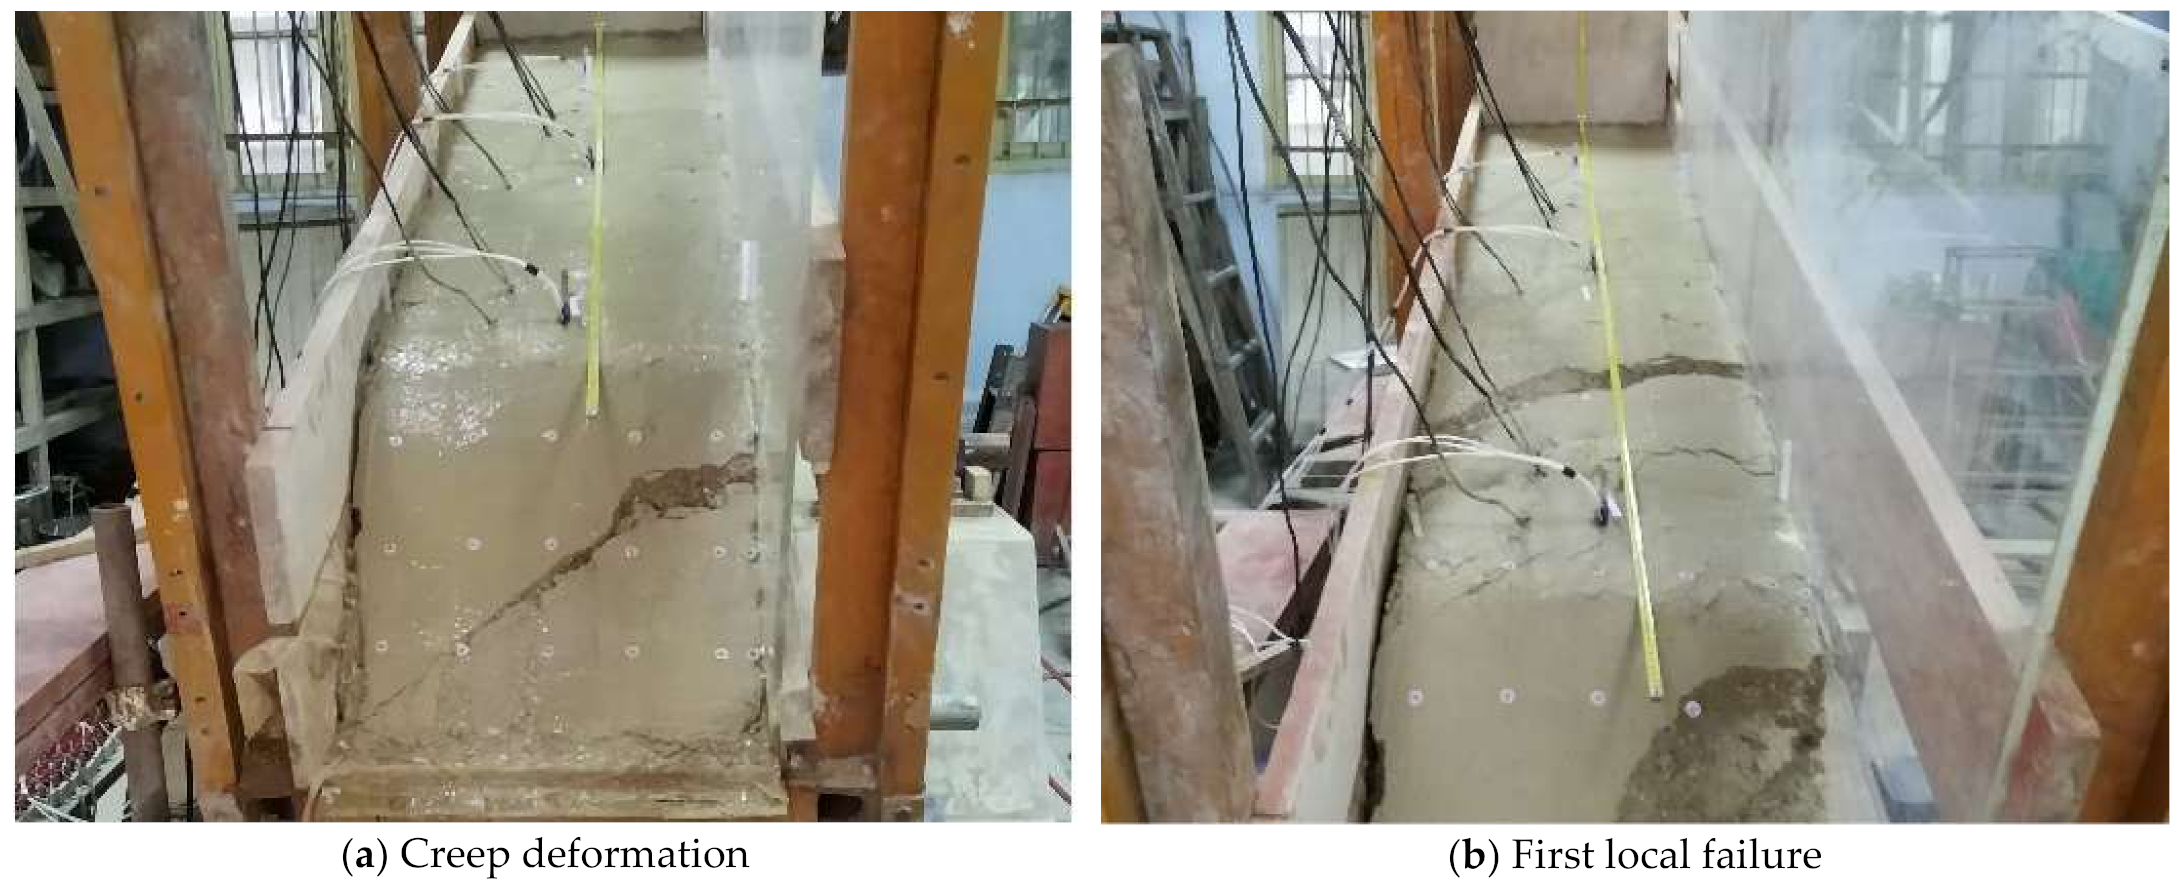
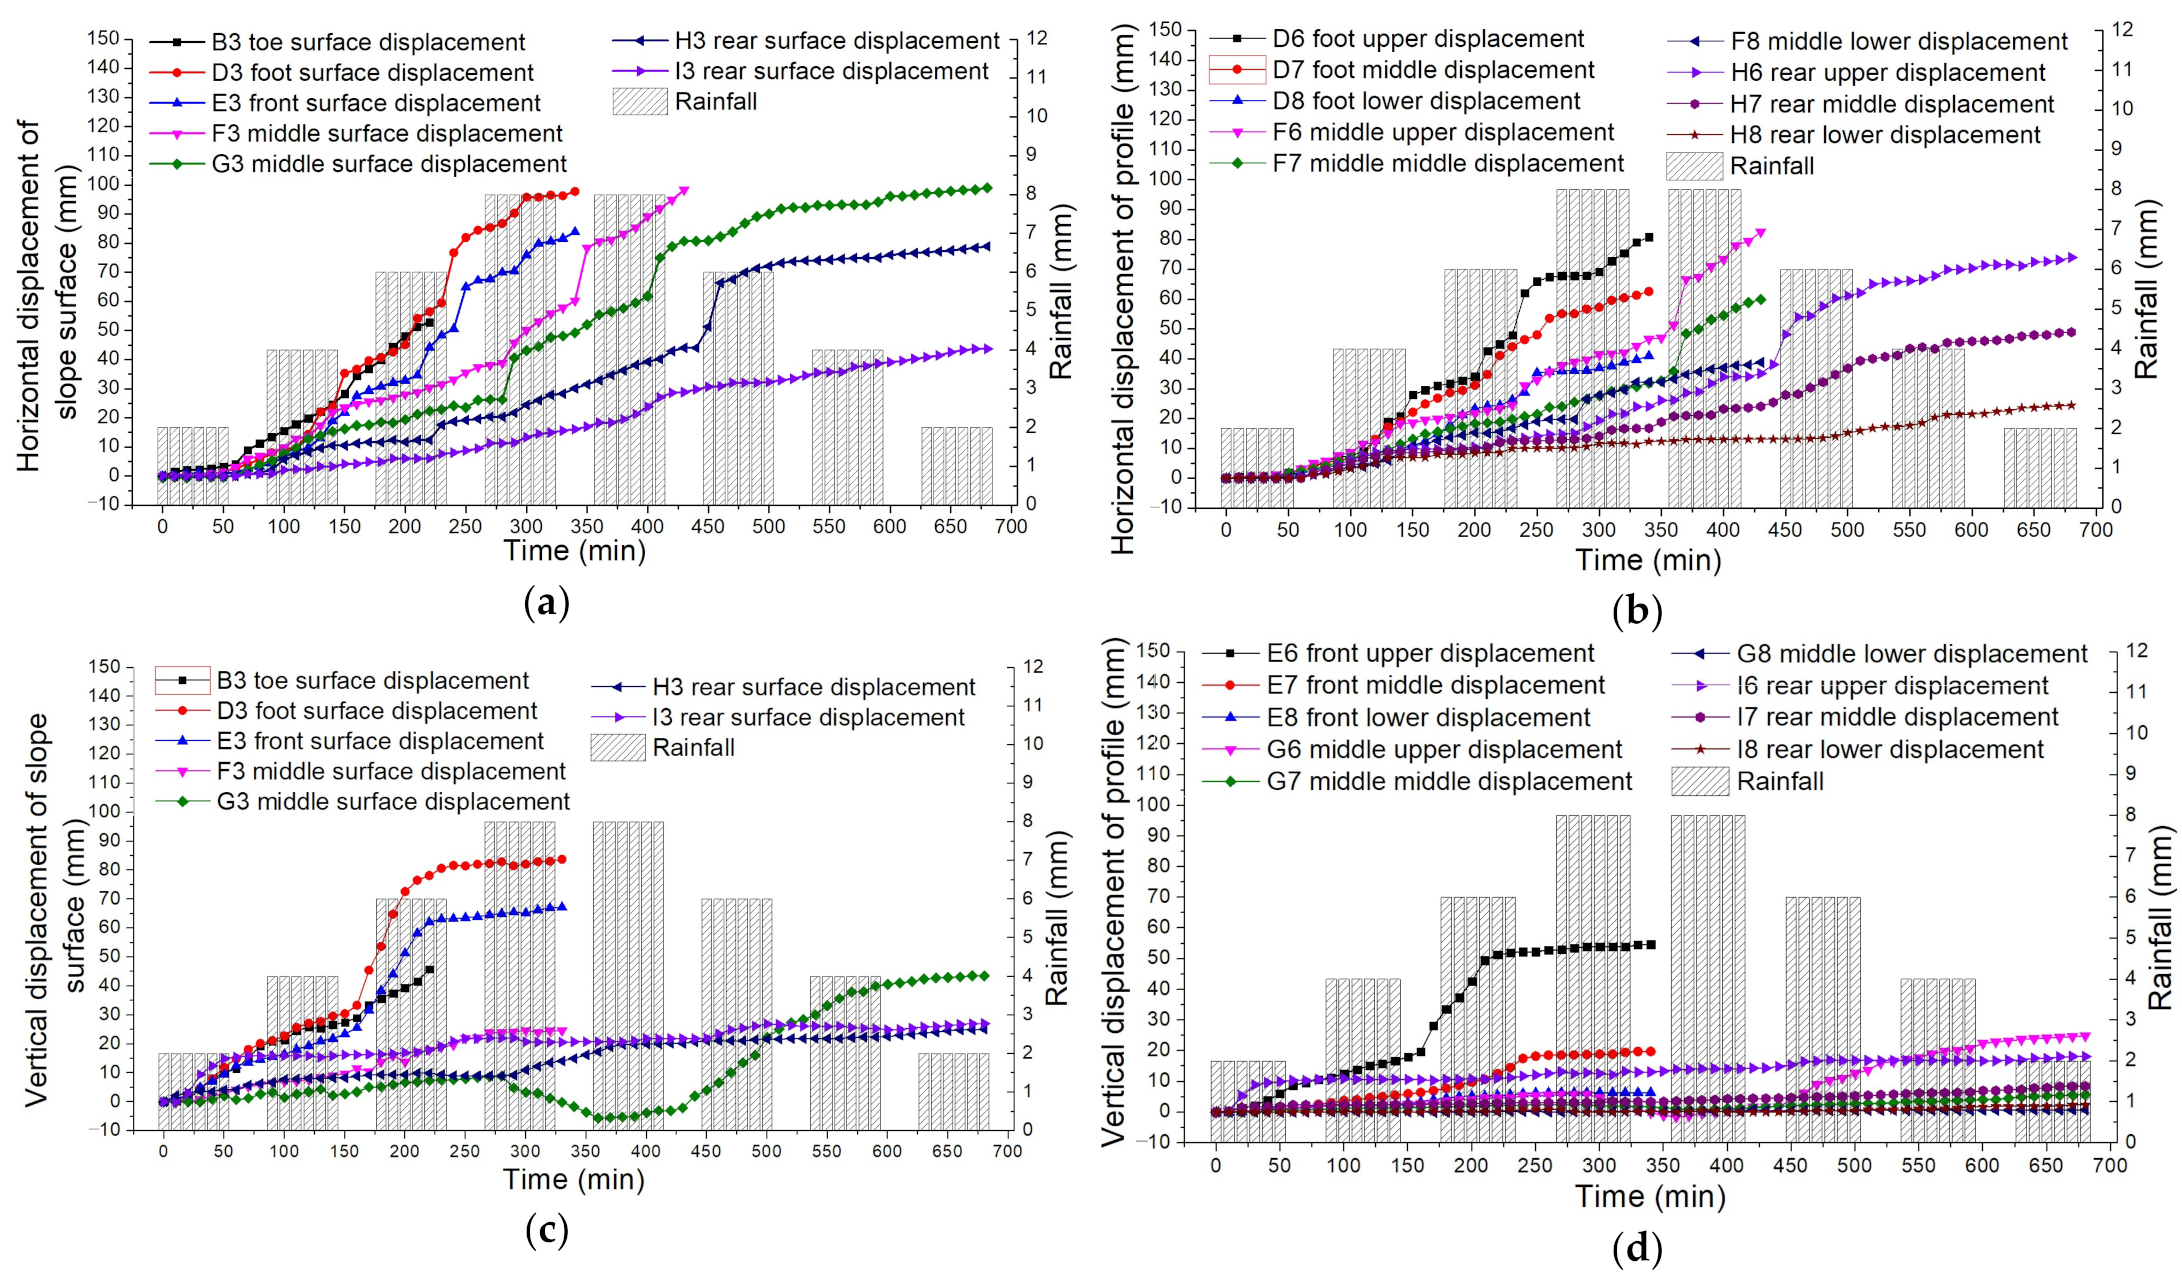
The slope subsided and gradually slipped during the intermittent rainfall test (Figure 10). The toe of the slope subsided during the first rain (Figure 11c,d), and the subsidence and slip increased rapidly during the period after the first rainfall, with slip and subsidence occurring at the foot of the slope and slip at the middle of the slope (Figure 11a,c). During the interval between 90 and 180 min of the test, the slip curve rose sharply, indicating that the model had entered a creep slip stage, and the maximum slip was 40.8 mm at the front surface of the slope. Between 180 and 340 min, the subsidence increased by 30 mm and the slippage increased by 57 mm at the foot of the slope (Figure 11). Between 340 and 430 min, the subsidence curve of the trailing edge of the slope, indicating that the trailing edge slope had reached a new equilibrium (Figure 11c,d). The trailing edge slope was deformed again after 430 min, due to failure of the middle slope. After 500 min, the displacement curve converged, indicating that the residual slope had reached a new equilibrium. There was a minor amount of slip and subsidence after 500 min (Figure 11).
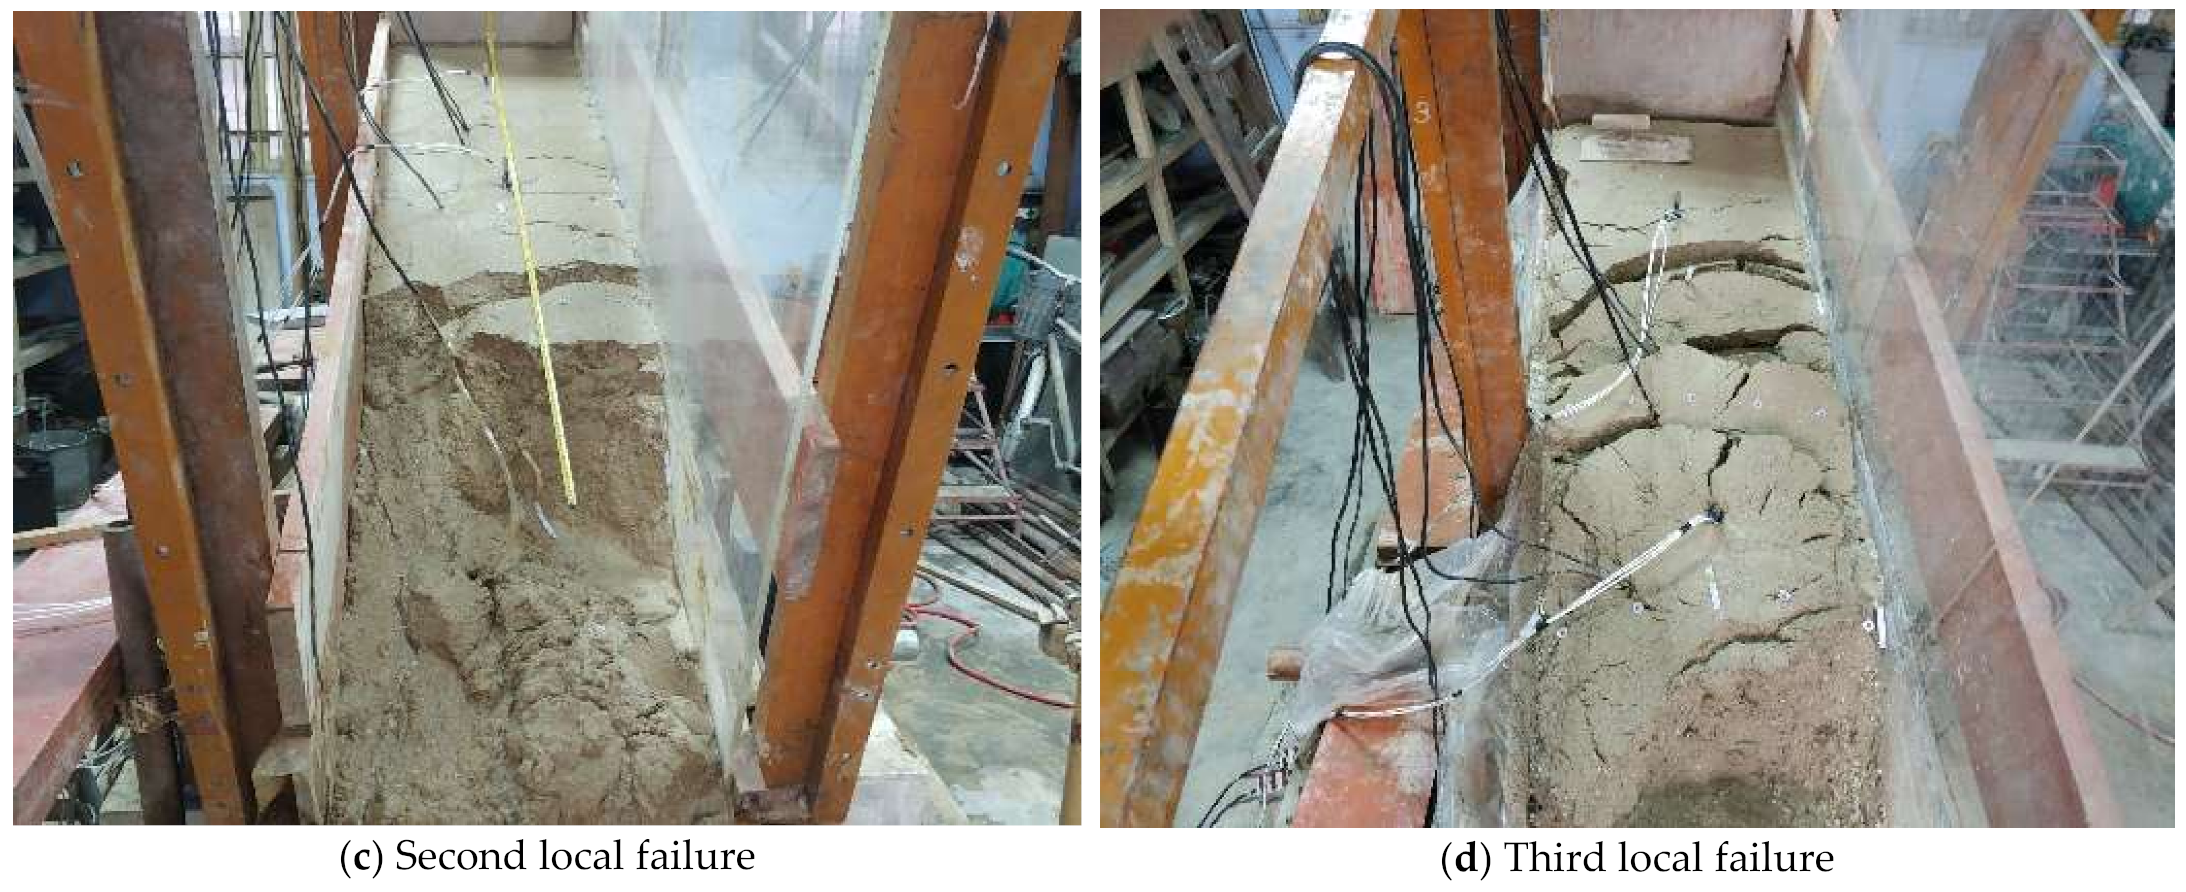
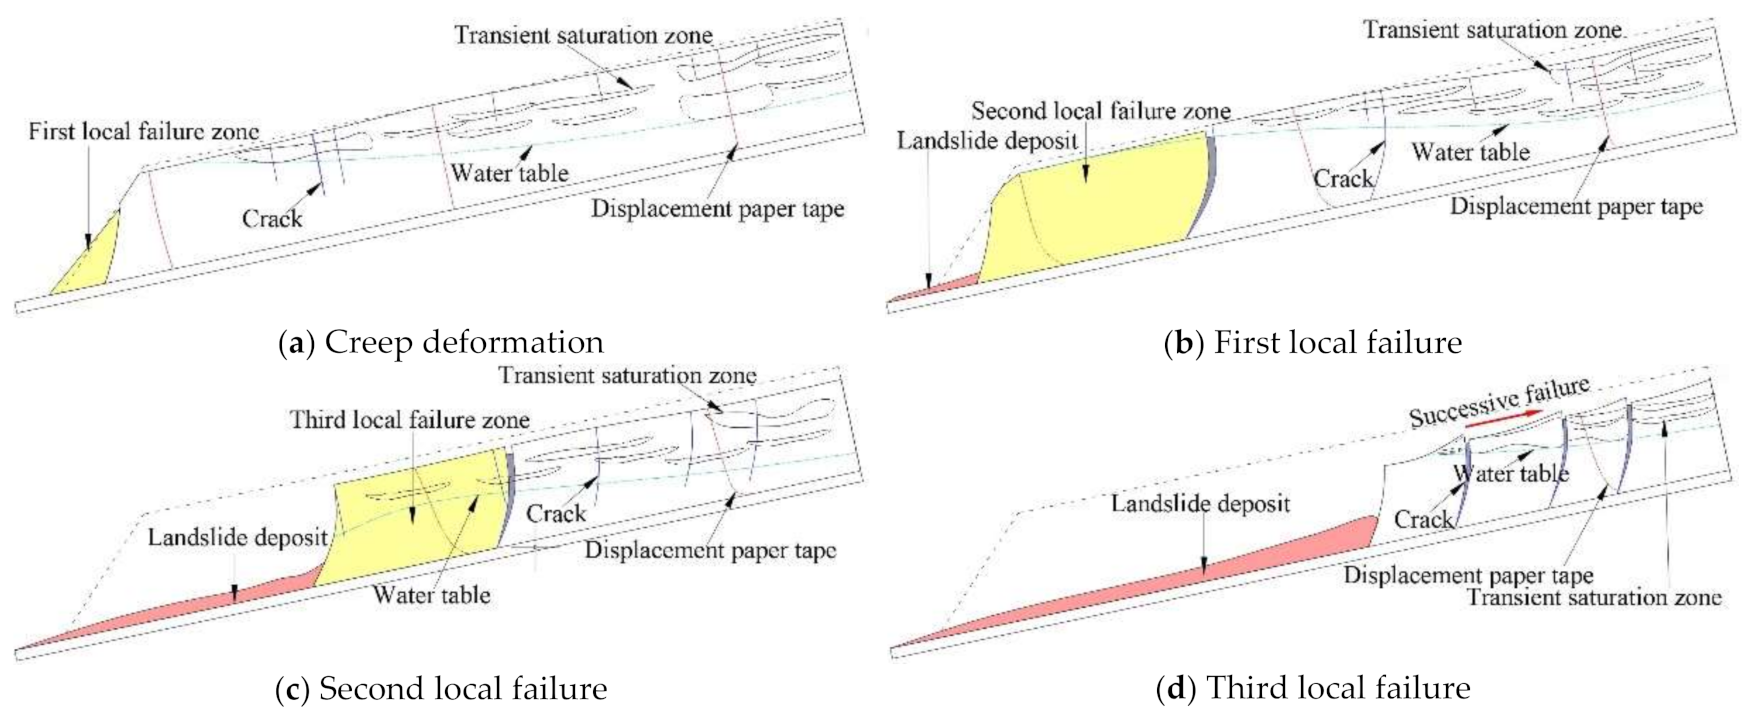
The slope model failed three times during the test. A local failure with the slope runoff of 9360 mm was first triggered at the toe of the slope during the third heavy rain (Figure 10a). After the end of the fourth period of rainfall, a local failure with a blocky sliding body occurred at the front of the slope (Figure 10b). The second local failure occurred as the water in the transient saturation zone continued to penetrate downward (Figure 10c). This failure originated at the base-cover interface at the lower part of the slope, which connected with the transverse crack to form a failure surface. This failure caused rapid deformation of the adjacent sliding bodies. After the end of the fifth period of rainfall, the third local failure was triggered close to the origin of the second one (Figure 10d). It is worth noting that two of the three local failures were causes between periods of rainfall in which there was not much water supply or deformation (Figure 11). This suggests that gently inclined accumulation layer slope failures may be triggered after rainfall and slope deformation.
In this test, no sudden local failure occurred during the first rainfall, even when the soil at the foot of the slope was fully saturated (Figure 10a). The first local failure occurred during the third rainfall period after the shear deformation of the slope foot and the formation of the main crack (Figure 11). Hence, the test results indicated that the sudden failure of the slope is not only related to the rise in the water table and the development of pore-water pressure, but also to the creep displacement, cracks and permeability of the slope. Although the rainfall and water tables changed during our physical model tests, the second and third failures both occurred in the interval during which the possibility of a rise in the water table was limited. Figure 11a,b show that the slope underwent long-term horizontal shear deformation at the position of the sliding belt before local failure. This provides evidence that the influence of the rise in the water table can be eliminated during the model test. It may be speculated that these local failures are caused by liquefaction of the soil in the sliding zone due to shear deformation. The gradual decrease in earth pressure due to the shear deformation in the sliding zone in test results confirms this hypothesis. Firstly, this physical model test showed that transverse tension cracks are first formed on the slope, and that the first local failure is triggered at the toe of the slope. Following this, the second local failure at the front of the slope is triggered. Secondly, the third local failure is triggered in the middle of the slope. Finally, the main cracks spread to form multiple sliding steps and sliding surfaces on the slope. These processes are characterised by regressive landslides.
Figure 12 shows a simplified slope model during the test, including cracks, the water table, and three failures. Firstly, following a subsidence, many tiny cracks were distributed over the surface of the slope. Secondly, these tiny cracks began to connect to each other to form multiple transverse main cracks. Thirdly, a main crack developed rapidly at the foot of the slope after two rainfalls, and this formed the origin of the first failures (Figure 12a). After the first local failure at the toe of the slope, main cracks adjacent to the sliding surface developed rapidly (Figure 12b). Main cracks adjacent to the sliding surface then rapidly developed and formed the boundary between the second and third failures after the first local failure had occurred at the toe of the slope (Figure 12c). Finally, open tension cracks formed the boundaries of multiple failures after the third local failure (Figure 12d). The failure process of the slope model was characterised by successive failures. It should be noted that all local failures occurred at the front face of the slope which was almost completely saturated and that the cracks adjacent to the failure surface only begin to develop rapidly after the front face was destroyed.
According to the paper tape’s deformation data, it can be seen that the relative displacement of the bottom layer in the vertical direction is the largest, and the displacement of the front part of the slope is the largest in the horizontal direction (Figure 11 and Figure 12). These strong deformation zones are concentrated around the water table, suggesting that the soil creep characteristics may be related to soil moisture content and saturation time.
4.2. Response of Pore Water Pressure
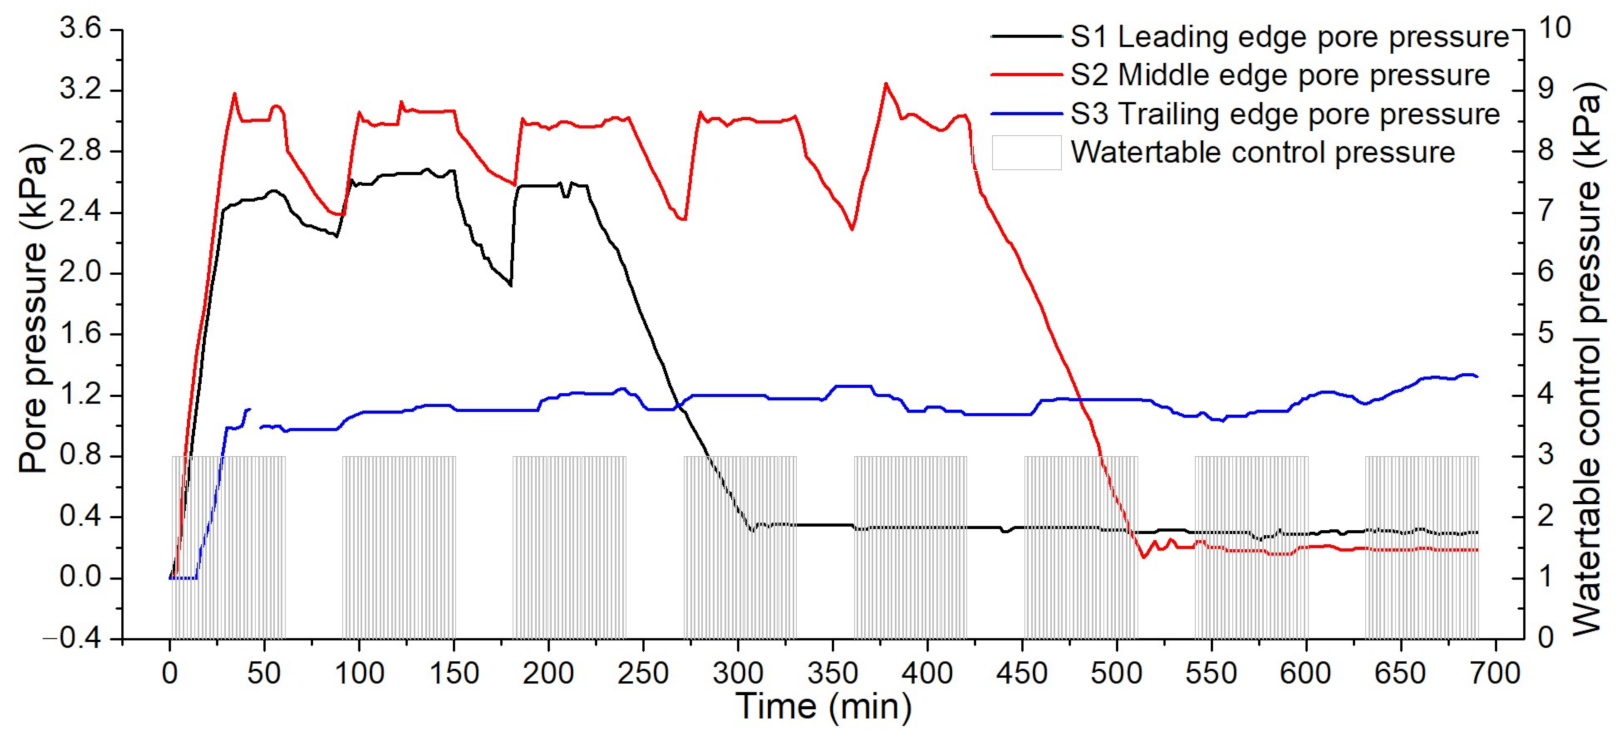
The position of the pore pressure transducer in the model is shown in Figure 7, in which S2 and the pressure gauge were used for water table control. The pore water pressure monitoring data is shown in Figure 13. The pore pressure curves for the pore water pressure transducers S1 and S2 began to flatten after approximately 22 min of the test, indicating that the soil at the front of the slope was saturated. The S3 pore pressure curve at the rear of the slope began to flatten after approximately 28 min, indicating that the water table had stabilised. Over the course of the intermittent rainfall, the pore pressure curves at S1 and S2 increased and decreased periodically, indicating the generation and dissipation of pore pressure. However, the pore pressure at S3 in the back of the slope was almost constant. The first and the third local failures resulted in the pore pressure at S1 and S2 first increasing and then continuously decreasing, but there was no obvious response of the pore pressure transducers to the second local failure. This is because the first and third local failures were triggered near the pore pressure transducers, and the pore pressure transducer was pulled out after local failure.
4.3. Earth Pressure
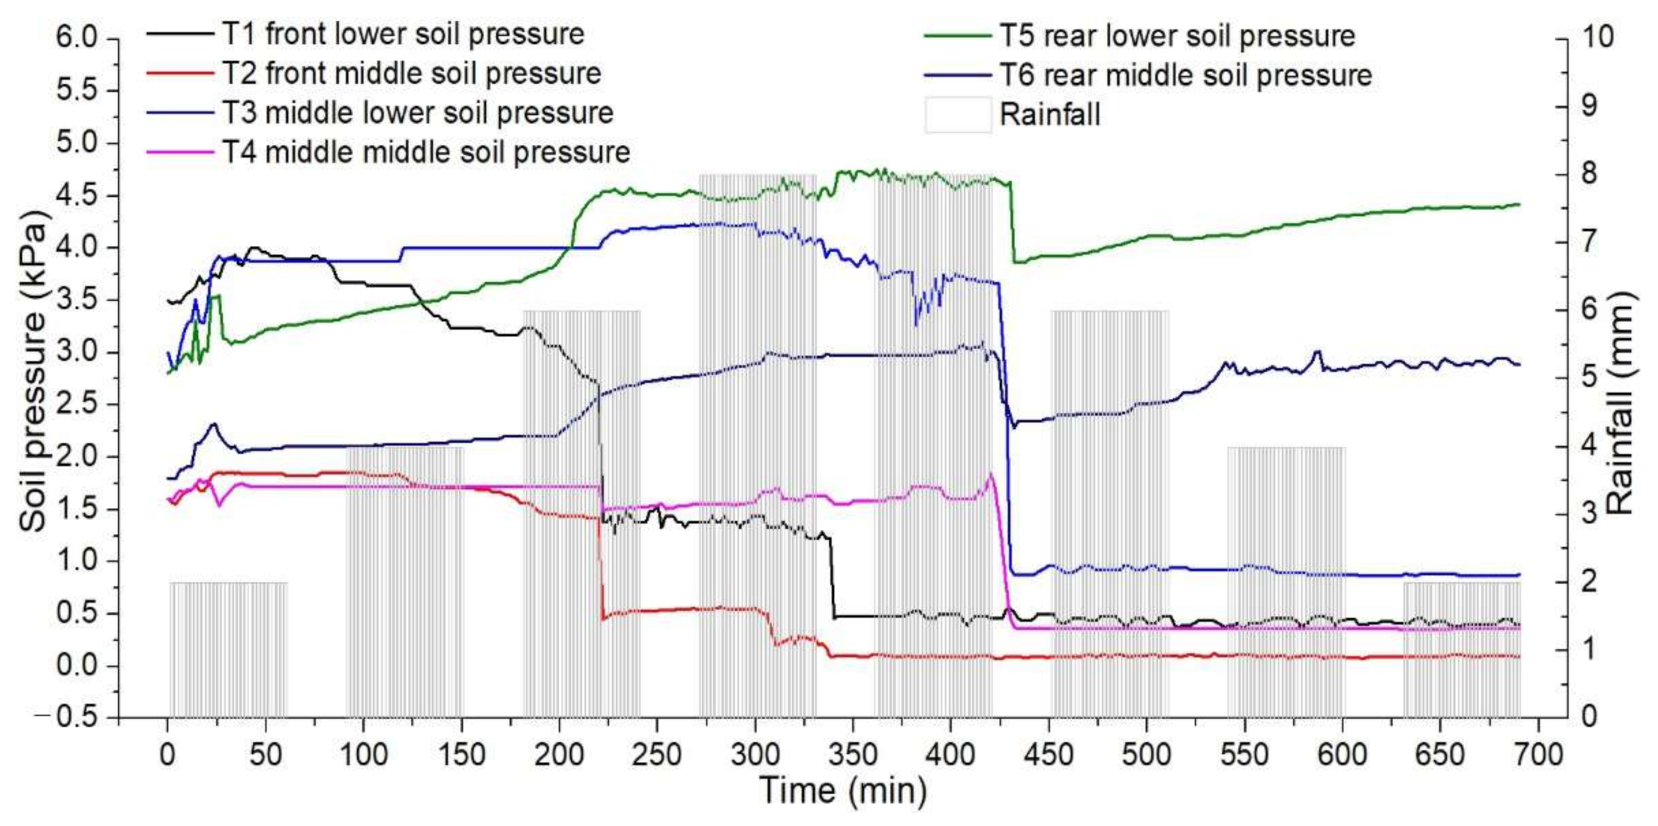
The earth pressure data is shown in Figure 14. The earth pressure on the bedrock surface increased significantly, according to the all transducers, with the continuous rainfall at the beginning of the test. Following that, T1 and T2 showed that pressure decreased gradually, indicating the occurrence of local creep slip at the front of the slope. When the first main crack occurred (Figure 10a), T1 and T2 showed a sudden pressure decrease (Figure 14), which was due to the soil on the upper part of the transducers becoming separated by the main crack. When the second local failure occurred, the transducer T1 was pulled out and exposed to the air, causing the earth pressure at the S1 transducer to decrease rapidly, while the earth pressures at the transducers distributed at the middle and back of the slope did not change significantly. After the second local failure, the earth pressure on the middle bedrock surface (T3) decreased unsteadily until the third local failure occurred. When the third local failure occurred, the pressure on T4 (in the middle part) firstly increased rapidly, and it was pulled out during failure. At the same time, the earth pressure on T5 and T6 decreased suddenly, due to cracking of the rear slope. As the intermittent rainfall continued, the pressure on T5 and T6 gradually recovered, due to the gradual subsidence of the slope and the filling of cracks by the liquefied soil.
5. Discussion
Accumulation slopes generally have relatively impermeable bedrock surfaces and loose quaternary accumulation layers, and their topography is mostly a skirt-shaped depression, meaning that colluvial slopes are vulnerable to rainfall. In general, rainfall-induced failures are characterised by severe slippage or repeated slow creep along the underlying bedrock surface [23]. Their failure may be essentially controlled by water table fluctuations, i.e., between periods of rainfall where a high safety factor is observed and gradually decreases as rain falls. Water table fluctuations may also be related to rainfall patterns, such as total rainfall and interval periods between rainfalls [1]. When the water table is close to the slope surface, especially at the slope toe, this could form a highly unstable area that may induce local sliding [17]. When the slope creep creates tension cracks, the surface runoff suspended fine-grained soil is transported into the cracks, and the sediment in the rainwater is deposited in the cracks, which increases the creep performance of the slope [24,25].
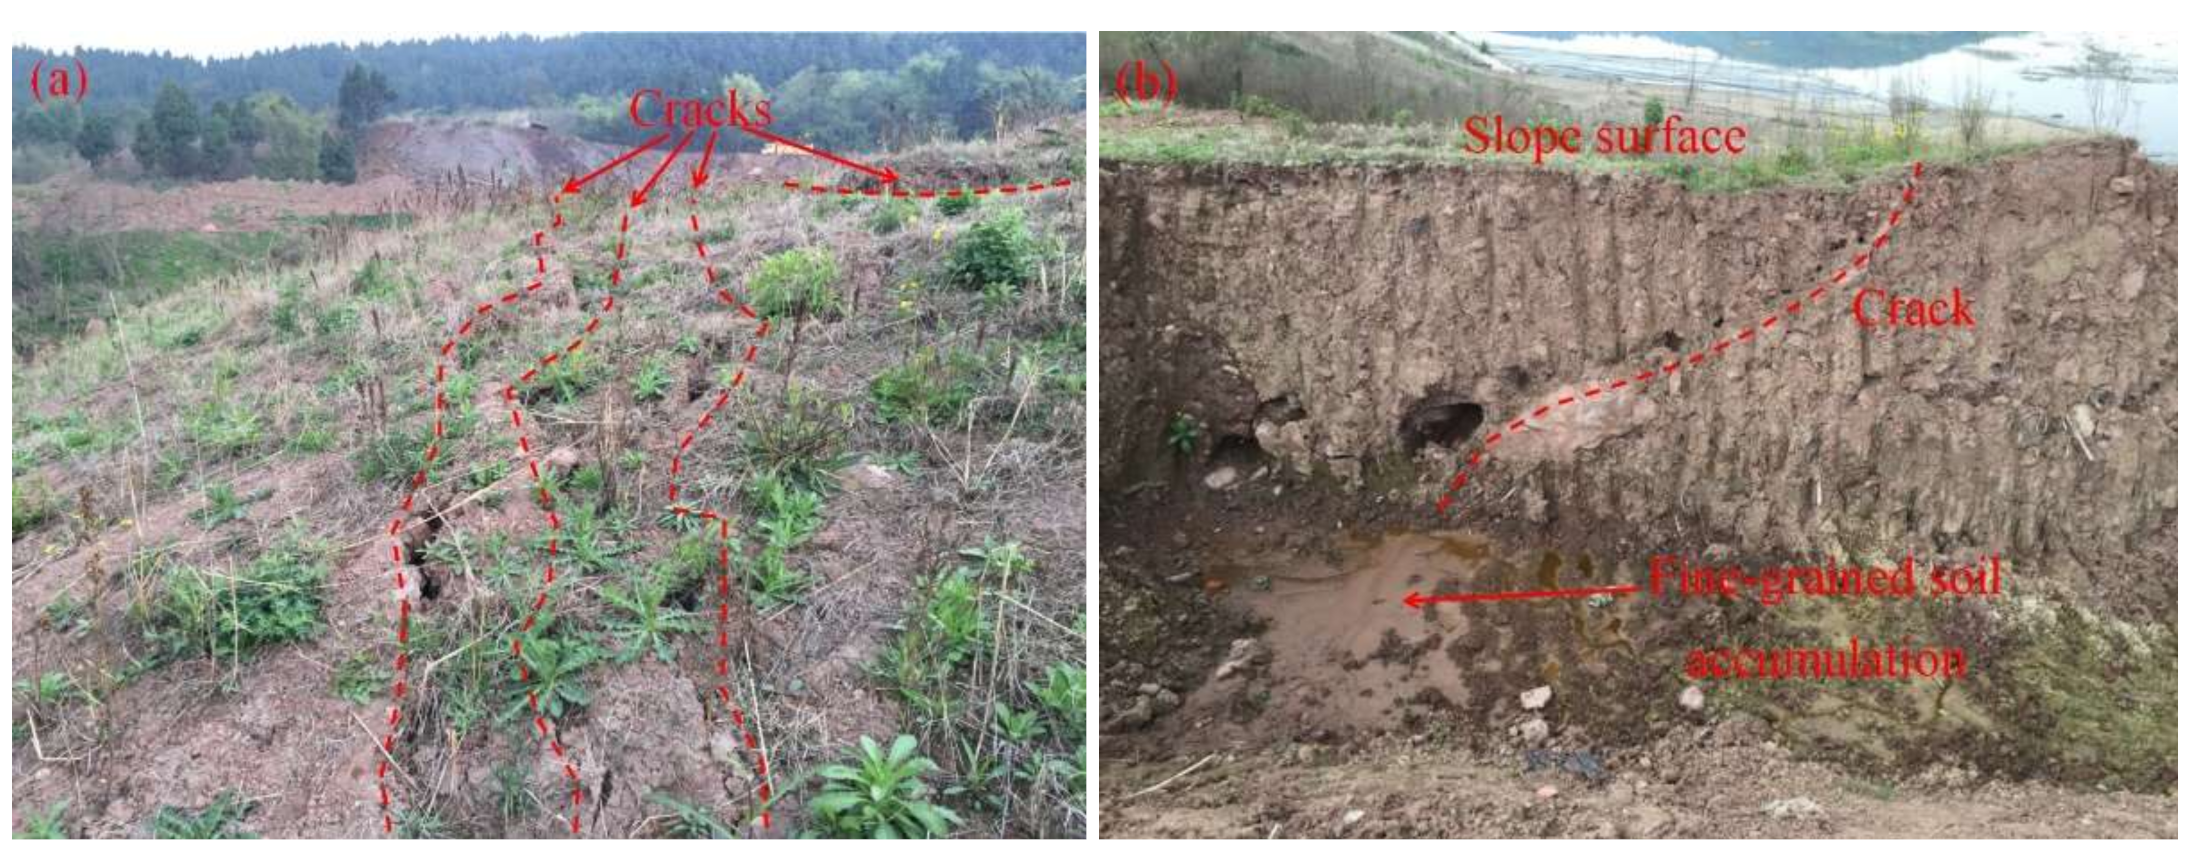
Data from the Yingtaogou Landslide Survey Report shows that the first local failure occurred at the foot of the slope in June 2015 (Figure 1b), and that the deformation was controlled after backfilling and drainage treatment. The slope began to slide again in stages due to multiple rainfall events in June 2018 (Figure 1d), and the failure characteristics are consistent with those of the model slope (Figure 10d). During the model test, many micro-cracks appeared on the slope. These quickly opened and connected as the adjacent soil failed, forming the boundary of the next landslide (Figure 12). Figure 13 shows that the pore pressure at the toe of the slope (S1) increased during the interval after the slope toe cracked. This shows that the cracks enhanced the infiltration capacity of the slope surface runoff and the drainage capacity of the slope. During drainage, fine particles in the middle and upper soil were deposited in the cracks and invade the sliding zone, leading to differences in the permeability of each layer of soil (Figure 10d). On site, numerous tension cracks were observed on the slope surface (Figure 15a). A section of one of these cracks was obtained by slope cutting, as shown in Figure 15b. Although the physical model is much smaller than the actual slope, these deformation and failure features are similar, indicating that this test method is effective and that the test results are reasonable.
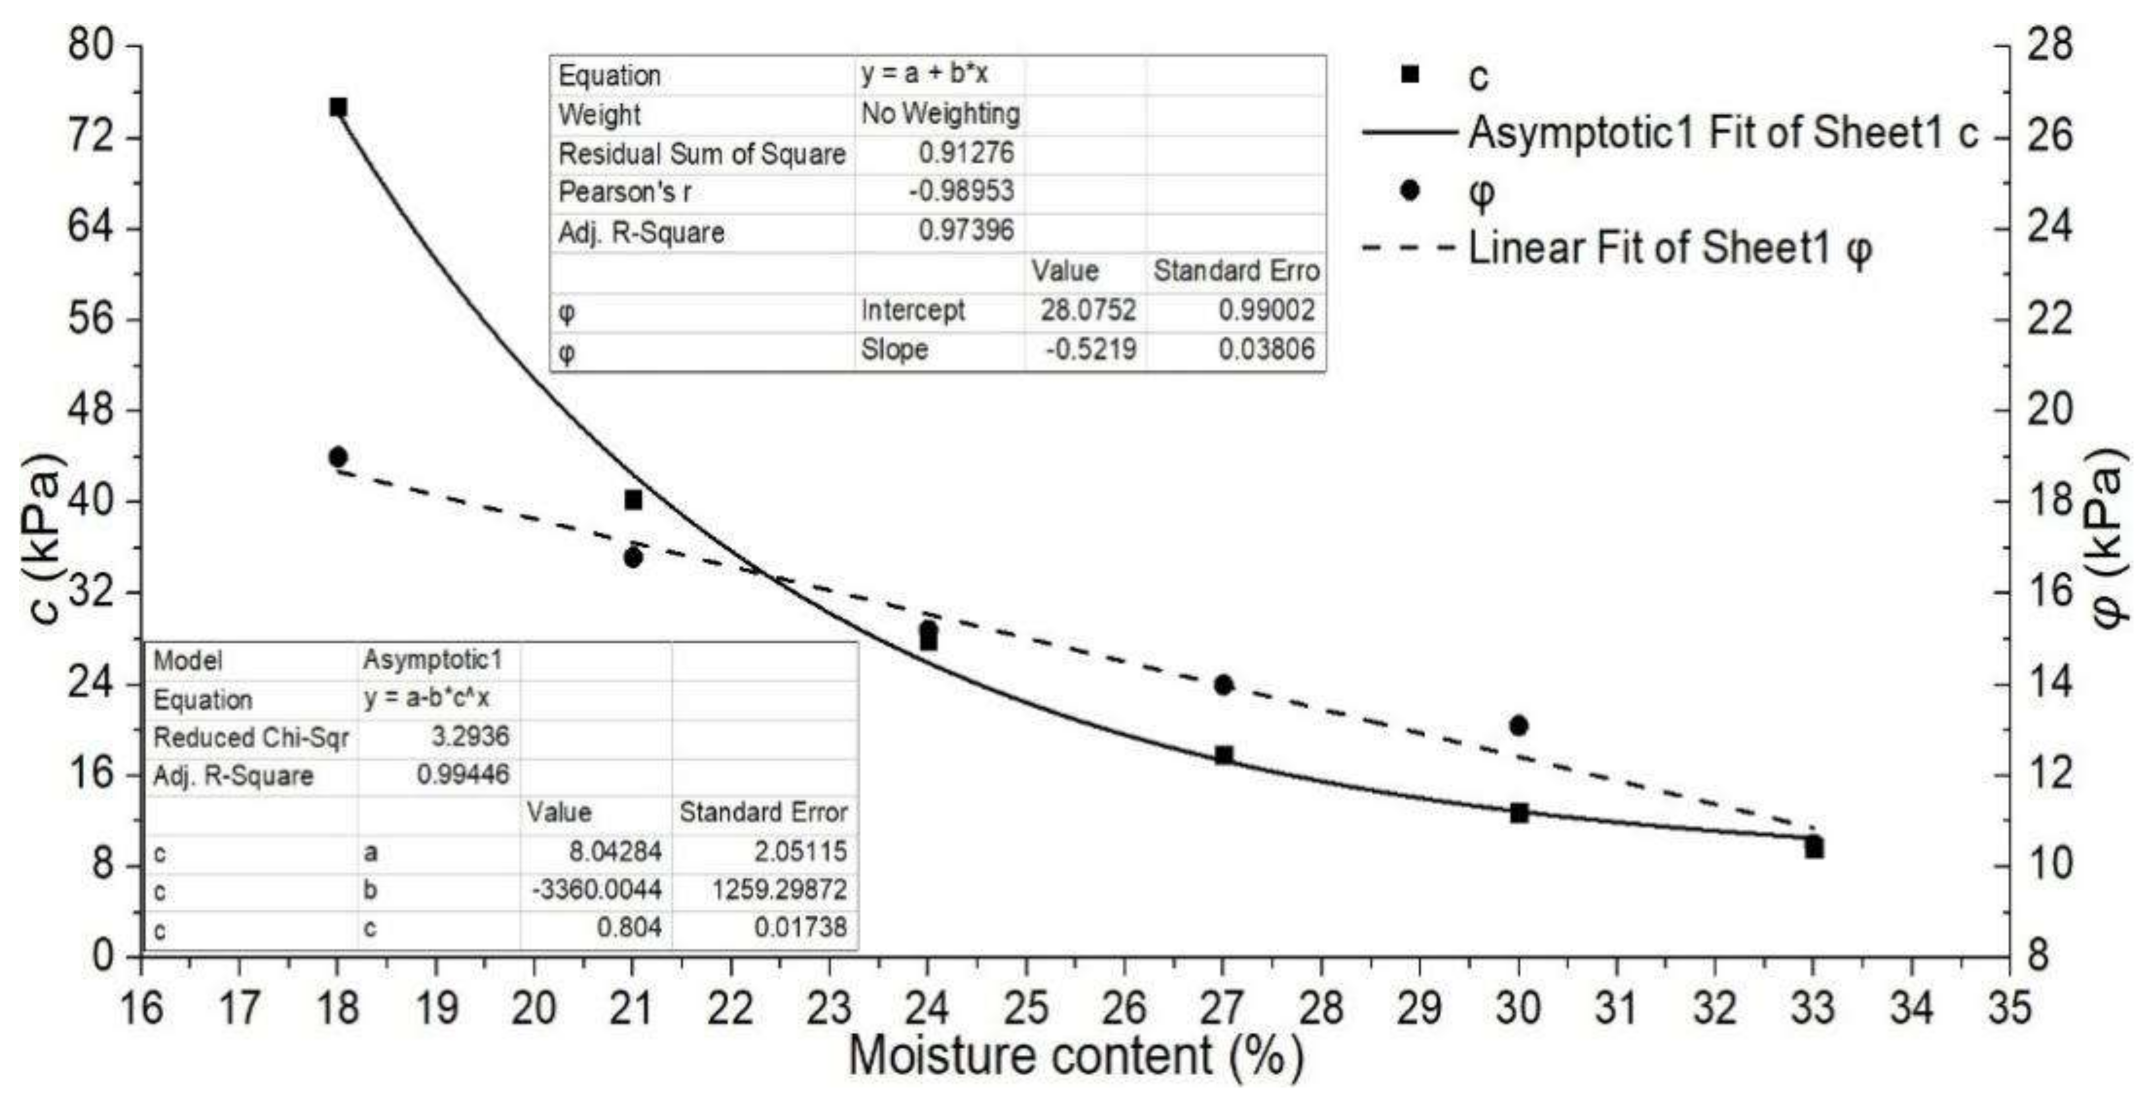
The reduced shear strength due to the increase in moisture content is insufficient to resist the sliding force, a highly unstable zone develops, and failure may be induced (Ram et al. 2014). This shows that the shear strength of the soil is important for the stability of the slope. The relationship between the soil moisture content of the slope and shear strength was investigated (Figure 16). The results showed that the shear strength parameters decreased rapidly with increasing moisture content. When the moisture was increased from 18% to 33%, the apparent was increased from 18% to 33%, the apparent cohesion decreased from 74.8 kPa to 9.7 kPa, and the internal friction angle decreased from 19° to 10.5°. Due to the decrease in shear strength, creep occurred on the slope. The uneven subsidence and shear creep deformations of the slope may be responsible for the micro-cracks on the slope surface. Vanapalli et al. (1996) obtained a simple equation for predicting soil strength through a large number of experiments:
where is the peak shear strength, is the apparent cohesion, is the total stress of unsaturated soil, is the angle of internal friction and are the pore gas pressure and pore water pressure, and , and are the volumetric, residual and saturated water content, respectively.
Equation (1) indicates that the increase in soil weight, increase in pore-water pressure and decrease in suction have a major effect on the reduction in shear strength. The model test found that no local failure occurred when the soil was first saturated. That showed that the reduction in shear strength due to the increase in the degree of saturation was still sufficient to stabilise the slope. Figure 12 shows that the thickness of the saturated layer and the soil immersion time of the slope gradually decreased from the front edge to the rear edge due to intermittent rainfall and seepage. With an increase in the saturation time, the shear strengths for different initial dry densities and initial moisture content showed different decreasing trends. The larger the initial dry density, the smaller the initial moisture content, and the greater the drop in the shear strength of the soil sample. The decrease in the cohesion accumulation of soil after saturation was due to the softening and dissolving effect of water, which destroys the cementation of soil particles (Deng et al. 2013). The clay particles in the soil mass gather in the main cracks, slip zones and slope toe during the seepage process (Figure 10d and Figure 15b). The shear strength and permeability of the soil decreased with the increase in the clay content [26].
Figure 11a,b show that the shear displacement curve of the sliding zone undergoes a steep rise before the local failures of the slope. The decrease in the residual internal friction angle with the increase in the clay content [27] may be the reason for the slow increase in shear rate. The residual strength rapidly decreases as the shear rate increases during shear deformation [28]. When the shear rate reaches a certain value, it is difficult for water to be excreted due to the accumulation of clay particles, which can easily lead to complete loss of the residual strength of the soil and liquefaction, triggering local failure.
6. Conclusions
In this study, a physical modelling method for gently dipping accumulation slopes was developed. It was combined with the monitoring technique to measure the displacement, pore water pressure and earth pressure of the slope under the action of intermittent rainfall. Based on the monitoring data, the influence of intermittent rainfall on the deformation and failure of the gently dipping accumulation layer slope was discussed. The major conclusions from this study can be outlined as follows:
- (1)
- Intermittent rainfall-induced failures of gently dipping accumulation slopes are characterised by regressive landslides. Firstly, transverse tension cracks are formed on the slope, and the first local failure is caused at the toe of the slope. Following this, the second local failure is triggered at the front of the slope. The third local failure is triggered in the middle of the slope. Finally, the main cracks spread, forming multiple sliding steps and sliding surfaces on the slope. The use of anti-slide piles at the slope foot of the gently sloping accumulation layer can effectively restrain the occurrence of landslides.
- (2)
- Before failure, a gently dipping accumulation layer landslide shows long-term creep deformation, when the clay particles in the soil would converge to the cracks, sliding zone and slope toe with seepage. The increasing creep displacement and increasing saturation thickness from the trailing edge to the leading edge of the slope provide a precondition for the cracking and stage failure of the landslide. Monitoring the displacement, pore water pressure and earth pressure at the foot of the slope may be effective for forecasting and the early warning of this type of landslide.
- (3)
- Shear strength testing of the undisturbed soil showed that when the water table approached the slope surface within this region, the reduced shear strength due to the increase in moisture content was still sufficient to resist local failure. The shear strength of the soil in the saturated zone further decreased with an increase in the clay content, saturated time, creep displacement and creep rate. This eventually led to a sudden increase in pore water pressure and liquefaction of the soil, triggering local failure. In the actual project, slope drainage and waterproofing measures should be taken to prevent the soil at the foot of the slope from being saturated for a long time.
Author Contributions
Conceptualization, W.Z. and N.H.; methodology, Y.Z.; formal analysis, N.H.; investigation, Y.Z.; resources, W.Z.; data curation, W.Z.; writing—original draft preparation, W.Z.; writing—review and editing, N.H.; visualization, Y.Z.; supervision, Y.Z.; project administration, N.H.; funding acquisition, W.Z. All authors have read and agreed to the published version of the manuscript.
Funding
This research was funded by National Key Research and Development Program of China (Grant No.2020YFD1100701) and the National Natural Science Foundation of China (No. 41302284).
Institutional Review Board Statement
Not applicable.
Informed Consent Statement
Not applicable.
Data Availability Statement
All individuals included in this section have consented to the acknowledgement.
Acknowledgments
This work was financially supported by the National Key Research and Development Program of China (Grant No. 2020YFD1100701) and the National Natural Science Foundation of China (No. 41302284).
Conflicts of Interest
The authors declare no conflict of interest.
References
- Zhu, Y.J.; He, N.; Zhong, W.; Kong, J.M. Physical Simulation Study on Accumulation Layer Slope Deformation and Damage Caused by Intermittent Rainfall. Rock Soil Mech. 2020, 41, 1–10. [Google Scholar] [CrossRef]
- Li, H.; Li, C.B.; Liu, Y.B.; Han, J.; Zhao, Q.H.; Coltd, C.E.; China, P. Geostress field characteristics of high steep canyon slope in Southwest China. Rock Soil Mech. 2016, 37, 482–488. [Google Scholar] [CrossRef]
- Xing, Z.; Ma, S.Q.; Xu, Q.; Liu, W. A WD-GA-LSSVM model for rainfall-triggered landslide displacement prediction. J. Mt. Sci. 2018, 15, 156–166. [Google Scholar] [CrossRef]
- Zhang, M.; Hu, R.L.; Yin, Y.P.; Wu, R. Study of mechanism of landslide induced by rainfall in gently inclined red stratum in east Sichuan basin. Chin. J. Rock Mech. Eng. 2014, 33, 3783–3790. [Google Scholar] [CrossRef]
- Zhang, Q.; Xu, Q.; Li, J.; Yi, J.S.; Wang, F. Study on characteristics and cause mechanism of grouping inclined—Shallow soil mass landslides on September 16, 2011 in Nanjiang. J. Nat. Disasters 2015, 24, 104–111. [Google Scholar] [CrossRef]
- Do, F.; Xu, M.; Xiao, X.Y.; Na, N. Physical simulation modeling for stability analysis of reser-voir landslide in gently underdip slopes: A case study of Xiangjiaping landslide. J. Eng. Geol. 2018, 26, 694–702. [Google Scholar] [CrossRef]
- Roy, P.; Jain, N.; Martha, T.R.; Kumar, K.V. Reactivating Balia Nala landslide, Nainital, India—A disaster in waiting. Landslides 2022, 19, 1531–1535. [Google Scholar] [CrossRef]
- Ran, Q.; Hong, Y.; Li, W.; Gao, J. A modelling study of rainfall-induced shallow landslide mechanisms under different rainfall characteristics. J. Hydrol. 2018, 563, 790–801. [Google Scholar] [CrossRef]
- Ram, K.R.; Kwansue, J.; Hajime, N.; Jaewon, K. Study on mechanism of retrogressive slope failure using artificial rainfall. Catena 2014, 122, 27–41. [Google Scholar] [CrossRef]
- Guo, M.; Su, A.G.; Zhang, J. Deformation Characteristics and Formation Mechanism of Ac-cumulated Landslides Under Rainfall Conditions. J. Hebei Univ. Eng. (Nat. Sci. Ed.) 2019, 36, 39–45. [Google Scholar]
- Cho, E.S. Probabilistic stability analysis of rainfall-induced landslides considering spatial variability of permeability. Eng. Geol. 2014, 171, 11–20. [Google Scholar] [CrossRef]
- Scaringi, G.; Hu, W.; Xu, Q.; Huang, R. Shear-Rate-Dependent Behavior of Clayey Bimaterial Interfaces at Landslide Stress Levels. Geophys. Res. Lett. 2017, 45, 766–777. [Google Scholar] [CrossRef] [Green Version]
- Crosta, G.; Di Prisco, C. On slope instability induced by seepage erosion. Can. Geotech. J. 1999, 36, 1056–1073. [Google Scholar] [CrossRef]
- Gattinoni, P.; Francani, V. A tool for modeling slope instability triggered by piping. World Acad. Sci. Eng. Technol. 2009, 3, 238–244. [Google Scholar]
- Song, D.; Chen, X.; Zhou, G.G.; Lu, X.; Cheng, G.; Chen, Q. Impact dynamics of debris flow against rigid obstacle in laboratory experiments. Eng. Geol. 2021, 291, 106211. [Google Scholar] [CrossRef]
- Lourenço., S.D.N.; Sassa, K.; Fukuoka, H. Failure process and hydrologic response of a two layer physical model: Implications for rainfall-induced landslides. Geomorphology 2006, 73, 115–130. [Google Scholar] [CrossRef]
- Tohari, A.; Nishigaki, M.; Komatsu, M. Laboratory Rainfall-Induced Slope Failure with Moisture Content Measurement. J. Geotech. Geoenviron. Eng. 2007, 133, 575–587. [Google Scholar] [CrossRef]
- Pajalić, S.; Peranić, J.; Maksimović, S.; Čeh, N.; Jagodnik, V.; Arbanas, Z. Monitoring and Data Analysis in Small-Scale Landslide Physical Model. Appl. Sci. 2021, 11, 5040. [Google Scholar] [CrossRef]
- Lora, M.; Camporese, M.; Troch, P.A.; Salandin, P. Rainfall-triggered shallow landslides: Infiltration dynamics in a physical hillslope model. Hydrol. Process. 2016, 30, 3239–3251. [Google Scholar] [CrossRef]
- Rolando, P.O.; Suguru, S.; Kengo, M.; Ikuo, T. Instrumented Model Slope Failure due to Water Seepage. J. Nat. Disaster Sci. 2006, 26, 15–26. [Google Scholar] [CrossRef] [Green Version]
- Shen, H.H. Stability analysis and treatment for the Zhongjiashan landslide in Long-quanyi, Chengdu. J. Geol. Hazards Environ. Preserv. 2005, 16, 311–314, (In Chinese with English Abstract). [Google Scholar]
- Xu, T. The Similarity Theory and the Statics Model Test; China Agricultural Mechanical Press: Beijing, Chnina, 1982; (In Chinese Book). [Google Scholar]
- Chen, S.X.; Xu, X.C.; Xu, H.B. Features and stability analysis of rainfall-induced colluvial landslides. Rock Soil Mech. 2005, 26, 6–10. [Google Scholar] [CrossRef]
- Pu, J.; Wallwork, J.; Khan, A.; Pandey, M.; Pourshahbaz, H.; Satyanaga, A.; Hanmaiahgari, P.; Gough, T. Flood Suspended Sediment Transport: Combined Modelling from Dilute to Hyper-Concentrated Flow. Water 2021, 13, 379. [Google Scholar] [CrossRef]
- John, C.; Pu, J.; Pandey, M.; Hanmaiahgari, P. Sediment Deposition within Rainwater: Case Study Comparison of Four Different Sites in Ikorodu, Nigeria. Fluids 2021, 6, 124. [Google Scholar] [CrossRef]
- Lei, J.; Zhang, G.M.; Liu, L.F.; Yang, Y.; Zhiqiang, Q.U.; Wen, H.; Dai, J. Measuring soil shear strength and impact factors. J. Beijing Norm. Univ. (Nat. Sci.) 2016, 52, 486–492. [Google Scholar] [CrossRef]
- Xu, C.X.; Wang, X.; Du, X.L. Experimental study on residual strength and index of shear strength characteristics of different clay soils. Chin. J. Geotech. Eng. 2017, 39, 436–443. [Google Scholar] [CrossRef]
- Xie, Q.; Zhang, G.D.; Hu, X.W.; Lu, J. Experimental researches on residual strength of satu-rated silty clay at different shear rates. J. China Three Gorges Univ. (Nat. Sci.) 2019, 41, 52–55. [Google Scholar] [CrossRef]
Figure 1.
(a) Location of the study area; (b) first failure in 2015; (c) second failure in 2018; and (d) photograph of the Yingtaogou landslide.
Figure 1.
(a) Location of the study area; (b) first failure in 2015; (c) second failure in 2018; and (d) photograph of the Yingtaogou landslide.


Figure 2.
(a) Variation in evaporation and rainfall for each month; (b) rainfall distribution and pressure head in 2018.
Figure 2.
(a) Variation in evaporation and rainfall for each month; (b) rainfall distribution and pressure head in 2018.

Figure 3.
Landslide profile.

Figure 4.
Model test bench.

Figure 5.
Composition and ratio of soil mixture.

Figure 6.
Schematic of the model.

Figure 7.
Distribution map of monitoring equipment (a) plan view; (b) side view.

Figure 8.
Equivalent rainfall simulation system.

Figure 9.
Intermittent rainfall test programme.

Figure 10.
(a) 130 min, (b) 280 min (c) 340 min and (d) 600 min.


Figure 11.
Slope displacement curve. (a) Horizontal displacement of slope surface, (b) Horizontal displacement of profile, (c) Vertical displacement of slope surface, (d) Vertical displacement of profile.
Figure 11.
Slope displacement curve. (a) Horizontal displacement of slope surface, (b) Horizontal displacement of profile, (c) Vertical displacement of slope surface, (d) Vertical displacement of profile.

Figure 12.
Water table, cracks and failure of the slope at (a) 130 min, (b) 280 min (c) 340 min and (d) 600 min.
Figure 12.
Water table, cracks and failure of the slope at (a) 130 min, (b) 280 min (c) 340 min and (d) 600 min.

Figure 13.
Pore water pressure time history.

Figure 14.
Earth pressure measurement time history.

Figure 15.
Characteristics of crack development before slope failure: (a) characteristics of slope surface cracks; (b) characteristics of section cracks.
Figure 15.
Characteristics of crack development before slope failure: (a) characteristics of slope surface cracks; (b) characteristics of section cracks.

Figure 16.
Relationship between soil moisture content of the slope and shear strength.


Table 1.
Soil properties.
| Property | Real Soil | Test Soil |
|---|---|---|
| Density | 1.95 | 1.95 |
| Cohesion | 13.0 | 0.63 |
| Internal friction angle | 12.0 | 10.8 |
| Poisson’s ratio | 0.26 | 0.28 |
| Elastic modulus | 31058 | 2099 |
Publisher’s Note: MDPI stays neutral with regard to jurisdictional claims in published maps and institutional affiliations. |
© 2022 by the authors. Licensee MDPI, Basel, Switzerland. This article is an open access article distributed under the terms and conditions of the Creative Commons Attribution (CC BY) license (https://creativecommons.org/licenses/by/4.0/).
Share and Cite
MDPI and ACS Style
Zhong, W.; Zhu, Y.; He, N. Physical Model Study of an Intermittent Rainfall-Induced Gently Dipping Accumulation Landslide. Water 2022, 14, 1770. https://doi.org/10.3390/w14111770
AMA Style
Zhong W, Zhu Y, He N. Physical Model Study of an Intermittent Rainfall-Induced Gently Dipping Accumulation Landslide. Water. 2022; 14(11):1770. https://doi.org/10.3390/w14111770
Chicago/Turabian StyleZhong, Wei, Yuanjia Zhu, and Na He. 2022. "Physical Model Study of an Intermittent Rainfall-Induced Gently Dipping Accumulation Landslide" Water 14, no. 11: 1770. https://doi.org/10.3390/w14111770
Note that from the first issue of 2016, this journal uses article numbers instead of page numbers. See further details here.