
Channel Bed Deformation and Ice Jam Evolution around Bridge Piers

1
School of Civil and Hydraulic Engineering, Hefei University of Technology, Hefei 230009, China
2
School of Engineering, University of Northern British Columbia, Prince George, BC V2N 4Z9, Canada
*
Authors to whom correspondence should be addressed.
Water 2022, 14(11), 1766; https://doi.org/10.3390/w14111766
Submission received: 19 May 2022
/
Revised: 26 May 2022
/
Accepted: 27 May 2022
/
Published: 31 May 2022
(This article belongs to the Special Issue Fluvial Hydraulics Affected by River Ice and Hydraulic Structures)
Abstract
:The interaction between the evolution of an ice jam and the local scour at bridge piers becomes much more complicated due to the evolution of both the channel bed and ice jam. Thus, research work regarding this topic has been hardly conducted. In the present study, experiments under different flow conditions with three different pier shapes were carried out. Through laboratory experiments, the development of scour holes around bridge piers under open flow, ice-covered, and ice-jammed flow conditions was compared. The results show that under the same hydraulic condition and with the same ice discharge rate (Qi/Q), the development of an initial ice jam with a local scour around bridge piers along the entire flume takes a relatively short time. However, it takes a longer time for an ice jam to achieve an equilibrium state. With the presence of a local scour at bridge piers, after an ice jam reaches an equilibrium state, the ice jam thickness, water level, and water depth for flow are relatively larger compared to that without a local scour at the pier. The equilibrium ice jam thickness around the pier is negatively correlated with the initial flow Froude number. When the development of an initial ice jam is dominated by a mechanical thickening process, the rate of the development of a scour hole around a pier is faster. On the other hand, when the development of an initial ice jam is dominated by a hydraulic thickening process, the development of a scour hole around a pier can be treated as a scour process under an ice-covered flow condition. An equation was developed to determine the scour depth around a pier under an ice-jammed flow condition by considering related factors such as the flow Froude number, ice jam thickness, and ice discharge rate. The results of this research can provide a reference for bridge design and safety protection, as well as the interaction mechanism of local scour and ice jam evolution.
1. Introduction
Ice jams in rivers are a common ice phenomenon in cold regions in winter that affect both hydraulic conditions and boundary conditions of watercourses. Sometimes, under the same flow condition, the presence of an ice cover in a river leads to a higher water level, which can induce ice flood disasters. The presence of bridge piers in a river narrows the flow cross section, changes the flow state of water around the piers, and forms a horseshoe vortex, which often results in a local scour around bridge piers. As reported by researchers, the existence of bridge piers in rivers increases the possibility of the formation of ice jams [1,2], and the formation and development of an ice jam aggravate the local scour of bridge piers [3]. Therefore, the mutual influence of flow conditions, local scour, and ice jam evolution makes relevant problems more complex.
Recently, some research has been conducted to study the hydraulic interaction between bridge piers and ice jams. The results of laboratory experiments showed that the existence of bridge piers results in an increase in the ice transport capacity near bridge piers and a decrease in the ice jam thickness [2]. Wang et al. [4,5] carried out an experimental study on ice jam blockage at bridge piers, which showed that ice blockage was affected by the ice cube size, spanning distance between piers, and flow conditions. Based on experiments conducted in a curved flume in a laboratory, it was found that the bridge pier located at the apex of the river bend had less influence on ice jam formation than the one installed in a straight section of a river (the junction of two bends) [6]. The results of laboratory experiments regarding the variation of water level around piers with different shapes under an ice jam showed that the increment of water level in the present of a cylindrical pier was the smallest, while it was the largest for a rectangular pier, and the regression formula for calculating the increase in water level caused by an equilibrated ice jam was given [7]. It was found that the ice accumulation process around bridge piers depends on the pier size, ice discharge rate, flow discharge, and Froude number. For a flow with a smaller Froude number and a larger ice discharge rate, with the presence of a smaller pier in the channel, the evolution process of an ice jam is similar to that without the presence of a pier [8]. There are very few studies on numerical simulation. Cheng et al. [9] used a discrete element model to simulate the ice floe accumulating process around bridge piers. In addition, Yang et al. [10] used a material point method; Istrati et al. [11] used a finite element method; Salciarini et al. [12] used a discrete element method, and Hasanpour et al. [13] used a smoothed particle hydrodynamics method to study tsunami-induced debris impacts on bridge structures, respectively, which has a certain reference value for the numerical simulation of hydraulic action between bridge piers and ice jams. Parola et al. [14] conducted experimental studies to develop a method for predicting debris forces on piers and superstructures. Malavasi et al. [15] studied the hydrodynamic interactions between an open flow and a bridge deck. The results of this work will provide a theoretical reference for the study of the interaction between ice floes and bridge decks under extreme hydraulic conditions.
Some researchers have done research work regarding the local scour process around circular piers under both open flow and ice-covered (instead of ice-jammed) flow conditions. In an open flow, to improve the applicability of the equation developed by Melville and Coleman in laboratory and field data, Pandey et al. [16] proposed new K-factors for a nonuniform gravel bed. Memar et al. [17] studied the influence of the size and position of circular collars from the sediment bed on serial bridge piers. Zhao et al. [18] derived one formula for calculating scour depth around a skew bridge in a curved road by solving the deflection angle of water flow and the width of the water crossing section. The existence of an ice cover changes the flow structure [19,20,21,22] and affects the development of a local scour. Compared to the adjacent position of the collar on the bed, placing the collars below the bed would reduce the scouring speed around a pier. Bacuta and Dargahi [23], Ackermann and Shen [24], and Hains and Zabilansky [25,26] studied the local scour at cylindrical bridge piers under ice-covered flow conditions and found that compared to open flow conditions, the local scour depth is greater under an ice-covered flow condition. Munteanu [27] performed experiments under four different boundary conditions (open flow, totally ice-covered, two sides partially ice-covered and one side partially ice-covered) and pointed out that the local scour process around the bridge pier was the most intense under two sides in a partial ice-covered condition, and the maximum scour depth was about 55% higher than that under an open flow condition. Christopher et al. [28] investigated the scour problem around bridge piers under different ice cover thicknesses and found that the scour depth increased with the increase in ice cover thickness. Wu et al. [29,30,31] investigated the local scour process under ice-covered flow conditions based on laboratory experiments and reported that the maximum scour depth increased with the increase in cover roughness. They also established empirical formulas for calculating the scour depth under an ice-covered flow condition. Wang et al. [32] analyzed the relationship between the flow intensity and dimensionless scour depth, as well as the difference in the rate of change of scour depth under an ice-covered flow condition compared to that under an open flow condition and developed an empirical equation for determining the change of scour depth with the time under an ice-covered condition. Namaee and Sui [33,34,35,36,37] studied the influence of ice covers with different roughness on the local scour process around side-by-side piers. They found that compared with the smooth-covered flow condition, the near-bed flow velocity was higher, and the maximum flow velocity position was closer to the channel bed under the rough cover. The maximum scour depth around piers increased with the decrease in particle size and the increase in cover roughness and densimetric Froude number. The smaller the pier size and the larger the pier spacing distance, the weaker the horseshoe vortex around the pier and the shallower the scour hole. The grain size of the armour layer obviously affects the depth of the scour hole.
The existing research studies either focus on the influence of bridge piers on the stability and evolution of ice jams or the local scour process around piers under an ice-covered (instead of ice-jammed) flow condition. However, no research work has been reported regarding the local scour process around bridge piers during the evolution process of an ice jam considering the thickness of an ice jam and the time for achieving the equilibrium condition. In the present experiment study, the influence of a local scour at bridge piers on the evolution of ice jams was studied. The development of scour holes under different evolution modes of the ice jam was investigated. The results of the present study can provide a basis for bridge design and safety protection in practical engineering.
2. Materials and Methods
2.1. Experimental Setup
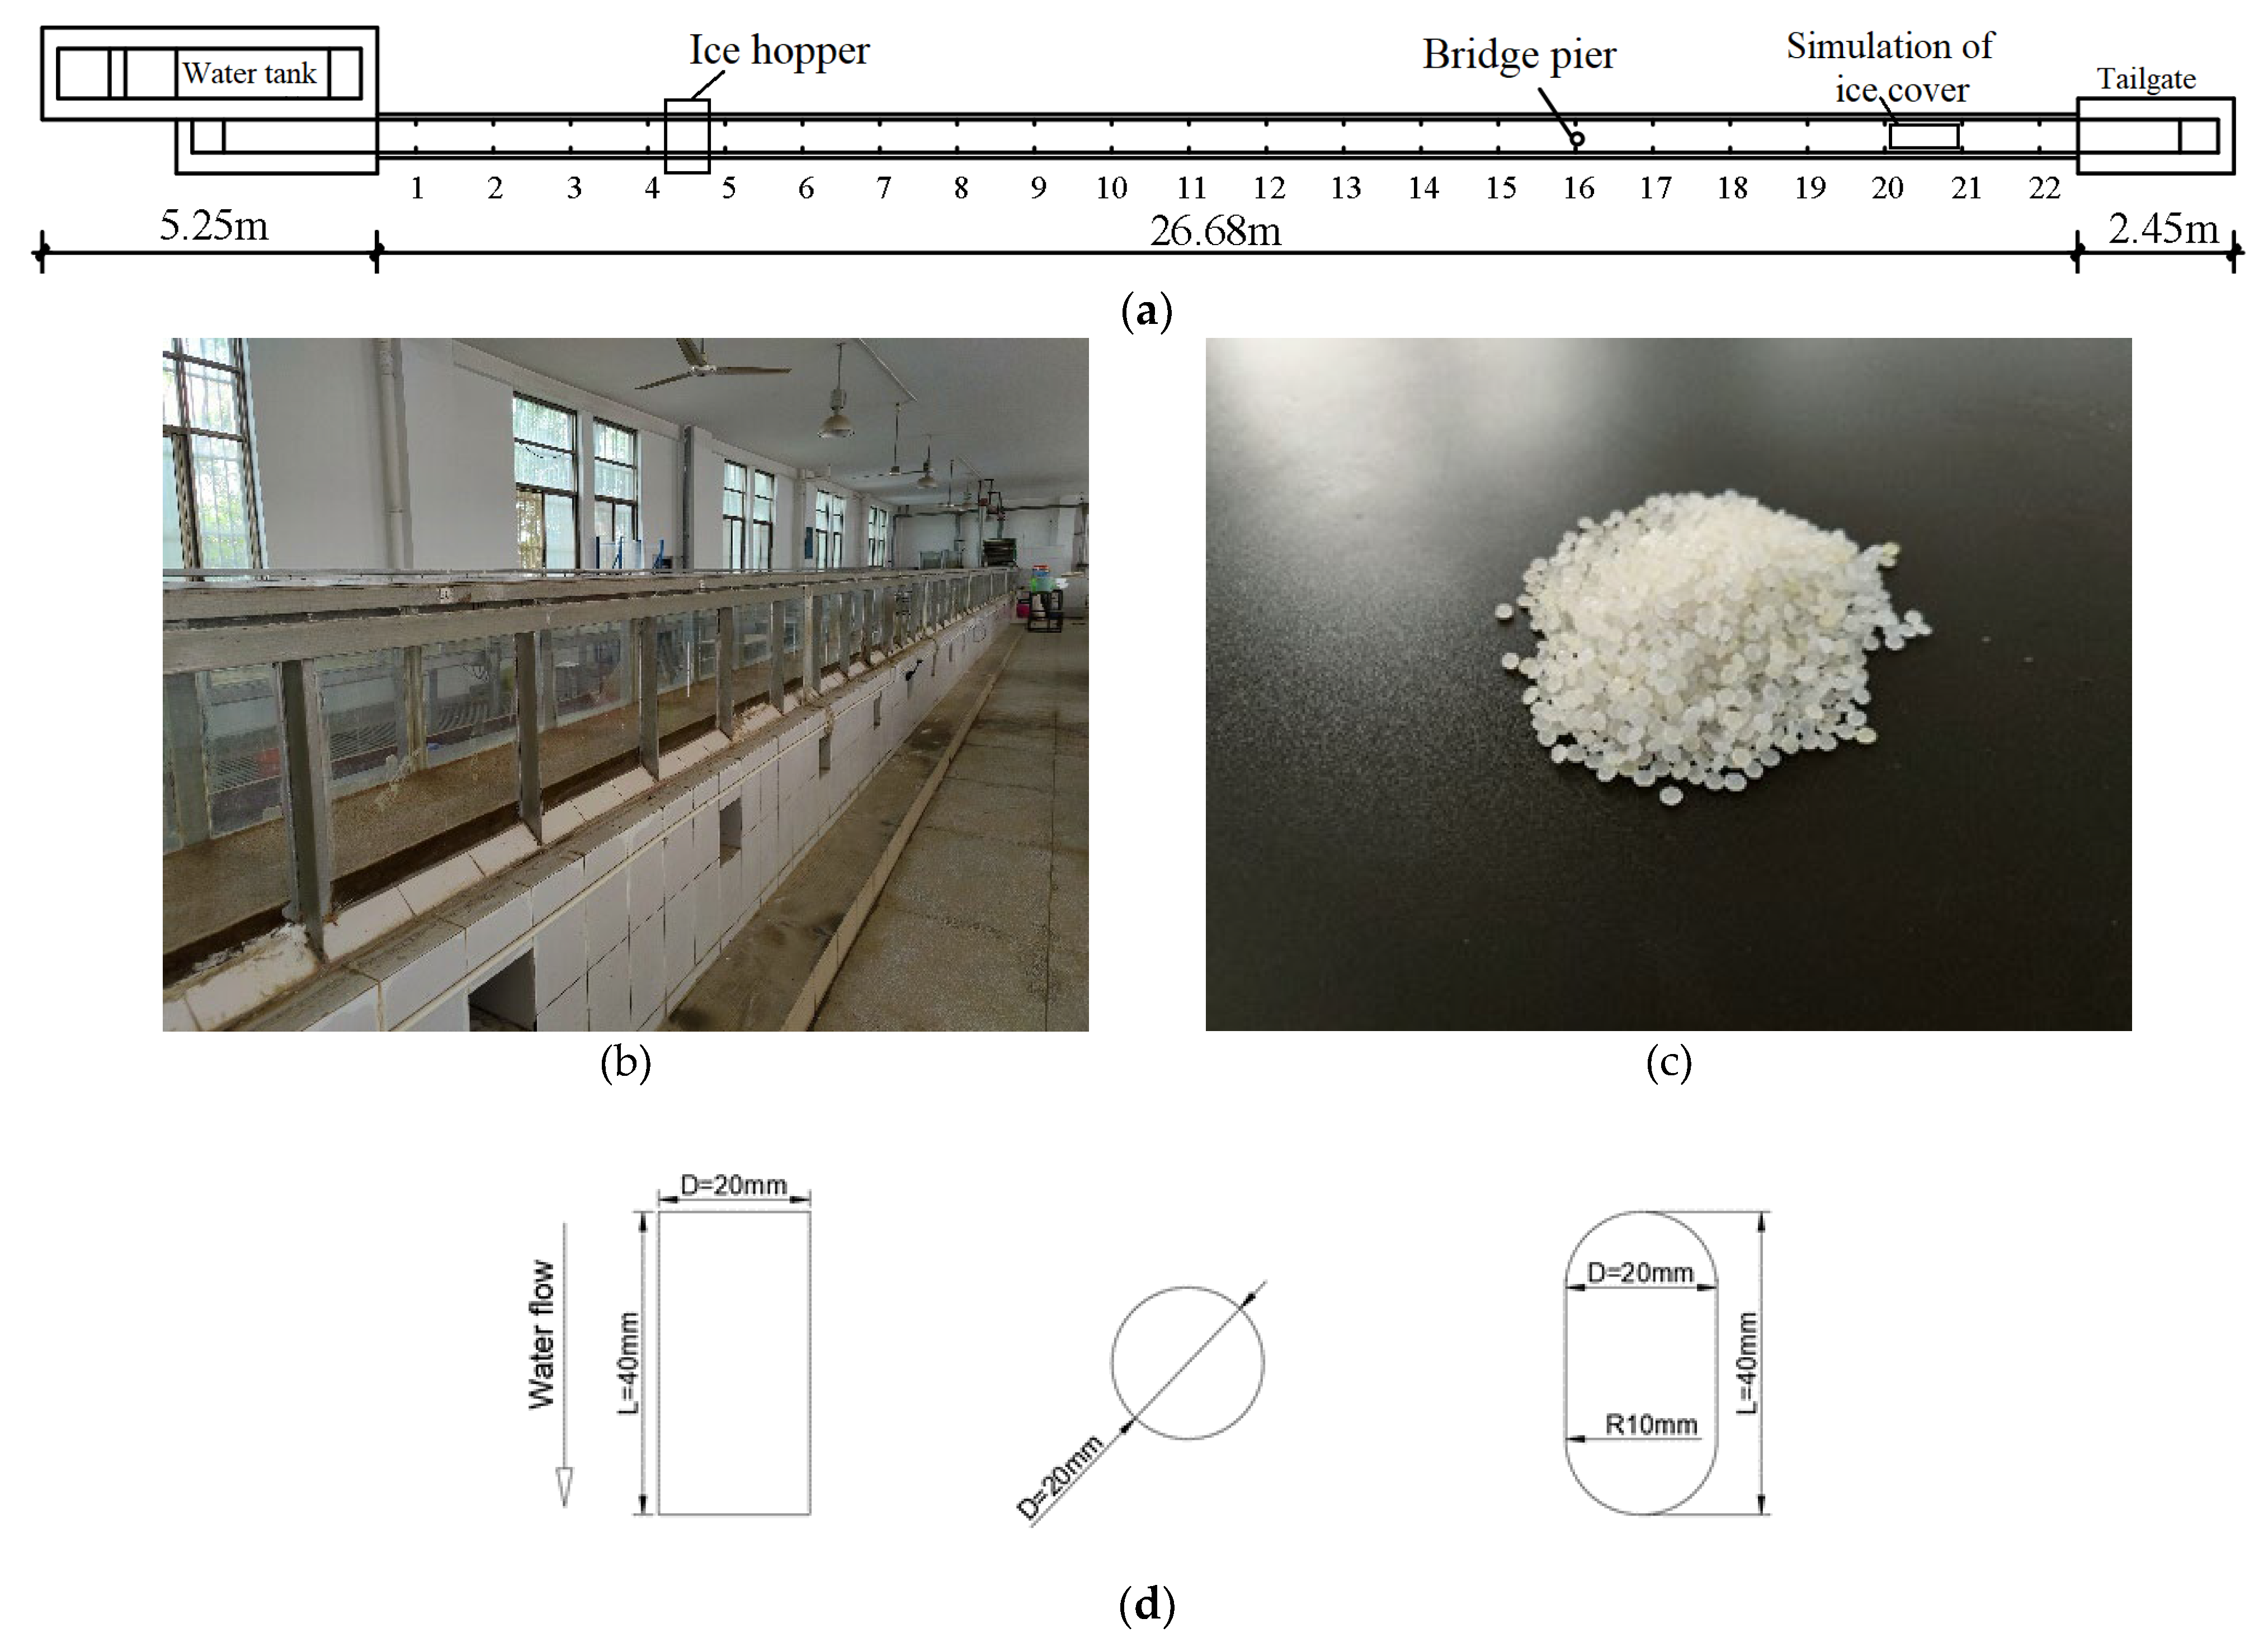
Laboratory experiments were carried out in a flume. The plan layout of the flume is shown in Figure 1. The length of the flume is 26.68 m with a width of 0.4 m and a depth of 1.3 m. Along this flume from upstream to downstream, 22 cross sections (CS) for measurement with an equal spacing distance of 1.2 m were set up. Between the upstream CS-4 and CS-5, an ice hopper was setup for discharging model ice particles into the flowing water. A Styrofoam panel that was 0.6 m long and 0.4 m wide was placed on the water surface between CS-20 and CS-21 for assisting with the initiation of an initial ice jam in front of the foam panel in the flume, corresponding to the phenomenon of an initial ice jam head formation in natural rivers.
Polyethylene particles were used to model ice particles. The mass density of the polyethylene particles was 0.918 g/cm3, which is nearly equal to the mass density of ice of 0.917 g/cm3 in rivers. Polyethylene particles has a flat ellipsoid shape with the longest diameter of 3.5 mm (as shown in Figure 1c). Between CS-2 and CS-22, a sand bed was prepared to model a sand bed in rivers. The initial thickness of the sand bed in the flume was 10 cm. The median particle size (d50) of the three sands used in the experiments was 0.49 mm, 0.713 mm, and 1.04 mm, respectively. The inhomogeneity coefficient of these three sands was 2.0, 1.61, and 2.68, respectively. The mass density was 1.423 g/cm3. Three different shapes of model piers were used, namely cylindrical, rectangle, and round end-shaped piers, as shown in Figure 1. The model pier was installed in the flume center at CS-16. Cross section 3 was the control section for the initial flow depth (H0) and initial velocity (V0) and the ice discharge rate (Qi) from the ice hopper. In engineering design, the ratio of the pier width to a single span between adjacent piers is 0.04~0.16 [38]. Considering the flume width of 40 cm, the pier width (D) was 2 cm. In addition, this research work is a conceptual study, which is not targeted at a specific engineering prototype, but mainly investigates the changes of local scours and median particle sizes of sediment on the speed of ice jam evolution and scour hole development.
2.2. Experimental Process
- (1)
- Firstly, the sand scraper was used to level the sediment bed along the study channel so that the flow pattern at each cross section was approximately the same.
- (2)
- The flume was filled with water slowly to prevent sediment particles in the channel bed from the initiation of motion until the water level in the flume reached the target value. The flow discharge of each experiment running through the triangular thin-walled weir with an accuracy of 0.1 mm was kept as constant. The water level in the flume was controlled by adjusting the tailgate of the flume.
- (3)
- Styrofoam panels were placed on the water surface between CS-20 and CS-21 to simulate the initiating point for an ice jam. A four-channel ultrasonic current meter with an accuracy of 0.01 m/s was arranged at the cross section where the pier was located to measure flow velocities around the model pier, which was placed in the center at CS-16.
- (4)
- Ice particles were filled in a barrel with a volume of 7.40 L. The mass of each barrel of ice particles was 6.786 kg. The time required for each barrel of ice particles to enter the flume from the ice hopper was calculated. At this point, the test preparation work was completed. Note: the ice discharge rate was controlled as the target value during each experiment run.
- (5)
- At CS-16, where the piers were located, the depth and length of scour holes were measured every 10 min for the first 1 h and then every 30 min. The thickness of the ice jam around this cross section was measured using a ruler with an accuracy of 1 mm, every 10 min in the previous hour, and then every 30 min (Note: when the ice wave phenomenon did not occur at this cross section, the thickness of the ice jam was the average of the largest and smallest values along this cross section; when an ice wave phenomenon appeared at this cross section, the thickness of the ice jam at this cross section was the average of the thickness of the wave crest and wave trough). The water level was measured at the same frequency as that for the ice jam thickness, and both were performed simultaneously until the ice jam and local scour achieved an equilibrium state. Experiments showed that the time for the scour hole to achieve an equilibrium state under an ice-jammed flow condition was related to the hydraulics and ice flow conditions and ranged from 8 h to 11 h. However, all experiments lasted 24 h to ensure that the local scour under an ice jam condition achieved an equilibrium state.
- (6)
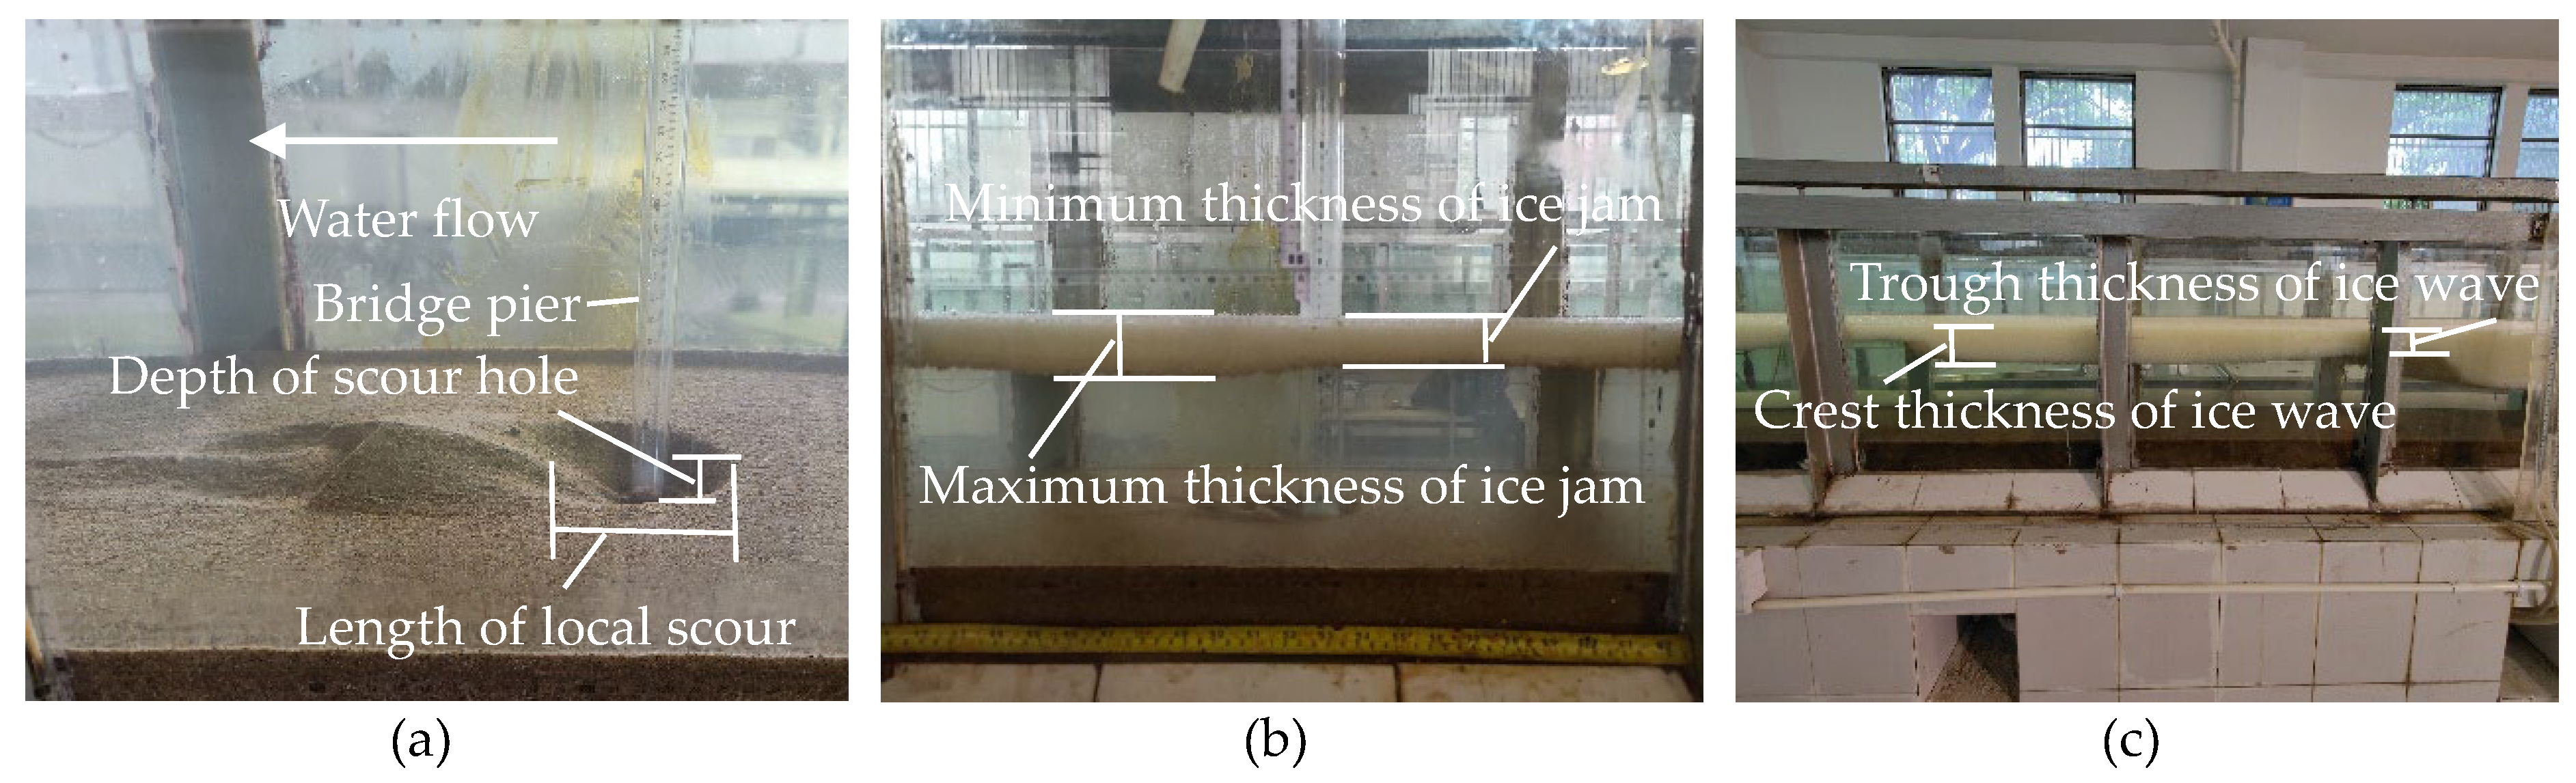
- Subsequently, we stopped adding ice particles in the flume, raised the tailgate, and gradually reduced the flow discharge to increase the water level so that ice particles under an ice jam in the flume stopped moving. To obtain a precious bathymetry of the scour hole, laboratory measurements were carefully carried out in order to not disturb the scour hole and ice jam due to the addition of probes. A point gage and a spot measuring instrument with an accuracy of 0.1 mm were used for measuring the bathymetry of the deformation of the sand bed around the pier. For each experimental run, data were collected at 26 measurement points around the bridge pier. Some variables used in this study were defined and are shown in Figure 2.
Each experimental run was considered to achieve an equilibrium state if the following conditions were met: (1) Water levels at all cross section did not change; (2) The thickness of the ice jam at any cross section did not change, namely, the amount of ice particles discharged from the ice hopper located upstream equalled that of the output at the downstream end of the ice jam; (3) The scour hole also reached an equilibrium condition, namely, not only the depth and shape of the scour hole around the pier did not change, but also the height and shape of the deposition dune downstream of the scour hole did not change. Whenever an experimental run satisfied these conditions, this experimental run was considered to reach the equilibrium state.
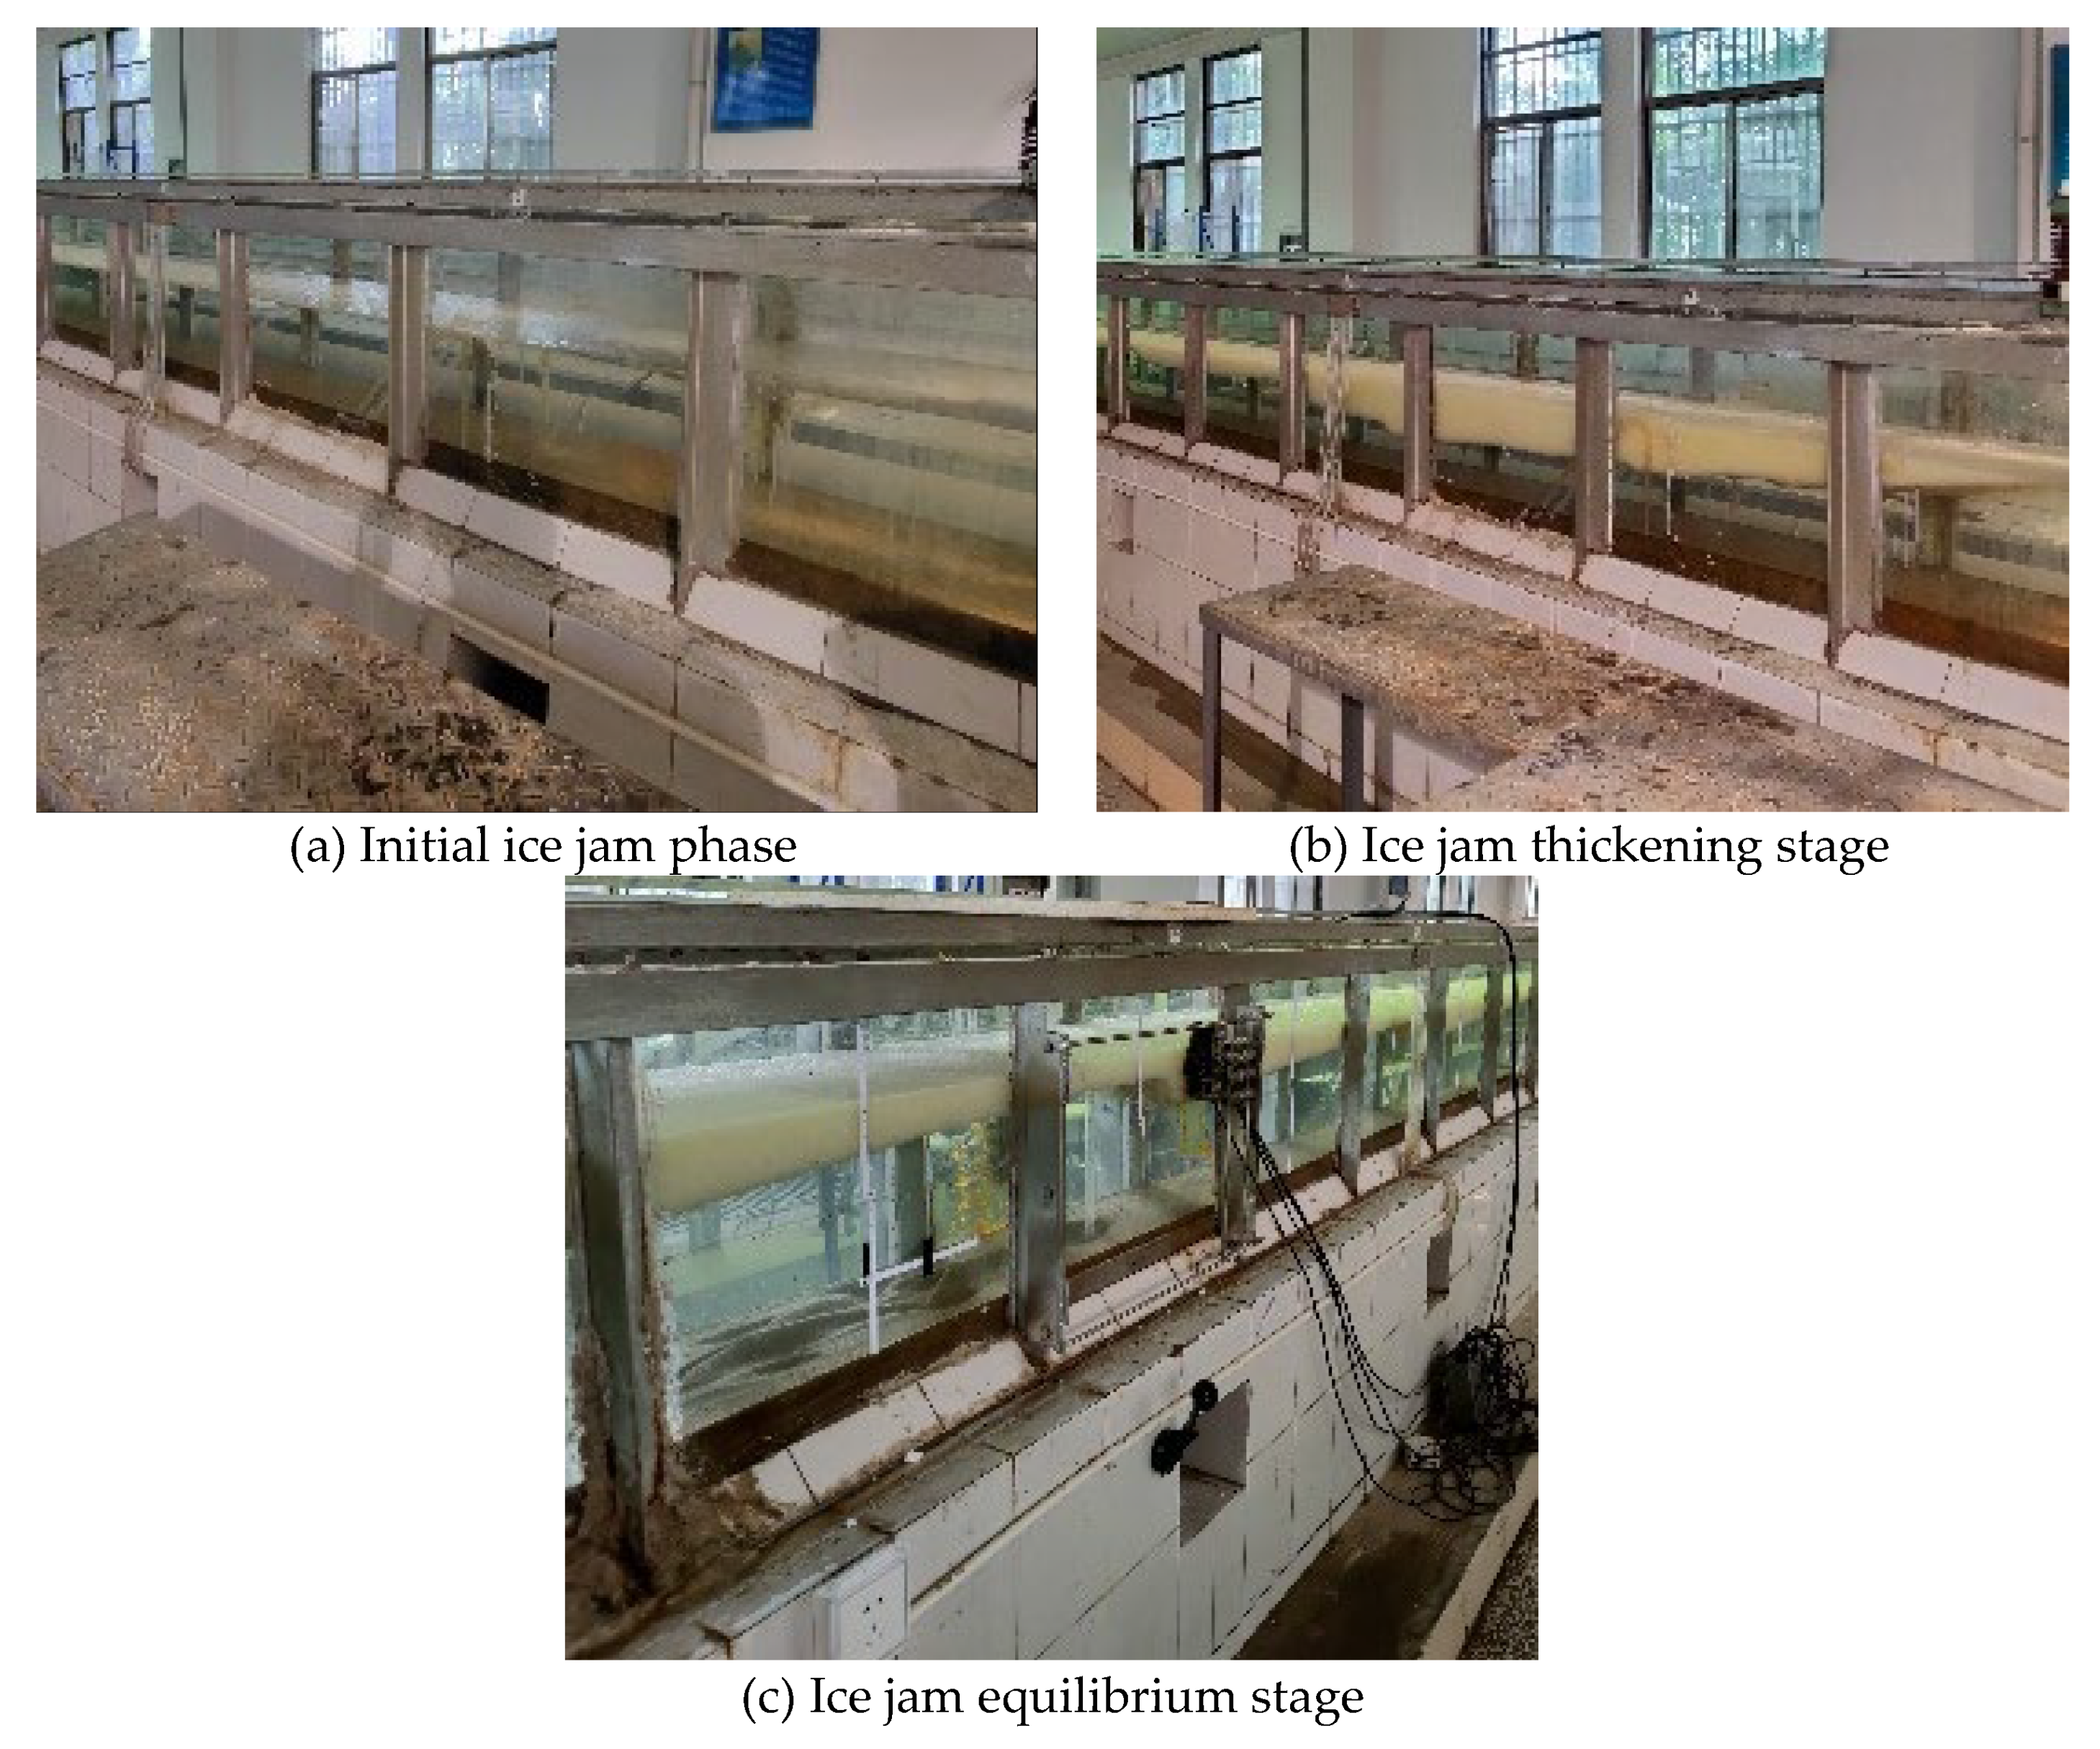
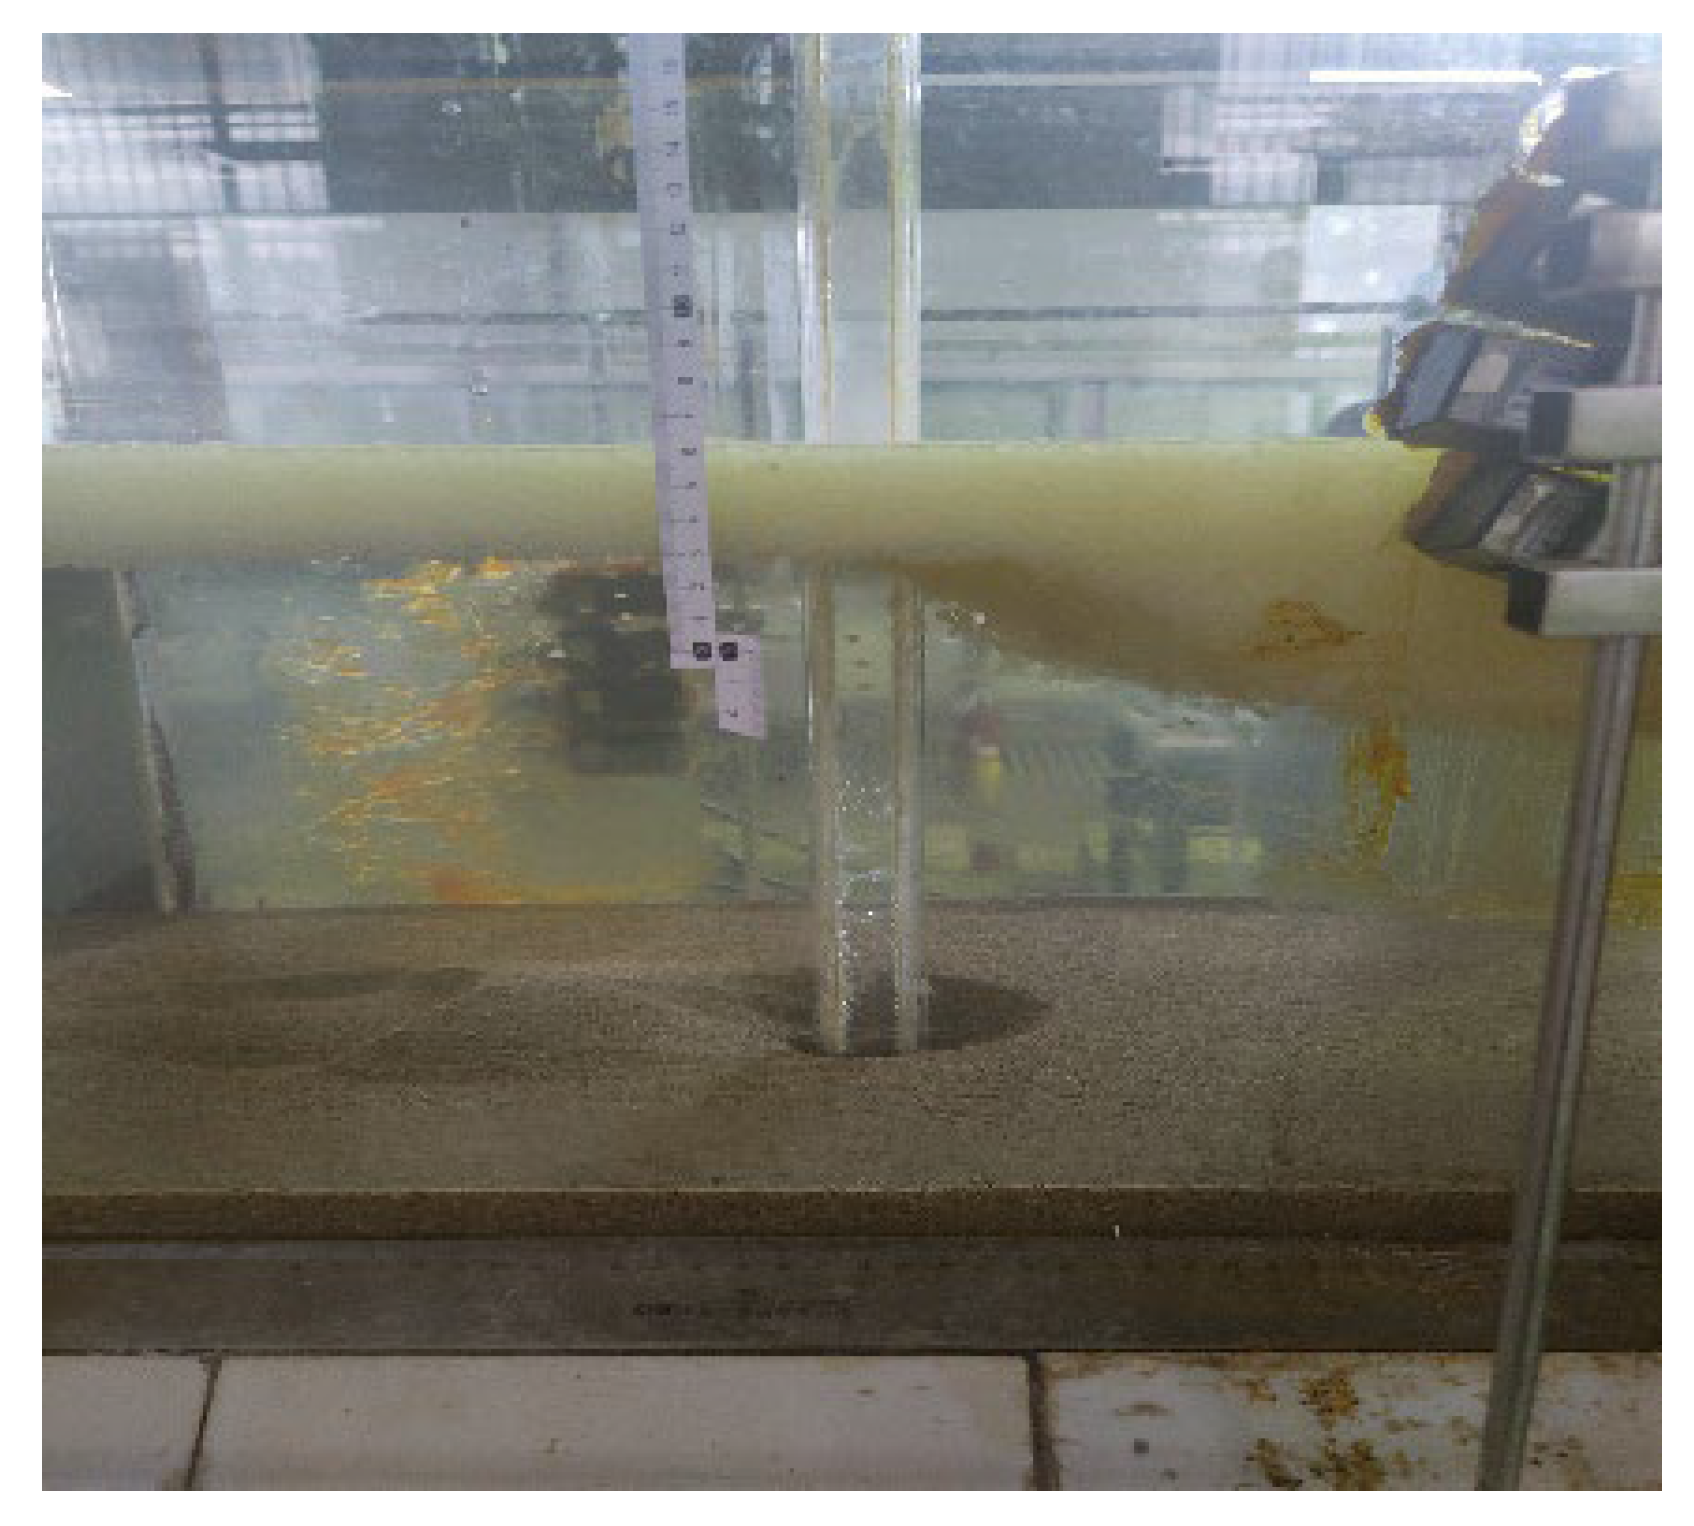
The evolution of an ice jam is divided into three stages: (1) The formation of the initial ice jam phase: the ice jam develops from the downstream Styrofoam panel to upstream with the continuous constant incoming ice particles from the ice hopper (as shown in Figure 3a). (2) The ice jam thickening stage: with the continuous incoming ice particles from the ice hopper, the ice jam gains thickness from upstream to downstream since the incoming ice particles are entrained by the flowing current and submerged at the head of an ice jam and then gradually delivered downstream. This process continues before the ice jam reaches an equilibrium state (as shown in Figure 3b). (3) The ice jam equilibrium stage: the amount of ice particles coming from upstream is equal to the output amount of ice particles (the amount of ice particles collected from the pond located at the downstream of the flume) from the toe of the ice jam body; however, the appearance of waves of ice accumulation migrate from upstream to downstream, and as a consequence, the ice jam becomes thicker whenever the crest of a wave of ice accumulation passes and thinner whenever the trough of such as wave passes (as shown in Figure 3c). In the present study, to assess the local scour around a pier, various experiments with local scour (as shown in Figure 4) and without local scour (namely, the fixed-bed experiments) were conducted, as summarized in Table 1.
Pier shape factor Kζ refers to a table for calculating the pier shape factor and pier width in the appendix of the Code for Hydrological Specifications for Survey and Design of Highway Engineering (JTG C30-2015). The pier shape factors of different pier types involved in this study are shown in Table 2.
3. Interaction of Local Scour and Ice Jam Evolution
3.1. Impact of Local Scour on Ice Jam Evolution
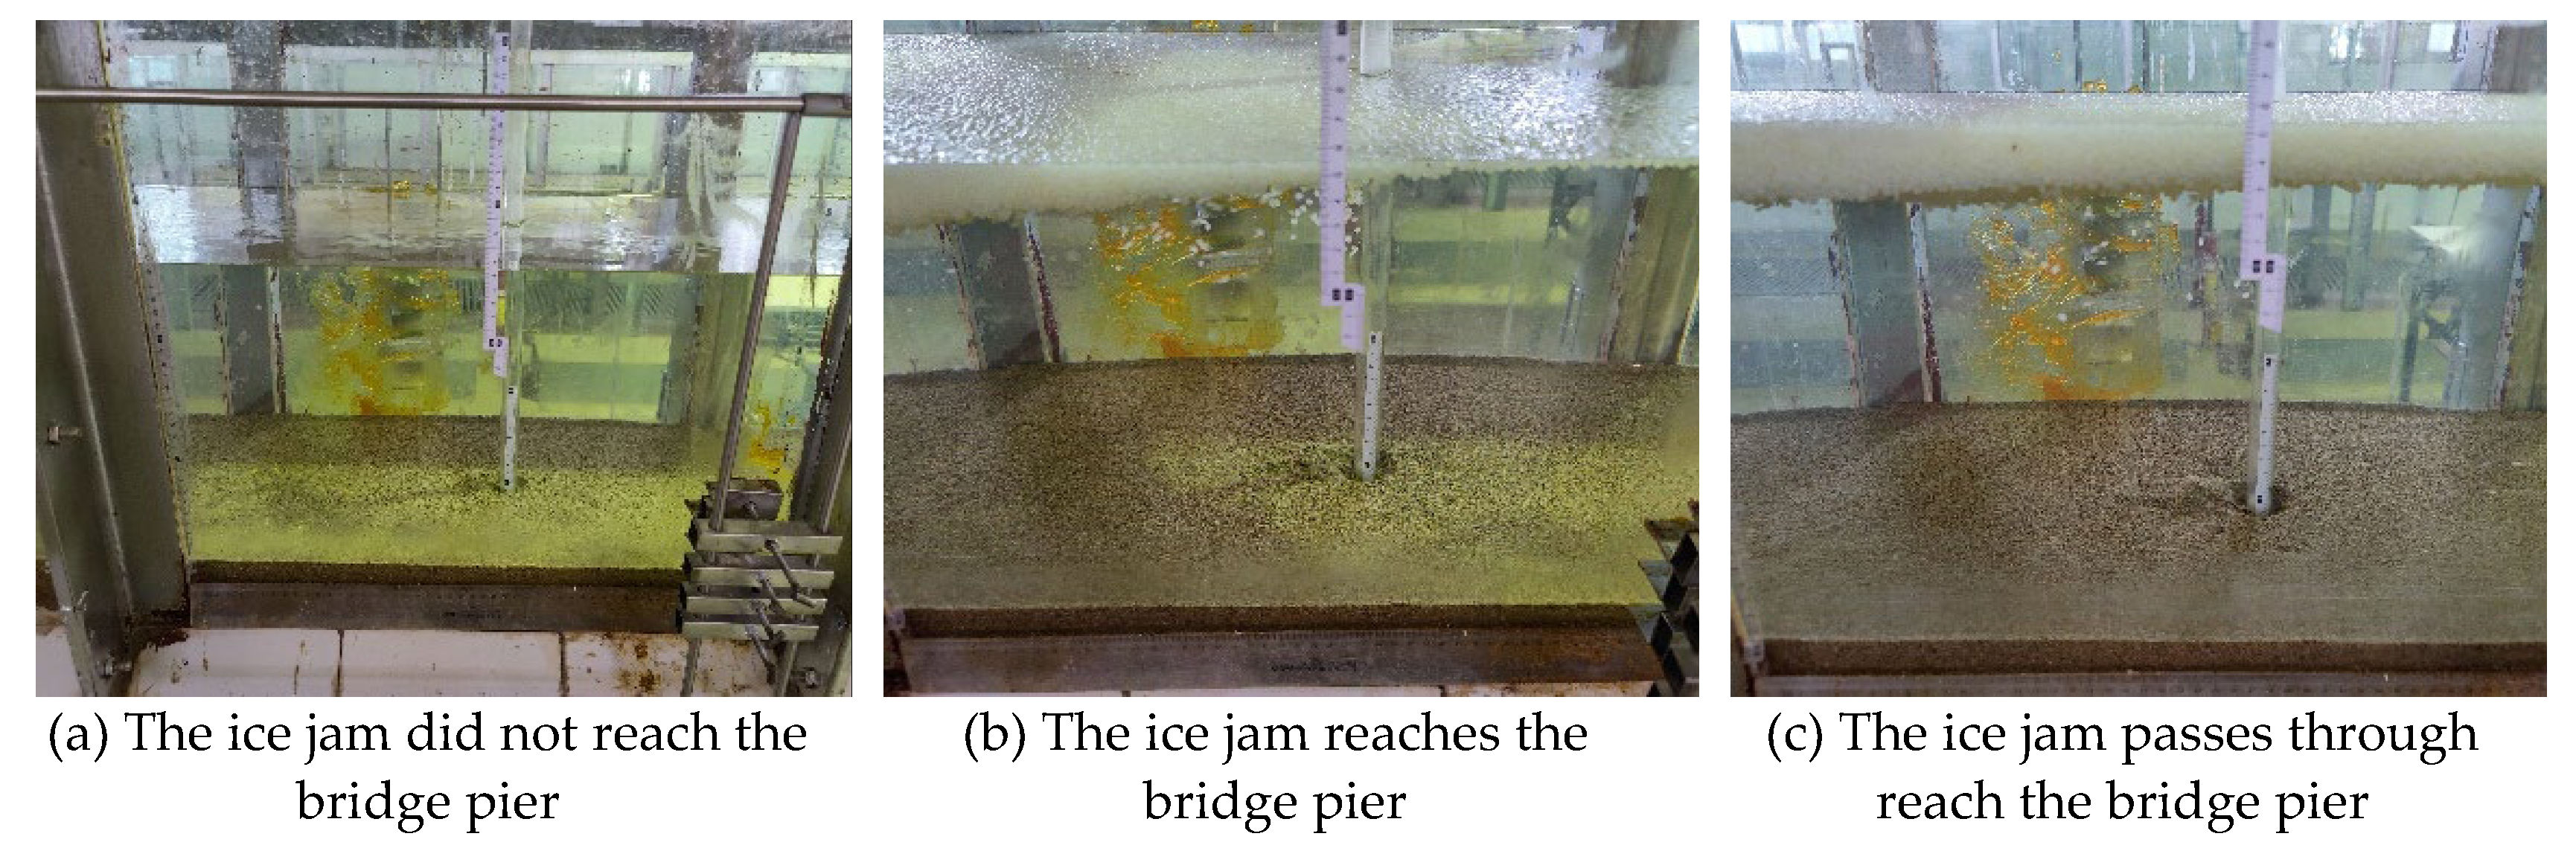
Figure 5 shows the vertical distribution of flow velocity at the cross section where the bridge pier is located, with and without a scour in the vicinity of the pier. One can see in Figure 5 that the difference in velocity distribution before and after an initial ice jam reaches the cross section (CS-16) where the pier is located (as shown in Figure 6b). It should be noted here that when an initial ice jam does not reach CS-16, it means that the head of an initial ice jam is located between CS-17 and CS-16 or downstream of CS-16 (as shown in Figure 6a), while the ice jam that passes CS-16 corresponds to the fact that the head of an initial ice jam is located upstream of CS-15 (as shown in Figure 6c).
As shown in Figure 5, before the head of an initial ice jam reaches and passes the pier, the flow velocity near the water surface or at the bottom of the initial ice jam at CS-16 is smaller. Also, the flow velocity near the channel bed is relative higher with the presence of a pier scour, compared to that without a local scour (fixed-bed condition), which makes the initial ice jam develop faster around the pier. When the head of an initial ice jam passes the pier (CS-16), the development of the initial ice jam is mainly influenced by the flow condition (velocity and depth) and the scour conditions (with or without a scour). As seen from Figure 7, in the presence of a pier scour, water levels upstream of the pier (CS-16) are greater after the initial ice jam passes CS-16; thus, the initial ice jam develops more rapidly toward the upstream section of the channel.
The comparison of the time required to complete the formation of an initial ice jam along the entire channel with and without a local scour is shown in Table 3. Compared with the results without a local scour process around the pier, the time required to complete the formation of an initial ice jam along the channel is shorter with the presence of a local scour around the pier. Because of the local scour process around the pier, the flow velocity near the pier is smaller, which leads to a more rapid development of the initial ice jam toward upstream. Meanwhile, with the propagation of the head of an initial ice jam toward upstream, the water levels upstream of the initial ice jam head are higher, and thus the flow velocity is lower, and it takes a shorter time to complete the formation of an initial ice jam along the channel.
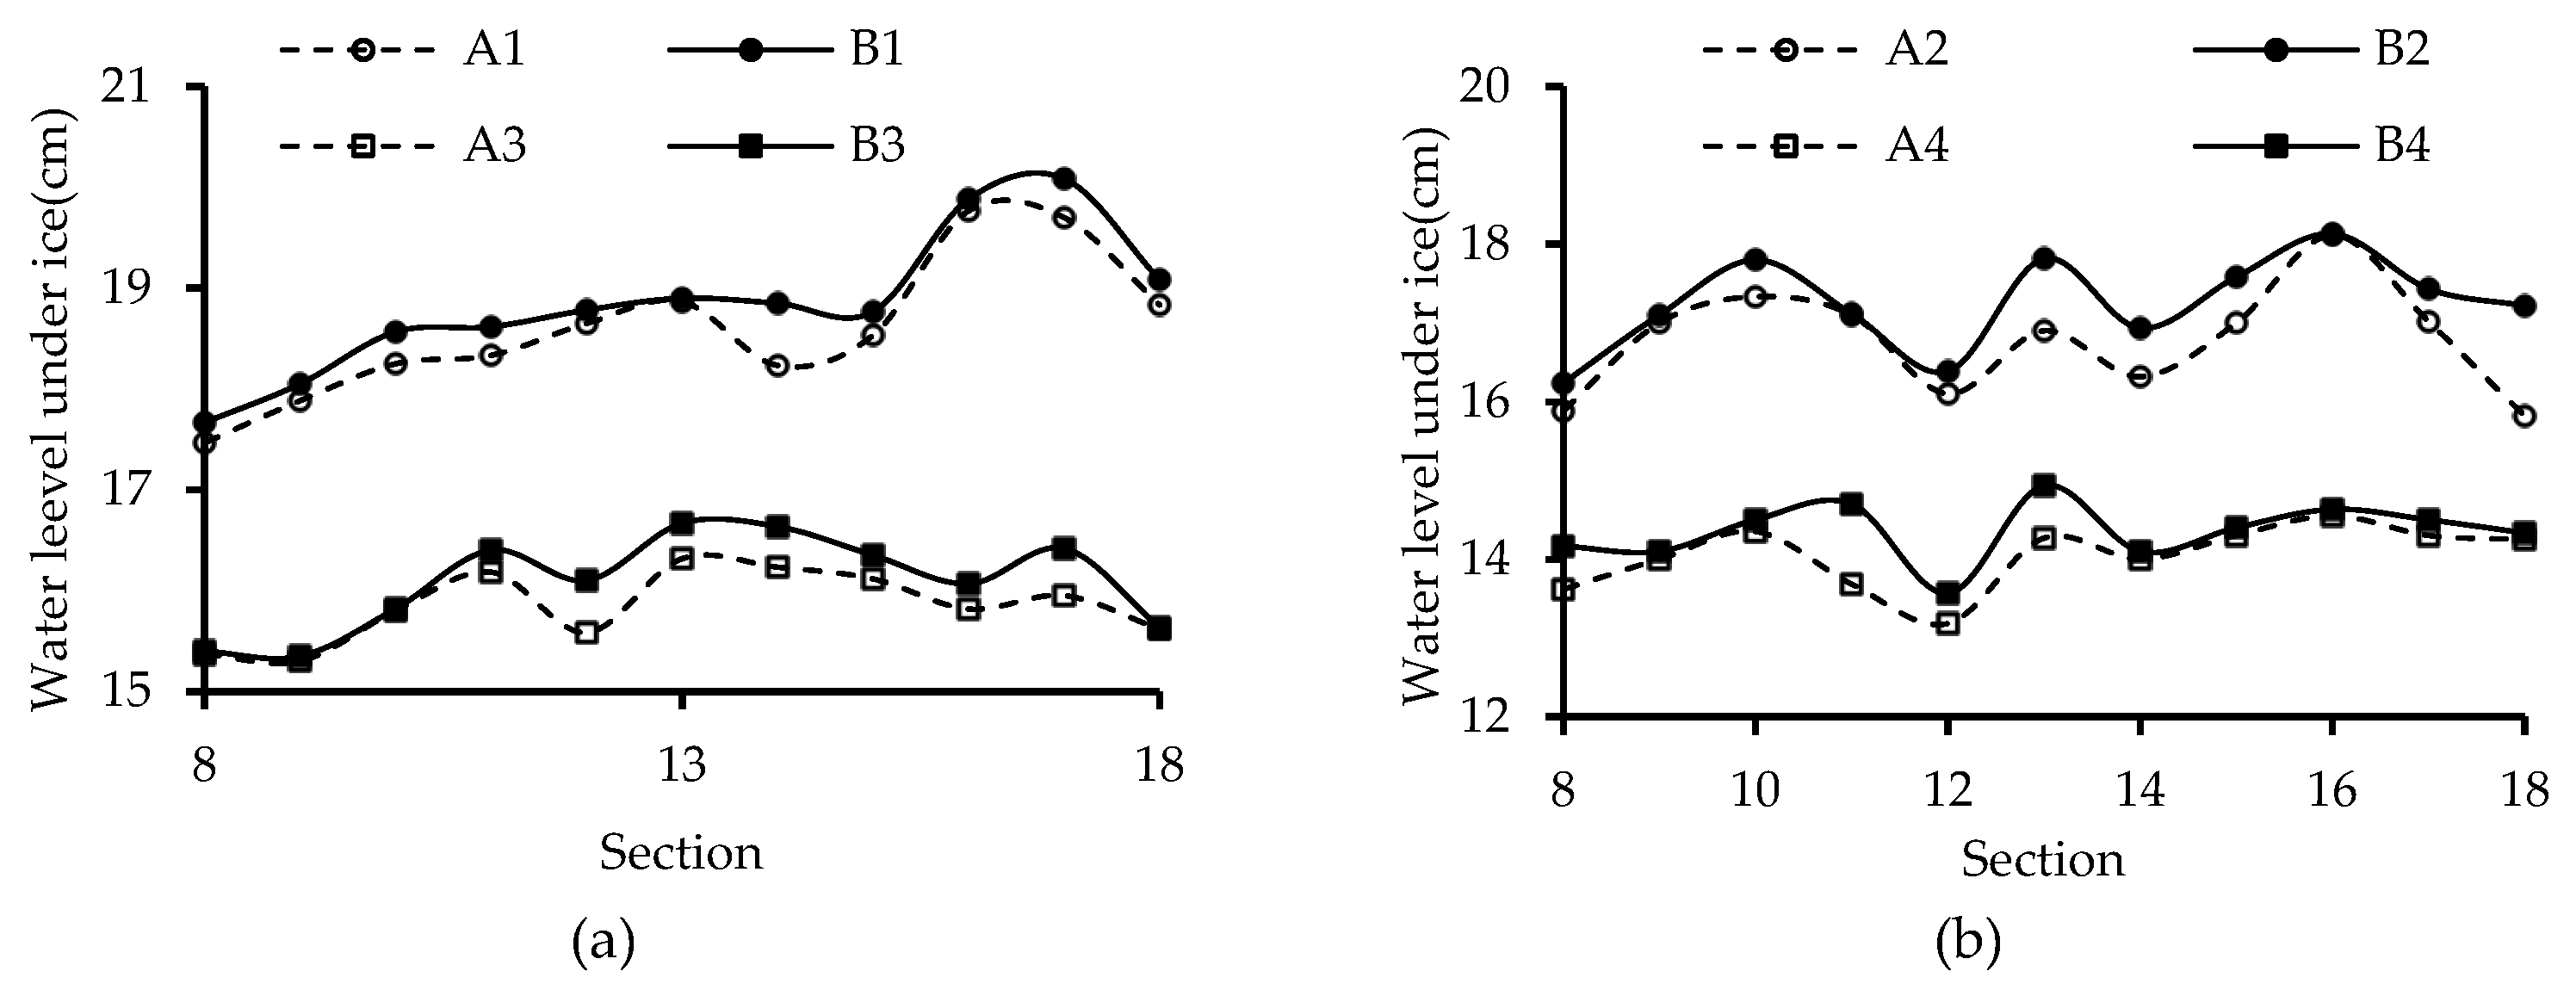
The flow depths under an equilibrium ice jam with a local scour were compared to those without a local scour, as presented in Figure 8. At each designated cross section, under the same hydraulic condition and ice discharge rate, the flow depth under an equilibrium ice jam without a local scour process (“B”) is smaller than that with a local scour process (“A”), and thus, the average flow velocity is larger, and the ice transport capacity is stronger. This means that the existence of a local scour should consume part of the energy of the flow under an ice jam, which is not conducive to the transportation of ice particles to the downstream section.
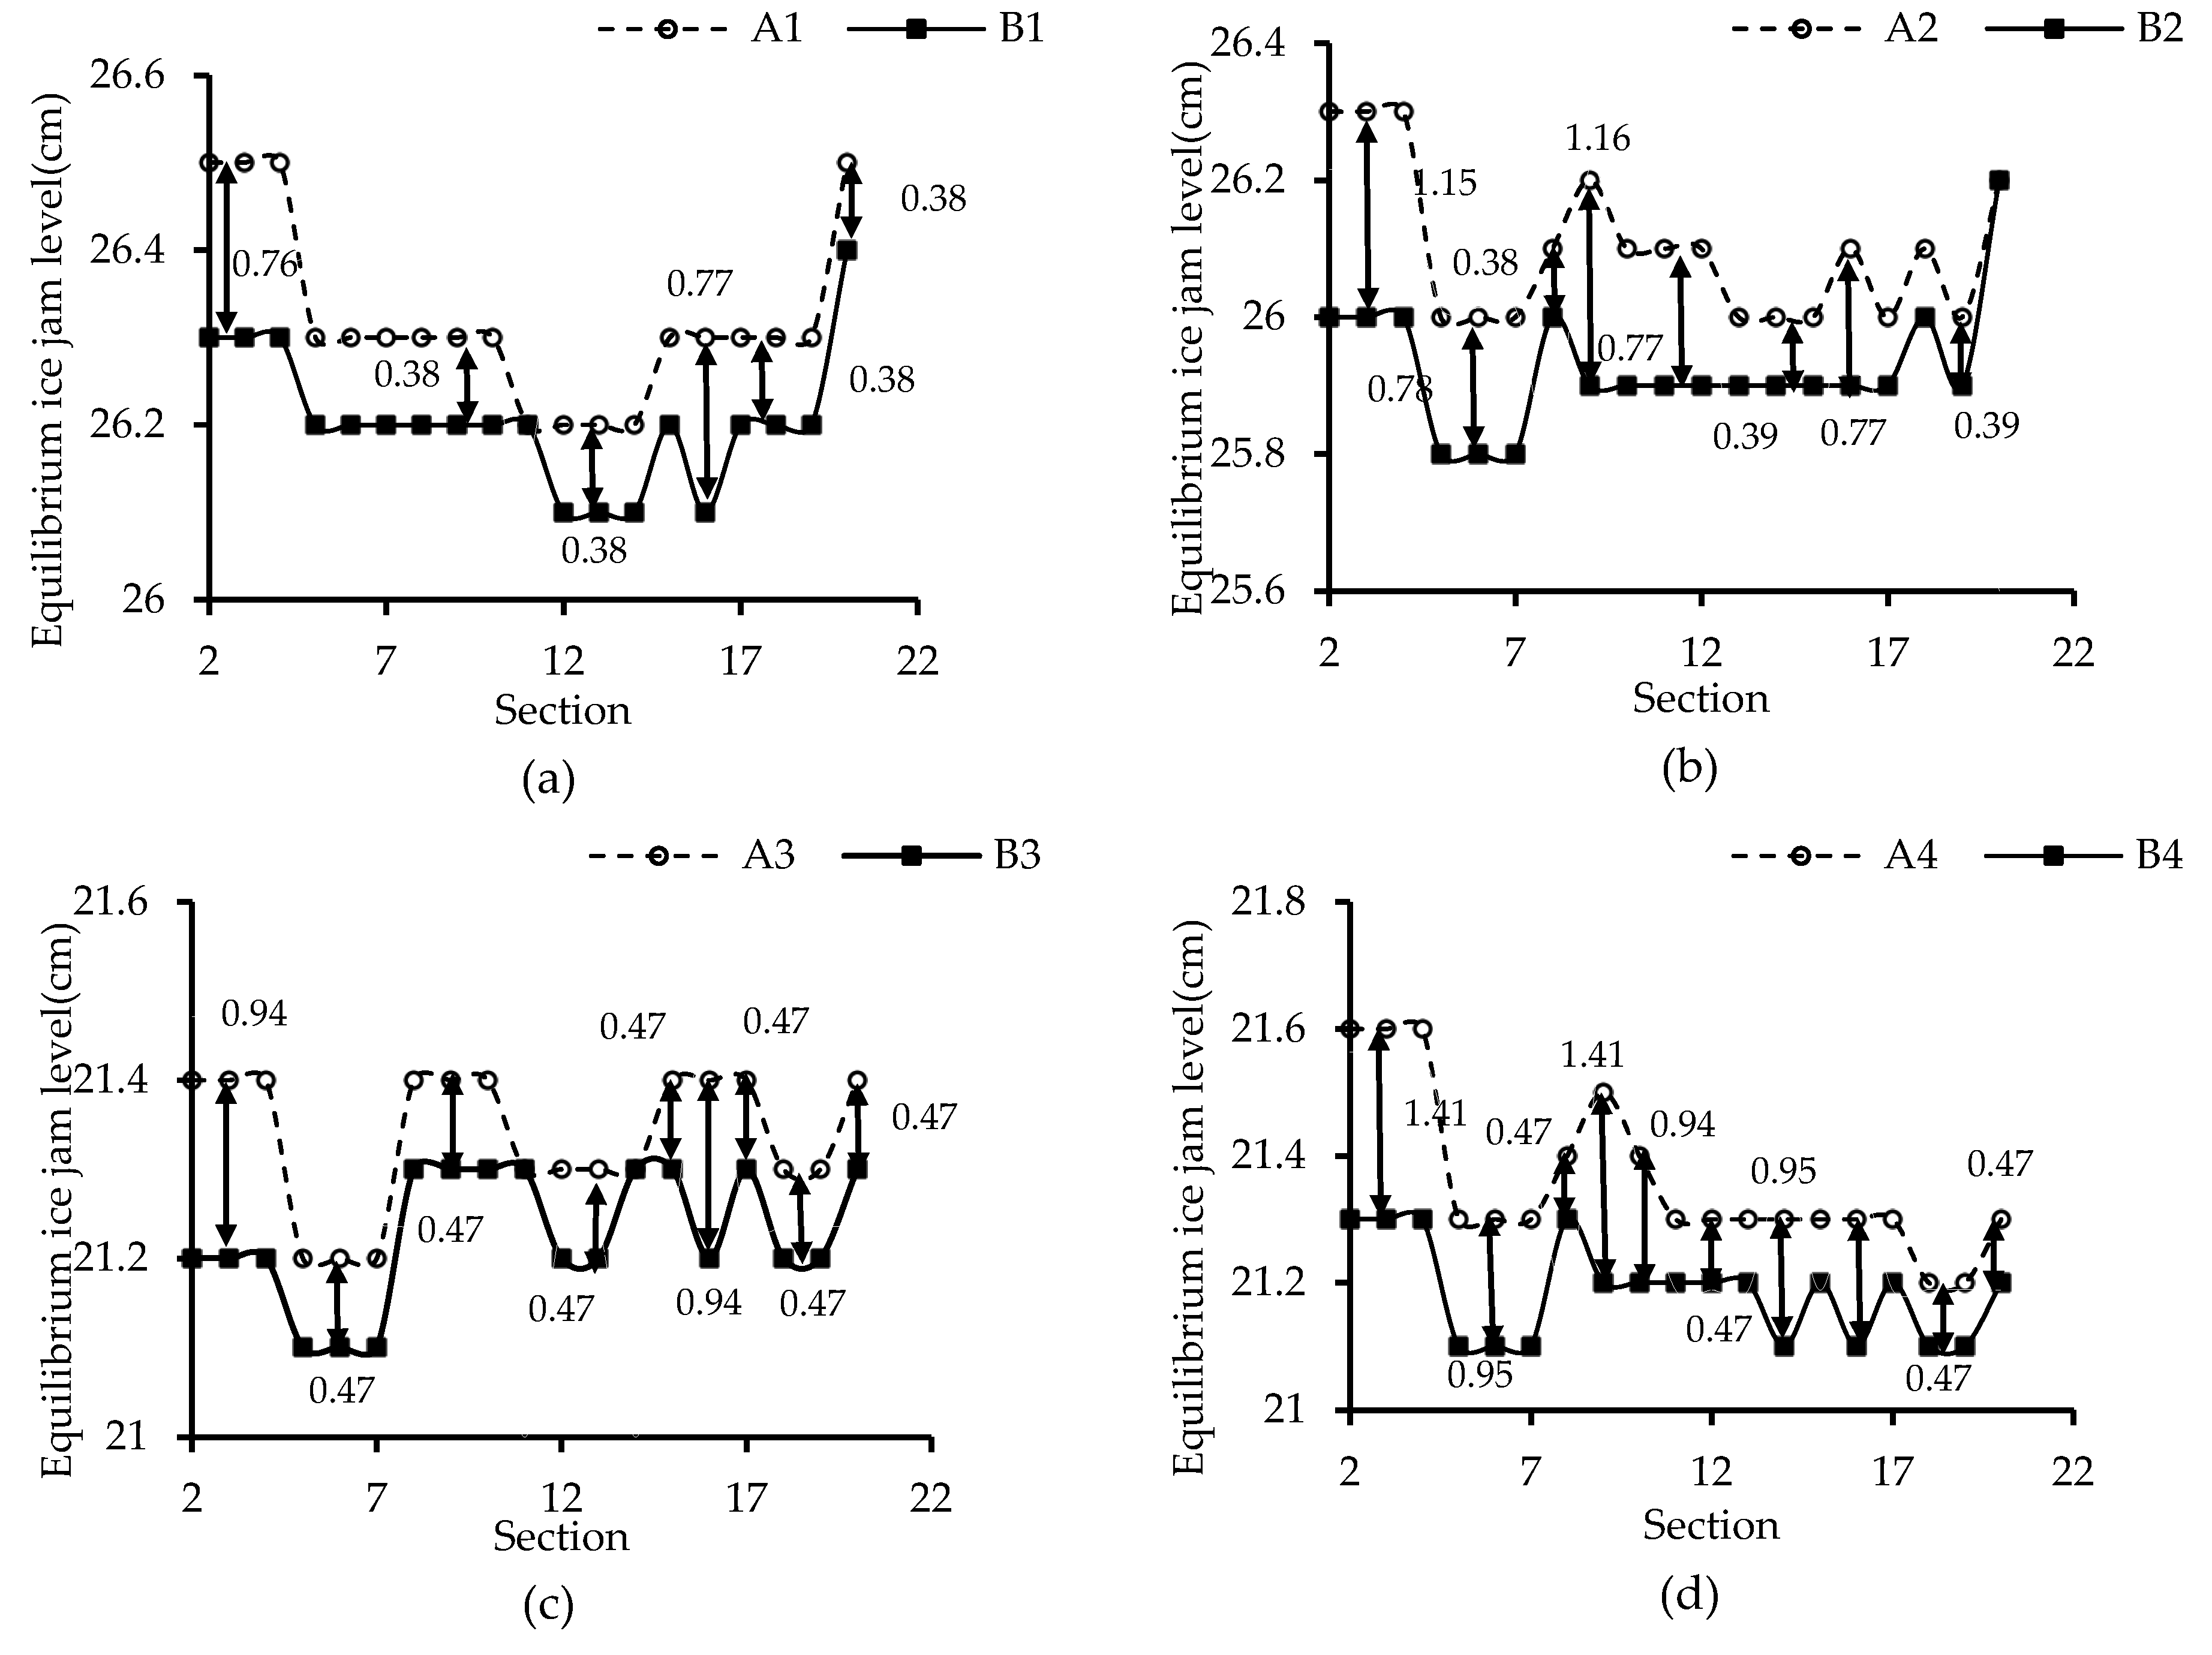
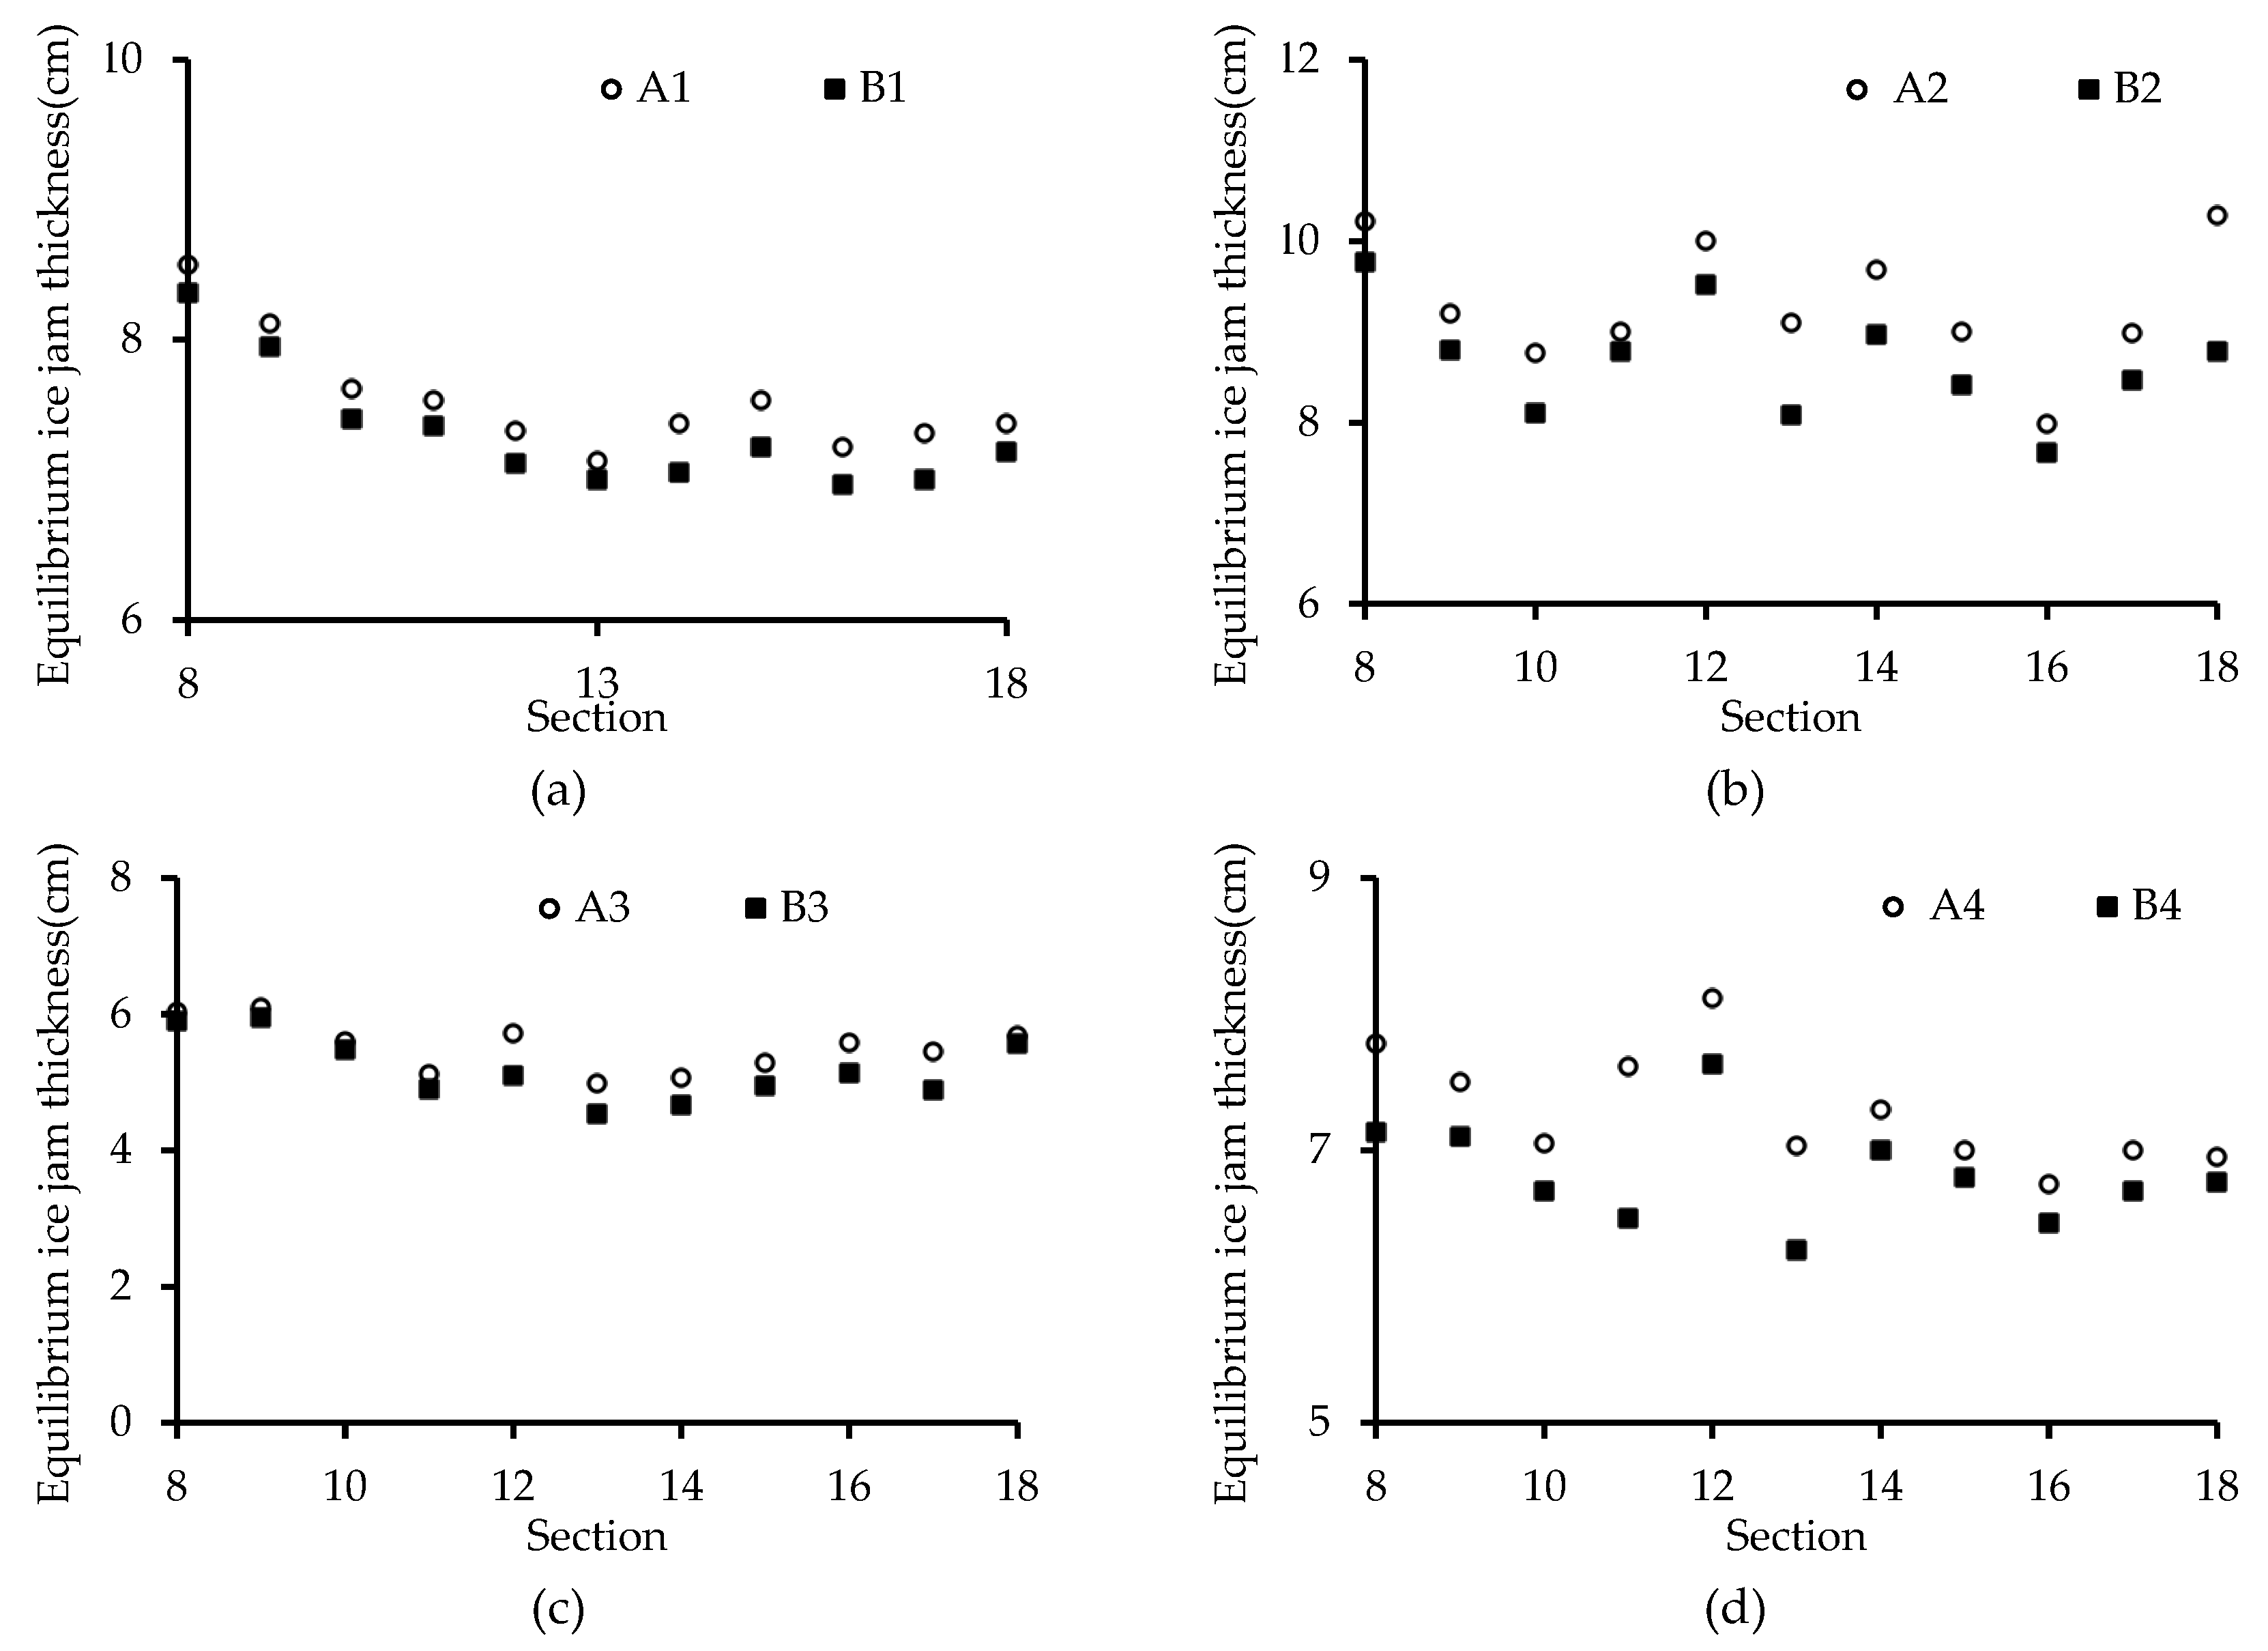
Figure 9 shows the comparison of water levels during the state of an equilibrium ice jam with a local scour to those without a local scour around a pier. It can be seen from Figure 9 that for an equilibrium ice jam, the water level at each cross section with a local scour is greater than that without a local scour around the pier. At the same time, it can be seen that in general, with the presence of a local scour at the pier, the increase in the water level along the channel reaches between CS-2 and CS-4 is the highest. This phenomenon results from the thickening stage of an ice jam, namely, the thicker the ice jam, the higher the upstream water level and the larger the hydraulic slope, as reported by Sui et al. [39]. The numbers in Figure 9 show that when the water level for an equilibrium ice jam without the presence of a local scour is used as the benchmark value, one can clearly see the rate of increase in the water level for an equilibrium ice jam with the presence of a local scour condition. The rate of increase in water level at the cross section where the pier is located is also larger because the presence of a local scour and the pier resulted in an increase in water level compared with that at the other cross sections. On the other hand, one can see from Figure 10 that the thickness of an equilibrium ice jam at each cross section with a local scour is greater than that without a local scour around a pier. Because of the existence of a local scour, the water flow will lose part of the energy through the bridge pier section, which reduces the ice transport capacity of the water flow near the bridge pier section, and during the evolution of the ice jam, the ice particles near the pier are transported downstream less, and the thickness of the cross-section ice jam increases. While the thickness of the ice jam near the pier thickens, the upstream water level increases, thereby reducing the water flow ice transport capacity of the upstream section, and there is more ice particle accumulation in the upstream section.
Table 4 shows the comparison of the time required for an ice jam to reach an equilibrium condition with a local scour process around the pier to that without a local scour. As shown in Table 4, it takes a longer time for the ice jam to reach an equilibrium jam stage with the presence of a local scour than that without a local scour at the pier. As mentioned above, the presence of a local scour consumes the flow energy near the pier. Because of the presence of a local scour at the pier, the water depth of the flow cross section increased. During the thickening stage of an ice jam, the ice transport capacity around the pier is weakened. Thus, there are more ice particles accumulated at the bottom of the ice jam near the pier; as a consequence, it causes an increase in the thickness of the ice jam and a reduction in the water depth under the ice jam. This will affect the transport capacity of ice particles. This local scour process and ice jam evolution interact with each other, and thus, it takes a longer time for an ice jam development to achieve an equilibrated stage with the presence of a local scour at the pier.
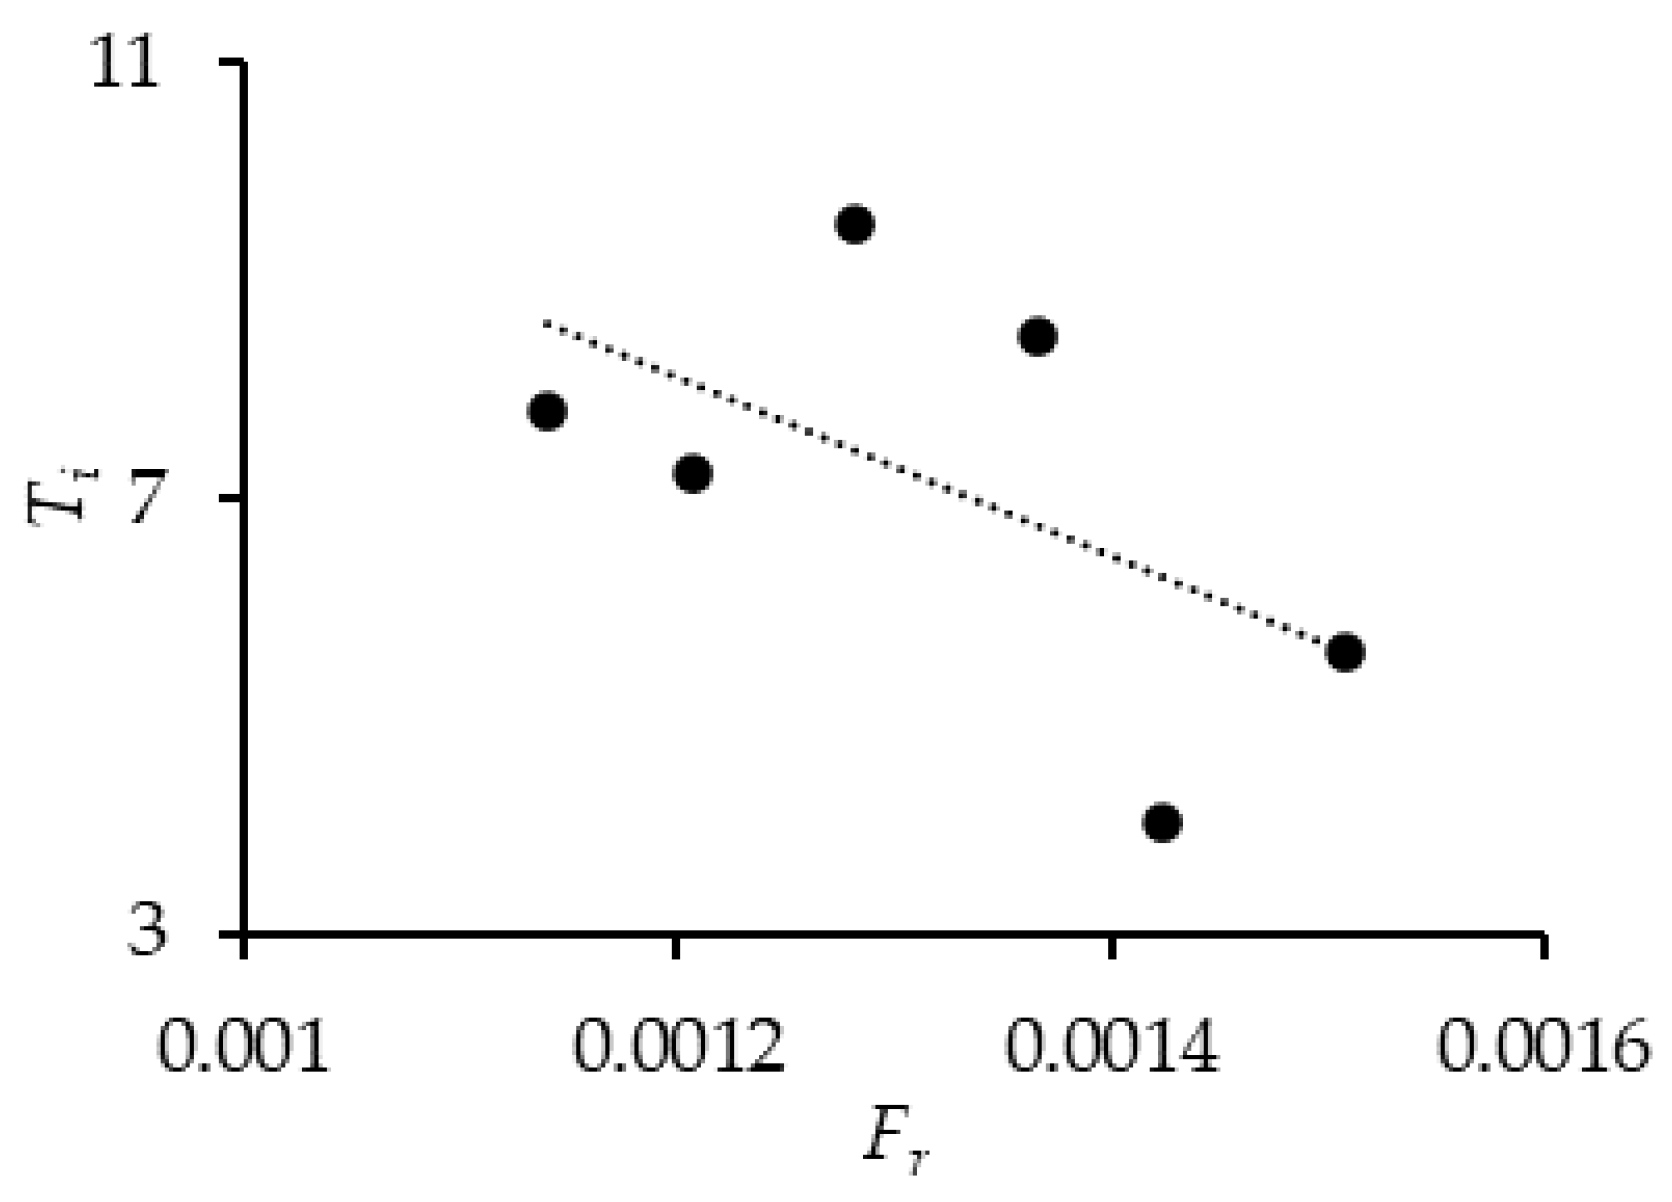
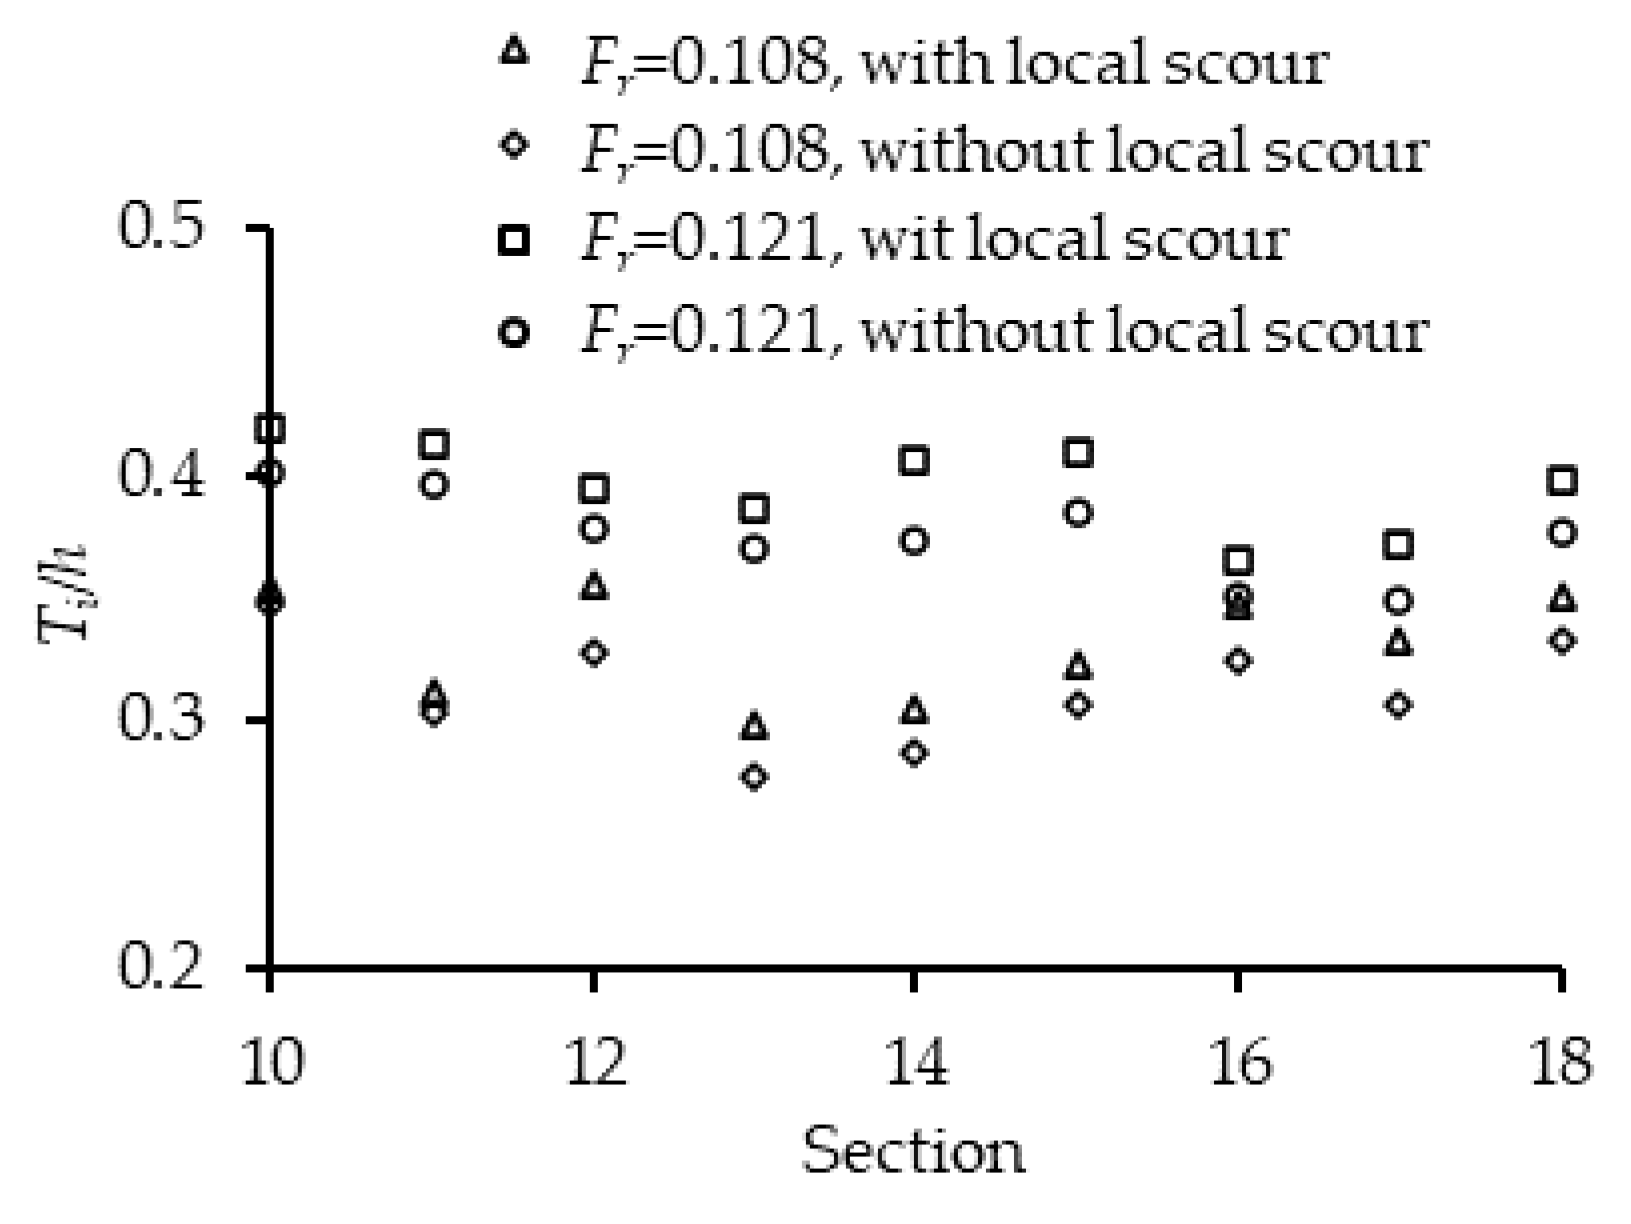
As seen in Figure 11, for the same ice discharge rate (Qi), the ratio of jam thickness (Ti) to flow depth under an ice jam (h) Ti/h decreases with the increase in the flow Froude number Fr regardless of whether a local scour appears around the pier. An increase in the Fr means that the ice transport capacity of the flow under the ice jam increases, and more ice particles are transported downstream during the evolution of the ice jam (as shown in Figure 12). Thus, the thickness of the ice jam becomes relatively small (as shown in Figure 13). It was also found that with the same Fr, the Ti/h is larger when there is a local scour around the pier. Because of the presence of a local scour, the flow velocity at the cross section where the pier is located decreases. Therefore, the transport capacity of the ice decreases; the ice jam evolution process slows down, and fewer ice particles are delivered to the downstream of the pier. Thus, the thickness of the ice jam increases, resulting in a greater value of Ti/h in the equilibrium state. During the thickening process of an ice jam near the pier, the upstream water level increases. Thus, the ice transfer capacity in the upstream section is also reduced. More ice particles accumulate in the upstream section. The flow velocity under the ice jam increases and causes the local scour upstream of the pier. Thus, the Ti/h value in the upstream cross section is greater (as shown in Figure 14). In Figure 12, Fr is the flow Froude number of the initial flow at the cross section where the pier is located.
3.2. Effect of Ice Jam Evolution on Local Scour
The results show that compared to the formation of a scour hole under an open flow condition, the formation of a scour hole under an ice-jammed flow condition can be classified into the following two different categories based on the thickening process of the ice jam:
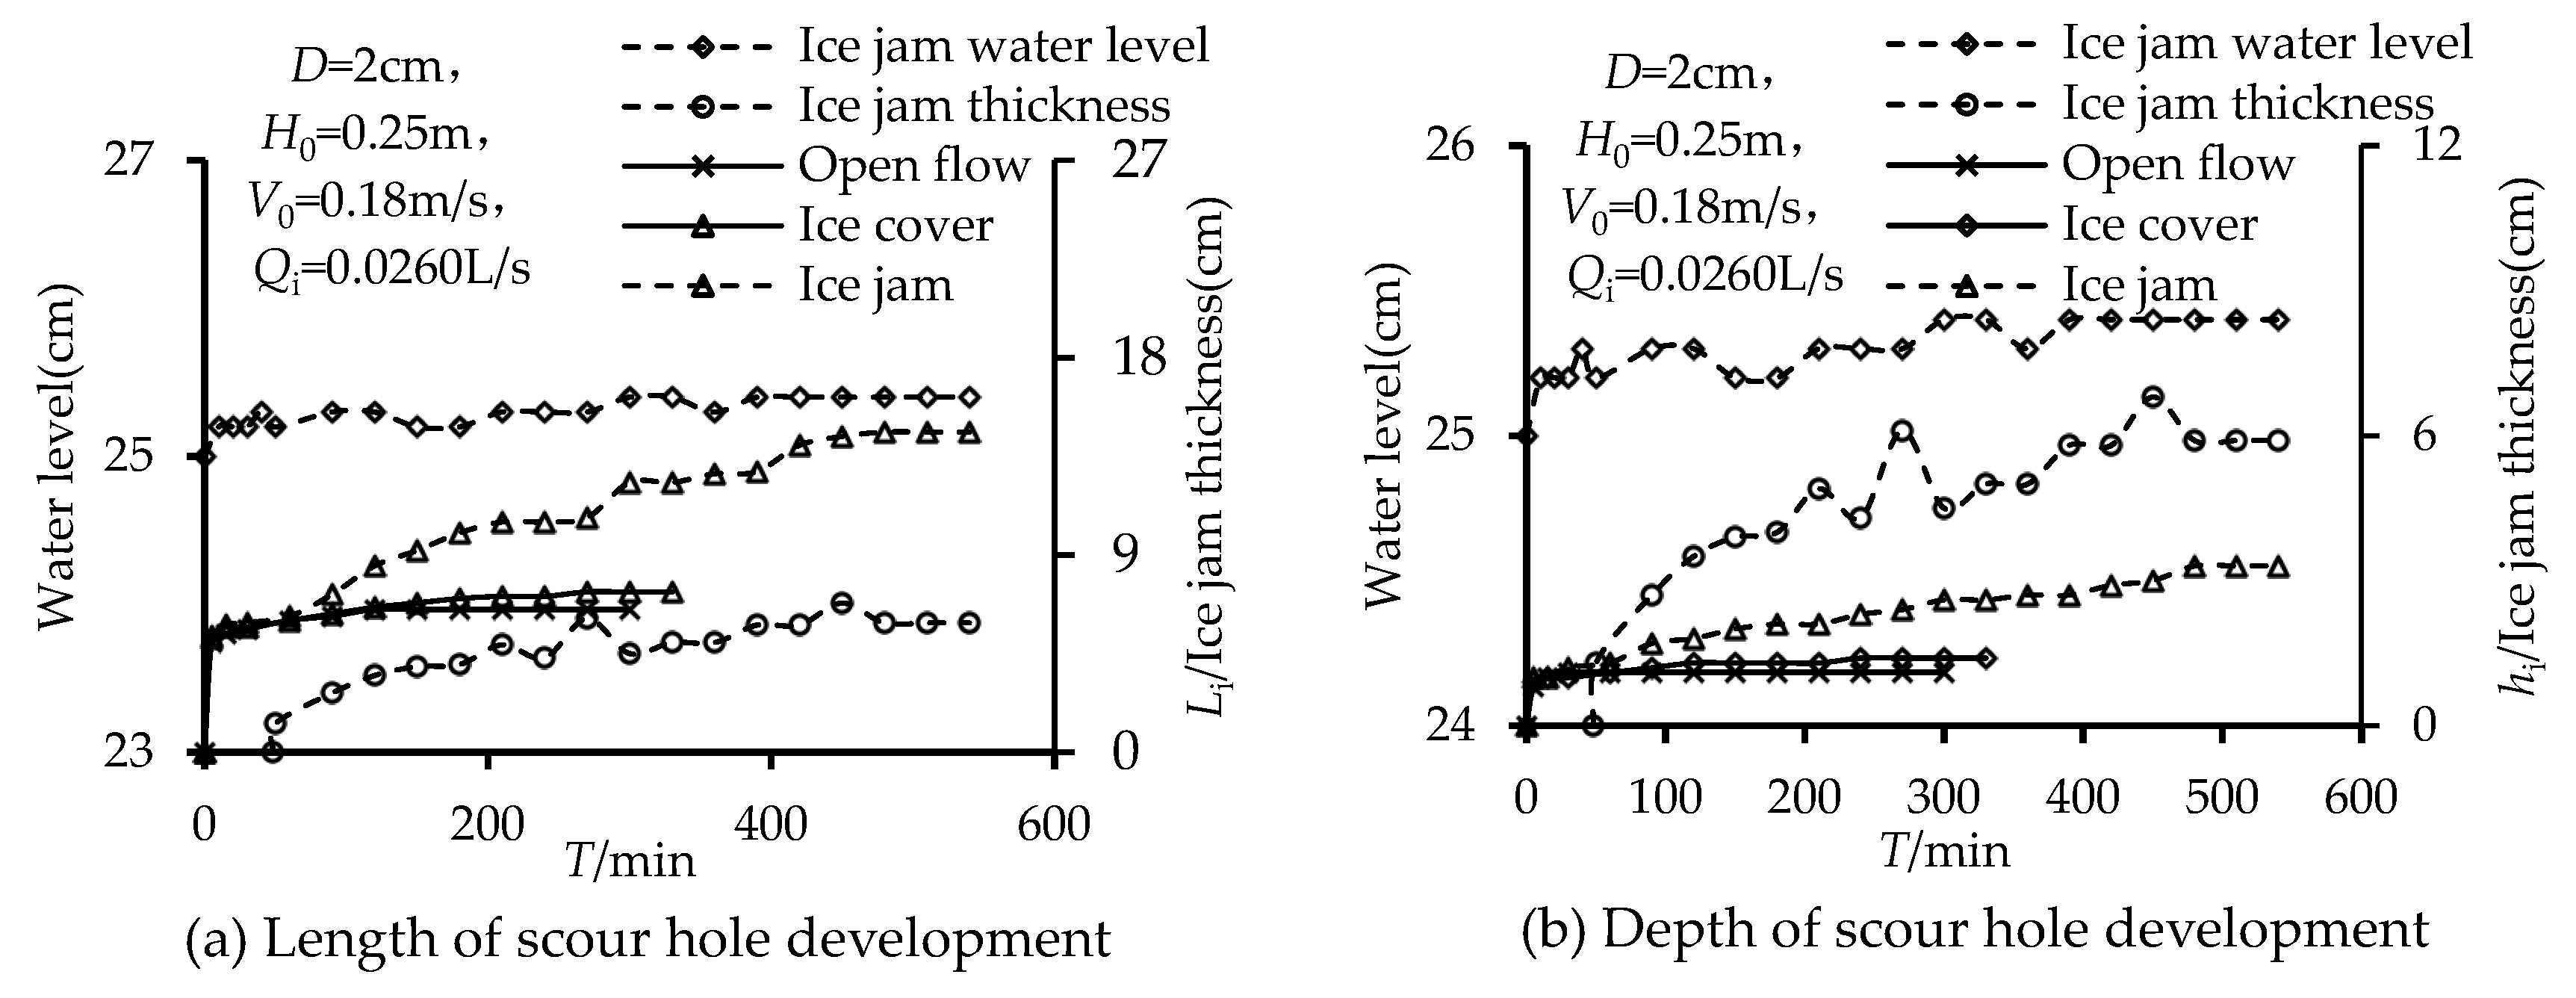
- The bed shear stress changes dramatically after an ice cover forms on the water surface compared to that of open flow conditions. Thus, in the presence of an ice cover, the turbulence intensities in a scour hole increase, and the sediment transport will be affected significantly. As pointed out by Wu et al. [29,30,31], the rougher the ice cover, the closer the maximum velocity to the sand bed and thus, the greater the Reynolds shear stress inside the scour hole. As a consequence, the scour hole at a pier becomes deeper. When the development of an ice jam is dominated by a mechanical thickening process (an ice cover is unable to withstand the external forces acting on it and is broken up and extruded to form an ice jam) [40], the development process of a scour hole is similar to that under an open flow condition. In such a case, as the ice jam develops upstream, the thickness of the ice jam increases. When the initial ice jam reaches the pier, the thickness of the initial ice jam grows rapidly, and the flow depth decreases. Thus, the velocity under the initial ice jam at this section increases and results in an intensified scouring process around the pier with a rapid increase in the scour depth. The scouring process at the pier gradually decreases since the increase in the jam thickness gradually slows down and gradually approaches the equilibrium ice jam phase, as shown in Figure 15 (In the figure, Li is the length of a scour hole, and hi is the depth of a scour hole at the pier, respectively).
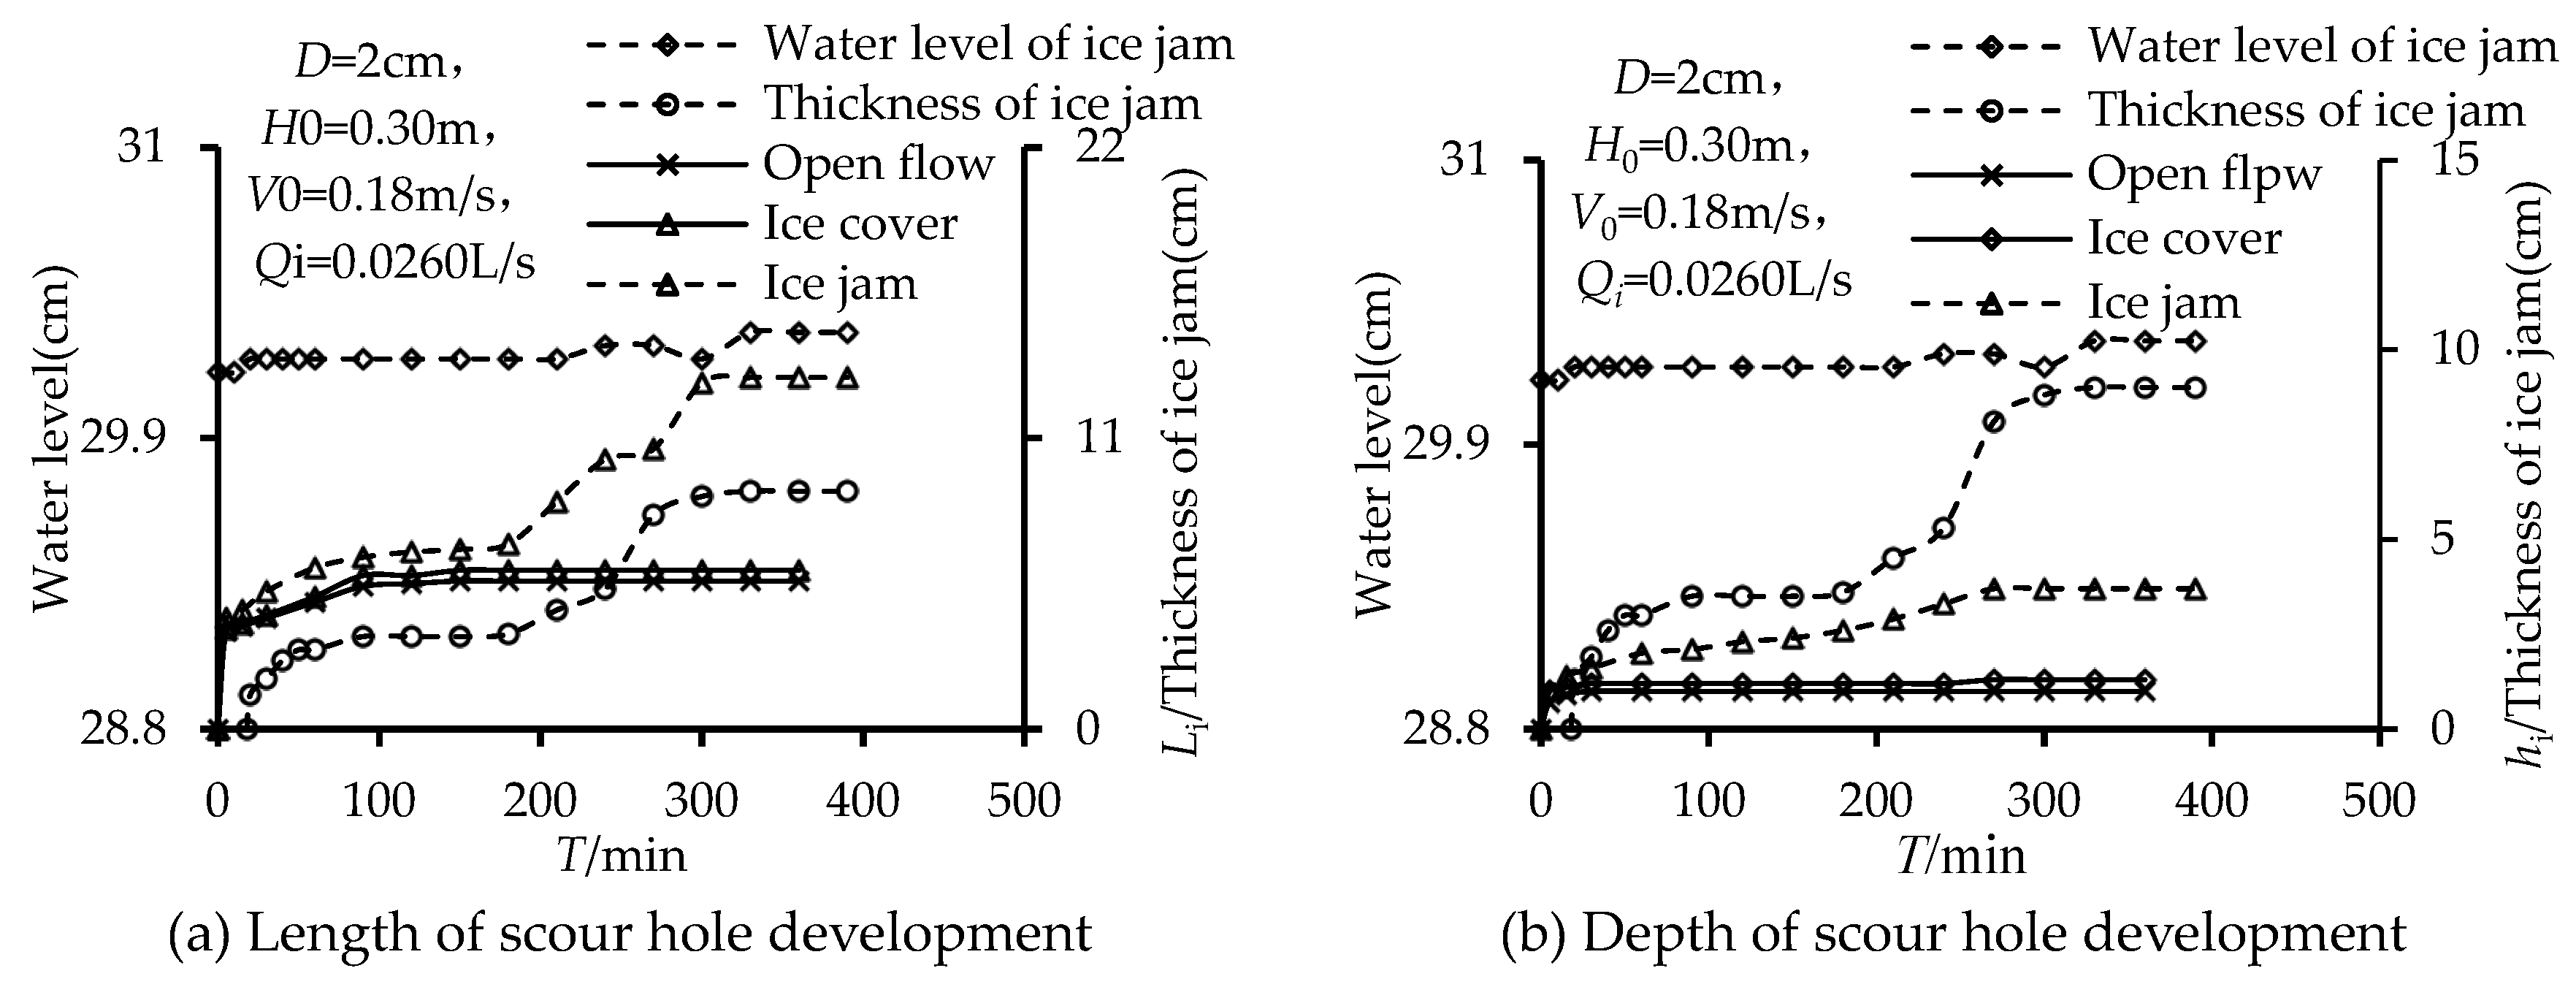
- When the formation of an initial ice jam is dominated by a hydraulic thickening process (ice floes and frazil ice particles are entrained by flowing water and submerged at the front of the ice cover and accumulate under the ice cover) [40], with fewer ice particles entrained and accumulating under an ice cover/initial ice jam, the thickness of the initial ice jam is much smaller and grows more slowly compared to that dominated by a mechanical thickening process. Thus, the water depth under the ice jam changes less. The depth of the scour hole around a pier develops similarly to that under an ice-covered flow condition, and the depth of the scour hole around a pier increases slowly. During the thickening process of the ice jam (dominated by a hydraulic thickening process) along the channel, the bottom of the ice jam appears as a wave-shaped accumulation. It is noticed that when the crest of such a wave migrates from upstream to the cross section of the pier, the flow depth under the ice jam decreases, and the flow velocity increases. Under such a circumstance (migration of a wave of ice accumulation), the scouring process at the pier becomes intense. Gradually, the development of the ice jam approaches an equilibrium condition, and the scouring process around the pier slows down, as shown in Figure 16.
4. Empirical Relationship between Scour Depth and Ice Jam Thickness
Wang et al. (2021) performed experiments to study the local scour at a pier under an ice-jammed flow condition [3]. In their study, the relationship between the equilibrium thickness of ice jams (Ti) and the maximum scour depth of scour holes at the pier (hs) was derived as follows,
The dependence of the ratio of the maximum scour depth of scour holes to the flow depth (H) on the flow Froude number (Fr = V/(gH)0.5) can be expressed as the following:
where V = average flow velocity and g = gravitational acceleration.
In the above study [3], the impacts of both pier size and particle size of bed material on the maximum depth of scour holes at piers under an ice-jammed flow condition were not explored. The effect of the ice discharge rate on the maximum depth of scour holes at piers under an ice-jammed flow condition was not investigated. In addition, the shape of the piers was not considered.
Namaee and Sui [33,34,35,36,37] carried out experiments in a large outdoor flume to study local scour around two side-by-side piers under ice-covered flow conditions by using three nonuniform sands. Considering factors influencing the depth of scour holes around the side-by-side piers, such as flow Froude number, ice cover bottom roughness, bed roughness, pier diameter, and pier spacing, the following equation for describing the maximum scour depth of scour holes was obtained:
where ymax = maximum scour depth, D50 = median particle diameter, y0 = approach flow depth, G = bridge spacing distance, D = pier diameter, ni = ice cover roughness, and nb = channel bed roughness.
In the above study [30], two types of model ice covers with different roughness coefficients were used. The evolution of an ice jam on the local scour process around piers was not studied.
Overall, the maximum depth of scour holes (hs) in the vicinity of the pier under an ice jam depends on the flow intensity, pier size (D), particle size of the sand bed (db), ice particle size (di), thickness of an ice jam (Ti), ice discharge rate (Qi), roughness of the channel bed (nb), and ice cover (ni), respectively. The maximum depth of a scour hole (hs) can be expressed as the following relation:
From the dimensional analysis, the relative maximum depth of a scour hole (hs/H) can be presented as follows,
The dimensionless variable Froude number of the approaching flow is very important. In the current study, only one sand was used for bed material. For the model ice particle, only one size of model ice was used. Thus, only the dominant parameters affecting the maximum scouring depth around a pier under an ice jam were considered for developing an empirical relationship to describe the dependency of the maximum scour depth on the ice jam thickness, flow Froude number, and ice discharge rate. The ratio ni/nb was not considered in this study, assuming both ni and nb did not change much. In the present study, the pier coefficient was also considered since different pier shapes were used. Based on data collected from experiments, a regression analysis of the relative maximum scour depth (hS/H) against other dimensionless variables including the relative ice jam thickness (Ti/H), flow Froude number (Fr), grain size of bed material (d50/D), pier shape factor(Kζ), and ice discharge rate (Qi/Q) was performed. The following equation for calculating the maximum depth of a scour hole at a pier under an ice jam was derived:
where g = gravitational acceleration, Q = flow discharge, H = approaching flow depth, V = average approaching velocity, d50 = Grain size of sand bed, D = pier size, and Kζ = pier shape factor.
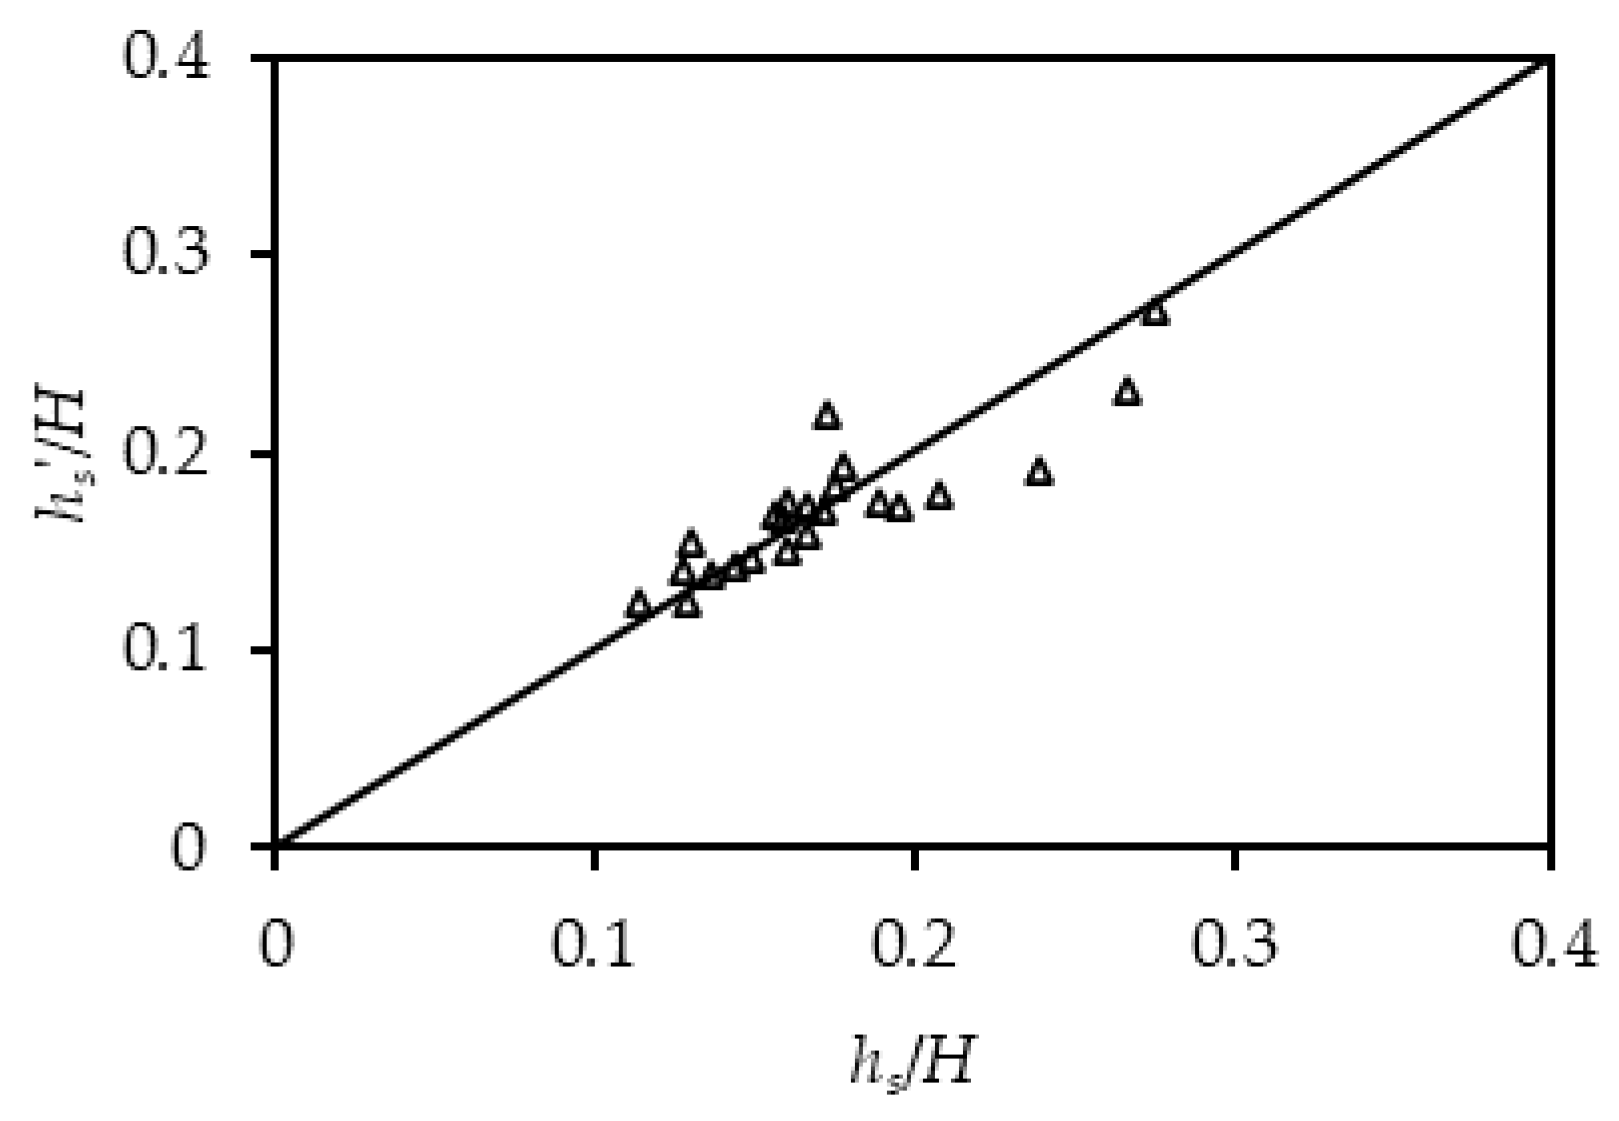
Equation (3) implies that the relative maximum scour depth (hS/H) of scour holes around the pier primarily depends on the relative ice jam thickness (Ti/H), Froude number (Fr = V/(gH)0.5) of the approaching flow, and ice discharge rate (Qi/Q). One can see from Equation (3) that the thicker the ice jam accumulation, the deeper the scour hole around the pier. The depth of a scour hole also increases with the flow Froude number. Interestingly, a larger ice discharge rate (Qi/Q) also results in a deeper scour hole. This is because a larger ice discharge rate (Qi/Q) leads to a thicker ice jam. On the other hand, the finer the bed material (d50/D), the larger and the deeper the scour hole around the pier. For a bridge pier whose cross section has a rectangular shape, the pier shape factor is more than that of a cylindrical shape. Thus, the maximum scour depth around the rectangular-shaped pier is more than that around a cylindrical pier. As shown in Figure 17, the results of the calculation using Equation (3) agree well with those of the laboratory measurements. The hs’ in Figure 17 is the calculated maximum depth of a scour hole.
5. Conclusions
In the present study, experiments in a flume were carried out to study the influence of the evolution of ice jams on the local scour around bridge piers. The following results were obtained:
- During the formation of the initial ice jam around the piers with the local scour process, compared to the absence of the local scour around the pier, the depth of the water under the initial ice jam is greater with the local scour, implying that the flow under the initial ice jam has less capacity for transporting ice particles. Thus, during the thickening stage of an ice jam, more ice particles accumulate under the initial ice jam, and the thickness of the equilibrium ice jam is greater.
- Compared to the results without a local scour, with the presence of a local scour around the pier, it needs more time for an ice jam to achieve an equilibrium condition; the upstream water level and jam thickness are clearly higher, and the rate of increase in the water level of equilibrium ice jams in upstream and pier sections is larger. In addition, the flow depth under an equilibrium ice jam with the scour case is smaller than that without a pier scour, implying that the presence of a local scour consumes part of the flow energy and is not conducive to transport ice particles.
- Compared to the development of scour holes without the presence of an ice cover, the formation of scour holes under an ice jam can be classified into the following two different categories based on the thickening process of the ice jam: (a) When the development of an ice jam is dominated by a mechanical thickening process, as the ice jam develops upstream, the thickness of an ice jam increases. When the initial ice jam reaches the pier, the flow depth under the ice jam decreases. The development of a scour hole is accelerated. Experiments showed that the development of a scour hole under an ice-jammed flow condition is faster before an ice jam reaches an equilibrium state. (b) When the development of an initial ice jam is dominated by a hydraulic thickening process, during the thickening stage of an ice jam, when the ice wave crest reaches the pier, the thickness of an ice jam increases rapidly, and thus, the flow depth under the ice jam decreases and leads to a rapid development of the scour hole at the pier.
- Regardless of whether a local scour appears or not, the Ti/h is negatively correlated with Fr. An increase in Fr results in an increase in the ice transport capacity. Therefore, more ice particles are transported downstream, and the ice jam thickness is relatively small. However, with the same flow Froude number Fr, the Ti/h value is larger in the presence of a local scour. The ice jam thickness near the piers increases, which leads to an upstream water level increase, and the ice transport capacity is weakened. Thus, the ice jam thickness in the upstream section of the pier increases
- An equation for calculating the maximum depth of a scour hole around the pier under an ice-jammed flow condition is obtained. The results show that with the increase in the flow Froude number (Fr), ice flow (Qi), and pier shape coefficient (Kζ), the maximum depth of scour holes around the pier increases. The maximum depth of a scour hole under an ice-jammed flow condition increases with the decrease in the particle size of the sand bed. The calculation results using the proposed equation agree well with those of the measurements in the laboratory.
- This paper mainly focuses on the interaction between local scour at a single pier and ice jam evolution under the flow condition whereby the leading edge of an initial ice jam can reach the upstream of the piers. The mechanical impact of ice particles on the pier and the interaction between piers (pier superstructure) and ice jams under extreme conditions were not investigated. The influence of different angles between the direction of the flow and the bridge pier on local scour at the pier was not assessed. In the event that the leading edge of an ice jam cannot reach the pier section, the local scour around the pier should be further studied.
Author Contributions
H.H.: Laboratory works, data curation, formal analysis, methodology, and writing—original draft preparation; J.W.: Conceptualization, laboratory supervision, methodology, funding acquisition, writing—original draft preparation; T.C.: Laboratory works, data curation, investigation; Z.H.: Laboratory works, data curation, investigation; J.S.: Conceptualization, formal analysis, methodology, writing—review and editing. All authors have read and agreed to the published version of the manuscript.
Funding
This research was supported by the National Natural Science Foundation of China (grant nos. 51879065). The authors are grateful for the financial support.
Institutional Review Board Statement
Not applicable.
Informed Consent Statement
Not applicable.
Data Availability Statement
The data are available in the case that it is required.
Conflicts of Interest
The authors declare no conflict of interest.
References
- Sui, J.; Wang, J.; He, Y.; Krol, F. Velocity profiles and incipient motion of frazil particles under ice cover. Int. J. Sediment Res. 2010, 25, 39–51. [Google Scholar] [CrossRef]
- Wang, J.; Wang, T.; Li, S.; Chen, P. Impacts of bridge pier on ice jam initiation and ice thickness in a curved channel—An experimental study. J. Hydraul. Eng. 2017, 48, 588–593. [Google Scholar]
- Wang, J.; Hou, Z.; Sun, H.; Fang, B.; Sui, J.; Karney, B. Local scour around a bridge pier under ice-jammed flow condition—An experimental study. J. Hydrol. Hydromech. 2021, 69, 275–287. [Google Scholar] [CrossRef]
- Wang, J.; Hua, J.; Chen, P.; Sui, J.; Wu, P.; Whitcombe, T. Initiation of ice jam in front of bridge piers—An experimental study. J. Hydrodyn. 2019, 31, 117–123. [Google Scholar] [CrossRef]
- Wang, J.; Chen, P.; Qang, Q. lmpact of bridge piers on ice jam stage variation: An experimental study. Adv. Water Sci. 2015, 26, 867–873. [Google Scholar]
- Urroz, G.E.; Schaefer, J.; Ettema, R. Bridge-pier location and ice conveyance in curved channels. J. Cold Reg. Eng. 1994, 8, 66–72. [Google Scholar] [CrossRef]
- Wang, J.; Huang, N.; Wu, Y.; Cheng, T. Impacts of bridge-pier types on balancing ice jams: An experimental study. Adv. Water Sci. 2018, 29, 568–573. [Google Scholar]
- Wang, J.; Hua, J.; Sui, J.; Wu, P.; Liu, T.; Chen, P. The impact of bridge pier on ice jam evolution an experimental study. J. Hydrol. Hydromech. 2016, 64, 75–82. [Google Scholar] [CrossRef] [Green Version]
- Cheng, T.; Wang, J.; Chen, P.; Sui, J. Simulation of ice accumulation around bridge piers during river breakup periods using a discrete element model. J. Hydrodyn. 2022, 34, 94–105. [Google Scholar] [CrossRef]
- Yang, W.C.; Shekhar, K.; Arduino, P.; Mackenzie-Helnweinb, P.; Millerb, G. Modeling tsunami induced debris impacts on bridge structures using the material point method. Procedia Eng. 2017, 175, 175–181. [Google Scholar] [CrossRef]
- Istrati, D.; Hasanpour, A.; Buckle, I. Numerical Investigation of Tsunami-Borne Debris Damming Loads on a Coastal Bridge. In Proceedings of the 17 World Conference on Earthquake Engineering, Sendai, Japan, 27 September–2 October 2020; p. 27. [Google Scholar]
- Salciarini, D.; Tamagnini, C.; Conversini, P. Discrete element modeling of debris-avalanche impact on earthfill barriers. Phys. Chem. Earth Parts A/B/C 2010, 35, 172–181. [Google Scholar] [CrossRef]
- Hasanpour, A.; Istrati, D.; Buckle, I. Coupled SPH–FEM Modeling of Tsunami-Borne Large Debris Flow and Impact on Coastal Structures. J. Mar. Sci. Eng. 2021, 9, 1068. [Google Scholar] [CrossRef]
- Parola, A.C.; Apelt, C.J.; Jempson, M.A. Debris Forces on Highway Bridges; No. 445; Transportation Research Board: Washington, DC, USA, 2000. [Google Scholar]
- Malavasi, S.; Riva, M.; Vanali, M.; Larcan, E. Hydrodynamic forces on a submerged bridge. WIT Trans. Built Environ. 2001, 56. [Google Scholar] [CrossRef]
- Pandey, M.; Oliveto, G.; Pu, J.H.; Sharma, P.K.; Ojha, C.S.P. Pier scour prediction in non-uniform gravel beds. Water 2020, 12, 1696. [Google Scholar] [CrossRef]
- Memar, S.; Zounemat-Kermani, M.; Beheshti, A.; Rahimpour, M.; Cesare, G.D.; Schleiss, A.J. Influence of collars on reduction in scour depth at two piers in a tandem configuration. Acta Geophys. 2020, 68, 229–242. [Google Scholar] [CrossRef]
- Zhao, J.; Zhang, Y.; Li, M. Experimental study of piers scour in complex boundary condition. J. Sediment Res. 2013, 1, 14–19. [Google Scholar]
- Nyantekyi-Kwakye, B.; Essel, E.E.; Dow, K.; Clark, S.P.; Tachie, M.F. Hydraulic and turbulent flow characteristics beneath a simulated partial ice-cover. J. Hydraul. Res. 2021, 59, 392–403. [Google Scholar] [CrossRef]
- Beltaos, S.; Burrell, B.C. Effects of River-Ice Breakup on Sediment Transport and Implications to Stream Environments: A Review. Water 2021, 13, 2541. [Google Scholar] [CrossRef]
- Biron, P.M.; Buffin-Bélanger, T.; Martel, N. Three-dimensional turbulent structures at a medium-sized confluence with and without an ice cover. Earth Surf. Process. Landf. 2019, 44, 3042–3056. [Google Scholar] [CrossRef]
- Fu, H.; Guo, X.; Kashani, A.H. Experimental study of real ice accumulation on channel hydraulics upstream of inverted siphons. Cold Reg. Sci. Technol. 2020, 176, 103087. [Google Scholar] [CrossRef]
- Batuca, D.; Dargahi, B. Some experimental results on local scour around cylindrical piers for open and covered flow. In Third International Symposium on River Sedimentation; University of Mississippi: University, MS, USA, 1986; pp. 1095–1104. [Google Scholar]
- Ackermann, N.L.; Shen, H.; Olsson, P. Local Scour Around Circular Piers Under Ice Covers. In Proceedings of the Ice in the Environment: 16th IAHR International Symposium on Ice, Dunedin, New Zealand, 2–6 December 2002; pp. 149–155. [Google Scholar]
- Hains, D.; Zabilansky, L. Laboratory Test of Scour under Ice: Data and Preliminary Results; U.S. Army Engineer Research and Development Center, Cold Regions Research and Engineering Laboratory: Hanover, NH, USA, 2004; p. 182. [Google Scholar]
- Hains, D.; Zabilansky, L. The Effects of river ice on scour and sediment transport. In Proceedings of the CRIPE 13th Workshop on the Hydraulics of Ice Covered Rivers, Hanover, NH, USA, 15–16 September 2005; pp. 102–107. [Google Scholar]
- Munteanu, A. Scouring around a Cylindrical Bridge Pier under Partially Ice-Covered Flow Condition; University of Ottawa: Ottawa, ON, Canada, 2004. [Google Scholar]
- Valela, C.; Sirianni, D.A.; Nistor, I.; Rennie, C.D.; Almansour, H. Bridge pier scour under ice cover. Water 2021, 13, 536. [Google Scholar] [CrossRef]
- Wu, P.; Balachandar, R.; Sui, J. Local Scour around Bridge Piers under Ice-Covered Conditions. J. Hydraul. Eng. 2016, 142, 04015038. [Google Scholar] [CrossRef]
- Wu, P.; Hirshfield, F.; Sui, J. Further studies of incipient motion and shear stress on local scour around bridge abutment under ice cover. Can. J. Civ. Eng. 2014, 41, 892–899. [Google Scholar] [CrossRef]
- Wu, P.; Hirshfield, F.; Sui, J. Armour Layer Analysis of Local Scour around Bridge Abutments Under Ice Cover. River Res. Appl. 2015, 31, 736–746. [Google Scholar] [CrossRef]
- Wang, J.; Li, Z.; Cheng, T.; Sui, J. Time-dependent local scour around bridge piers under ice cover-an experimental study. Chin. J. Hydraul. Eng. 2021, 52, 1174–1182. [Google Scholar]
- Namaee, M.R.; Sui, J. Impact of armour layer on the depth of scour hole around side-by-side bridge piers under ice-covered flow condition. J. Hydrol. Hydromech. 2019, 67, 240–251. [Google Scholar] [CrossRef] [Green Version]
- Namaee, M.R.; Sui, J. Effects of ice cover on the incipient motion of bed material and shear stress around side-by-side bridge piers. Cold Reg. Sci. Technol. 2019, 165, 102811. [Google Scholar] [CrossRef]
- Namaee, M.R.; Sui, J. Local scour around two side-by-side cylindrical bridge piers under ice-covered conditions. Int. J. Sediment Res. 2019, 34, 355–367. [Google Scholar] [CrossRef]
- Namaee, M.R.; Sui, J. Velocity profiles and turbulence intensities around side-by-side bridge piers under ice-covered flow condition. J. Hydrol. Hydromech. 2020, 68, 70–82. [Google Scholar] [CrossRef] [Green Version]
- Namaee, M.R.; Sui, J.; Wu, Y.; Linklater, N. Three-dimensional numerical simulation of local scour around circular side-by-side bridge piers with ice cover. Can. J. Civ. Eng. 2021, 48, 1335–1353. [Google Scholar] [CrossRef]
- CCCC High-Way Consultants Co, Ltd. General Code for Design of Highway Bridges and Culverts: JTG D60—2015[S]; China Communications Press: Beijing, China, 2015. [Google Scholar]
- Sui, J.; Karney, B.; Fang, D. Variation in water level under ice-jammed condition–Field investigation and experimental study. Hydrol. Res. 2005, 36, 65–84. [Google Scholar] [CrossRef]
- Ashton, G.D. River and Lake Ice Engineering; Water Resources Publication: Alexandria, VA, USA, 1986. [Google Scholar]
Figure 1.
(a,b) Flume layout for experiment; (c) polyethylene particles; (d) cross section of model piers.
Figure 1.
(a,b) Flume layout for experiment; (c) polyethylene particles; (d) cross section of model piers.

Figure 2.
Scour hole at the pier under an ice jam and associated variables. ((a): scour hole with point measurement; (b,c): points for measuring ice jam thickness).
Figure 2.
Scour hole at the pier under an ice jam and associated variables. ((a): scour hole with point measurement; (b,c): points for measuring ice jam thickness).

Figure 3.
Development of an ice jam at different stages.

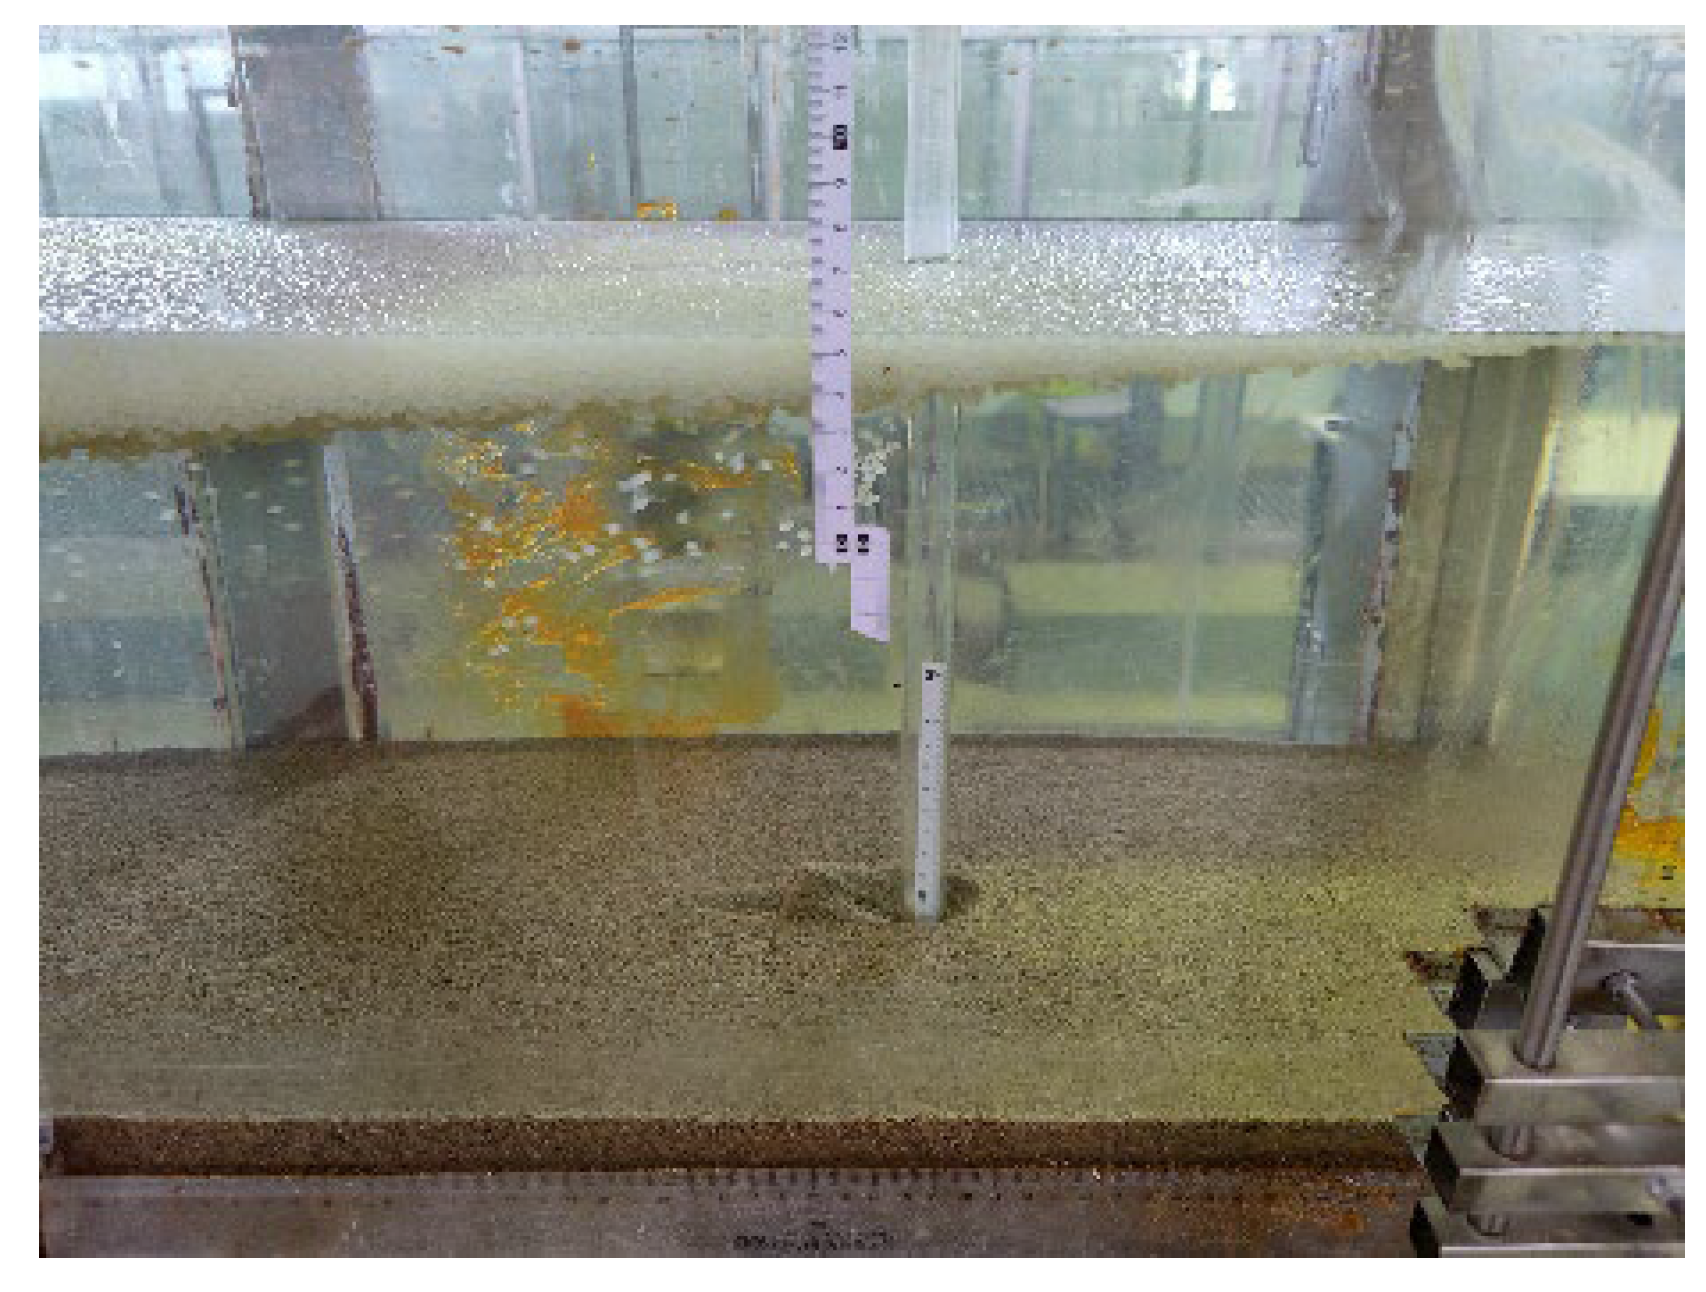
Figure 4.
Local scour hole around a pier.

Figure 5.
Velocity distributions with and without a pier scour for 3 cases: before the head of an initial ice jam reaching the pier (a,b); the head of an initial ice jam reaching the pier (c,d); after the head of an initial ice jam passing the pier (e,f).
Figure 5.
Velocity distributions with and without a pier scour for 3 cases: before the head of an initial ice jam reaching the pier (a,b); the head of an initial ice jam reaching the pier (c,d); after the head of an initial ice jam passing the pier (e,f).

Figure 6.
Pier scour for 3 cases: before the head of an initial ice jam reaching the pier (a); the head of an initial ice jam reaching the pier (b); after the head of an initial ice jam passing the pier (c).
Figure 6.
Pier scour for 3 cases: before the head of an initial ice jam reaching the pier (a); the head of an initial ice jam reaching the pier (b); after the head of an initial ice jam passing the pier (c).

Figure 7.
Comparison of water levels in the upstream cross section when the initial ice jam passes the pier (CS-16) with a local scour and those without a local scour. ((a): H0 = 0.25 m, V0 = 0.17 m/s; (b): H0 = 0.25 m, V0 = 0.15 m/s; (c): H0 = 0.20 m, V0 = 0.17 m/s; (d): H0 = 0.20 m, V0 = 0.15 m/s).

Figure 8.
Comparison of water depth under an equilibrium ice jam with a local scour around the pier to those without a local scour. ((a): H0 = 0.25 m, V0 = 0.17 m/s and H0 = 0.20 m, V0 = 0.17 m/s; (b): H0 = 0.25 m, V0 = 0.15 m/s and H0 = 0.20 m, V0 = 0.15 m/s).
Figure 8.
Comparison of water depth under an equilibrium ice jam with a local scour around the pier to those without a local scour. ((a): H0 = 0.25 m, V0 = 0.17 m/s and H0 = 0.20 m, V0 = 0.17 m/s; (b): H0 = 0.25 m, V0 = 0.15 m/s and H0 = 0.20 m, V0 = 0.15 m/s).

Figure 9.
Comparison of water levels during an equilibrium ice jam with a local scour around the pier to those without a local scour. The numbers in Figure 9 show that when the water level for an equilibrium ice jam without the presence of a local scour is used as the benchmark value, the rate of increase in water level for an equilibrium ice jam with the presence of a local scour condition is in %. ((a): H0 = 0.25 m, V0 = 0.17 m/s; (b): H0 = 0.25 m, V0 = 0.15 m/s; (c): H0 = 0.20 m, V0 = 0.17 m/s; (d): H0 = 0.20 m, V0 = 0.15 m/s).

Figure 10.
Comparison of the thickness of an equilibrium ice jam with the presence of a local scour at the pier to that without a local scour. ((a): H0 = 0.25 m, V0 = 0.17 m/s; (b): H0 = 0.25 m, V0 = 0.15 m/s; (c): H0 = 0.20 m, V0 = 0.17 m/s; (d): H0 = 0.20 m, V0 = 0.15 m/s).
Figure 10.
Comparison of the thickness of an equilibrium ice jam with the presence of a local scour at the pier to that without a local scour. ((a): H0 = 0.25 m, V0 = 0.17 m/s; (b): H0 = 0.25 m, V0 = 0.15 m/s; (c): H0 = 0.20 m, V0 = 0.17 m/s; (d): H0 = 0.20 m, V0 = 0.15 m/s).

Figure 11.
Relationship between Ti/h and Fr with and without a local scour.

Figure 12.
Transportation of ice particles.

Figure 13.
Relationship between Ti/h and Fr with the presence of a local scour.

Figure 14.
The ratio Ti/h at different cross sections with and without a local scour with the same Fr.
Figure 14.
The ratio Ti/h at different cross sections with and without a local scour with the same Fr.

Figure 15.
Comparison of the development of a scour hole around a pier under open flow, ice cover and ice jam conditions in Case 1.
Figure 15.
Comparison of the development of a scour hole around a pier under open flow, ice cover and ice jam conditions in Case 1.

Figure 16.
Comparison of the development of a scour hole around a pier under open flow, ice cover and ice jam conditions in Case 2.
Figure 16.
Comparison of the development of a scour hole around a pier under open flow, ice cover and ice jam conditions in Case 2.

Figure 17.
Comparison of the ratio of calculated maximum scour depths to H to those of the measurements.
Figure 17.
Comparison of the ratio of calculated maximum scour depths to H to those of the measurements.


Table 1.
Summary of all experimental runs.
| Number | Average Approaching Velocity V0 (m/s) | Approaching Flow Depth H0 (m) | Ice Flow Rate Qi (L/s) | Grain Size of Sand Bed d50 (mm) | With or Without Local Scour | Bridge Pier Shape |
|---|---|---|---|---|---|---|
| A1 | 0.17 | 0.25 | 0.0205 | 0.713 | With | cylindrical |
| A2 | 0.15 | 0.25 | 0.0205 | 0.713 | With | cylindrical |
| A3 | 0.17 | 0.20 | 0.0205 | 0.713 | With | cylindrical |
| A4 | 0.15 | 0.20 | 0.0205 | 0.713 | With | cylindrical |
| A5 | 0.16 | 0.20 | 0.0205 | 0.713 | With | round end-shaped |
| A6 | 0.18 | 0.25 | 0.0205 | 0.713 | With | round end-shaped |
| A7 | 0.17 | 0.20 | 0.0205 | 0.713 | With | round end-shaped |
| A8 | 0.15 | 0.15 | 0.0205 | 0.713 | With | round end-shaped |
| A9 | 0.17 | 0.25 | 0.0205 | 0.713 | With | rectangle |
| A10 | 0.15 | 0.25 | 0.0205 | 0.713 | With | rectangle |
| A11 | 0.15 | 0.20 | 0.0205 | 0.713 | With | rectangle |
| A12 | 0.15 | 0.15 | 0.0205 | 0.713 | With | rectangle |
| A13 | 0.17 | 0.25 | 0.0205 | 0.490 | With | cylindrical |
| A14 | 0.15 | 0.20 | 0.0205 | 0.490 | With | cylindrical |
| A15 | 0.17 | 0.25 | 0.0205 | 1.040 | With | cylindrical |
| A16 | 0.15 | 0.20 | 0.0205 | 1.040 | With | cylindrical |
| B1 | 0.17 | 0.25 | 0.0205 | - | Without | cylindrical |
| B2 | 0.15 | 0.25 | 0.0205 | - | Without | cylindrical |
| B3 | 0.17 | 0.20 | 0.0205 | - | Without | cylindrical |
| B4 | 0.15 | 0.20 | 0.0205 | - | Without | cylindrical |
Table 2.
The pier shape factors corresponding to different pier shape.
| Pier Shape | Pier Shape Factor Kζ (The Oblique Angle with Water Flow is 0°) |
|---|---|
| cylindrical | 1 |
| rectangle | 1.2 |
| round end-shaped | 0.98 |
Table 3.
The time required to complete the development of an initial ice jam phase with and without local scour conditions.
Table 3.
The time required to complete the development of an initial ice jam phase with and without local scour conditions.
| Bridge Pier Shape | V0 (m/s) | H0 (m) | Qi (L/s) | Time Required to Complete the Initial Ice Jam Phase (min) | ||
|---|---|---|---|---|---|---|
| With Local Scour | Without Local Scour | With Local Scour | Without Local Scour | |||
| cylindrical | 0.17 | 0.25 | 0.0205 | 0.0205 | 138 | 195 |
| cylindrical | 0.15 | 0.25 | 0.0205 | 0.0205 | 80 | 107 |
| cylindrical | 0.17 | 0.20 | 0.0205 | 0.0205 | 269 | 300 |
| cylindrical | 0.15 | 0.20 | 0.0205 | 0.0205 | 100 | 118 |
| round end-shaped | 0.17 | 0.20 | 0.0205 | 0.0224 | 93 | 129 |
| round end-shaped | 0.16 | 0.20 | 0.0205 | 0.0212 | 87 | 175 |
Table 4.
Comparison of the time required for an ice jam to reach an equilibrium condition with and without a local scour around the pier.
Table 4.
Comparison of the time required for an ice jam to reach an equilibrium condition with and without a local scour around the pier.
| Bridge Pier Shape | V0 (m/s) | H0 (m) | Qi (L/s) | Time Required to Complete the Initial Ice Jam Phase (min) | ||
|---|---|---|---|---|---|---|
| With Local Scour | Without Local Scour | With Local Scour | Without Local Scour | |||
| cylindrical | 0.17 | 0.25 | 0.0205 | 0.0205 | 8.5 | 7.0 |
| cylindrical | 0.15 | 0.25 | 0.0205 | 0.0205 | 9.0 | 8.0 |
| cylindrical | 0.17 | 0.20 | 0.0205 | 0.0205 | 8.0 | 7.0 |
| cylindrical | 0.15 | 0.20 | 0.0205 | 0.0205 | 8.5 | 7.5 |
| round end-shaped | 0.17 | 0.20 | 0.0205 | 0.0224 | 7.5 | 5.5 |
| round end-shaped | 0.16 | 0.20 | 0.0205 | 0.0212 | 8.5 | 6.5 |
Publisher’s Note: MDPI stays neutral with regard to jurisdictional claims in published maps and institutional affiliations. |
© 2022 by the authors. Licensee MDPI, Basel, Switzerland. This article is an open access article distributed under the terms and conditions of the Creative Commons Attribution (CC BY) license (https://creativecommons.org/licenses/by/4.0/).
Share and Cite
MDPI and ACS Style
Hu, H.; Wang, J.; Cheng, T.; Hou, Z.; Sui, J. Channel Bed Deformation and Ice Jam Evolution around Bridge Piers. Water 2022, 14, 1766. https://doi.org/10.3390/w14111766
AMA Style
Hu H, Wang J, Cheng T, Hou Z, Sui J. Channel Bed Deformation and Ice Jam Evolution around Bridge Piers. Water. 2022; 14(11):1766. https://doi.org/10.3390/w14111766
Chicago/Turabian StyleHu, Haotian, Jun Wang, Tiejie Cheng, Zhixing Hou, and Jueyi Sui. 2022. "Channel Bed Deformation and Ice Jam Evolution around Bridge Piers" Water 14, no. 11: 1766. https://doi.org/10.3390/w14111766
Note that from the first issue of 2016, this journal uses article numbers instead of page numbers. See further details here.