Article

An Analysis of the Impact of Groundwater Overdraft on Runoff Generation in the North China Plain with a Hydrological Modeling Framework

1
Guizhou Survey and Design Research Institute for Water Resources and Hydropower, Guiyang 550001, China
2
School of Resources and Geosciences, China University of Mining and Technology, Xuzhou 221008, China
3
State Key Laboratory of Hydrology-Water Resources and Hydraulic Engineering, Nanjing Hydraulic Research Institute, Nanjing 210029, China
4
Research Center for Climate Change, Ministry of Water Resources, Nanjing 210029, China
5
State Key Laboratory of Hydraulics and Mountain River Engineering, College of Water Resource and Hydropower, Sichuan University, Chengdu 610065, China
6
Yangtze Institute for Conservation and Development, Nanjing 210098, China
*
Author to whom correspondence should be addressed.
These authors contributed equally to this work.
Water 2022, 14(11), 1758; https://doi.org/10.3390/w14111758
Submission received: 9 May 2022 / Revised: 26 May 2022 / Accepted: 27 May 2022 / Published: 30 May 2022

Abstract

:
The long-term overexploitation of groundwater has caused sharp decreases in groundwater table depth and water storage in the agricultural areas of the North China Plain, which has led to obvious changes in the runoff process of the hydrological cycle, affecting the mechanism of runoff generation. Evaluating the impact of groundwater overdraft on runoff generation using hydrological models is the focus of the current work. Herein, a hydrological modeling framework is proposed based on the Variable Infiltration Capacity (VIC) model. The optimal parameters of the VIC model were determined by the synergetic calibration method, combining runoff, evaporation, and water storage levels. Meanwhile, a sliding calibration scheme was employed to explore the implied relationships among runoff coefficient, groundwater exploitation, and model parameters, particularly for the thickness of the second soil layer (i.e., parameter d2), both for the whole period and the sliding window periods. Overall, the VIC model showed good applicability in the southern Haihe river plain, as demonstrated by the low absolute value of the relative error (RE) between the simulated and observed data for runoff and evaporation, with all REs < 8%, as well as large correlation coefficients (CC, all > 0.8). In addition, the CCs between the simulated and the observed data for water storage were all above 0.7. The calibrated optimal parameter d2 increased as the sliding window period increased, and the average d2 gradually increased from 0.372 m to 0.415 m, for which we also found high correlations with both the groundwater table and water storage levels. Additionally, increases in the parameter d2 led to decreases in the runoff coefficient. From 2003 to 2016, the parameter d2 increased from 0.36 m to 0.42 m, and the runoff coefficient decreased by about 0.02.

1. Introduction

In recent years, the problem of climate change has remained an important issue of global concern, and a series of associated hydrological changes has received increasing attention from hydrographers [1,2,3,4,5,6]. Plain areas are often regions with dense populations, developed agriculture, and rapid economic and social development, where emerging environmental and hydrological problems caused by those intensive human activities are becoming more and more prominent [7,8,9,10,11,12]. The North China Plain is one of the three major agriculturally developed plains in China, and it is also the main center of grain production in China, with corn and wheat yields that account for more than 45% and 50% of the whole country, respectively [13,14]. However, the North China Plain has long been perturbed by serious groundwater overdrafts due to extensive agricultural irrigation [15]. The overexploitation of groundwater causes sharp declines in groundwater levels, which has significantly changed the original hydrophysical mechanisms [16,17,18]. Consequently, it is critically important to explore the influence of groundwater overdraft on runoff generation and reveal the relevant underlying mechanisms.
Conceptually, a hydrological model refers to a mathematical model for generalizing complex hydrological phenomena and processes using a simulation method [19,20,21,22]; such models contribute to the quantitative evaluation of the impacts of groundwater overdraft on runoff generation. According to the degree of discretization of the descriptions of watershed hydrological processes, models can be divided into three categories: lumped [23,24], distributed [25,26,27,28], and semi-distributed [29]. Of these, distributed hydrological models show advantages over lumped models due to the fact that they take into account spatial variability in processes, inputs, boundary conditions, and catchment characteristics [30]. Specifically, the Variable Infiltration Capacity (VIC) model has been widely applied for numerous hydrological simulations and predictions, playing a critically important role in studying the impacts of climate change on hydrological processes [31,32,33,34]. More importantly, the influence of soil inhomogeneity on runoff yield is described in the VIC model using the soil infiltration capacity parameters for each grid [35], which facilitates the accurate simulation of changes in groundwater storage; furthermore, it allows researchers to quantitatively analyze the impacts on runoff generation.
In general, hydrological models often use the observed runoff series of the outlet section to verify the reliability of the model [28,34]. However, for plain areas with groundwater overexploitation, the changes in runoff production and model parameters have always been a scientifically difficult problem for hydrology scholars [36,37,38]. On the one hand, plenty of previous studies on hydrological model optimization have focused on traditional hydrological simulations in hilly areas, with little attention paid to plain areas. Hydrological modeling in plain areas is more difficult than in hilly areas because there is no unified river basin outlet for calibration using observed runoff data [34]. On the other hand, traditional hydrological modeling only considered runoff at the outlet of the basin section [28,31,34], neglecting the influences of intense groundwater overexploitation on runoff generation. There are several hydrological processes highly related to groundwater overexploitation, especially concerning water storage, that can assist in synergistically calibrating hydrological models. Moreover, precipitation is also consumed for most evapotranspiration during runoff generating processes, which further influences the dynamic process of water storage according to the water balance principle; thus, the two hydrological elements, i.e., water storage and evaporation, could be employed in hydrological models for synergetic calibration. Therefore, constructing a hydrological modeling framework appropriate for runoff simulation in plain areas is crucial for further quantitative evaluation of the influences of groundwater overdraft on runoff yield, and the core of the framework is a combination of the intermediate variables of water storage and evaporation.
However, water storage is difficult to assess by ground observations, and ground-observed evaporation usually has low spatial resolution, which inhibits its further application in hydrological models over large areas. With the continuous development of remote sensing technology, satellite/reanalysis datasets concerning global evapotranspiration and terrestrial water storage provide new technical possibilities for hydrological modeling [39,40,41,42,43,44]. The observed evaporation data provided by the Global Land Evaporation Amsterdam Model (GLEAM) have demonstrated good performance in numerous cases, as demonstrated by high consistency with the flux observation tower [45]. As for the water storage data monitored by the Gravity Recovery and Climate Experiment (GRACE) satellite, they have been successfully applied to hydrological model calibration, providing a new avenue for regional groundwater storage estimation [46]. The GRACE water storage data can also be employed for data assimilation of hydrological models to reduce the uncertainty of hydrological models and improve the reliability of the simulations [47]. As mentioned above, the introduction of the GLEAM evaporation and GRACE water storage data to hydrological models enables the evaluation of multiple hydrological elements and can also effectively reduce the large margin of error that may result from selecting the optimal parameters of a model based only on a single hydrological element; reducing such errors improves the integrity of hydrological simulations [48].
One of our study’s main goals is to quantitatively evaluate the impacts of groundwater overdraft on runoff generation using a hydrological model for plain areas with intense agricultural irrigation. Another aspect our study aims to explore is the applicability of a synergetic calibration and validation method for simulating runoff processes based on the GRACE water storage and GLEAM evaporation datasets.
To this end, a hydrological modeling framework is proposed based on the VIC model using the synergetic calibration and validation of three hydrological elements, as well as sliding calibration for the most sensitive parameters of the runoff generation model. The runoff, evaporation, and water storage parameters were combined to synergistically calibrate the VIC model, and the applicability of the VIC model was analyzed in the southern Haihe river plain area. The relationships among the runoff coefficient, groundwater exploitation, and model parameters were further explored, and based on that analysis, a quantitative estimation of the effect of groundwater overdraft on the runoff coefficient was carried out. This research may provide scientific guidance in climate change studies, especially for distinguishing and quantifying the contributions of human activities (e.g., intense groundwater exploitation) to river streamflow changes; it may also contribute to agricultural water management in certain plain river basins.

2. Data and Methodology
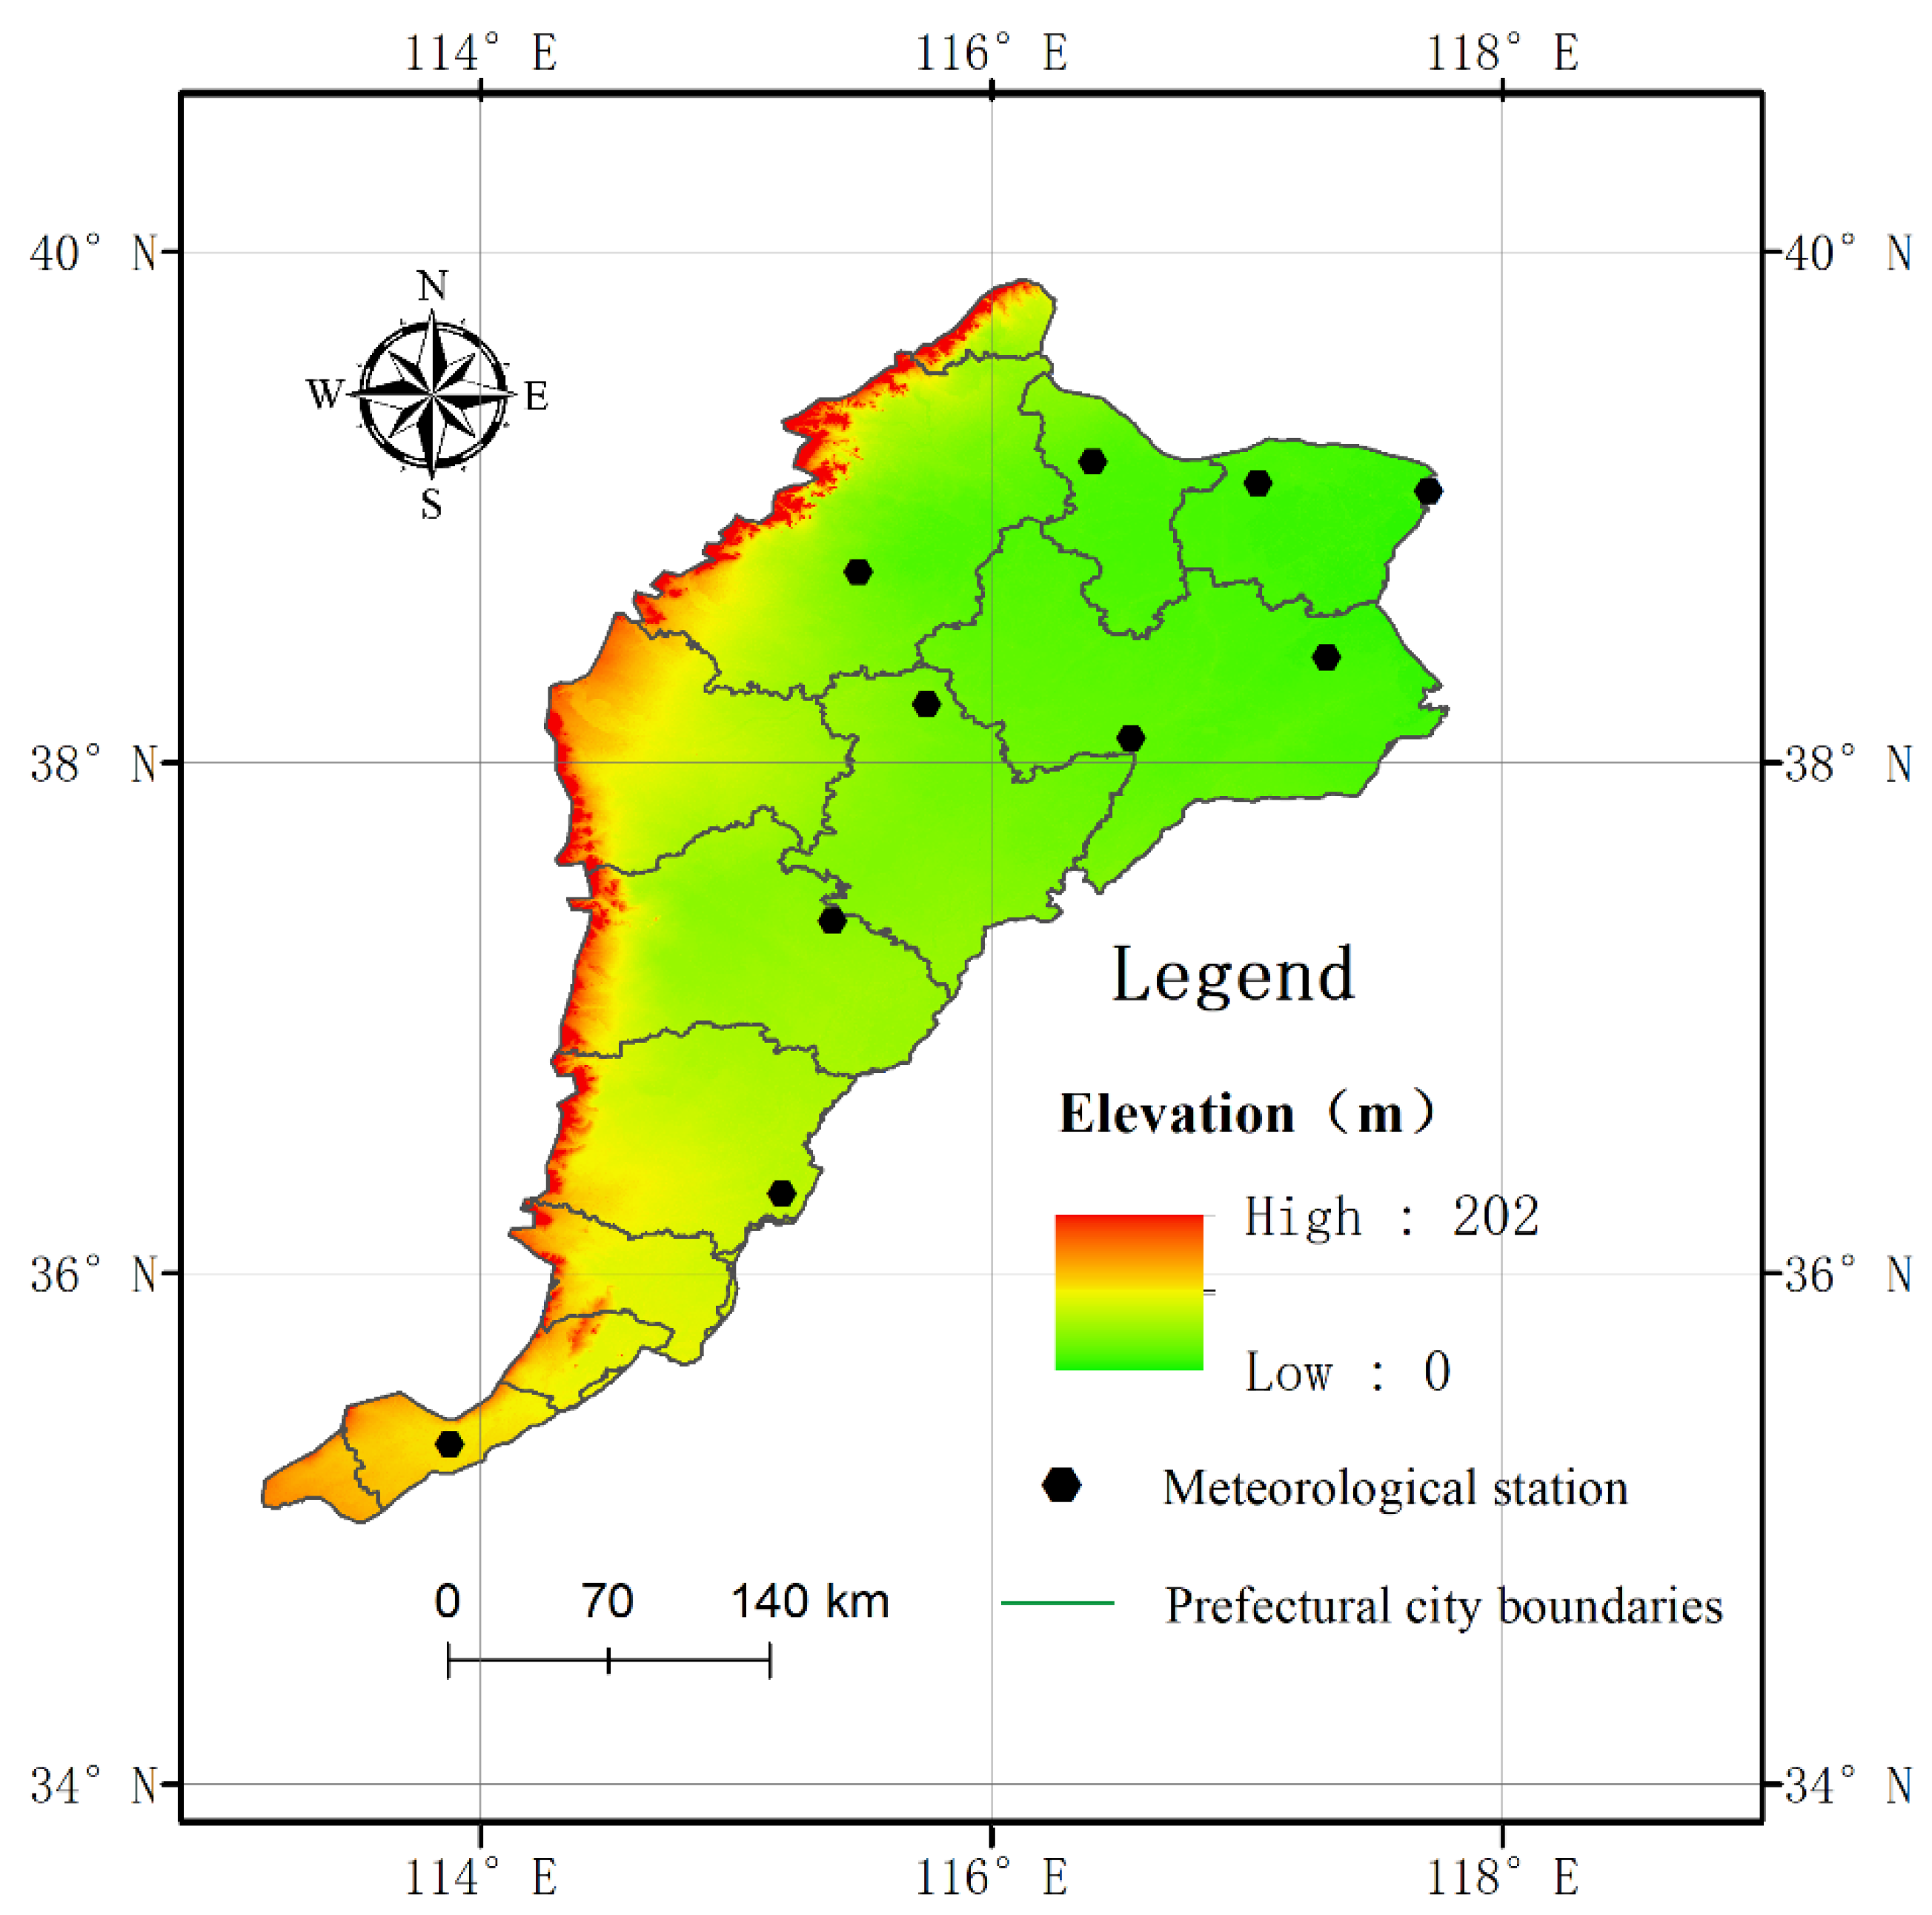
2.1. Study Area

The southern Haihe plain is located in the plain area of the central Haihe river basin in China, with a total area of about 61,000 km2. As shown in Figure 1, the coverage area includes the Taihang Piedmont economic belt centered around the cities of Shijiazhuang, Handan, Xingtai, and Baoding. In addition, the cities of Hengshui and Cangzhou are in the central plain area and the eastern marine plain area, respectively. The main crops in the study area are wheat and corn. The average annual precipitation is about 520 mm. In terms of climate conditions, the whole region has a warm temperate humid or semi-humid climate, which is dry and cold in winter, with high temperatures and heavy rain in the summer but less rain and high levels of evaporation in the spring. For this reason, these areas experience heavy droughts in the spring, and floods often occur in the summer.
The groundwater level has been greatly reduced in these areas due to serious overexploitation, which has even caused dehydration and dry cracks. Since the discovery of ground fissures in Handan city, Hebei Province, in the 1960s, more than 200 ground fissures have been found in the southern plain area of the Haihe river; they are mainly distributed in Tianjin, Tangshan, Baoding, Langfang, etc., with a scale often ranging from several meters to 500 m, with a maximum length of thousands of meters [49,50]. Moreover, the overexploitation of groundwater has also caused numerous ecological and environmental problems, e.g., the formation of underground funnels, the drying up of wetland lakes, and seawater invasion [19].

2.2. Data Description

The calculation period in this study is from January 2003 to December 2016. The data used for the current work mainly include precipitation, evaporation, maximum temperature, minimum temperature, wind speed, runoff, water storage, land cover change data, soil data, and Digital Elevation Model (DEM) data. A summary of the input data used to construct the VIC model can be seen in Table 1. In addition, considering that the plain area has no unified river basin outlet, the observed runoff data were calculated and restored by analyzing the water resources of prefecture-level cities based on the statistical data of the National Water Resource Evaluation presided over by the Ministry of Water Resources, together with water resource data published on the China Water Resources Communique. Such restored runoff data can well represent the natural runoff of the southern Haihe river basin.
The observed evaporation data were obtained from GLEAM V3.3b, which is based on remote sensing reanalysis data observed by various satellites and estimated by the Priestley–Taylor formula, including total evaporation (E), vegetation transpiration (Et), plant canopy interception loss (Ei), bare soil evaporation (Eb), snow sublimation (Es), and surface evaporation (Ew). The dataset covers the period from January 2003 to December 2018, and its spatial resolution is 0.25°. Additionally, water storage data for the study area were obtained from the inversed water reserves data of the GRACE satellite. The data source (JPL: https://grace.jpl.nasa.gov/data/get-data/jpl_global_mascons/ (accessed on 10 December 2021)) has monthly data with a spatial resolution of 1° × 1°. To keep in line with other data, the calculation period selected for the water storage data was 2003 January to 2018 December 2000. It should be noted that the missing data for water storage were interpolated according to the adjacent average interpolation method, obtaining water storage data for each 1° grid for the southern system of the Haihe river basin. The groundwater table data were obtained from the Information Center of the Ministry of Water Resources; these data were monthly with spatial resolution of 0.043° × 0.043°, and the period covered was from January 2003 to December 2016. A total of 4076 grid points were selected in the study area.

2.3. Methodology

VIC Model. The VIC hydrological model, developed at Princeton University and Washington University, is a large-scale land surface distributed hydrological model based on a spatial orthogonal distribution grid. The VIC model was firstly proposed in 1992 by Wood et al. [51] and was later developed by Liang et al. [35]. Currently, the VIC model has been improved from the previous VIC-2 L model to the more mature VIC-3 L model. Compared with other hydrological models, the VIC model can simulate land–atmosphere energy conversion and water balance and simultaneously considers two types of runoff generation mechanisms, i.e., saturation excess and infiltration excess runoff. The influence of soil inhomogeneity on runoff yield is also described using soil infiltration capacity parameters for each grid. By doing so, the VIC model can complement the shortcomings of the traditional hydrological model that only considers a single runoff generation mechanism, and it can convert the runoff depth for each grid into runoff data at the outlet of the basin through confluence calculations. Moreover, the VIC model not only considers the energy conversion process but also describes the processes of surface hydrological phenomena. For example, variations in vegetation evaporation, bare soil evaporation, soil melting snow, and other parameters are employed in the model. The temporal and spatial variations in precipitation, soil properties, and vegetation in watersheds grid can also be estimated by the VIC model.
Three soil layers are distinguished in the VIC-3 L model, with surface runoff generated in the upper and middle layers and base flow produced in the lower layer. The ARNO model scheme is used to describe the base flow. The data output from the land surface model are usually adopted as the input data for the confluence module in the VIC model, using the Saint-Venant Equation to calculate the flow process from each grid to the outlet section of the basin and to obtain the simulated runoff at the outlet of the river basin.
This work only considers the runoff generation process of the land surface model and neglects the calculation of confluence, since plain areas have no unified basin outlet section. The Haihe plain was divided into 188 grids with a spatial resolution of 0.25°. The physical and chemical properties of each grid were used as the input data to drive the VIC model. The period covered by the data is from 2003 to 2016. The temporal resolution of the VIC output depends on the input meteorological data (diurnal). When evaluating the model performance against the observed data, it is necessary to unify the temporal resolution by statistical reanalysis of the diurnal simulated results of the VIC model. The temporal resolution of the restored natural runoff in plain areas is annual; thus, the total annual runoff output of the VIC model was calculated for comparison with the restored natural runoff. For comparison with the monthly GLEAM V3.3b evaporation data, the total monthly evaporation of the VIC model was also calculated. Water storage is characterized by the sum of the soil water content of the three layers of soil in the VIC model. The water storage data observed by the GRACE satellite were adopted herein to evaluate the model performance with respect to simulating water storage changes on a monthly scale. However, the magnitude and unit of the GRACE satellite water storage data are not unified with those of the soil water content data simulated by the VIC model; thus, data standardization in preprocessing the two data series could attain better comparison results.
ModelSynergetic Calibrationand Validation. The optimal parameters of the VIC model in the present work were determined by the synergetic calibration method based on three hydrological elements, i.e., runoff, evaporation, and water storage. The synergetic calibration method refers to using a group of parameters in the model to calibrate multiple hydrological elements at the same time. In contrast with the traditional simulation of a single point of runoff at the outlet of the basin section, the synergetic calibration method simultaneously considers the simulation accuracy of the runoff, evaporation, and water storage data. Four statistical metrics, namely the Nash–Sutcliffe efficiency coefficient (NSEC), the relative error (RE), the root mean square error (RMSE), and the correlation coefficient (CC), were used to evaluate the performance of the VIC model. The CC represents the correlation between the observed values and the simulated values, the RE indicates the relative error between the observed values and the simulated values, and the NSEC indicates the fitting degree between the observed values and the simulated values. The higher the NSEC, the higher the fitting degree between the observations and the simulations, indicating a higher simulation accuracy of the VIC model. RMSE represents the average level of absolute error between the observed and the simulated data series.
Herein, NSEC, RE, RMSE, and CC were calculated using the following formulas:
NSEC = 1 t = t 1 t n ( obs t sim t ) 2 t = t 1 t n ( obs t obs ¯ ) 2
where t 1 and t n are the start and end times of the observed and simulated data series, respectively, obs t and sim t are the observed and simulated hydrological elements at time t, respectively, and obs ¯ is the average of the observed data series.
RE = ( sim ¯ obs ¯ ) / obs ¯
where sim t ¯ and obs ¯ are the averages of the model-simulated and the observed data series, respectively.
RMSE = t = t 1 t n ( obs t sim t ) 2 n
where obs t and sim t indicate the observed and the model-simulated hydrological elements at time t, respectively.
CC = i = 1 m ( sim i sim ¯ ) ( obs i obs ¯ ) i = 1 m ( sim i sim ¯ ) 2 i = 1 m ( obs i obs ¯ ) 2
where sim is a model-simulated value, o b s is an observed value, and sim ¯ and obs ¯ are the averages of the model-simulated and observed data series, respectively. Note that the Pearson’s CC was analyzed for significance at the 0.01 and 0.05 levels.
Specifically, in terms of simulating runoff using the VIC model, the model parameters were calibrated using the total runoff simulated by the VIC model against the restored natural runoff, and three evaluation indexes, including RE, RMSE, and CC, were adopted in the model’s performance evaluation. When simulating evaporation using the VIC model, the model calibration was based on the simulated total evaporation and the observed GLEAM v3.3b evaporation data. According to Zhong et al. [45], the GLEAM evaporation data showed high consistency with those from the flux observation tower over the Huang–Huai-Hai Basin areas, indicating that GLEAM evaporation data can be regarded as references for ground-observed evaporation. The selected evaluation indexes for evaporation simulation were NSEC, RE, RMSE, and CC. The simulation of water storage was represented by the sum of the soil water content of the three layers output by the VIC model. When calibrating the model parameters, the inversed water storage data provided by the GRACE satellite were used as the observed water storage, and the selected evaluation index was CC.
Sliding Calibration Method. There were six parameters in the VIC model needing to be calibrated, i.e., the variable infiltration curve index (B), the ratio of initial nonlinear base flow value to maximum base flow (DS), the maximum base flow velocity (Dm), the maximum proportional coefficient of soil water content in the third layer (WS), and the thicknesses of the second soil layer (d2) and the third soil layer (d3). It has been demonstrated that the most important parameter affecting runoff production in the VIC model is parameter d2 [34]. The thickness of the second soil layer affects the water storage of each grid and further affects the grid infiltration, resulting in influences on the surface runoff yield. The southern plain of the Haihe river exhibits the worst drop in groundwater table and water storage levels due to many years of overexploitation of groundwater, which may change the parameter d2 of the VIC model. On this basis, the sliding calibration method was adopted to obtain the variation scale of the parameter d2 and further analyze the implied relationship between groundwater exploitation and the model parameter d2. Specifically, the sliding calibration scheme used in this work was as follows:
(1)
Model calibration and validation for the whole period. The calculation period chosen for the study area was from 2003 to 2016. The model was firstly calibrated and validated for the whole period, with a calibration period from 2003 to 2012 and a validation period from 2013 to 2016. The Rosenbrock method was adopted to calibrate the six parameters (i.e., B, DS, Dm, WS, d2, and d3) of the overall calculation period.
(2)
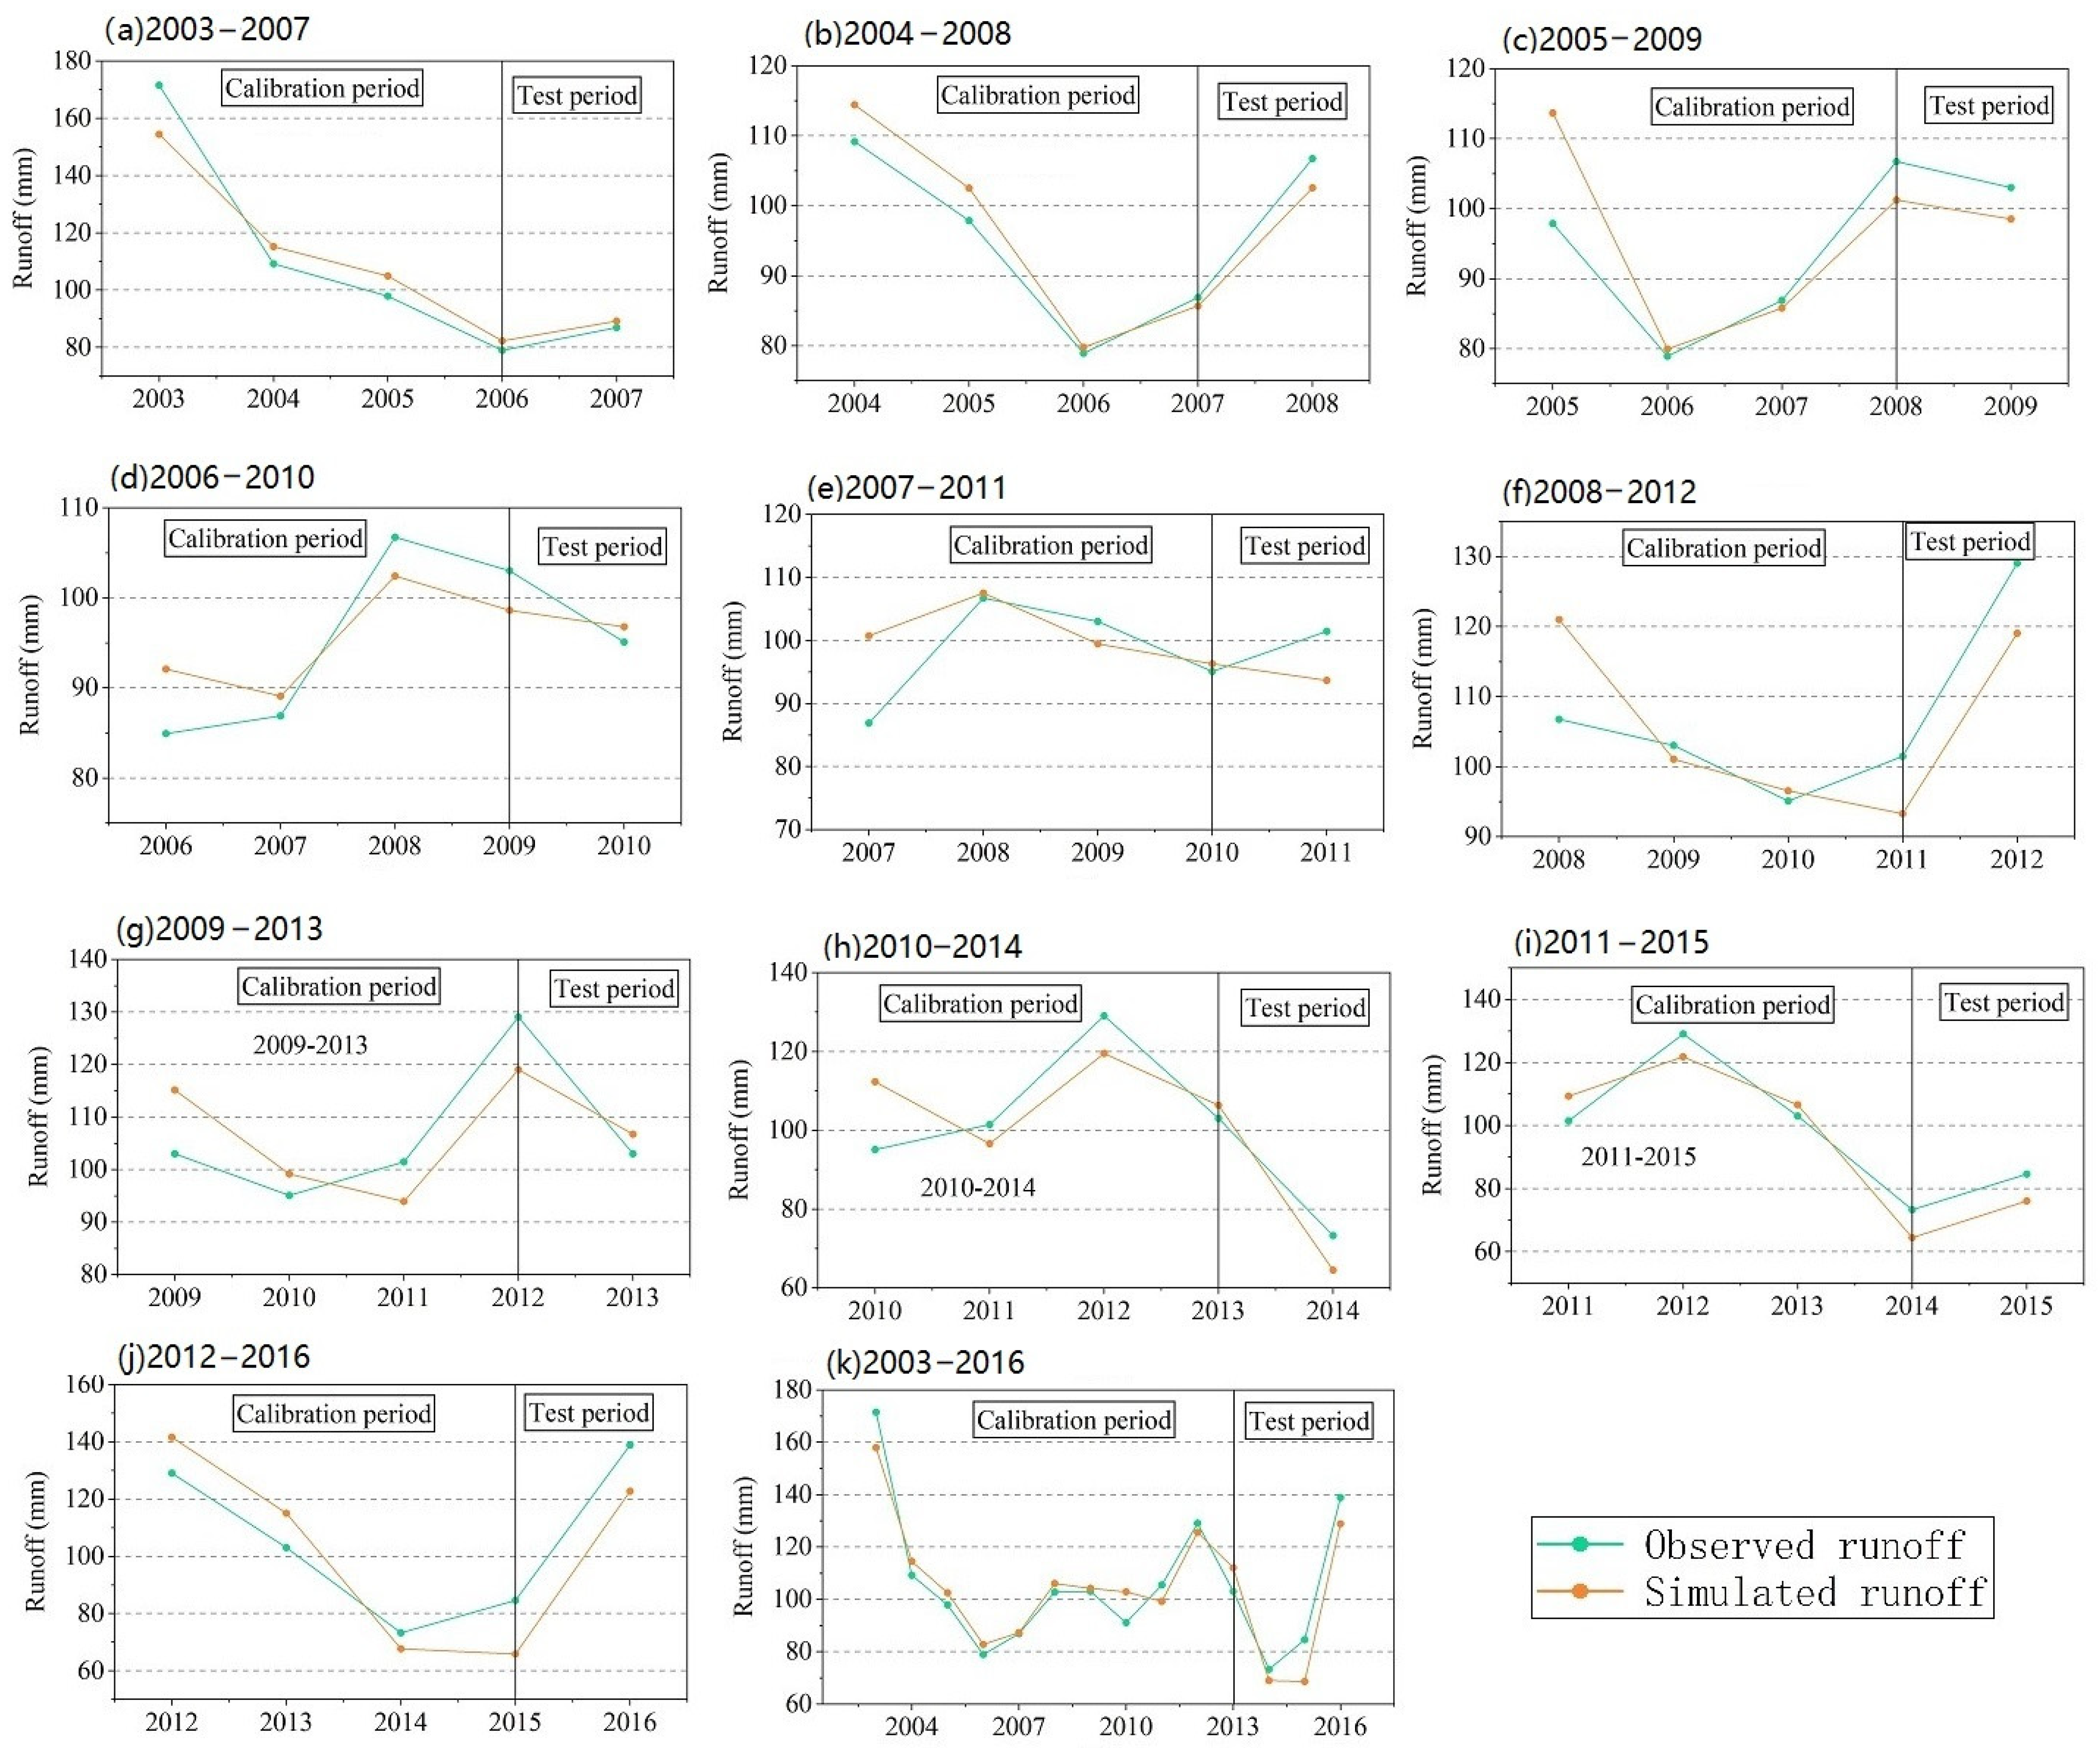
Sliding window division. Sliding window periods of five years were designated: 2003–2007, 2004–2008, 2005–2009, etc. A total of ten sliding windows were established for the whole period 2003–2016. For each sliding window period of five years, the VIC was separately constructed, with the first four years as the calibration period and the last year used for model validation.
(3)
Model calibration and validation for each sliding window period. When calibrating the VIC model for each sliding window period, the parameters B, DS, Dm, WS, and d3 were the same as those obtained in step (1), and d2 was the only parameter to be calibrated. The parameter d2 was given a range of [0.1, 0.5], and the setting step was set as 0.001, generating 400 groups of model parameter sets. The optimal model parameters were ascertained using the synergetic calibration and validation method. Firstly, five groups of model parameters were chosen based on the minimum sum of the absolute values of RE and RMSE between the simulated and the observed runoff and evaporation. Secondly, the optimal parameter was obtained according to the largest CC between the simulated and observed water storage data.

3. Results

3.1. Spatial and Temporal Variations in the Groundwater Table and Water Storage

The annual rate of change in groundwater table and water storage levels in the southern Haihe river plain was obtained by regression analysis at the annual scale. Then, the spatial annual rate of change for the whole Haihe southern system was obtained by interpolation in space using the inverse distance weight (IDW) method, as shown in Figure 2a,b. Spatially, the water storage data for the southern Haihe river plain showed a decreasing trend, while the groundwater table showed an increasing trend. The spatial distributions of the groundwater table and water storage levels were in good agreement. In addition, those areas with the largest increase in the groundwater table and the most obvious decline in water storage were primarily concentrated in the cities of Baoding, Shijiazhuang, and Xingtai. Groundwater exploitation in the Haihe plain is the main source of local agricultural irrigation, particularly for the Shijiazhuang, Baoding, Xingtai, and Hengshui areas, where irrigation for agriculture has been largely dependent on groundwater exploitation. It was reported that local groundwater agricultural exploitation accounted for more than 80% of total agricultural water use [52].
The changes in annual water storage and groundwater table levels were further analyzed, as presented in Figure 3. An evident decreasing trend in water storage and an increasing trend in the groundwater table were found in the southern Haihe river plain areas. The water storage of the southern Haihe river plain decreased at the rate of 1.6 cm/a, and the groundwater table increased at the rate of 0.27 m/a. The correlation between water storage and the groundwater table was found to be strong, with the determination coefficient (R2) reaching 0.82. Zhong et al. [45] found that the land water storage in Beijing, Tianjin, and Hebei decreased at a rate greater than 1 cm/a, which was consistent with the rate of decrease presented in this work (1.6 cm/a).

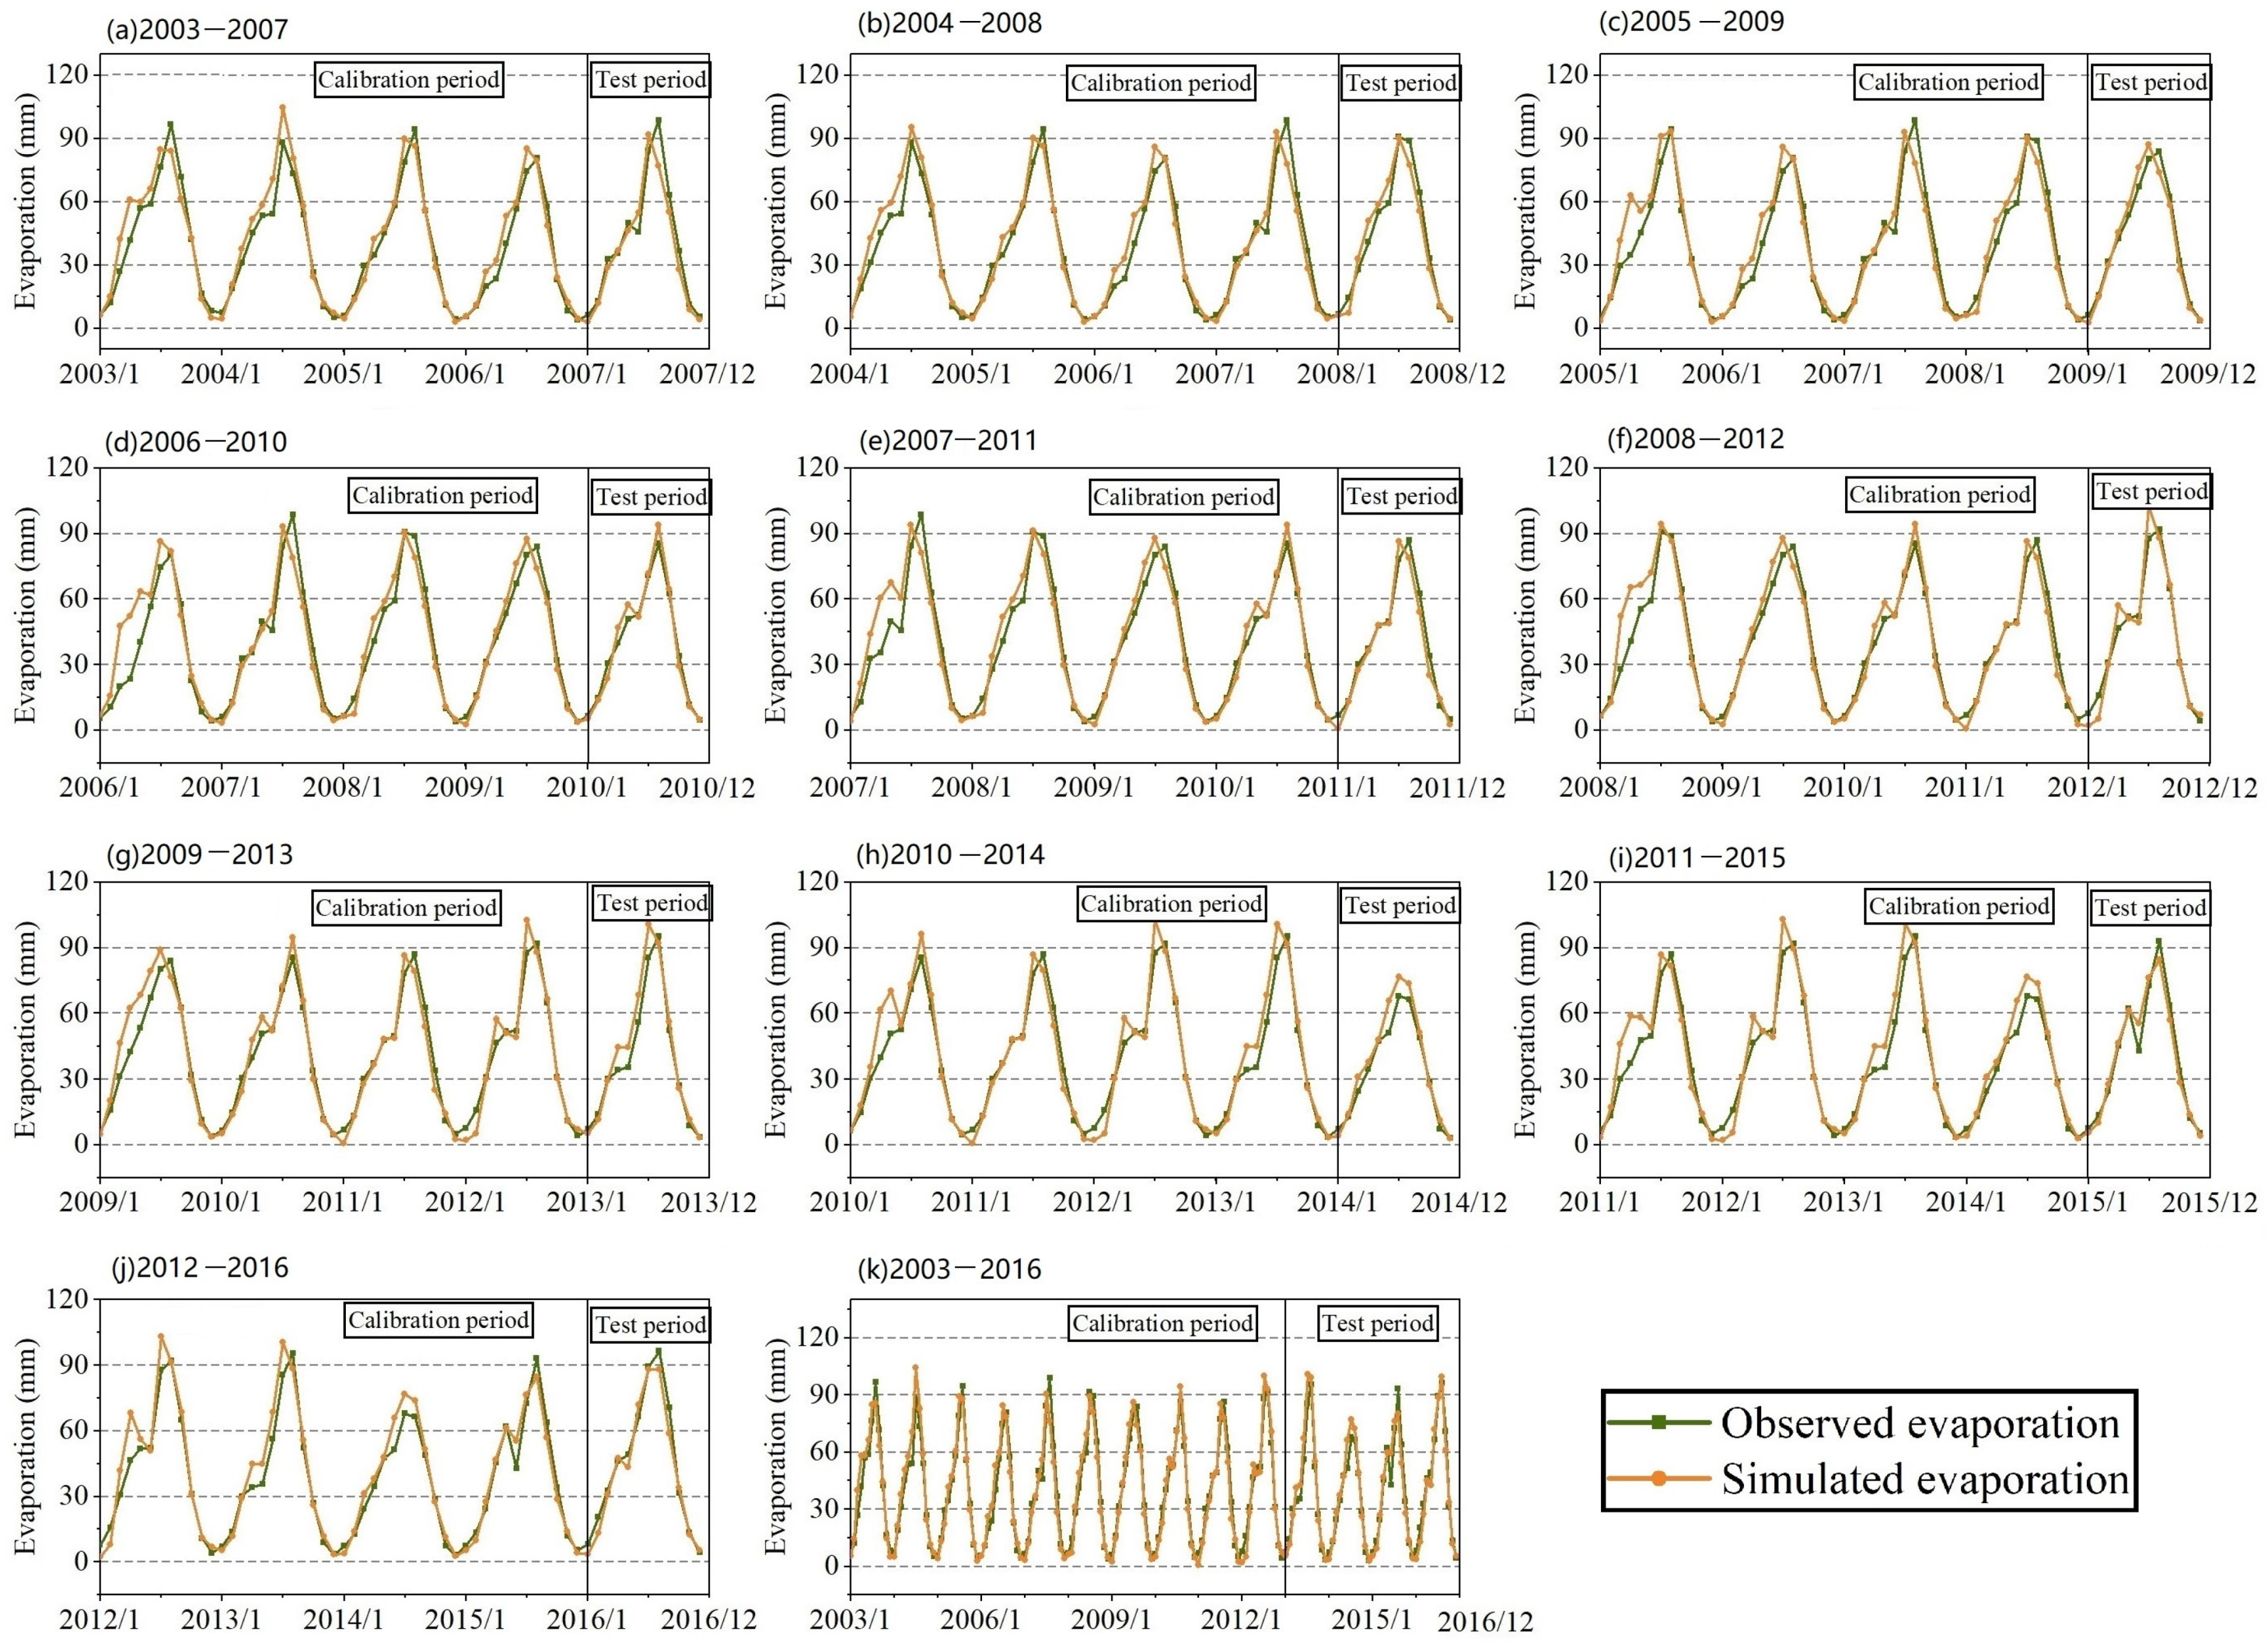
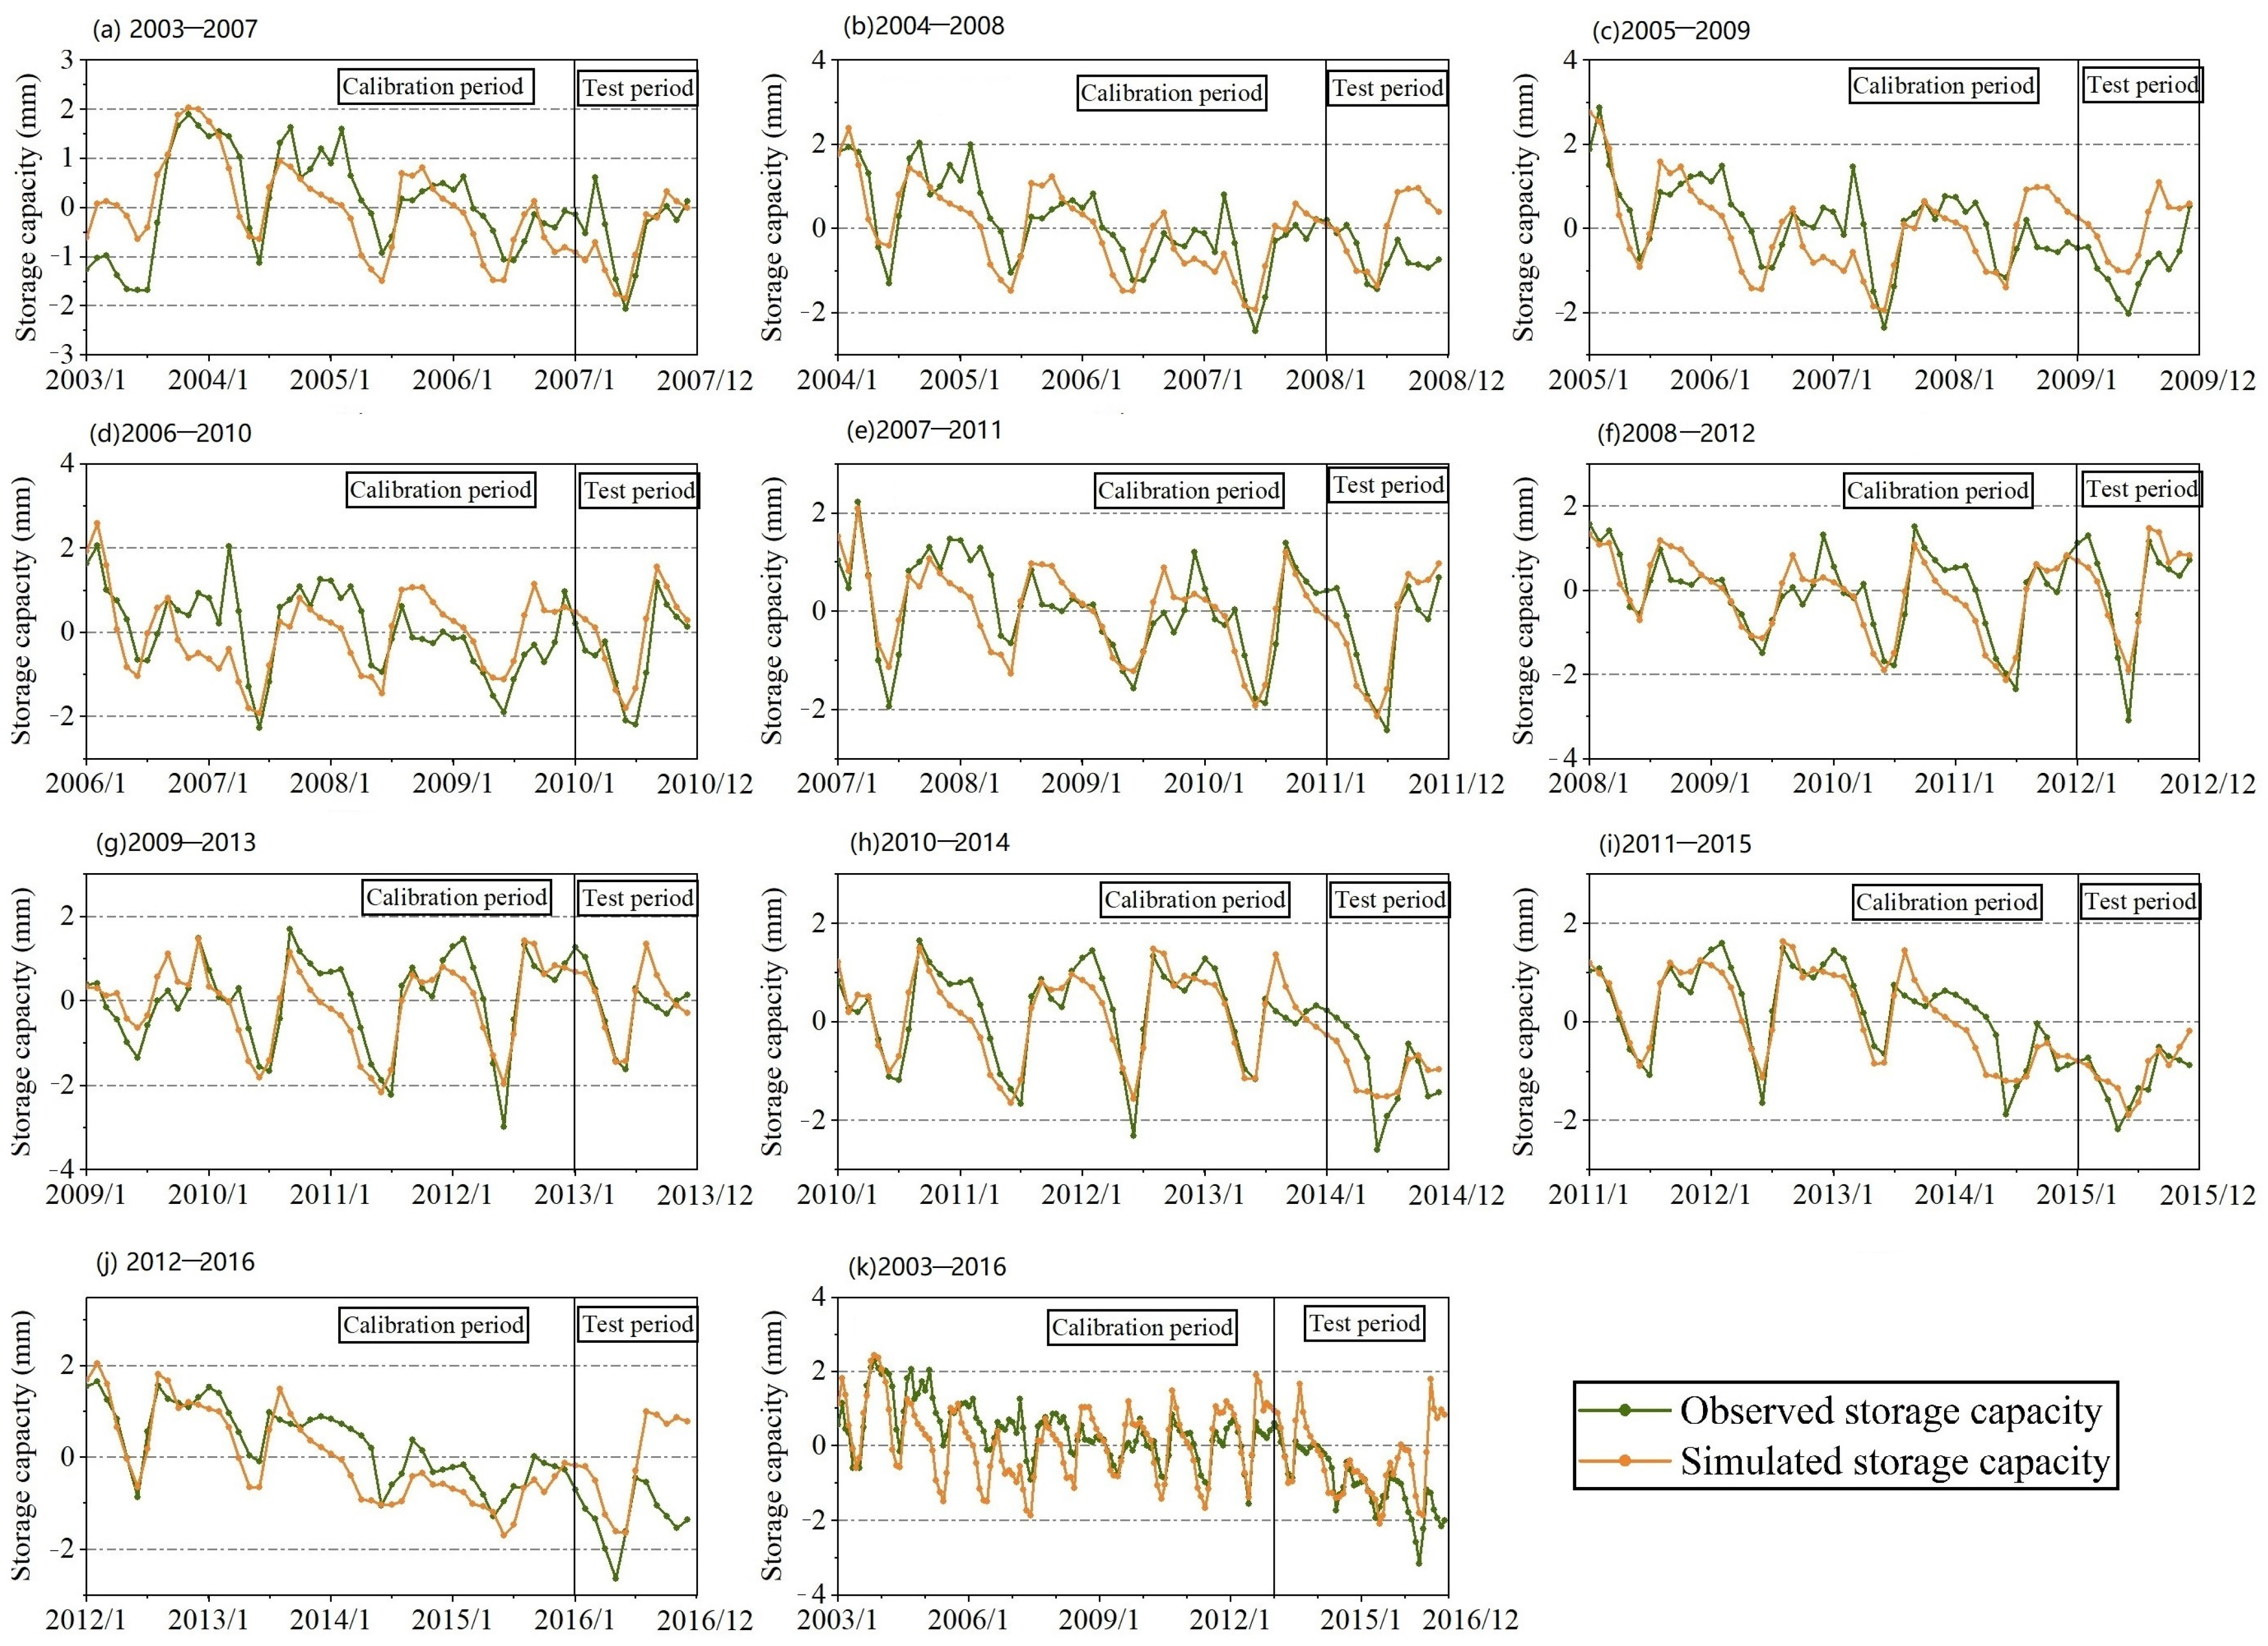
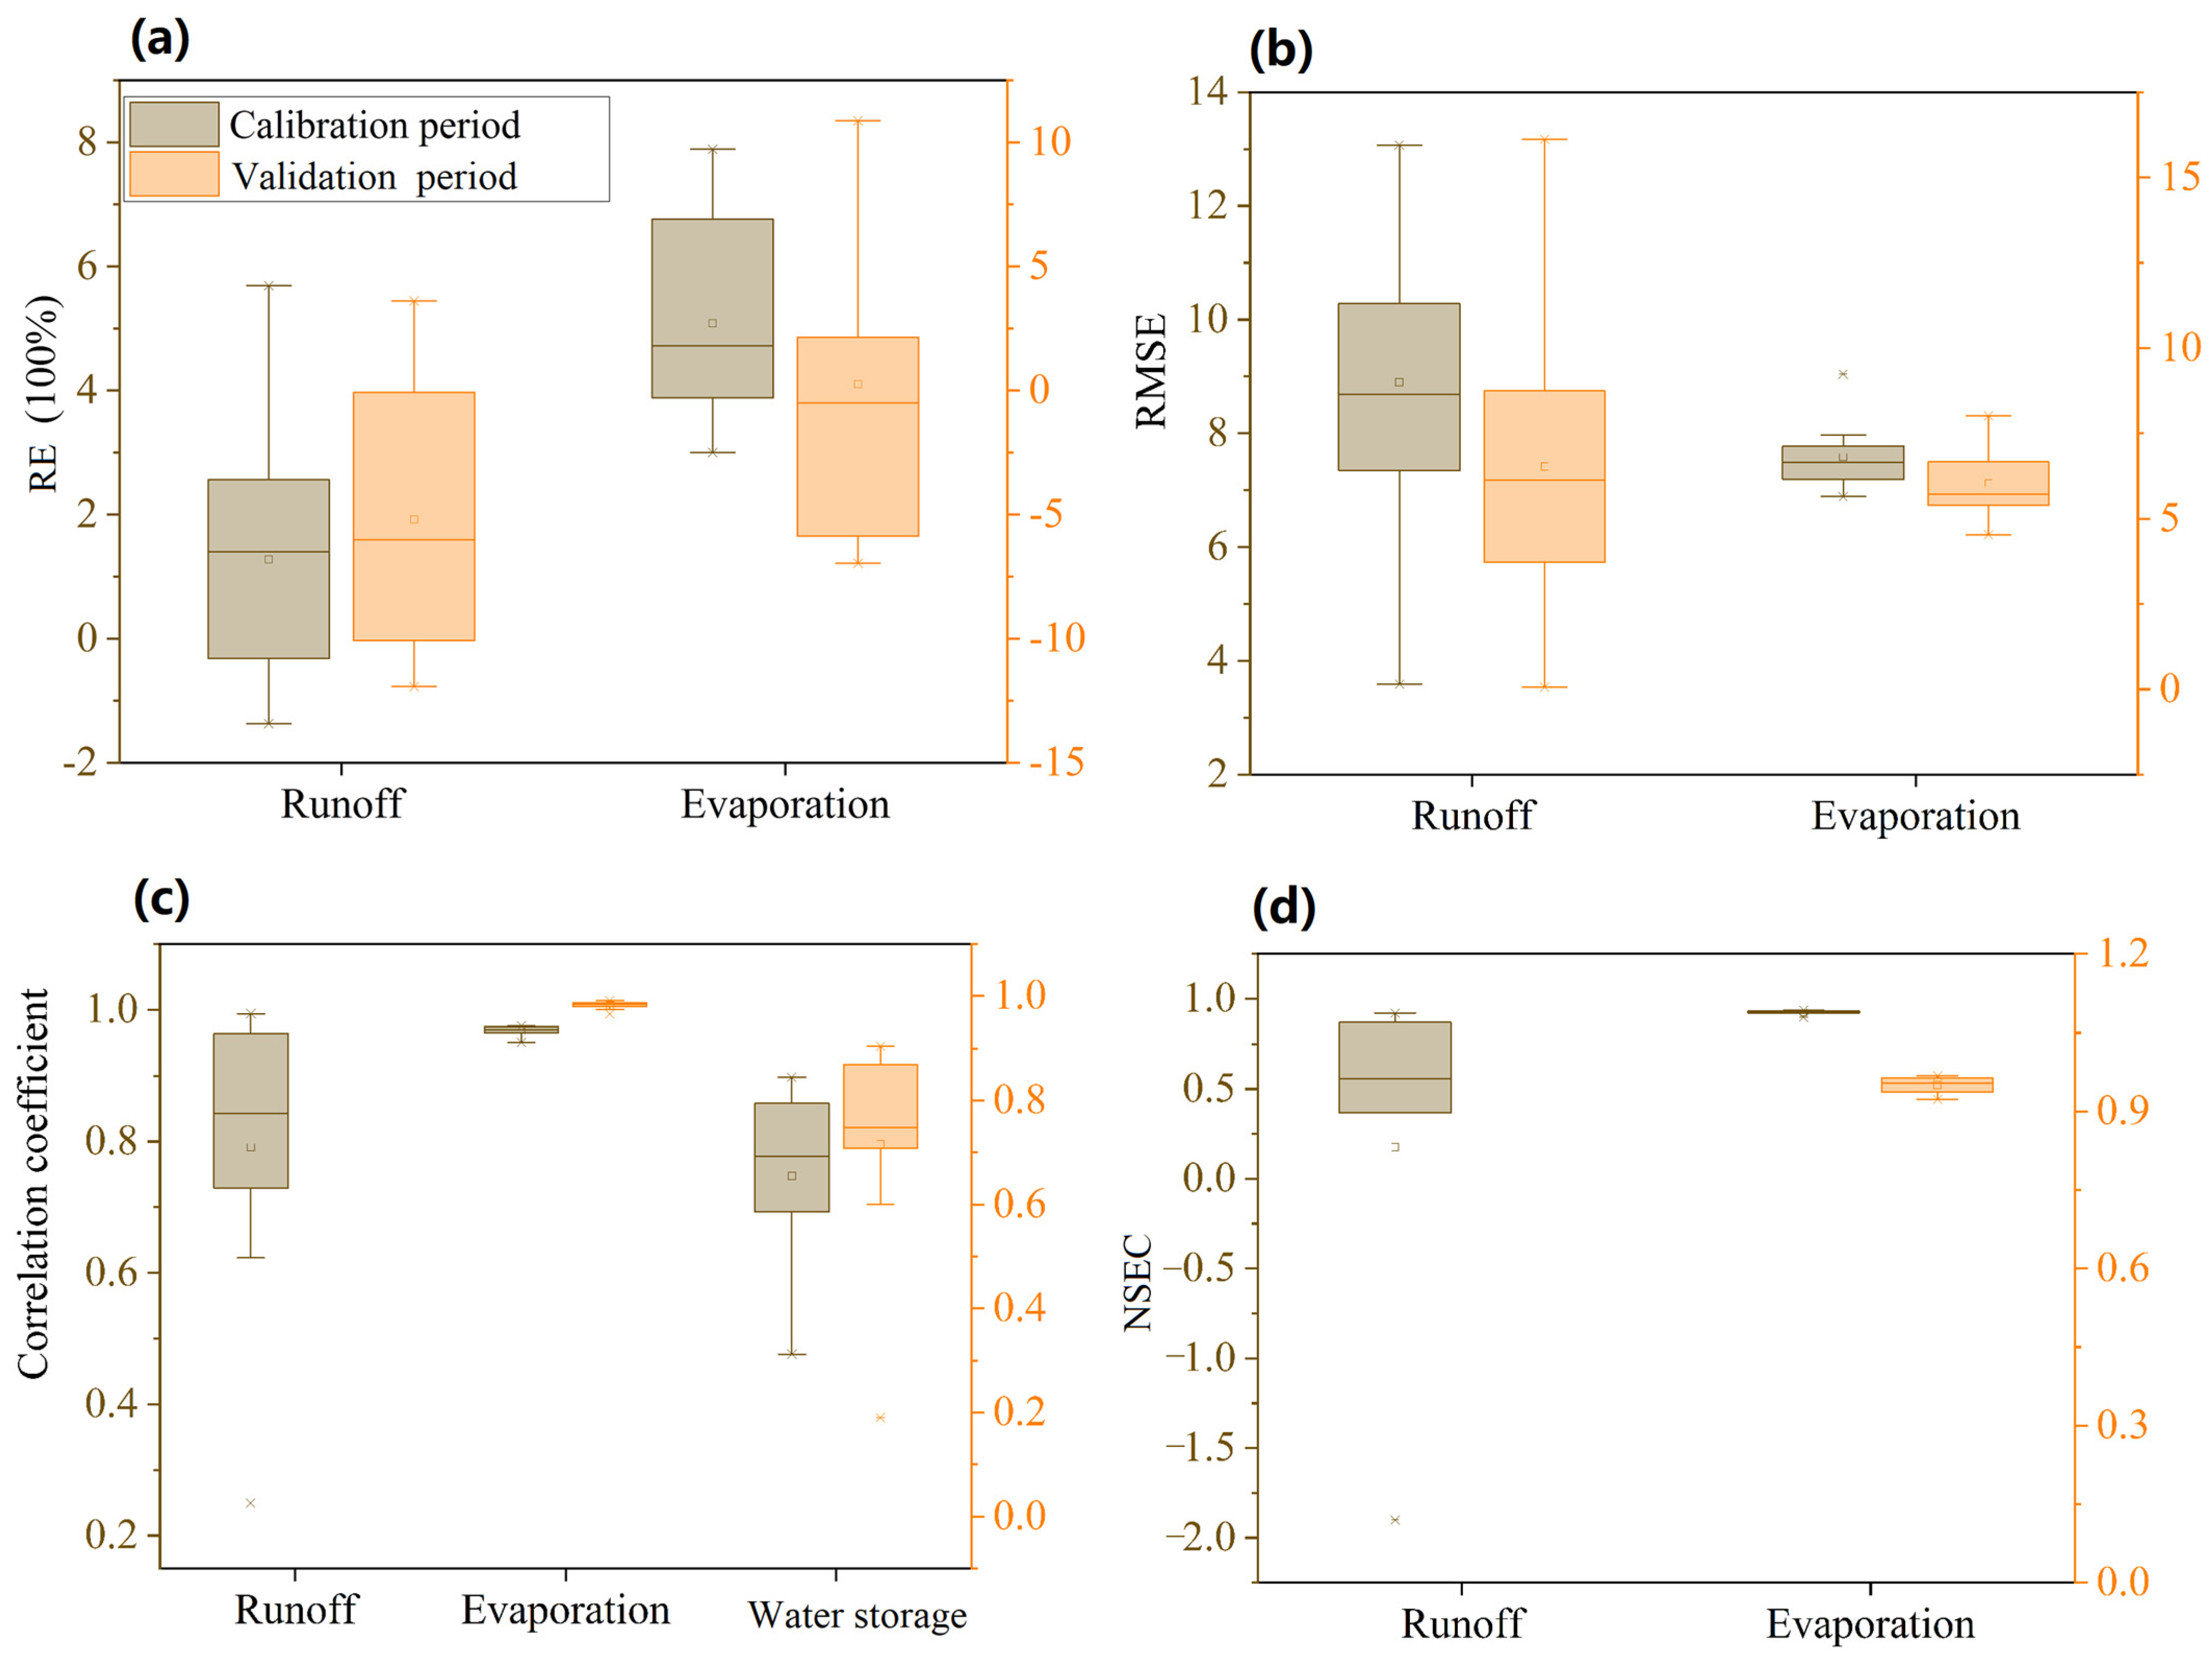
3.2. Hydrological Simulation of Runoff, Evaporation, and Water Storage

Hydrological elements such as runoff, evaporation, and water storage are the key variables that should be used to evaluate the simulation results of the VIC model. Based on the synergetic calibration and validation method, the runoff, evaporation, and water storage processes in the southern Haihe river plain from 2003 to 2016 were simultaneously simulated using the VIC model. The applicability of the VIC model to the simulation of the three hydrological elements in the southern Haihe river basin was evaluated both for the whole period and for the sliding window periods. The results indicated that the VIC model reflects the hydrological element changes of the southern Haihe river basin better than the traditional model, as shown in Figure 4, Figure 5 and Figure 6.
In terms of the VIC model performance for the whole period (Figure 4k, Figure 5k and Figure 6k), the VIC model well simulated the runoff and evaporation processes of the study area both in the calibration (2003–2012) and validation (2013–2016) periods, as seen in the overall statistical results in Table 2. All the NSECs were more than 0.8, and all the CCs were more than 0.9; meanwhile, all the REs were less than 5%, and the RMSEs were small. According to the results of the water storage simulation, the CC for the calibration period was about 0.6; for the validation period, it was reduced to 0.4.
In terms of the sliding calibration results, the simulated runoff, evaporation, and water storage data of the VIC model in the 10 sliding window periods were compared with the observed values, and the statistics for the performance metrics are presented in distribution box diagrams (Figure 7). Overall, the sliding simulation by the VIC model showed good performance for the 10 sliding window periods. All absolute values of relative error (|RE|) for simulating runoff and evaporation were less than 8%; the RMSEs were all less than 10, and all the CCs were above 0.8. The simulation of water storage for each sliding period indicated no significant difference in the CC between the simulated and the observed water storage for both the calibration and the validation periods; all were ~0.7. The water storage simulated by the VIC model was found to be in good agreement with the observations of the GRACE satellite. However, for the sliding validation periods, the water storage simulated by the VIC model was slightly higher than that of the GRACE satellite inversion, particularly for the period from 2012 to 2016 (Figure 6).

3.3. Sliding Variation Trend of Model

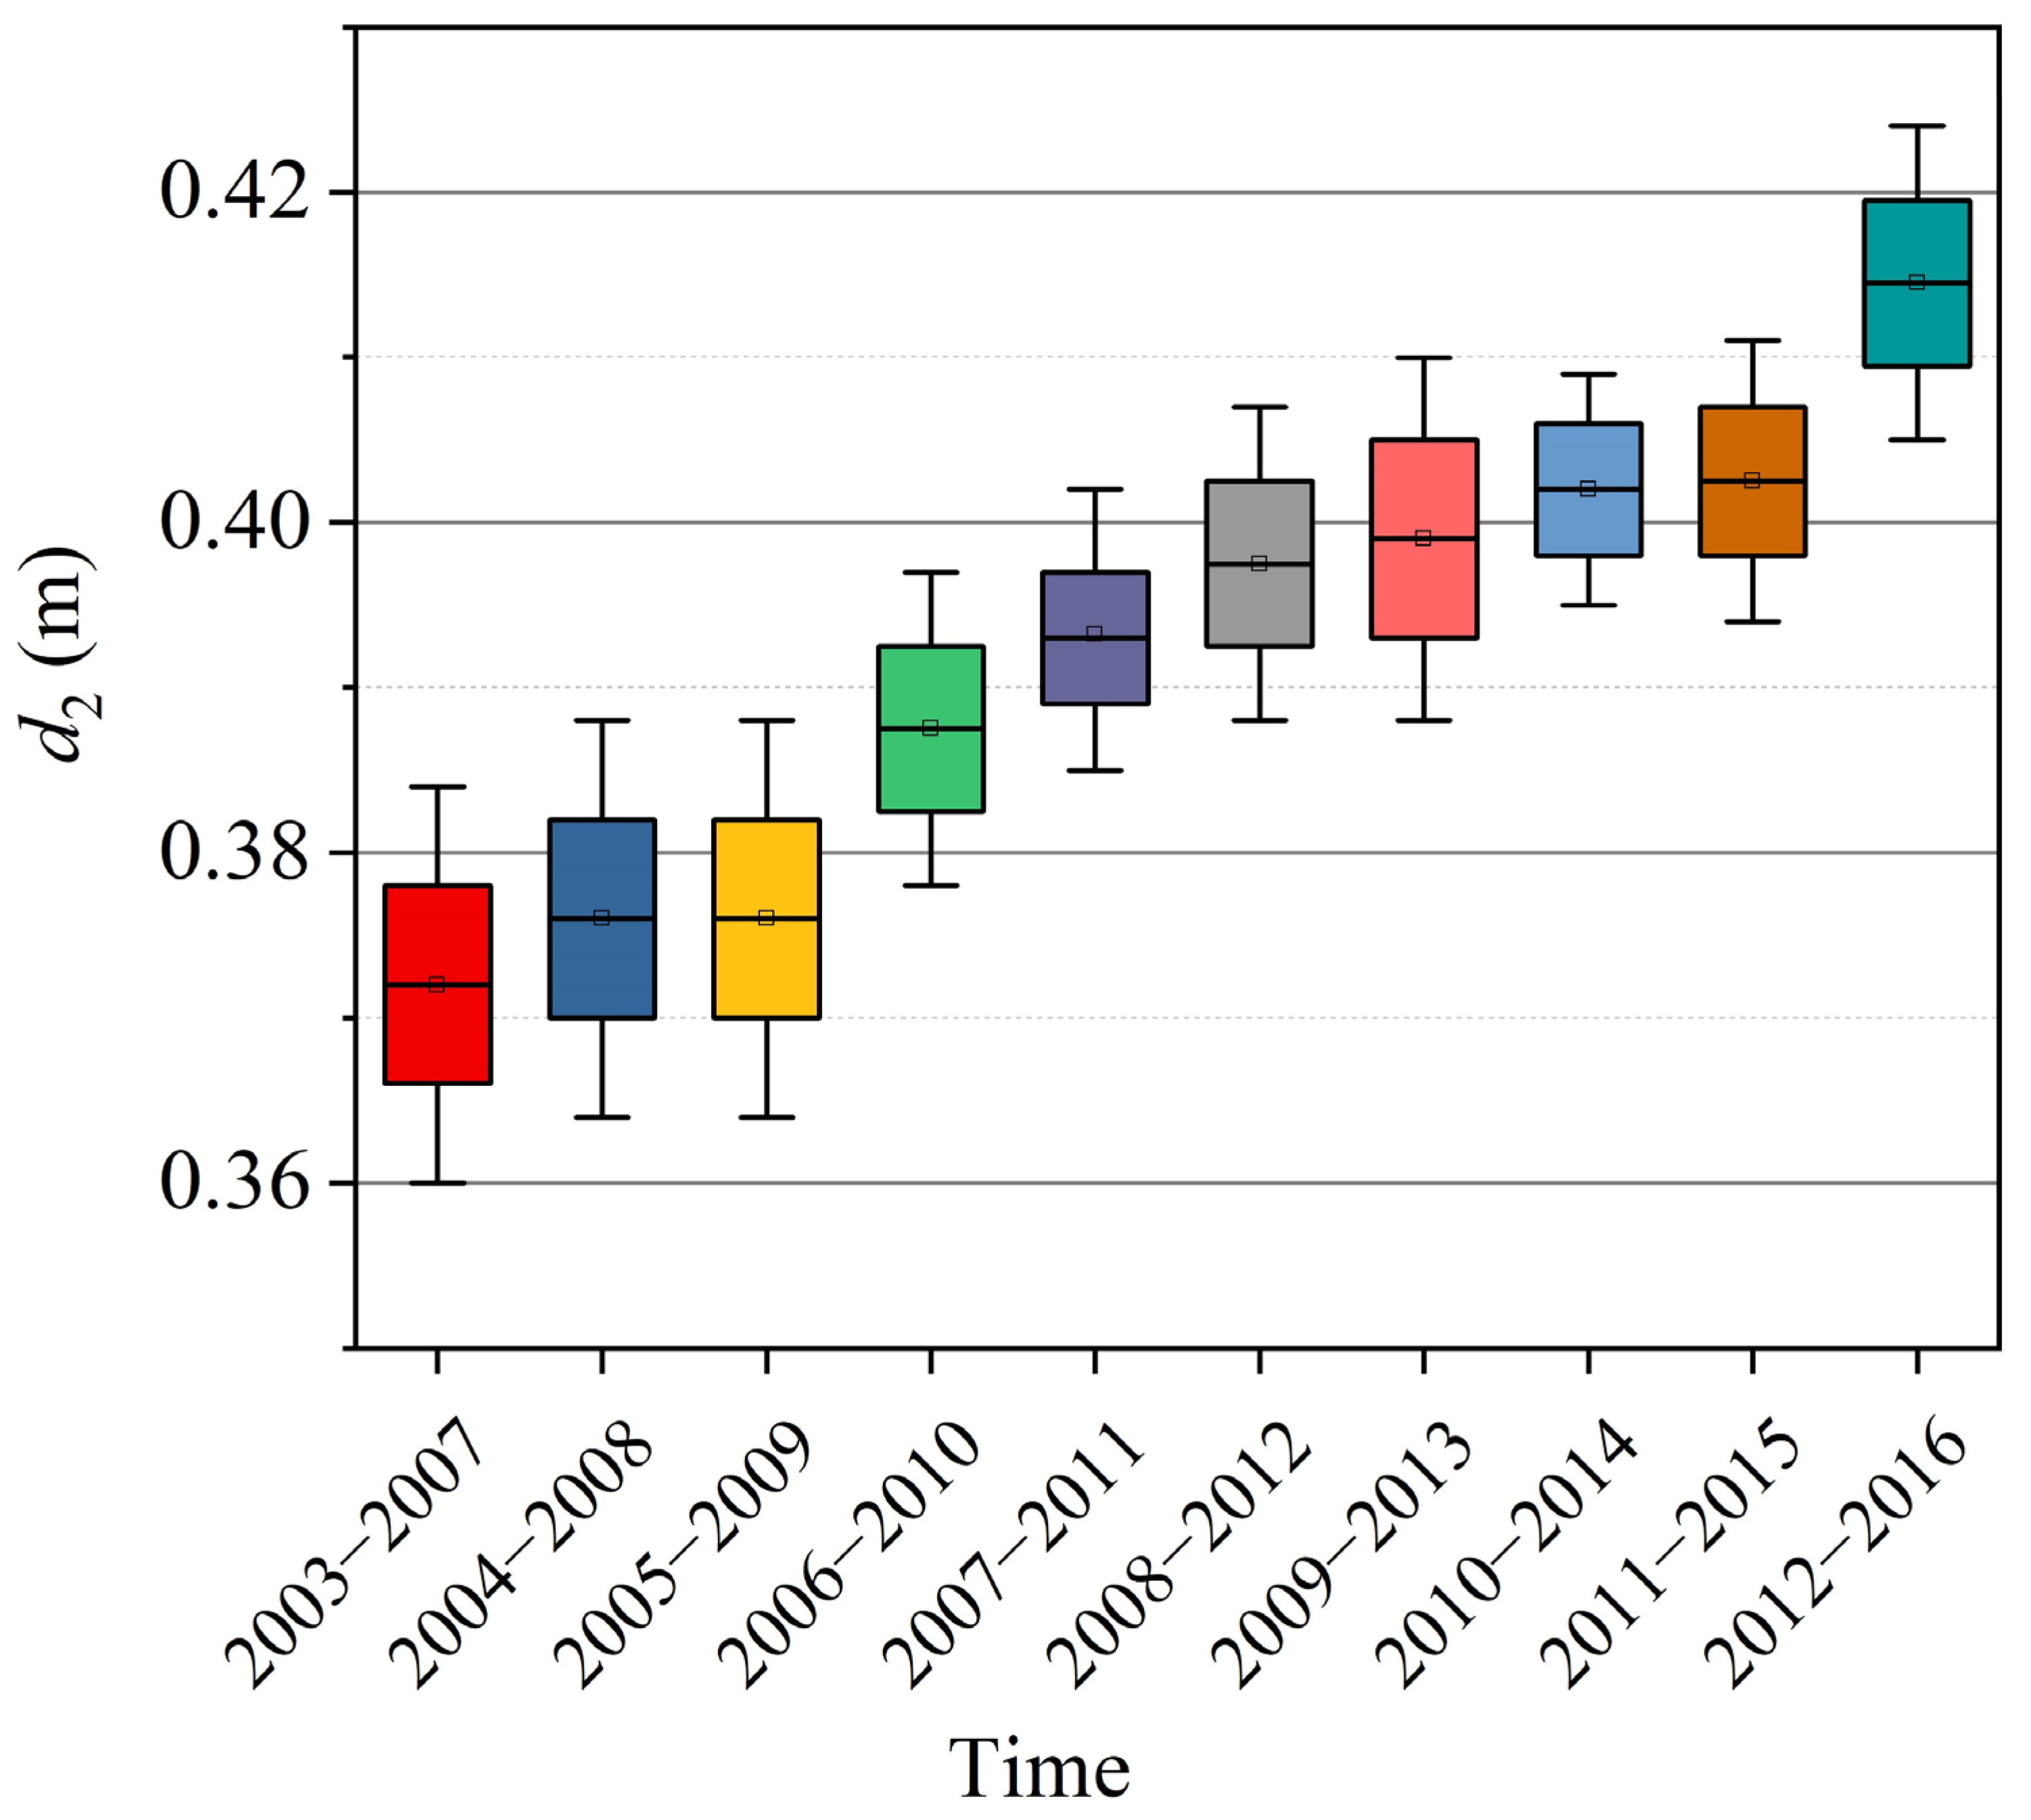
3.3.1. Variation Trend of Thickness of the Second Soil Layer

To obtain the variation trend of the thickness of the second soil layer (d2) in the VIC model, the optimal 25 parameter groups were selected from the total 400 sets of parameters used for the calibration and validation of each sliding period (Figure 8). It can be seen that, with the increase in the sliding window period, the average d2 ( d 2 ¯ ) gradually increased from 0.372 m to 0.415 m, especially for the last sliding period (2012–2016), which increased by 12% compared to that of the first sliding period (2003–2007). According to the aforementioned analysis of the changes in water storage and groundwater table levels, the largest decrease in water storage and the largest increase in the groundwater table also occurred during the period 2012–2016.

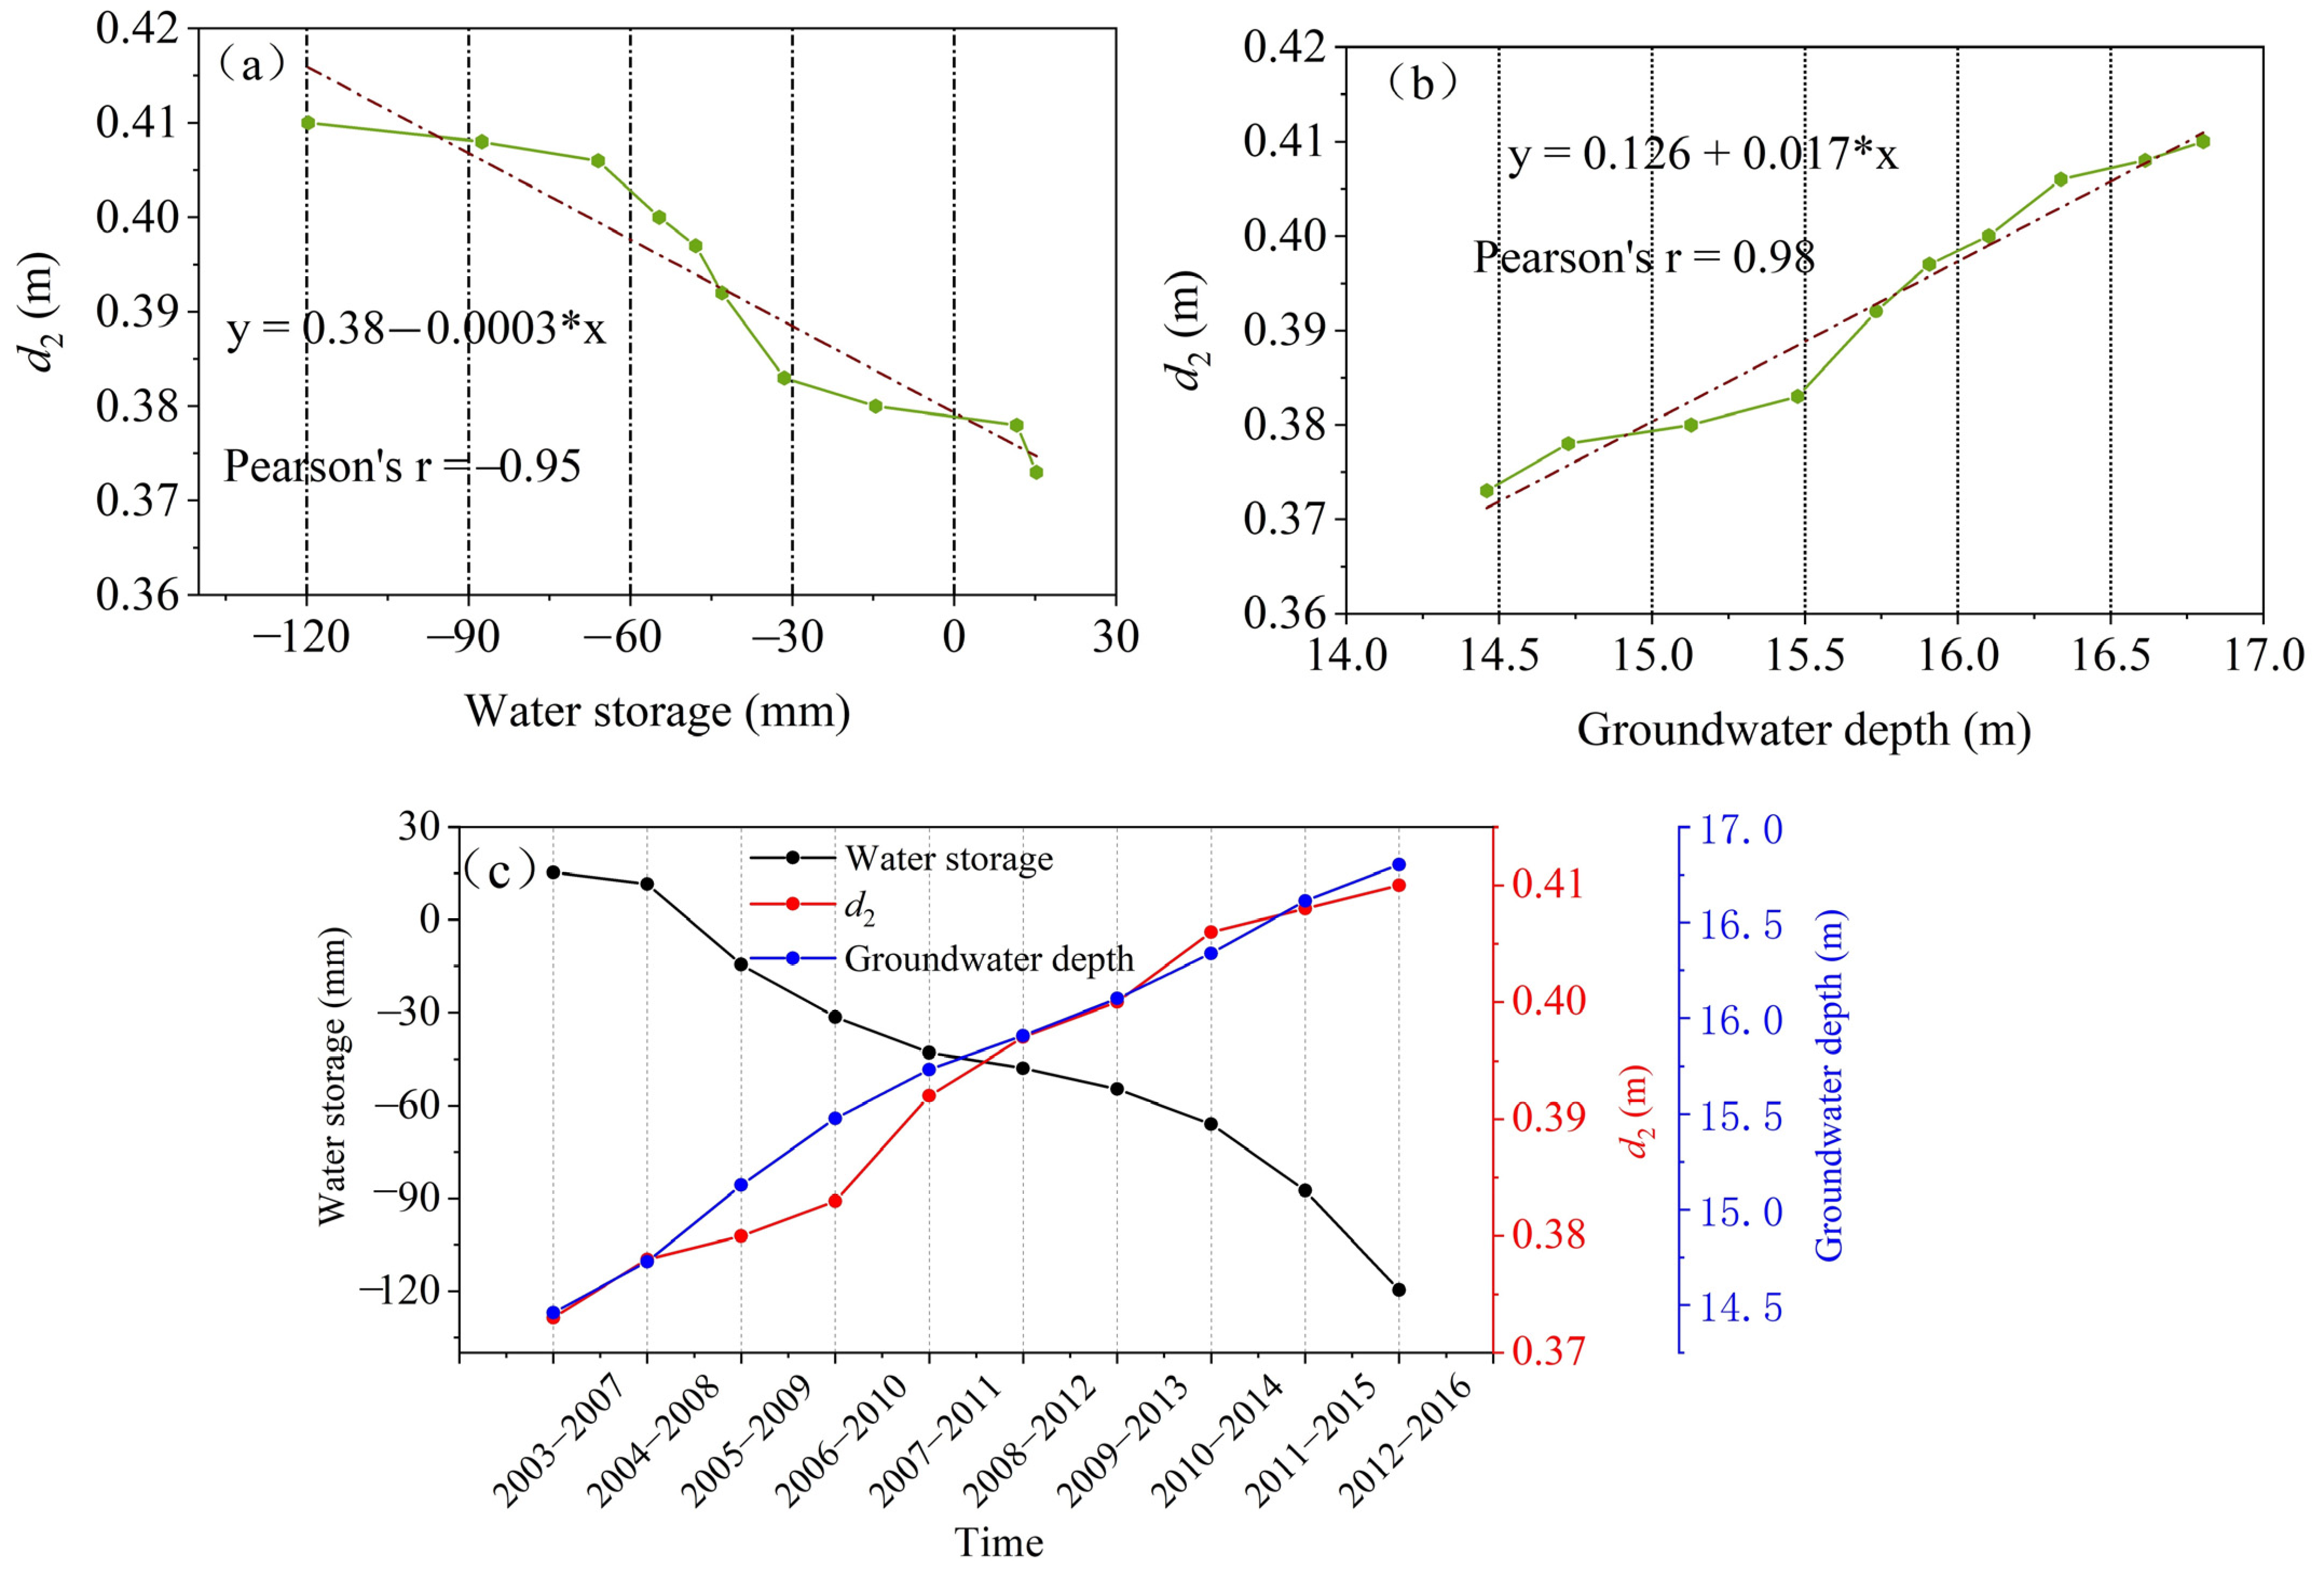
3.3.2. Correlation Analysis of the Groundwater Table, Water Storage, and d2

The water storage and groundwater table levels simulated by the VIC model were averaged for each sliding period, obtaining the water storage and groundwater table series for different sliding window periods. Meanwhile, the optimal d2 was chosen for each sliding period. On this basis, the correlations between water storage, the groundwater table, and the parameter d2 were further analyzed (Figure 9). A significant correlation was found between the groundwater table and water storage and the parameter d2, based on regression analysis, as shown in Figure 9a,b. The correlation coefficient between water storage and d2 was −0.95, and the slope of the regression line was −0.0003 (m), indicating that for each 1 mm decrease in water storage, the parameter d2 of the VIC model increased by 0.3 mm. Similarly, the correlation coefficient between the groundwater table and d2 reached 0.98, with the slope of the regression line reaching 0.017 (m), indicating that for each 1 m increase in the groundwater table, d2 increased by 0.017 m. According to the aforementioned temporal-spatial analysis of water storage and groundwater table levels in Section 3.1, the rate of decrease in water storage was 1.6 cm/a, and the rate of increase in the groundwater table was 0.27 m/a. At such decreasing/increasing rates, the parameter d2 in the VIC model would increase 0.46–0.48 cm/a for the southern Haihe river basin plain.

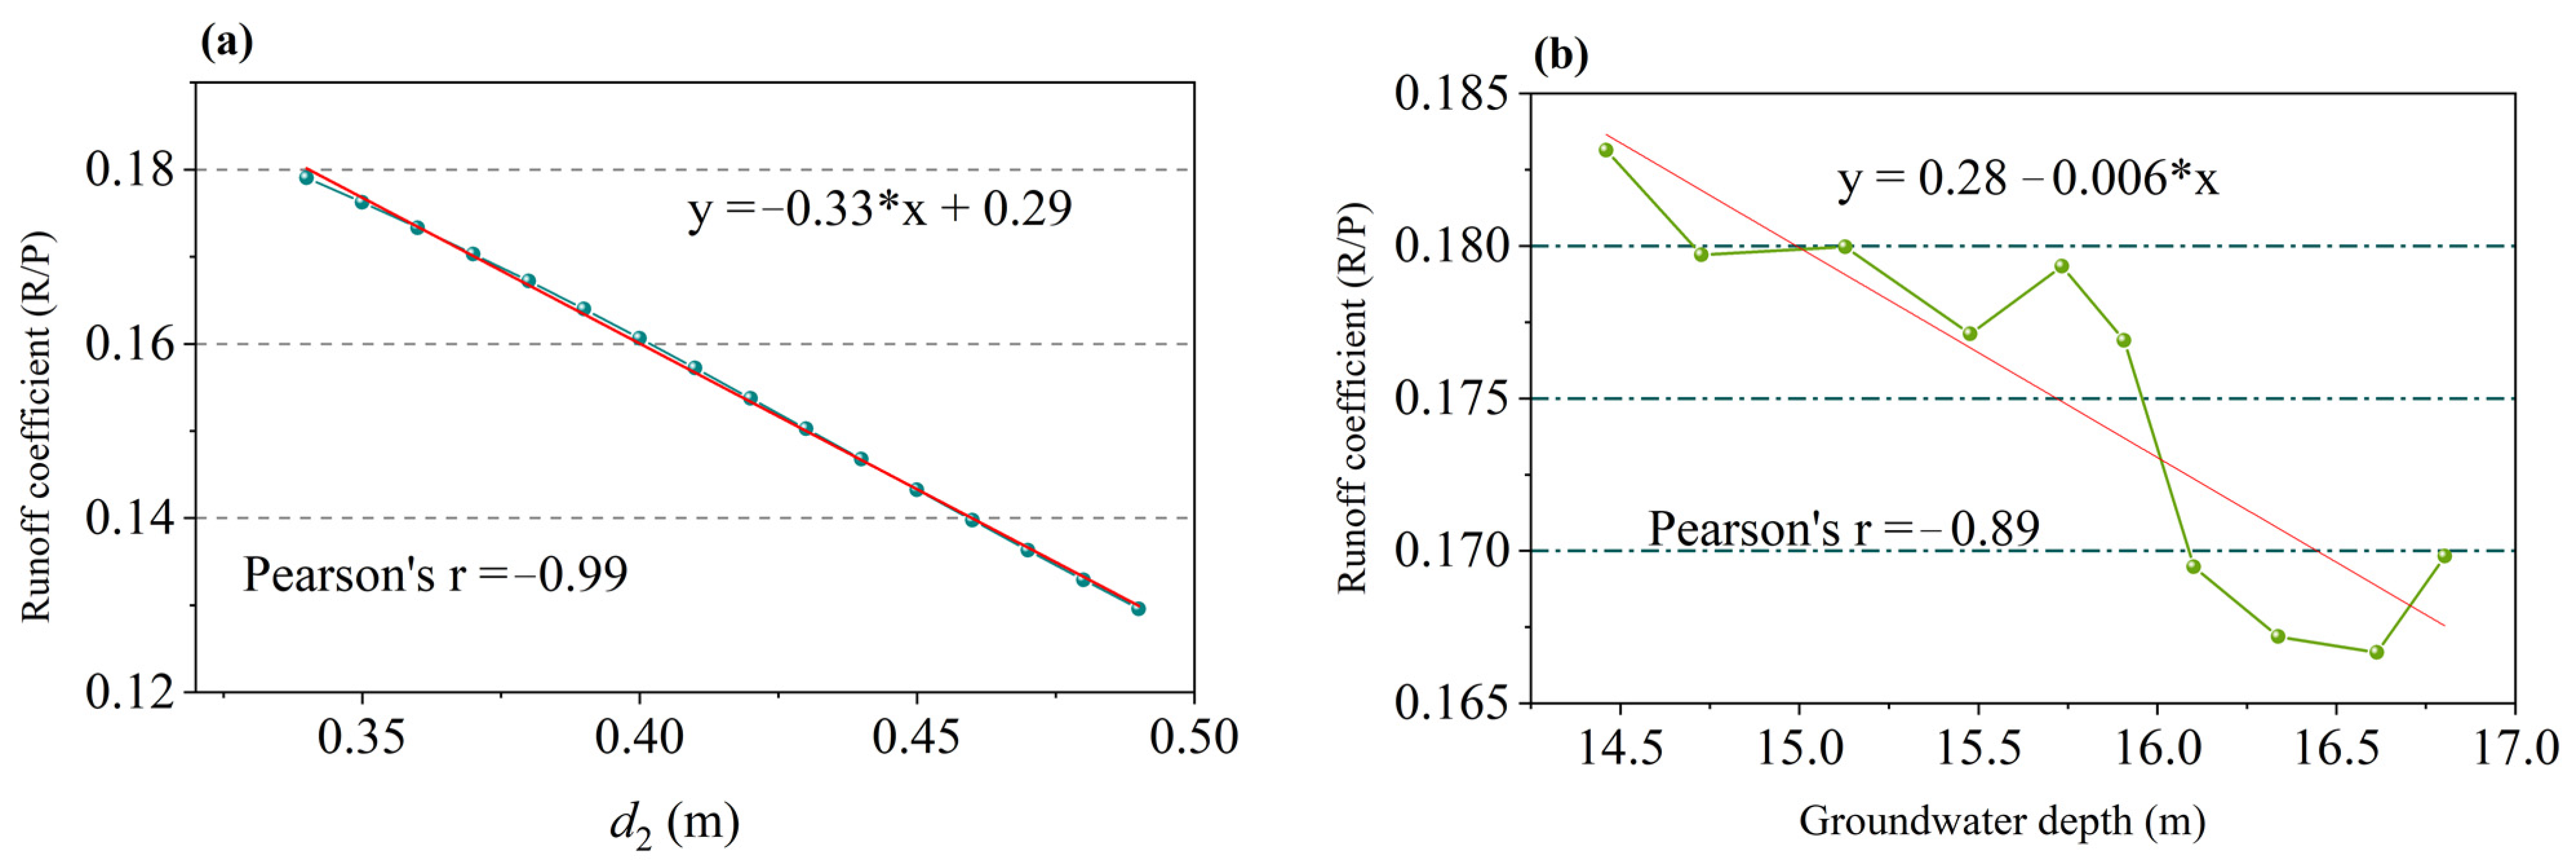
3.4. Relationships among the Groundwater Table, d2, and Runoff Coefficient

The optimal d2 values for the 10 sliding periods were in the range of 0.35~0.43 m (Figure 8). The constructed VIC model framework for the whole period (2003–2016) was adopted herein to explore the relationship between the runoff coefficient and the parameter d2. Specifically, the parameter d2 was set to 0.35–0.49 m, with a step of 0.01, to drive the VIC model for each time period and to calculate the corresponding runoff coefficients. The relationship between d2 and the corresponding runoff coefficient is presented in Figure 10a. It can be seen that a significant negative linear relationship exists between the runoff coefficient and d2 (regression equation: y = −0.33x + 0.29), with the Pearson’s correlation coefficient reaching −0.99. As mentioned above, the parameter d2 in the VIC model increased from 0.36 m (2003) to 0.42 m (2016) for the southern Haihe river basin plain. The decrement of the runoff coefficient can be calculated using the regression equation; it was reduced by ~0.02. The relationship between the observed groundwater table and the runoff coefficient was also analyzed for the 10 sliding window periods (Figure 10b). The regression equation between the groundwater table and the runoff coefficient was y = −0.006x + 0.28, with a Pearson’s correlation coefficient of −0.89. Since the groundwater table increased by 3.6 m from 2003 to 2016 (Figure 3), the runoff coefficient decreased by ~0.022, which was similar to the simulation results of the model.

4. Discussion

Due to long−term extensive agricultural irrigation, the North China Plain is faced with a serious groundwater overdraft problem (Li et al., 2021), which has caused a sharp decline in the groundwater level, changing the original hydrophysical processes of the area and further affecting the relevant runoff generation mechanisms [16,17,18]. This influence of groundwater overdraft on runoff generation can be described and evaluated with the aid of hydrological models (e.g., the VIC model) [48]. This work established a hydrological modeling framework based on the VIC model, which was synergistically calibrated and validated using data for three hydrological elements (i.e., runoff, evaporation, and water storage); on this basis, the relationships among the runoff coefficient, groundwater storage, and model parameters were further analyzed using the sliding calibration method.
Applicability analysis of the VIC Model. The optimal parameters of the VIC model were determined by the synergetic calibration and validation method. The VIC model suitably reflects the changes in the hydrological processes of the southern Haihe river plain area; the model showed high estimation accuracy in simulating runoff, evaporation, and water storage compared to physical observations, both for the whole period and the sliding periods (Figure 4, Figure 5, Figure 6 and Figure 7, Table 2). When simulating runoff and evaporation for the whole period, all the NSECs were more than 0.8, all the CCs were more than 0.9, all the REs were less than 5%, and the RMSEs were small. The runoff and evaporation simulated by the VIC model were proven to be highly correlated with physical observations, as well as exhibiting low estimation errors, indicating that the calibrated model parameters were reasonable and applicable for simulating runoff and evaporation changes. As for the water storage simulation, the VIC model showed passable performance in the calibration period (CC: ~0.6) but worse accuracy in the validation period (CC: ~0.4). This is mainly because the southern plain of the Haihe river basin has been seriously influenced by intense human activities [53]. The frequent exploitation of groundwater caused the water reserves in those areas to run out. In addition, water consumption in the basin is greater than the recharge rate, causing the groundwater table to significantly increase. However, this interference of human activities with regional water storage was not considered in the VIC model; as a result, the simulated water storage was larger than the observed value using the calibrated parameters in the calibration period. Correspondingly, the CC between the simulated and the observed water storage was also low for the validation period.
The simulated runoff, evaporation, and water storage in the 10 sliding periods also showed good performance, as presented by low REs (|RE| < 8%) and RMSEs (<10) and large CCs (>0.8) (Figure 7). It should be noted that the NSEC of one sliding period (2007–2011) was negative (NSEC < 0) when slidingly simulating runoff; this is likely due to slight variations between the simulated and the observed annual runoff. Such an inconspicuous relationship between the peak and valley values of annual runoff could not be well reflected by the NSEC. In terms of the water storage simulation for different sliding periods, the water storage simulated by the VIC model was in good agreement with the observations of the GRACE satellite (CC: ~0.7). For some sliding validation periods (e.g., 2012–2016), the values for the simulations were found to be slightly higher than the observations. This is because more water storage was predicted by the VIC model due to the large rainfall input for 2016; however, the observed water storage in the same period by the GRACE satellite presented a significant decrease (Figure 3). As a result, the water storage simulated by the VIC model during the validation period was much higher than that from the GRACE satellite inversion.
Impacts of d2 on runoff generation. The most sensitive parameter for runoff generation in the VIC model, namely d2, was slidingly calibrated and validated, with the optimal 25 parameter groups chosen for each sliding window period. The average d2 gradually increased as the sliding periods increased, with the largest increment occurring for the last sliding period (2012–2016), which increased by 12% compared to the first sliding period (2003–2007). According to the observed data for water storage and the groundwater table, the largest variation also occurred in the period 2012–2016, indicating that parameter d2 responds well to changes in water storage and the groundwater table. Based on a correlation analysis of the groundwater table, water storage, and d2 (Figure 9), a significant correlation was found, as shown by the CC of −0.95 between water storage and d2, with the linear regression equation y = 0.38 − 0.0003x (y is d2 and x is water storage), and the CC of 0.98 between the groundwater table and d2, with the linear regression equation y = 0.126 + 0.017x (y is d2 and x is the groundwater table). Thus, the increasing rate of the parameter d2 can be calculated using the linear regression equations. As the water storage observed by the GRACE satellite decreased at a rate of 1.6 cm/a, and the observed groundwater increased at a rate of 0.27 cm/a (Figure 3), the parameter d2 in the VIC model increased at the rate of 0.46–0.48 cm/a under the interference of groundwater overexploitation.
Generally, the parameter d2 proved the most important parameter affecting runoff production in the VIC model, and the larger the value of d2, the larger the water capacity, indicating a lower runoff coefficient [54]. Herein, the relationship between d2 and the runoff coefficient was found to be significantly negative, with a regression equation of y = −0.33x + 0.29 (y is the runoff coefficient, x is d2), and a Pearson’s CC that reached −0.99. As mentioned above, the parameter d2 increased by ~0.06 m from 2003 to 2016; thus, the corresponding runoff coefficient was reduced by ~0.02. Meanwhile, the observed groundwater tale also showed a high correlation with the modeled groundwater table, as presented by a significant CC of −0.89 and a linear regression equation of y = −0.33x + 0.29 (y is the runoff coefficient, x is the groundwater table). Since the observed groundwater table increased by 3.6 m from 2003 to 2016, the corresponding runoff coefficient decreased by ~0.022, which was consistent with the values calculated using the parameter d2; this further verified the quantitative estimation of the impacts of the parameter d2 on the runoff coefficient.
In sum, the proposed hydrological modeling framework adopted the VIC model for the synergetic calibration and validation of runoff, evaporation, and water storage, which demonstrated good applicability for the southern Haihe river plain area. Further, the sliding calibration method was used in the framework; it explored the relationships among the groundwater table, parameter d2, and the runoff coefficient and was used to quantitatively estimate the impacts of groundwater overdraft on runoff generation. In a changing environment, this research could provide scientific guidance for distinguishing and quantifying the contributions of human activities to river streamflow changes in climate change studies, especially for agricultural plain areas with intense groundwater exploitation.
It should be kept in mind that the period covered by all the dataset series in this study was chosen as 2003 to 2016; this is relevant mainly because the groundwater level during this period decreased significantly due to intense agricultural irrigation in the North China Plain areas. However, the groundwater overdraft situation has since been alleviated due to the implementation of the South-to-North Water Diversion Project in the year 2016. Thus, the factors influencing runoff generation are now more complicated than before and need to be further identified in future studies.

5. Conclusions

This work proposed a hydrological modeling framework to quantitatively evaluate the impacts of groundwater overdraft on runoff generation. Firstly, the applicability of the VIC model was verified for the southern Haihe river plain areas, with the optimal parameters determined using the synergetic calibration method, which combined three hydrological elements, i.e., runoff, evaporation, and water storage. Secondly, the relationships among the runoff coefficient, groundwater exploitation, and model parameters were explored based on the sliding calibration scheme, particularly for the most sensitive parameter d2, both for the whole period and the sliding window periods. The major conclusions of the current work are as follows:
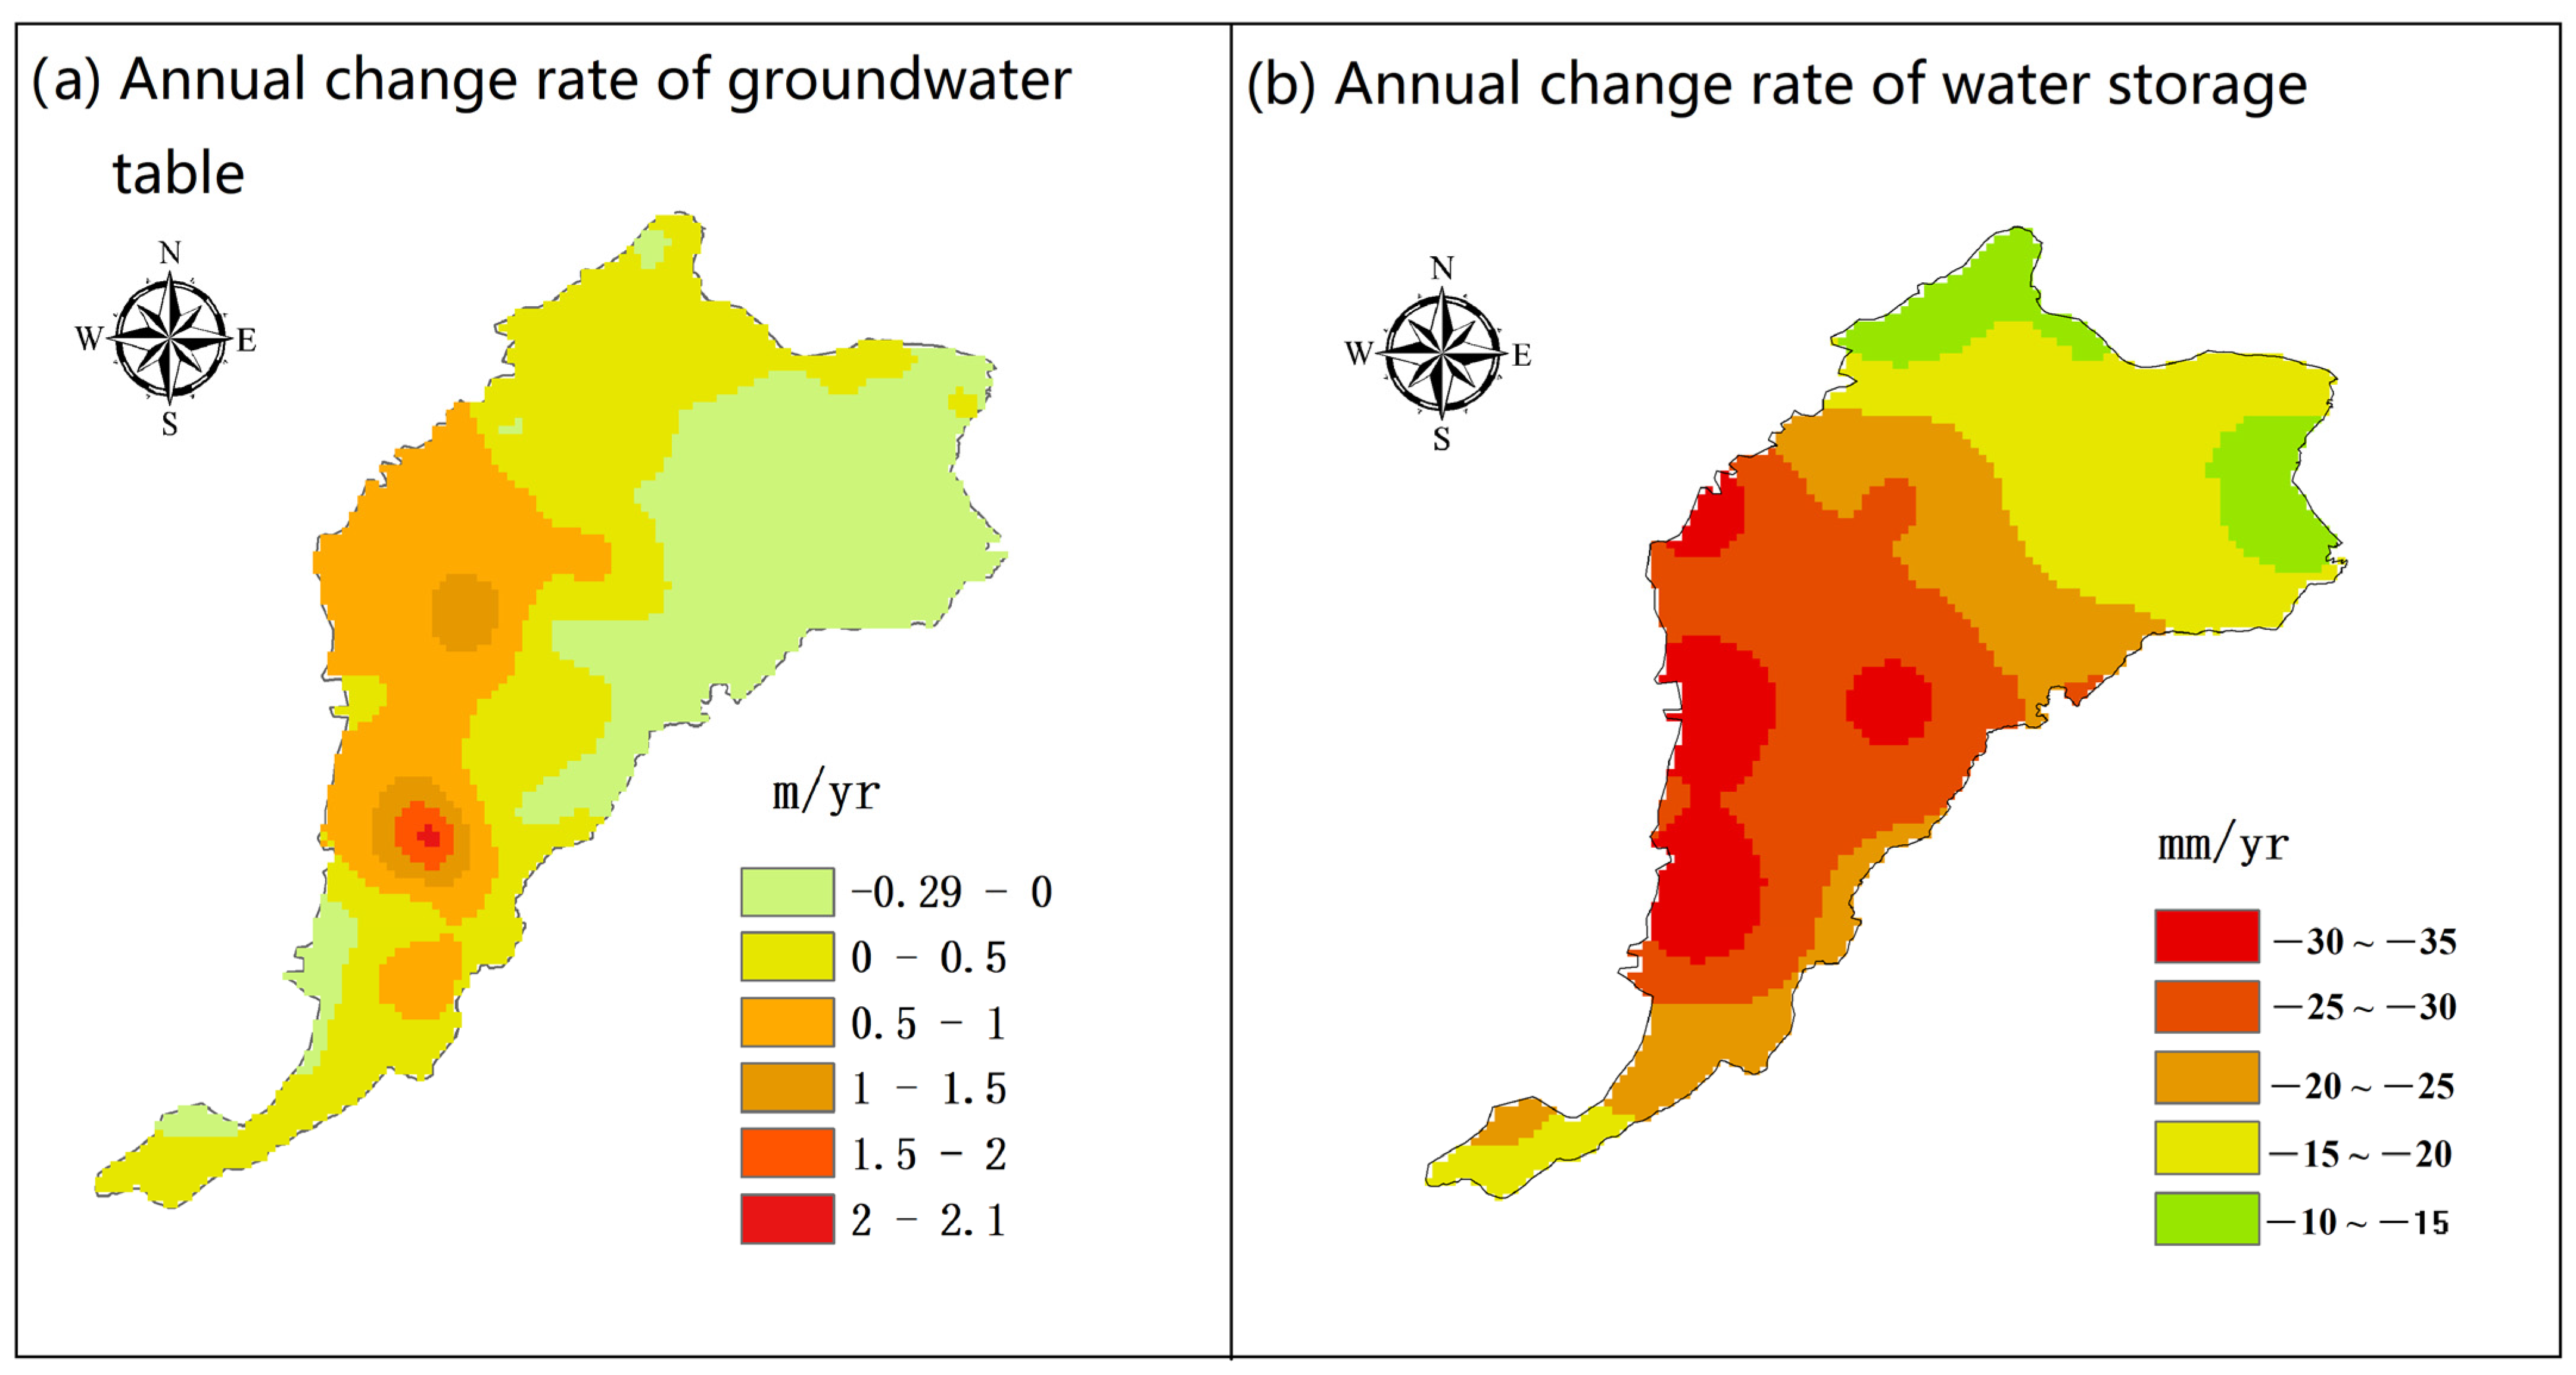
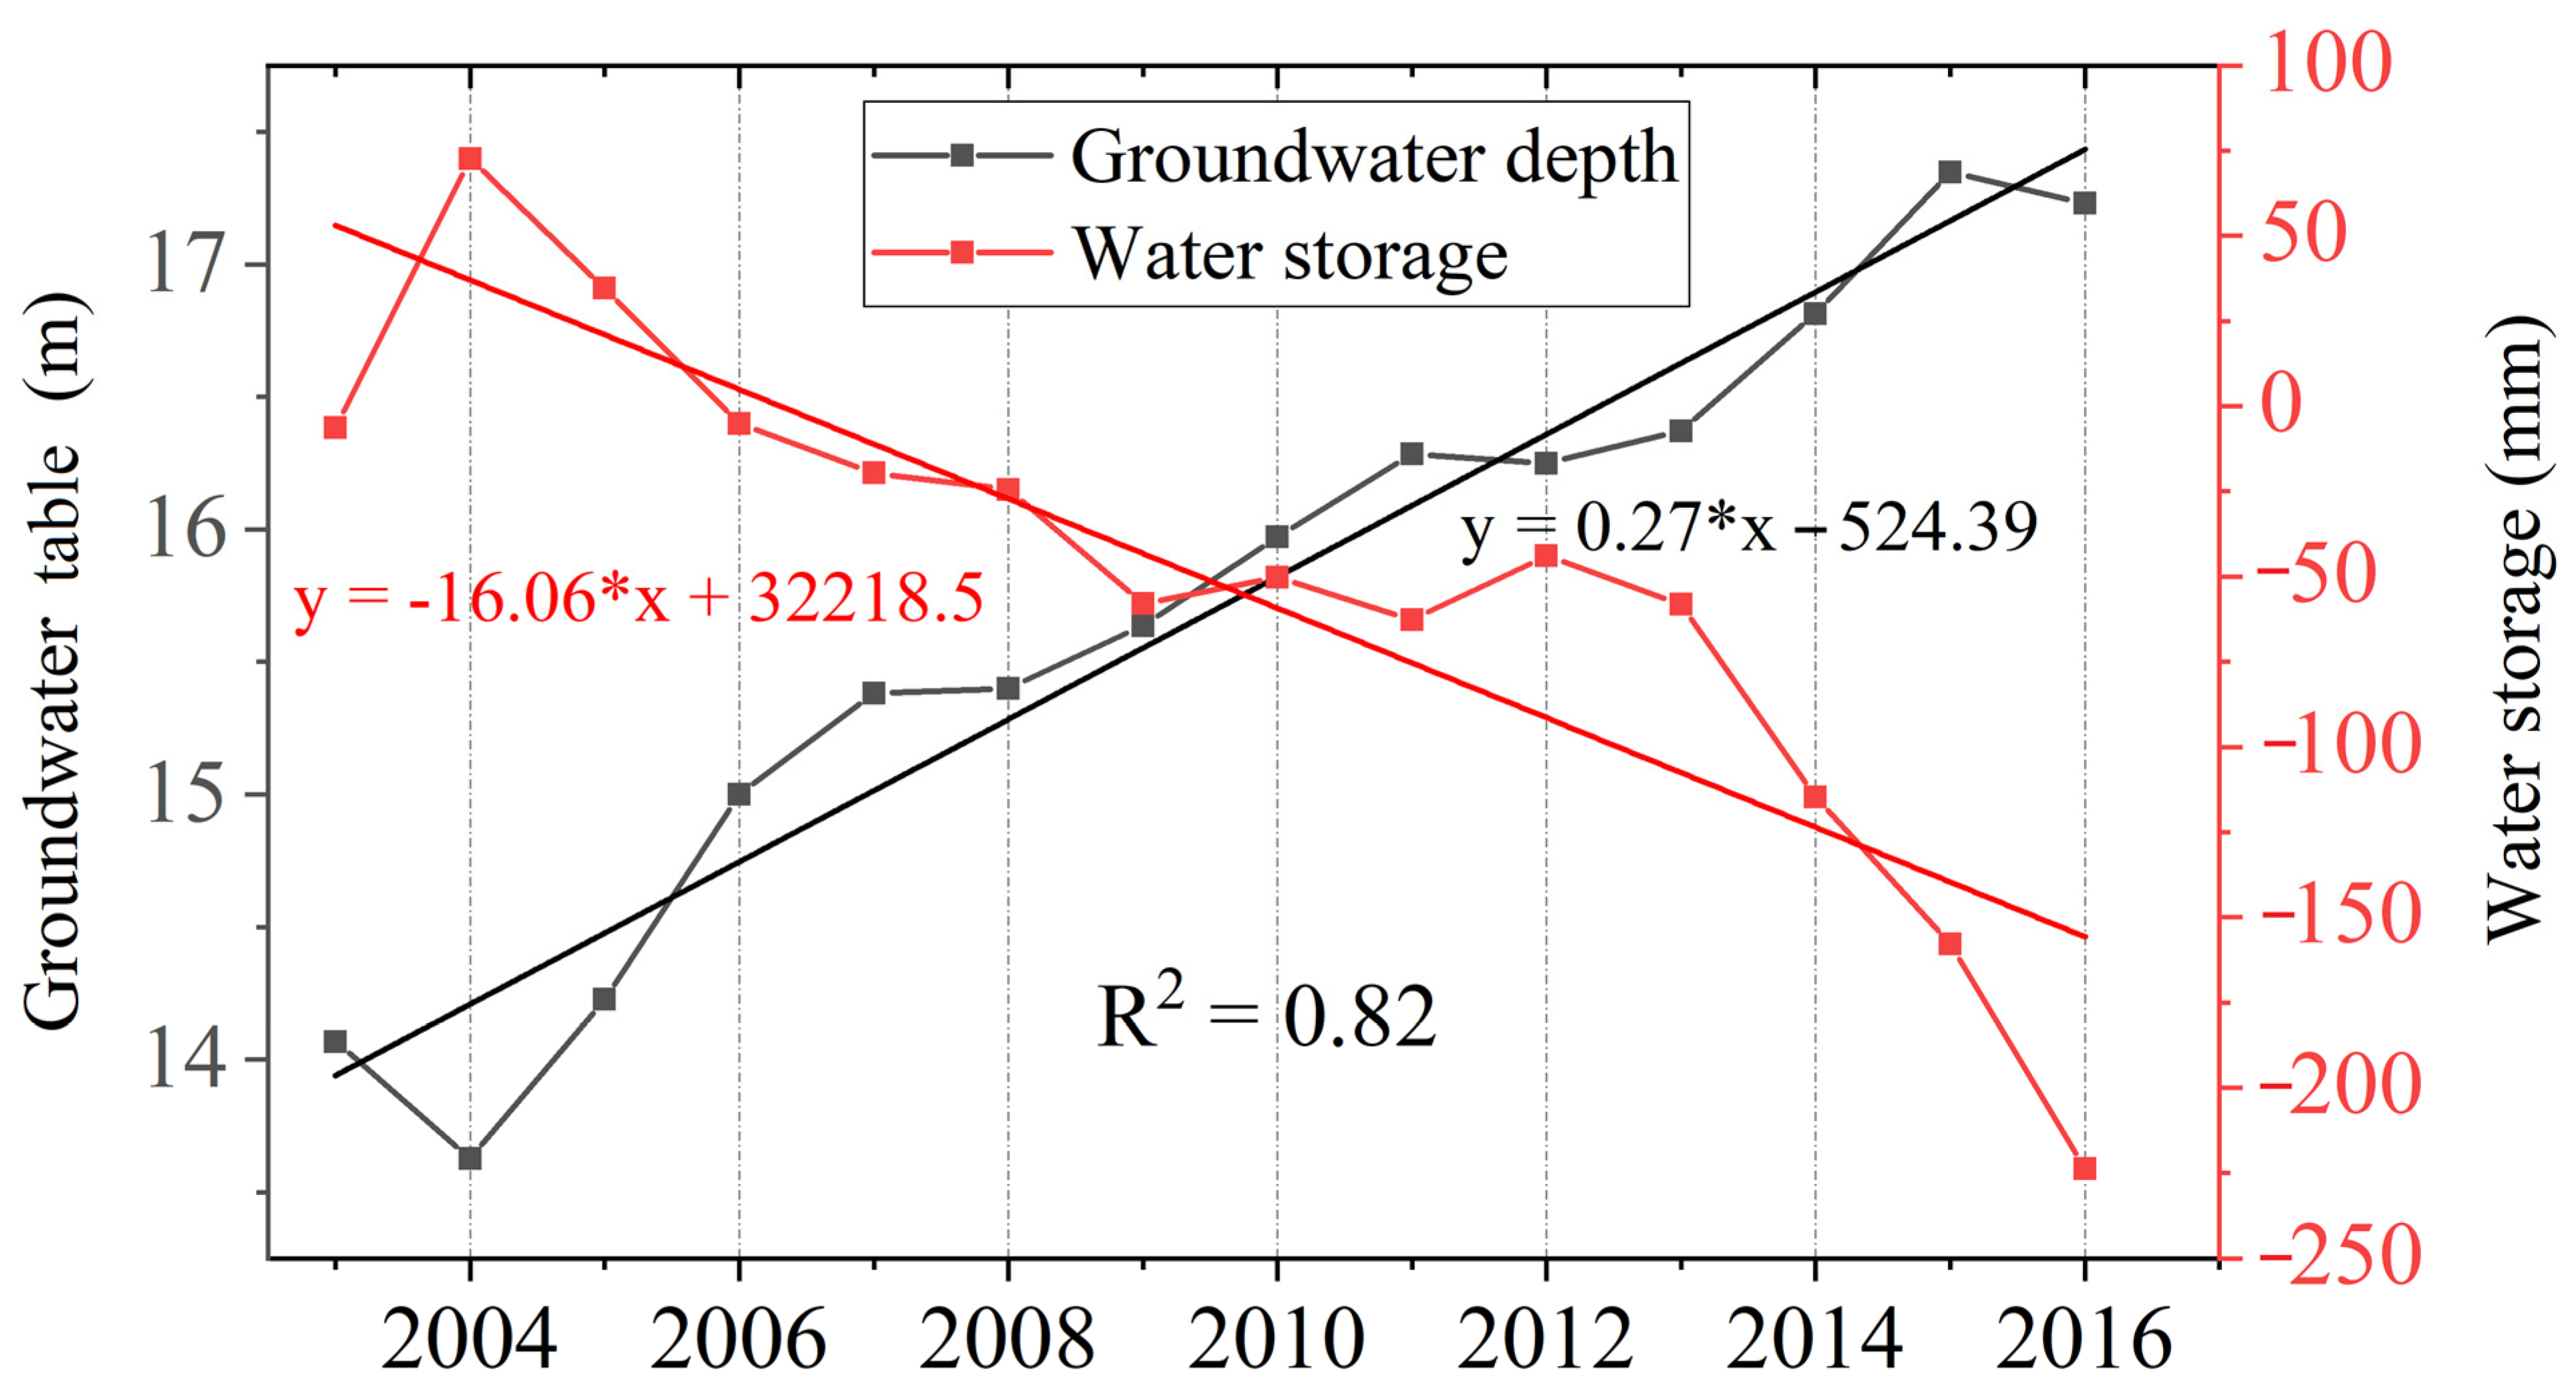
  • A remarkable decrease in water storage and the groundwater table was found in the southern plain of the Haihe river basin. The water storage decreased at the rate of 1.6 cm/a, and the groundwater table increased at the rate of 0.27 m/a. The areas with significantly increased groundwater table and decreased water storage were concentrated in the cities of Baoding, Shijiazhuang, and Xingtai, where local agricultural development is highly dependent on groundwater exploitation.
  • The VIC model showed good applicability for the southern Haihe river plain area. The three hydrological elements, i.e., runoff, evaporation, and water storage, achieved good simulation accuracy with the use of the synergetic calibration and validation method. The correlation coefficients between the simulated and observed data for evaporation and runoff were all above 0.8, the absolute value of RE was less than 8%, and the RMSE was less than 10. The correlation coefficient between the simulated and observed water storage was more than 0.6.
  • Groundwater exploitation may affect hydrophysical mechanisms and the runoff generation process. The calibrated optimal parameter d2 in the VIC model increased as the sliding window periods increased, and the average d2 gradually increased from 0.372 m to 0.415 m. Parameter d2 was also found to be highly correlated with both the groundwater table and water storage. The increased parameter d2 indicated increased soil water capacity, which decreased the runoff yield, as shown by the decrease in the runoff coefficient. From 2003 to 2016, the parameter d2 increased from 0.36 m to 0.42 m, and the runoff coefficient decreased by about 0.02.

Author Contributions

Conceptualization, Z.B.; Data curation, Y.T. and Y.M.; Formal analysis, Y.M.; Investigation, Y.Y., C.L. and H.W.; Methodology, Y.T. and H.W.; Project administration, Z.B., G.W. and C.L.; Resources, Z.B.; Software, Y.T.; Supervision, Z.B., X.S. and G.W.; Visualization, Y.T.; Writing—original draft, Y.Y.; Writing—review & editing, Y.Y. All authors have read and agreed to the published version of the manuscript.

Funding

This research was funded by the National Key Research and Development Program of China (grant number 2017YFA0605002), the National Natural Science Foundation of China (grant numbers 41961124007 and 41830863), and “Six top talents” in Jiangsu province (grant number RJFW−031). And The APC was funded by 2017YFA0605002.

Informed Consent Statement

Not applicable.

Conflicts of Interest

The authors declare no conflict of interest.

References

  1. Luo, K.; TAO, F.; Moiwo, J.; Xiao, D. Attribution of hydrological change in Heihe River Basin to climate and land use change in the past three decades. Sci. Rep. 2016, 6, 33704. [Google Scholar] [CrossRef] [PubMed] [Green Version]
  2. Karlsson, I.; Sonnenborg, T.; Refsgaard, J.; Trolle, D.; Børgesen, C.; Olesen, J.; Jeppesen, E.; Jensen, K. Combined effects of climate models, hydrological model structures and land use scenarios on hydrological impacts of climate change. J. Hydrol. 2016, 535, 301–317. [Google Scholar] [CrossRef]
  3. Yang, G.; Zhang, M.; Xie, Z.; Li, J.; Ma, M.; Lai, P.; Wang, J. Quantifying the Contributions of Climate Change and Human Activities to Water Volume in Lake Qinghai, China. Remote Sens. 2022, 14, 99. [Google Scholar] [CrossRef]
  4. Dams, J.; Nossent, J.; Senbeta, T.; Willems, P.; Batelaan, O. Multi-model approach to assess the impact of climate change on runoff. J. Hydrol. 2015, 529, 1601–1616. [Google Scholar] [CrossRef]
  5. Zhang, X.; Xu, Y.; Hao, F.; Li, C.; Wang, X. Hydrological Components Variability under the Impact of Climate Change in a Semi-Arid River Basin. Water 2019, 11, 1122. [Google Scholar] [CrossRef] [Green Version]
  6. Zhang, D.; Zhang, Q.; Qiu, J.; Bai, P.; Liang, K.; Li, X. Intensification of hydrological drought due to human activity in the middle reaches of the Yangtze River, China. Sci. Total Environ. 2018, 637, 1432–1442. [Google Scholar] [CrossRef] [PubMed]
  7. Zhang, Y.; Li, G. Influence of south-to-north water diversion on major cones of depression in North China Plain. Environ. Earth Sci. 2014, 71, 3845–3853. [Google Scholar] [CrossRef]
  8. MISRA, A. Climate change impact, mitigation and adaptation strategies for agricultural and water resources, in Ganga Plain (India). Mitig. Adapt. Strateg. Glob. Chang. 2013, 18, 673–689. [Google Scholar] [CrossRef]
  9. Wang, G.; Cheng, G.; Du, M. The Impacts of Human Activity on Hydrological Processes in the Arid Zones of the Hexi Corridor, Northwest China, in the Past 50 Years; IAHS-AISH Publication: Wallingford, CT, USA, 2003; pp. 93–103. [Google Scholar]
  10. Breg Valjavec, M.; Janža, M.; Smrekar, A. Environmental risk resulting from historical land degradation in alluvial plains considered for dam planning. Land Degrad. Dev. 2018, 29, 4227–4238. [Google Scholar] [CrossRef]
  11. Hu, S.; Liu, C.; Zheng, H.; Wang, Z.; Yu, J. Assessing the impacts of climate variability and human activities on streamflow in the water source area of Baiyangdian Lake. J. Geogr. Sci. 2012, 22, 895–905. [Google Scholar] [CrossRef]
  12. Han, S.; Tian, F.; Liu, Y.; Duan, X. Socio-hydrological perspectives of the co-evolution of humans and groundwater in Cangzhou, North China Plain. Hydrol. Earth Syst. Sci. 2017, 21, 3619–3633. [Google Scholar] [CrossRef] [Green Version]
  13. Gao, X.; Lu, C.; Luan, Q.; Zhang, S.; Liu, J.; Han, D. Mapping Farmland-Soil Moisture at a Regional Scale Using a Distributed Hydrological Model: Case Study in the North China Plain. J. Irrig. Drain. Div. Am. Soc. Civ. Eng. 2016, 142, 04016029. [Google Scholar] [CrossRef]
  14. Jiang, M.; Liu, C.; Chen, M. Quantifying potential yield and water-limited yield of summer maize in the North China Plain. In Proceedings of the Conference on Remote Sensing and Modeling of Ecosystems for Sustainability XIV, San Diego, CA, USA, 9 August 2017. [Google Scholar]
  15. Li, J.; J Cui, J.; Sui, P.; Yue, S.; Yang, J.; Lv, Z.; Wang, D.; Chen, X.; Sun, B.; Ran, M.; et al. Valuing the synergy in the water-energy-food nexus for cropping systems: A case in the North China Plain. Ecol. Indic. 2021, 127, 107741. [Google Scholar] [CrossRef]
  16. Xiao, D.; Shen, Y.; Qi, Y.; Moiwo, J.; Min, L.; Zhang, Y.; Guo, Y.; Pei, H. Impact of alternative cropping systems on groundwater use and grain yields in the North China Plain Region. Agric. Syst. 2017, 153, 109–117. [Google Scholar] [CrossRef]
  17. Davidsen, C.; Liu, S.; Mo, X.; Rosbjerg, D.; Bauer-Gottwein, P. The cost of ending groundwater overdraft on the North China Plain. Hydrol. Earth Syst. Sci. 2016, 20, 771–785. [Google Scholar] [CrossRef] [Green Version]
  18. Xiao, D.; Liu, D.; Feng, P.; Wang, B.; Waters, C.; Shen, Y.; Qi, Y.; Bai, H.; Tang, J. Future climate change impacts on grain yield and groundwater use under different cropping systems in the North China Plain. Agric. Water Manag. 2021, 246, 106685. [Google Scholar] [CrossRef]
  19. Luo, J.; Shen, Y.; Qi, Y.; Zhang, Y.; Xiao, D. Evaluating water conservation effects due to cropping system optimization on the Beijing-Tianjin-Hebei plain, China. Agric. Syst. 2018, 159, 32–41. [Google Scholar] [CrossRef]
  20. Wang, L.; Wang, Z.; Yu, J.; Zhang, Y.; Dang, S. Hydrological Process Simulation of Inland River Watershed: A Case Study of the Heihe River Basin with Multiple Hydrological Models. Water 2018, 10, 421. [Google Scholar] [CrossRef] [Green Version]
  21. Medina, Y.; Munoz, E. Analysis of the Relative Importance of Model Parameters in Watersheds with Different Hydrological Regimes. Water 2020, 12, 2376. [Google Scholar] [CrossRef]
  22. Guse, B.; Kail, J.; Radinger, J.; Schröder, M.; Kiesel, J.; Hering, D.; Wolter, C.; Fohrer, N. Eco-hydrologic model cascades: Simulating land use and climate change impacts on hydrology, hydraulics and habitats for fish and macroinvertebrates. Sci. Total Environ. 2015, 533, 542–556. [Google Scholar] [CrossRef]
  23. Beven, K.; Freer, J. Equifinality, data assimilation, and uncertainty estimation in mechanistic modelling of complex environmental systems using the GLUE methodology. J. Hydrol. 2001, 249, 11–29. [Google Scholar] [CrossRef]
  24. Yao, C.; Zhang, K.; Yu, Z.; Li, Z.; Li, Q. Improving the flood prediction capability of the Xinanjiang model in ungauged nested catchments by coupling it with the geomorphologic instantaneous unit hydrograph. J. Hydrol. 2014, 517, 1035–1048. [Google Scholar] [CrossRef]
  25. Tan, M.; Gassman, P.; Yang, X.; Haywood, J. A Review of SWAT Applications, Performance and Future Needs for Simulation of Hydro-Climatic Extremes. Adv. Water Resour. 2020, 143, 103662. [Google Scholar] [CrossRef]
  26. Priya, R.; Manjula, R. A review for comparing SWAT and SWAT coupled models and its applications. Mater. Today Proc. 2021, 45, 7190–7194. [Google Scholar] [CrossRef]
  27. Hamman, J.; Nijssen, B.; Bohn, T.; Gergel, D.; Mao, Y. The Variable Infiltration Capacity Model, Version 5 (VIC-5): Infrastructure improvements for new applications and reproducibility. Geosci. Model Dev. 2018, 11, 3481–3496. [Google Scholar] [CrossRef] [Green Version]
  28. Nanda, T.; Sahoo, B.; Chatterjee, C. Enhancing real-time streamflow forecasts with wavelet-neural network based error-updating schemes and ECMWF meteorological predictions in Variable Infiltration Capacity model. J. Hydrol. 2019, 575, 890–910. [Google Scholar] [CrossRef]
  29. Xiong, L.; Guo, S. Effects of the catchment runoff coefficient on the performance of TOPMODEL in rainfall–runoff modelling. Hydrol. Process. 2004, 18, 1823–1836. [Google Scholar] [CrossRef]
  30. Pechlivanidis, I.; Jackson, B.; Mcintyre, H.; Wheater, H. Catchment scale hydrological modelling: A review of model types, calibration approaches and uncertainty analysis methods in the context of recent developments in technology and applications. GlobalNEST Int. J. 2011, 13, 193–214. [Google Scholar]
  31. Liu, W.; Xu, Z.; Liu, L.; Li, F. Distributed hydrological simulation in the Lhasa River basin based on VIC model. Beijing Shifan Daxue Xuebao Ziran Kexueban 2012, 48, 524–529, (In Chinese with an English Abstract). [Google Scholar]
  32. Meng, C.; Zhou, J.; Dai, M.; Zhu, S.; Xue, X.; Ye, L. Variable infiltration capacity model with BGSA-based wavelet neural network. Stoch. Environ. Res. Risk Assess. 2017, 31, 1871–1885. [Google Scholar] [CrossRef]
  33. Niu, J.; Chen, J. Terrestrial hydrological features of the Pearl River basin in South China. J. Hydro-Environ. Res. 2010, 4, 279–288. [Google Scholar] [CrossRef]
  34. Bao, Z.; Zhang, J.; Liu, J.; Wang, G.; Yan, X.; Wang, X.; Zhang, L. Sensitivity of hydrological variables to climate change in the Haihe River basin, China. Hydrol. Process. 2012, 26, 2294–2306. [Google Scholar] [CrossRef]
  35. Liang, X.; Lettenmaier, D.; Wood, E.; Burges, S. A simple hydrologically based model of land surface water and energy fluxes for general circulation models. J. Geophys. Res. Atmos. 1994, 99, 14415–14428. [Google Scholar] [CrossRef]
  36. Huo, J.; Liu, L.; Zhang, Y. Comparative research of optimization algorithms for parameters calibration of watershed hydrological model. J. Comput. Methods Sci. Eng. 2016, 16, 653–669. [Google Scholar] [CrossRef]
  37. Qi, W.; Zhang, C.; Fu, G.; Sweetapple, C.; Liu, Y. Impact of robustness of hydrological model parameters on flood prediction uncertainty. J. Flood Risk Manag. 2019, 12, e12488. [Google Scholar] [CrossRef] [Green Version]
  38. Song, X.; Zhang, J.; Zhan, C.; Xuan, Y.; Ye, M.; Xu, C. Global sensitivity analysis in hydrological modeling: Review of concepts, methods, theoretical framework, and applications. J. Hydrol. 2015, 523, 739–757. [Google Scholar] [CrossRef] [Green Version]
  39. Chen, H.; Zhu, G.; Shang, S.; Qin, W.; Zhang, Y.; Su, Y.; Zhang, K.; Zhu, Y.; Xu, C. Uncertainties in partitioning evapotranspiration by two remote sensing-based models. J. Hydrol. 2022, 604, 127223. [Google Scholar] [CrossRef]
  40. Jin, X.; Jin, Y. Calibration of a Distributed Hydrological Model in a Data-Scarce Basin Based on GLEAM Datasets. Water 2020, 12, 897. [Google Scholar] [CrossRef] [Green Version]
  41. Chao, L.; Zhang, K.; Wang, J.; Feng, J.; Zhang, M. A Comprehensive Evaluation of Five Evapotranspiration Datasets Based on Ground and GRACE Satellite Observations: Implications for Improvement of Evapotranspiration Retrieval Algorithm. Remote Sens. 2021, 13, 2414. [Google Scholar] [CrossRef]
  42. Davood, M.; Sadegh, S.; Zahra, K.; Carla, S.; Bagher, Z. Spatio-Temporal Assessment of Global Gridded Evapotranspiration Datasets across Iran. Remote Sens. 2021, 13, 1816. [Google Scholar]
  43. Zhang, R.; Zhu, L.; Ma, Q.; Chen, H.; Liu, C.; Zubaida, M. The consecutive lake group water storage variations and their dynamic response to climate change in the central Tibetan Plateau. J. Hydrol. 2021, 601, 126615. [Google Scholar] [CrossRef]
  44. Liu, B.; Zou, X.; Yi, S.; Sneeuw, N.; Cai, J.; Li, J. Identifying and separating climate- and human-driven water storage anomalies using GRACE satellite data. Remote Sens. Environ. 2021, 263, 112559. [Google Scholar] [CrossRef]
  45. Zhong, Y.; Zhong, M.; Mao, Y.; Ji, B. Evaluation of Evapotranspiration for Exorheic Catchments of China during the GRACE Era: From a Water Balance Perspective. Remote Sens. 2020, 12, 511. [Google Scholar] [CrossRef] [Green Version]
  46. Hu, L.; Jiao, J. Calibration of a large-scale groundwater flow model using GRACE data: A case study in the Qaidam Basin, China. Hydrogeol. J. 2015, 23, 1305–1307. [Google Scholar] [CrossRef]
  47. Tangdamrongsub, N.; Han, S.; Tian, S.; Müller, S.; Sutanudjaja, E.; Ran, J.; Feng, W. Evaluation of Groundwater Storage Variations Estimated from GRACE Data Assimilation and State-of-the-Art Land Surface Models in Australia and the North China Plain. Remote Sens. 2018, 10, 483. [Google Scholar] [CrossRef] [Green Version]
  48. Bai, P.; Liu, X.; Liu, C. Improving hydrological simulations by incorporating GRACE data for model calibration. J. Hydrol. 2018, 557, 291–304. [Google Scholar] [CrossRef]
  49. Zou, J.; Zhan, C.; Zhao, R.; Qin, P.; Hu, T.; Wang, F. Impacts of Water Consumption in the Haihe Plain on the Climate of the Taihang Mountains, North China. Adv. Meteorol. 2018, 2018, 6280737. [Google Scholar] [CrossRef] [Green Version]
  50. Su, Y.; Guo, B.; Zhou, Z.; Zhong, Y.; Min, L. Spatio-Temporal Variations in Groundwater Revealed by GRACE and Its Driving Factors in the Huang-Huai-Hai Plain, China. Sensors 2020, 20, 922. [Google Scholar] [CrossRef] [Green Version]
  51. Wood, E.; Lettenmaier, D.; Zartarian, V. A Land-surface hydrology parameterization with subgrid variability for general circulation models. J. Geophys. Res. 1992, 97, 2717–2728. [Google Scholar] [CrossRef]
  52. Qiu, G.; Zhang, X.; Yu, X.; Zou, Z. The increasing effects in energy and GHG emission caused by groundwater level declines in North China’s main food production plain. Agric. Water Manag. 2018, 203, 138–150. [Google Scholar] [CrossRef]
  53. Huang, Z.; Pan, Y.; Gong, H.; Yeh, P.; Li, X.; Zhou, D.; Zhao, W. Subregional-scale groundwater depletion detected by GRACE for both shallow and deep aquifers in North China Plain. Geophys. Res. Lett. 2015, 42, 1791–1799. [Google Scholar] [CrossRef]
  54. Bao, Z.; Zhang, J.; Liu, J.; Wang, G.; Fu, G.; He, R.; Yan, X. Base flow parameter estimation framework of VIC model based on soil properties. Shuikexue Jinzhan 2013, 24, 169–176, (In Chinese with an English Abstract). [Google Scholar]
Figure 1. Locations of the study area, meteorological stations, and elevation information.
Water 14 01758 g001
Figure 2. Spatial variations in the groundwater table (a) and water storage (b) in the southern Haihe river plain.
Water 14 01758 g002
Figure 3. Temporal variations in the groundwater table and water storage in the southern Haihe river plain.
Water 14 01758 g003
Figure 4. Runoff simulation by the VIC model both in the whole period (k) and the ten sliding window periods (aj).
Water 14 01758 g004
Figure 5. Evaporation simulation by the VIC model both in the whole period (k) and the ten sliding window periods (aj).
Water 14 01758 g005
Figure 6. Water storage simulation by the VIC model both in the whole period (k) and the ten sliding window periods (aj).
Water 14 01758 g006
Figure 7. Distribution box diagrams of the model performance metrics for three hydrological elements (i.e., runoff, evaporation, and water storage) for the ten sliding window periods. Four statistical metrics were as presented as (a) RE, (b) RMSE, (c) CC, and (d) NSEC, respectively.
Water 14 01758 g007
Figure 8. Distribution box diagrams of the VIC model parameter d2 calibrated for different sliding window periods. (Note that only the optimal 25 d2 parameters were chosen and plotted in the box diagram for each sliding period).
Water 14 01758 g008
Figure 9. Correlation analysis of water storage, groundwater table depth, and the parameter d2 (a,b), together with their variation trends for different sliding periods (c).
Water 14 01758 g009
Figure 10. Relationship between the runoff coefficient and the parameter d2 (a) and groundwater table depth (b). (Note that the red line indicates the linear regression trend line).
Water 14 01758 g010
Table 1. Summary of input data for driving the VIC model.
DataData Sources/LinksData DescriptionResolution
Meteorological driven dataChina meteorological data network (https://data.cma.cn/ (accessed on 17 October 2020.))70a daily meteorological data of 699 meteorological stations in ChinaSite data
DEM Geo-spatial data cloud (http://www.gscloud.cn/ (accessed on 6 September 2021))SRTMDEM digital elevation data90 m
Land coverUniversity of Maryland global land cover datasetGlobal land cover data1 km
Soil propertyScientific center for dry regions in cold regions (http://westdc.westgis.ac.cn/ (accessed on 6 September 2021))Chinese soil data set based on the World Soil Database5 km
Table 2. Overall VIC model performance in simulating runoff, evaporation, and water storage for the whole period over the southern Haihe river basin plain. (Note that ** indicates p < 0.01 and * indicates p < 0.05).
Hydrological ElementsPerformance Metrics for the Calibration Period (2003–2012)Performance Metric Indicators for the Validation Period (2013–2016)
NSECCCRE/%RMSENSECCCRE/%RMSE
Runoff 0.870.97 **−0.299.060.820.94 **−5.3210.66
Evaporation0.950.98 **0.386.30.950.98 **0.696.15
Water storage0.56 * 0.4 *
Publisher’s Note: MDPI stays neutral with regard to jurisdictional claims in published maps and institutional affiliations.

