Article

Evaluating the Influence of Deficit Irrigation on Fruit Yield and Quality Indices of Tomatoes Grown in Sandy Loam and Silty Loam Soils

1
College of Water Conservancy and Civil Engineering, South China Agriculture University, Guangzhou 510070, China
2
Department of Agricultural Engineering, School of Agriculture, University of Cape Coast, Cape Coast PMB TF0494, Ghana
3
National Center for International Collaboration Research on Precision Agricultural Aviation Pesticides Spraying Technology (NPAAC), College of Engineering, South China Agriculture University, Guangzhou 510642, China
4
College of Agronomy and Biotechnology, China Agricultural University, Beijing 100193, China
5
College of Food Science, South China Agricultural University, Guangzhou 510070, China
6
Guangdong Engineering Research Center for Agricultural Aviation Application (ERCAAA), College of Engineering, South China Agricultural University, Guangzhou 510642, China
*
Author to whom correspondence should be addressed.
Water 2022, 14(11), 1753; https://doi.org/10.3390/w14111753
Submission received: 14 March 2022 / Revised: 5 April 2022 / Accepted: 9 April 2022 / Published: 30 May 2022
(This article belongs to the Special Issue Insight into Drip Irrigation)

Abstract

:
The most important biotic stress factor impacting tomato crop biophysical, biochemical, physiological, and morphological features is water stress. A pot experiment was undertaken in a greenhouse to study the drought responsiveness of tomato (Solanum lycopersicum) yield and quality indices in sandy loam and silty loam soils. For both sandy loam and silty loam soils, the water supply levels were 70–100% FC, 60–70% FC, 50–60% FC, and 40–50% FC of ETo (crop evapotranspiration) from the vegetative stage to the fruit ripening stage, calculated using the Hargreaves–Samani (HS) model compared to the time-domain reflectometer (TDR) values calibrated using volumetric water content (VWC). The experiment was conducted as a 2 × 4 factorial experiment, arranged in a completely randomized block design, with four treatments replicated four times. In this study, we examined how sandy loam and silty loam soils at different % FC affect the total marketable yield and quality components of tomatoes, concentrating on total soluble solids (Brix), fruit firmness, dry fruit mass, pH, titratable acid (TA), ascorbic acid (Vit. C), and carotenoid composition. Lycopene and β-Carotene were estimated using the UV spectroscopy method, with absorption spectra bands centered at 451 nm, 472 nm, 485 nm, and 502 nm. The results revealed that even though there were some limitations, TDR-based soil moisture content values had a strong positive correlation with HS-based evapotranspiration, with R2 = 0.8, indicating an improvement whereby TDR can solely be used to estimate soil water content. Tomato plants subjected to 40–50% FC (ETo) water stress in both sandy loam and silty loam soils recorded the highest total soluble solids, titratable acidity, ascorbic acid content, and β-carotene content at an absorption peak of 482 nm, and lycopene content at an absorption peak of 472 nm, with lower fruit firmness, fruit juice content, and fruit juice pH, and a reduced marketable yield. Similarly, tomato plants subjected to 60–70% FC throughout the growing season achieved good fruit firmness, percent juice content, total soluble solids, titratable acidity, ascorbic acid content, and chlorophyll content (SPAD), with minimum fruit juice pH and high marketable yield in both soil textural types. It is concluded that subjecting tomato plants to 60–70% FC (ETo) has a constructive impact on the marketable yield quality indices of tomatoes.

1. Introduction

Tomatoes (Solanum lycopersicum) are perennial crops but are grown as annual crops. The tomato plant belongs to the Solanaceae family, along with potato, eggplant, and many others. In China, tomatoes were likely introduced in the 1500s from the Philippines or Macau. They were given the name fānqié, as the Chinese named many foodstuffs introduced from abroad, referring specifically to early introductions [1]. Tomatoes are high in carotenoids (primarily lycopene), ascorbic acid, carotene, lutein, and phytoene, and contain roughly 95% water, 2% fiber, and from 4% to 9% fruit Brix [2]. Tomatoes are important components of human diets because of their high antioxidant content and nutritional value (acids, fats, amino acids, and carotenoids) [3]. Tomatoes are abundant in additional bioactive substances such phenolics, vitamin C, and provitamin A, which are thought to protect against and possibly prevent cancer [2]. Lycopene is the major carotenoid found in tomato fruits [4]. It accumulates as an orange-red pigment in the final ripening period, contributing somewhat more than 80% of the total carotenoid concentration. Some authors [5] define lycopene as polyunsaturated hydrocarbon bioactive components found in red fruit and veggies (papayas, tomatoes, red peppers, and watermelons) that belong to the tetraterpene carotenoid family. Like any other carotenoid, lycopene has strong in vitro and in vivo antioxidant properties [6]. However, carotenoids such as total phenolic contents, ascorbic acid, β-carotene and α-carotene, and total flavonoids are active compounds in tomatoes, and these have captured the interest of many researchers because of their biochemical and physicochemical properties, especially the natural and active antioxidant compounds and the health benefits that they provides to humans. Ascorbic acid is an active antioxidant which is an essential phytochemical component in the tomato fruit. In tomatoes, the level of antioxidant is highly affected by variety, as well as agronomical and environmental factors such as temperature, light, and water stress conditions throughout the growth of the plant [6,7,8,9,10]. The most perilous environmental factor that affects the physicochemical, biochemical, and biophysical properties of tomato crops is water stress. According to Klunklin and Savage [4], insufficient water supply severely influences water use efficiency, photosynthesis, plant growth, and fruit quality. In most cases, plants adjust to water stress conditions by disordering the normal metabolic pathways of plant functions as an adoptive mechanism to combat water stress [11,12,13,14]. The physiology of tomatoes and the synthesis of secondary metabolites are both affected by water stress if the stress is prolonged or occurs at the early stages of the reproductive phase [15,16,17]. On the other hand, water stress, may improve tomato fruit quality by increasing total soluble solids (sugars, amino acids, and organic acids), which are important molecules during the ripening stage [18,19]. According to Klunklin and Savage [4], total soluble solids increase the value of fresh tomato fruits, improve their quality and market value due to their sweet flavor, and reduced water content.
Water stress in tomatoes can cause meagerness in crop yield and yield quality. The timely and precise identification of crop water status saves water and optimizes yield quantity and quality. Timely crop water stress measurement allows for good irrigation decision making. Many techniques are available for crop water stress detection, but few of them are user-friendly, labor conservative, accurate, and non-destructive when used in greenhouse irrigation management. According to Helyes et al. [20], the accurate detection of crop water status through physiological crop examination methods, such as stomatal conductance, transpiration rate, and relative leaf water content, is essential, but their operation demands specialized knowledge. However, ground-based hyperspectral remote sensing and the use of a crop water stress index (CWSI) offer a satisfactory solution for tracking plant water stress situations using thermography data, thereby providing precise and timely temporal and spatial information for accurate crop water stress measurements and diagnosis for use in greenhouse tomato production [20,21,22]. Based on leaf temperature, the CWSI is the most often used indicator to diagnose agricultural water deficiencies. CWSI was created as a conventional indicator to detect stress and overcome the impacts of other environmental elements that alter the stress–plant temperature relationship [20,21,22]. The CWSI is commonly calculated using empirical methods that relate the leaf–air temperature differential (Tc-Ta) to a non-water-stressed baseline’s air vapor pressure deficit. Since the early 1980s, the CWSI has been successfully used to generate irrigation plans for various crops in various countries [12,23,24]. Recently, most researchers have measured the temperature of various crops such tomato, wheat, soybean, Bermuda grass, and cabbage leaves under various irrigation regimens, developing a CWSI model to track crop water status in real time [25,26]. The approach must be farmer-friendly and as simple as possible to be used in precision agricultural systems [27]. According to the literature, there is currently a major knowledge gap between collecting and extracting UAV-based TIR data and then assuring that this data can be transformed into biologically meaningful knowledge at the individual plant level to benefit farmers [21,27,28]. CWSI computed from thermographic data obtained by a hyperspectral camera or from temperature data is practicable for estimating water stress in tomatoes [13,29,30,31]. The aim of this research seeks to investigate (1) how different soil types and field capacity affect the yield, firmness, soluble solids content, pH, titration acid, ascorbic acid, β carotene, and lycopene concentrations of tomatoes, and (2) the best irrigation scheduling method appropriate for tomatoes in each soil type. This study has proven beyond a doubt that reducing soil field capacity by 40% and maintaining it throughout the plant growth season saves water and improves tomato yield and fruit quality indices.

2. Materials and Methods

2.1. Experimental Site and Procedure

This research was carried out at the Tea Research Institute of the Guangdong Academy of Agricultural Sciences, South China Agricultural University, in Guangzhou, China, from September 2020 to March 2021. The research site is located between latitude 23°157′826″ N and longitude 113°350′668″ E, with an elevation of 11 m above sea level. The climate of the region is subtropical monsoon. A simple arc, 120 sqm greenhouse was employed, which was covered with a 150 micron polyethylene sheet to ensure uniform light distribution throughout the greenhouse. To manage weeds, minimize waterlogging, and improve light reflection for maximum photosynthesis, the greenhouse floor was covered with white woven polyethylene. A Randomized Complete Block Design (RCBD) in a 2×4 factorial experiment was used as shown in Table 1. Tomato (cv. xiang sheng) is an indeterminate type with normal leaf type, and which can grow to a height of 6.6 ft. The fruit is a flattened globe with an average fruit weight of 350 g and having a deep red fruit color. The tomato seeds were nursed and transplanted three weeks after emergence, then trellised with black nylon rope to allow the plants to stand upright. The plants were spaced at 30 cm × 70 cm apart from each other and pruned to three stems to improve aeration and reduce fungal growth. Two weeks after transplanting, the plants were subjected to four water stress treatments: 70–100% FC, 60–70% FC, 50–60% FC, and 40–50% FC of ETo.

2.2. Soil and Water Quality Data

Sandy and silty loam soils where the two textural types used in this experiment. These soil samples were collected from the South China Agricultural University crop research farm. Soils were sampled before treatment allocation from the surface horizon to a depth of 0–30 cm to estimate the general physical and chemical properties of both soil textural types in each pot. The physical and chemical properties of the soil were analyzed using standardized methods. The results of these properties are shown in Table 2 and Table 3. Irrigation water quality measurements were conducted, and the results revealed that the water was of good quality during the irrigation season, with an average electrical conductivity (EC) of 2.0, using time-domain reflectometry (IMKO. TRIME. PICO TDR HD2 64 by Micromodultecnik GMBH, Montabaur, Germany) and a pH of 5.6, using a glass electrode (pH meter) by Shanghai Chunye Instrument Technology, Shanghai, China.

2.3. Irrigation Water Application

The flow rates of the irrigation water were calibrated in the field using a gravity-driven drip irrigation system with a 1.2 L/h output. The soil field capacity was assessed using soil moisture sensors TDR, and the water stress treatment was conducted based on the results of the TDR calibrated with the volumetric water content of the field and validated with ETo, calculated using the HS model in the greenhouse. To evaluate the soil moisture content before irrigation water application, TDR, which is a high-precision measuring device with a probe length of 16 cm, probe diameter of 6 mm, and spacing of 40 mm, was used to sense soil moisture content and electrical conductivity (Ec) every 12 h before and after irrigating by inserting the probe vertically into the soil at a depth of 16 cm from the soil surface. The volume of water applied to the soil to bring the soil back to field capacity was calculated based on the resulting equation using [32,33]
I = Q + S W C A W C × D S M A × 1000
I denotes the irrigation water in (mm), Q is the water for ponding (mm), SWC is the saturated water content (%), AWC is the actual water content of the soil when irrigating (%), and DSM is the soil dry mass (kg). The calculation indicates A as the area of a truncated cone (mm2).
A = π R 2 + r 2 + π R + r h 2 + R r 2
R is the bottom base’s radius, r is the top base’s radius, and h is the truncated cone’s slant height. A drip irrigation system was used to apply high-quality irrigation water. Based on the soil percent FC, water stress treatment was started two weeks after transplanting.

2.4. Evapotranspiration Estimation (Hargreaves Model)

In this work, the Hargreaves model was used to measure evaporative loss (ETo). To determine ETo, using the Hargreaves–Samani model, daily air temperature range, maximum air temperature, minimum air temperature, mean air temperature, and solar radiance Ra were estimated, as proposed by [34,35,36]. The Hargreaves model is one of the most efficient ETo models tested for the calculation of evapotranspiration in greenhouses, as it only requires two easily accessible parameters: temperature and solar energy. The Hargreaves model can be shown in Equation (3).
E T o = 1 λ 0.0023 T m e a n + 17.8 ( T m a x T m i n ) 0.5   R a
where:
  • ETo—anticipated daily evapotranspiration in millimeters per day (mm/day)
  • Λ—Latent heat of vaporization (MJ kg−1)
  • Ra—Solar radiation (MJ m−2 day−1)
  • Tmax—Maximum daily air temperature (°C)
  • Tmin—Minimum daily air temperature (°C)
  • Tmean—Mean daily air temperature (°C)

2.5. Data Collection

2.5.1. Biomass, Chlorophyll, Fruit Bottom Temperature, and Marketable Yield Measurement

A handheld Konica Minolta SPAD 502 obtained from Hangzhou Mindfull Technology Co. Ltd, Hangzhou, China was used to determine the amount of chlorophyll in the leaves. At each growing stage of the tomato, SPAD measurements were taken on the newest completely grown leaf. On all plants, a reading was taken on a selected leaf at a location half the length of each leaf and halfway between the leaf edges [37,38,39]. A Raytek® handheld, non-contact infrared thermometer with an emissivity of 0.95 Wm−2 and a display resolution of 0.2–0.5 °C produced by Raytek company ltd., Wilmington, CA, USA, was used to monitor the temperature of the tomato fruit bottom. After tomato fruits were picked, sorted, and weighed on an electronic platform scale, the dry biomass of the fruit and the total marketable yield (t/ha) were recorded. To determine the fruit dry matter, all the fruits produced by each plant within each treatment were gathered, and samples (4 kg) for the analysis were taken from each sample per treatment. The fresh fruit was weighed and the dry matter content was determined by drying sliced fruit samples at 40 °C for 96 h in a ventilated oven. The average dry matter content of these sliced fruits provided an accurate estimate of the total dry matter content of the fruit. To evaluate the above-ground dry biomass and root biomass, shoots and roots were harvested from the sampling plants from each treatment in both soil types (sandy loam and silty loam). The dry biomass was quantified using the American Association of Analytical Chemists (AOAC) method 935.10, which involved drying the biomass overnight at 105 °C [40].

2.5.2. Fruit Quality Characteristics Induced by Water Stress

The growing cycle of the tomato crop ended on 25 March 2021. Fruits were sorted into marketable and non-marketable fruits immediately after harvesting. The fruits’ firmness was measured by a GY-1 penetrometer produced by Tsingtao Toky Instruments Co.,Ltd, Qingdao, China, on three discs of the skin surface from the equatorial fruit area for peeled and unpeeled fruits [27,41]. Then, 2 kg of marketable tomato fruits were homogenized using a (Joyoung JYL-C19V) electric multifunctional juicer by Jiuyang technology, Guangzhou, China. To assess total soluble solids, homogenized tomato juice was squeezed onto the main prism assembly of a digital refractometer (PR-100, Tokyo, Japan) (TSS) and the value was observed through the eyepiece. Method 932.12 of the AOAC was used to calculate the values in Brix according to the American Organization for the Advancement of Science, Washington, DC, USA, 2005. A pH meter was used to check the pH of the homogenized tomatoes (CH-8603, Mettler-Toledo GmbH, Schwerzenbach, Switzerland) [41]. Colorimetric analysis was used to determine ascorbic acid (vitamin C) levels [3,6,42]. UV spectroscopy was used to determine the levels of carotene and lycopene [6,43]. Initially, the method of linearity for the various wavelengths (451 nm, 472 nm, 485, and 502 nm) for the determination of lycopene and β-carotene was performed in a range of 0–25 ppm, revealing R2 = 0.9988 for all the individual wavelength, with y= 0.241x + 0.002, y = 0.281x + 0.0031, y = 0.0282x + 0.0029, and y = 0.0255x + 0.0008, respectively this is shown in Figure 1.

2.5.3. Extraction Solvents

In these tests, the following elution solvents were used: water, methanol, 96% ethyl acetate, 4% water; 86% acetonitrile, 10% water, 4% formic acid. At room temperature, the separations were carried out using a 35-min linear gradient (10% C + 90% D) and a 55-min linear gradient (100%). The flow rate was 1.5 mL/min, and the retention time was 69 min, with lycopene and carotene detection at 451 nm, 472 nm, 485, and 502 nm. The precision of the replicates was below 5% [44,45].

2.5.4. Apparatus

A UV-Vis SPECORD M400 spectrophotometer with a microprocessor and twin-beams produced by Nanbei Instrument Limited at Zhengzhou, China was used for the spectral analysis. The wavelengths varied from 185 to 900 nm. Infrared spectroscopy using the Fourier transform (FT-IR) [45] was also used. A Perkin Elmer Spectra GX spectroscopy with a potassium bromide beam splitter and a vacuum distillation triglycine sulfate (DTGS) detector produced by Perkin Elmer (Woodbridge, ON, Canada) was used to obtain all of the measurements. The Attenuated Total Reflectance (ATR) accessory featured a 3-reflection diamond crystal plate, which delivered a 3-fold enhancement in sample responsiveness over a standard single-reflection crystal plate (Pike Technologies, Fitchburg, MA, USA) [43]. A total of 400–4000 pictures were collected for each spectrum at a spectral resolution of 4 cm−1 and 32 scans. When used with a powdered pure substance, the drift accessory allows for a more precise and straightforward evaluation. DRIFT spectra were transformed to Kubelka–Munk spectra on a KBr backdrop. Total Reflection Infrared Spectroscopy with Attenuated Reflection as also used. A diamond-ZnSe ATR crystal (Pike Technologies, Fitchburg, MA, USA) was used to capture mid-infrared spectra in the range of 650 to 4000 cm−1 in a nine-reflection setup. On the surface of the ATR crystal, 2–3 mg of tomato samples were deposited (diameter, 0.5 mm2). A total of 32 scans, with a spectral resolution of 4 cm−1, yielded four spectra for each sample. The averaged spectra were used in subsequent analyses.

2.5.5. Lycopene Extraction

To isolate lycopene from the tomato products, researchers employed the following method: 50 mL methanol, 1 g calcium bicarbonate, and 5 g elite were used to standardize 5 g of tomato puree. The material was then purified with Whatman no. 1 and no. 42 filter sheets. Lycopene was obtained using a hexane:acetone (1:1, v/v) sample and a UV spectrophotometer, quantified in mg/100 g FW at 451 nm, 472 nm, 485, and 502 nm [6,45].

2.6. Analyzed Data

The differences among treatments in a completely randomized design were determined using a factorial evaluation with two soil types and four water stress treatments. All parameters were evaluated using one-way analysis of variance (ANOVA) in IBM SPSS statistic 21, and Fisher’s Least Significant Difference was used to identify significant differences among treatments at * p < 0.05 significant levels.

3. Results

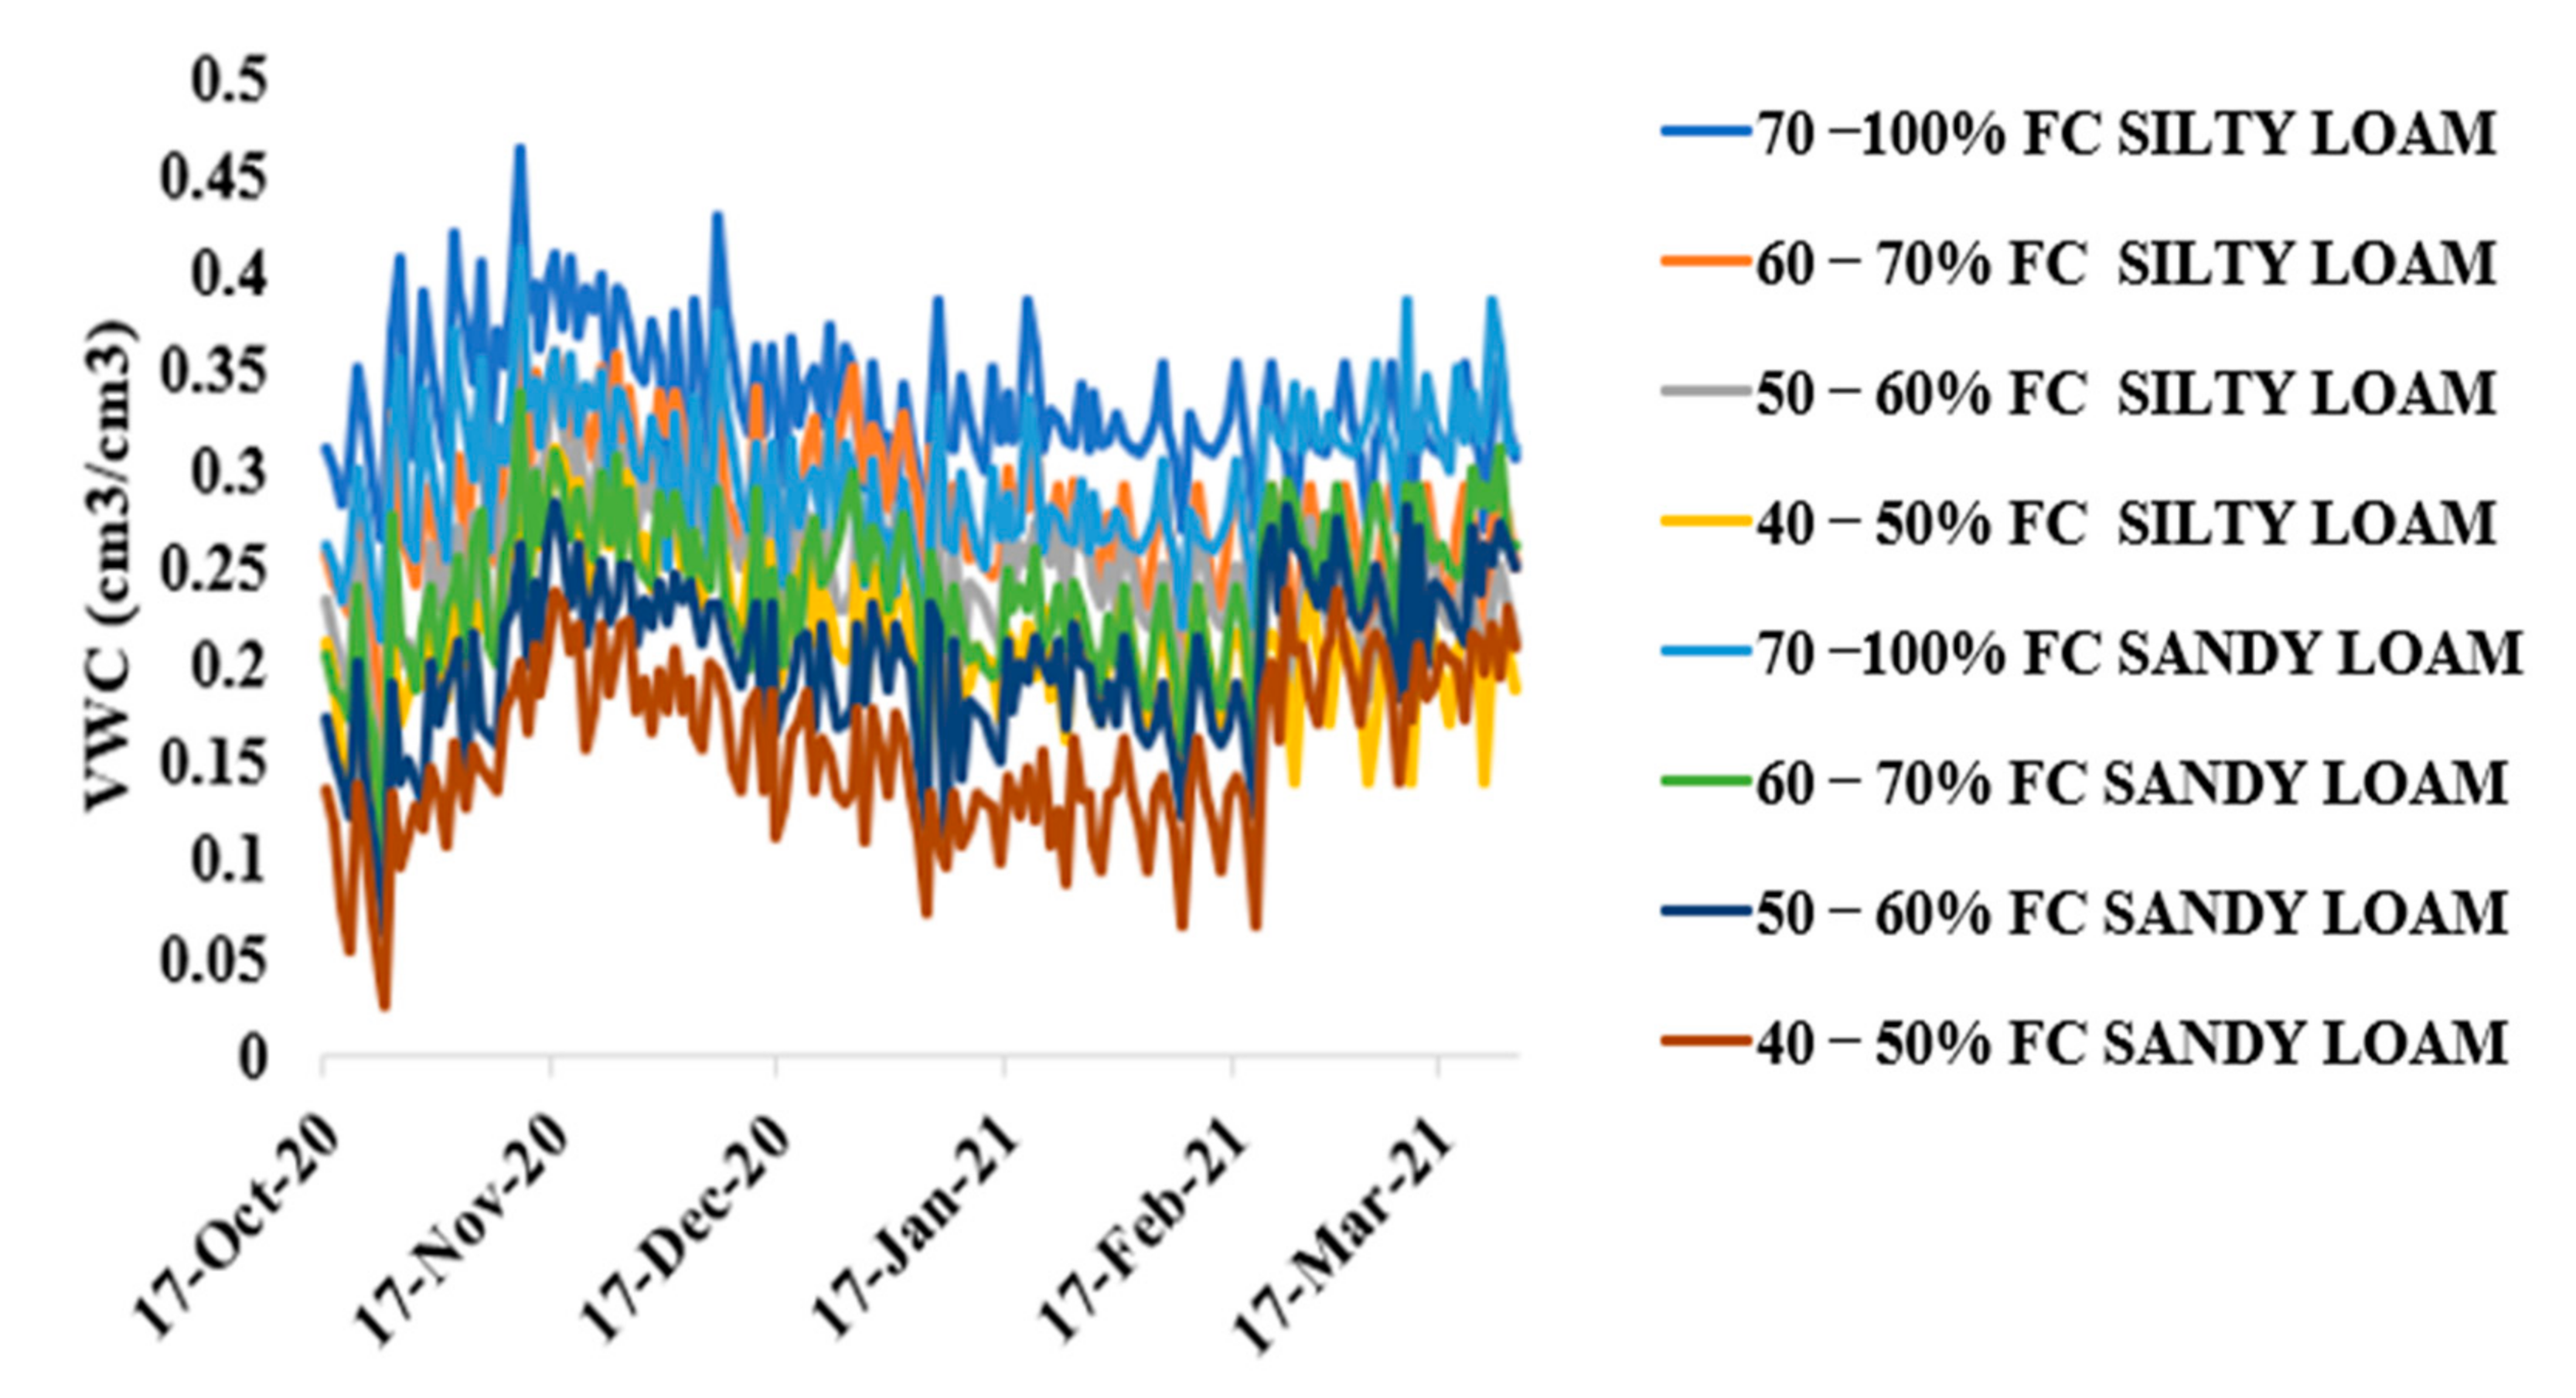
3.1. Measurement of Soil Water Content

The TDR and gravimetric soil water content measurements demonstrated a good association, according to the findings of this investigation. For sandy loam and silty loam soils, the correlation coefficient was greater than 0.85 at p 0.01, as shown in Figure 2. For sandy loam soils, the total irrigation water applied for tomato growth during the growing season was 225.9 mm, 146.9 mm, 124.3 mm, and 101.7 mm at 70–100% FC, 60–70% FC, 50–60% FC, and 40–50% FC, respectively, whereas the total irrigation water applied for silty loam soils was 243 mm, 158.1 mm, 121.3 mm, and 109.5 mm for 70–100% FC, 60–70% FC, 50–60% FC, and 40–50% FC, respectively. The monthly average rainfall, temperature, and humidity at the research site during the study are shown in Figure 2.

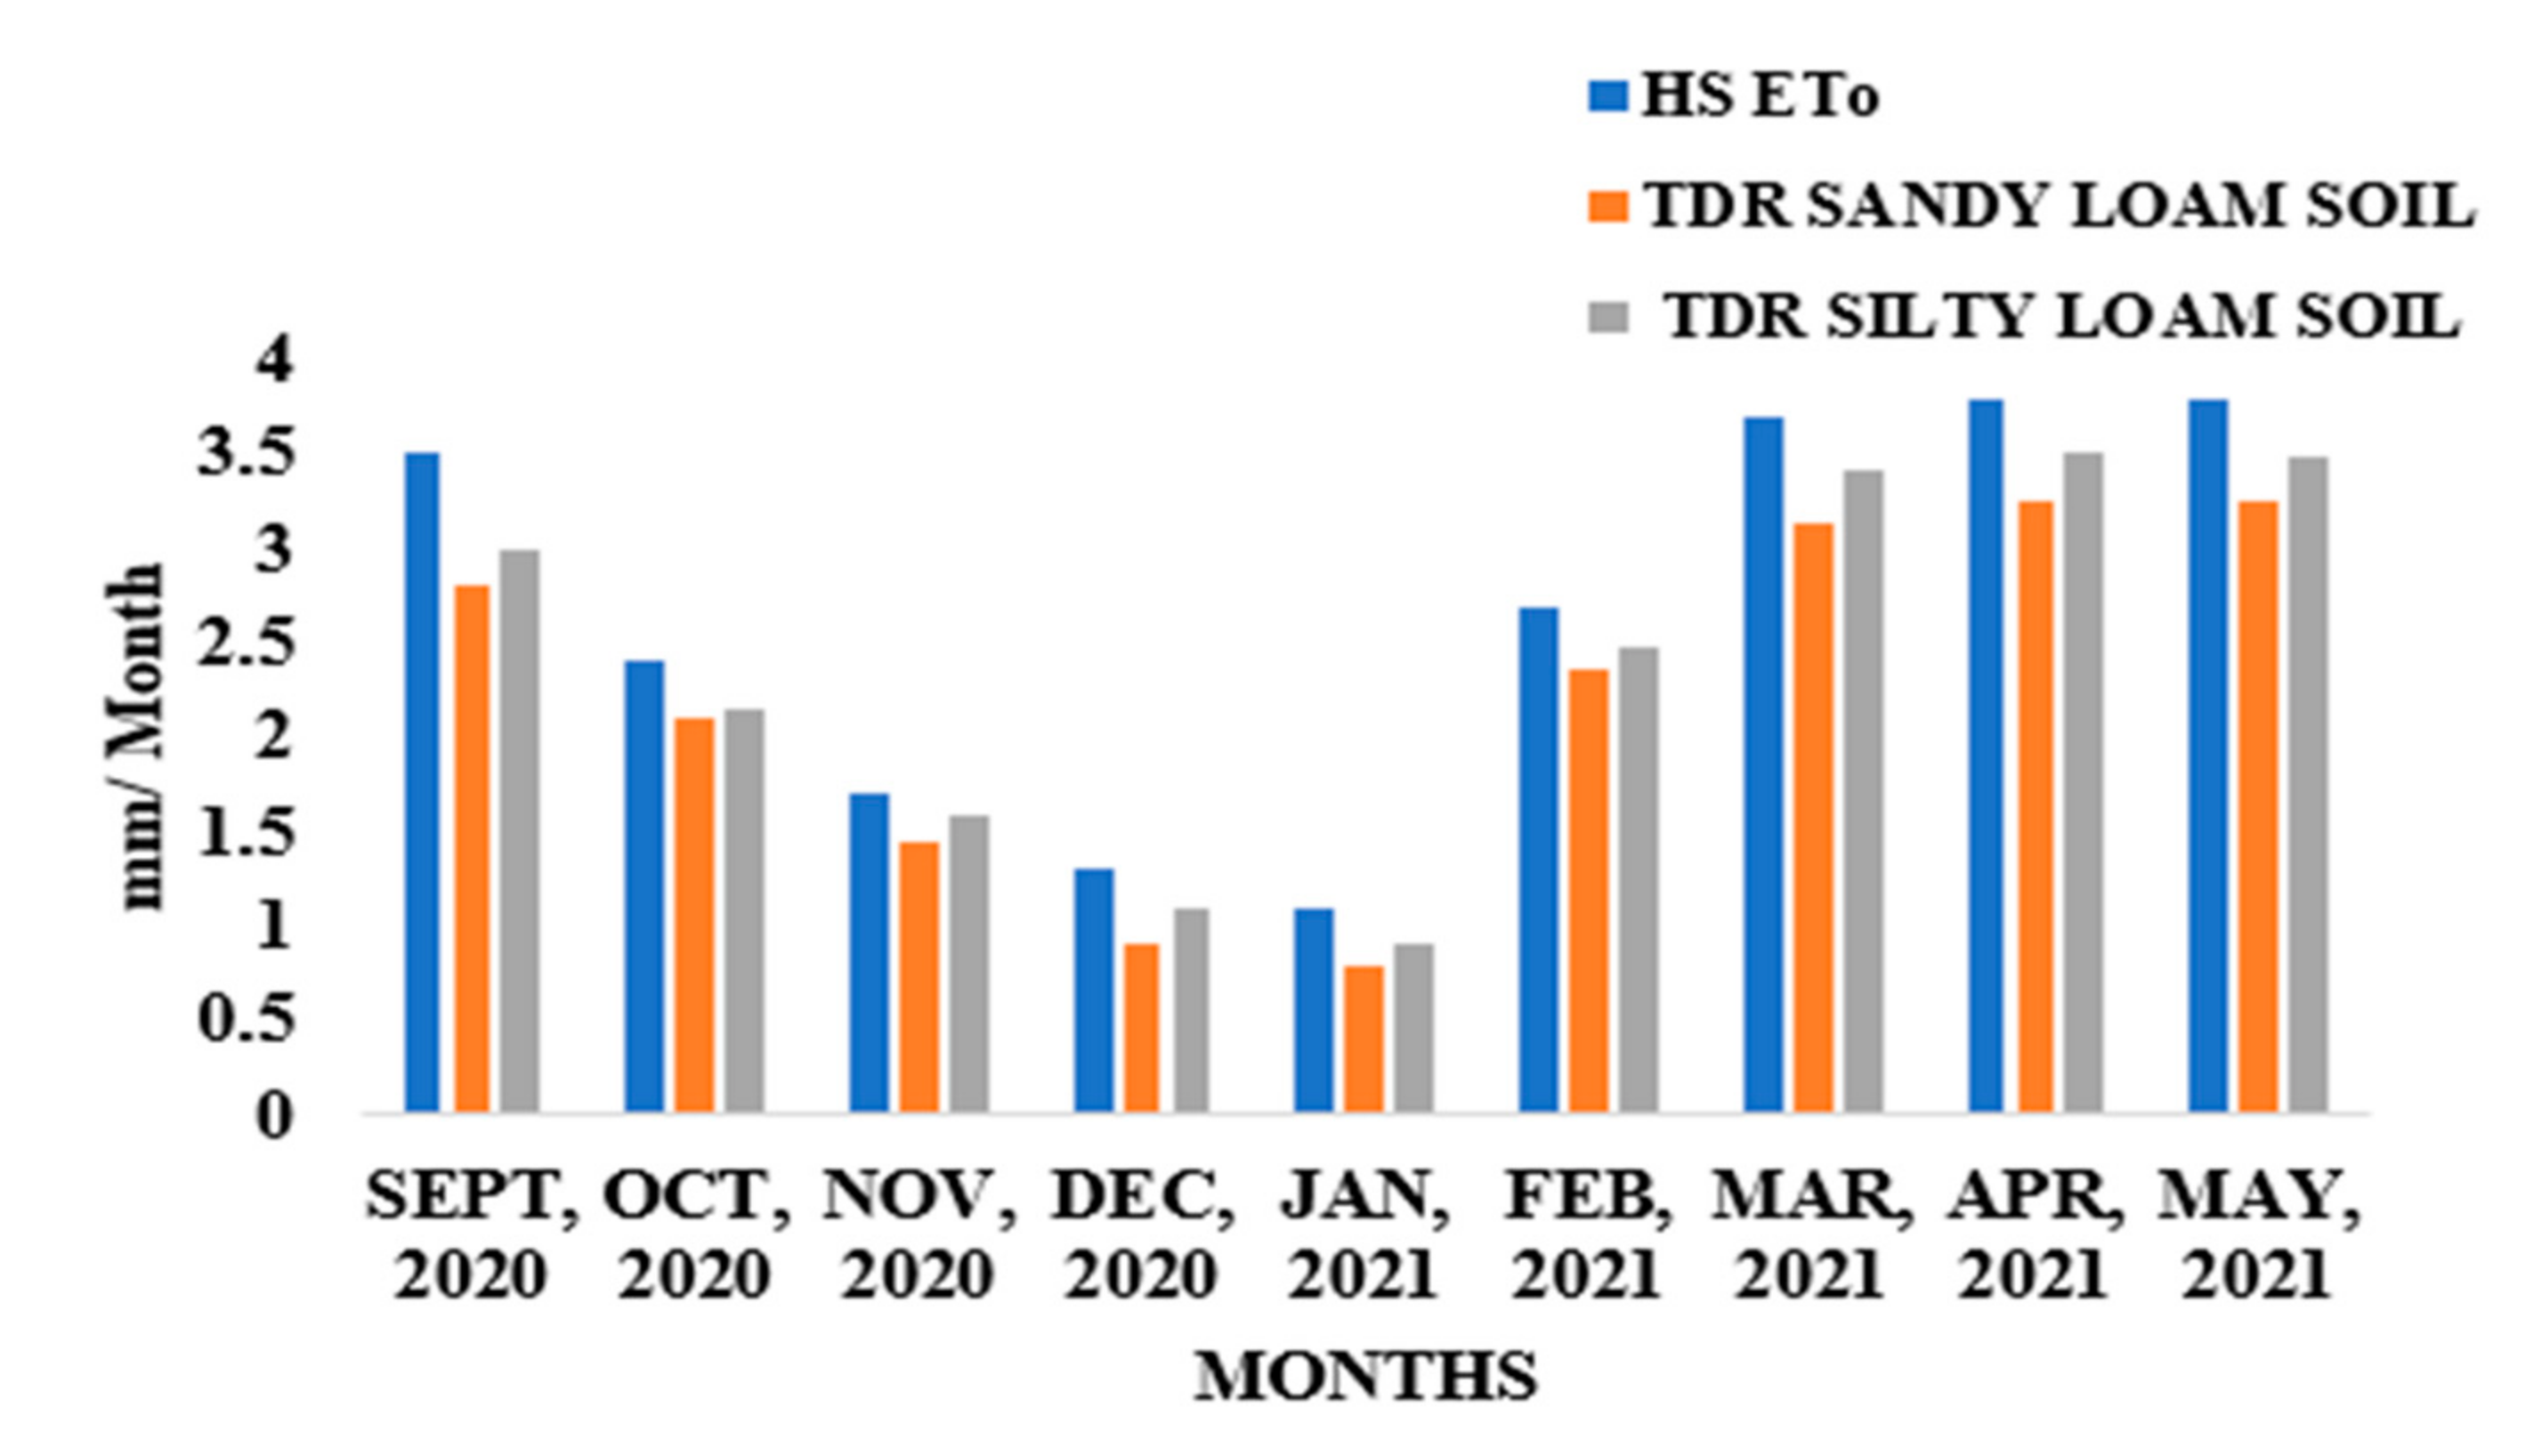
3.2. Evapotranspiration ETo and Moisture Content in the Soil

Throughout the tomato crop season, the maximum and minimum temperature, solar radiance, and vapor pressure deficit, as well as the humidity in the greenhouse, were measured daily and computed into mean monthly data, and the mean values at each growth stage were recorded, as shown in Table 2. The greenhouse’s monthly mean temperature, relative humidity, vapor pressure deficit, and solar radiance ranged from 22.2 to 25.4 °C, 57.1 to 67.6%, 0.33 to 0.38 kPa, and 276.1 to 300.31, respectively. These climatological data are shown in Table 4.
As indicated in Figure 3, the mean total seasonal ETo, calculated using the HS model, ranged from 1.1 to 3.7 mm/month, and the soil moisture content, measured with the TDR, ranged from 0.9 to 2.8 for sandy loam soil and 0.91 to 3.41 for silty loam soil. The total amount of water applied for each treatment throughout the crop season varied from 101 to 225.9 mm and 109.5 to 243 mm for sandy loam and silty loam soils, respectively, as shown in Table 5 and Table 6, respectively. Water stored in the pots signifies the difference between ETo and total water applied. The ETo increased with irrigation water volume in general and was higher during the blossoming and maturity stages of plant growth, as these corresponded to the times when greenhouse temperatures increased, due to increasing environmental temperatures, as well as when crops required more water for physiological development. The HG model was used to calculate ETo for a monthly period in order to estimate the evapotranspiration rate at each growth stage of tomatoes grown in greenhouse conditions during the growing season, as used by [35,36,46].

3.3. Correlation between HS-Based Evapotranspiration and TDR-Based Soil Water Content

Results from this study revealed that crop evapotranspiration calculated from temperature and solar radiance data in the greenhouse as a plant-based approach for estimating water stress and TDR soil moisture reading to measure soil water content had a strong positive correlation. The Correlation Coefficient turned out to be R2 = 0.9105 and 0.8903, p < 0.05 for silty loam and sandy loam soils, respectively, as shown in Figure 4. The variations in soil water content for sandy loam and silty loam soils are shown in Figure 5.

3.4. Effect of Water Above-Ground Biomass, Below-Ground Biomass, and Chlorophyll

The effect of water stress and soil type on above-ground biomass, below-ground biomass, and chlorophyll is represented in Table 7. The biomasses and chlorophyll decreased linearly with increasing water stress for sandy loam and silty loam soils, whereas the fruit bottom temperature increased with increasing water stress. There was a significant difference (p < 0.05) in the dry biomasses and leaf chlorophyll content (SPAD) between the water stress treatments. Similarly, there were significant differences (p < 0.05) in dry biomass and leaf chlorophyll content (SPAD) among sandy loam and silty loam soils.

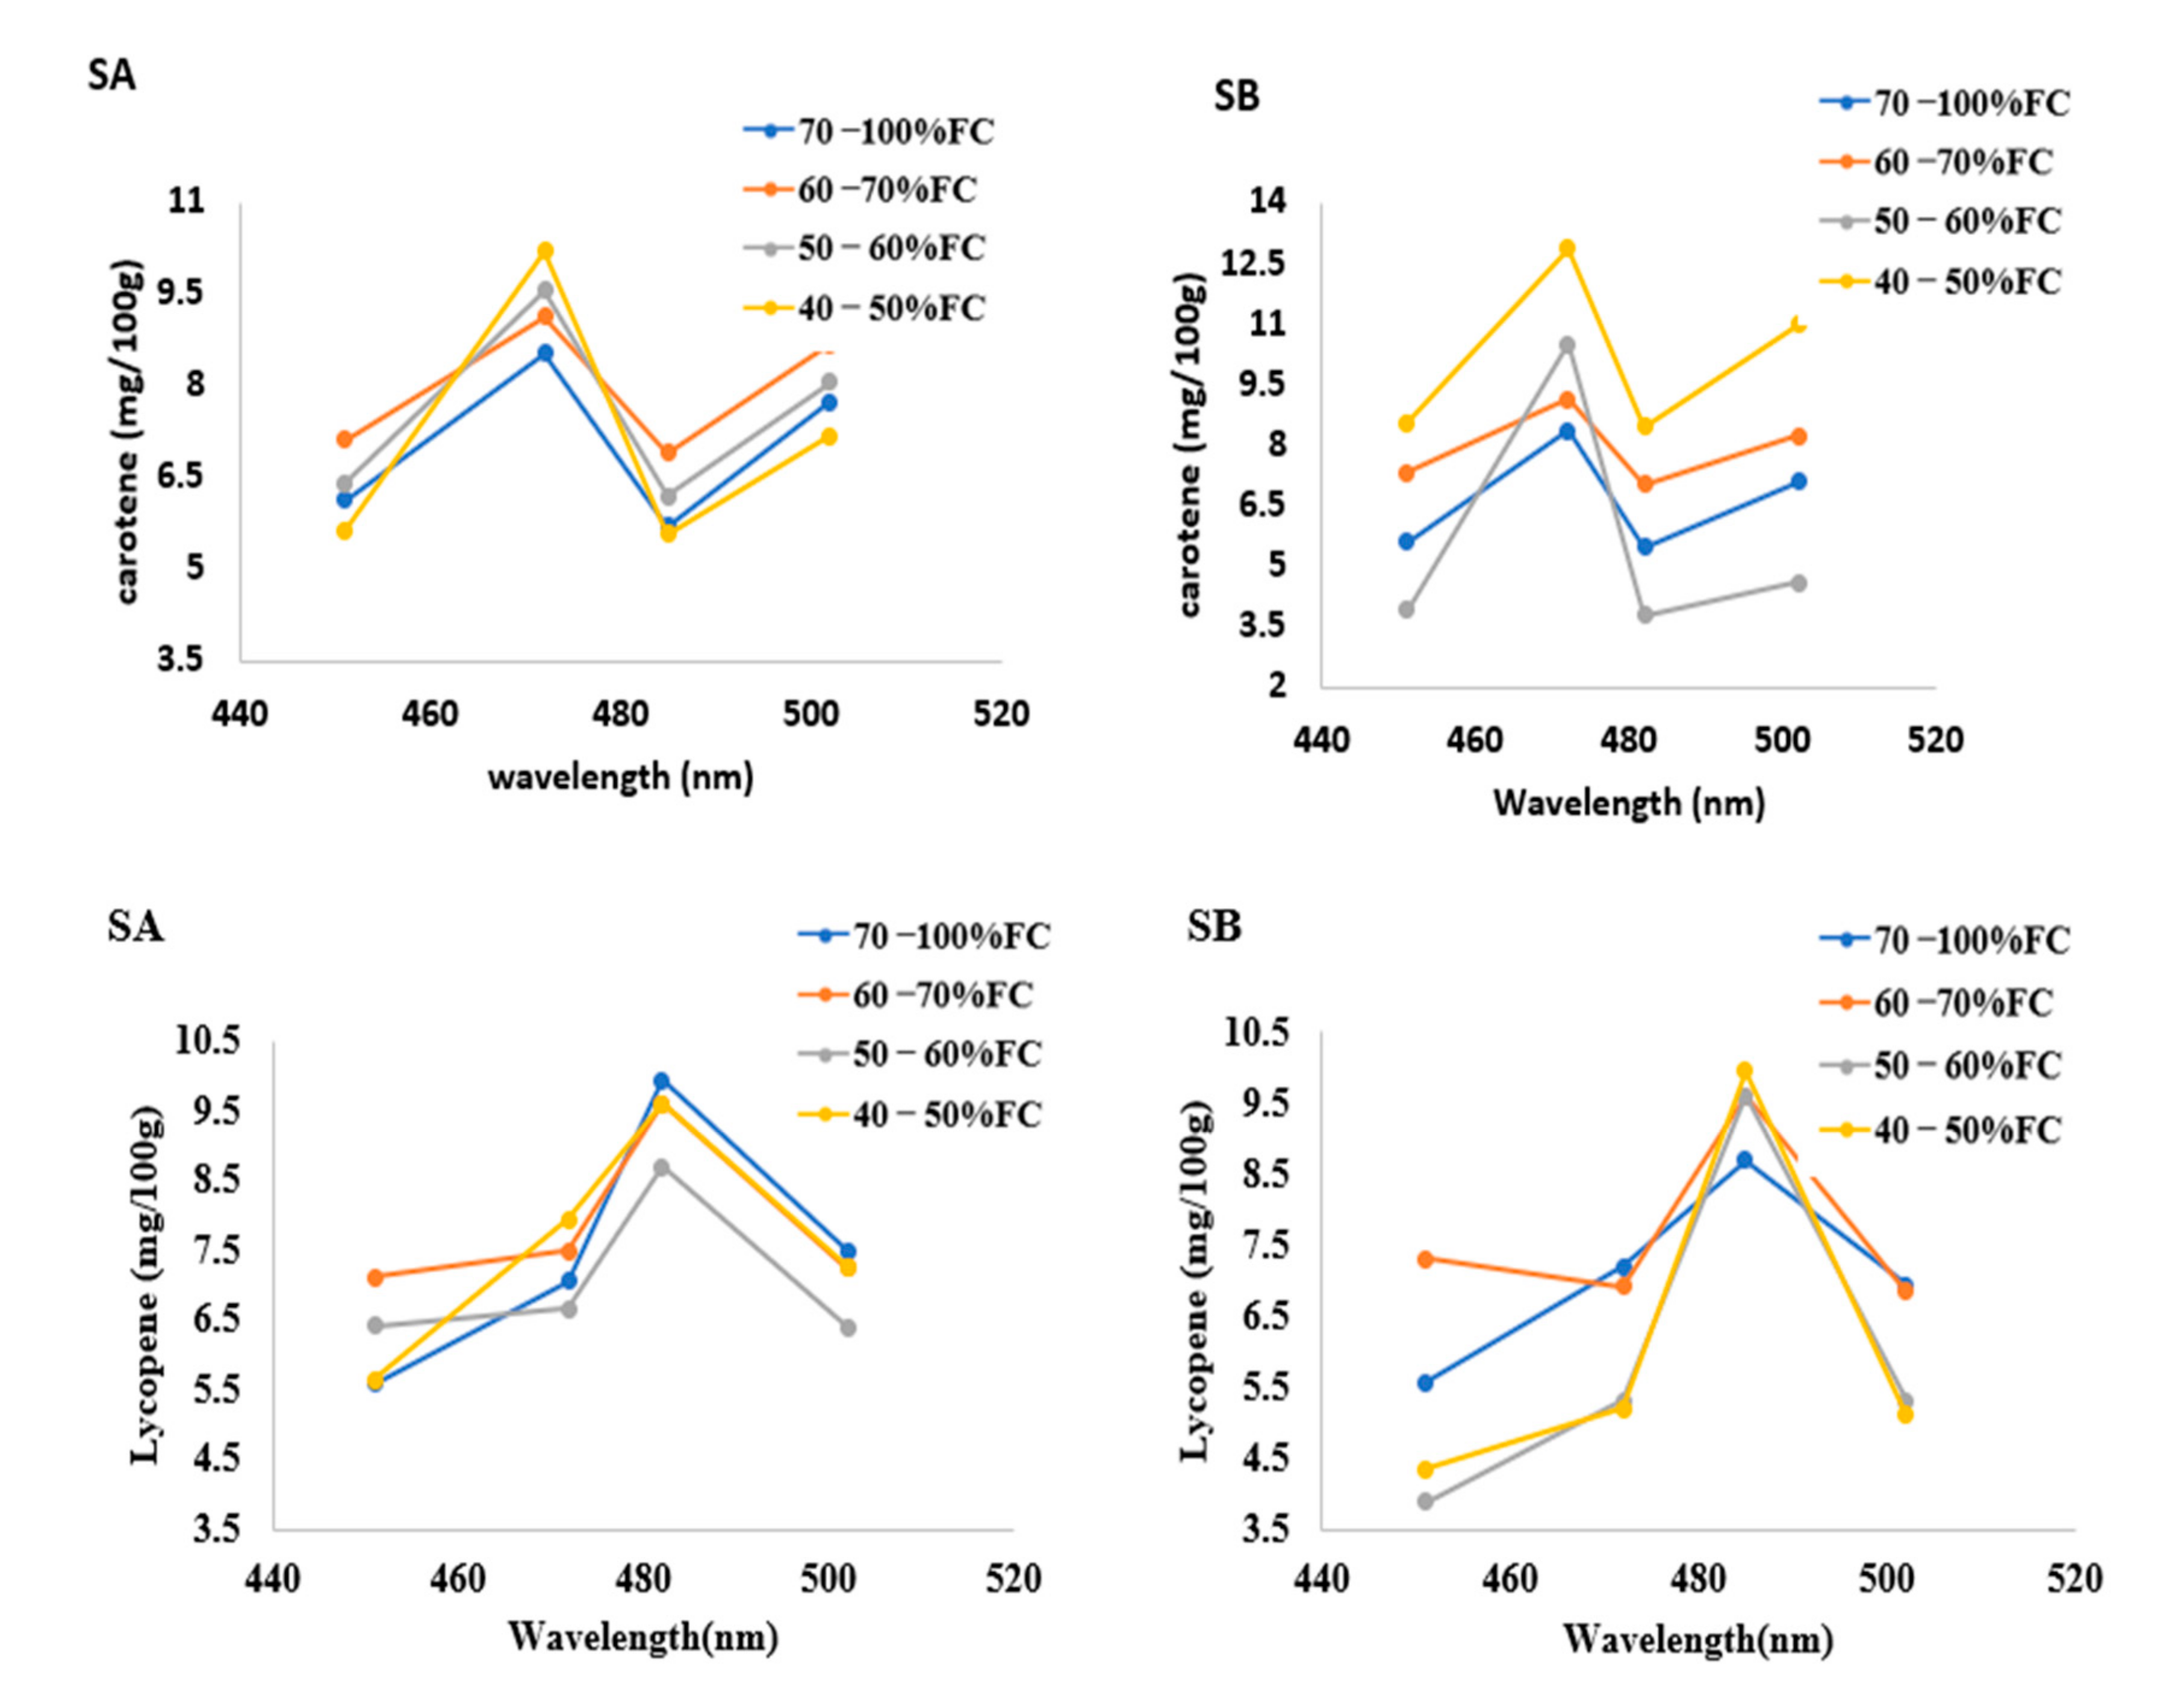
3.5. Absorption Spectra

The absorption spectrum of an extract of tomato fruit for β-carotene and lycopene was measured at an absorbance between 0.3 and 0.85. Lycopene and β-carotene characteristics absorb at prominent peaks of 451 nm, 472 nm, 485 nm, and 502 nm. This study revealed that the best absorption peaks for β-carotene are at 472 nm, whereas lycopene’s best absorption peak was at 485 nm, and this was evident in all the water stress levels for both sandy loam (SA) and silty loam soils (SB). Β-carotene and lycopene contents observed from this experiment were plotted against the wavelength (nm) separately for the two soil types, as shown in Figure 6.

3.6. Fruit Quality Characteristics Induced by Water Stress

Total soluble solids (TSS), titratable acidity (TA), and pH increased linearly with water stress for sandy loam and silty loam soils. There was a significant difference among TSS, TA, and pH regarding water stress and soil type (p < 0.05). However, fruit firmness significantly decreased at high water-stress treatment. β-carotene and lycopene concentrations increased with water stress. This trend was experimental when lycopene and β-carotene contents were expressed in fresh tomato weight. This experiment revealed that sandy loam soil and silty loam soil have different physical and chemical properties. The physicochemical characteristics of the soils significantly influence the quality of the tomato fruit. The physicochemical properties of the tomatoes obtained from sandy loam soils were significantly different from those obtained from silty loam soils (p < 0.05); this is shown in Table 8.

3.7. Water Stress vs. Marketable Yield

The influence of moisture stress treatments on marketable tomato production is depicted in Figure 7. Total marketable yields in sandy loam soil ranged from 6.8 to 2.02 kg in plant−1 for 70–100% FC and 40–50% FC treatments, respectively, and 5.4–1.75 kg in plant−1 for 70–100% FC and 40–50% FC treatments in silty loam soil. The 70–100% FC treatment resulted in the highest mean marketable yield (6.8 kg for plant−1) in sandy loam soil, while the 40–50% FC treatment resulted in the lowest mean marketable yield (1.78 kg for plant−1) in silty loam soil. In sandy loam soil, the average yield from the 70–100% FC treatment was not statistically different from the yield from the 60–70% FC treatment, but was significantly different from the yield from the 50–60% FC and 40–50% FC treatments (p < 0.05). In silty loam soil, however, the average yield obtained from the 70–100% FC treatment was significantly different from the average yield obtained from the 60–70% FC, 50–60% FC, and 40–50% FC treatments (p < 0.01 and 0.05, respectively). The results showed that sandy loam and silty loam soils have distinct field capabilities; the yield from sandy loam soil differed significantly from the yield from silty loam soils, at p 0.001. This means that each soil has its unique % FC threshold below which, if stress occurs, a noticeable reduction in crop output results. However, sandy loam and silty loam soils have a substantial link to water stress treatment, with a correlation coefficient of 0.95 and a p-value of 0.001. The marketable yields produced by sandy loam soil are superior to those produced by silty loam soil.

4. Discussion

The Hargreaves–Samani model was used to estimate reference evapotranspiration (ETo) using meteorological data collected at the study location and in the greenhouse. In sandy loam and silty loam soils, the calculated ETo from the HS model was correlated with the TDR-based evapotranspiration, which is a soil-based approach to estimating crop water status, and the results revealed a strong positive correlation, with R2 above 0.8. For both sandy loam and silty loam soils, the HS model seemed to predict higher ETo than the TDR data throughout the growing season, with higher values recorded at the early stages of the vegetative stage and during the fruit enlargement and senescence stages. The results of this study are similar to the findings of [36,47,48,49,50], who reported that the HS model is ideal to estimate ETo in greenhouse crop production by utilizing only available temperature data, and that this can be used to validate TDR moisture estimation. However, when compared to silty loam soils, sandy loam soils had the highest ETo, which could be due to the soil texture. The sensitivity of time variations in evaporation intensity is partly a result of changes in the evaporation capacity of greenhouse air, and partly related to changes in the general weather conditions (i.e., radiation, air temperature, humidity, and wind speed), as well as the stage of plant growth. The positive partiality of surface air temperature rose with increasing ambient temperature, reduced plant canopy cover, increased solar radiation, and in soils with light textures, according to the findings of several researchers [2,47,51,52,53]. The estimation of crop water status using this approach in a greenhouse provides vital information on yield and quality indices of tomatoes.
Tomato quality index study is notoriously difficult and prone to errors. In developed nations, carotenoids are generally separated and quantified using the HPLC technique [27,45]. Even though this procedure is dependable, accurate, and quick, it necessitates highly skilled workers and expensive equipment. UV-Vis spectroscopy, optothermal, and photothermal approaches are among the novel chemical techniques that have been tested for the direct assessment of lycopene and carotene [44,45,54].
Findings from many research studies on marketable tomato yield and quality properties were comparable to the data obtained from this study. The authors of [27,41,42,55,56,57,58,59,60] reported that the maximum yield is achievable when tomato plants are exposed to minimal water stress. However, total marketable yield increases relatively with irrigation water applied [21,22,61]. A soil water deficit at FC% below 50% resulted in marketable yield reduction and economic loss [62]. Consequently, increasing irrigation through the drip irrigation system in a regulated deficit irrigation approach increases marketable yield, as water is delivered directly to the plant root, thereby reducing water wastage [2,59,63,64]. Additionally, the total marketable yield was high at 70–100% FC in sandy loam soils. This study also revealed that above-ground biomass, below-ground biomass, and chlorophyll content (SPAD) decrease with high water stress or soil water deficit in silty loam soil. These results were confirmed by the findings of [39,41,65,66], who reported that soil water deficit induces severe dry biomass effects, including plants physiological and biochemical changes, which leads to the reduction in the photosynthetic rate, transpiration rate, leaf relative water content, and pigments, such as chlorophyll contents, of plants. However, tomatoes grown in sandy loam soil provided the highest biomass and chlorophyll content over silty loam soil under different water stress treatments, confirming the findings of [8,42,59,67]. Tomato fruit firmness (peeled and unpeeled) decreased with increasing water stress. This finding is similar to the findings of [27] in his report, “Combined Effect of Deficit Irrigation and Strobilation Application on Yield, Fruit Quality, and Water Use Efficiency of Cherry Tomato”, which state that tomato fruit loses its turgidity and begins to wrinkle under water stress conditions. Additionally, fruit bioactive compounds such as TSS, titratable acids, pH, and ascorbic acid observed in this study increased with increasing water stress, which was in line with the findings of [3,6,41,68], who investigated the effects of water stress on antioxidant systems and oxidative parameters in tomato fruits. It was also evident that sandy loam soil recorded the highest TSS, pH, titratable acids, and ascorbic acid values at water stress treatment of 40–50% FC. Carotenoid extracted using acetone: petroleum ether at ratio 1:1 showed that this reagent could extract β-carotene and lycopene. However, β-carotene and lycopene characteristic prominent absorption peaks were between 3.5 and 8.5 in the 451 nm, 472 nm, 485 nm, and 502 nm wavelength, following the research method of [69]. Out of the several absorption peaks measured, the 472 nm and 485 nm wavelengths revealed the highest absorption peaks for lycopene and β-carotene, at 74.3% and 87.9%, respectively, similar to the results of [44]. This finding was similar to the results of [3,5,6,10,59] in estimating the total antioxidants and oxidative parameters in plants under water stress conditions. The β-carotene and lycopene content obtained from this study increased with water stress, and this result is comparable with the results of [2,6,7,10,11,14,58,69] on the effects of water stress on tomato yield quality. However, results from the ANOVA analysis revealed that water stress and soil type significantly influenced the total marketable yield, as shown in Figure 3, as well as the above-ground and below-ground biomass and the bioactive compounds of tomatoes, as shown in Table 6. These results indicated that stressing tomato plants at 60–70% FC in sandy loam soil optimizes tomato yield and fruit quality.

5. Conclusions

This study has improved our understanding of the reception of water stress treatment induced in sandy loam and silty loam soils and its effect on the tomato fruit yield and quality characteristics. The reduction of the soil field capacity by 30–40% showed a significant increase in total marketable yield, chlorophyll content, fruit firmness, and dry biomass over tomatoes grown at full field capacity in both soil textural types used, but sandy loam soil proved to be slightly better than silty loam soil.
Despite the fact that low water stress treatments increased fruit firmness, this study found that soil type had no significate effect on fruit firmness. However, different water stress levels and soil types were found to have a substantial impact on total soluble solids (Brix), pH, titratable acid (TA), ascorbic acid (vitamin C), lycopene, and carotene content, with increased values in the 40–50% FC range. To summarize, tomato cv. xiang sheng variety cultivated in sandy loam soils under 60–70% FC optimized yield, along with physiochemical and carotenoid content. It is also clear that sandy loam soil provided the suitable physical and chemical qualities needed to boost tomato productivity, particularly in hotter climates, even though it exhibited a higher evaporation rate.
In general, UV-Vis spectroscopy is very useful to estimate the effect of water stress on tomato fruit quality indices, such as carotene and lycopene. To ensure sustainable agriculture through water and food security in this recent global warming crisis, the efficient and effective utilization of water resources, the selection of the appropriate soil textural type, and the choice of an appropriate plant cultivar or variety, is essential. These studies clearly indicate that precise soil water content and field capacity modulation is obligatory to fine-tune tomato fruit output and quality indices in greenhouse-grown tomatoes. This study also identifies the best irrigation scheduling methods appropriate for tomatoes in each soil type. Future studies should take into account many different tomato varieties and soil types in order to model tomato water use and water requirements.

Author Contributions

Conceptualization, K.E.A. and J.L. (Juan Liao); methodology, K.E.A.; software, K.E.A., A.A.A. and S.A.A.; validation, Y.L., H.W., S.Q. and R.O.D.; formal analysis, J.L. and K.E.A.; investigation, K.E.A., S.A.A. and A.A.A.; resources, D.A. and Y.L.; data curation, K.E.A. and C.L.; writing—original draft preparation, K.E.A.; writing—review and editing, K.E.A., R.O.D., A.A.A. and D.A.; visualization, J.L. (Juan Liao) and C.L.; supervision, J.L. (Jiuhao Li); project administration, Y.L.; funding acquisition, J.L. (Jiuhao Li) All authors have read and agreed to the published version of the manuscript.

Funding

This research work was funded by the Key-Area Research and Development program of Guangdong Province (grant number 2019B020214003) and the National Natural Science Foundation of China (31901401).

Institutional Review Board Statement

Not applicable.

Informed Consent Statement

Not applicable.

Data Availability Statement

Not applicable.

Acknowledgments

We would like to thank everyone who contributed to this article, especially the field technical workers and the laboratory crew.

Conflicts of Interest

The authors declare no conflict of interest.

References

  1. Kiple, K.F.; Coneè, O.K. The Cambridge World History of Food; Cambridge University Press: Cambridge, UK, 2000; Volume 1, ISBN 978-0-521-40214-9. [Google Scholar]
  2. Basit, A.; Hassnain, M.A.; Ullah, I.; Shah, S.T.; Zuhair, S.A.; Ullah, I. Quality Indices of Tomato Plant as Affected by Water Stress Conditions and Chitosan Application. Pure Appl. Biol. 2020, 9, 1364–1375. [Google Scholar] [CrossRef]
  3. Koh, E.; Charoenprasert, S.; Mitchell, A.E. Effect of Industrial Tomato Paste Processing on Ascorbic Acid, Flavonoids and Carotenoids and Their Stability over One-Year Storage. J. Sci. Food Agric. 2012, 92, 23–28. [Google Scholar] [CrossRef] [PubMed]
  4. Klunklin, W.; Savage, G. Effect on Quality Characteristics of Tomatoes Grown under Well-Watered and Drought Stress Conditions. Foods 2017, 6, 56. [Google Scholar] [CrossRef] [PubMed] [Green Version]
  5. Bojórquez, R.M.C.; Gallego, J.G.; Collado, P.S. Functional Properties and Health Benefits of Lycopene. Nutr. Hosp. 2013, 28, 6–15. [Google Scholar]
  6. Melfi, M.T.; Nardiello, D.; Cicco, N.; Candido, V.; Centonze, D. Simultaneous Determination of Water- and Fat-Soluble Vitamins, Lycopene and Beta-Carotene in Tomato Samples and Pharmaceutical Formulations: Double Injection Single Run by Reverse-Phase Liquid Chromatography with UV Detection. J. Food Compos. Anal. 2018, 70, 9–17. [Google Scholar] [CrossRef]
  7. George, B.; Kaur, C.; Khurdiya, D.S.; Kapoor, H.C. Antioxidants in Tomato (Lycopersicum esculentum) as a Function of Genotype. Food Chem. 2004, 84, 45–51. [Google Scholar] [CrossRef]
  8. Katsoulas, N.; Kittas, C.; Dimokas, G.; Lykas, C.H. Effect of Irrigation Frequency on Rose Flower Production and Quality. Bios. Eng. 2006, 93, 237–244. [Google Scholar] [CrossRef]
  9. Rosales, M.A.; Ruiz, J.M.; Hernandez, J.; Soriano, T.; Castilla, N.; Romero, L.; Rosales, M.A.; Ruiz, J.M.; Hernandez, J.; Soriano, T.; et al. Antioxidant Content and Ascorbate Metabolism in Cherry Tomato Exocarp in Relation to Temperature and Solar Radiation. J. Sci. Food Agric. 2006, 86, 1545–1551. [Google Scholar] [CrossRef]
  10. Murshed, R.; Lopez-Lauri, F.; Sallanon, H. Effect of Water Stress on Antioxidant Systems and Oxidative Parameters in Fruits of Tomato (Solanum Lycopersicon L., Cv. Micro-Tom). Physiol. Mol. Biol. Plants 2013, 19, 363–378. [Google Scholar] [CrossRef] [Green Version]
  11. Zhang, H.; Xiong, Y.; Huang, G.; Xu, X.; Huang, Q. Effects of Water Stress on Processing Tomatoes Yield, Quality and Water Use Efficiency with Plastic Mulched Drip Irrigation in Sandy Soil of the Hetao Irrigation District. Agric. Water Manag. 2017, 179, 205–214. [Google Scholar] [CrossRef]
  12. Idso, S.B. Non-Water Stressed Baselines: A Key to Measuring and Interpreting Plant Water Stress. Agric. Meteorol. 1982, 27, 59–70. [Google Scholar] [CrossRef]
  13. Giuliani, M.M.; Nardella, E.; Gagliardi, A.; Gatta, G. Deficit Irrigation and Partial Root-Zone Drying Techniques in Processing Tomato Cultivated under Mediterranean Climate Condition. Sustainability 2017, 9, 2197. [Google Scholar] [CrossRef] [Green Version]
  14. Zhang, H.; Han, M.; Chavez, J.L.; Lan, Y. Improvement in Estimation of Soil Water Deficit by Integrating Airborne Imagery Data into a Soil Water Balance Model. Int. J. Agric. Biol. Eng. 2017, 10, 37–46. [Google Scholar]
  15. Quinet, M.; Angosto, T.; Yuste-Lisbona, F.J.; Blanchard-Gros, R.; Bigot, S.; Martinez, J.P.; Lutts, S. Tomato Fruit Development and Metabolism. Front. Plant Sci. 2019, 10, 1554. [Google Scholar] [CrossRef] [Green Version]
  16. Conti, V.; Romi, M.; Guarnieri, M.; Cantini, C.; Cai, G. Italian Tomato Cultivars under Drought Stress Show Different Content of Bioactives in Pulp and Peel of Fruits. Foods 2022, 11, 270. [Google Scholar] [CrossRef]
  17. Isah, T. Stress and Defense Responses in Plant Secondary Metabolites Production. Biol. Res. 2019, 52, 39. [Google Scholar] [CrossRef] [Green Version]
  18. Yin, Y.G.; Kobayashi, Y.; Sanuki, A.; Kondo, S.; Fukuda, N.; Ezura, H.; Sugaya, S.; Matsukura, C. Salinity Induces Carbohydrate Accumulation and Sugar-Regulated Starch Biosynthetic Genes in Tomato (Solanum lycopersicum L. Cv. ‘Micro Tom’) Fruits in an ABA- and Osmotic Stress-Independent Manner. J. Exp. Bot. 2010, 61, 563–574. [Google Scholar] [CrossRef]
  19. Helyes, L.; Szuvandzsiev, P.; Neményi, A.; Pék, Z.; Lugasi, A. Different Water Supply and Stomatal Conductance Correlates with Yield Quantity and Quality Parameters. Acta Hortic. 2013, 971, 119–126. [Google Scholar] [CrossRef]
  20. Nemeskéri, E.; Neményi, A.; Bocs, A.; Pék, Z.; Helyes, L. Physiological Factors and Their Relationship with the Productivity of Processing Tomato under Different Water Supplies. Water 2019, 11, 586. [Google Scholar] [CrossRef] [Green Version]
  21. Ihuoma, S.O.; Madramootoo, C.A. Sensitivity of Spectral Vegetation Indices for Monitoring Water Stress in Tomato Plants. Comput. Electron. Agric. 2019, 163, 104860. [Google Scholar] [CrossRef]
  22. Jackson, R.D.; Idso, S.B.; Reginato, R.J.; Pinter, P.J. Canopy Temperature as a Crop Water Stress Indicator. Water Resour. Res. 1981, 17, 1133–1138. [Google Scholar] [CrossRef]
  23. Idso, S.B.; Jackson, R.D.; Pinter, P.J.; Hatfield, J.H. Normalizing the Stress Degree-Day Parameter for Environmental Variability. Agric. Meteorol. 1981, 24, 45–55. [Google Scholar] [CrossRef]
  24. Sepaskhah, A.R.; Kashefipour, S.M. Relationships between Leaf Water Potential, CWSI, Yield and Fruit Quality of Sweet Lime under Drip Irrigation. Agric. Water Manag. 1994, 25, 13–21. [Google Scholar] [CrossRef]
  25. Alordzinu, K.E.; Li, J.; Lan, Y.; Appiah, S.A.; Al Aasmi, A.; Wang, H. Rapid Estimation of Crop Water Stress Index on Tomato Growth. Sensors 2021, 21, 5142. [Google Scholar] [CrossRef] [PubMed]
  26. Cantore, V.; Lechkar, O.; Karabulut, E.; Sellami, M.H.; Albrizio, R.; Boari, F.; Todorovic, M. Combined Effect of Deficit Irrigation and Strobilurin Application on Yield, Fruit Quality and Water Use Efficiency of “Cherry” Tomato (Solanum lycopersicum L.). Agric. Water Manag. 2016, 167, 53–61. [Google Scholar] [CrossRef]
  27. Zinkernagel, J.; Maestre-Valero, J.F.; Seresti, S.Y.; Intrigliolo, D.S. New Technologies and Practical Approaches to Improve Irrigation Management of Open Field Vegetable Crops. Agric. Water Manag. 2020, 242, 106404. [Google Scholar] [CrossRef]
  28. El-Marsafawy, S.M.; Swelam, A.; Ghanem, A. Evolution of Crop Water Productivity in the Nile Delta over Three Decades (1985–2015). Water 2018, 10, 1168. [Google Scholar] [CrossRef] [Green Version]
  29. Martínez-Fernández, J.; González-Zamora, A.; Sánchez, N.; Gumuzzio, A. A Soil Water Based Index as a Suitable Agricultural Drought Indicator. J. Hydrol. 2015, 522, 265–273. [Google Scholar] [CrossRef]
  30. Zotarelli, L.; Dukes, M.D.; Scholberg, J.M.S.; Munoz-Carpena, R. Tomato Nitrogen Accumulation and Fertilizer Use Efficiency on a Sandy Soil, as Affected by Nitrogen Rate and Irrigation Scheduling. Agric. Water Manag. 2009, 96, 1247–1258. [Google Scholar] [CrossRef]
  31. Alordzinu, K.E.; Li, J.; Lan, Y.; Appiah, S.A.; Al Aasmi, A.; Wang, H.; Liao, J.; Sam-Amoah, L.K.; Qiao, S. Remote Sensing of Environment Ground-Based Hyperspectral Remote Sensing for Estimating Water Stress in Tomato Growth in Sandy Loam and Silty Loam Soils. Sensors 2021, 21, 5705. [Google Scholar] [CrossRef]
  32. Alhaj Hamoud, Y.; Shaghaleh, H.; Sheteiwy, M.; Guo, X.; Elshaikh, N.A.; Ullah Khan, N.; Oumarou, A.; Rahim, S.F. Impact of Alternative Wetting and Soil Drying and Soil Clay Content on the Morphological and Physiological Traits of Rice Roots and Their Relationships to Yield and Nutrient Use-Efficiency. Agric. Water Manag. 2019, 223, 105706. [Google Scholar] [CrossRef]
  33. Hargreaves, G.H.; Samani, Z.A. Estimating Potential Evapotranspiration. J. Irrig. Drain. Div. 1982, 108, 223–230. [Google Scholar] [CrossRef]
  34. Hargreaves, G.H.; Samani, Z.A. Reference Crop Evapotranspiration from Temperature. Appl. Eng. Agric. 1985, 1, 96–99. [Google Scholar] [CrossRef]
  35. Feng, Y.; Jia, Y.; Cui, N.; Zhao, L.; Li, C.; Gong, D. Calibration of Hargreaves Model for Reference Evapotranspiration Estimation in Sichuan Basin of Southwest China. Agric. Water Manag. 2017, 181, 1–9. [Google Scholar] [CrossRef]
  36. Bai, H.; Purcell, L.C. Aerial Canopy Temperature Differences between Fast- and Slow-Wilting Soya Bean Genotypes. J. Agron. Crop. Sci. 2018, 204, 243–251. [Google Scholar] [CrossRef]
  37. Bausch, W.C.; Diker, K.; Khosla, R.; Paris, J.F. Estimating Corn Nitrogen Status Using Ground–Based and Satellite Multispectral Data. Remote Sens. Modeling Ecosyst. Sustain. 2004, 5544, 489–498. [Google Scholar] [CrossRef]
  38. Gitelson, A.A.; Viña, A.; Ciganda, V.; Rundquist, D.C.; Arkebauer, T.J. Remote Estimation of Canopy Chlorophyll Content in Crops. Geophys. Res. Lett. 2005, 32, 1–4. [Google Scholar] [CrossRef] [Green Version]
  39. Association of Official Agricultural Chemistry. Official Methods of Analysis International, 18th ed.; AOAC: Washington, DC, USA, 2005. [Google Scholar]
  40. Li, Y.; Sun, Y.; Liao, S.; Zou, G.; Zhao, T.; Chen, Y.; Yang, J.; Zhang, L. Effects of Two Slow-Release Nitrogen Fertilizers and Irrigation on Yield, Quality, and Water-Fertilizer Productivity of Greenhouse Tomato. Agric. Water Manag. 2017, 186, 139–146. [Google Scholar] [CrossRef]
  41. Nyabundi, J.O.; Hsia, T.C. Effects of Water Stress on Growth and Yield of Field-Grown Tomatoes. H. Biomass Partitioning between Vegetative and Productive Growth. E. Afr. Agric. J. 2009, 55, 53–61. [Google Scholar]
  42. Selahle, M.K.; Sivakumar, D.; Soundy, P. Effect of Photo-Selective Nettings on Post-Harvest Quality and Bioactive Compounds in Selected Tomato Cultivars. J. Sci. Food Agric. 2014, 94, 2187–2195. [Google Scholar] [CrossRef]
  43. Abdul-Hammed, M.; Bello, I.A.; Oladoye, S.O. Simultaneous Spectrophotometric Determination of Lycopene and Beta-Carotene Concentrations in Carotenoid Mixtures of the Extracts from Tomatoes, Papaya and Orange Juice. Pak. J. Sci. Ind. Res. Ser. B Biol. Sci. 2013, 56, 90–97. [Google Scholar] [CrossRef]
  44. Bunghez, I.R.; Raduly, M.; Doncea, S.; Aksahin, I.; Ion, R.M. Lycopene Determination in Tomatoes by Different Spectral Techniques (UV-VIS, FTIR and HPLC). Dig. J. Nanomater. Biostruct. 2011, 6, 1349–1356. [Google Scholar]
  45. Wu, I. A Simple Evapotranspiration Model for Hawaii: The Hargreaves Model; Engineer’s Notebook No. 106; Cooperative Extension Service, CTAHR: Honolulu, HI, USA, 1997; pp. 1–2. [Google Scholar]
  46. Schelde, K.; Ringgaard, R.; Herbst, M.; Thomsen, A.; Friborg, T.; Søgaard, H. Comparing Evapotranspiration Rates Estimated from Atmospheric Flux and TDR Soil Moisture Measurements. Vadose Zone J. 2011, 10, 78–83. [Google Scholar] [CrossRef]
  47. Kirda, C.; Cetin, M. Evapotranspiration Measurements of Greenhouse Grown Tomato, Melon and Cucumber. In Proceedings of the M. Şefik Yeşilsoy International Symposium on Arid Region Soils (YISARS), International Agrohydrology Research and Training Center, İzmir, Turkey, 21–24 September 1998; pp. 73–78. [Google Scholar]
  48. Valdés, H.; Ortega-Farias, S.; Argote, M.; Leyton, B.; Olioso, A.; Paillán, H. Estimation of Evapotranspiration over a Greenhouse Tomato Crop Using the Penman-Monteith Equation. Acta Hortic. 2004, 664, 477–482. [Google Scholar] [CrossRef]
  49. Parkash, V.; Singh, S. A Review on Potential Plant-Basedwater Stress Indicators for Vegetable Crops. Sustainability 2020, 12, 3945. [Google Scholar] [CrossRef]
  50. Shi, X.; Han, W.; Zhao, T.; Tang, J. Decision support system for variable rate irrigation based on UAV multispectral remote sensing. Sensors 2019, 19, 2880. [Google Scholar] [CrossRef] [Green Version]
  51. Albergel, C.; Dutra, E.; Munier, S.; Calvet, J.C.; Munoz-Sabater, J.; De Rosnay, P.; Balsamo, G. ERA-5 and ERA-Interim Driven ISBA Land Surface Model Simulations: Which One Performs Better? Hydrol. Earth Syst. Sci. 2018, 22, 3515–3532. [Google Scholar] [CrossRef] [Green Version]
  52. Allen, G.; Pereira, S.; Raes, D.; Smith, M. Crop Evapotranspiration. FAO Irrig. Drain. Pap. 1998, 56, 300. [Google Scholar]
  53. Sharma, S.K.; Le-Marguer, M. Lycopene in Tomatoes and Tomato Pulp Fractions. Ital. J. Food Sci. 1996, 2, 107–113. [Google Scholar]
  54. Pék, Z.; Szuvandzsiev, P.; Daood, H.; Neményi, A.; Helyes, L. Effect of Irrigation on Yield Parameters and Antioxidant Profiles of Processing Cherry Tomato. Open Life Sci. 2014, 9, 383–395. [Google Scholar] [CrossRef] [Green Version]
  55. Birhanu, K.; Tilahun, K. Fruit Yield and Quality of Drip-Irrigated Tomato under Deficit Irrigation. Afr. J. Food Agric. Nutr. Dev. 2010, 10, 2142. [Google Scholar] [CrossRef]
  56. Alordzinu, K.E.; Jiuhao, L.; Appiah, S.A.; Aasmi, A.A.L.; Blege, P.K.; Afful, E.A. Water Stress Affects the Physio-Morphological Development of Tomato Growth. Afr. J. Agric. Res. 2021, 17, 733–742. [Google Scholar] [CrossRef]
  57. Lu, J.; Shao, G.; Cui, J.; Wang, X.; Keabetswe, L. Yield, Fruit Quality and Water Use Efficiency of Tomato for Processing under Regulated Deficit Irrigation: A Meta Analysis. Agric. Water Manag. 2019, 222, 30. [Google Scholar] [CrossRef]
  58. Takács, S.; Pék, Z.; Csányi, D.; Daood, H.G.; Szuvandzsiev, P.; Palotás, G.; Helyes, L. Influence of Water Stress Levels on the Yield and Lycopene Content of Tomato. Water 2020, 12, 2165. [Google Scholar] [CrossRef]
  59. Zhang, C.; Filella, I.; Liu, D.; Ogaya, R.; Llusià, J.; Asensio, D.; Peñuelas, J. Photochemical Reflectance Index (PRI) for Detecting Responses of Diurnal and Seasonal Photosynthetic Activity to Experimental Drought and Warming in a Mediterranean Shrubland. Remote Sens. 2017, 9, 1189. [Google Scholar] [CrossRef] [Green Version]
  60. Espinoza, C.Z.; Khot, L.R.; Sankaran, S.; Jacoby, P.W. High Resolution Multispectral and Thermal Remote Sensing-Based Water Stress Assessment in Subsurface Irrigated Grapevines. Remote Sens. 2017, 9, 961. [Google Scholar] [CrossRef] [Green Version]
  61. Liu, J.; Hu, T.; Feng, P.; Wang, L.; Yang, S. Tomato Yield and Water Use Efficiency Change with Various Soil Moisture and Potassium Levels during Different Growth Stages. PLoS ONE 2019, 14, e0213643. [Google Scholar] [CrossRef]
  62. Nuruddin, M.M.; Madramootoo, C.A.; Doods, G.T. Effects of Water Stress at Different Growth Stages on Greenhouse Tomato Yield and Quality. Am. Soc. Hortic. Sci. 2003, 37, 1389–1393. [Google Scholar] [CrossRef] [Green Version]
  63. Zhang, L.; Zhang, H.; Niu, Y.; Han, W. Mapping Maize Water Stress Based on UAV Multispectral Remote Sensing. Remote Sens. 2019, 11, 605. [Google Scholar] [CrossRef] [Green Version]
  64. Gerhards, M.; Schlerf, M.; Mallick, K.; Udelhoven, T. Challenges and Future Perspectives of Multi- Hyperspectral Thermal Infrared Remote Sensing for Crop Water-Stress Detection: A Review. Remote Sens. 2019, 11, 1240. [Google Scholar] [CrossRef] [Green Version]
  65. Zhang, J.; Wang, J.; Chen, J.; Song, H.; Li, S.; Zhao, Y.; Tao, J.; Liu, J. Soil Moisture Determines Horizontal and Vertical Root Extension in the Perennial Grass Lolium perenne L. Growing in Karst Soil. Front. Plant Sci. 2019, 10, 629. [Google Scholar] [CrossRef] [PubMed]
  66. Patanè, C.; Tringali, S.; Sortino, O. Effects of Deficit Irrigation on Biomass, Yield, Water Productivity and Fruit Quality of Processing Tomato under Semi-Arid Mediterranean Climate Conditions. Sci. Hortic. 2011, 129, 590–596. [Google Scholar] [CrossRef]
  67. Gamon, J.A.; Huemmrich, K.F.; Wong, C.Y.S.; Ensminger, I.; Garrity, S.; Hollinger, D.Y.; Noormets, A.; Peñuelas, J. A Remotely Sensed Pigment Index Reveals Photosynthetic Phenology in Evergreen Conifers. Proc. Natl. Acad. Sci. USA 2016, 113, 13087–13092. [Google Scholar] [CrossRef] [Green Version]
  68. Lichtenthaler, H.K. Synthesis of Prenyllipids in Vascular Plants (Including Chlorophylls, Carotenoids, Prenylquinones). Vol. I, Part I: Basic Principles; Matsui, A., Black, C.C., Eds.; CRC Press: Boca Raton, FL, USA, 1982; Volume 1, pp. 405–421. [Google Scholar]
  69. Lahoz, I.; Pérez-de-Castro, A.; Valcárcel, M.; Macua, J.I.; Beltránd, J.; Rosellóc, S.; Cebolla-Cornejo, J. Effect of Water Deficit on the Agronomical Performance and Quality of Processing Tomato. Sci. Hortic. 2016, 200, 55–65. [Google Scholar] [CrossRef] [Green Version]
Figure 1. Standard calibration curve for the determination of lycopene and β-carotene ((a) is absorption at 451 nm, (b) = 472 nm, (c) = 485 nm, and (d) = 502 nm wavelength, respectively).
Water 14 01753 g001
Figure 2. Meteorological data from the experimental site; data used are the means.
Water 14 01753 g002
Figure 3. The Hargreaves–Samani model and time-domain reflectometry (TDR)-based estimates of monthly evapotranspiration from September 2020 to May 2021.
Water 14 01753 g003
Figure 4. Correlation between HS-based evapotranspiration and TDR-based soil water readings for sandy loam and silty loam soils.
Water 14 01753 g004
Figure 5. Disparities in soil water content in sandy loam and silty loam soils during the tomato growing season.
Water 14 01753 g005
Figure 6. Absorbance spectra of β-carotene and lycopene under different water stress levels in two different soil types (SA = silty loam soil; SB = sandy loam soil).
Water 14 01753 g006
Figure 7. Effects of water stress level and soil type on marketable yield (kg of plant−1) of tomatoes (the same letter indicate no significant difference).
Water 14 01753 g007
Table 1. Factorial design for water stress levels and soil type.
Factors Level of Factors Descriptions
Soil typeSA Sandy loam soil
SBSilty loam soil
Water stress Treatment70–100 %FCNo water stress
60–70 %FCModerate water stress
50–60 %FCMid-moderate water stresss
40–50 %FCHigh water stress
Note: FC represents field capacity, SA is sandy loam soil, and SB is silty loam soil.
Table 2. Results of soil physical properties.
Soil TextureSand (%)Silt (%)Clay (%)Bulk Density (g/cm3)Saturation Point (%)Field Capacity (%)Permanent Wilting Point (%)Porosity (m3/m3)Permeability (cm/hour)
Sandy loam75.4204.61.34482190.472.34
Silty loam43.5339.9316.631.3245.7331190.40.23
Table 3. Results of soil chemical properties.
Soil TexturepHO.M (g/kg)Total N (g/kg)Total P (g/kg)Total K (G/KG)Alkalized N (mg/kg)Avail. P (mg/kg)Avail. K (mg/kg)
Sandy loam5.6415.911.230.889.3450.28195.72428.43
Silty loam5.322.971.5180.86519.5972.7128.2585.5
Table 4. Climatological information collected at various phases of crop development.
Growth StagesRH (%)Ra (w/m2)TmaxTmaxTmean (℃)VPD (kPa)λ (MJ kg−1)
Vegetative Stage62.3300.3126.82425.40.332.43 MJ/P
Anthesis Stage67.6297.9824.623.223.90.39
Fruit Expansion Stage57.1276.125.319.122.20.37
Senescence Stage60.1290.525.723.524.60.38
All values are the mean of each parameter. RH is the relative humidity; Ra is the solar radiance; T is the air temperature; VPD is the vapor pressure deficit, and λ is the latent heat of vaporization (MJ kg−1).
Table 5. Irrigation water applied for tomatoes throughout the growing cycle for each growth stage for the different treatments in sandy loam soil (SA).
Treatment (% FC)Duration (Days)Irrigation Water Applied (mm)
70–10060–7050–6040–50
SASASASASA
Vegetative stage305032.527.522.5
Anthesis stage4060.139.133.127.1
Fruit expansion stage507045.538.531.5
Senescence stage3045.829.825.220.6
Total150225.9146.9124.3101.7
Table 6. Irrigation water applied for tomatoes throughout the growing cycle for each growth stage for the different treatments in silty loam soil (SB).
Treatment (% FC)Duration (Days)Irrigation Water Applied (mm)
70–10060–7050–6040–50
SBSBSBSBSB
Vegetative stage325535.830.324.8
Anthesis stage406542.323.329.3
Fruit expansion stage507347.540.232.9
Senescence stage315032.527.522.5
Total153243158.1121.3109.5
Table 7. Above-ground biomass and below-ground biomass under different water stress levels and in sandy loam (SA) and silty loam soils (SB).
Soil TypeWater Stress FC%Above-Ground Biomass kg/plantBelow-Ground Biomass kg/plantChlorophyll Content (SPAD)
SA70–10056.722.754.3
60–7048.413.051.2
50–6044.010.150.9
40–503909.548.0
SB70–10060.816.957.3
60–7043.319.355.5
50–6034.515.254.1
40–5023.213.152.0
Factors WSLEVELS
70–10052.0 a24.2 a53.9 a
60–7045.2 b15.2 bc51.9 b
50–6041.5 bc13.7 c51.2 bc
40–5030.2 c11.1 d49.3 c
SSA50.3 ab15.7 bc52.0 b
SB53.0 a16.6 b54.2 a
ANOVARWSSSS
Rtv −WS0.4120.5900.924
RSSSS
Rtv−S0.1130.3390.831
RWS−SSSS
RtvWS−S0.0170.0410.461
Values represent mean ± standard deviation. NS = not significant; S means significant, p < 0.05, LSD = least significant difference; RWS means the significant level of water stress treatment; RS means the significant level of soil type; RWS−S means the significant level of the water stress treatment and soil type effect; Rtv−WS, Rtv−S, and Rtv −WS × S mean the contribution of each factor to the total variance of the parameter in the same column. Different letters (a, b, c) indicate significant differences.
Table 8. Tomato firmness, soluble solids, pH, total acids, ascorbic acid, carotene, and lycopene contents under different water stress levels and in sandy loam and silty loam soils.
Soil TypeWater Stress FC%Firmness (×0.1 MPa)Soluble Solids (%)pHTitratable Acids (%)Ascorbic Acid mg/100 gCarotene mg/100 gLycopene mg/100 g
PeeledUnpeeled
SA70–1005.012.55.84.50.3519.1 8.58.7
60–704.611.15.84.30.4119.6 9.19.6
50–604.910.36.64.10.4820.5 9.69.6
40–504.09.97.03.80.521.310.210.0
SB70–1005.713.26.54.70.4515.68.46.8
60–704.612.96.84.20.5016.59.17.1
50–604.313.07.54.10.5617.610.59.1
40–504.211.58.24.10.7122.013.09.3
Factors WSLEVELS
70–1004.1 bc10.9 c4.8 c5.5 ab0.3 d19.0 b8.9 c9.4 b
60–704.5 b11.1 b4.3 c6.3 a0.4 c20.0 ab9.71 b10.6 a
50–604.5 b11.5 b6.5 bc5.1 ab0.5 b20.9 ab11.12 ab10.5 a
40–505.6 a12.2 a7.5 b3.1 c0.6 b22.59 a12.04 a10.8 a
SSA5.0 a12.7 a7.1 b4.7 b0.6 b21.1 a9.3 b10.0 ab
SB5.3 a12.5 a8.5 a5.0 ab0.7 a19.0 c13.0 a9.01 b
ANOVARWSSSSSSSSS
Rtv−WS0.0320.670.750.0310.1210.1010.7330.93
RSNSNSSSSSSS
Rtv−S0.210.5210.6110.0020.2510.4930.920.67
RWS−SSSSSSSSS
RtvWS−S0.3160.2720.5210.1030.0370.890.8560.962
Values represent mean ± standard deviation. NS = not significant; S means significant, p < 0.05, LSD = least significant difference; RWS means the significant level of water stress treatment; RS means the significant level of soil type; RWS−S means the significant level of the water stress treatment and soil type effect; Rtv−WS, Rtv−S, and Rtv−WS × S mean the contribution of each factor to the total variance of the parameter in the same column. Different letters (a, b, c) indicate significant differences.
Publisher’s Note: MDPI stays neutral with regard to jurisdictional claims in published maps and institutional affiliations.

