
Drivers of Turbidity and Its Seasonal Variability at Herschel Island Qikiqtaruk (Western Canadian Arctic)


1
Institute of Geosciences, University of Potsdam, 14476 Potsdam, Germany
2
Permafrost Research Section, Alfred Wegener Institute Helmholtz Centre for Polar and Marine Science, 14473 Potsdam, Germany
*
Author to whom correspondence should be addressed.
†
Current Address: National Renewable Energy Laboratory, Golden, CO 80401, USA.
Water 2022, 14(11), 1751; https://doi.org/10.3390/w14111751
Submission received: 4 February 2022
/
Revised: 16 May 2022
/
Accepted: 24 May 2022
/
Published: 30 May 2022
(This article belongs to the Special Issue Erosion and Sediment Transport Processes in Coastal Waters)
Abstract
:The Arctic is greatly affected by climate change. Increasing air temperatures drive permafrost thaw and an increase in coastal erosion and river discharge. This results in a greater input of sediment and organic matter into nearshore waters, impacting ecosystems by reducing light transmission through the water column and altering biogeochemistry. This potentially results in impacts on the subsistence economy of local people as well as the climate due to the transformation of suspended organic matter into greenhouse gases. Even though the impacts of increased suspended sediment concentrations and turbidity in the Arctic nearshore zone are well-studied, the mechanisms underpinning this increase are largely unknown. Wave energy and tides drive the level of turbidity in the temperate and tropical parts of the world, and this is generally assumed to also be the case in the Arctic. However, the tidal range is considerably lower in the Arctic, and processes related to the occurrence of permafrost have the potential to greatly contribute to nearshore turbidity. In this study, we use high-resolution satellite imagery alongside in situ and ERA5 reanalysis data of ocean and climate variables in order to identify the drivers of nearshore turbidity, along with its seasonality in the nearshore waters of Herschel Island Qikiqtaruk, in the western Canadian Arctic. Nearshore turbidity correlates well to wind direction, wind speed, significant wave height, and wave period. Nearshore turbidity is superiorly correlated to wind speed at the Beaufort Shelf compared to in situ measurements at Herschel Island Qikiqtaruk, showing that nearshore turbidity, albeit being of limited spatial extent, is influenced by large-scale weather and ocean phenomenons. We show that, in contrast to the temperate and tropical ocean, freshly eroded material is the predominant driver of nearshore turbidity in the Arctic, rather than resuspension, which is caused by the vulnerability of permafrost coasts to thermo-erosion.
1. Introduction
The Arctic is disproportionally strongly affected by climate change [1,2]. It affects the biophysical system in multiple ways: intensified permafrost thaw [3], increased river discharge [4], and intensified coastal erosion [5]. Permafrost coasts are especially vulnerable to increasing air temperatures, as frozen sediments can thaw and provide lower resistance against physical erosion such as wave erosion [6,7]. This has the potential to release the vast pools of organic matter, which are stored in permafrost [8], to release carbon and nutrients to nearshore waters [5], or to directly emit greenhouse gases into the atmosphere [9,10,11].
Arctic nearshore areas are defined as seawater shallower than 20 m along coastlines [5] and have witnessed increased sediment input from river discharge and coastal erosion over the past few decades [12,13,14]. Permafrost coasts in the Arctic are eroding at a mean annual rate of 0.5 m/a [15]. This leads to high sediment loads in the nearshore zone, which likely contain large amounts of carbon given the high organic matter content of coastal permafrost [5]. Sediment fluxes from coastal erosion in the Arctic are not well-known due to the limited accessibility of most Arctic study sites. The few studies attempting to calculate sediment and carbon fluxes from coastal erosion to the Arctic Ocean report fluxes of ~430 Tg sediment per year and 4.9–46.54 Tg carbon per year [15,16,17,18].
Upon entering the nearshore waters, sediment and organic matter are exposed to a multitude of processes. Carbon-rich suspended sediments could be transformed into greenhouse gases and transferred to the atmosphere [19]. Coastal erosion, resuspension, and longshore sediment transport cause a regular supply of carbon-rich sediments in surface waters. Despite this relevance, nearshore zones remain understudied in Arctic oceanography [5]. Highly suspended sediment loads increase water turbidity, which reduces light penetration in the water column [20]. This, in turn, will likely reduce primary production, which impacts local food webs and eventually the subsistence economy of local people [21]. All these processes have been considered in isolation, but there is limited understanding of their interplay in nearshore waters, which is detrimental to the compilation of comprehensive biogeochemical budgets for the nearshore zone.
The drivers of nearshore turbidity are generally assumed to be wave energy and tides, which cause the resuspension of sediments [22]. However, these assumptions were made in the temperate and tropical oceans. The tidal range in the Arctic is generally lower than in most parts of the world’s ocean [23], and wave heights are also generally lower in the Arctic Ocean due to reduced fetch lengths caused by sea ice [15,24], even in the summer months, since the sea ice in the Arctic Ocean is not melting entirely. Despite these factors, sediment load is extraordinarily high in Arctic coastal and nearshore waters [25], because of the low water depths of the Arctic shelves and high terrestrial sediment supply. We, therefore, hypothesize that the drivers of nearshore turbidity in the Arctic nearshore zone go beyond waves and tides.
The absence of infrastructure to document the potential multitude of processes driving turbidity has hampered the ability to provide an Arctic-specific quantitative understanding of the link between processes other than tides and waves with turbidity. Remote sensing plays a crucial role in regional turbidity observations because it provides the spatial and temporal coverage needed to link turbidity to a wide range of environmental drivers. Turbidity caused by suspended sediments generally shows a high correlation to the water-leaving reflectance in the red and near-infrared (NIR) parts of the electromagnetic spectrum [26]. Semi-empirical algorithms to relate turbidity from water-leaving reflectance have been widely used during the past decade [27,28] and were even recently validated for the Arctic nearshore zone [29]. Remotely sensed turbidity retrieval is still limited by the availability of cloud-free images, especially in the Arctic, where the ocean is covered by ice for 8 months of the year.
In this study, we used high-resolution satellite imagery, which covers most parts of the 2019 summer season at Herschel Island Qikiqtaruk in the western Canadian Arctic, to identify and analyze seasonal variations in nearshore turbidity. ERA5 ocean and climate variables were used together with in situ measurements to identify drivers and influences on nearshore turbidity.
2. Methods
2.1. Study Area
The focus regions of this study are the coastal and nearshore waters around Herschel Island Qikiqtaruk (HIQ) on the Canadian Beaufort Shelf (Figure 1). The Mackenzie River is the main freshwater source of the shelf, with a maximum discharge of 35,000 m3/s during its freshet in May [30,31,32]. Coastal erosion and the associated sediment supply to the nearshore zone are limited to the open-water season, the part of the year when the ocean is not covered by ice, which generally spans from mid-June to the end of September [33]. However, sea ice is generally found on the Canadian Beaufort Shelf yearlong. Permafrost along the Yukon Coast has a high ice content [34], making it especially vulnerable to increasing air temperatures, and is rich in buried organic material [35]. The climate in the southern Beaufort Sea is characterized by long, cold winters, and short summers [36]. It is classified as Dsc (subarctic climate) in the Köppen–Geiger climate classification [37]. Winds predominantly blow from ESE and NW directions [38]. Wind direction and wind speed have the potential to influence hydrodynamics such as currents [30] and upwelling [39].
2.2. Satellite Imagery
In this study, satellite images recorded by Landsat 7, Landsat 8, and Sentinel 2 during the open-water season of 2019 were used to map turbidity in space and time. Landsat imagery was downloaded from the United States Geological Survey (USGS) Earth Explorer as a level 1T product. Sentinel 2 imagery was downloaded as a level 1C product from the European Space Agency (ESA) SciHub. Atmospheric correction toward water-leaving reflectance was performed using the ACOLITE software (version 20210114.0, RBINS, Oostende, Belgium) [40,41], and the dark spectrum fitting algorithm was applied. To relate turbidity to water-leaving reflectance, the Arctic Nearshore Turbidity Algorithm (ANTA) [29] was applied to each scene.
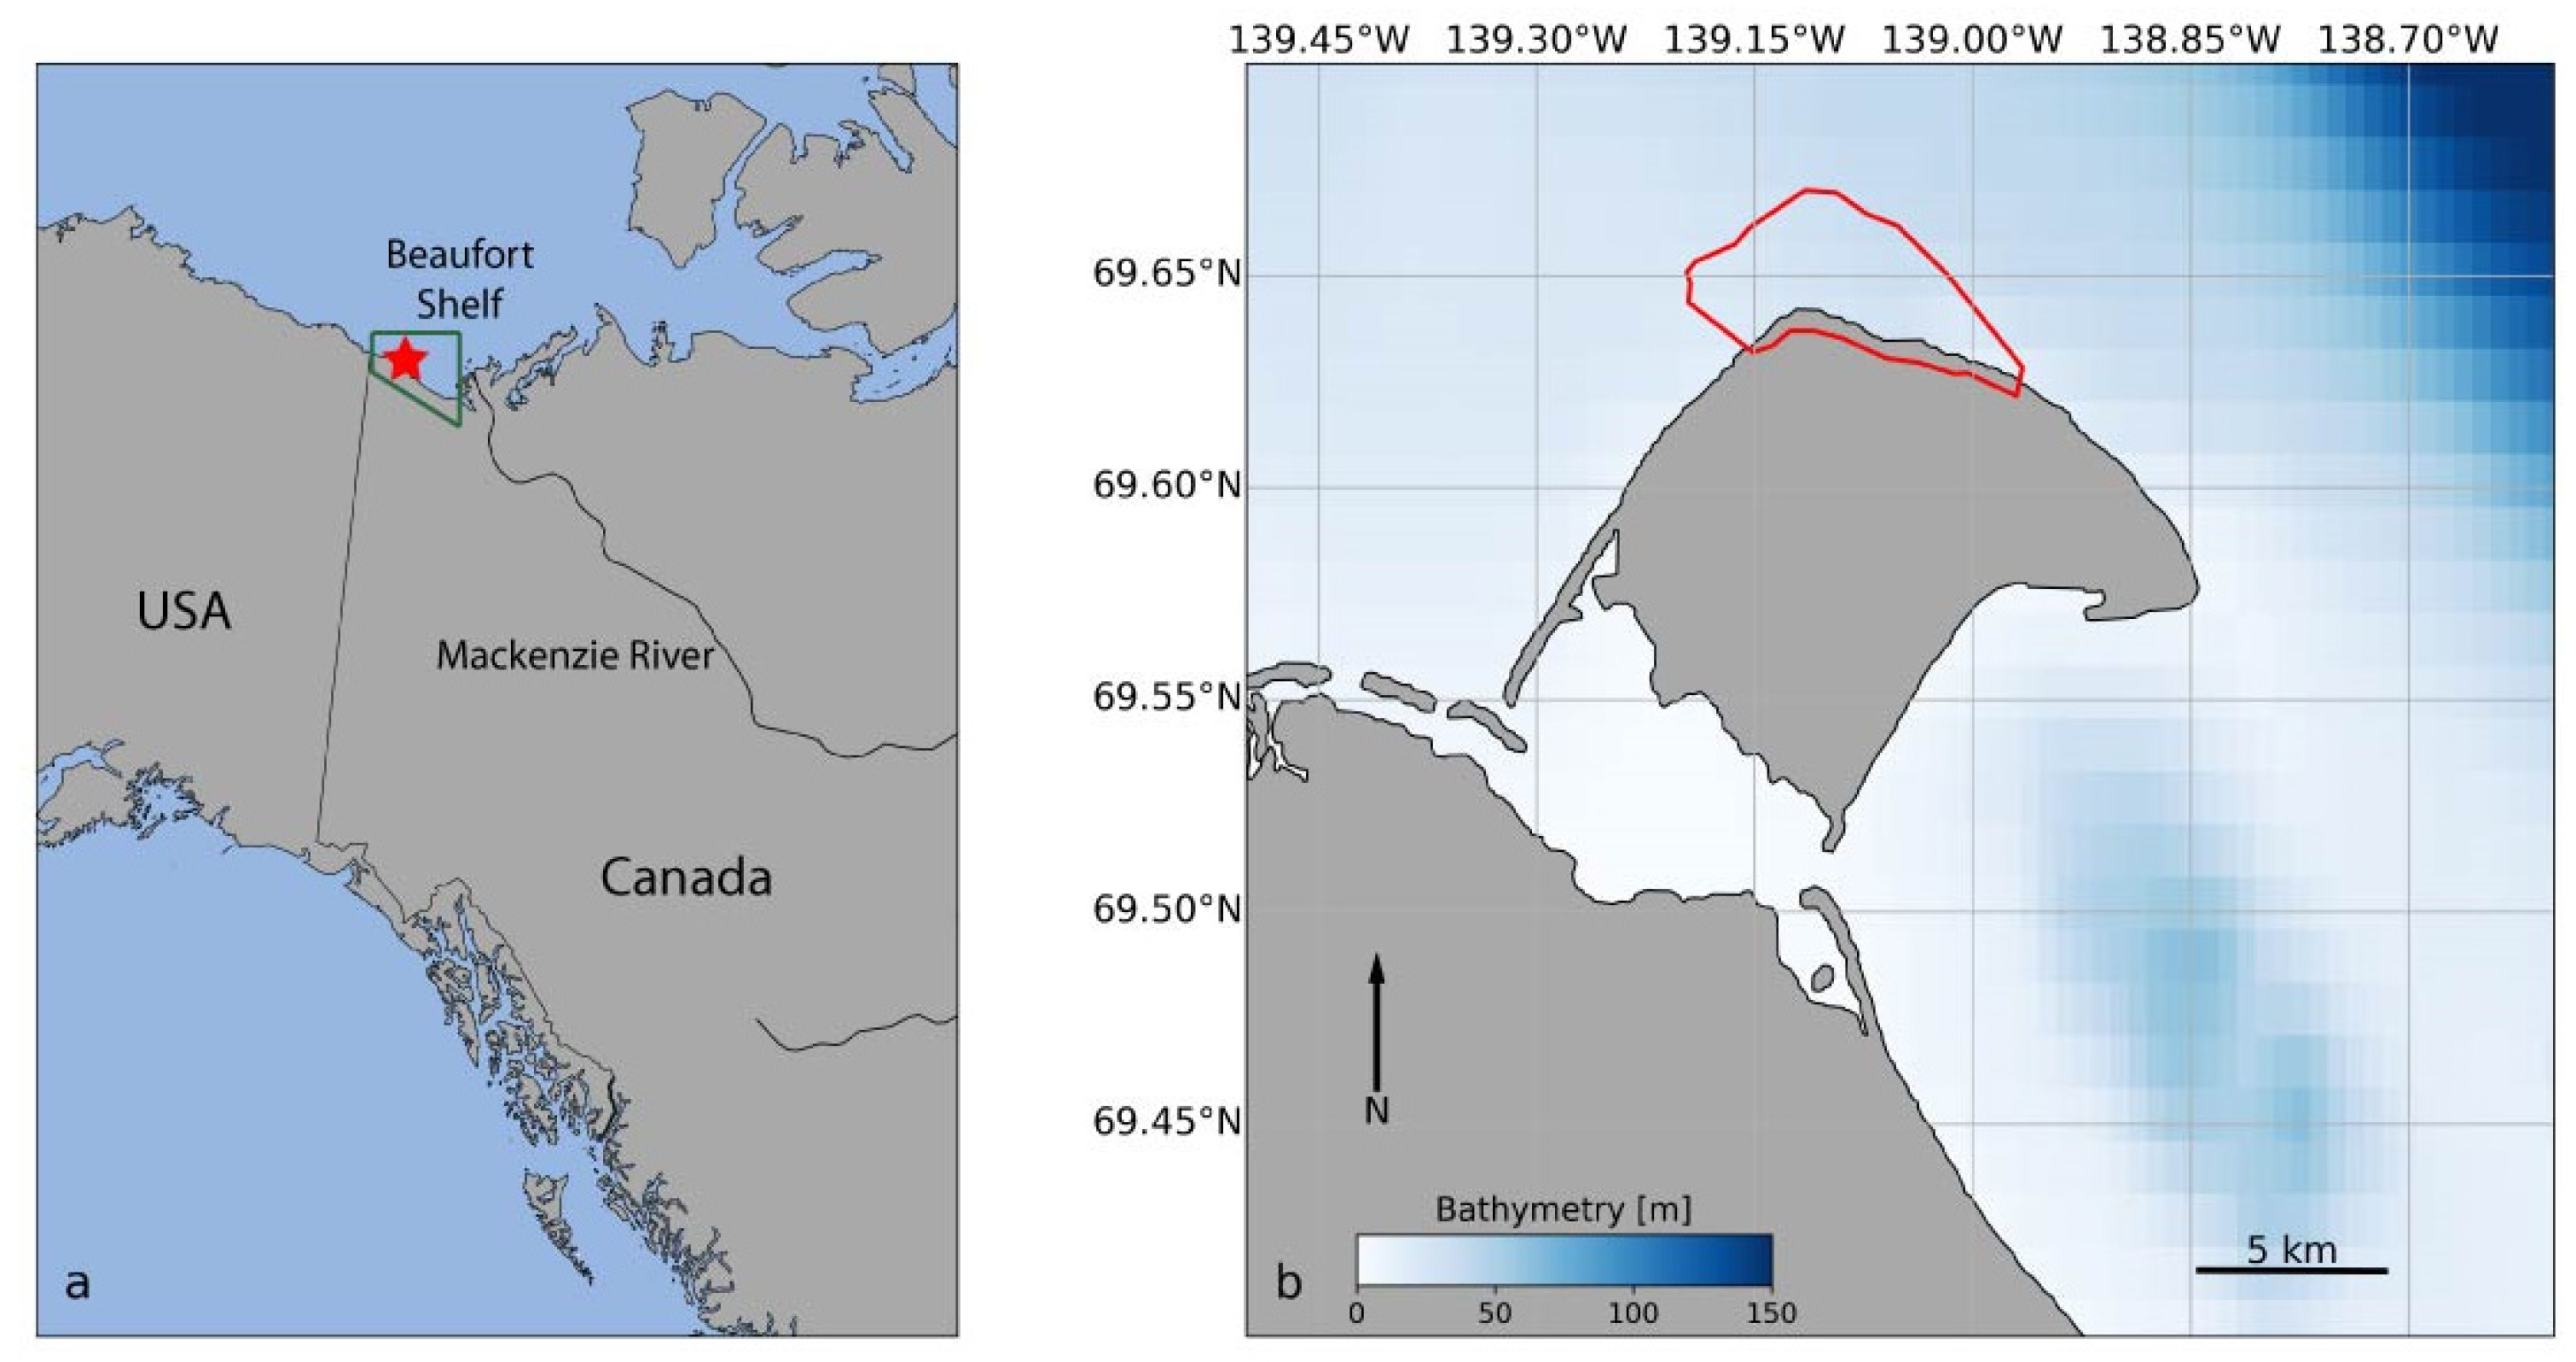
Based on the results presented in [29], an area of increased turbidity along the N and NW coast of HIQ was identified (red area in Figure 1b). These areas are expected to contain large amounts of eroded sediment, potentially holding large amounts of organic matter. This makes these areas especially important to monitor, as they have the largest impact on climate warming. For each scene, the average turbidity within this area of interest was calculated and related to the daily averages of external influences.
2.3. In Situ Data
In situ measurements from the weather station on HIQ (69.5° N, 139.25° W) were downloaded from the Environment Canada weather archive [42]. Downloaded parameters were air temperature, wind speed, and wind direction for the time period between 1 June and 30 September 2019. Data at the weather station were recorded in hourly intervals. Mean values were assigned to each satellite image using the 24 measurements prior to 15:00, in order to correspond with the satellite imagery, which was also recorded at 15:00. Daily discharge data from the Mackenzie River at Arctic Red River were acquired as preliminary data from Environment and Climate Change Canada (ECCC). The preliminary data did not pass quality checks; however, at the time of publication, these are the best data available. It is noted that, due to the pending quality checks, this might change in the future.
2.4. Reanalysis of Data
ERA5 is the fifth generation of reanalysis datasets from ECMWF, using an advanced 4D-var data assimilation scheme [43]. The variables used are air temperature, wind speed, wind direction, sea-ice concentration, and sea-surface temperature, which are all at an hourly temporal resolution and a spatial resolution of approximately 0.25 degrees. Significant height of combined wind waves and swell, as well as peak wave period, are at a 0.5-degree spatial resolution. All variables were extracted from the domain bounds of 68.5–70 N and 136–142 W (green are in Figure 1a), and the area-weighted averages over all the latitudes and longitude grid cells within this bounding box were calculated. The hourly timesteps were then averaged over the 24 h prior to 15:00, in order to correspond with the satellite imagery recording. ERA5 [43] was downloaded from the Copernicus Climate Change Service (C3S) Climate Data Store.
3. Results and Discussion
3.1. Time Series Analysis
3.1.1. Ice Breakup
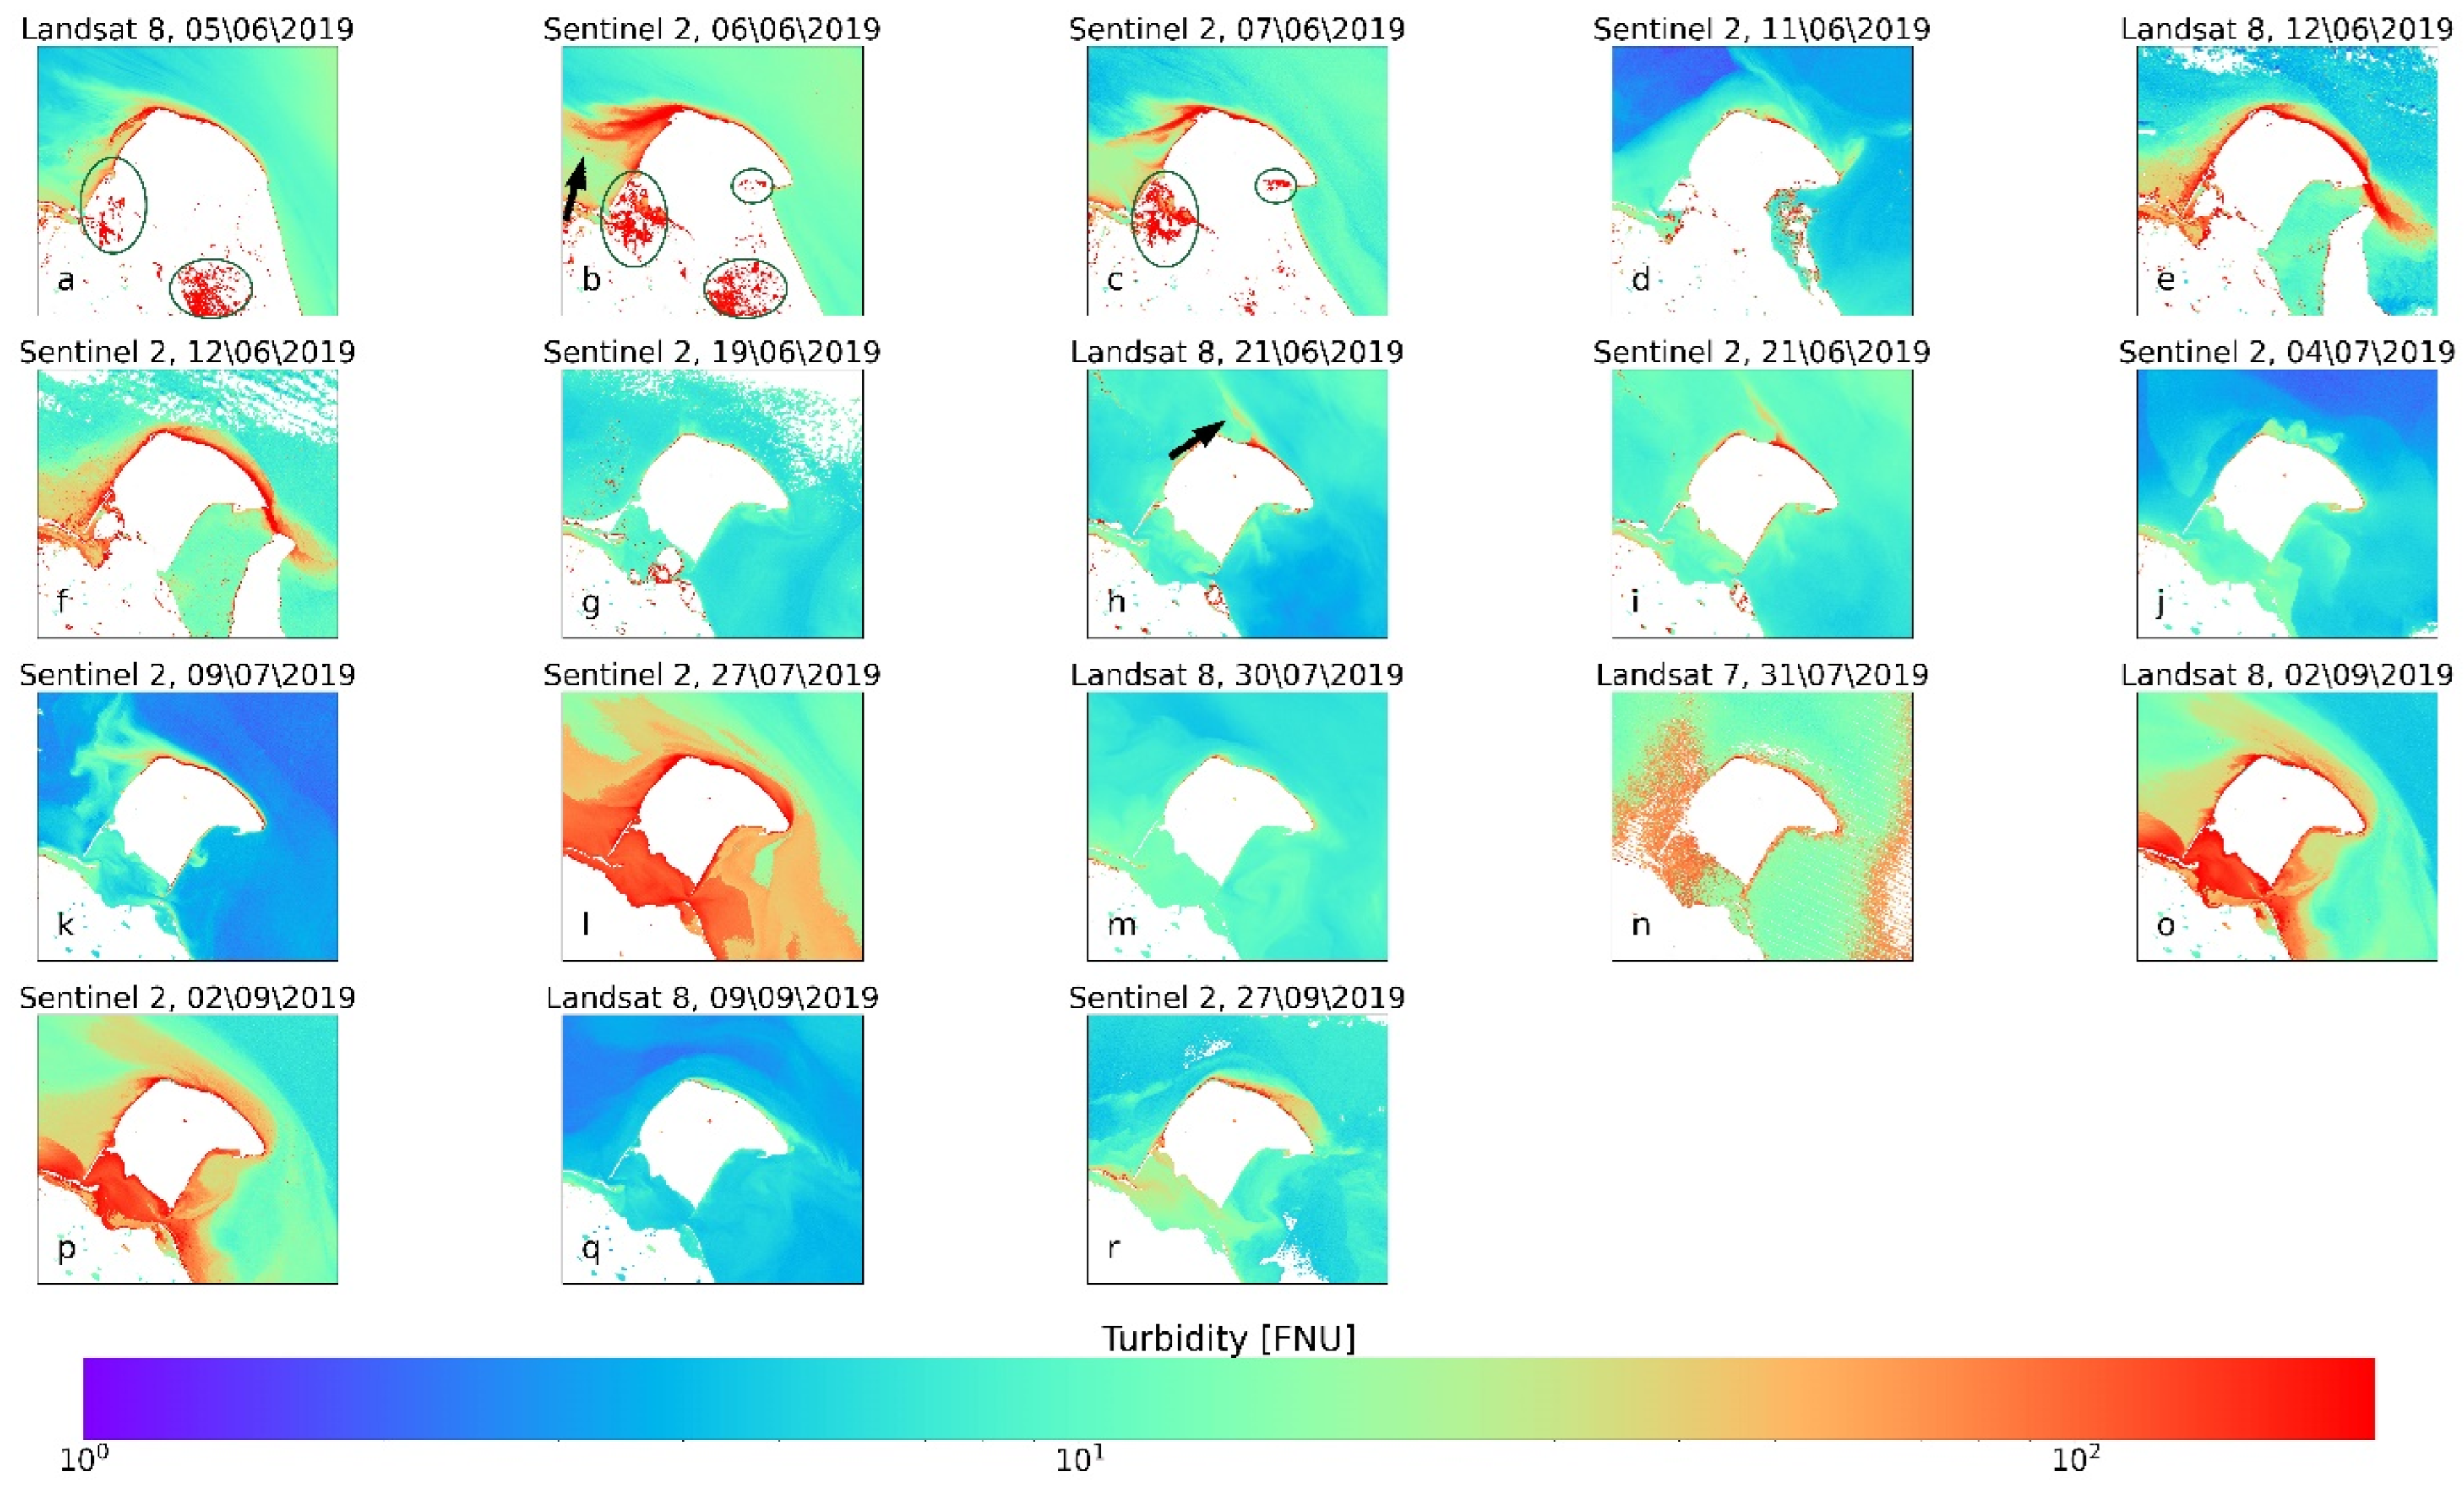
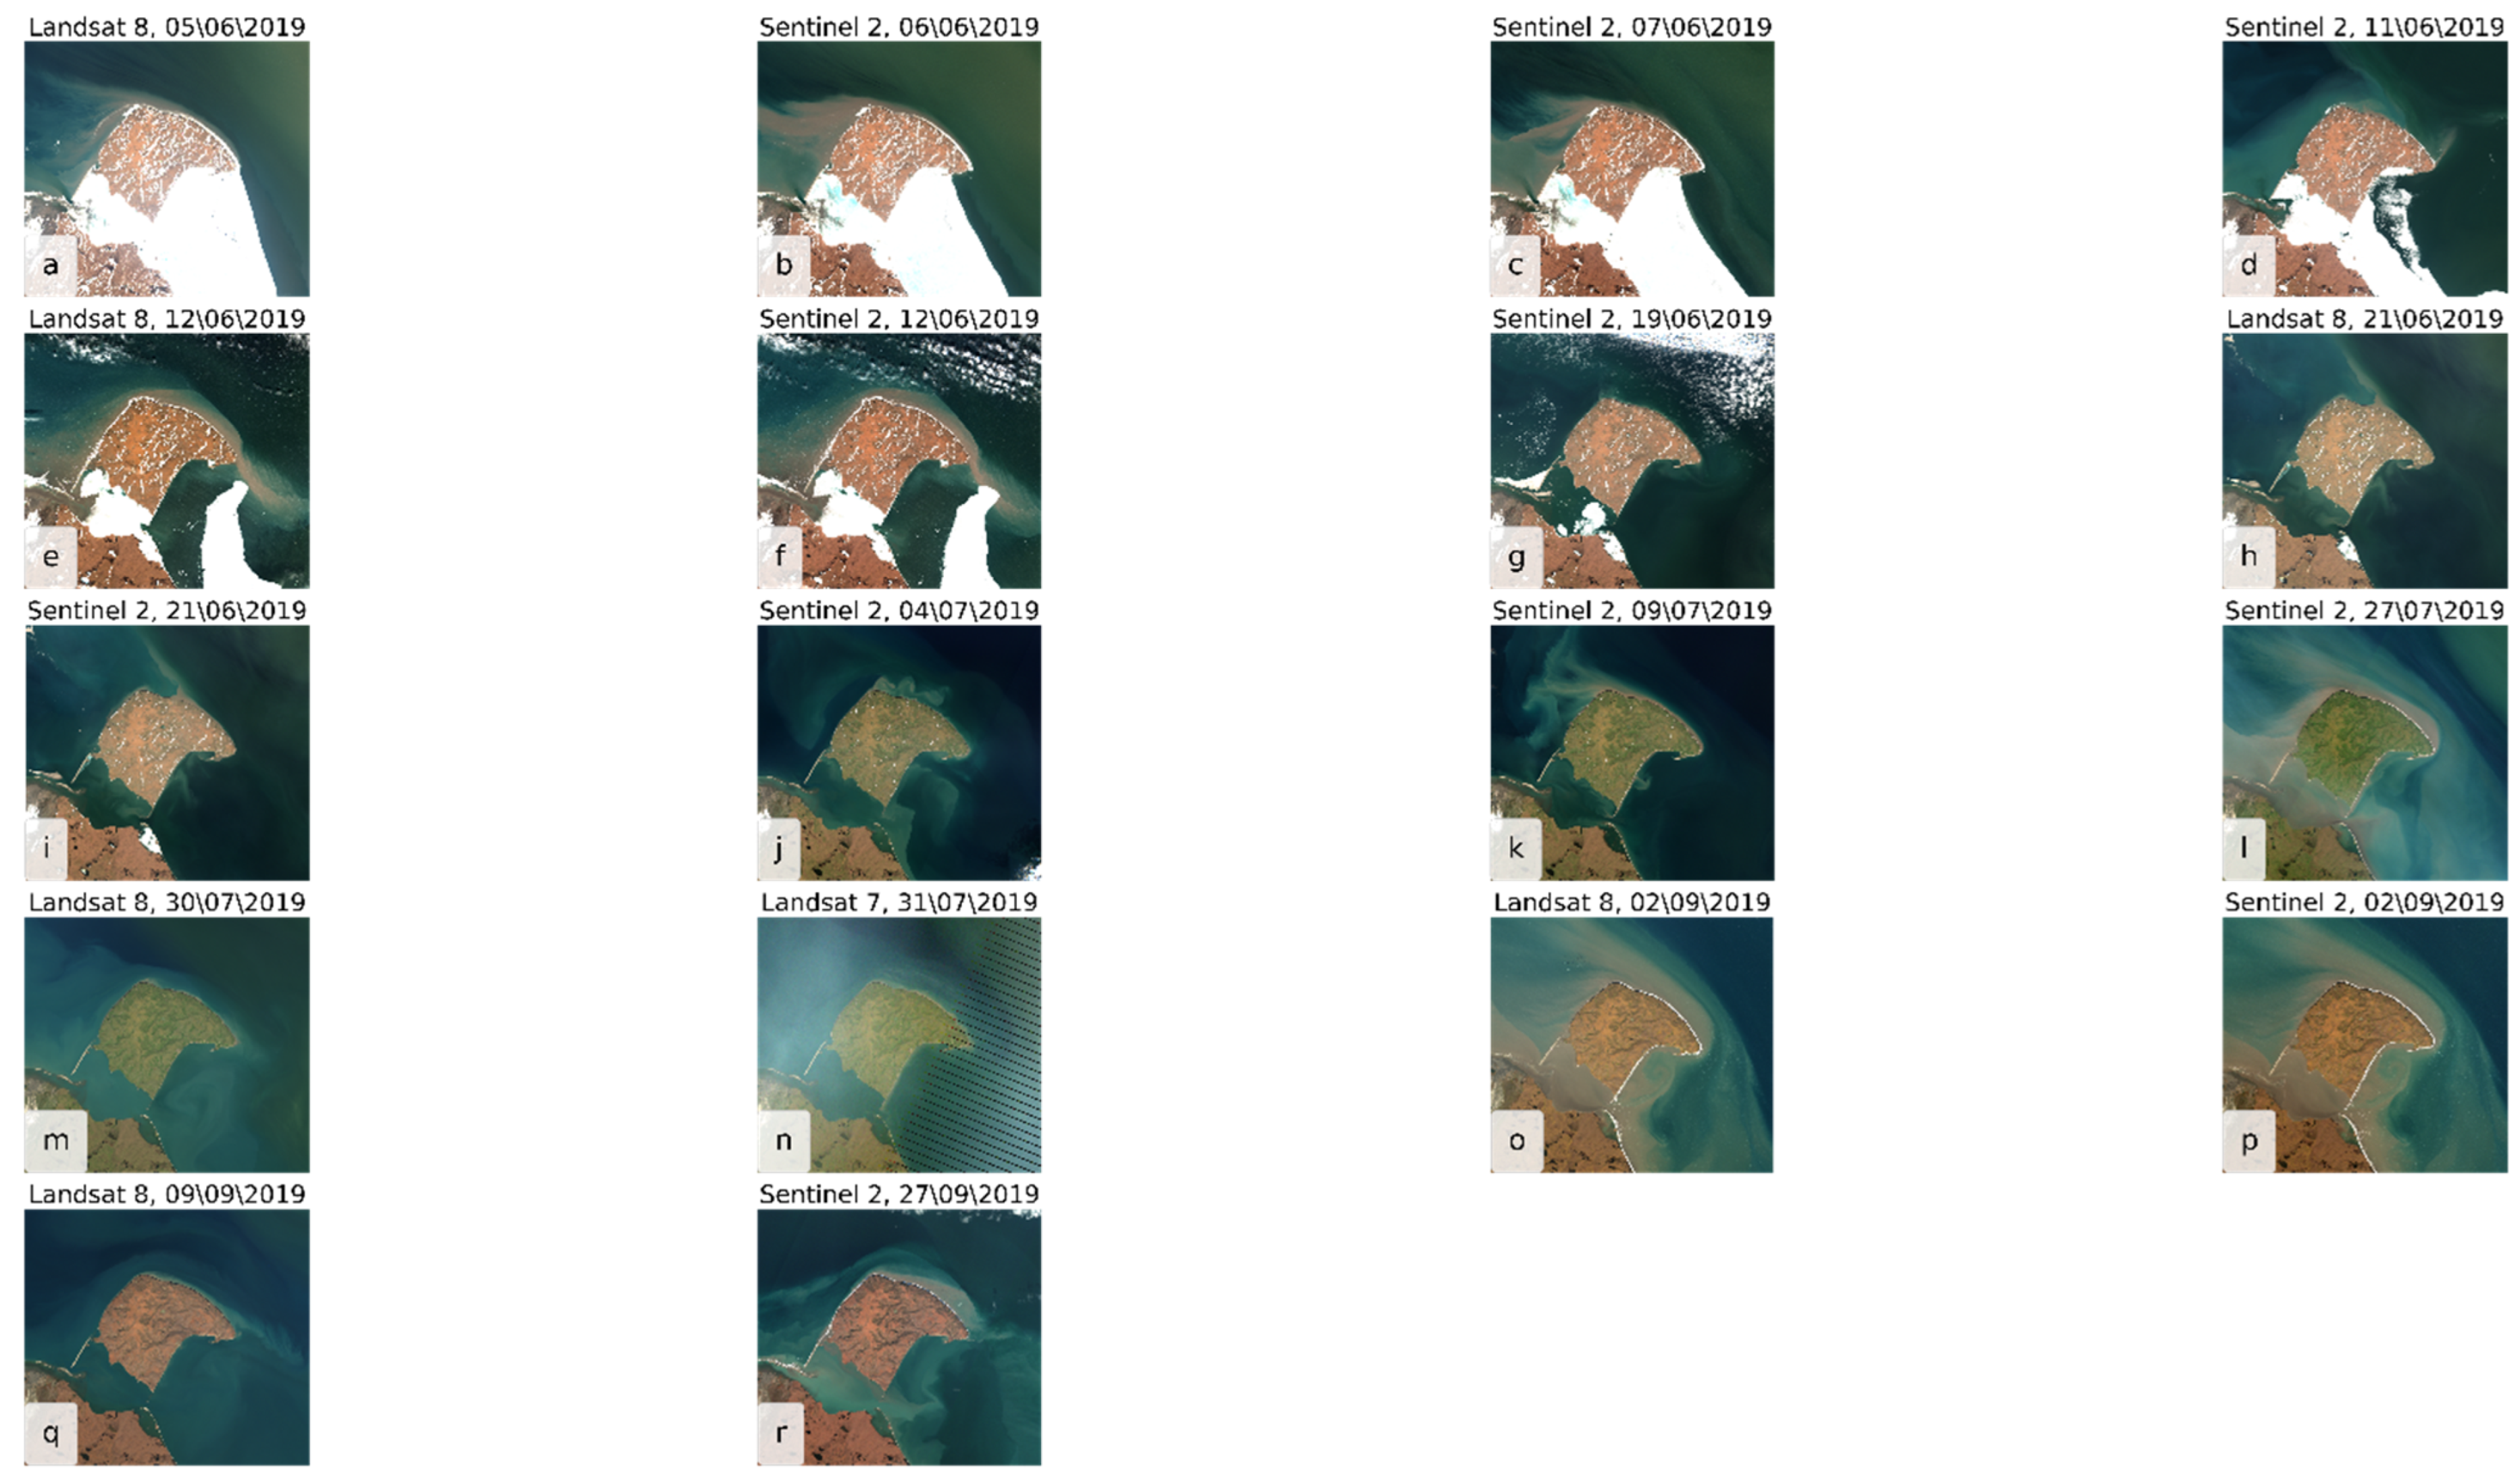
The time series of high-resolution satellite imagery shows the period of the ice breakup between 5 June and 21 June in great detail. The landfast ice in Thetis Bay retreats from scene to scene (Figure 2a–f). It covers Collinson Head completely on 5 June (Figure 2a), which becomes ice-free by June 6 (Figure 2b). Thetis Bay and the Workboat Passage are still covered by sea ice, while the west side of HIQ is ice-free. This is a typical situation during the breakup period. Pack ice is generally transported northwards on the shelf and does not affect the HIQ nearshore zone. This situation seems to greatly affect turbidity dispersal at the W side of HIQ. During ESE wind conditions, this is the lee side of the island, which causes the high turbidity there due to longshore sediment transport. However, this feature faces the SW direction, which is not visible on any other scene from 2019 (arrow in Figure 2b). The authors of [39] suggested that upwelling, which typically occurs N of HIQ during ESE wind direction, is affected by the occurrence of sea ice and its movement. This has the potential to move the main upwelling area slightly towards the west and partially “block” the longshore current towards the NW. This might only occur during very limited times of the year when the sea ice on the shelf is melting and transported towards the W due to wind forces. However, there is no existing in situ dataset to validate this hypothesis. This SW facing longshore drift feature was not identified in another study [25], in which satellite imagery from late June until mid-September was analyzed over three decades, showing that it is either confined to this small period of time per year or may even be a 2019-exclusive feature.
Images with high ice content in Thetis Bay (Figure 2a–c) show areas where water was identified by the atmospheric correction algorithm within the landfast ice area (green circles). These water areas can be caused by either thawing or flooding. The authors of [30] reported that flooding of landfast ice is widespread during the breakup period, when rivers have their freshets, and that substantial amounts of sediment are likely to be deposited. Another possibility is misclassifications of the atmospheric correction; however, RGB composites (see Appendix A) indicate shallow water areas. Thus, the high modeled turbidity values (above 100 FNU, Formazin Nephelometric Unit) do not necessarily reflect a high sediment load but might be contaminated by the reflection of ice beneath the water.
During a period of NW winds in mid-June, the landfast ice became detached from the Yukon Coast (Figure 2d–f). By 19 June, sea ice subsisted only in the Workboat passage, and all large chunks of pack ice had vanished from the study area. The formerly ice-covered area in Thetis Bay has relatively high and uniform turbidity (Figure 2e,f), which is caused by increased primary production and the suspended load, which was stored in the ice [44]. The high-turbidity feature caused by the longshore drift towards the SE direction on 12 June is considerably larger than that identified in [29] and is the largest feature of this kind identified in the whole summer season. Wind speed was very high during the recording of the scene, which has likely caused the high levels of suspended sediment concentration due to stronger wave-induced erosion. This is also visible along the NW coast of HIQ, where turbidity is remarkably higher compared with every other NW wind situation captured in 2019. Due to the wind direction, this cannot be caused by the Mackenzie River plume [25] (see Appendix A for detailed wind plots).
3.1.2. Mid-Summer
Sea ice disappeared in the nearshore zone of HIQ until 21 June. Only small chunks remained in lagoons on the Canadian mainland, which ultimately thawed until 4 July. After the sea ice disappeared, turbidity decreased remarkably compared to the storm situation on 12 June (Figure 3). Areas of high turbidity are confined to the nearshore waters very close to the coast. A longshore current of higher turbidity was resolved on 21 June along the NE coast towards the NW direction (Figure 2h,i), which was guided offshore due to upwelling N of HIQ and the Coriolis force (arrow in Figure 2h). On 4 July, features characteristic of changing wind conditions identified by [25], and [29] were resolved, most prominently, a circular feature of increased turbidity NW of HIQ (Figure 2j). This changed on 9 July, when ESE winds caused longshore drift towards the W direction (Figure 2k).
The scenes from 21 June, 4 July, and 9 July show spatial patterns of turbidity that were not expected based on the results presented in [25]. During ESE wind conditions (see Appendix A), high turbidity covered a remarkably larger area according to [25]. In general, turbidity values during this time of the year are comparatively low, which was not detected in the long-term trend [25].
According to our results, 27 July marked a day of exceptionally high turbidity in the whole nearshore zone of HIQ (Figure 2 and Figure 3). High, uniform turbidity values were resolved in the Workboat Passage, the area between HIQ and the Yukon mainland, which is only rarely visible on the 2019 imagery. The longshore drift towards the NW was well-resolved along the NE coast of HIQ. High turbidity values were also resolved in Herschel Basin east of the island, which indicates that external sediment sources were transported into the nearshore waters of HIQ. This high level of suspended sediment load does not correspond to typical drivers, such as wind speed or the Mackenzie discharge. The listed features were not long-lasting, as turbidity on 30 July decreased significantly (Figure 2m,n). Turbidity values close to the shoreline were among the lowest during the whole summer season but remained higher than average a few kilometers off the coast. On the one hand, this shows the quickly changing conditions in the nearshore area, but on the other hand, it highlights the need to further investigate external influences on turbidity and suspended sediment concentration in nearshore waters.
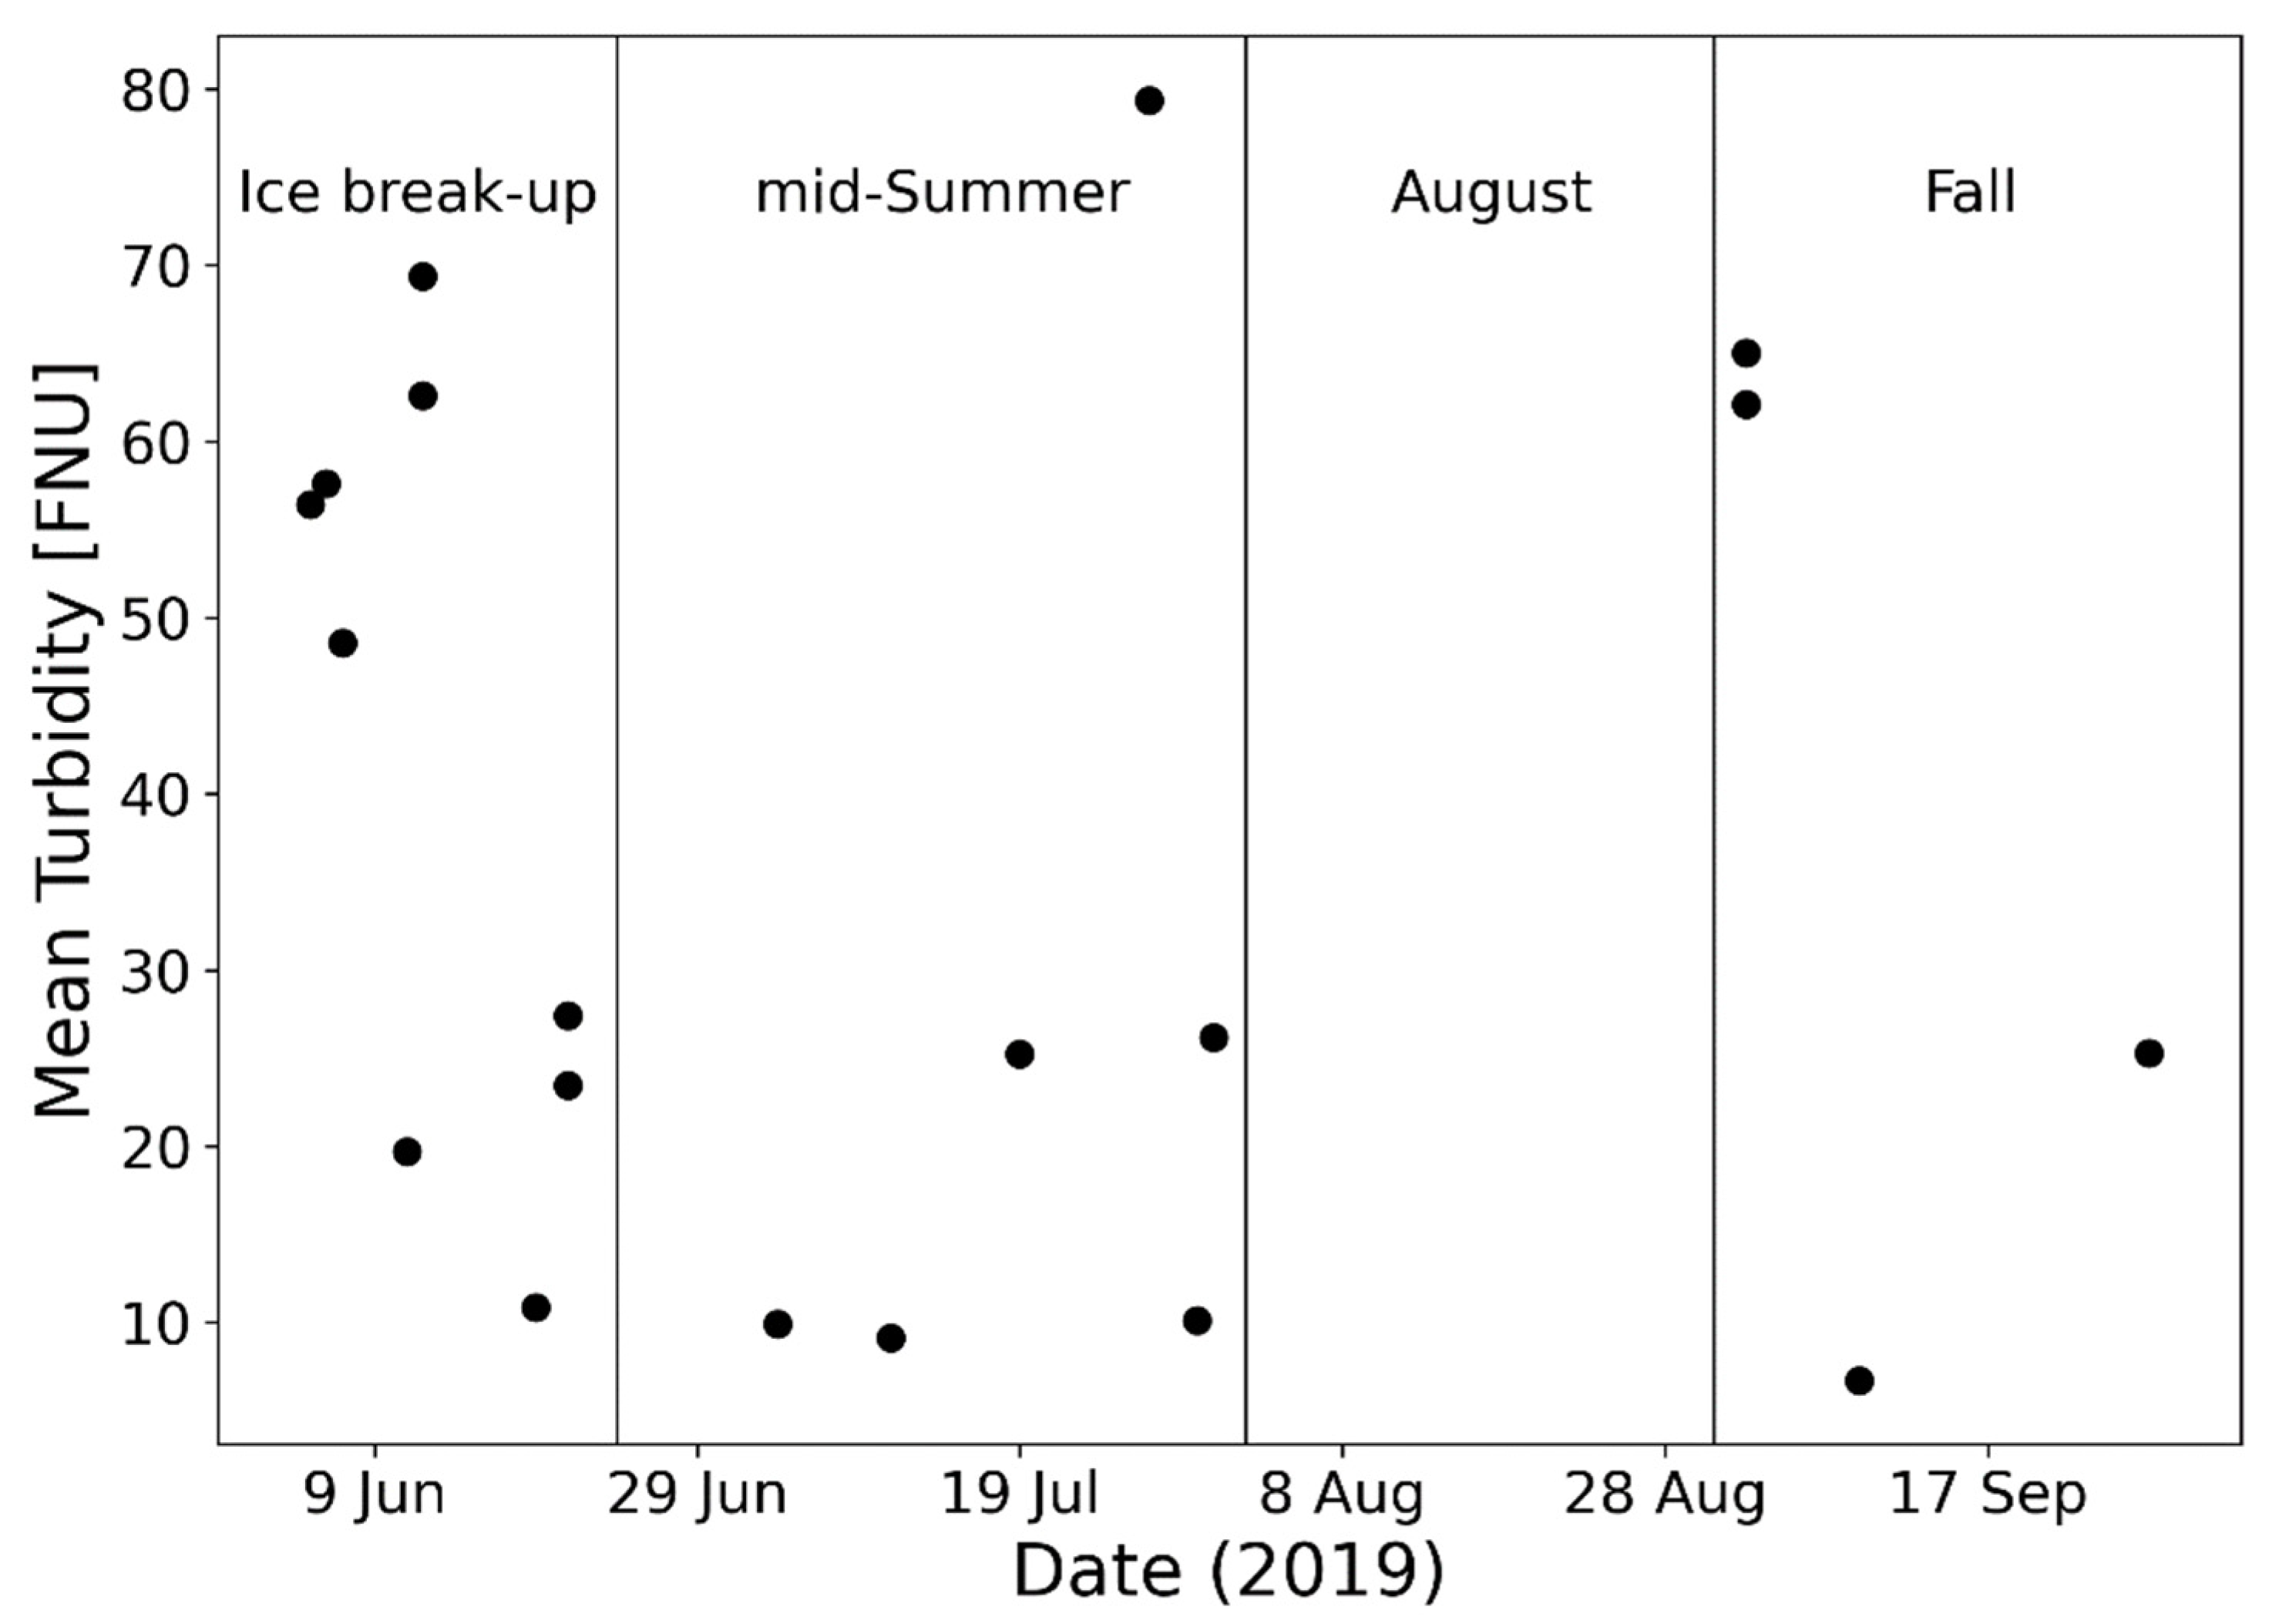
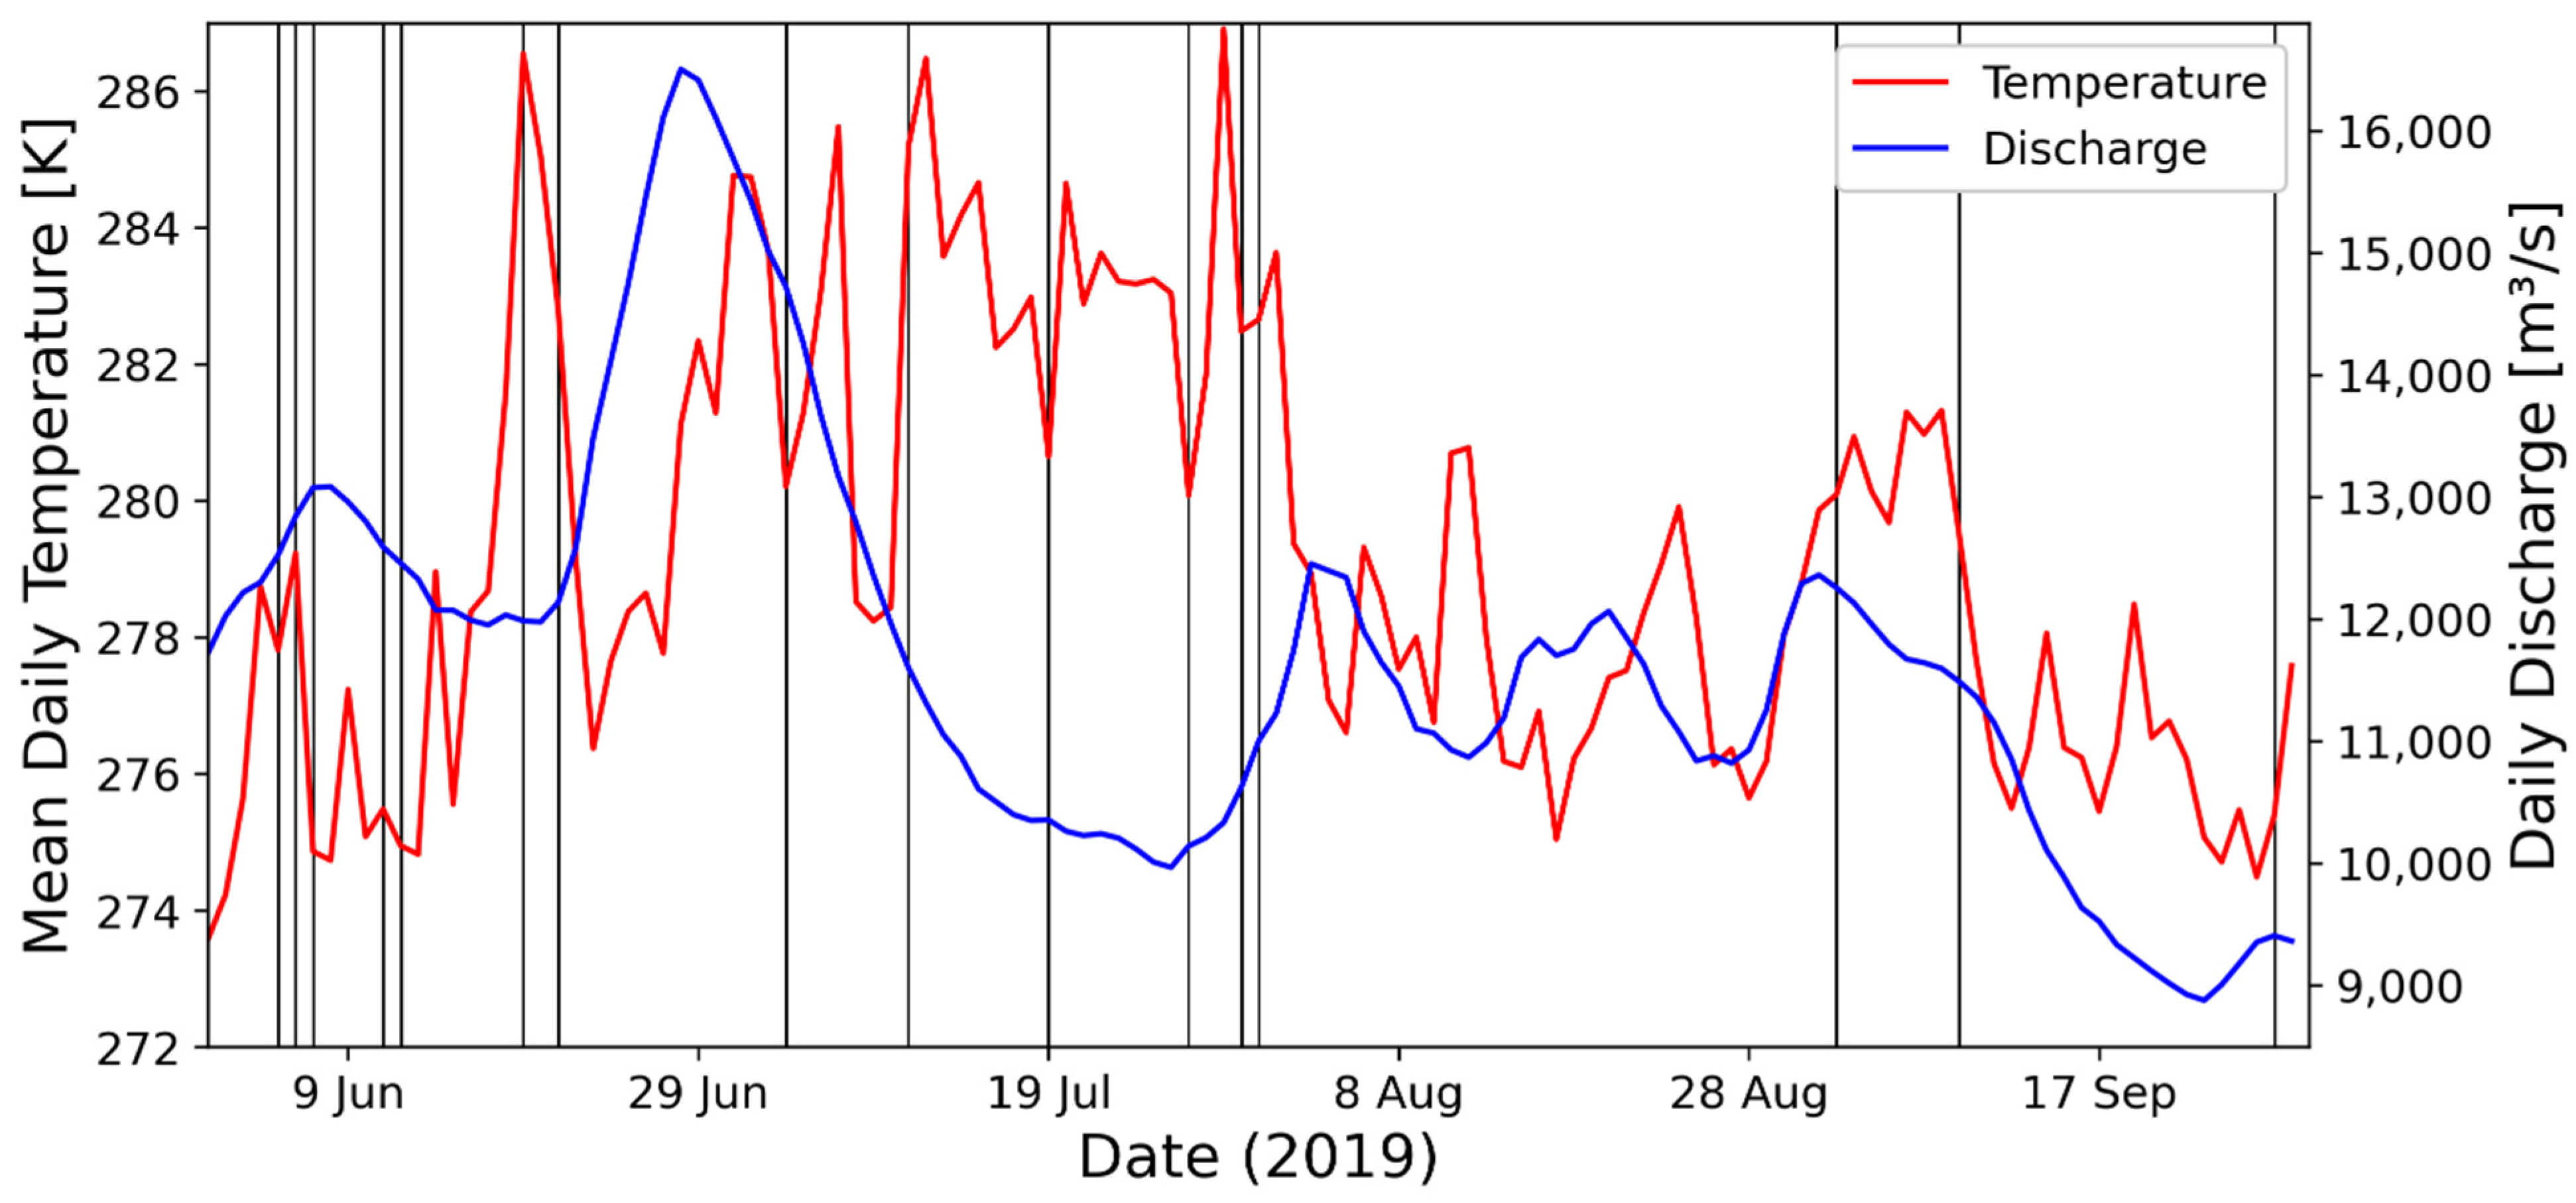
August, unfortunately, was very cloudy, and no cloud-free high-resolution satellite images were recorded by either Landsat 7, Landsat 8, or Sentinel 2. In situ weather data from the HIQ weather station reveal that August was very cold, with a mean daily temperature of 5 °C, compared with the average temperature between 2001 and 2021 (6.8 °C, Environment Canada, Figure 4). The Mackenzie discharge did not show any substantial anomalies. The cold temperatures, together with normal river discharge, indicate that turbidity values in the nearshore waters of HIQ remained low in August. This suggests reduced thermo-erosion, which was identified as the main mechanism for erosion along permafrost-dominated coastlines [45,46].
3.1.3. Fall
In September, cloud conditions became more favorable for optical remote sensing. Imagery recorded on 2 September reveal high turbidity values over large parts of the nearshore zone (Figure 2o,p). This situation is comparable to that of 27 July. Air temperatures on 2 September were higher than temperatures on previous days (max. temperature 7 °C compared with 4 °C, Figure 4), enhancing thermo-erosion, and thus sediment supply, to the nearshore zone. Turbidity was especially high in Workboat Passage, where longshore currents caused resuspension in shallow waters. Longshore drift was also well-resolved along the NE coast of HIQ towards the west, and turbidity features along the SE coast indicate a larger erosional event, probably related to retrogressive thaw slumps, which are common erosional features there.
Until 9 September (Figure 2q), turbidity decreased to the lowest values throughout the whole summer season (Figure 3), both very close and further away from the coastline, even though air temperatures exceeded 10 °C on that day, which is exceptionally high for that time of the year (Figure 4). Wind directions were changing, but longshore drift towards the SE direction was resolved. Similar features were resolved in the last image from the season, recorded on 27 September, but with higher turbidity values throughout the whole nearshore zone, even though air temperatures did not exceed 3 °C (Figure 2r).
The analysis of the time series reveals multiple erosion events throughout the summer season, which contributed substantial amounts of sediment to the nearshore zone. One erosion event was triggered by a major storm on 12 June, with strong longshore sediment transport towards the SE direction. This was the only major storm detected on satellite imagery, which is in part due to generally high cloud coverage during storms. Longshore drift conditions towards the NW direction were detected throughout the whole summer season (June, July, and September). This feature was not limited to a specific part of the summer season. The same is true for the low-turbidity situations, which were also detected in June, July, and September. Generally, turbidity was increased during the ice breakup, which was related not to high wind speed but to high air temperature (up to 10 °C). On the other hand, the imagery from September shows that air temperature was not the predominant driver of nearshore turbidity.
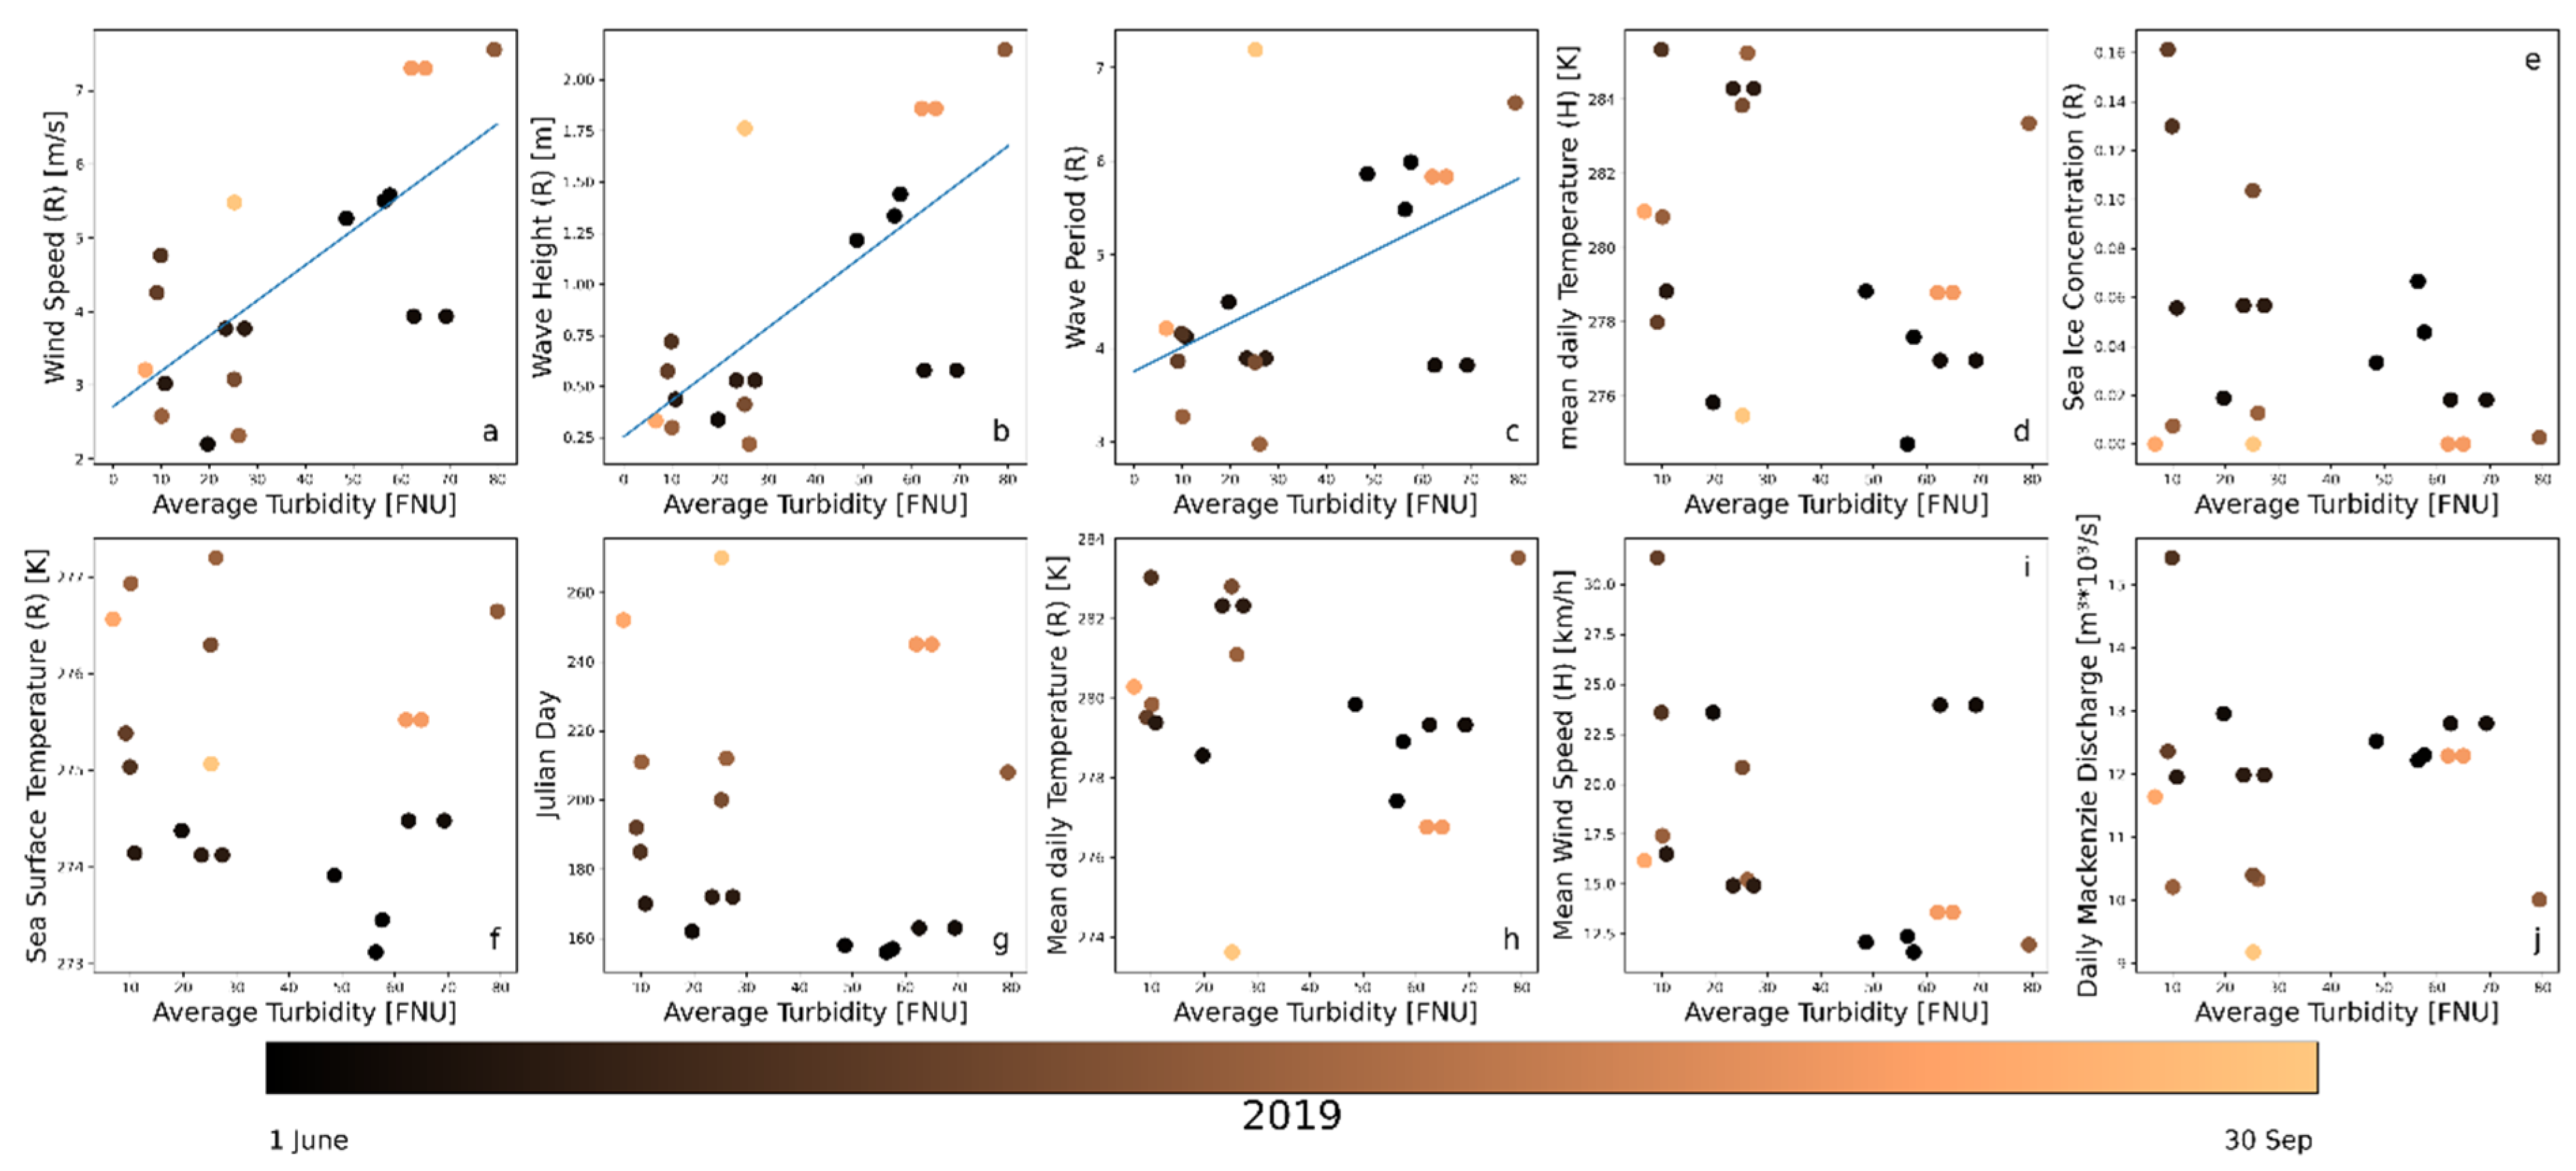
3.2. Drivers of Turbidity
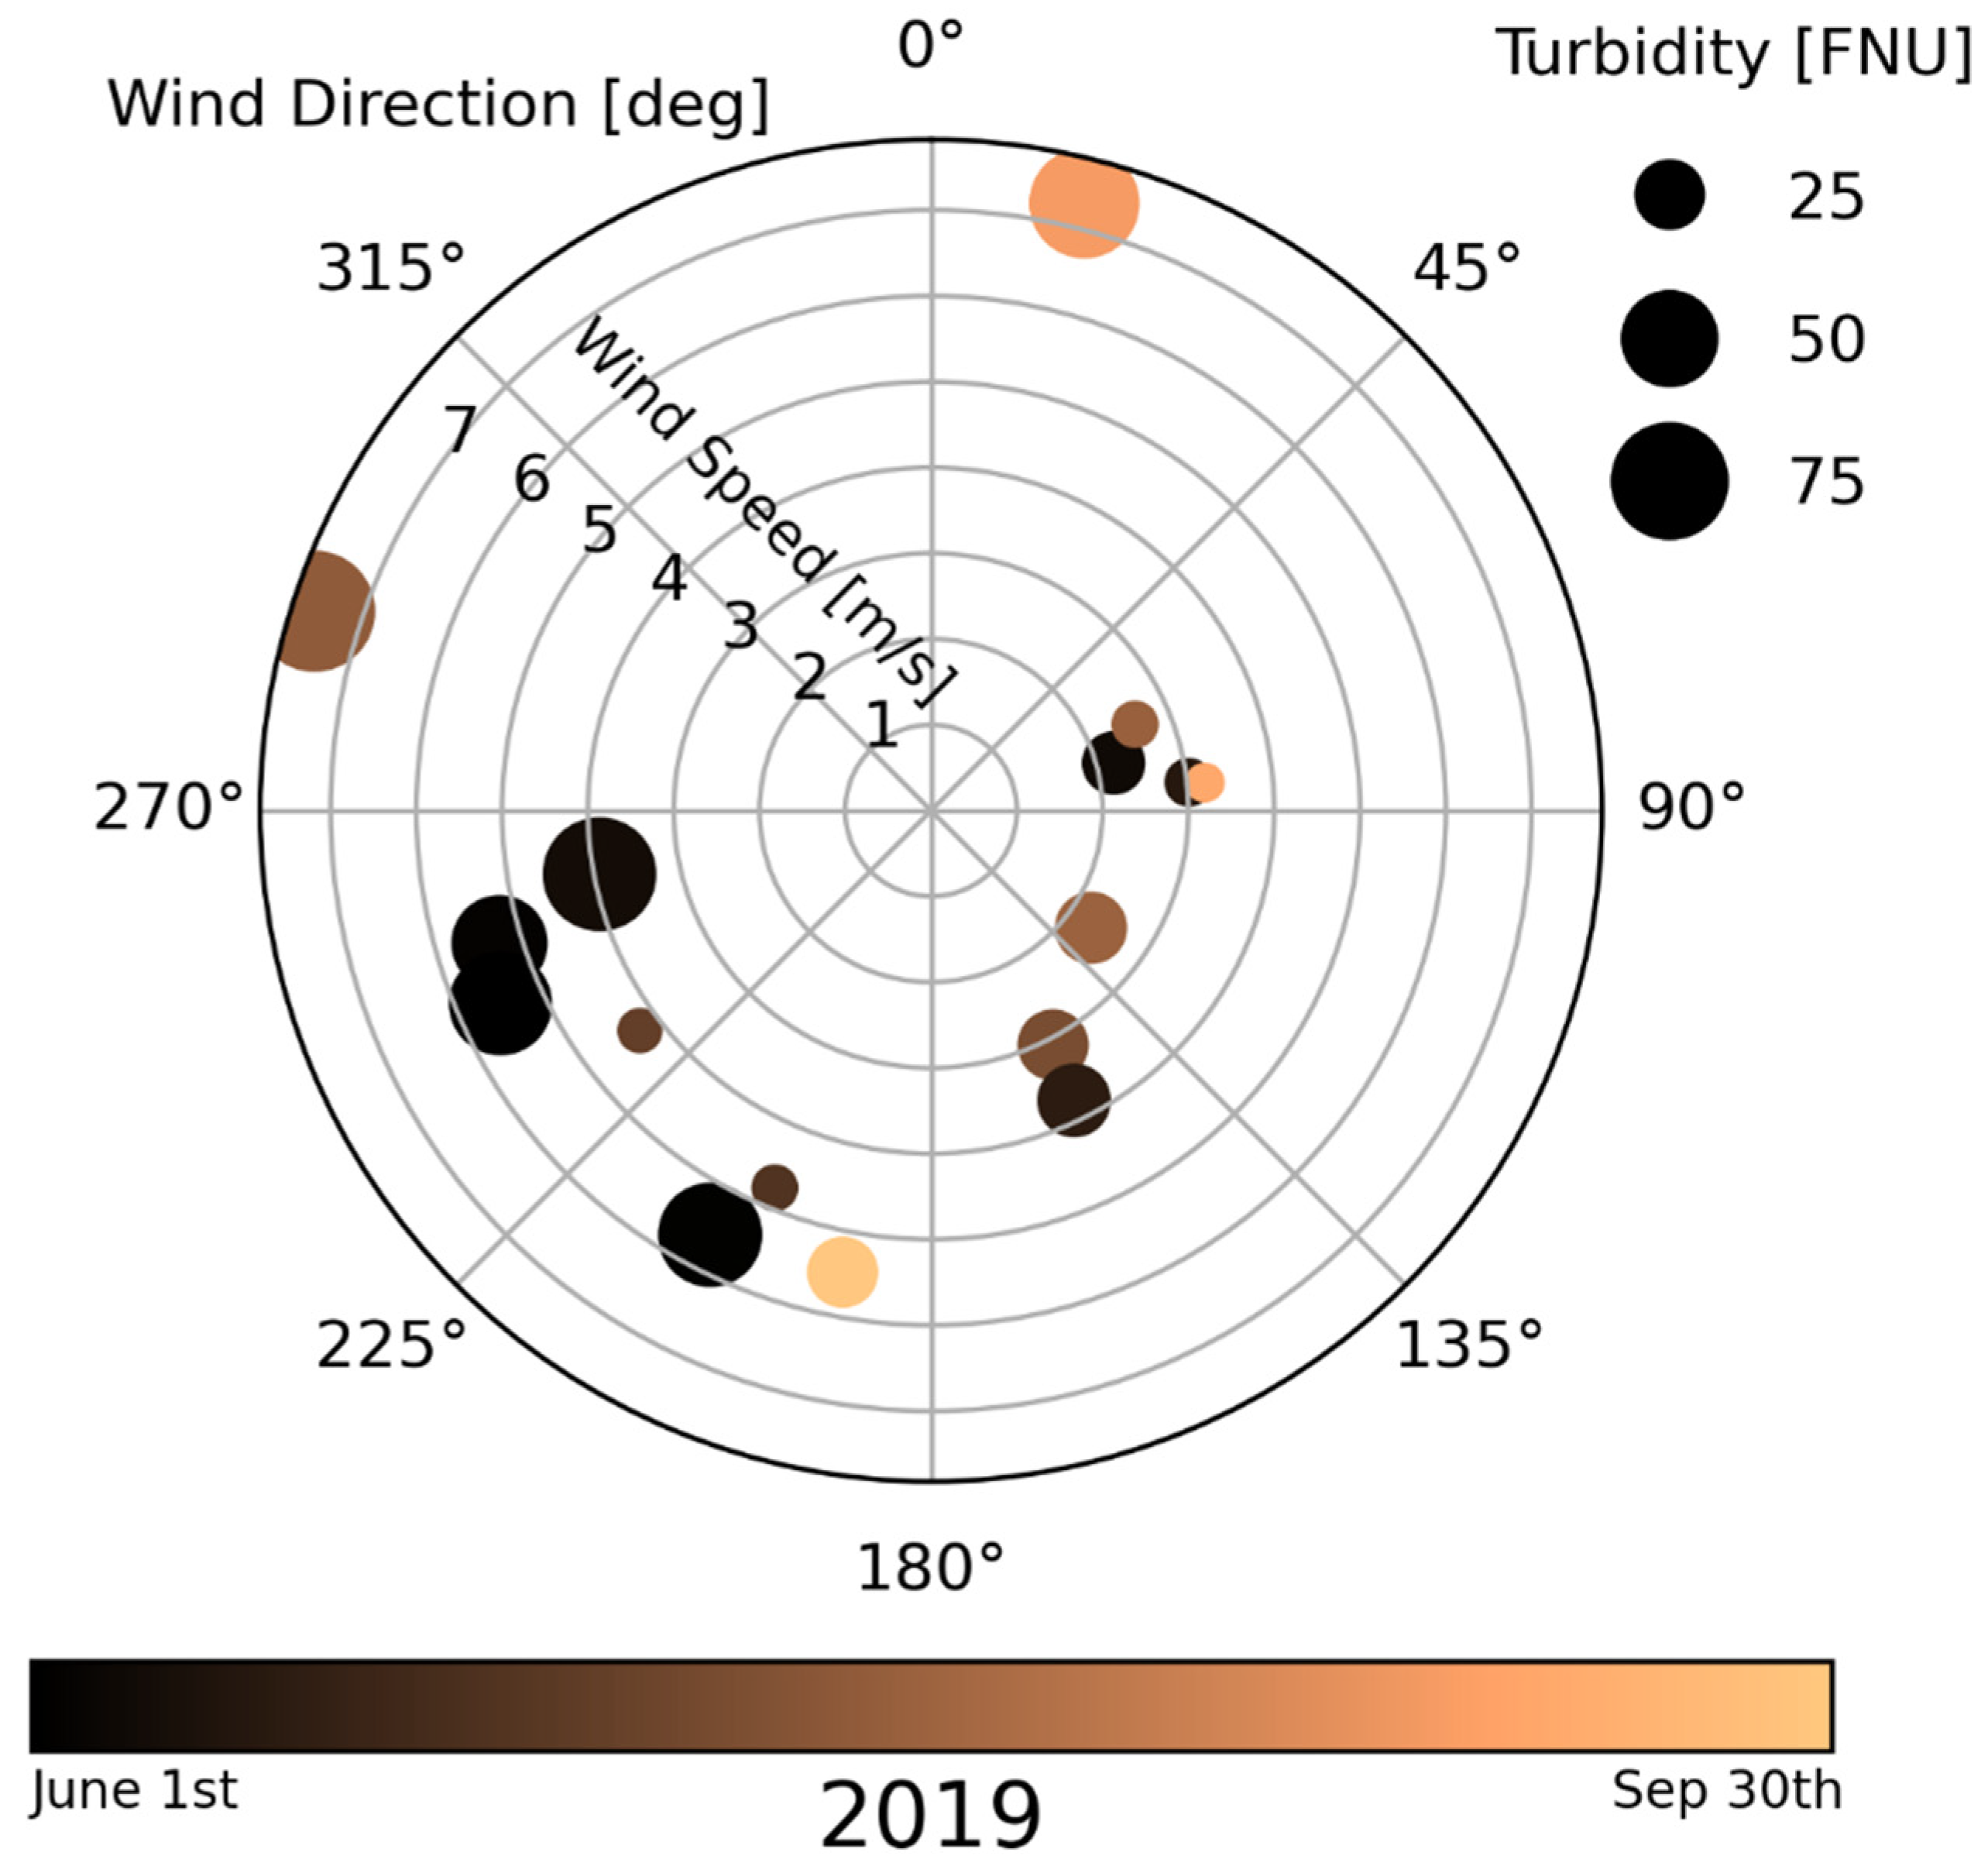
A combination of in situ measurements from the weather station at HIQ, the daily Mackenzie River discharge data from the Arctic Red River, and ERA5 reanalysis data were used to identify drivers of nearshore sediment dispersal and to evaluate the results presented in Klein et al. (2019). The highest correlation was identified between turbidity and mean wind speed from the reanalysis dataset (R2 = 0.49, Figure 5a), turbidity and significant wave height (R2 = 0.46, Figure 5b), and turbidity and wave period (R2 = 0.27, Figure 5c). Interestingly, in contrast to the reanalysis wind speed, the in situ wind speed from the HIQ weather station does not show any correlation to turbidity. This might be due to the location of the weather station on the island: located at Simpson Point, it is slightly shielded from wind from westerly directions. During westerly and northwesterly wind conditions, the highest turbidity values were detected around HIQ (Figure 6), which largely contrasts the findings made by [25].
No correlation was identified between the Mackenzie River discharge and turbidity at HIQ (Figure 5j). It is noted, however, that the discharge data used in this study are preliminary and, therefore, did not pass through the complete quality checks at Environment Canada. It is also shown that the daily discharge did not necessarily follow expected seasonal patterns in 2019 (Figure 4), as daily discharge values between 12,000 m3/s and 13,000 m3/s were detected both early and late during the summer season [32]. For example, the Mackenzie discharge around 9 June (Julian day 160) 2019 hit a maximum during the ice breakup period with ~13,000 m3/s, which is more than 50% lower than the 1973–2011 average of ~21,000 m3/s [32]. In contrast to the findings in [25], the sea-surface temperature did not correlate with the Mackenzie river discharge.
The data from 2019 indicate that nearshore turbidity is related to wave energy (Figure 5b,c). This is due to erosion-inducing wave action on permafrost coastlines, supplying sediment to the nearshore waters, and resuspension of formerly deposited sediment, which describes the large sediment load detected during a storm in Figure 2e,f. The rate at which resuspension affects surface turbidity has not been quantified yet. Resuspension, however, is mainly driven by the breaking characteristics of the wave [47]. Its kinetic energy has only limited influence on resuspension [48], which causes shear stress on the seafloor based on the wave period [49]. This means that the area that is influenced by sediment resuspension is refined to the surf zone and, thus, smaller than the high-turbidity area detected in most imagery in Figure 2, and also smaller than the results reported by [25]. Even though the presented data do not include wave-breaking characteristics, Figure 5 shows the lesser importance of resuspension due to wave propagation to surface turbidity. As turbidity caused by breaking waves affects only a small area very close to the coastline, it is likely not fully detected by the imagery. This is caused by the occurrence of mixing pixels of land and ocean, which are subject to large errors and are, thus, flagged during the atmospheric correction.
The data further clarify that nearshore turbidity is not driven by air temperature (Figure 5d,h), sea-surface temperature (Figure 5f), or sea-ice concentration on the shelf (Figure 5e). This shows that sea ice, which does not completely melt even during summer, does not affect wave energy and, therefore, erosion in a significant way. Higher air temperatures, which increase thermo-erosion, do not lead to an increased sediment export to the nearshore zone, and the data even suggest the opposite. A general comparison indicates that in situ data from HIQ do not correlate to nearshore turbidity in most cases, in contrast to the reanalysis data from the shelf (best visible in Figure 5a,i). This shows that nearshore turbidity, albeit being of very limited spatial extent, is strongly affected by the weather conditions several hundreds of kilometers offshore, while weather conditions in close vicinity have a very limited impact on it.
4. Conclusions
The aim of this study was to identify seasonal patterns of nearshore turbidity and its drivers in the nearshore zone of Herschel Island Qikiqtaruk in the western Canadian Arctic. A time series of high-resolution satellite imagery from the summer season of 2019, as well as in situ measurements and ERA5 reanalysis data of atmospheric and oceanic climate variables, and Mackenzie River discharge data, were used. It was shown that nearshore turbidity is driven by wind speed and wind direction, as well as wave height and wave period. Seasonal variations could not be identified; however, it was shown that turbidity was higher during the period of ice breakup than during the rest of the open-water season, even though erosion rates are low during this time of the year.
Nearshore turbidity did not show spatial patterns that were expected based on the results presented in [25], in which long-term trends show a remarkably larger area that is affected by high turbidity. The highest turbidity was detected under westerly wind conditions. The correlation between nearshore turbidity and the Mackenzie discharge is weak, which eliminates the Mackenzie discharge as a potential influencing factor on nearshore turbidity. Nearshore turbidity shows a higher correlation to ERA5 wind speed rather than in situ wind speed from Herschel Island Qikiqtaruk, showing that nearshore turbidity, despite being of regional spatial extent, is driven by weather conditions several kilometers away from the nearshore zone. Remote sensing has shown to be a powerful tool to detect nearshore turbidity, especially in areas that are difficult to access such as the Arctic.
To further facilitate the drivers of nearshore turbidity in the Arctic, longer time series analyses are needed to eliminate yearly anomalies. However, time series of high-resolution satellite images, such as the one presented in this study, are rarely available due to the low temporal resolution of appropriate satellite sensors and challenging weather conditions. This might improve with the recent launch of OLI2 onboard Landsat 9, essentially doubling the potential amount of available Landsat imagery to increase the temporal coverage over one summer season. Including multiple study sites will validate the results on a pan-Arctic scale and help to foster our understanding of suspended sediment dynamics in Arctic nearshore zones.
Author Contributions
Study design, K.P.K. and H.L.; data acquisition, K.P.K. and R.J.R.; data processing, K.P.K. and R.J.R.; statistical analysis, K.P.K.; interpretation of results, K.P.K. and H.L.; manuscript preparation, K.P.K. All authors have read and agreed to the published version of the manuscript.
Funding
This publication is part of the Nunataryuk project. The project has received funding under the European Union’s Horizon 2020 Research and Innovation Program under grant agreement no. 773421. K.P.K. was financially supported by a PhD stipend from the University of Potsdam (PoGS Potsdam Graduate School). R.J.R. was financially supported by the GeoX research network for Geosciences in Berlin and Potsdam under grant number SO_087.
Acknowledgments
USGS and NASA are acknowledged for Landsat imagery. ESA is acknowledged for Sentinel 2 imagery. We thank Justus Gimsa for his help during the statistical analysis. We thank the three anonymous reviewers for their valuable input, which significantly improved the quality of this publication. We acknowledge the support of Deutsche Forschungsgemeinschaft (German Research Foundation) and Open Access Publication Fund of University of Potsdam.
Conflicts of Interest
The authors declare no conflict of interest.
Appendix A
Figure A1.
RGB composites of the satellite imagery similar to Figure 2. (a–f) depict the ice break-up with increased turbidity. During mid-Summer (g–n), turbidity is decreased with one exception (l). During Fall (o–r), the turbidity features are unstable and change rapidly.
Figure A1.
RGB composites of the satellite imagery similar to Figure 2. (a–f) depict the ice break-up with increased turbidity. During mid-Summer (g–n), turbidity is decreased with one exception (l). During Fall (o–r), the turbidity features are unstable and change rapidly.

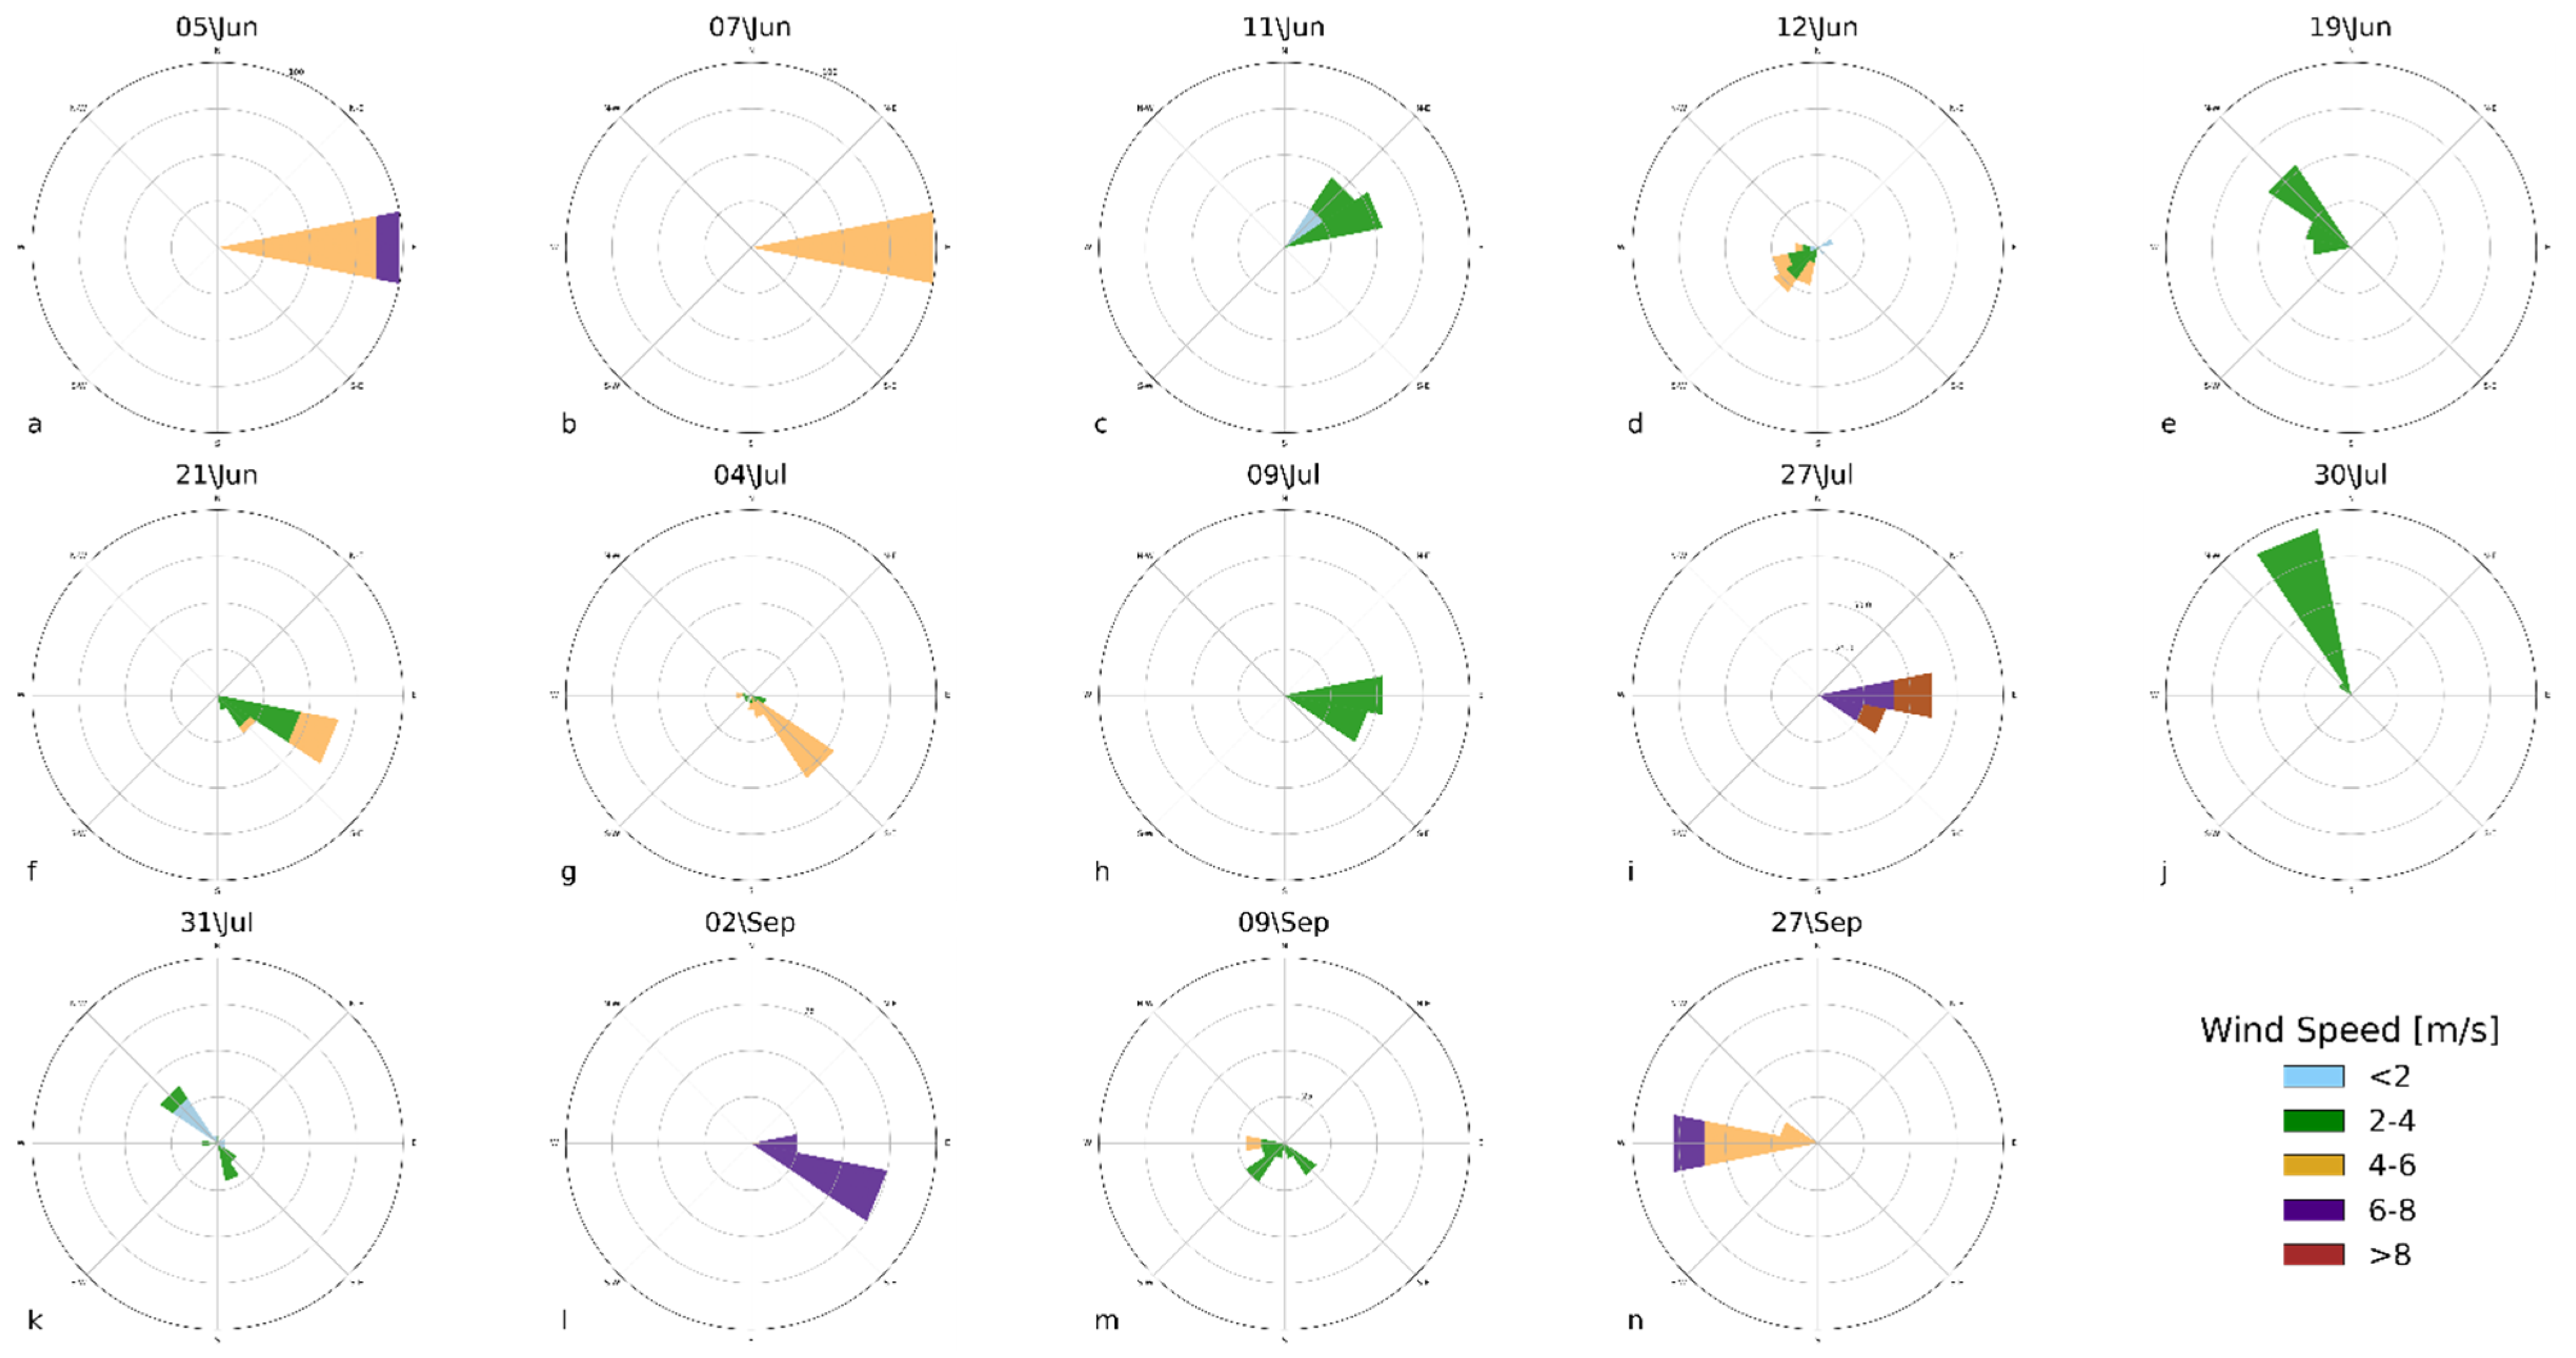
Figure A2.
Wind plots on each day of satellite image recording during the 2019 summer season. Wind data were acquired from the ERA-5 reanalysis dataset 24 h prior to each image acquisition. Radial lines indicate the frequency of the wind direction over the sampling time: 25%, 50%, 75%, and 100%, respectively. During early and mid-Summer (a–k), easterly wind conditions are more common, while wind conditions remain unstable during Fall (l–n). Northwest is the main storm direction during the whole year.

References
- Serreze, M.C.; Barry, R.G. Processes and impacts of Arctic amplification: A research synthesis. Glob. Planet. Chang. 2011, 77, 85–96. [Google Scholar] [CrossRef]
- Box, J.E.; Colgan, W.T.; Christensen, T.R.; Schmidt, N.M.; Lund, M.; Parmentier, F.J.W.; Brown, R.; Bhatt, U.S.; Euskirchen, E.S.; Romanovsky, V.E.; et al. Key indicators of Arctic climate change: 1971–2017. Environ. Res. Lett. 2019, 14, 045010. [Google Scholar] [CrossRef]
- Biskaborn, B.K.; Smith, S.L.; Noetzli, J.; Matthes, H.; Vieira, G.; Streletskiy, D.A.; Schoeneich, P.; Romanovsky, V.E.; Lewkowicz, A.G.; Abramov, A.; et al. Permafrost is warming at a global scale. Nat. Commun. 2019, 10, 264. [Google Scholar] [CrossRef] [PubMed] [Green Version]
- McClelland, J.W.; Holmes, R.M.; Peterson, B.J.; Raymond, P.A.; Striegl, R.G.; Zhulidov, A.V.; Zimov, S.A.; Zimov, N.; Tank, S.E.; Spencer, R.G.M.; et al. Particulate organic carbon and nitrogen export from major Arctic rivers. Glob. Biogeochem. Cycles 2016, 30, 629–643. [Google Scholar] [CrossRef]
- Fritz, M.; Vonk, J.E.; Lantuit, H. Collapsing Arctic coastlines. Nat. Clim. Chang. 2017, 7, 6–7. [Google Scholar] [CrossRef] [Green Version]
- Lantuit, H.; Pollard, W.H. Fifty years of coastal erosion and retrogressive thaw slump activity on Herschel Island, southern Beaufort Sea, Yukon Territory, Canada. Geomorphology 2008, 95, 84–102. [Google Scholar] [CrossRef]
- McGillivray, D.G.; Agnew, T.A.; McKay, G.A.; Pilkington, G.R.; Hill, M.C. Impacts of climatic change on the Beaufort sea-ice regime: Implications for the Arctic petroleum industry. In Climate Change Digest CCD; Environment Canada: Downsview, ON, Canada, 1993; Volume 93-01. [Google Scholar]
- Tank, S.E.; Fellman, J.B.; Hood, E.; Kritzberg, E.S. Beyond respiration: Controls on lateral carbon fluxes across the terrestrial-aquatic interface. Limnol. Oceanogr. Lett. 2018, 3, 76–88. [Google Scholar] [CrossRef]
- Romanovsky, V.E.; Smith, S.L.; Christiansen, H.H. Permafrost thermal state in the polar northern hemisphere during the international polar year 2007–2009: A synthesis. Permafr. Periglac. Process. 2010, 21, 106–116. [Google Scholar] [CrossRef] [Green Version]
- Tanski, G.; Wagner, D.; Knoblauch, C.; Fritz, M.; Sachs, T.; Lantuit, H. Rapid CO2 release from eroding permafrost in seawater. Geophys. Res. Lett. 2019, 46, 11244–11252. [Google Scholar] [CrossRef] [Green Version]
- Vonk, J.E.; Sánchez-García, L.; van Dongen, B.E.; Alling, V.; Kosmach, D.; Charkin, A.; Semiletov, I.P.; Dudarev, O.V.; Shakhova, N.; Roos, P.; et al. Activation of old carbon by erosion of coastal and subsea permafrost in Arctic Siberia. Nature 2012, 489, 137–140. [Google Scholar] [CrossRef]
- Déry, S.J.; Hernández-Henríquez, M.A.; Burford, J.E.; Wood, E.F. Observational evidence of an intensifying hydrological cycle in northern Canada. Geophys. Res. Lett. 2009, 36, 1–5. [Google Scholar] [CrossRef]
- Jones, B.M.; Arp, C.D.; Jorgenson, M.T.; Hinkel, K.M.; Schmutz, J.A.; Flint, P.L. Increase in the rate and uniformity of coastline erosion in Arctic Alaska. Geophys. Res. Lett. 2009, 36, 1–5. [Google Scholar] [CrossRef]
- McClelland, J.W.; Déry, S.J.; Peterson, B.J.; Holmes, R.M.; Wood, E.F. A pan-arctic evaluation of changes in river discharge during the latter half of the 20th century. Geophys. Res. Lett. 2006, 33, 2–5. [Google Scholar] [CrossRef] [Green Version]
- Lantuit, H.; Overduin, P.P.; Wetterich, S. Recent progress regarding permafrost coasts. Permafr. Periglac. Process. 2013, 24, 120–130. [Google Scholar] [CrossRef]
- Wegner, C.; Bennett, K.E.; de Vernal, A.; Forwick, M.; Fritz, M.; Heikkilä, M.; Łącka, M.; Lantuit, H.; Laska, M.; Moskalik, M.; et al. Variability in transport of terrigenous material on the shelves and the deep Arctic Ocean during the Holocene. Polar Res. 2015, 34, 24964. [Google Scholar] [CrossRef] [Green Version]
- Terhaar, J.; Lauerwald, R.; Regnier, P.; Gruber, N.; Bopp, L. Around one third of current Arctic Ocean primary production sustained by rivers and coastal erosion. Nat. Commun. 2021, 12, 169. [Google Scholar] [CrossRef]
- Overeem, I.; Nienhuis, J.H.; Piliouras, A. Ice-dominated Arctic deltas. Nat. Rev. Earth Environ. 2022, 3, 225–240. [Google Scholar] [CrossRef]
- Jong, D.; Bröder, L.; Tanski, G.; Fritz, M.; Lantuit, H.; Tesi, T.; Haghipour, N.; Eglinton, T.I.; Vonk, J.E. Nearshore zone dynamics determine pathway of organic carbon from eroding permafrost coasts. Geophys. Res. Lett. 2020, 47, e2020GL088561. [Google Scholar] [CrossRef]
- Carmack, E.; Wassmann, P. Food webs and physical-biological coupling on pan-Arctic shelves: Unifying concepts and comprehensive perspectives. Prog. Oceanogr. 2006, 71, 446–477. [Google Scholar] [CrossRef]
- Mangan, S.; Lohrer, A.M.; Thrush, S.F.; Pilditch, C.A. Water column turbidity not sediment nutrient enrichment moderates microphytobenthic primary production. J. Mar. Sci. Eng. 2020, 8, 732. [Google Scholar] [CrossRef]
- Cartwright, P.J.; Fearns, P.R.C.S.; Branson, P.; Cutler, M.V.W.; O’leary, M.; Browne, N.K.; Lowe, R.J. Identifying metocean drivers of turbidity using 18 years of modis satellite data: Implications for marine ecosystems under climate change. Remote Sens. 2021, 13, 3616. [Google Scholar] [CrossRef]
- Kulikov, M.E.; Medvedev, I.P.; Kondrin, A.T. Seasonal variability of tides in the Arctic Seas. Russ. J. Earth Sci. 2018, 18, 1–14. [Google Scholar] [CrossRef]
- Thomson, J.; Rogers, W.E. Swell and sea in the emerging Arctic Ocean. Geophys. Res. Lett. 2014, 41, 3136–3140. [Google Scholar] [CrossRef]
- Klein, K.P.; Lantuit, H.; Heim, B.; Fell, F.; Doxaran, D.; Irrgang, A.M. Long-term high-resolution sediment and sea surface temperature spatial patterns in Arctic nearshore waters retrieved using 30-Year Landsat archive imagery. Remote Sens. 2019, 11, 2791. [Google Scholar] [CrossRef] [Green Version]
- Munday, J.C.; Alföldi, T.T. LANDSAT test of diffuse reflectance models for aquatic suspended solids measurement. Remote Sens. Environ. 1979, 8, 169–183. [Google Scholar] [CrossRef]
- Nechad, B.; Ruddick, K.G.; Neukermans, G. Calibration and validation of a generic multisensor algorithm for mapping of turbidity in coastal waters. In Proceedings of the SPIE—The International Society for Optical Engineering, San Diego, CA, USA, 4 August 2009; Bostater, C.R.J., Mertikas, S.P., Neyt, X., Velez-Reyes, M., Eds.; College of Optical Sciences, University of Arizona: Tucson, AZ, USA, 2009; Volume 7473, pp. 1–11. [Google Scholar]
- Dogliotti, A.I.; Ruddick, K.G.; Nechad, B.; Doxaran, D.; Knaeps, E. A single algorithm to retrieve turbidity from remotely-sensed data in all coastal and estuarine waters. Remote Sens. Environ. 2015, 156, 157–168. [Google Scholar] [CrossRef] [Green Version]
- Klein, K.P.; Lantuit, H.; Heim, B.; Doxaran, D.; Juhls, B.; Nitze, I.; Walch, D.; Poste, A.; Søreide, J.E. The Arctic Nearshore Turbidity Algorithm (ANTA)—A multi sensor turbidity algorithm for Arctic nearshore environments. Sci. Remote Sens. 2021, 4, 100036. [Google Scholar] [CrossRef]
- Hill, P.R.; Blasco, S.M.; Harper, J.R.; Fissel, D.B. Sedimentation on the Canadian Beaufort Shelf. Cont. Shelf Res. 1991, 11, 821–842. [Google Scholar] [CrossRef]
- O’Brien, M.C.; Macdonald, R.W.; Melling, H.; Iseki, K. Particle fluxes and geochemistry on the Canadian Beaufort Shelf: Implications for sediment transport and deposition. Cont. Shelf Res. 2006, 26, 41–81. [Google Scholar] [CrossRef]
- Yang, D.; Shi, X.; Marsh, P. Variability and extreme of Mackenzie River daily discharge during 1973–2011. Quat. Int. 2015, 380–381, 159–168. [Google Scholar] [CrossRef]
- Solomon, S.M. Spatial and temporal variability of shoreline change in the Beaufort-Mackenzie region, northwest territories, Canada. Geo-Marine Lett. 2005, 25, 127–137. [Google Scholar] [CrossRef]
- Mackay, J.R. The Origin of Massive Icy Beds in Permafrost, Western Arctic Coast, Canada. Can. J. Earth Sci. 1971, 8, 397–422. [Google Scholar] [CrossRef]
- Tanski, G.; Lantuit, H.; Ruttor, S.; Knoblauch, C.; Radosavljevic, B.; Strauss, J.; Wolter, J.; Irrgang, A.M.; Ramage, J.; Fritz, M. Transformation of terrestrial organic matter along thermokarst-affected permafrost coasts in the Arctic. Sci. Total Environ. 2017, 581–582, 434–447. [Google Scholar] [CrossRef] [PubMed] [Green Version]
- Burn, C.R.; Zhang, Y. Permafrost and climate change at Herschel Island (Qikiqtaruq), Yukon Territory, Canada. J. Geophys. Res. 2009, 114, 298840. [Google Scholar] [CrossRef] [Green Version]
- Beck, H.E.; Zimermann, N.E.; McVicar, T.R.; Vergopolan, N.; Berg, A.; Wood, E.F. Present and future köppen-geiger climate classification maps at 1-km resolution. Sci. Data 2018, 5, 180214. [Google Scholar] [CrossRef] [PubMed] [Green Version]
- Radosavljevic, B.; Lantuit, H.; Pollard, W.; Overduin, P.; Couture, N.; Sachs, T.; Helm, V.; Fritz, M. Erosion and flooding—threats to coastal infrastructure in the Arctic: A case study from Herschel Island, Yukon Territory, Canada. Estuaries Coasts 2015, 39, 900–915. [Google Scholar] [CrossRef] [Green Version]
- Williams, W.J.; Carmack, E.C.; Shimada, K.; Melling, H.; Aagaard, K.; Macdonald, R.W.; Grant Ingram, R. Joint effects of wind and ice motion in forcing upwelling in Mackenzie Trough, Beaufort Sea. Cont. Shelf Res. 2006, 26, 2352–2366. [Google Scholar] [CrossRef]
- Vanhellemont, Q. Remote sensing of environment adaptation of the dark spectrum fitting atmospheric correction for aquatic applications of the Landsat and Sentinel-2 archives. Remote Sens. Environ. 2019, 225, 175–192. [Google Scholar] [CrossRef]
- Vanhellemont, Q.; Ruddick, K. Atmospheric correction of Sentinel-3/OLCI data for mapping of suspended particulate matter and chlorophyll-a concentration in Belgian turbid coastal waters. Remote Sens. Environ. 2021, 256, 112284. [Google Scholar] [CrossRef]
- Historical Climate Data. Available online: https://climate.weather.gc.ca (accessed on 23 May 2022).
- Hersbach, H.; Bell, B.; Berrisford, P.; Hirahara, S.; Horányi, A.; Muñoz-Sabater, J.; Nicolas, J.; Peubey, C.; Radu, R.; Schepers, D.; et al. The ERA5 global reanalysis. Q. J. R. Meteorol. Soc. 2020, 146, 1999–2049. [Google Scholar] [CrossRef]
- Macdonald, R.W.; ZouZou, K.; Johannessen, S.C. The vulnerability of arctic shelf sediments to climate change. Environ. Rev. 2015, 23, 461–479. [Google Scholar] [CrossRef]
- Rolph, R.; Overduin, P.P.; Ravens, T.; Lantuit, H.; Langer, M. ArcticBeach v1.0: A physics-based parameterization of pan-Arctic coastline erosion. Geosci. Model Dev. Discuss. 2021, 28, 1–26. [Google Scholar] [CrossRef]
- Nielsen, D.M.; Dobrynin, M.; Baehr, J.; Razumov, S.; Grigoriev, M. Coastal erosion variability at the southern Laptev Sea linked to winter sea ice and the Arctic oscillation. Geophys. Res. Lett. 2020, 47, e2019GL086876. [Google Scholar] [CrossRef] [Green Version]
- Voulgaris, G.; Collins, M.B. Sediment resuspension on beaches: Response to breaking waves. Mar. Geol. 2000, 167, 167–187. [Google Scholar] [CrossRef]
- Kularatne, S.; Pattiaratchi, C. Turbulent kinetic energy and sediment resuspension due to wave groups. Cont. Shelf Res. 2008, 28, 726–736. [Google Scholar] [CrossRef] [Green Version]
- Dean, R.G.; Dalrymple, R.A. Water Wave Mechanics for Engineers and Scientists. Advanced Series on Ocean Engineering; World Scientific Publishing: Singapore, 1991; Volume 2, ISBN 978-981-02-0421-1. [Google Scholar]
Figure 1.
(a) Location of the study area close to the northernmost border of Canada and the USA. The green polygon marks the area where ERA5 data were retrieved; (b) Herschel Island Qikiqtaruk, located on the Canadian Beaufort Shelf. The area of interest is highlighted in red. Geographic coordinates were retrieved from WGS84 projection.

Figure 2.
Time series of satellite imagery from the summer season of 2019. Highlighted green areas mark areas of water–ice interactions and, thus, potential mistakes within the atmospheric correction. Black arrows highlight sediment transport off the coastline. (a–f) depict the ice break-up with increased turbidity. During mid-Summer (g–n), turbidity is decreased with one exception (l). During Fall (o–r), the turbidity features are unstable and change rapidly.

Figure 3.
Overview of mean turbidity in the area of interest over the summer season 2019.

Figure 4.
Mean daily temperature from the weather station at HIQ between 1 June and 30 September (red) and daily Mackenzie River discharge measured at Arctic Red Tsiigehtchic for the same time period (blue). Black lines indicate the dates of satellite image recordings.
Figure 4.
Mean daily temperature from the weather station at HIQ between 1 June and 30 September (red) and daily Mackenzie River discharge measured at Arctic Red Tsiigehtchic for the same time period (blue). Black lines indicate the dates of satellite image recordings.

Figure 5.
Correlation of possible drivers and nearshore turbidity. Parameters that were both measured by the HIQ weather station and downloaded in the ERA5 reanalysis dataset are shown; (H) relates to the HIQ measurement and (R) to the ERA5 reanalysis dataset. (g) Effect of Julian Day on Turbidity.
Figure 5.
Correlation of possible drivers and nearshore turbidity. Parameters that were both measured by the HIQ weather station and downloaded in the ERA5 reanalysis dataset are shown; (H) relates to the HIQ measurement and (R) to the ERA5 reanalysis dataset. (g) Effect of Julian Day on Turbidity.

Figure 6.
Rose diagram showing the dependence of nearshore turbidity on wind speed (reanalysis data from the shelf) and wind direction (in situ data from HIQ).
Figure 6.
Rose diagram showing the dependence of nearshore turbidity on wind speed (reanalysis data from the shelf) and wind direction (in situ data from HIQ).

Publisher’s Note: MDPI stays neutral with regard to jurisdictional claims in published maps and institutional affiliations. |
© 2022 by the authors. Licensee MDPI, Basel, Switzerland. This article is an open access article distributed under the terms and conditions of the Creative Commons Attribution (CC BY) license (https://creativecommons.org/licenses/by/4.0/).
Share and Cite
MDPI and ACS Style
Klein, K.P.; Lantuit, H.; Rolph, R.J. Drivers of Turbidity and Its Seasonal Variability at Herschel Island Qikiqtaruk (Western Canadian Arctic). Water 2022, 14, 1751. https://doi.org/10.3390/w14111751
AMA Style
Klein KP, Lantuit H, Rolph RJ. Drivers of Turbidity and Its Seasonal Variability at Herschel Island Qikiqtaruk (Western Canadian Arctic). Water. 2022; 14(11):1751. https://doi.org/10.3390/w14111751
Chicago/Turabian StyleKlein, Konstantin P., Hugues Lantuit, and Rebecca J. Rolph. 2022. "Drivers of Turbidity and Its Seasonal Variability at Herschel Island Qikiqtaruk (Western Canadian Arctic)" Water 14, no. 11: 1751. https://doi.org/10.3390/w14111751
Note that from the first issue of 2016, this journal uses article numbers instead of page numbers. See further details here.