Article

Groundwater Hydrochemical and Isotopic Evolution from High Atlas Jurassic Limestones to Errachidia Cretaceous Basin (Southeastern Morocco)

1
Laboratory of Geoengineering and Environment, Research Group “Water Sciences and Environment Engineering”, Department of Geology, Faculty of Sciences, Moulay Ismail University, B.P. 11201 Zitoune, Meknes 50000, Morocco
2
Functional Ecology and Environmental Engineering Laboratory, Faculty of Science and Technology, Sidi Mohamed Ben Abdellah University, BP Imouzer Road, Fez 30000, Morocco
3
Department of Geological Engineering, Pamukkale University, Denizli 20010, Turkey
4
UMR 6249 Chrono-Environment, University of Burgundy-Franche-Comté, 16 Route de Gray, 25030 Besançon, France
5
Laboratory Physico-Chemistry of Processes and Materials, Research Team Geology of the Mining and Energetics Resources, Faculty of Sciences and Technology, Hassan First University of Settat, Settat 26002, Morocco
*
Author to whom correspondence should be addressed.
Water 2022, 14(11), 1747; https://doi.org/10.3390/w14111747
Submission received: 21 April 2022 / Revised: 20 May 2022 / Accepted: 26 May 2022 / Published: 29 May 2022
(This article belongs to the Special Issue Advances in Hydrogeology and Groundwater Management Research)

Abstract

:
The objective of this research was to determine the recharge of the Cretaceous aquifers by the High Atlas, as well as the interaction and possible mixing phenomena between the waters of the different aquifers, by investigating the hydrochemical and isotopic evolution of groundwater flow paths from the limestone karst systems of the High Atlas to the Cretaceous basin of Errachidia. Geological techniques were used to investigate and confirm the chemical and isotopic characteristics of the waters. Although the Gibbs diagram shows that water–rock interaction is the dominant hydrochemical process, some water samples in the Cretaceous basin are influenced by both evaporation and water–rock interaction, indicating a mixture of rainfall and deep waters. A saturation index study indicated that limestone minerals were supersaturated in parts of the groundwater samples (calcite and dolomite). This result was confirmed by isotope data. Indeed, some Cretaceous basin samples show isotopic similarities to those from the Jurassic High Atlas. The geological cross-sections illustrate that the High Atlas Jurassic limestones are in direct contact with the Cretaceous basin’s permeable rocks, allowing groundwater to circulate from the High Atlas to Errachidia’s Cretaceous basin.

1. Introduction

Fractured and karstified aquifers are major sources of drinking water worldwide [1,2,3,4,5]. Their protection requires careful studies, often concentrated in recharge areas, to avoid potential pollution. It has already been identified that climate change and global population growth are having a substantial impact on global water resources [6]. Thus, the study of water resources in arid and semi-arid areas is the main focus of many current scientific investigations, as the natural stresses of development in these regions are directly related to the scarcity of water resources. In the majority of developing countries, there is a lack of systematic monitoring of hydrological systems, although the decrease in water levels and the degradation of their quality are generally remarked despite sometimes being detected in an advanced stage of deterioration of the aquifer.
The focus of the present study is the geochemistry of groundwater in the Errachidia region, which is an arid to semi-arid area located in the southeastern part of Morocco. It includes the Jurassic aquifers of the High Atlas and the Cretaceous aquifers of the Errachidia basin. The study area shows a very diversified lithology with a dominance of carbonate formations of Jurassic Atlas and Turonian limestones, as well as sands and sandstones of the Senonian and Infracenomanian. These formations are very fissured and faulted with karstic phenomena advanced in the carbonates. These formations are the potential location of aquifers that manifest in many springs of varying importance, the groundwater of which is a major source of life for the local population. Despite the prolonged drought cycles that this region has suffered in recent years and which have caused a significant water deficit, as well as the low effective rainfall in the basin, the majority of springs from the Cretaceous basin of Errachidia continue to show a significant flow rate [7,8]. The hypothesis of a feeding of the aquifers of the basin from the Jurassic aquifers of the High Atlas has been proposed [7,9,10]. The usual methods of estimating the recharge of the aquifers often do not provide the desired precision [11,12]. On the other hand, hydrogeochemical investigation methods, some of which are based on stable isotopes, have become an essential means for better understanding the hydrological functioning of aquifer systems in recent years [13,14,15,16,17,18]. Multi-trackers combined with stable isotopes of the water molecule are used to study groundwater movement, mixing patterns between different groundwater sources, salinity origin and recharge area [19,20,21,22]. This information is essential for improving groundwater resource management, especially in arid and semi-arid regions [23,24,25].
Major and trace elements are widely applied for geochemical characterization of groundwater and to define anthropogenic input [26,27,28,29,30]. Stable isotopes are also used as tracers of different processes, such as groundwater hydrodynamics, mixing processes, seawater intrusion and groundwater contamination [14,26].
The objective of the present study was to study the hydrochemical and isotopic evolution of subsurface flows from the carbonate karst systems of the High Atlas to the Cretaceous Errachidia basin (discharge area) in order to determine the interactions and mixing between the waters of the different aquifers along the global flow axis.

2. Materials and Methods

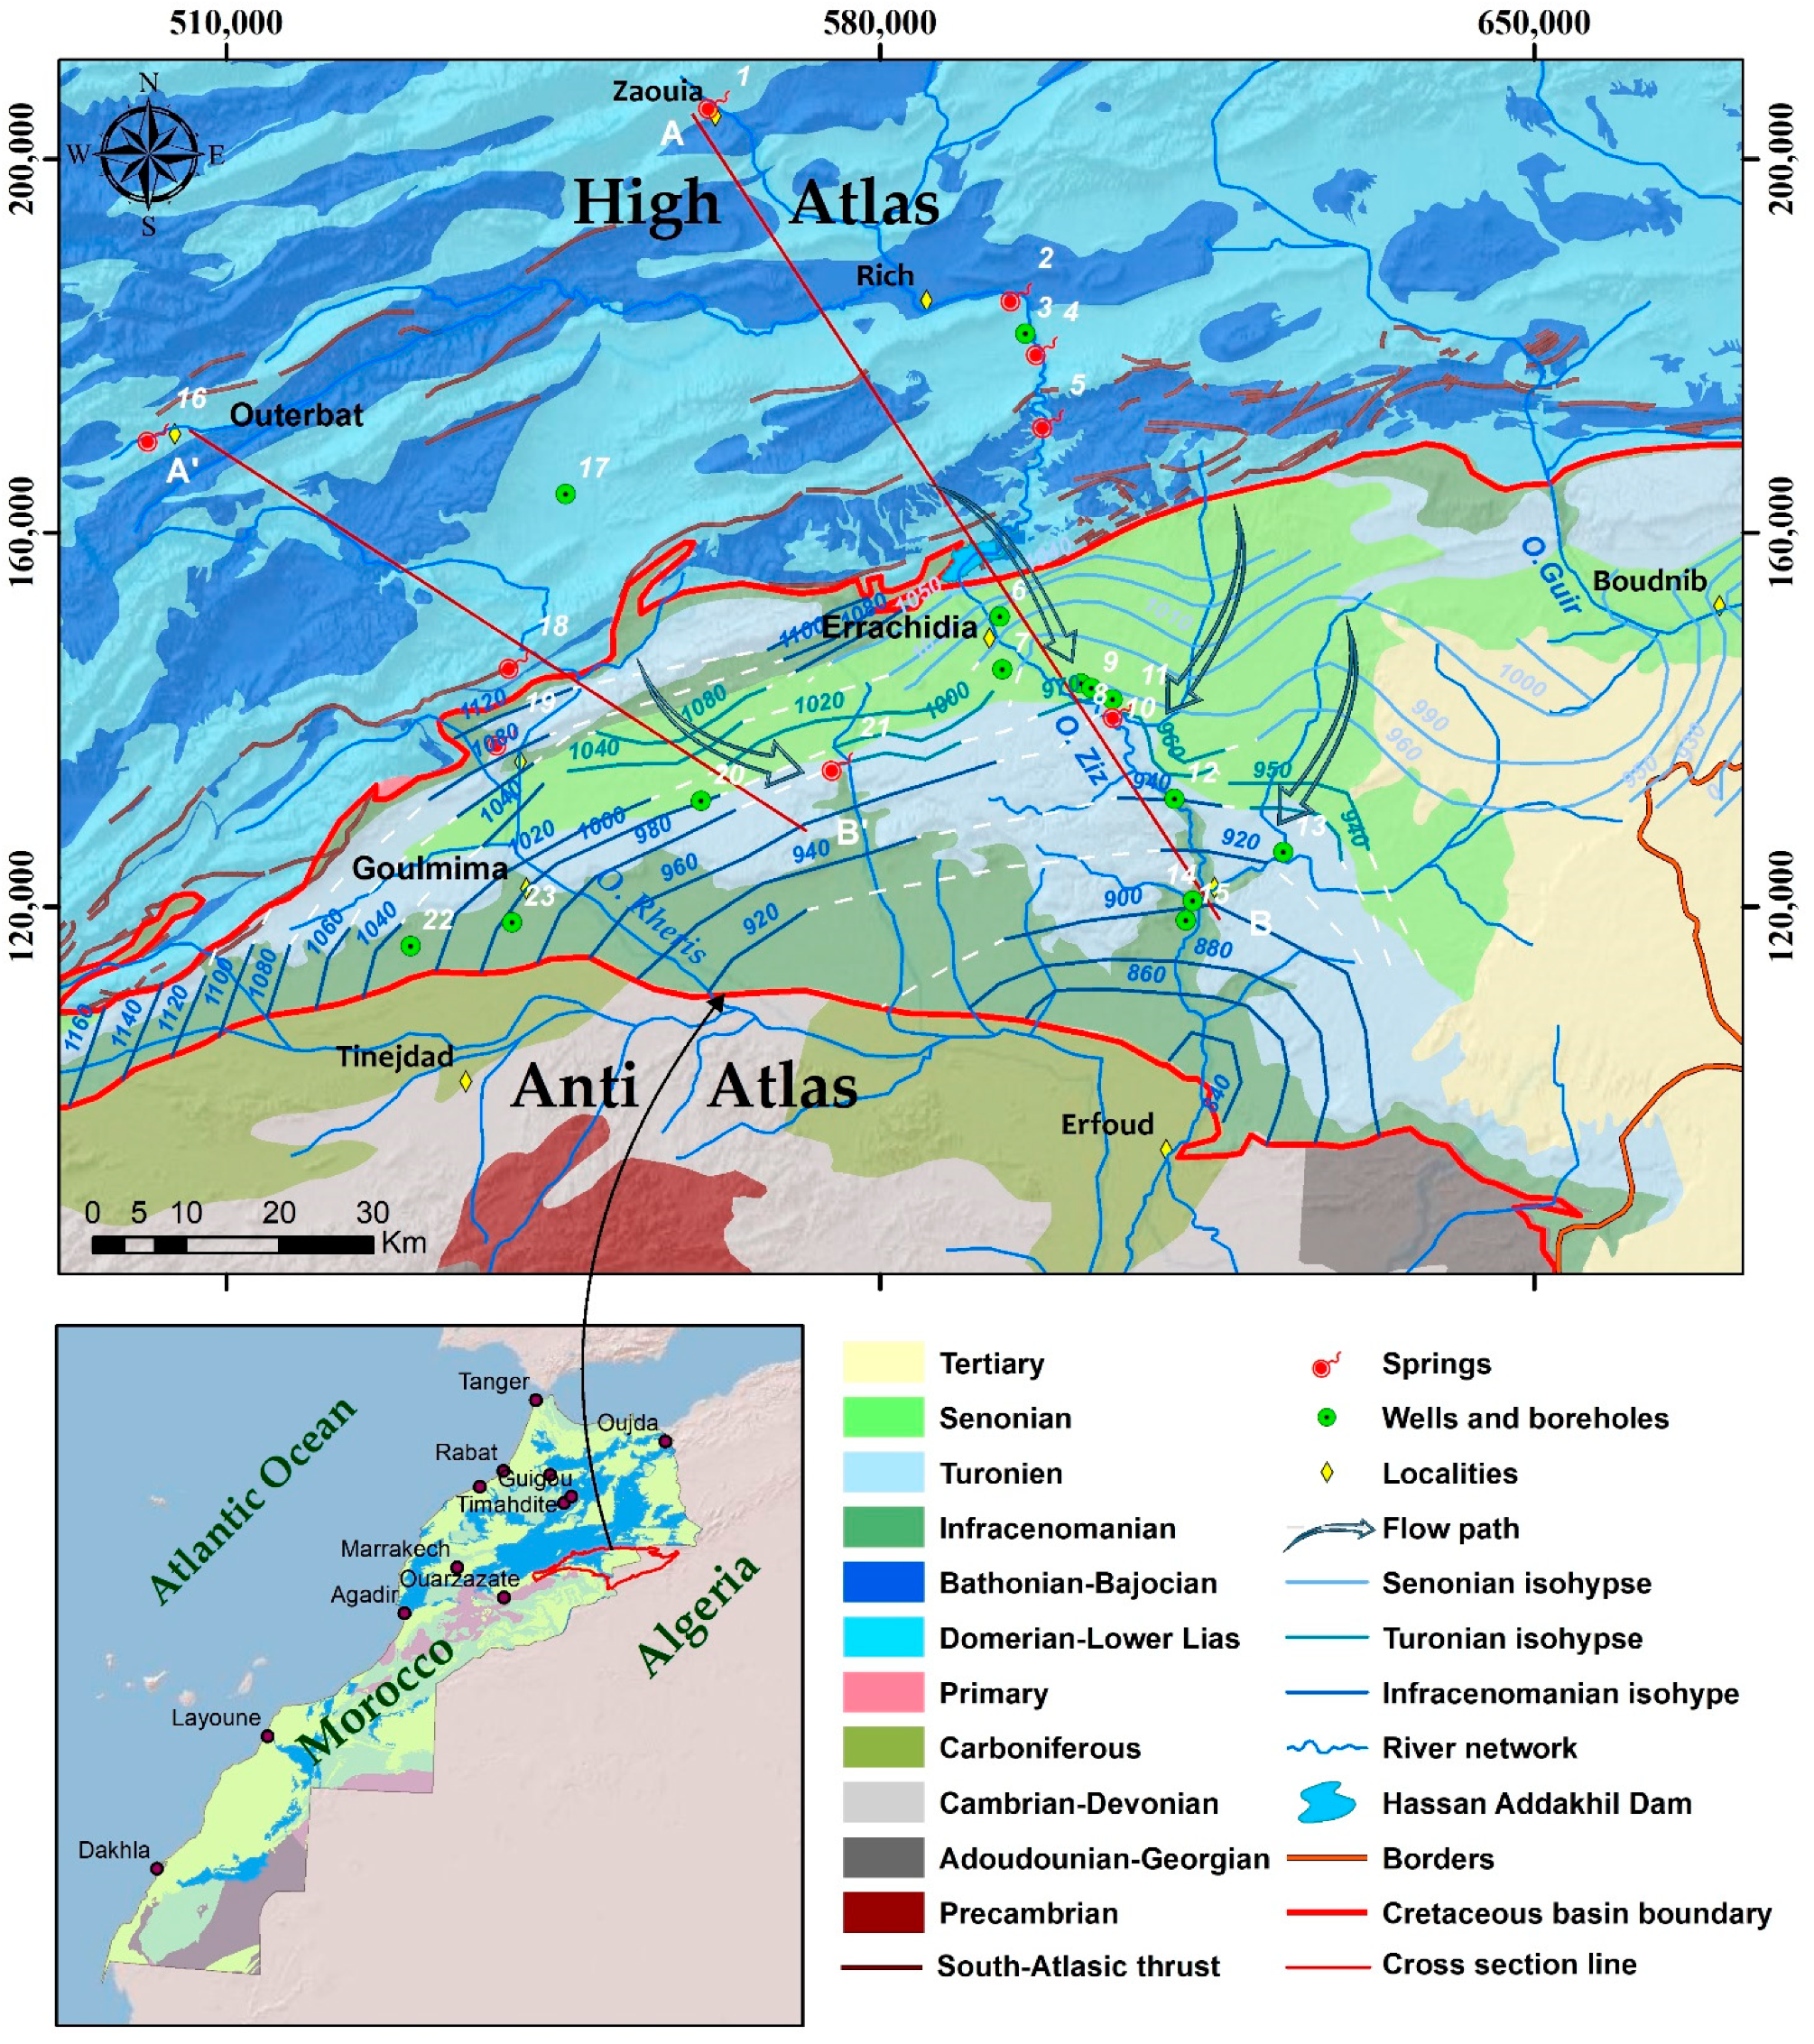
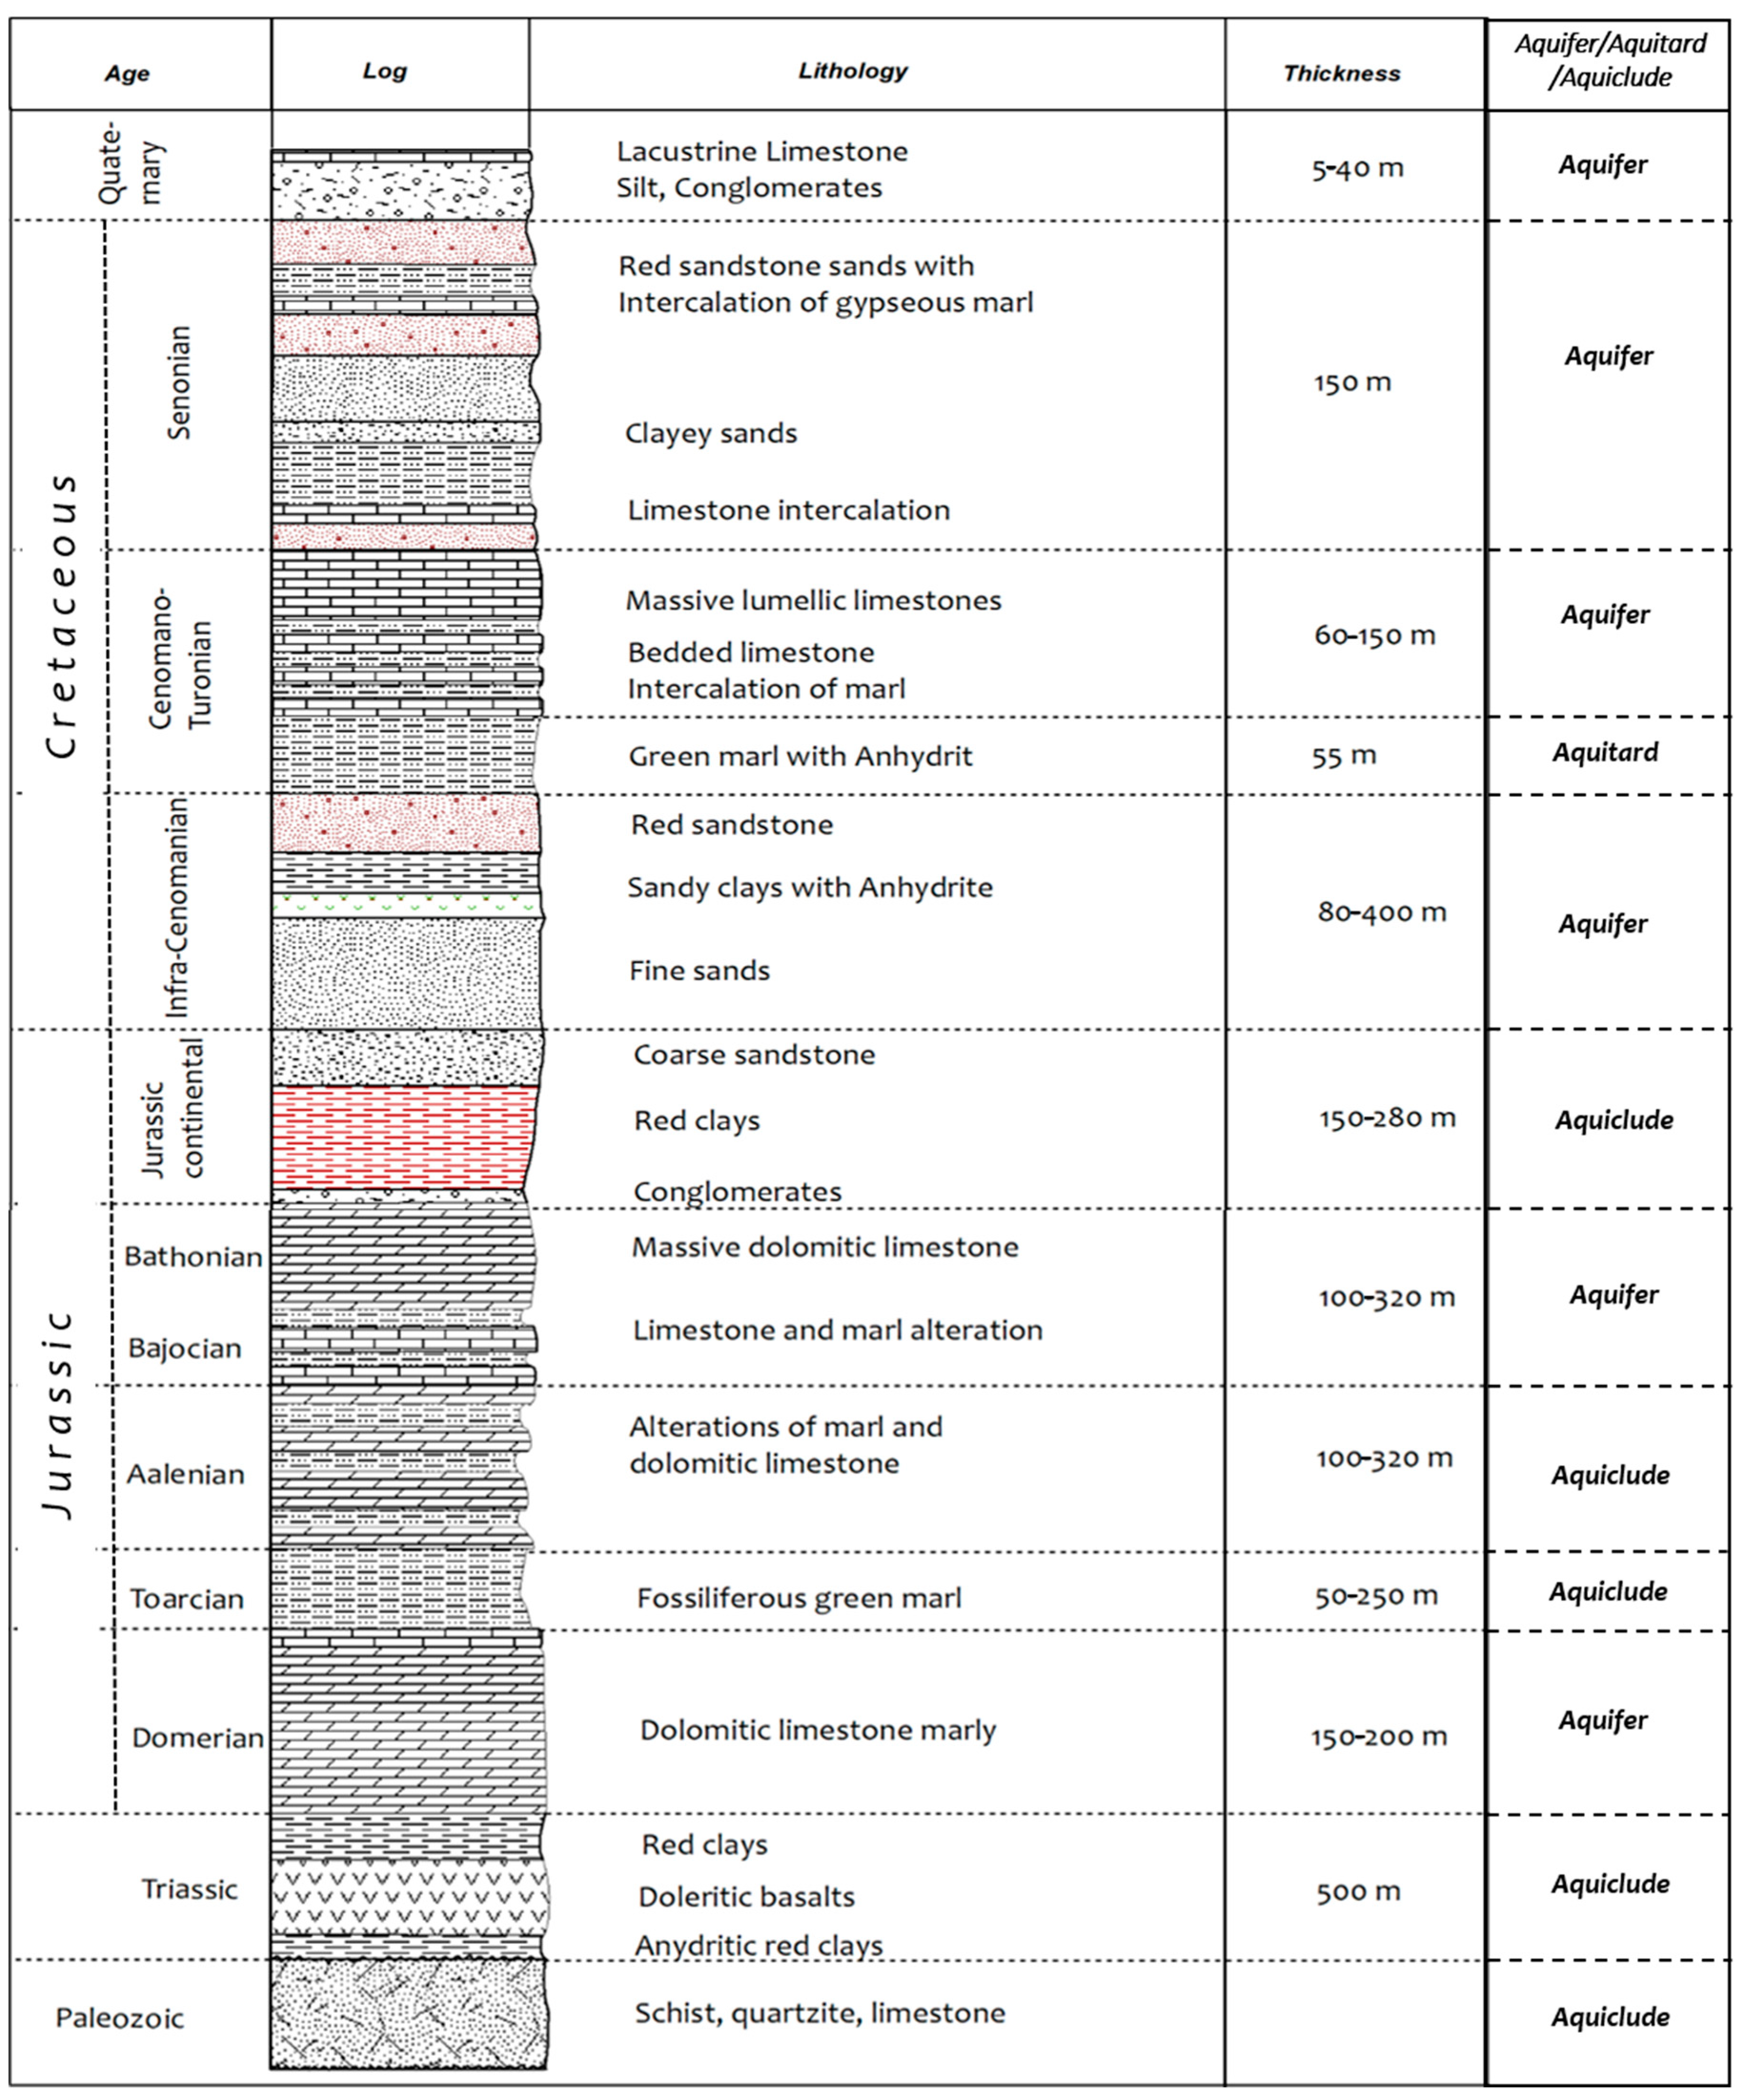
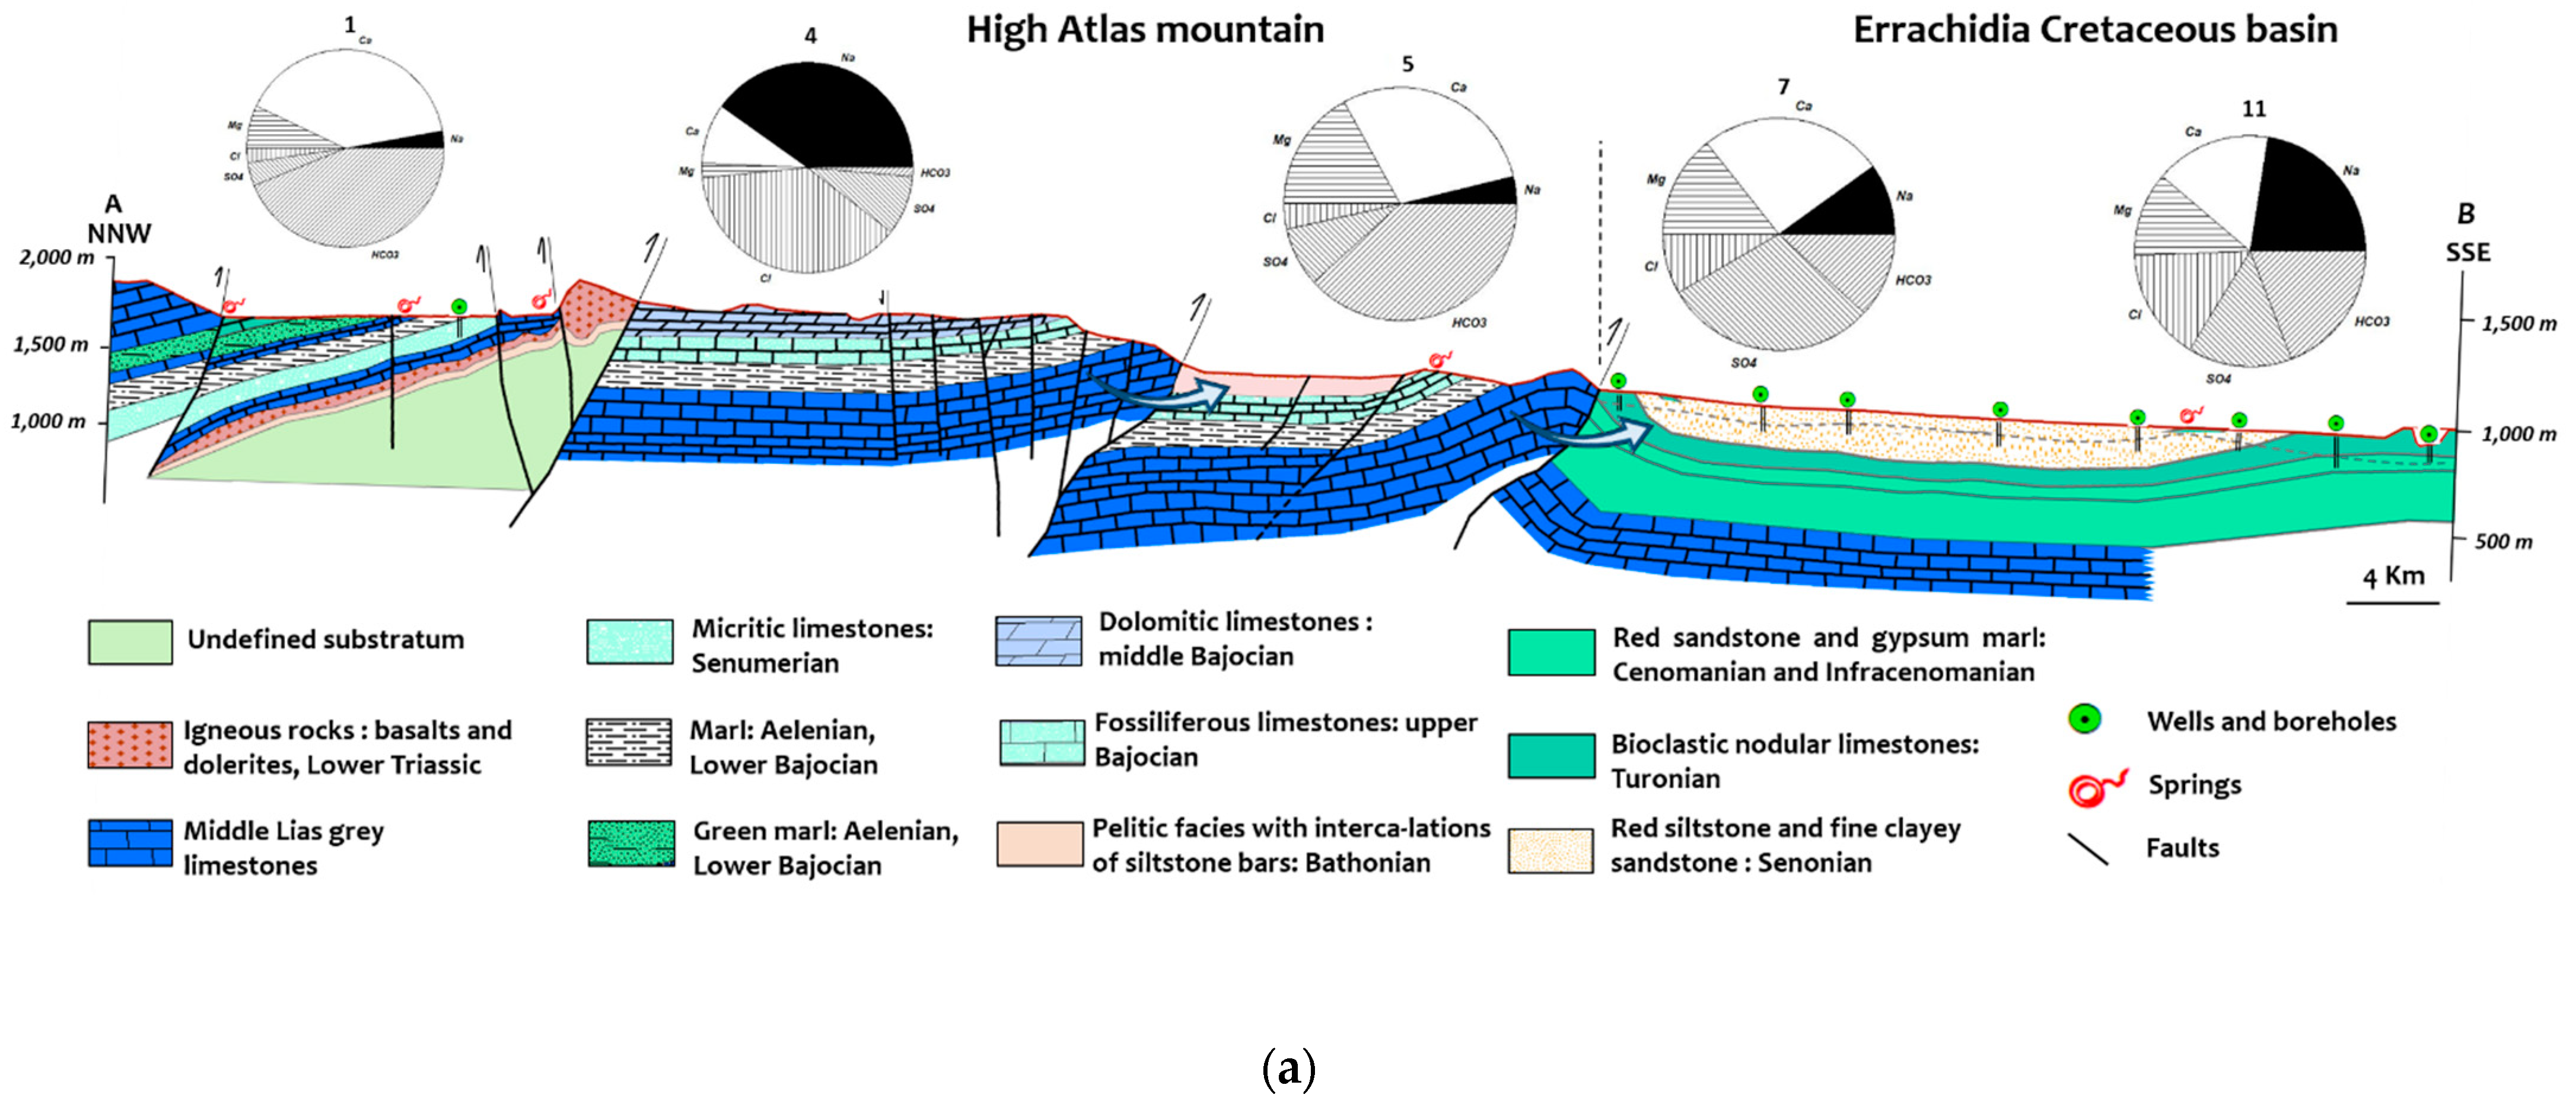
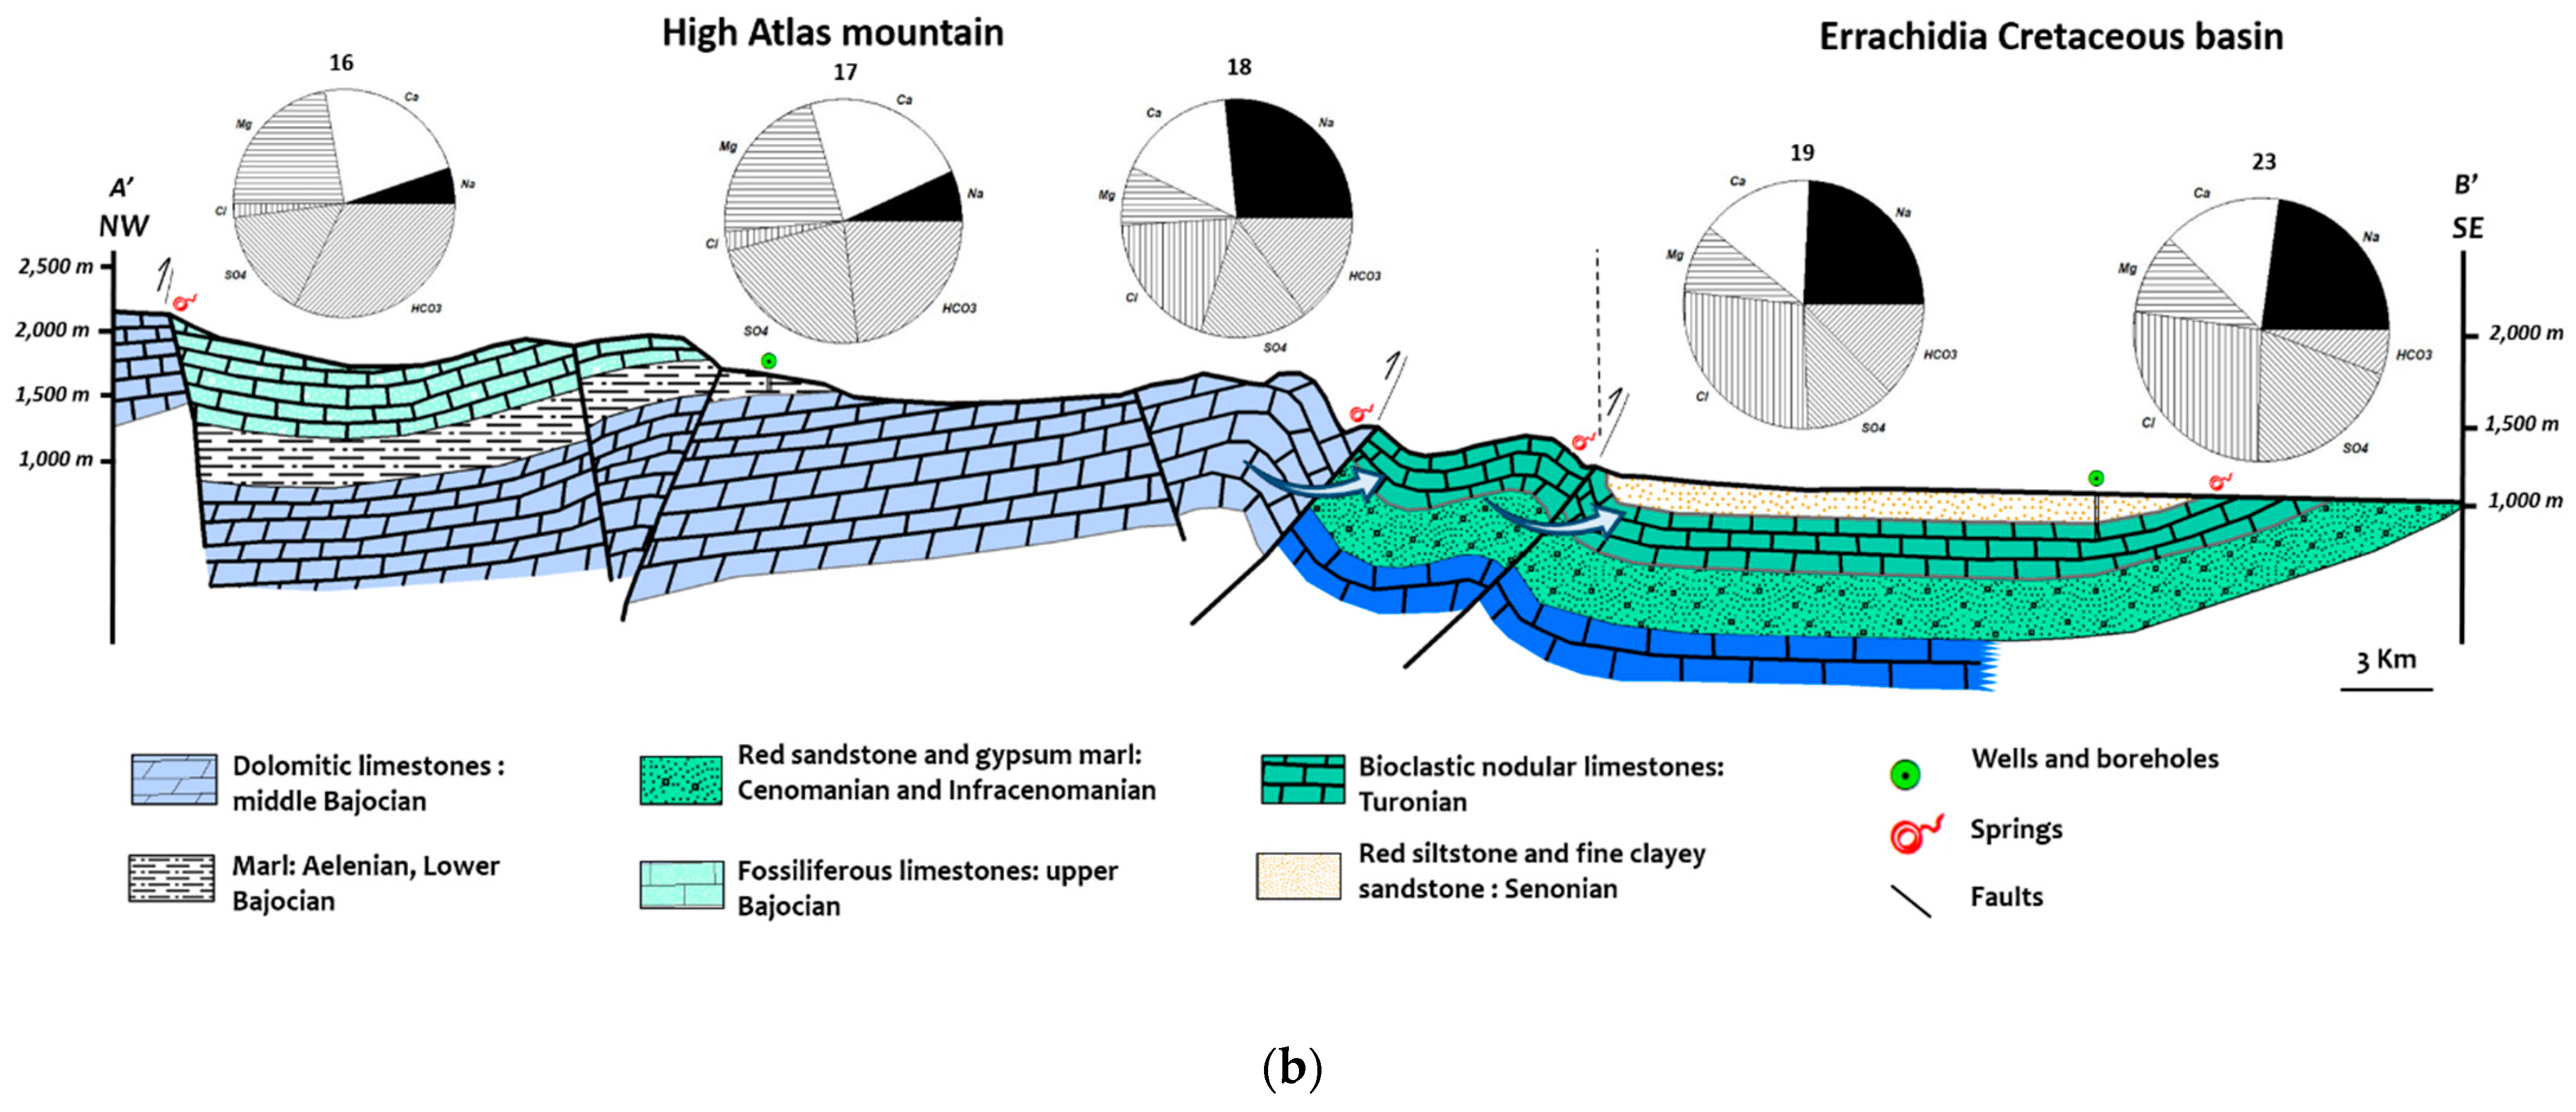
2.1. Geological and Hydrogeological Settings

The study area is located in the southeast of Morocco (Figure 1). It is constituted by the High Atlas to the north and the Cretaceous Errachidia basin to the south. These two units are separated by the South Atlas thrust. This region is characterized by an arid to semi-arid climate, with an annual regime of rainfall marked by two wet seasons of autumn and spring separated by a short winter season and by a long, dry summer season. Rainfall decreases from 250 mm in the high reliefs of the High Atlas to 150 mm in the piedmont, with an effective rainfall of about 6.47 mm. In the south, rainfall is about 80 mm, with an effective rainfall varying from 1.52 to 4.55 mm. The low rainfall in the south is due to the fact that the Atlas mountains prevent any oceanic influence and the presence of warm air masses coming from the Sahara [31].
The geological and lithostratigraphic framework of the study area is marked by a series of geological formations aged from Paleozoic to Quaternary. The High Atlas in the study area is represented by Jurassic aquifers (Lower Liassic aquifer networks and aquifer networks of the Aalenian and Dogger limestone series) and Quaternary aquifers. These aquifers are made up of limestones and dolomites intercalated with marls and clays containing occurrences of anhydrite and gypsum, which are deposited on Paleozoic shales and quartzites or on red clays and basalts of the Triassic. They outcrop in the north of the basin with a thickness of 450 m.
The Cretaceous basin is bordered to the north by the High Atlas reliefs and to the south by those of the Anti-Atlas and consists mainly of three superimposed aquifers (Senonian, Turonian and Infracenomanian) surmounted by a quaternary alluvial table.
The Infracenomanian aquifer is formed by continental deposits (sandstones and conglomerates) and deposits from lagoons (sands, clays and marls) (Figure 2). It outcrops in the form of vast plains to the NW and to the south, with a variable thickness of 200 m in the north and more than 500 m in the center of the basin, and progressively decreases towards the south with a thickness of 50 to 100 m. Its bottom is impermeable, formed by shales, marls and red clays. Its cover is made up of impermeable Cenomanian formations of marine origin composed of marls and clays with various thicknesses.
The Turonian aquifer is characterized by fractured limestone and dolomite formations of marine origin in the form of karstic facies. It is exposed in the form of fissured plains, with an average thickness of around 100 m, which is reduced to 25 m in the south. Its impermeable bottom is formed of Cenomanian clays, its top is formed of Senonian sandstones and marls, allowing for communication with the upper formations. Its principal natural exits are springs, including that of Tarda (sample 21, Table 1), Tifounassine and Meski (sample 11, Table 1).
The Senonian aquifer is composed of heterogeneous continental formations (sandstone and clay) containing gypsum (CaSO4-2H2O) and anhydrite (CaSO4). It outcrops in the eastern part of the study area, with an average thickness of 150 m.
The general flow in the study area is from north to south. Piezometric analysis of aquifers shows three major flow axes: the first is in the Errachidia area, where the general groundwater flow is from north to south (Figure 1), with a hydraulic gradient of nearly 5‰, attesting a recharge of the aquifer from the High Atlas; the second flow axis is in the Goulmima region, generally flowing from northwest to southeast, with a hydraulic gradient of nearly 3‰; and the third flow axis is in the area between Meski and Erfoud, with a flow generally from north to south, and a hydraulic gradient of nearly 5‰.

2.2. Sampling and Analytical Methods

A total of 23 water samples were collected from springs, wells and boreholes for hydrochemical analysis and determination of environmentally stable isotope concentrations during October 2020 in the different aquifers of the study area. Temperature (T), hydrogen potential (pH) and electrical conductivity (EC) were measured in situ using a multiparameter instrument (BANTE Instruments 821). These samples were the object of chemical analysis at the National Center of Scientific and Technical Research (CNRST) for determination of the major elements and the elements in traces (ICP). ICP analysis was used for the identification of concentrations of elements such as SiO2, Cu, Pb, Al and As. Analysis of major elements such as Na+, K+, Ca2+, Mg2+, Cl and SO4 was performed with ionic chromatography, and we determined the concentration of bicarbonates (HCO3) in the field by the pH-metric method at the equivalent point TAC (complete alkalinity titer).
Analysis of the stable isotopes of the molecules of water oxygen 18 (18O) and deuterium (2H) performed using a Delta Plus UV mass spectrophotometer and an ICP-MS mass spectrometer (IRMS) after equilibration at 18 °C. The 18O and 2H contents are expressed per thousand (‰) of deviation from the V-SMOW standard with an uncertainty of 0.1‰ for 18O and 1‰ for 2H. For tritium 3H analysis, we adapted the method by electrolytic enrichment and liquid scintillation counting (LSC), as described in ISO 9698 standards [33]. Tritium contents are reported in tritium units (TU). These analyses were performed at the National Center of Energy, Sciences and Nuclear Techniques (CNESTEN).
The results were used for the estimation of saturation index (SI). The geochemical modeling program PHREEQC V2.18 [35] was used to calculate speciations, ion activities and saturation indices (calcite, dolomite, gypsum, halite, kaolinite, etc.), depending on element concentrations and temperature. Some chemical and physical processes (mixing, precipitation, solubility, ion exchange and redox reactions) were described by means of PhreeqC results, as well as some interpretation of hydrogeochemical diagrams and scatter graphics.
Piezometric surveys were conducted during October 2020 to establish the piezometric map.
The geological map and cross sections were established by GIS software to locate the sampling positions, as well as for geological analysis of the study area to understand the hydrogeochemical processes.

3. Results and Discussion

3.1. Hydrochemical Result

The obtained analytical measurements are summarized in Table 1. The collected waters from these aquifers have a large range of salinity, as indicated by the EC, which ranges from 263 μS/cm to 8000 μS/cm, depending on the aquifer level and the nature of the aquifer lithology. The samples with the highest salinity in the study area were obtained from the Quaternary aquifer, particularly in the Cretaceous basin and geothermal groundwater (samples 1 and 4). However, the samples from the carbonate aquifer situated on the High Atlas present low electrical conductivity values. The temperature of the groundwater varied between 14 °C and 50.3 °C. The pH ranged from 6.34 to 8.65 in the sampled groundwater, indicating neutral to slightly alkaline values, with the lowest values corresponding to geothermal water (sample 4), as well as Infracenomanian waters (samples 22 and 23), whereas higher pH values were observed in water samples from the alluvial Quaternary aquifer (samples 9, 17), as well as Jurassic samples (sample 1, 16 and 17).

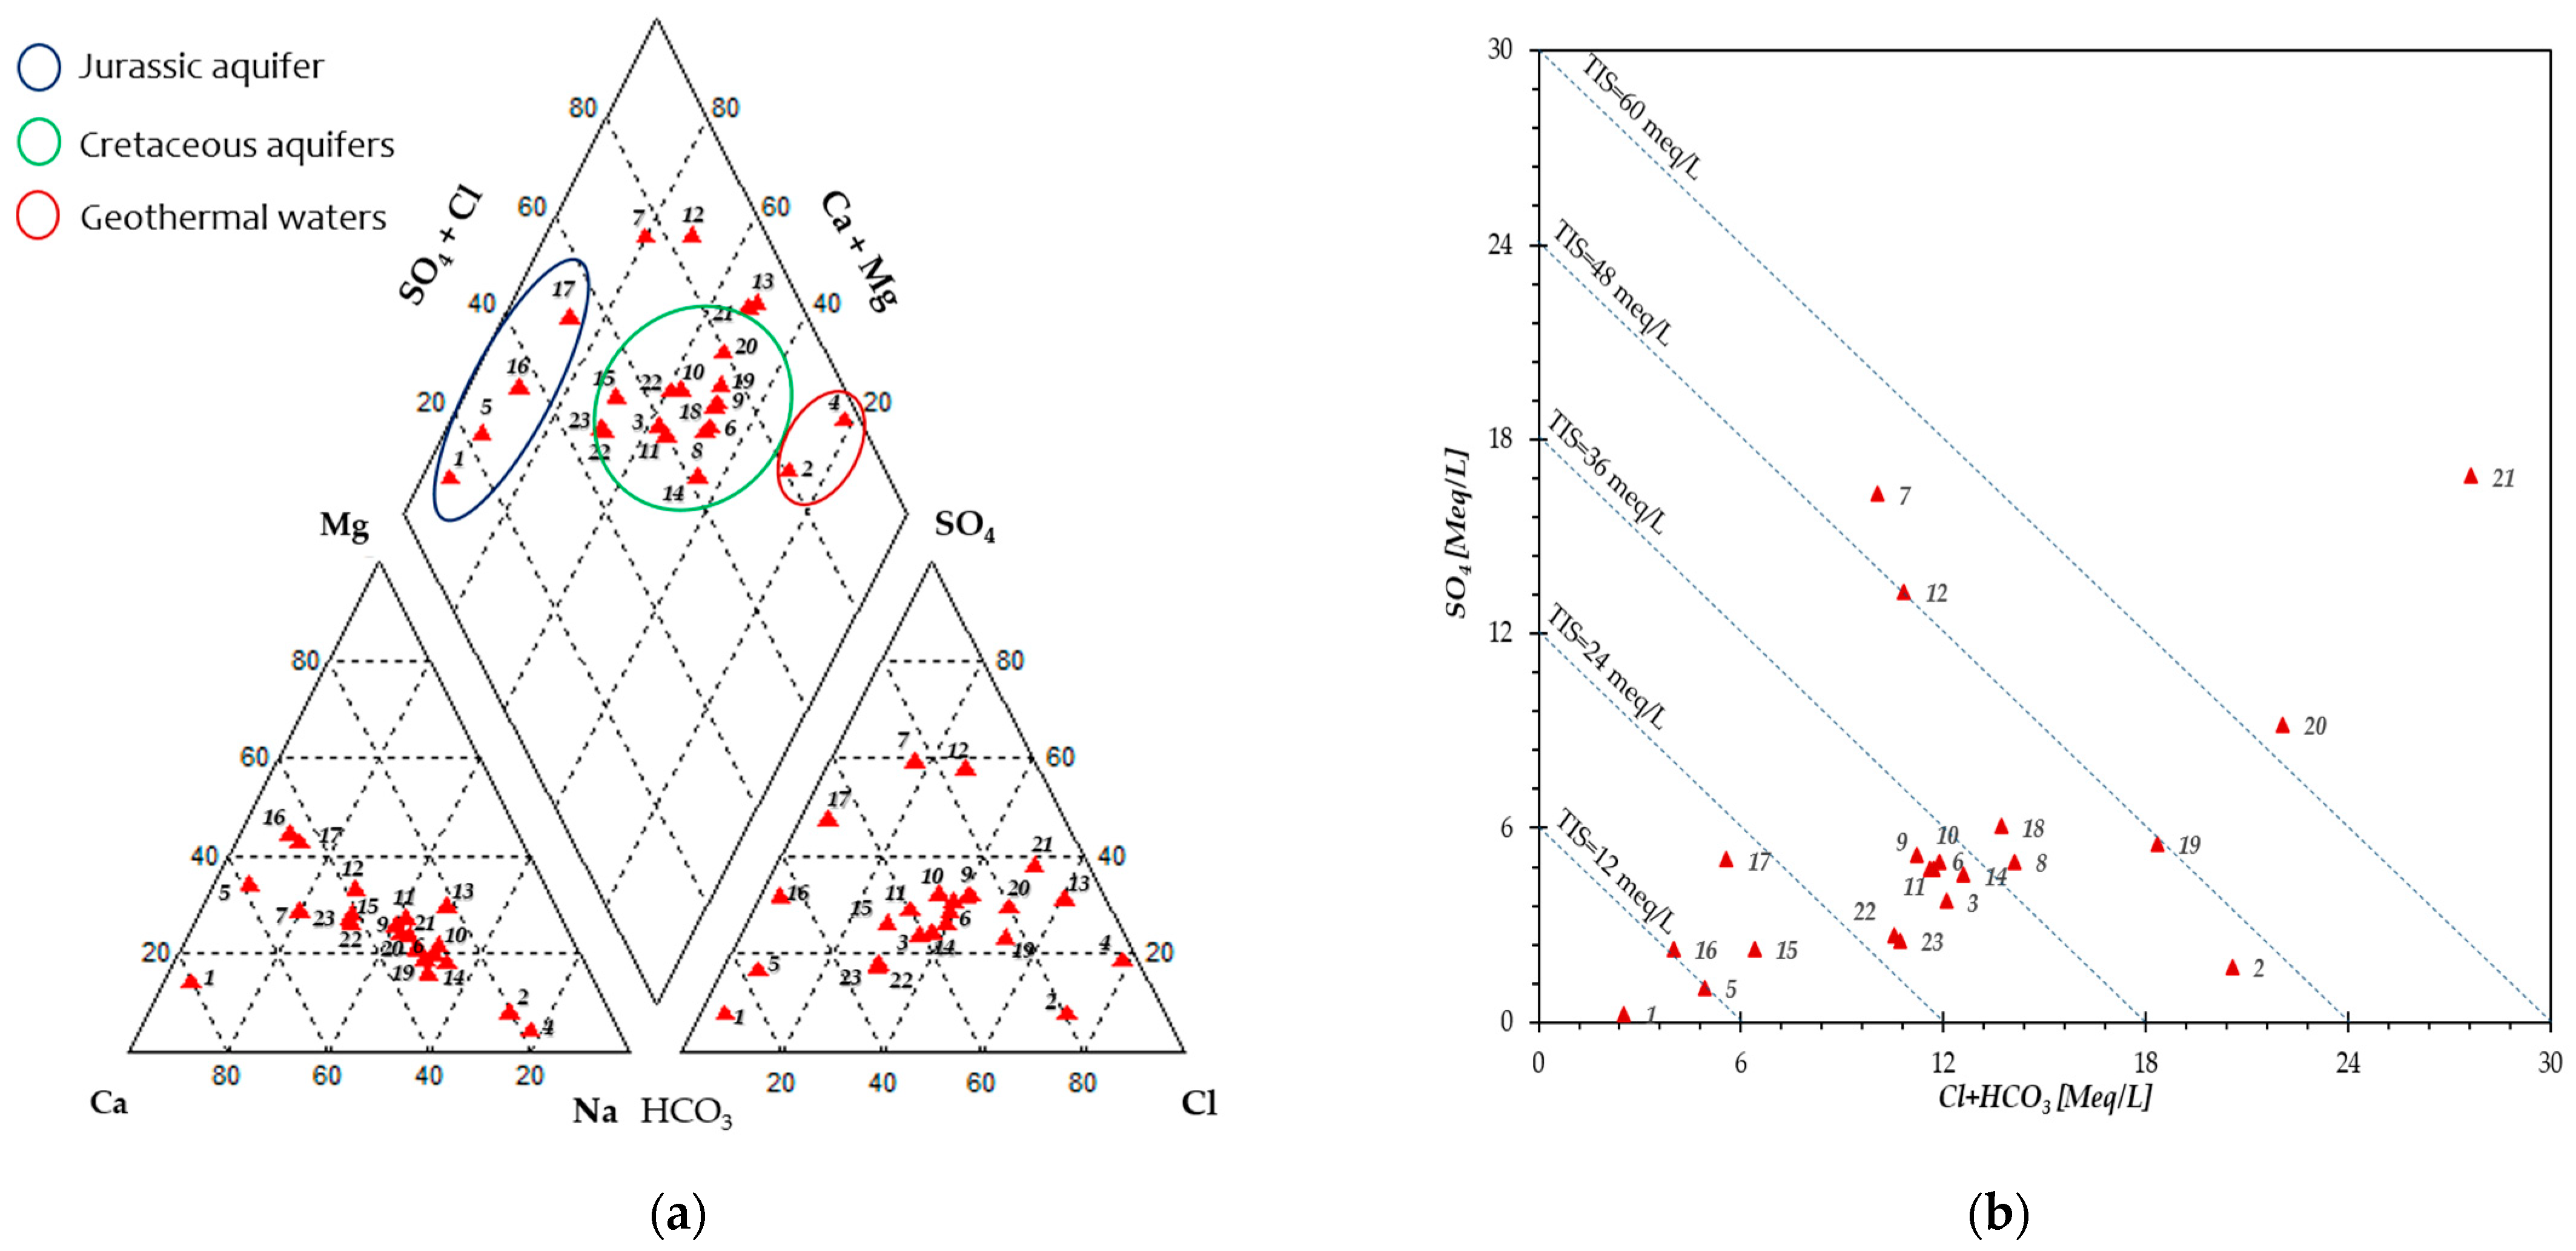
3.1.1. Hydrochemical Characteristics

Studying water mixing is not always simple because the boundaries between surface water and groundwater are not well defined [36,37]. The collected samples were projected on a piper diagram (Figure 3a) to define and understand the various hydrochemical characteristics and hydrochemical types of waters, as well as the hydrochemical evolution of groundwater. Figure 3a shows that most of the water from the Jurassic aquifer (samples 1, 5, 16 and 17) is of a Mg-Ca-HCO3-SO4 type. However, the water chemistry type for Cretaceous basin aquifers is relatively complex, including Na-Ca Mg-Cl-SO4, HCO3-SO4-Ca-Mg, SO4-HCO3-Ca-Mg, SO4-Cl-Ca-Mg and Cl-SO4-Na types (samples 6, 7, 8, 9, 18, 19, etc.).
The major geothermal systems are dominated by deep groundwater circulating with little or no dilution by substantial shallow meteoric water [38,39,40]. In our study area, the geothermal waters, which are represented by the springs of Moulay Ali Cherif and Moulay Hachem (samples 2 and 4), are characterized by Na-Cl type.
The waters of the thermal springs of My Hachem and My Ali Cherif (samples 2 and 4, Figure 1), with chloride-sodic facies, have circulated deeply through a crystalline substratum affected by major tectonic activities. However, the influence of the Triassic evaporitic terrains can be noted.
In the Giggenbach triangular diagram (Na-K-Mg) (Figure 4), the analytical results of the thermal waters of the springs show a certain tendency towards thermodynamic equilibrium, with a temperature below 100 °C. However, the representative point of the waters of My Ali Cherif spring, located in the magnesian pole of the Na-K-Mg diagram, shows that the equilibrium between the water and the host rock is far from being reached and testifies to a more important mixing of hot waters with cold waters at depth.

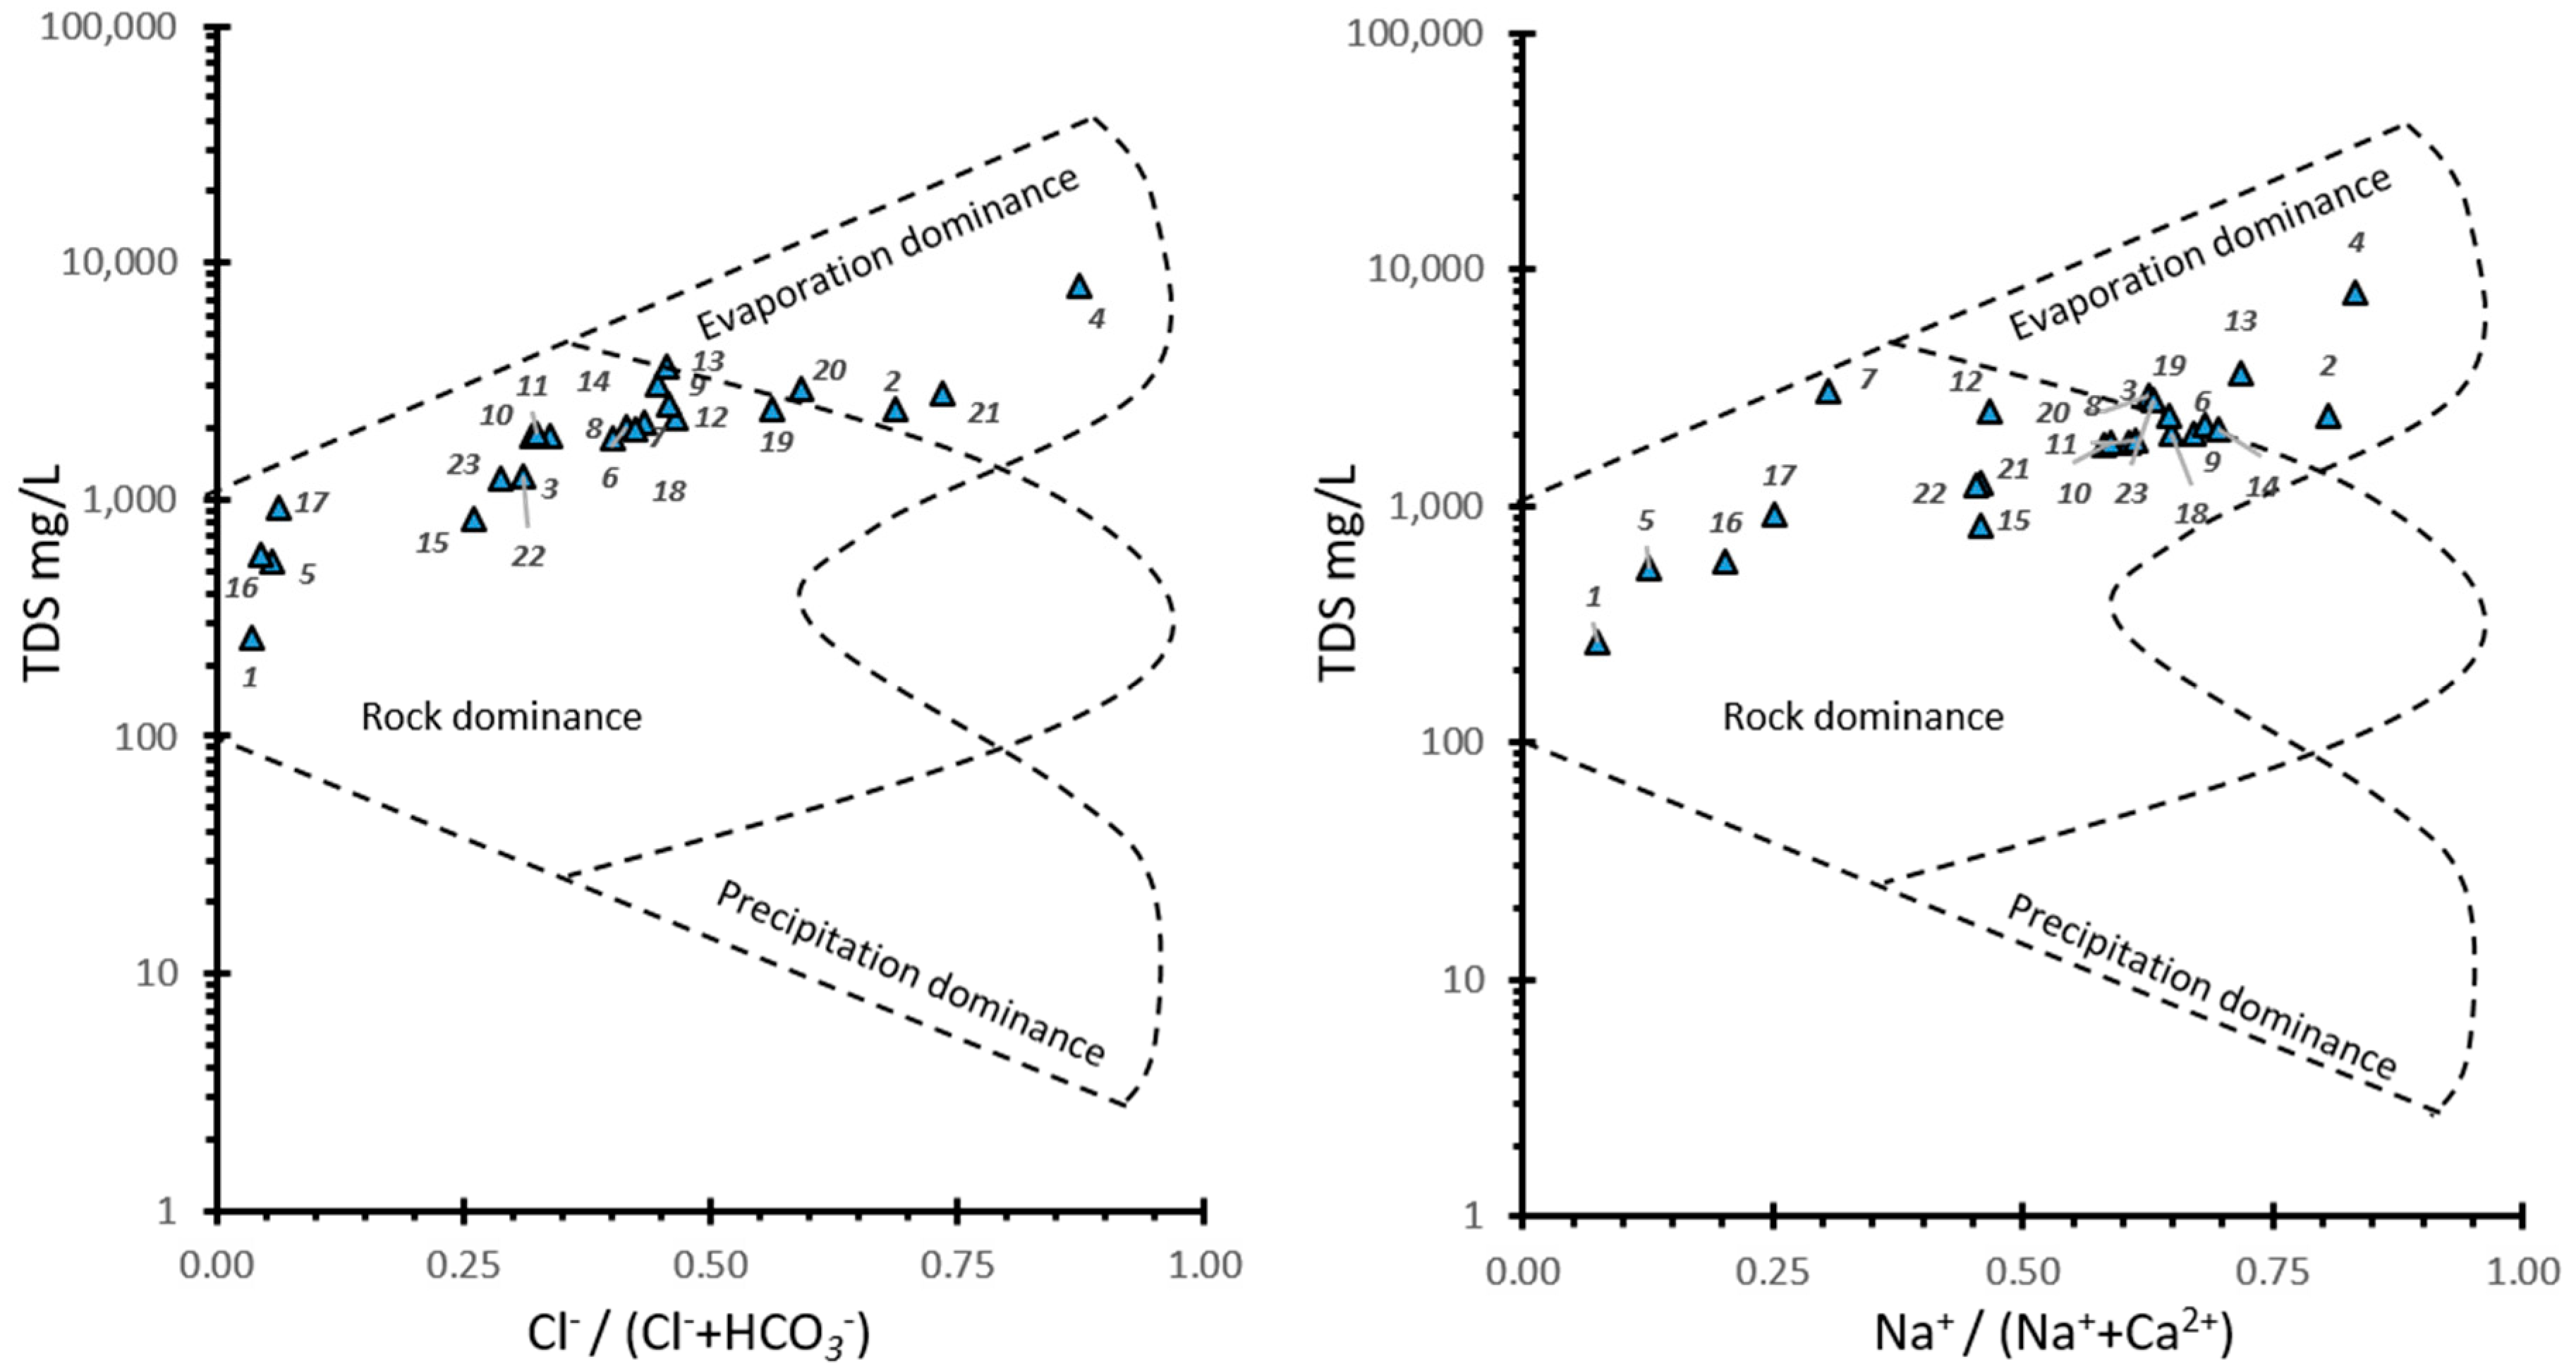
3.1.2. Hydrochemical Processes

The samples were plotted on Gibbs diagrams, which were constructed by the equivalence concentration ratios of Na+/(Na+ + Ca2+) and Cl/(Cl + HCO3) versus TDS. Such diagrams are largely used to identify hydrogeochemical evolution, which involves precipitation, rock weathering and evaporation–crystallization processes [41]. In the Gibbs diagram, water samples are located in the lower right, with low TDS values but high Na+/(Na+ + Ca2+) or Cl/(Cl + HCO3) values, indicating that the chemical compositions were influenced by atmospheric precipitation. Samples drop in the center zone, indicating that the rock alteration process is dominant, and samples with high TDS values and high Na+/(Na+ + Ca2+) and Cl/(Cl + HCO3) values drop in the top-right zone, signifying the influence of evaporation.
Figure 5 shows that most of these groundwater samples are located in an area dominated by a rock weathering process, which indicates that the main hydrochemical process of water in the study area is water–rock interaction. However, some groundwater samples, such as the geothermal waters of Moulay Ali Cherif and Moulay Hachem (samples 2, 4), as well as samples 13, 14, 20 and 23, which are located at shallow depths in the Cretaceous basin, are located in the transition zone between evaporation and rock weathering, which suggests that the waters of the Jurassic aquifers of the High Atlas are influenced by water–rock interaction processes. However, some of the waters of the Cretaceous basin were influenced by both evaporation and water–rock interaction.

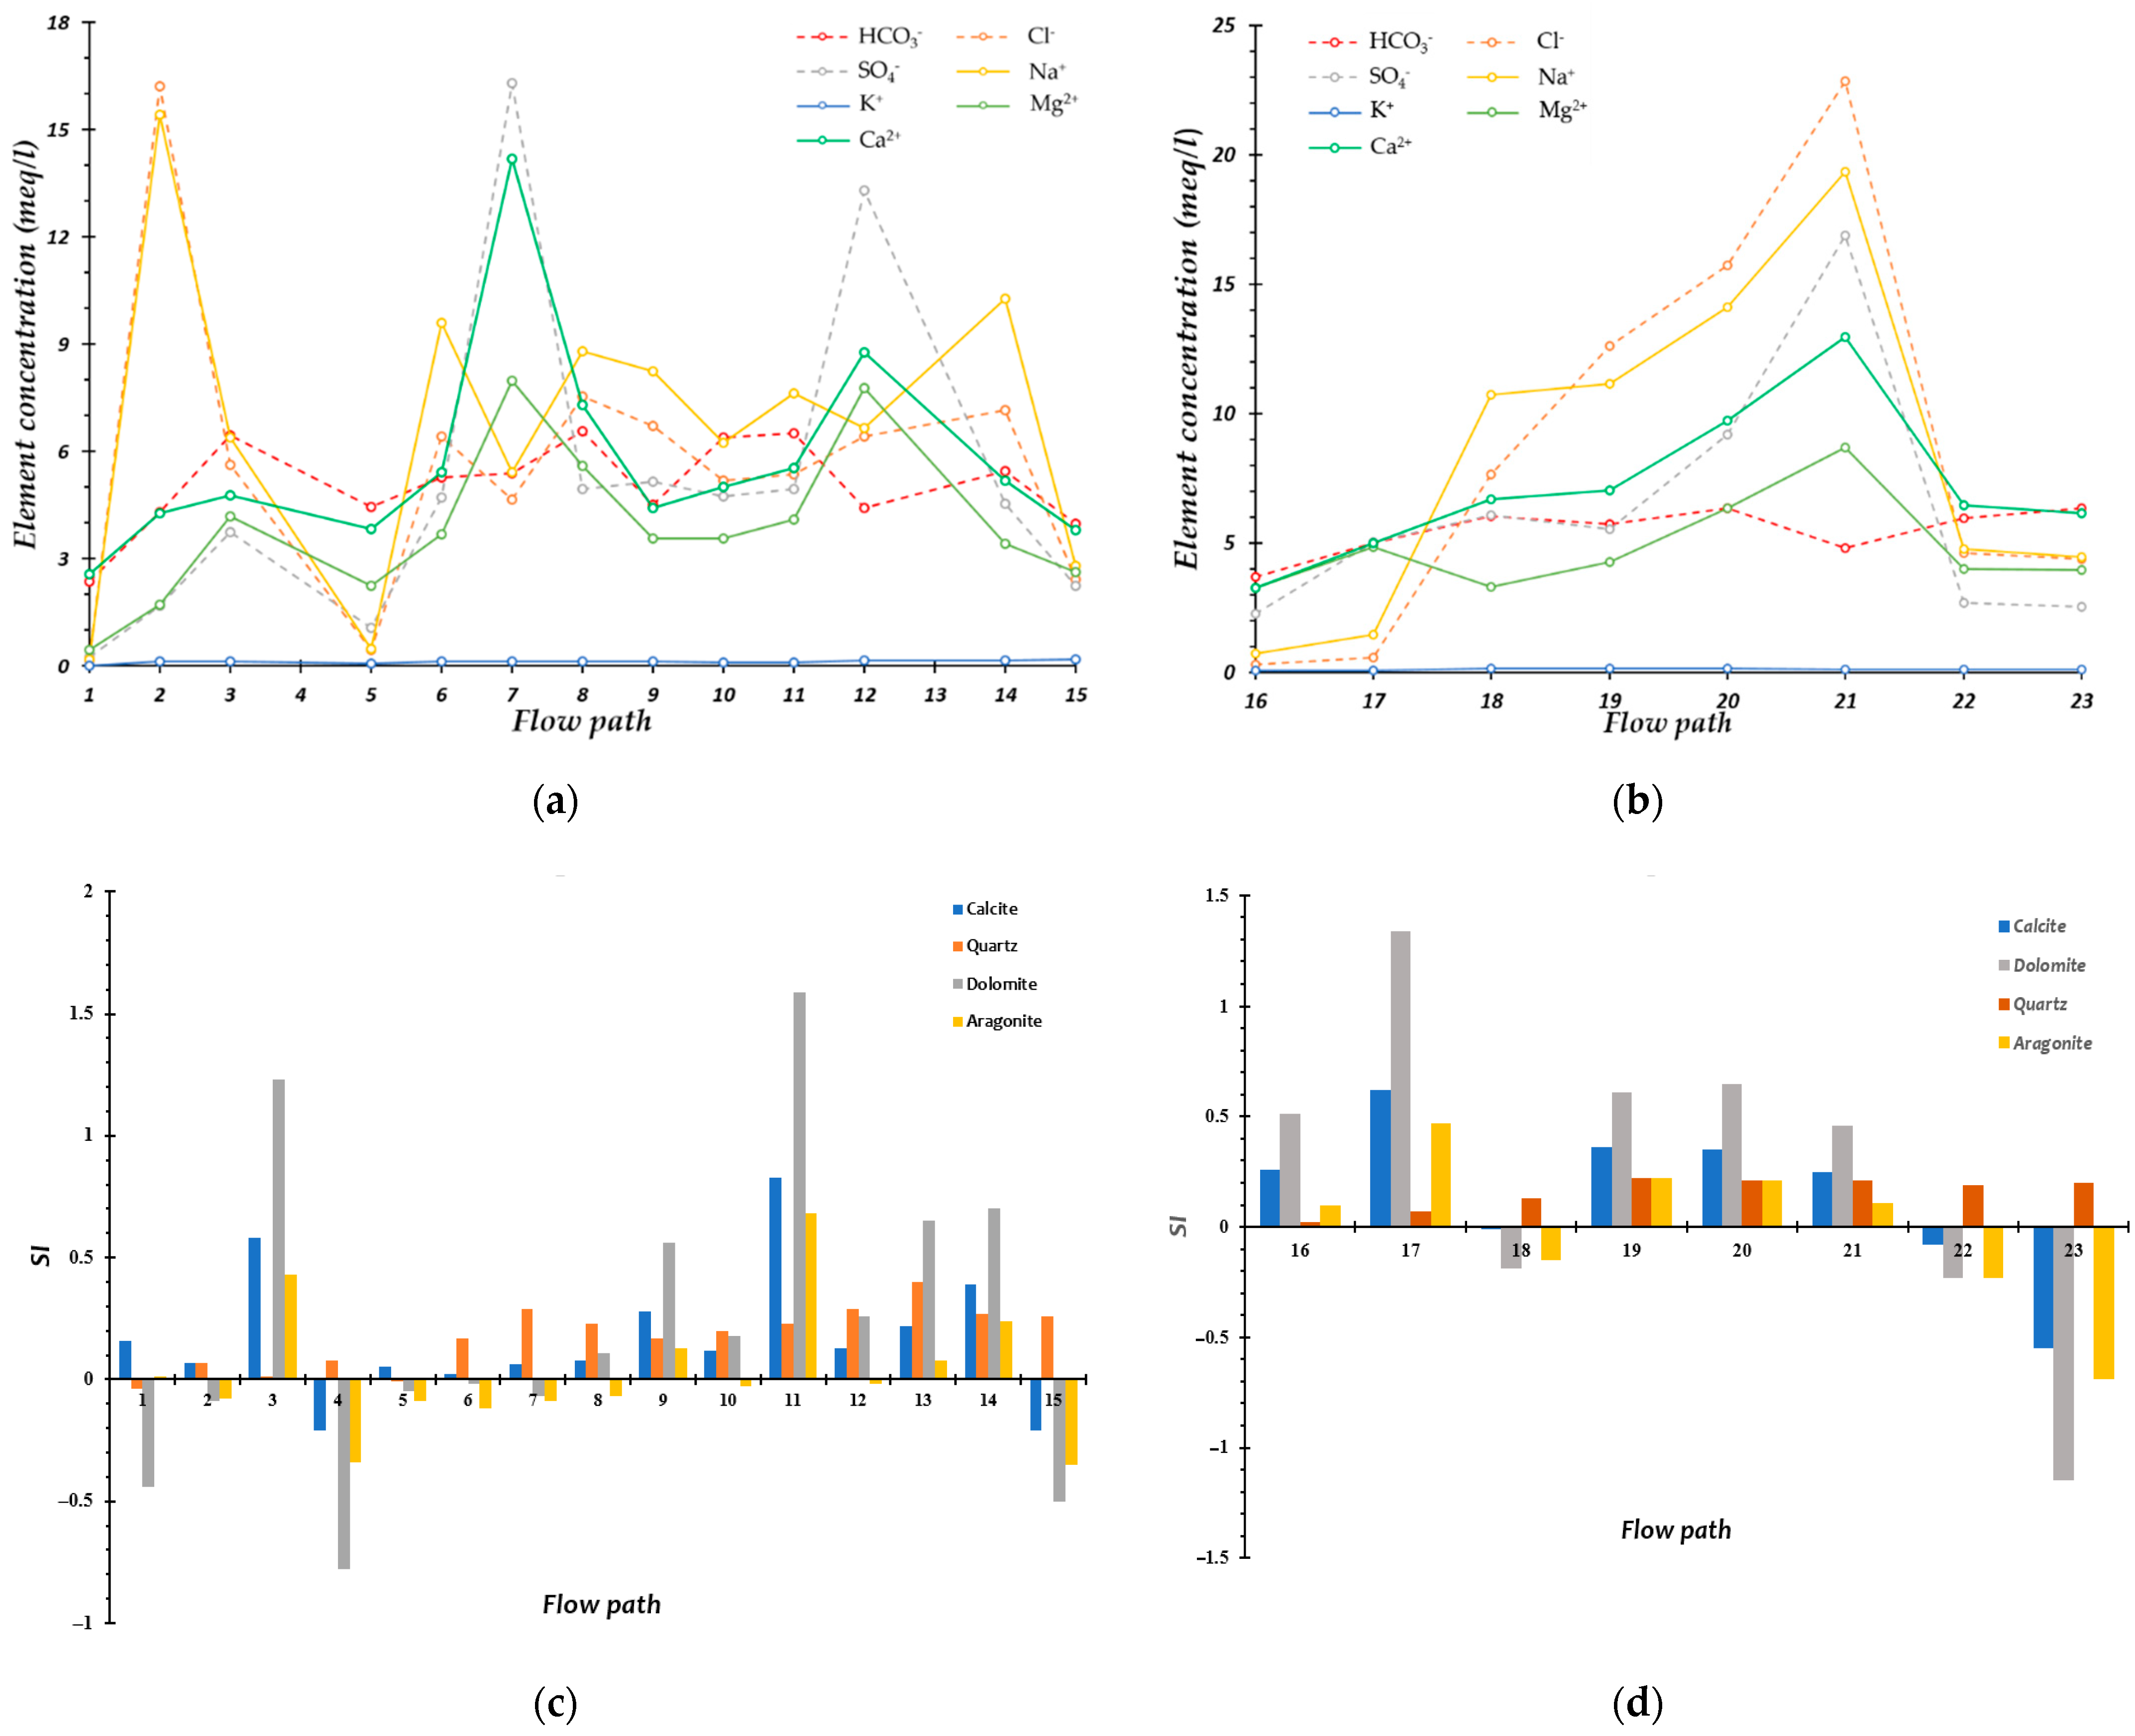
3.1.3. Saturation Index and Mineral Dissolution

Groundwater hydrochemistry is controlled by various processes, such as groundwater flow, recharge and discharge processes, and water–rock reactions. Along the groundwater flow direction, the hydrochemistry is always affected by mineral weathering over a long residence time [42]. However, from the recharge area to the discharge area along the flow path, decreasing tritium values and increasing concentrations of chloride ions and electric conductivity are expected due to exchange reactions, precipitations, solubility and mixing water, although real data may vary [43,44]. The saturation index (SI) of a mineral can be estimated by the following equation:
SI = log(KIAP/KSP)
where KIAP is the ionic activity product for a mineral equilibrium reaction, and KSP is the solubility product of the mineral.
We used the PHREEQC software to calculate the SI values of minerals in groundwater. Indeed, water is unsaturated, and the mineral is be continuously altered by the groundwater if its index is lower than −0.1. On the other hand, if the saturation index is higher than 0.1, the water is saturated, and the mineral precipitates. At equilibrium, the saturation index is close to 0, and the mineral phase remains in equilibrium. The saturation indices of some minerals were calculated (Table 2).
The saturation index values of calcite and dolomite minerals of the collected samples vary; some of the samples have values higher than 0, whereas samples from other parts had values lower than 0 (Table 2), suggesting that the carbonate minerals progressively change from unsaturated to oversaturated conditions.
However, the saturation index of halite and gypsum for the sampled waters was lower than 0 (Table 3) and positively correlated with electrical conductivity (Figure 6a), indicating that those minerals are continuously dissolving in the groundwater. Saturation of gypsum is rarely reached under natural conditions; saturation only occurs in highly evaporated solutions (sample 4) due to the high dissolution rate of gypsum.
Although all samples are close to equilibrium with quartz (Figure 6c), the Cretaceous Basin aquifers have high saturation index values of 0.2 < SIQuartz < 0.4, revealing the influence of Senonian and Quaternary saline sediments (samples 7, 8, 12, 13 and 14).
The dissolution of gypsum by the addition of Ca2+ to the solution increases the saturation of calcite according to:
CaSO4→Ca2+ + SO42−
This explains the correlation observed between SIcalcite and SIgypsum, (Figure 6d). The increase in Ca2+ concentrations due to gypsum dissolution leads to calcite precipitation, and gypsum dissolution induces the transformation of dolomite to calcite and produces waters with high Mg2+, Ca2+ and SO42− concentrations (Figure 7a,b).The increase in Ca2+ concentration due to the dissolution of gypsum causes the precipitation of calcite and a decrease in CO32− concentration during the precipitation of calcite [45], which explains the increase in the saturation index of calcite from the Errachidia region to Meski (samples 6 to 15 Figure 8). This causes the dissolution of dolomite and thus an increase in the concentration of Mg2+ according to:
Ca2+ + CaMg (CO3)2→2CaCO3 + Mg2+
The geochemical evolution during the flow paths from the High Atlas to the Cretaceous basin is generally guided by the geological nature of each aquifer, this explains the geochemical changes in groundwater (Figure 7b) and the decrease in major element concentrations in samples 22 and 23 of the Infracenomanian aquifer due to the deep origin, as well as the long residence time of these waters.
The interpretation of the saturation indices of the main minerals of the waters of different aquifers highlighted three main reactions that characterize their chemical evolution from the recharge area (High Atlas) to the discharge area (Cretaceous basin). The evolution is characterized by a high dissolution of chlorides, including halite (NaCl), gypsum (CaSO42H2O) and anhydrite (CaSO4), and dedolomitization along the flow paths of the groundwater. This natural phenomenon is related to aquifers containing limestones and dolomites in combination with gypsiferous layers [35].

3.2. Environmental Isotopes

The groundwater samples seem to be grouped around an average value (δ18O‰ = −7.75 and δ2H‰ = −51.6%), showing a variable isotopic composition from one aquifer to another.

3.2.1. Isotopic Characterization

In order to highlight the recharge of the different aquifers and the possible evaporation phenomena, the stable isotope contents of the 23 points sampled in the different aquifers in the study area were plotted in a δ²H vs δ18O diagram (Figure 8), which can be expressed by the following equations.
-
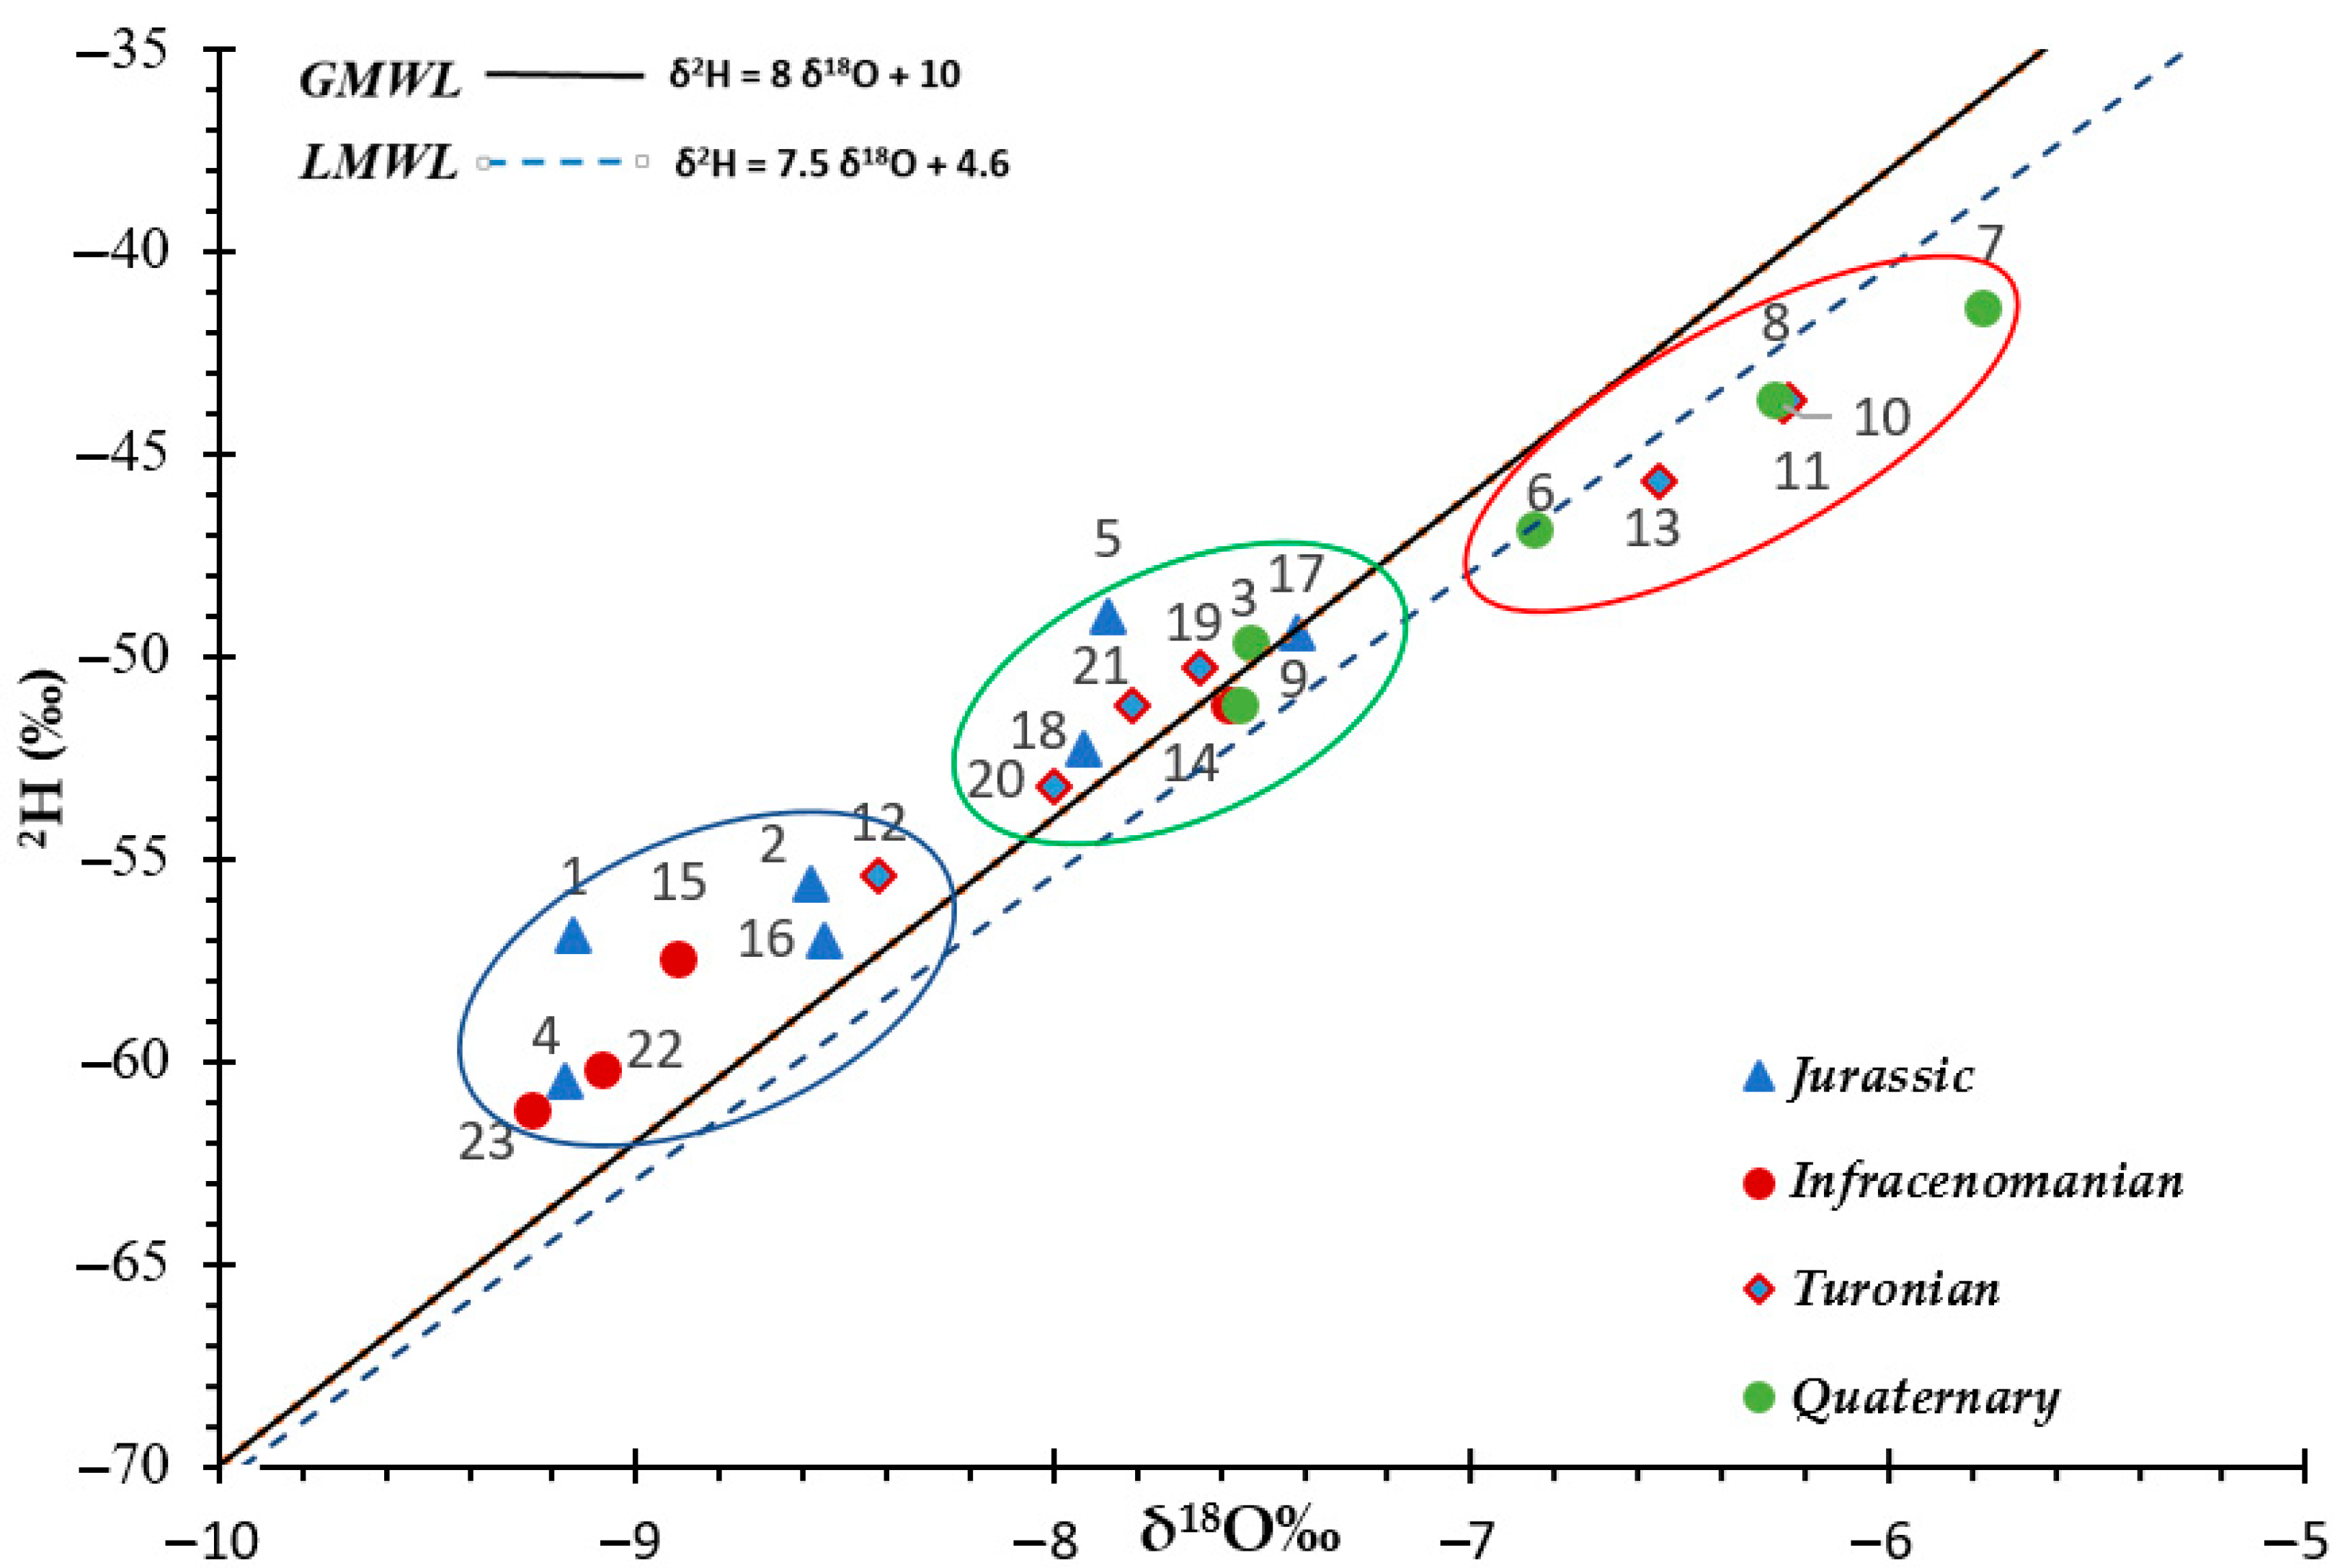
Equation of the global meteorological water line [30]:
δ²H = 8 δ 18O + 10
-
Equation of the local meteorological water line of the study area [31]:
δ²H = 7.5 δ 18O + 4.6
From the spatial distribution of δ18O concentrations, we distinguish some spatial organization of information:
-
A cluster of water samples (Group 1: blue) is located above the global and local meteoric lines. This group is depleted in 18O, with 2H contents between −61.2‰ and −55.6‰. The isotopic concentrations of this group (1, 2, 4, 12, 15, 16, 22, 23) are close to the average values of the High Atlas rainwater [31]. The values are characteristic of a protected aquifer free of any contribution from other aquifers. The waters are derived from an air mass that has not undergone any evaporative phenomena. Group 1, the isotopic signature of which is above the meteoric water line, contains water samples 1 and 16, with tritium activity values equal to 2.86 and 3.15, respectively, indicating a contribution of meteoric water to the recharge. The contribution of the recent waters to the recharge of the other points, although located on the right side of the meteoric waters, cannot be concluded because these waters contain very little or no tritium (0.05 TU, 0 TU, 0.91 TU, 0 TU, 0 TU and 1.13 TU).
-
A second or intermediate group (group 2: green) consists of samples 3, 5, 9, 14, 17, 18, 19, 20 and 21. This group is more enriched by heavy isotopes relative to group 1 and more depleted compared to group 3. The majority of the points in this group are located on the right side of the meteoric waters, showing a current recharge for samples 3 and 14, with tritium values equal to 2.62 and 3.40 TU, respectively. Points 9, 17, 20 and 21, with tritium contents equal to 0.47, 0.82, 0 and 0 TU, respectively, indicate a past recharge. Other samples (5, 18 and 19), with tritium values equal to 1.36, 1.54 and 1.79 TU, respectively, are probably the result of water mixing.
-
A third group (group 3: red) consists of water points 7, 8, 10, 11, 13 and 6, located squarely in the Cretaceous Errachidia basin. This group is enriched in heavy isotopes compared to group 2. Oxygen 18 values range from −6.85‰ to −5.77‰. These points are located below the meteoric water line are indicative of relatively recent water that underwent evaporative phenomena during a rain event that contributed to the recharge after their entry into the system. Their corresponding tritium values vary from 1.48 TU to 3.61 TU (Table 3).
The stable isotopes of water (deuterium and oxygen 18) are relatively invariant over time and are therefore well suited for the study the complexities of the groundwater hydrology of a region.

3.2.2. Estimation of Recharge Area

The isotopic gradient was determined from the relationship between δ18O (‰) and the estimated average elevation of the recharge area of four stations in the study area (Figure 9), which was established by El Ouali in 2022 [31]. δ18O (‰) ratios are related to the elevation of the recharge area and can be expressed by the following equation:
y = −0.0026 × − 1.67
We projected all samples to estimate the elevation of their recharge area. From the projections of the samples on the isotopic gradient line, we found that the recharge area of most of the Cretaceous basin aquifers is fed from an elevation zone that is higher than 1400 m. This zone corresponds to the outcrop area of the High Atlas mountains.
Groundwater undergoing evaporation is positively correlated with δ18O and conductivity. In the diagram of δ18O vs. conductivity (Figure 10a), a positive correlation was obtained; moreover, in most of the samples, an increase in electrical conductivity (EC) values during the flow from the High Atlas to the discharge zone takes place with a change in isotopic composition, which may be due to the mineralization. The analysis of our samples shows an enrichment of the heavier isotopes with a remarkable increase in EC. This confirms that some of the groundwater seems to be fed by evaporated water (enriched in isotopes) at the surface, in the unsaturated zone or by river water.
The content of groundwater is positively correlated with the relationship between δ18O and NO3 concentration. Figure 10b shows that except for a few samples, groundwater with low nitrate content is generally associated with water with a high δ18O concentration. This indicates anaerobic conditions at deeper levels in the subsurface [46]. Groundwater was also found to be associated with a high δ18O value; this demonstrates that some points are fed by significant amounts of evaporated rainwater (enriched in 18O) seeping with nitrate salts from the soil into the groundwater systems.

4. Geological Validation

Our geological study focused on the Cretaceous basin formations and those of the High Atlas separated by the South Atlas thrust. This thrust is constituted by a succession of faults generally oriented in a WSW-ENE direction. These faults put the permeable formations located on both sides of this structural limit in direct contact, as is the case in our studied geological sections, which leads to the passage of water from the High Atlas to the Cretaceous basin aquifers. The main areas of possible water flow are located in the east of the city of Errcahidia at the Jbel Hamdoun overlapping area (cross section AB, Figure 11a,b).

5. Conclusions

Hydrogeochemical and environmental isotope studies were carried out to evaluate the recharge mechanism from High Atlas limestones to the Errachidia Cretaceous basin and the geochemical processes during the flow paths. The composition of groundwater is modified by the dissolution of minerals in water depending on the geology and the nature of each aquifer. Hydrochemistry shows that most of the waters in the limestone aquifer of the Jurassic High Atlas are of the Mg-Ca-HCO3-SO4 type. These waters evolve into relatively complex water types in the Cretaceous basin aquifers. The main geothermal systems are dominated by deep groundwater circulation and characterized by the Na-Cl water type. The dominant hydrochemical process is water–rock interaction. Some water samples in the Cretaceous basin are influenced by both evaporation and water–rock interaction, indicating a mixture of precipitation and deep waters. The saturation indices of the main minerals of the waters of different aquifers highlight three main reactions that characterize their chemical evolution from the recharge area (high Atlas) to the discharge area (Cretaceous basin). The evolution is characterized by high dissolution of chlorides, including halite (NaCl), gypsum (CaSO4-2H2O) and anhydrite (CaSO4), and dedolomitization along the flow paths of the groundwater. In fact, isotope composition of δ18O and δ2H of several samples from the Cretaceous aquifers shows isotopic similarities with those of the Jurassic High Atlas limestones, as confirmed by the δ18O vs. altitude plot, which shows that these waters are recharged at higher altitudes than their emergence corresponding to the High Atlas elevations. In this study, we focused on the transfer of knowledge and skills according to scientific logic with different approaches, which allowed us not only to demonstrate the mechanisms of recharge of Cretaceous aquifers and provide information for the evaluation of groundwater potential but also to contribute to the socioeconomic development of the region by promoting the activities of the population and encouraging investors to invest in the region. Groundwater is undoubtedly important for water supply and eco-environmental protection, especially in arid and semi-arid regions. Therefore, adequate management of water resources in the region is strongly recommended, especially with the scarcity of water resources and the succession of drought periods in recent years in this region. Detailed investigations and studies of this nature are required to identify the important geochemical processes affecting water quality, as well as the protection of recharge areas.

Author Contributions

Conceptualization, A.R., A.E.O. (Anas El Ouali), A.B. and A.E.O. (Abdelhadi El Ouali); data curation, A.R.; formal analysis, A.R., A.E.O. (Anas El Ouali) and A.E.O. (Abdelhadi El Ouali); funding acquisition, A.R.; investigation, A.R. and A.E.O. (Anas El Ouali); methodology, A.R., A.E.O. (Anas El Ouali), A.B., Y.M. and A.E.O. (Abdelhadi El Ouali); project administration, A.L., A.E., A.E.H. and A.E.O. (Abdelhadi El Ouali); resources, A.L., A.E. and A.E.O. (Abdelhadi El Ouali); software, A.R., A.B. and Y.M.; supervision, A.E.O. (Abdelhadi El Ouali); validation, A.R., A.L. and A.E.O. (Abdelhadi El Ouali); visualization, A.R., A.E. and A.E.O. (Abdelhadi El Ouali); writing—original draft, A.R. and A.E.O. (Anas El Ouali); writing—review and editing, A.E.O. (Anas El Ouali), A.B., J.M., Y.M., A.E.H. and A.E.O. (Abdelhadi El Ouali). All authors have read and agreed to the published version of the manuscript.

Funding

This research received no external funding.

Data Availability Statement

Not applicable.

Acknowledgments

The authors thank all those who contributed to this work and would like to thank the CNESTEN for performing isotope analyses.

Conflicts of Interest

The authors declare no conflict of interest.

References

  1. Andreo, B.; Vías, J.; Durán, J.J.; Jiménez, P.; López-Geta, J.A.; Carrasco, F. Methodology for groundwater recharge assessment in carbonate aquifers: Application to pilot sites in southern Spain. Appl. Hydrogeol. 2008, 16, 911–925. [Google Scholar] [CrossRef]
  2. Bakalowicz, M. Contribution de la Géochimie des eaux à la Connaissance de L’aquifère Karstique de la Karutification. Doctoral Dissertation, Universite Pierre et Marie Curie, Paris, France, 1979. [Google Scholar]
  3. Fiorillo, F.; Petitta, M.; Preziosi, E.; Rusi, S.; Esposito, L.; Tallini, M. Long-term trend and fluctuations of karst spring discharge in a Mediterranean area (central-southern Italy). Environ. Earth Sci. 2015, 74, 153–172. [Google Scholar] [CrossRef]
  4. Hartmann, A.; Mudarra, M.; Andreo, B.; Marín, A.; Wagener, T.; Lange, J. Modeling spatiotemporal impacts of hy-droclimatic extremes on groundwater recharge at a Mediterranean karst aquifer. Water Resour. Res. 2014, 50, 6507–6521. [Google Scholar] [CrossRef]
  5. Lauber, U.; Goldscheider, N. Use of artificial and natural tracers to assess groundwater transit-time distribution and flow systems in a high-alpine karst system (Wetterstein Mountains, Germany). Appl. Hydrogeol. 2014, 22, 1807–1824. [Google Scholar] [CrossRef]
  6. Vörösmarty, C.J.; Green, P.; Salisbury, J.; Lammers, R.B. Global Water Resources: Vulnerability from Climate Change and Population Growth. Science 2000, 289, 284–288. [Google Scholar] [CrossRef] [Green Version]
  7. El Ouali, A.; El Ouali, A.; Mudry, J.; Mania, J.; Chauve, P.; Elyamine, N.; Marzouk, M. Present recharge of an aquifer in a semi-arid region: An example from the Turonian limestones of the Errachidia basin, Morocco. Environ. Geol. 1999, 38, 171–176. [Google Scholar] [CrossRef]
  8. El Ouali, A.; El Hafyani, M.; Roubil, A.; Lahrach, A.; Essahlaoui, A.; Hamid, F.E.; Muzirafuti, A.; Paraforos, D.S.; Lanza, S.; Randazzo, G. Modeling and Spatiotemporal Mapping of Water Quality through Remote Sensing Techniques: A Case Study of the Hassan Addakhil Dam. Appl. Sci. 2021, 11, 9297. [Google Scholar] [CrossRef]
  9. Louvat, D.; Bichara, S. Etude de plusieurs systèmes aquifères du Maroc, à l’aide des isotopes du milieu. Eau Dev. 1991, 11, 69–77. [Google Scholar]
  10. Michelot, J.L.; Sinan, M.; Krimissa, M.; Bichara, S.; Louvat, D. Hydrologie Isotopique des Systèmes Aquifères de Fès-Meknès, Errachidia et Kheng El Hamam. Rap; AIEA MOR/008/4: Vienne, Austria, 1992. [Google Scholar]
  11. Fontes, J.; Coque, R.; Dever, L.; Filly, A.; Mamou, A. Paleohydrologie isotopique de l’Oued el Akarit (sud tunisie) au Pleistocene superieur et a l’Holocene. Palaeogeogr. Palaeoclim. Palaeoecol. 1983, 43, 41–62. [Google Scholar] [CrossRef]
  12. Barnes, C.; Allison, G. Tracing of water movement in the unsaturated zone using stable isotopes of hydrogen and oxygen. J. Hydrol. 1988, 100, 143–176. [Google Scholar] [CrossRef]
  13. Aquilina, L.; Ladouche, B.; Dörfliger, N. Recharge processes in karstic systems investigated through the correlation of chemical and isotopic composition of rain and spring-waters. Appl. Geochem. 2005, 20, 2189–2206. [Google Scholar] [CrossRef]
  14. Banner, J.L.; Kaufman, J. The isotopic record of ocean chemistry and diagenesis preserved in non-luminescent brachiopods from Mississippian carbonate rocks, Illinois and Missouri. GSA Bull. 1994, 106, 1074–1082. [Google Scholar] [CrossRef]
  15. Barbieri, M.; Boschetti, T.; Petitta, M.; Tallini, M. Stable isotope (2H, 18O and 87Sr/86Sr) and hydrochemistry mon-itoring for groundwater hydrodynamics analysis in a karst aquifer (Gran Sasso, Central Italy). Appl. Geochem. 2005, 20, 2063–2081. [Google Scholar] [CrossRef]
  16. Han, G.; Liu, C.-Q. Water geochemistry controlled by carbonate dissolution: A study of the river waters draining karst-dominated terrain, Guizhou Province, China. Chem. Geol. 2004, 204, 1–21. [Google Scholar] [CrossRef]
  17. Katz, B.G.; Bullen, T.D. The combined use of 87Sr/86Sr and carbon and water isotopes to study the hydrochemical interaction between groundwater and lakewater in mantled karst. Geochim. Cosmochim. Acta 1996, 60, 5075–5087. [Google Scholar] [CrossRef]
  18. Thomas, J.; Rose, T. Environmental isotopes in hydrogeology. Environ. Earth Sci. 2003, 43, 532. [Google Scholar] [CrossRef]
  19. Pu, T.; He, Y.; Zhu, G.; Zhang, N.; Du, J.; Wang, C. Characteristics of water stable isotopes and hydrograph separa-tion in Baishui catchment during the wet season in Mt. Yulong region, south western China. Hydrol. Process. 2013, 27, 3641–3648. [Google Scholar] [CrossRef]
  20. Wang, X.-F.; Yakir, D. Using stable isotopes of water in evapotranspiration studies. Hydrol. Process. 2000, 14, 1407–1421. [Google Scholar] [CrossRef]
  21. Chandrajith, R.; Padmasiri, J.P.; Dissanayake, C.B.; Prematilaka, K.M. Spatial distribution of fluoride in ground-water of Sri Lanka. J. Natl. Sci. Found. Sri Lanka 2012, 40, 4. [Google Scholar]
  22. Döll, P.; Hoffmann-Dobrev, H.; Portmann, F.; Siebert, S.; Eicker, A.; Rodell, M.; Strassberg, G.; Scanlon, B. Impact of water withdrawals from groundwater and surface water on continental water storage variations. J. Geodyn. 2012, 59, 143–156. [Google Scholar] [CrossRef]
  23. Mohammadi, Z.; Vaselli, O.; Muchez, P.; Claes, H.; Capezzuoli, E.; Swennen, R. Hydrogeochemistry, stable isotope composition and geothermometry of CO2-bearing hydrothermal springs from Western Iran: Evidence for their origin, evolution and spatio-temporal variations. Sediment. Geol. 2020, 404, 105676. [Google Scholar] [CrossRef]
  24. Vespasiano, G.; Marini, L.; Muto, F.; Auqué, L.F.; Cipriani, M.; De Rosa, R.; Critelli, S.; Gimeno, M.J.; Blasco, M.; Dotsika, E.; et al. Chemical, isotopic and geotectonic relations of the warm and cold waters of the Cotronei (Ponte Coniglio), Bruciarello and Repole thermal areas, (Calabria—Southern Italy). Geothermics 2021, 96, 102228. [Google Scholar] [CrossRef]
  25. Paternoster, M.; Liotta, M.; Favara, R. Stable isotope ratios in meteoric recharge and groundwater at Mt. Vulture volcano, southern Italy. J. Hydrol. 2007, 348, 87–97. [Google Scholar] [CrossRef]
  26. Merchán, D.; Auqué, L.F.; Acero, P.; Gimeno, M.J.; Causapé, J. Geochemical processes controlling water saliniza-tion in an irrigated basin in Spain: Identification of natural and anthropogenic influence. Sci. Total Environ. 2015, 502, 330–343. [Google Scholar] [CrossRef] [PubMed]
  27. Parihar, S.S.; Ajit, K.; Ajay, K.; Gupta, R.N.; Manoj, P.; Archana, S.; Pandey, A.C. Physico-chemical and Microbio-logical analysis of underground water in and around Gwalior city, MP, India. Res. J. Recent Sci. 2012, 1, 62–65. [Google Scholar]
  28. Jalali, M. Geochemistry characterization of groundwater in an agricultural area of Razan, Hamadan, Iran. Environ. Earth Sci. 2008, 56, 1479–1488. [Google Scholar] [CrossRef]
  29. Toumi, N.; Hussein, B.H.M.; Rafrafi, S.; El Kassas, N. Groundwater quality and hydrochemical properties of Al-Ula Region, Saudi Arabia. Environ. Monit. Assess. 2015, 187, 84. [Google Scholar] [CrossRef]
  30. Craig, H. Standard for Reporting Concentrations of Deuterium and Oxygen-18 in Natural Waters. Science 1961, 133, 1833–1834. [Google Scholar] [CrossRef]
  31. El Ouali, A.; Roubil, A.; Lahrach, A.; Mudry, J.; El Ghali, T.; Qurtobi, M.; El Hafyani, M.; Alitane, A.; El Hmaidi, A.; Essahlaoui, A.; et al. Isotopic Characterization of Rainwater for the Development of a Local Meteoric Water Line in an Arid Climate: The Case of the Wadi Ziz Watershed (South-Eastern Morocco). Water 2022, 14, 779. [Google Scholar] [CrossRef]
  32. Dubar, G. Notice explicative de la carte géologique provisoire du Haut-Atlas de Midelt au 1/200.000 e. Notes Mém. Serv. Géol. Maroc. 1943, 59, 60. [Google Scholar]
  33. Lyazidi, M.; Eyssautier, L.; Marcais, J.; Choubert, G.; Faillot, P. Carte géologique de Rich et Boudnib au 1/200,000. In Publiée Par Le Serv. Géologique Du Maroc; 1956. Available online: https://www.mem.gov.ma/Pages/secteur.aspx?e=8&prj=6 (accessed on 18 January 2022).
  34. Choubert, G.; Faure-Muret, A. Évolution du Domaine Atlasique Marocain Depuis les Temps Paléozoïques; Mémoire Hors-Série; Société Géologique de France: Paris, France, 1962; Volume 1, pp. 447–527. [Google Scholar]
  35. Parkhurst, D.L.; Appelo, C.A.J. User’s guide to PHREEQC (Version 2): A computer program for speciation, batch-reaction, one-dimensional transport, and inverse geochemical calculations. Water-Resour. Investig. Rep. 1999, 99, 312. [Google Scholar]
  36. Vervier, P.; Gibert, J.; Marmonier, P.; Dole-Olivier, M.J. A perspective on the permeability of the surface freshwa-ter-groundwater ecotone. J. N. Am. Benthol. Soc. 1992, 11, 93–102. [Google Scholar] [CrossRef]
  37. Fraser, B.G.; Williams, D.D. Seasonal boundary dynamics of a groundwater/surface-water ecotone. Ecology 1998, 79, 2019–2031. [Google Scholar]
  38. Weiss, R.F.; Lonsdale, P.; Lupton, J.E.; Bainbridge, A.E.; Craig, H. Hydrothermal plumes in the Galapagos Rift. Nature 1977, 267, 600–603. [Google Scholar] [CrossRef]
  39. Panichi, C. Isotopic Investigation in Geothermal Hydrology; Report of an Expert Mission (Project number ETH/8/003); International Atomic Energy Agency: Vienna, Austria, 1995. [Google Scholar]
  40. Ayenew, T. Environmental isotope-based integrated hydrogeological study of some Ethiopian rift lakes. J. Radioanal. Nucl. Chem. Artic. 2003, 257, 11–16. [Google Scholar] [CrossRef]
  41. Gibbs, R.J. Mechanisms Controlling World Water Chemistry. Science 1970, 170, 1088–1090. [Google Scholar] [CrossRef]
  42. Wen, X.H.; Wu, Y.Q.; Wu, J. Hydrochemical characteristics of groundwater in the Zhangye Basin, Northwestern China. Environ. Geol. 2008, 55, 1713–1724. [Google Scholar] [CrossRef]
  43. Zhu, C.; Anderson, G.M. Environmental Applications of Geochemical Modeling; Cambridge University Press: Cambridge, NY, USA, 2002; ISBN 978-0-521-80907-8. [Google Scholar]
  44. Tikhomirov, V.V. Hydrogeochemistry fundamentals and advances. In Groundwater Composition and Chemistry; John Wiley & Sons, Inc.: Hoboken, NJ, USA, 2016; Volume 1, ISBN 978-1-119-16039-7. [Google Scholar]
  45. Back, W.; Hanshaw, B.B.; Plummer, L.N.; Rahn, P.H.; Rightmire, C.T.; Rubin, M. Process and rate of dedolomiti-zation: Mass transfer and 14C dating in a regional carbonate aquifer. Geol. Soc. Am. Bull. 1983, 94, 1415–1429. [Google Scholar] [CrossRef]
  46. Datta, P.; Deb, D.; Tyagi, S. Assessment of groundwater contamination from fertilizers in the Delhi area based on 180, N03 and K+ composition. J. Contam. Hydrol. 1997, 27, 249–262. [Google Scholar] [CrossRef]
Figure 1. Geological map of the study area realized from the digitalization of the geological maps 1/200,000e of: “High Atlas of Midelt” [32] and “High Atlas North of Ksar Essouk and Boudenib” [33], hydrological network, samples location (white color), and hydrogeological sketch (October 2020).
Water 14 01747 g001
Figure 2. Simplified stratigraphic column of the study area compiling the lithology of the various formations and aquifer characteristics. Modified from [34].
Water 14 01747 g002
Figure 3. (a) Piper diagram and (b) SO4 vs. Cl + HCO3 (TIS) plot reporting the samples collected in the study area. In the TIS diagram, the isoionic salinity lines are drawn as reference.
Water 14 01747 g003
Figure 4. Giggenbach triangular diagram (Na-K-Mg).
Water 14 01747 g004
Figure 5. Gibbs diagrams for the concentration composition of major ions in the study area.
Water 14 01747 g005
Figure 6. Saturation indices (SI) of calcite, dolomite, quartz, halite and gypsum for the various groundwater samples. (a) SI of halite versus electrical conductivity; (b) SI of calcite versus SI of dolomite; (c) SI of dolomite versus SI of quartz; (d) SI of calcite versus SI of gypsum. Dol = dolomite, Cal = calcite, Qtz = quartz, Gyp = gypsum, EQU = equilibrium, Under-sat. = undersaturation and Over-sat = oversaturation.
Water 14 01747 g006
Figure 7. Plots showing the geochemical evolution during two flow paths (a,c) flow path A, b and d: flow path B, plots (a,b): the major ions evolution, plots (c,d) saturation index of calcite, dolomite, quartz and aragonite evolution.
Water 14 01747 g007
Figure 8. δ18O‰ vs. δ2H‰ plot of groundwater samples from the study area compared to GMWL [30] and LMWL [31].
Water 14 01747 g008
Figure 9. Plot of δ18O (‰) versus altitude.
Water 14 01747 g009
Figure 10. (a) Plot of δ18O vs. electrical conductivity. (b) Plot of δ18O vs. nitrate concentration.
Water 14 01747 g010
Figure 11. Northwest-southeast geological cross sections in the study area showing hydrogeological connections and geological structure between the high Atlas and Cretaceous basin with chemical composition (pie diagram) showing groundwater evolution along the flow path. (a) cross section AB; (b) cross section A’B’ (Figure 1).
Water 14 01747 g011aWater 14 01747 g011b
Table 1. Results of analysis of water samples in the study area with average uncertainties (W: wells; B: boreholes; HS: hot springs; S: cold springs) collected in October 2020.
CoordinatesPhysicochemical ParametersMajor Elements Concentration (mg/L)Trace Elements Concentration (mg/L)
NumberTypeSpring Flow (L/s)XYZT[°C]
(±0.36)
EC
(±3.8)
pH
(±0.28)
HCO3Cl
(±0.08)
NO3
(±0.17)
SO42−
(±0.13)
Na+
(±0.21)
K+
(±0.01)
Mg2+
(±0.05)
Ca2+
(±0.14)
SiO2
(±1.5)
Al
(±1.5)
As
(±0.01)
Cd
(±0.01)
Cu
(±0.15)
Ni
(±0.20)
Pb
(±0.06)
Zn
(±0.20)
1S398562,286206,027170814.72638.65145.25.58.7711.84.071.055.4751.34.1412.950.0090.0010.1610.2220.0842.817
2HS22594,643185,449129829.224007.34263.56576.29.0481.5354.45.0120.6985.78.155.210.0880.0000.1750.5740.0924.435
3W 595,581181,368126525.818657.66392.9200.121.05179.7147.04.9150.495.86.465.470.0280.0040.2861.2260.1385.734
4HS63597,382179,693125350.380006.34259.918024.181218261733.6376.05523.116.405.150.4050.0020.1600.6390.1024.005
5S46598,055171,910121521.15467.39272.116.318.4751.710.92.4826.9576.55.126.520.0030.0000.1471.3570.1426.259
6B 592,866151,072103722.320407.22322.13228.29.77227.1220.55.5844.42108.68.435.220.0490.0010.1930.7700.18825.77
7W 593,121145,432102820.230906.99329.45264.915.35782.7124.74.9695.87283.910.495.430.0410.0020.4980.4570.24362.38
8B 601,557143,888101220.518167.19400.23267.829.2237.7202.55.2267.181458.9814.830.0610.0150.3152.2050.19214.72
9W 602,661143,442100022.121907.81274.55238.557.83248.1189.74.5742.9488.58.1011.020.0980.0120.4131.5660.22625.77
10B 604,908142,231101122.218697.23390.46184.330.5228143.63.7242.92100.59.105.530.0410.0020.2510.7830.1276.16
11S56605,619140,84597719.719107.94396.57190.334.08238.2175.53.7749.33110.89.103.650.0400.0030.1450.5220.0794.47
12W 623,204125,85597319.825307.42269.66227.831.06638.11536.1393.17175.410.309.360.0780.0020.3121.0700.20220.78
13W 611,560131,57493620.236607.04575.93480.274.63956.871823.18230282.412.9114.880.1290.0040.5090.5220.33118.45
14W 613,536120,65491922.421007.6331.89253.63.19218.2236.56.5541.02103.710.706.180.0690.0010.1890.7310.1198.35
15W 612,776118,60891220.38217.26242.8285.712.44108.364.27.131.4476.09.506.910.0350.0000.1610.5740.11710.14
16S124502,246170,411218415.95827.96225.7410.418.65108.816.63.0638.9365.54.987.170.0080.0000.1560.9520.07824.80
17B 546,378164,1811419249227.89305.0520.416.7241.133.42.9758.2599.57.216.430.0140.0060.1881.2130.19721.75
18S213540,969146,09912122520007.08368.5271.89.86290.4246.26.1939.611338.408.190.0940.0080.2131.0570.18865.53
19S61539,629137,880115422.823907.58348.98447.310.87265.1256.46.351.041409.319.550.0940.0150.2211.5400.17675.97
20B 560,878131,346110625.229107.48385.58558.710.15440.6324.75.7175.98194.210.3013.450.1010.0081.1861.0440.250117.2
21S51575,543135,203105425.527907.27292.85810.87.44809.44454.83104.2259.410.406.820.0910.0050.1731.0050.11933.63
22B 529,750115,845106926.412446.85362.4163.48.26128.5109.24.2347.78129.110.103.780.0650.0030.2450.4310.1484.2
23B 540,630118,390103325.912276.43385.58155.87.7121.5102.14.6147.51123.210.407.590.0520.0060.3021.0700.12848.8
Table 2. Statistical data of saturation index of minerals in groundwater (Min: minimum, Max: maximum, SD: standard deviation).
Saturation Index of MineralsMinMaxAverageSD
Calcite−0.550.830.160.30
Dolomite−1.151.590.230.66
Gypsum−2.53−0.4−1.240.48
Kaolinite6.8510.328.350.94
Quartz−0.040.40.170.11
Halite−9.18−4.13−6.251.18
Illite5.349.276.670.99
K-feldspar0.793.261.580.57
Albite−0.962.360.640.78
Montmorillonite5.649.927.431.11
Gibbsite2.964.363.600.40
Table 3. Isotopic data of sampled waters with the average uncertainties (isotopic analyses relative to SMOW).
NumberAquiferLocationδ2H‰
(±1.6‰)
δ18O‰
(±0.2‰)
3H (Tu) Bq/L
1JurassicSidi Hamza−56.9−9.152.86 ± 0.33
2JurassicMy Hachem−55.6−8.580.05 ± 0.2
3QuaternaryAit Walil−49.7−7.532.62 ± 0.29
4JurassicMy Ali Cherif−60.5−9.170 ± 0.20
5JurassicTamrakcht−49−7.871.36 ± 0.23
6QuaternaryErrachidia−46.9−6.852.4 ± 0.33
7QuaternaryQsar serghin−41.4−5.772.09 ± 0.23
8QuaternaryTaznakt−43.7−6.273.49 ± 0.31
9QuaternaryTaznakt−51.2−7.550.47 ± 0.23
10TuronianMeski−43.8−6.253.61 ± 0.31
11TuronianMeski−43.7−6.241.48 ± 0.3
12TuronianAoufous−55.4−8.420.91 ± 0.24
13QuaternaryOuled Chaker−45.7−6.552.09 ± 0.29
14InfracenomanianZriguat−51.2−7.583.4 ± 0.34
15InfracenomanianZriguat−57.5−8.90 ± 0.31
16JurassicOuterbate−57−8.553.15 ± 0.36
17JurassicMkhoum−49.4−7.420.82 ± 0.3
18JurassicTahmdount−52.3−7.931.54 ± 0.3
19TuronianMouy−50.3−7.651.79 ± 0.24
20TuronianTarda−53.2−80 ± 0.26
21TuronianTarda−51.2−7.810 ± 0.27
22InfracenomanianGoulmima−60.2−9.080 ± 0.22
23InfracenomanianGoulmima−61.2−9.251.13 ± 0.28
Publisher’s Note: MDPI stays neutral with regard to jurisdictional claims in published maps and institutional affiliations.

