Article

Integration of Electrical Resistivity and Modified DRASTIC Model to Assess Groundwater Vulnerability in the Surrounding Area of Hulene-B Waste Dump, Maputo, Mozambique

by
Bernardino Bernardo
1,2,
Carla Candeias
1 and
Fernando Rocha
1,*
1
GeoBioTec Research Centre, Department of Geosciences, University of Aveiro, 3810-193 Aveiro, Portugal
2
Faculty of Earth Sciences and Environment, Pedagogic University of Maputo, Av. do Trabalho, Maputo 2482, Mozambique
*
Author to whom correspondence should be addressed.
Water 2022, 14(11), 1746; https://doi.org/10.3390/w14111746
Submission received: 24 April 2022 / Revised: 17 May 2022 / Accepted: 26 May 2022 / Published: 29 May 2022

Abstract

:
In this study, electrical resistivity was applied in six 400 m profiles around the Hulene-B waste dump (Mozambique). Afterwards, an inversion was performed by RES2Dinv. The use of the electrical resistivity method allowed us to characterize in detail some underlying aspects of the DRASTIC index by identifying anomalous zones considered to be permeable and prone to leachate migration. The modified DRASTIC index revealed high values in areas near contaminated surface groundwater and surface layers of the vadose zone, characterized by low resistivities. Areas with lower index results were characterized by high resistivity on surface layers and high depth at which groundwater was detected. The overall modified DRASTIC index result revealed medium vulnerability. However, high vulnerability index values were detected in areas with higher surface elevation, suggesting groundwater contamination by horizontal dilution of leachates from the surrounding area of the Hulene-B waste dump.

1. Introduction

Urban areas are characterized by excessive production of solid waste [1], which is often deposited in areas not prepared for disposal or treatment, thus posing a risk of environmental contamination [2]. Soils and groundwater are described as extremely vulnerable to pollution [3]. The concept of groundwater vulnerability was first described in the early 1960s, aiming to identify areas prone to contamination [4]. Groundwater vulnerability depends not only on its flow system properties but also on contaminant sources’ proximity, and contaminant characteristics, among other factors. These can promote potential contaminants to reach groundwater resources [5]. In urban areas, one of the main groundwater contamination sources is leachates, resulting from the decomposition of solid urban waste deposited without treatment in unplanned locations [6].
Several non-invasive models have been developed to assess groundwater vulnerability, of which geophysics, in particular electrical resistivity, and the DRASTIC hydrogeological model are pointed as the most relevant [7]. The electrical resistivity method has been used for locating hazardous waste in depth, and to identify different sources of contamination in subsurface environments [8,9]. Has been widely used to detect areas with heavy metal contamination plumes [10], groundwater [7] and lithological variations [11].
The DRASTIC model was defined by Aller, [12]. Seven hydrogeological parameters are included, being acronyms of the term “DRASTIC”, Depth of water table, net area Recharge, Aquifer media, Soil media, Topography vadose zone impact, and hydraulic Conductivity. This model has been applied to assess groundwater vulnerability in relatively large urban areas (>40 ha) [13,14]. Shah et al. [15], Arowoogun et al. [16], Dhakate et al. [17] and George [18] showed its effectiveness when combined with electrical resistivity to study contamination plumes migration, with different sources (e.g., dumps, mines, cemeteries) and estimate groundwater vulnerability.
Voudouris’s [14] recent study on the application of the DRASTIC model to assess groundwater vulnerability suggested the use of the DRASTIC method in areas >40 ha, combined with GIS. Shah et al. [15] applied the DRASTIC model and electrical conductivity to evaluate groundwater vulnerability in Pakistan, revealing lithology significance on different resistivity and contamination flow. Other studies by George [18] demonstrated that groundwater vulnerability analysis, using a combination of electrical resistivity and DRASTIC, was successfully achieved. Islami et al. [19] successfully combined resistivity and DRASTIC methods around the Pekanbaru dumpsite in Pekanbaru, Indonesia. Additionally, the original DRASTIC model was extensively modified to enhance groundwater vulnerability studies around landfills and dumpsites, e.g., El Naqa [20]; Vosoogh et al. [21]; Santhosh et al. [22]; Mohammadi et al. [23]. The modified DRASTIC model allows the incorporation of other variables that influence groundwater vulnerability [22]. Vosoogoh et al. [21] applied the modified DRASTIC (land use “L” effect) model to study older and recent landfills in Iran. The same method was used to study groundwater vulnerability around a landfill in Nigeria [24]. However, there are few studies that applied electrical resistivity and modified DRASTIC methods in smaller areas without using the layer interpolation method (DRASTIC factors), which is often pointed to create greater spatial bias, being the less obvious choice of specific areas for structural intervention [24].
Previous studies on groundwater in Mozambique, particularly in Maputo city, considered it vulnerable to contamination due to the hydrogeological context characterized by its shallow level and high urban growth without adequate planning and sanitation systems [25,26]. Hulene-B, the largest open-air dump in Mozambique (~17 ha) and its influence on soil and groundwater contamination due to horizontal and vertical leachate migration has been studied [27,28]. This study aims to integrate electrical resistivity and the modified DRASTIC model to identify anomalous leachate migration and to estimate groundwater vulnerability in the surrounding area of the Hulene-B waste dump, Maputo, Mozambique.

2. Materials and Methods
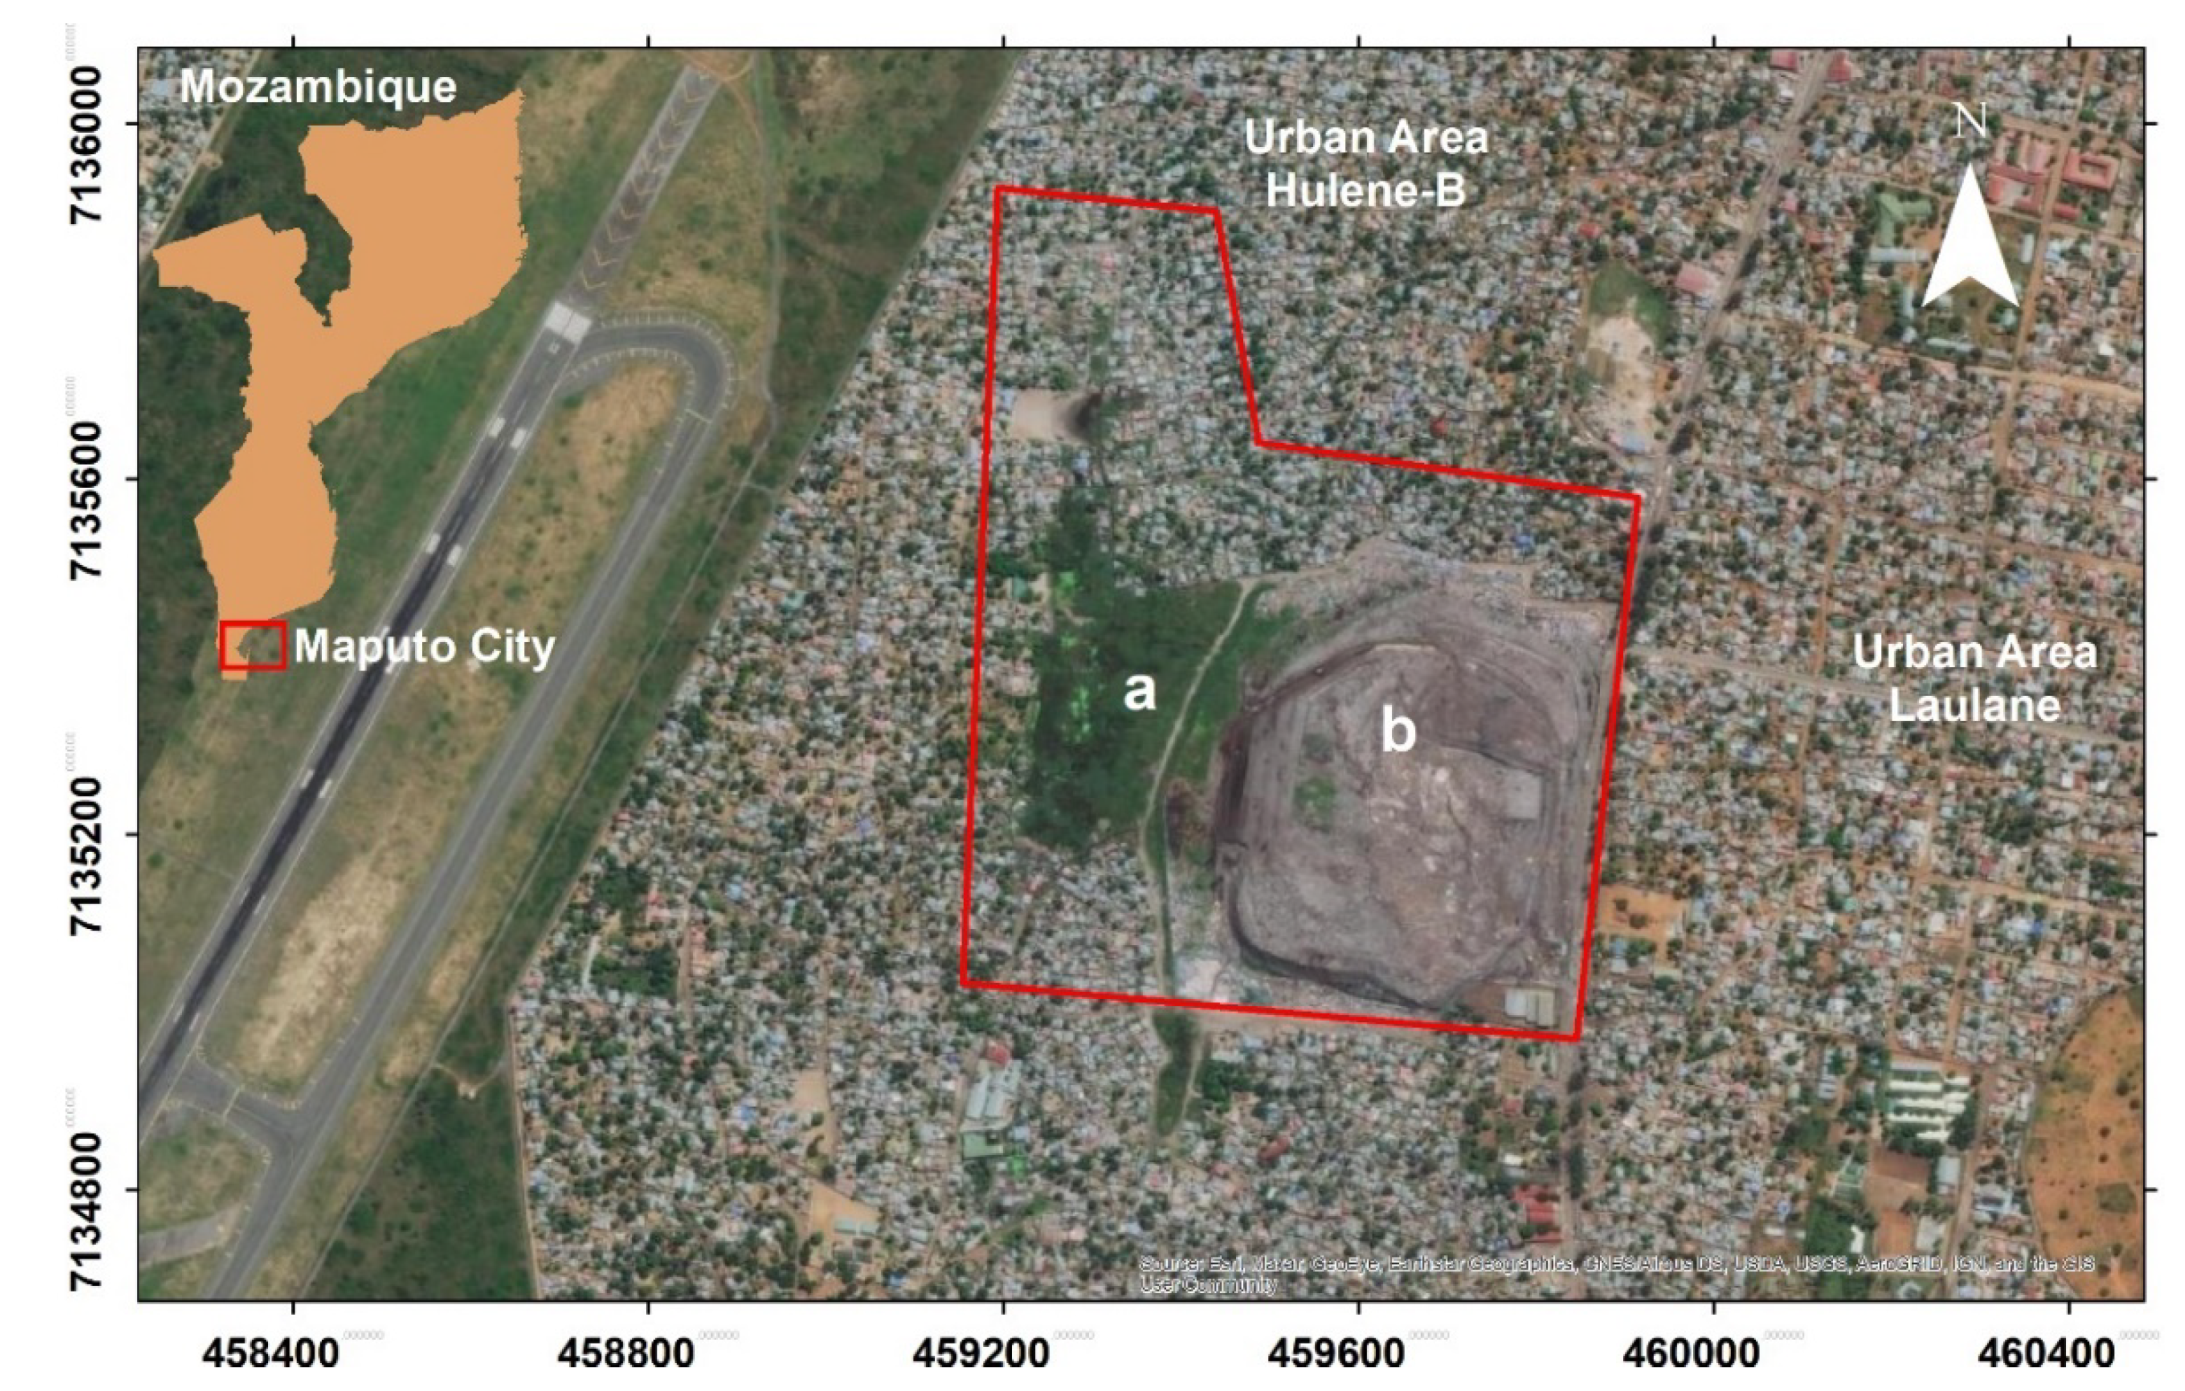
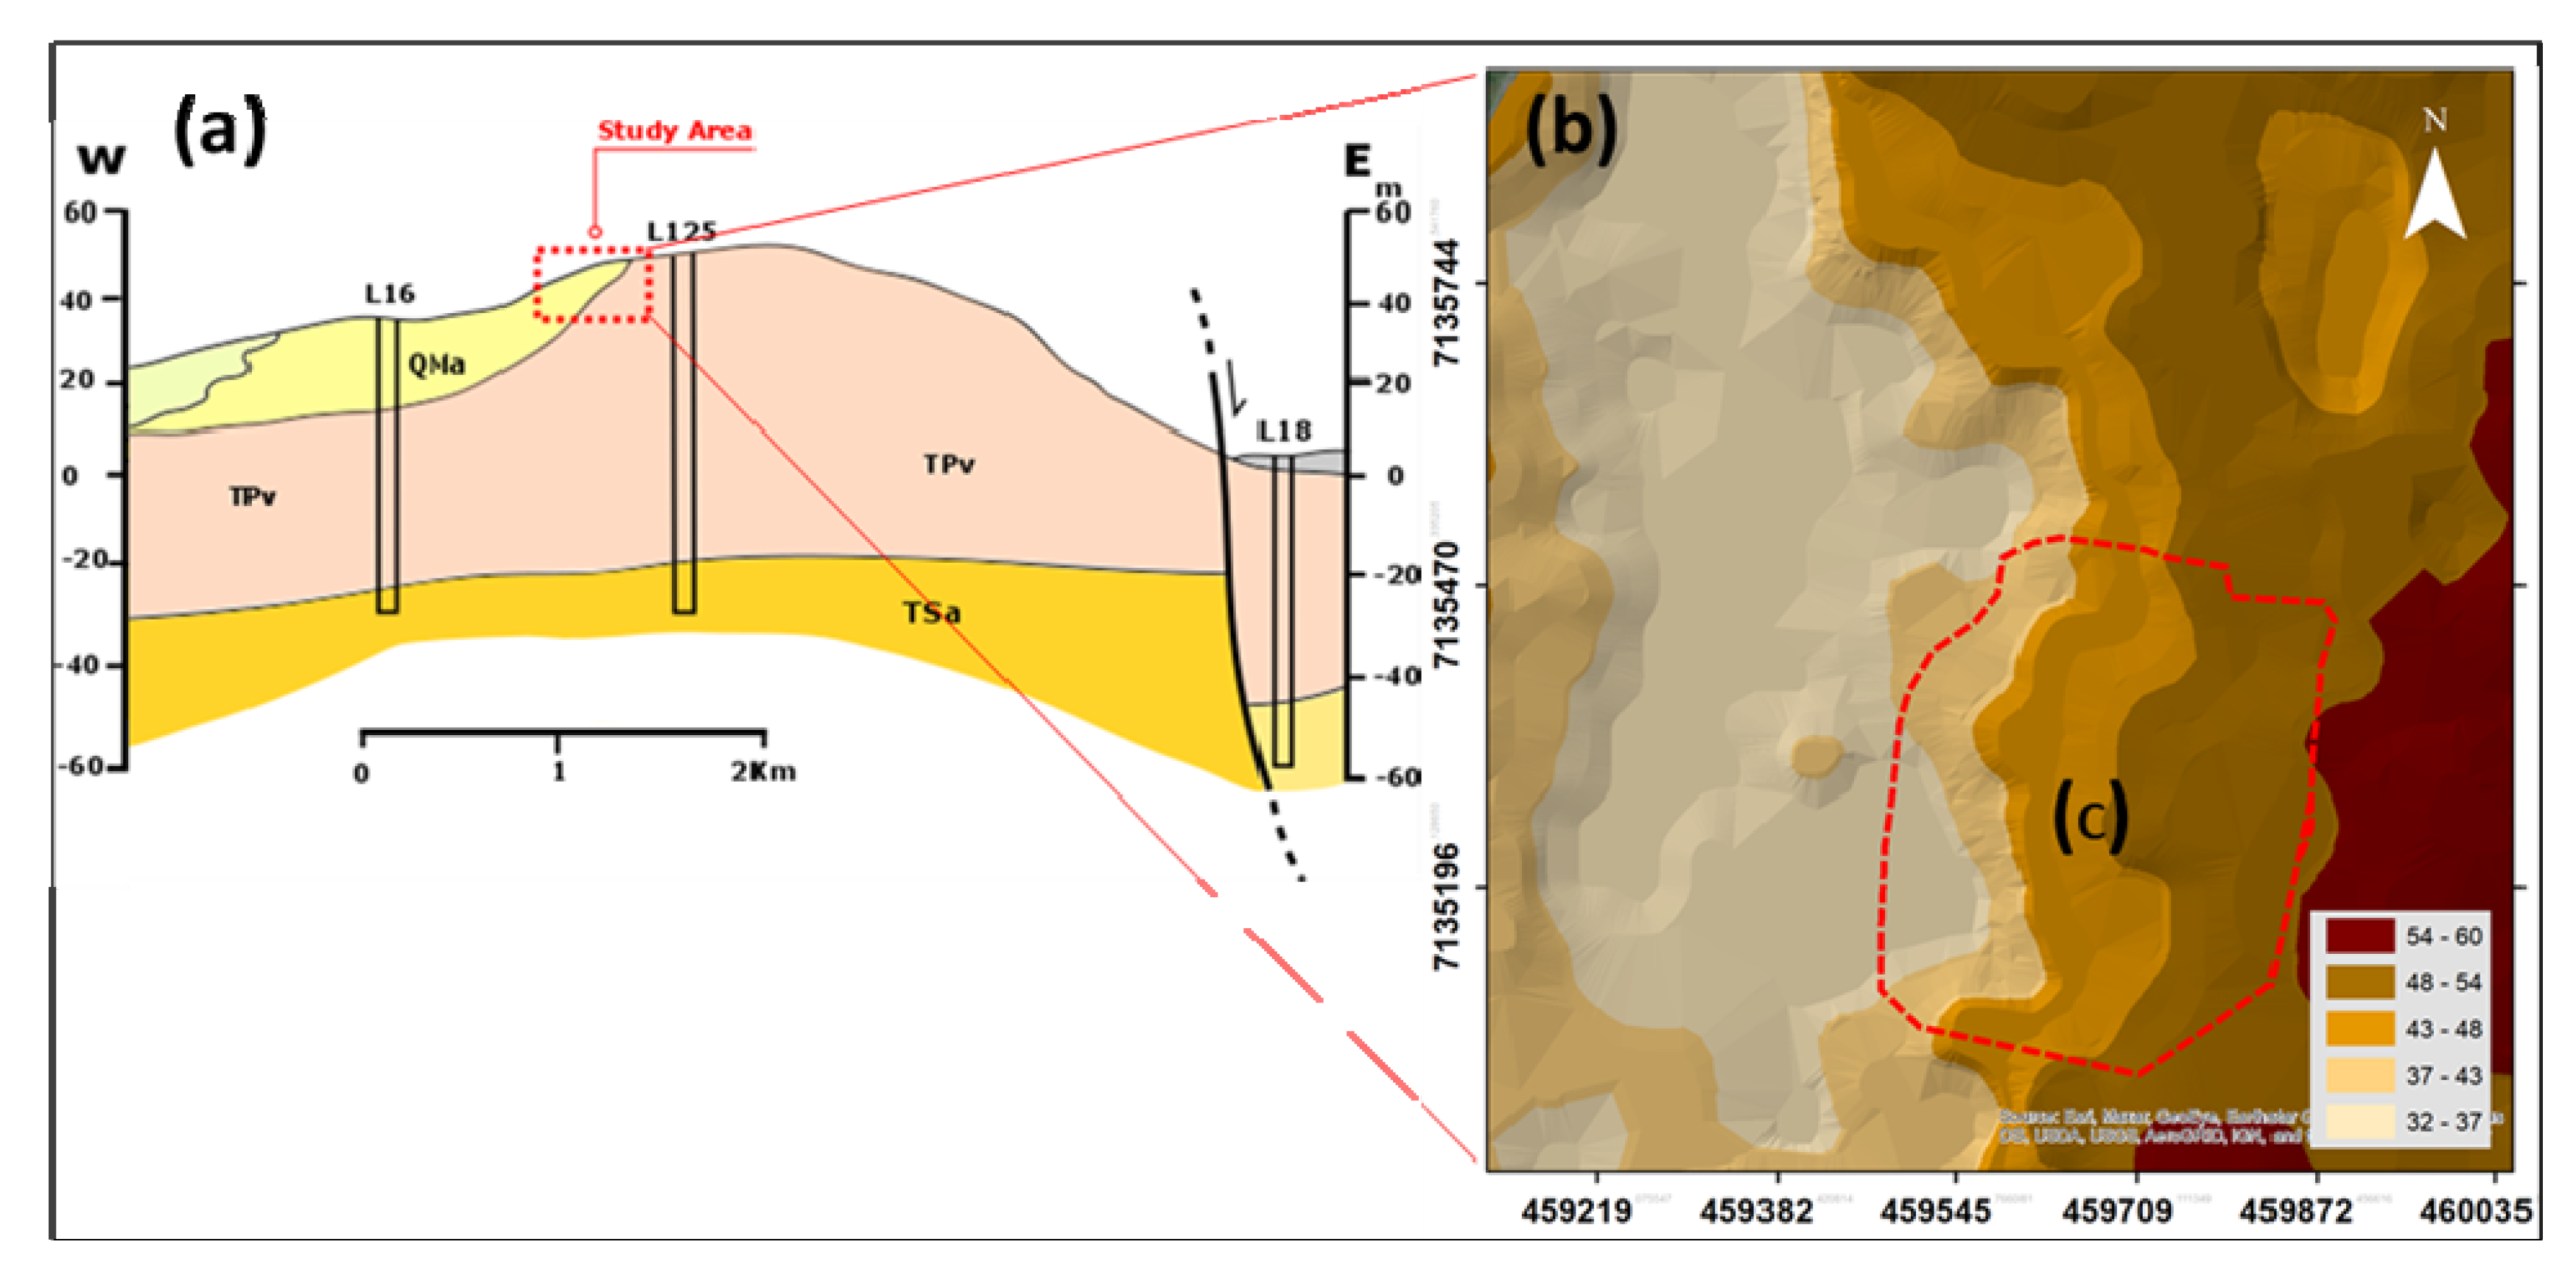
2.1. Study Area

The Hulene-B waste dump is considered the largest in Mozambique [29], and is located in Maputo city (Figure 1), surrounded by Hulene-B and Laulane residential areas, with approximately 49,000 inhabitants [30]. The immediate area of the dump was densely populated until February 2018, when the fall of a large mass of wastes caused the collapse of 32 houses and the death of 18 inhabitants, which led to the forced removal of the population within a range of 50 m to the dump [31]. The Hulene-B dump, an abandoned quarry with no previous preparation for waste deposition receives all types of wastes produced in Maputo City, e.g., domestic, industrial, medical, and construction [32,33]. The height of the waste is estimated to be between 6 and 15 m in depth, in an area of ~17 ha [34,35].
Geologically, the Hulene-B waste dump is in the Mesocenozoic sedimentary basin, in southern Mozambique [36] in a contact zone of two lithologies (Ponta Vermelha TPv, and Malhazine QMa Formations) [27] (Figure 2). The Ponta Vermelha Formation dates from the upper Pliocene to the lower Pleistocene, being composed in the upper part of ferruginous sandstones and red silty sands, which gradually change to yellow and whitish sands [37]. On the surface this unit presents a red color, being poorly consolidated, and loose sands may appear [26]. The Malhazine Formation, from the upper Pleistocene, consists of fine, poorly consolidated sands with whitish to reddish colors, fixed by vegetation on successive consolidation processes [26]. Waste deposition in the Hulene-B dump is mostly located in QMa, spreading to the East (TPv).
The eastern dump boundary corresponds to small slopes ranging from 52 to 54 m, while the western boundary presents smaller slopes, ranging 32 to 34 m (Figure 2b). Momade et al. [38] performed drillings L16 and L125 (Figure 2a) in two geological formations around the dump, showing that TPv formation underlain QMa, and TSa (Miocene-Pliocene) is composed of clayey, calcareous sandstone with Ostrea cullata in its upper part.
Figure 2. (a) Geological features; (b) study area topography; and (c) Hulene-B waste dump (adapt. Momade et al. [38]).
Water 14 01746 g002
The Hulene-B dump hydrogeological system is in the Tertiary-Quaternary aquifer system [26]. The aquifer substrate is formed by a layer of clayey marl to grey clay [38]. The localized presence of the semi-impermeable layer (clayey sands), between fine and coarse sand and sandstones, in the surroundings of the Hulene-B dump, causes water circulation in these two sectors [28]. Coarse sands lie directly on top of the clay layer, in some sections, promoting semi-confined conditions [25]. The water level on local wells varies between 1.5 and 9.3 m in depth, with an average of 3.8 m [38]. Bernardo et al. [27] used electrical resistivity profiles in 2020 and 2021, suggesting that groundwater in the western boundary of the Hulene-B dump was at variable depths and with a potential risk of being contaminated by leachate plumes resulting from vertical and horizontal migration, which, in the subsurface environment, were assigned d values 4.26 to 8.5 Ω.m. The hydraulic conductivity was estimated to be 1 to 5 m/d on the surroundings of the Hulene-B dump [28].
The predominant local climate is subtropical, with mean annual precipitation of ~789 mm, with two climatic seasons: (a) hot (mean 25 °C) rainy period from December to March, representing >60% of the annual precipitation, with its peak in January (~125 mm); and (b) dry and cold season, from April to September, with lower temperatures in June and July (mean 21 °C), and scarce precipitation, whose minimum values recorded in August (~12 mm) [39]. The prevailing winds are SE [40].

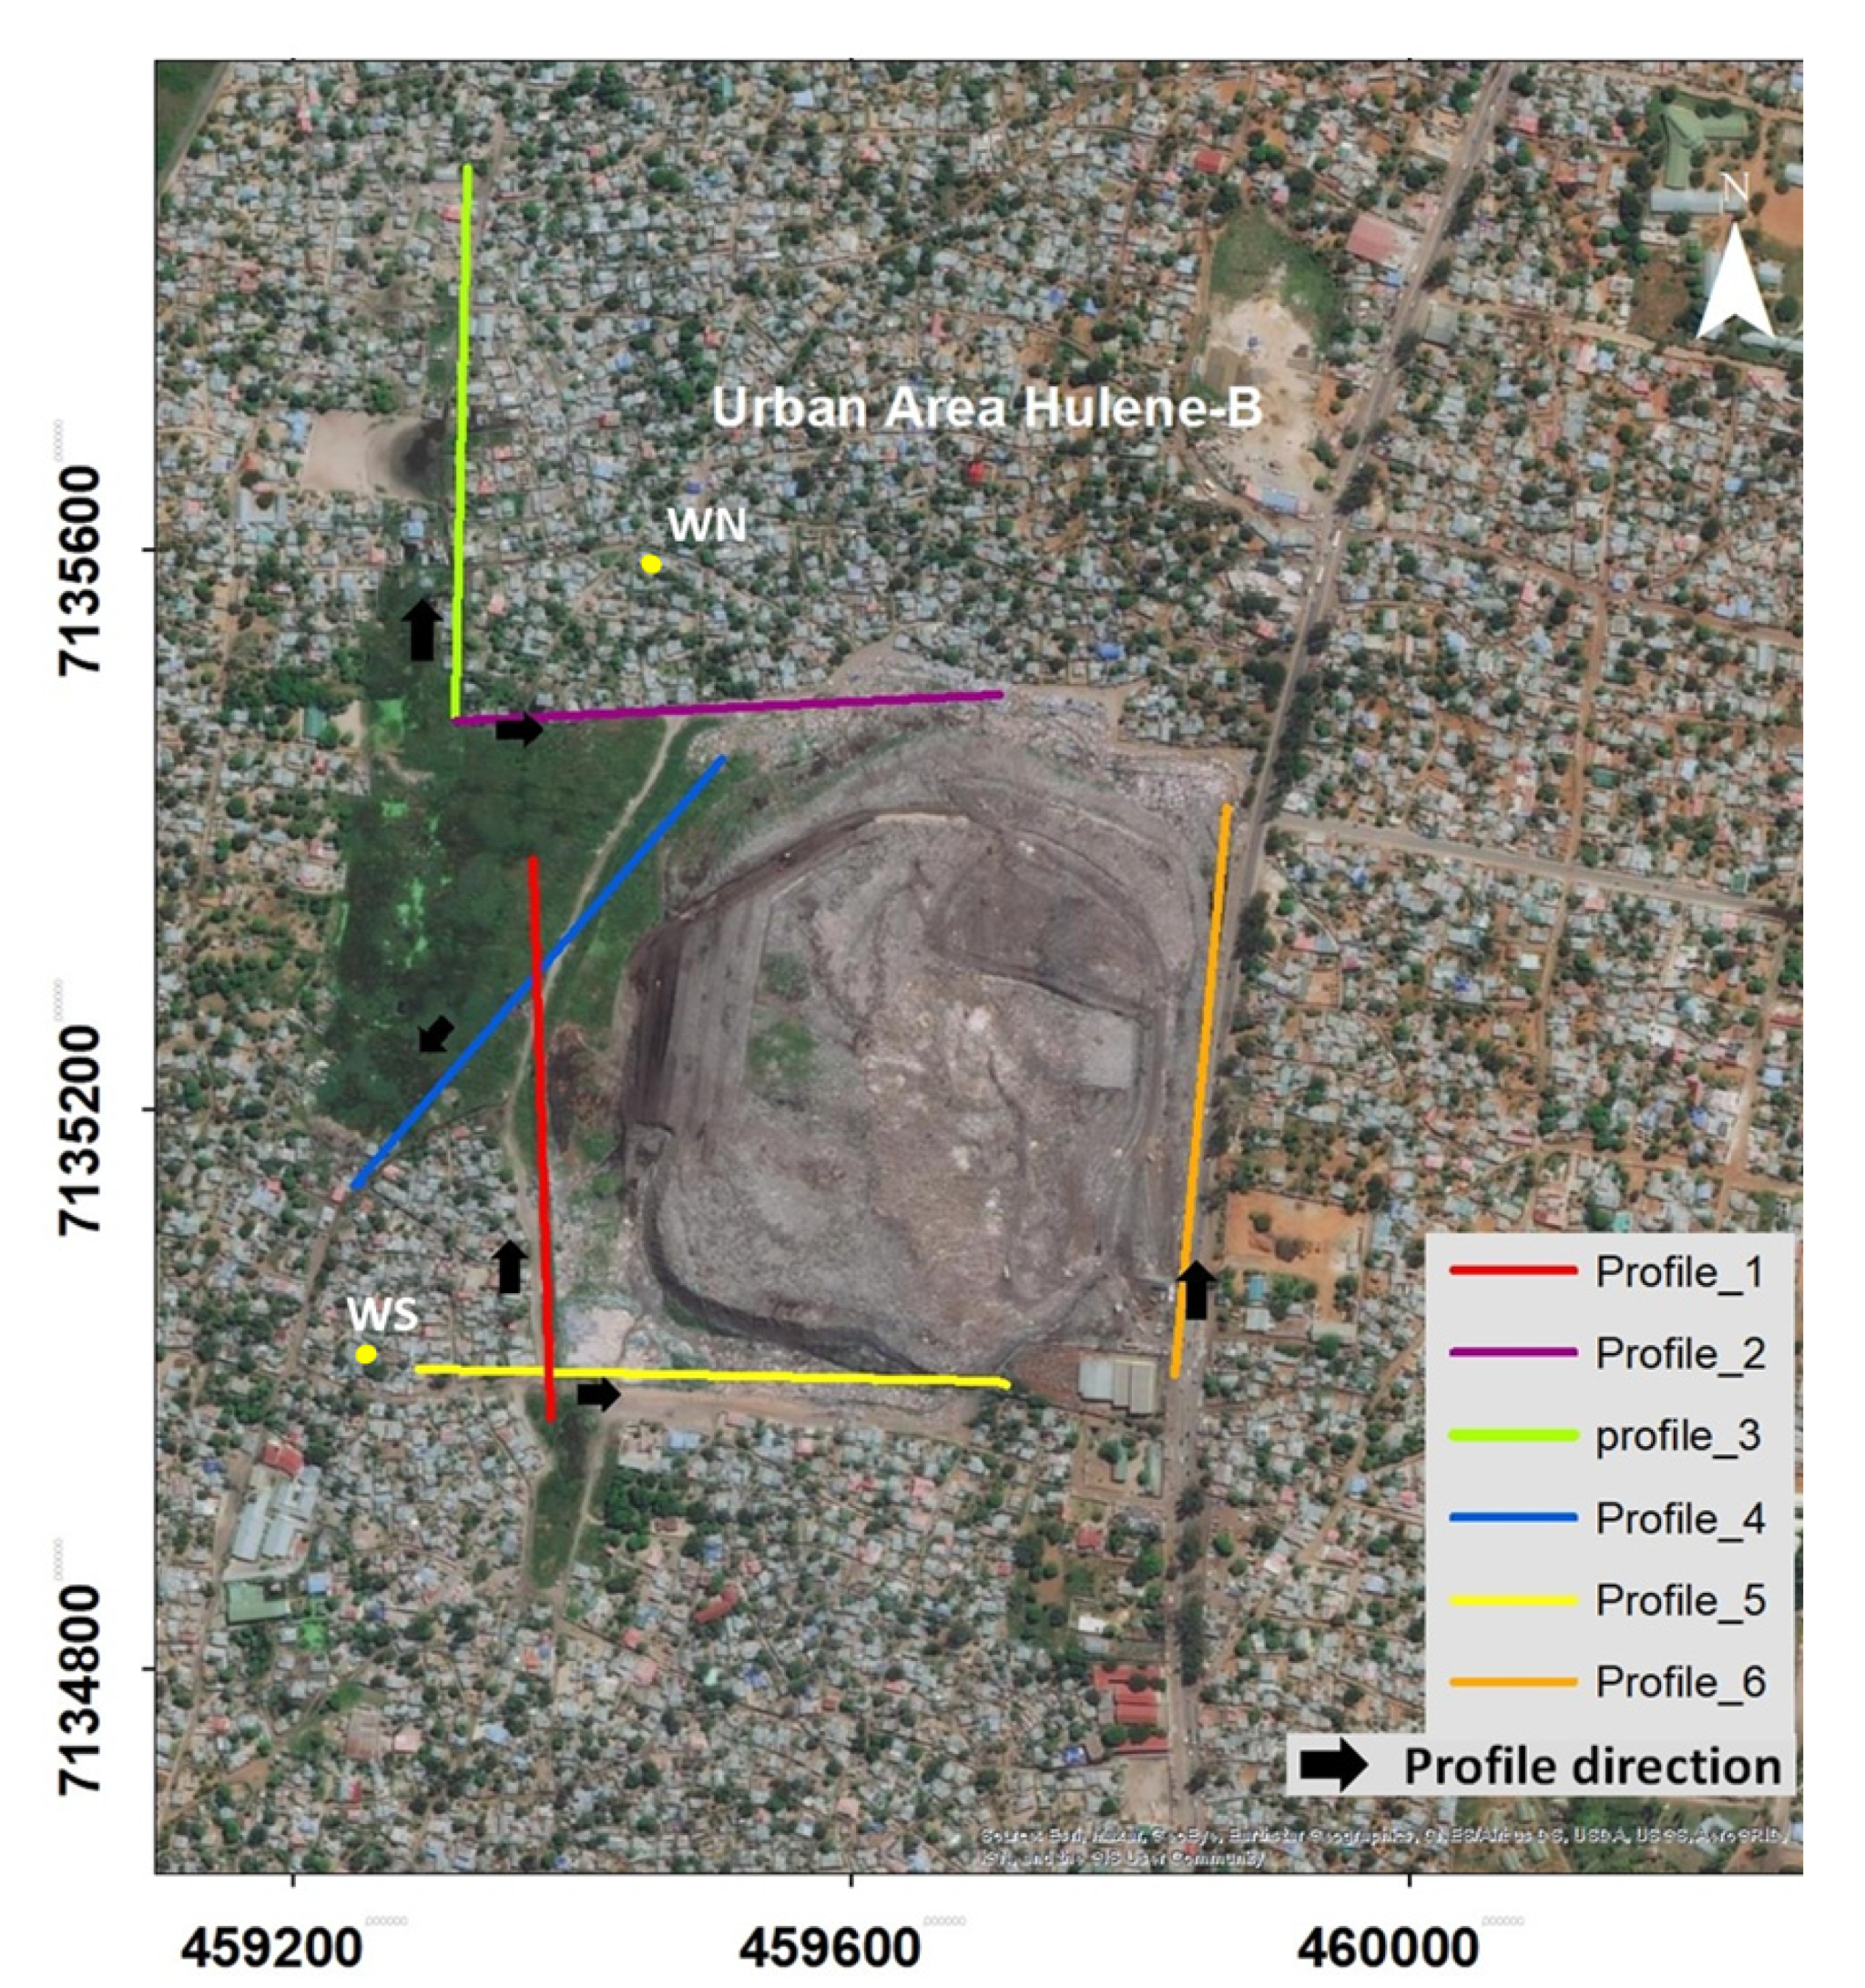
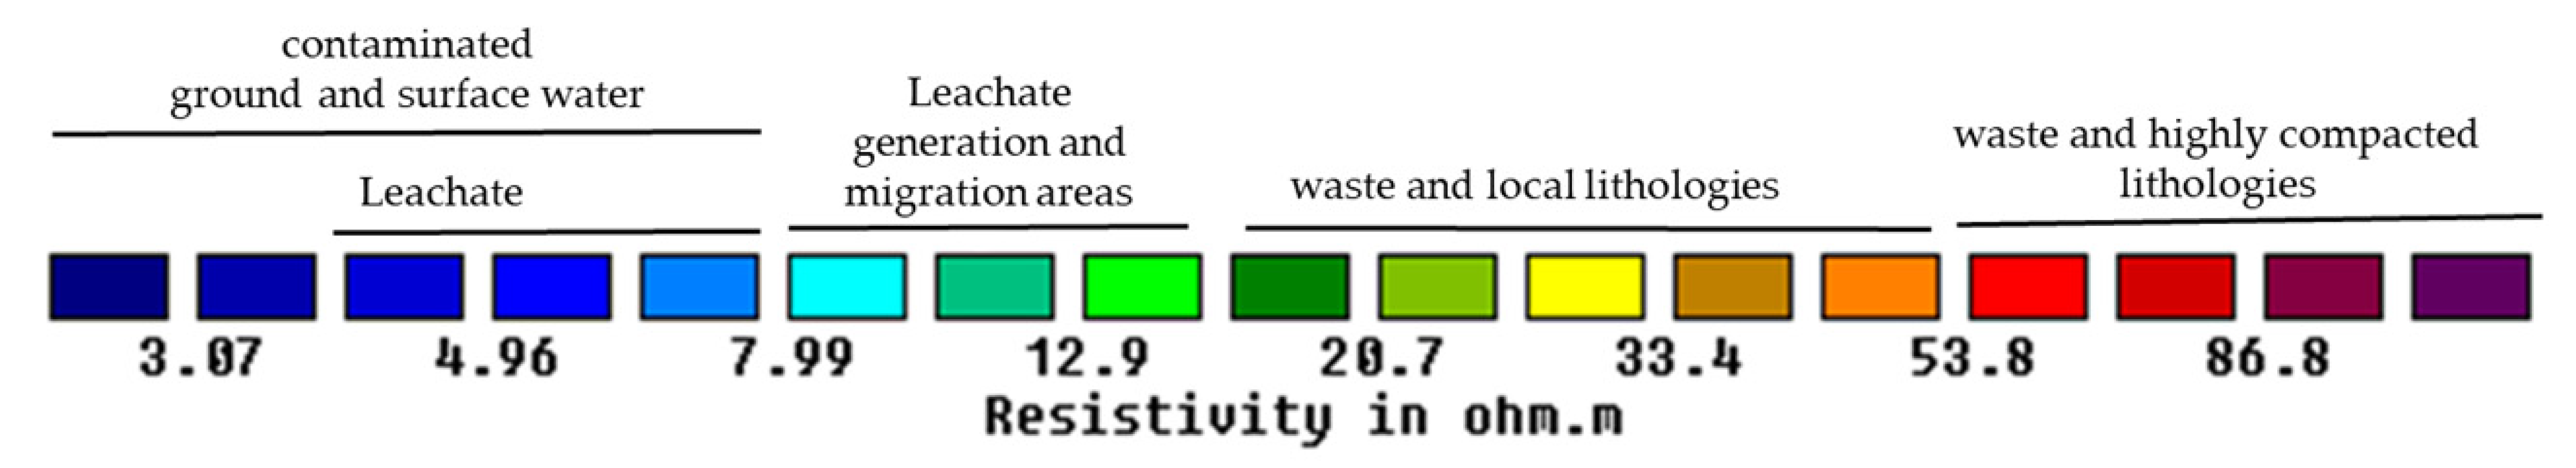
2.2. Electrical Resistivity

Electrical resistivity studies are based on electric current injected into the ground through a pair of electrodes (A and B—current electrodes), and the resulting potential difference between another pair of electrodes (M and N—potential electrodes) [41]. Ground resistivity is calculated by distances between electrodes, applied current and measured potential difference, based on the Law of Ohm [42].
The soil’s electrical resistivity is a characteristic closely linked to the type, nature, and state of alteration of geological formations [8]. In areas with potential groundwater contamination, it has been used for determining the depth of the groundwater table [43] (Akhtar et al., 2021), determining the distribution of contamination areas and the direction of migration of pollutants, assessing the thickness of wastes deposited in a landfill, and identifying possible leachate plumes [41,44,45]. Soil apparent resistivity (ρa) can be determined based on the known difference between electric field potential (∆V), the current (I), and the distance between electrodes [41], given by the equation:
ρa = k ∆V/I
where ρa is apparent resistivity, I the intensity of current applied to the soil by electrodes A and B (mA), ∆V the differential potential between electrodes M and N (mV), and k the geometrical coefficient of electrode positioning (m). The geometrical factor k is dependent on the distribution geometry of the electrodes, as follows:
k = 2 π ( 1 A M ¯ 1 B M ¯ 1 A N ¯ + 1 B N ¯ )
where AM, BM, AN and BN represent the geometrical distance between electrodes A and M, B and M, A and N, and B and N, respectively.
In this study, 6 electrical resistivity profiles were performed in May 2021, of which, 4 were on the western border of the dump and 2 profiles were on the southern and northern borders (Figure 3). Profile 3, on the north of the dump, was applied to understand the possible migration of contaminants to areas further away from the dump (reference profile).
ABEM SAS 4000 was used for resistor data acquisition, including 4 rollers of 100 m cables with 21 outlets connected to the same number of electrodes. The layout produced by this sequence of cables corresponds to the standard of the reading program hosted by the resistivimeter LUND Imaging System. Data acquisition employed a 50 Hz current frequency, using GRAD4LX8 multigradient protocol, once provides dense coverage nearby surface and adopts the Wenner–Schlumberger protocol (ABEM, 2018). The electrode spacing for data acquisition was 5 m. All electrode take-outs were connected in the GRAD4S8 protocol. The resistivimeter automatically switches electrodes to serve as current or potential pairs. After the readings, data was transferred to the resistivimeter, which then takes 3 to 6 readings to obtain the smallest error average between readings. The inversion of the electrical resistivity data obtained in the 6 lines was performed based on standards defined in software RES2DINV3.59.106, namely, the application of the smoothness constraint method in the resistivity values of the final model, calculation of the Jacobian matrix in each iteration, standard Gauss–Newton optimization method [46]. Profiles interpretation was based on the direction of each profile over the entire length (400 m).

2.3. Modified DRASTIC Groundwater Vulnerability

The DRASTIC model has been commonly used in areas where geographical, and hydrogeological information is available and has been successfully applied in different regions [15,47,48]. The word DRASTIC is an abbreviation of the initial letter of different parameters such as ‘D’ to depth to water; ‘R’ to net recharge, ‘A’ to aquifer media, ‘S’ to soil media, ‘T’ to topography, ‘I’ the impact of the vadose zone media, and ‘C’ to the hydraulic conductivity of the aquifer intrinsic vulnerability of groundwater is evaluated by the DRASTIC index formula which is given below:
DRASTIC Index = DrDw + RrRw + ArAw + SrSw + TrTw +IrIw + CrCw
where “r” is the rating value, and “w” is the weight assigned to each parameter. Each factor is assigned a relative weight ranging from 1 to 5 (Table 1). Each DRASTIC factor is divided into ranges that affect the contaminant potential. The range for each factor lies from 1 to 10. The DRASTIC model depends on seven boundaries or layers, which are used as input boundaries for modeling. Thus, the interpretation of the index follows three categories: (i) indices <135 denote low vulnerability; (ii) indices between 135 and 150 represent medium vulnerability; and (iii) indices >150 suggest a high vulnerability to groundwater-related environmental impacts [6,12].
In this study we applied the modified DRASTIC model combined with electrical resistivity data. This allows a specific assessment of the vulnerability of the dump surrounding area, based on the distance between anomalous surface layer (low resistivity; leachate influenced) and groundwater. The soil variable was replaced since soils around the landfill were classified as sandy, which is characteristic of the whole surroundings [38]. Thus, ‘S’ corresponds to the distance between the superficial anomalous layer and groundwater. Values and weights of the variables were kept the same as for soil, given processes similarity, controlled by these factors (migration and attenuation of leachate). Layers spatial distribution was not made, given detailed description for each factor in depth and superficial slight change, as well as study area size [49,50].
For resistivity models and groundwater vulnerability validation, groundwater depth, pH and sulphates (PO43−) were measured in two wells in the surroundings of the dump (Figure 3 and Figure S1). Chemical analysis of total phosphate was performed with an HI96713, with a resolution level of 0.01 mg/L (Figure S1).

3. Results

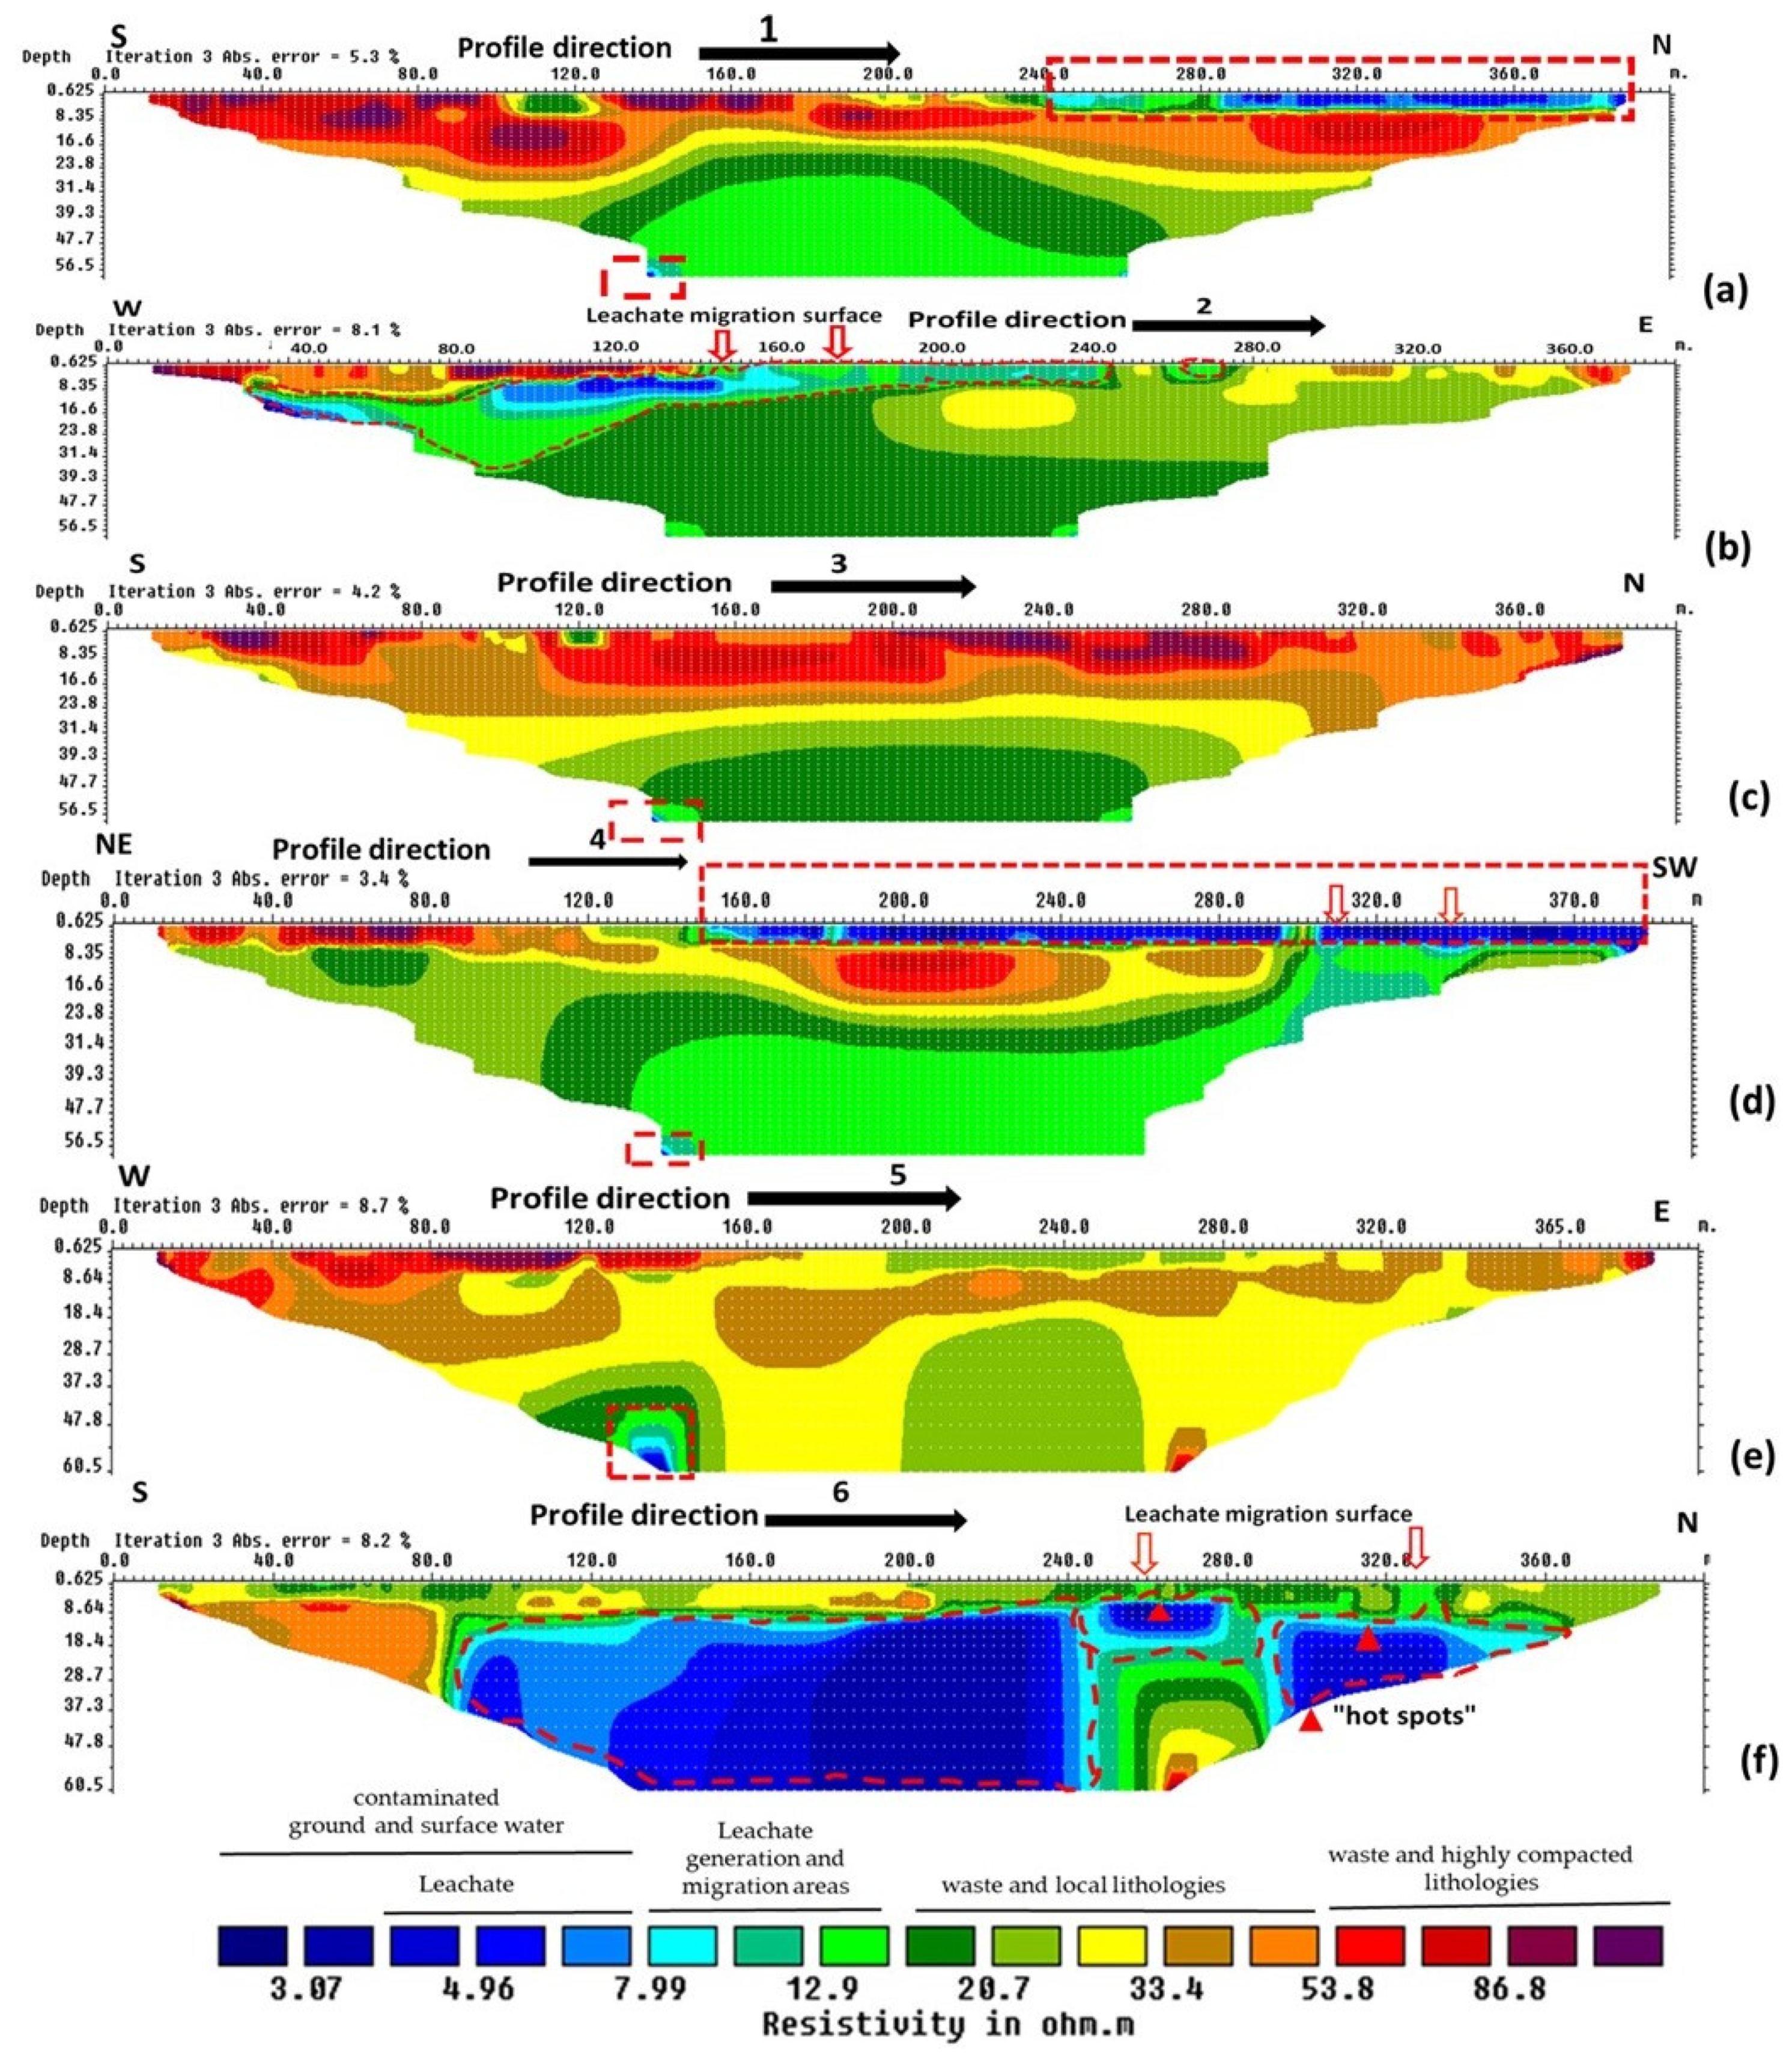
3.1. Resistivity Models and Potential Contamination Risk

For the analysis of the profiles, the resistivity values of the profiles were adjusted to the same scale so that each color of the contour in the resistivity model implies the same resistivity value (Figure 4). In this study, the electrical resistivity models were analyzed to identify the possible influence of leachate on groundwater contamination. Thus, anomalous zones that may reflect the leachate migration and contamination process were identified: (i) leachate generation and migration areas (7.99–16.8 Ω.m); (ii) saturated zones contaminated by leachate (4.96–7.99 Ω.m); (iii) groundwater and surface water contaminated by leachate (1.535–7.99 Ω.m); (iv) waste and lithologies local (>16.8 Ω.m).
Profile 1, from south to north of the dump (Figure 5a), is superficially characterized by high resistivity associated with rubble, house debris and compacted waste in non-wet environments from 0 to 35 m. From 240 to 280 m there were zones with a rather heterogeneous anomalous resistivity, which were considered leachate generation and migration zones, (7.99–16.8 Ω.m) given the strong accumulation of surface leachates resulting from the E-W movement (profile 2) that are diluted with the surface waters, causing possible contamination (280 to 400 m) (1.535–7.99 Ω.m). At medium depths 30–56.5 we note the predominance of a vast layer throughout the length of the profile that we interpret as TPv lithologies, less resistive (12.9–16.8 Ω.m) given the possible influence of horizontal migration at depth described in profile 2. At deeper levels between 47 and 56.5 m, anomalous zones are observed, which were considered as lithologies influenced by horizontal leachate migration and possible contaminated groundwater (>45 m depth) (1.535–7.99 Ω.m).
Profile 2, along the W-E direction (Figure 5b), is quite heterogeneous, with high surface resistivities from 0 to 140 m, which represents rubble, old house debris, and waste buried in a non-wet environment west of the dump, followed, from 140 to 160 m, by a zone of possible migration of surface leachate into the subsurface environment, causing an extensive zone of subsurface anomalies, which were considered as lithologies contaminated by strong horizontal migration of leachate with E-W direction (7.99–16.8 Ω.m) and saturated zone of contaminated groundwater (1.535–7.99 Ω.m), differentiated levels of semi-confinement of aquifers. From 245 to 400 m depths, there were local anomalies and lithologies with higher resistivities, corresponding to highly compacted waste with diverse contents. At depths ranging from 30 to 160 m, semi-confined anomalies (<8.35 m depth) and aquifers (>10 m depth) separated by semi-saturated layers were noted, demonstrating the existence of a possible continuous connection between the two. These characteristics were described as conducive to groundwater contamination at various depths, mainly in the surroundings of the Hulene-B waste dump, where surface leachate flows were noted with successive enrichment of lithological layers (7.99–16.8 Ω.m).
Profile 3 (Figure 5c) north of the dump in the S-N direction, to study possible dynamics of groundwater contamination, ~300 m away from the dump. The profile at the surface level exhibited generally high resistivities, alternating between rubble and highly compacted soils. At the deeper level (>40 m) in the southern end, an anomalous zone was found and considered as contaminated lithologies (7.99–16.8 Ω.m). This anomaly was associated with the horizontal and vertical migration of leachate described in profile 2.
Profile 4, in the NE-SW direction (Figure 5d), from the starting point to 150 m, showed generally high resistivities associated with compacted residues and rubble of old houses. From 150 m depth to the end of the profile, a continuous decrease in resistivity was observed, which can be associated with saturated and wet areas with origin in a natural receiving basin where new waste deposits were observed, a localized source of dilution, and vertical migration of leachate and groundwater contamination (<7.99 Ω.m).
Between 300 and 310 m, relatively high resistivities were found, associated with waste deposited in the intra dune depression with low surface moisture level. From 320 m to the end of the profile, a shallow aquifer was evident (<7.99 Ω.m), as this area corresponds to the end of the depression (SW) with a surface covered by humid soils, evidenced by low surface resistivities. Between 6 and 56 m in depth, was noticed a large anomaly (16.3–7.99 Ω.m) related to surface influence by leachates propagated to greater depths (>37.4 m) causing possible groundwater contamination (<7.99 Ω.m).
Profile 5, with a west-east orientation, was at the southern end of the dump (Figure 5e). The electrical resistivity results did not display significant changes at surface level and showed higher resistivities associated with compacted soils and rubble (including road asphalt where the profile was executed). This road, besides being in the southern boundary of the dump, is an access route to the interior of the Hulene-B neighborhood. Between 130 and 145 m (>40 m depth) extended a resistive zone of low anomalous values, which were interpreted as lithologies that might influence leachate migration (7.99–16.8 Ω.m Ω.m) and possible water contamination by the vertical movement of leachates (1.535–7.99 Ω.m).
Profile 6, this profile was taken at the eastern limit of the dump, along the S-N direction, between the dump and Julius Nyerere Avenue (Figure 5f). From the starting point to 200 m, there were resistivities with average profile values (12.9–33.4 Ω.m). These resistivities suggested soils with different levels of compaction and surface moisture that may be associated with various activities south of the dump. The resistivity of 33.4–53.8 Ω.m corresponding to a superficial but thick layer, between 160 and 200 m, indicated compacted soils at the entrance of the dump. From 8.6 m depth, higher resistivity values (>70.3 Ω.m) were noted which may be related to the sandstone stratum with different levels of alteration, typical of the TPv formation [25]. Onwards, in the northern direction, resistivity starts to decrease successively (<27.05 Ω.m) along thick layers with moisture levels that increase until to groundwater (<10.44 Ω.m).
The saturated area occupied a large space, revealing the existence of an E-W groundwater flow parallel, to the dune slope where the leachate is located. The groundwater contamination process at this point may be occurring horizontally due to leachate diffusion, causing localized anomalous resistivities (<10.445 Ω.m) close to the groundwater resistivity (<7.99 Ω.m). From 240 m, resistivity begins to decrease, generating localized anomalous zones in the subsurface, which are associated with vertical leachate migration, pointing to the occurrence of two isolated “hot spots”. Between 240 and 280 m, below the first “hot spots”, there was a tendency for a significant increase in resistivity, which may correspond to less saturated layers up to the least conductive stratum (>33.4 Ω.m). Profile data showed the existence of two mechanisms of possible saturated zone and groundwater contamination which were, horizontal dilution in the south and center of the profile, and vertical migration (<16.8 Ω.m) and retention of leachate in localized “hot spots”.

3.2. Modified DRASTIC Index

3.2.1. Depth to Water Table (D)

Aller et al. [12] refer that the depth of the water table determines the depth through which a contaminant moves before reaching the aquifer and determines the contact time with the surrounding media. Thus, a greater possibility of contamination mitigation occurs when the depth of the water table is greater because a deeper water table implies more travel time and less vulnerability to contamination [13]. Thus, the deeper the phreatic table implies more travel time and less vulnerability to contamination [13,47]. On the eastern, southwestern and northern boundary of the dump (area covered by profiles 6, 4, 2 and 1), subsurface waters and groundwater were detected between 1.5 and 4.6 m, and on the southern, northern and western boundary at depths >30 m (area covered by profiles 5 and 3). Results for the eastern border southwest and northwest were similar to those published by [28], who classified the predominant aquifers in Maputo city as shallow and phreatic aquifers, estimating their average depth between 1.5 and 9.3 m. DRASTIC parameters of 9 and 1, respectively, were assigned, and D = 5 (Table 1 and Table 2).

3.2.2. Net Recharge (R)

Net recharge is the amount of surface water that infiltrated the underground and reaches groundwater [6], indicating the amount of water from precipitation that was available for vertical transport, dispersion, and dilution of pollutants from a given application point [5,12]. Recharge water in the dump’s surroundings is a source of contaminant transport within the vadose zone to the aquifer [19]. The greater the recharge, the more vulnerable the groundwater [51]. Given the small area analyzed in this study, data used according to Momade et al. [38] and Vicente [36] estimates the value of groundwater recharge in Maputo city between 165 and 185 mm/year for the entire Hulene-B dump surrounding area. A value of 8 was assigned to the area and R = 4 (Table 1 and Table 2).

3.2.3. Aquifer Media (A)

Aquifer media refers to a rock in the ground that serves as water storage [52]. It indicates material property that controls pollutant attenuation processes based on the permeability of each layer [53]. The attenuation characteristic of the aquifer material is reflected by the mobility of contaminants through aquifer media [47]. In the surroundings of the Hulene-B dump, two types of semi-confined (west of profile area, 2) and shallow (south-west of profile area 1, 4 and area covered by profile 6) aquifers were assumed to exist, which have been described by Momade et al. [38], Vicente [36], and Cendon et al. [26], composed of inland dune sands and semi-permeable sands, and recharge occurs mainly by precipitation given the permeable surfaces such as dune sands. The value of 7 was assigned to the area around the Hulene-B dump and A = 3 (Table 1 and Table 2).

3.2.4. Distance of the Anomalous Surface Layer and Groundwater (S)

The distance between anomalous surface layer (low resistivities) generally represents surfaces contaminated by leachates in areas close to landfills [42]. Anomalous surface to groundwater band areas were characterized by intense leachate migration, which was evidenced by transected profiles 2 (<10.445 Ω.m) and 6 (<16.8 Ω.m). The area north of profile 1 and southwest of profile 4 show intense anomalies that we interpret as a shallow aquifer (4) and surface soils enriched by leachates (1) that accumulate successively to the west that can easily migrate into the confined aquifer described in (2). However, other profiles did not show bands with the continuous connection of anomalies and groundwater. The area covered by profiles 1, 2, 4 and 6 was assigned the value 10 and other areas value 1, and S = 2 (Table 1 and Table 2).

3.2.5. Topography (T)

Topography refers to the slope of an area [47]. It controls the probability of a pollutant being transported by runoff or remaining in the soil where it may be infiltrated [12]. The softer the slope (slope of 0–2%), the higher the water and/or pollutant holding capacity, while in slopes >10%, lower water and/or pollutant holding capacity occurs [12]. In the surroundings of the dump, the relief is heterogeneous (Figure 2). The area covered by profiles 1, 3, 4 and 6 did not present slopes. However, the area covered by profiles 2 and 5 has sloped >10%. Thus, the area covered by profiles 2 and 5 was assigned the value 5 and the other areas were assigned the value is 10, and T = 1 (Table 1 and Table 2).

3.2.6. Vadose (I)

The vadose zone is the unsaturated zone that lies below the soil horizon and above the water table [47]. It determines the attenuation characteristics of the contaminants [12]. The movement of contaminants into the saturated zone is controlled by this parameter. Aller et al. [12] and Asfaw et al. [47] refer that if the flood zone consists of sand, the potential risk of contamination of the aquifer is very high. The surrounding soils of the Hulene-B dump are dune sands. However, the combination of electrical resistivity data showed specific characteristics, which allowed us to classify in detail the environment of the dump. The area covered by profiles 3 and 5 was characterized by having very resistive surface layers, showing a low infiltration rate, so a value of 4 was assigned. Profile 1 was heterogeneous, with half of the area covered being very resistive(south) and with very low resistivities, the assigned value was 8. Profiles 2, 4 and 6 had a lower resistivity, showing higher infiltration, which is typical of sandy soils, so a value of 8 was assigned, and I = 5 (Table 1 and Table 2).

3.2.7. Hydraulic Conductivity (C)

Hydraulic conductivity is described as the ability of materials to transmit water to aquifers, in turn controlling the rate of groundwater and contaminant material flow under a given hydraulic gradient [13]. It controls contaminant migration and dispersion from the injection point within the saturated zone [47]. In the surroundings of the Hulene-B waste dump, the hydraulic conductivity was estimated by Momade et al. [38] as 1–5 m/d. For the whole studied area, a value of 2 was assigned, and C = 3 (Table 1 and Table 2).

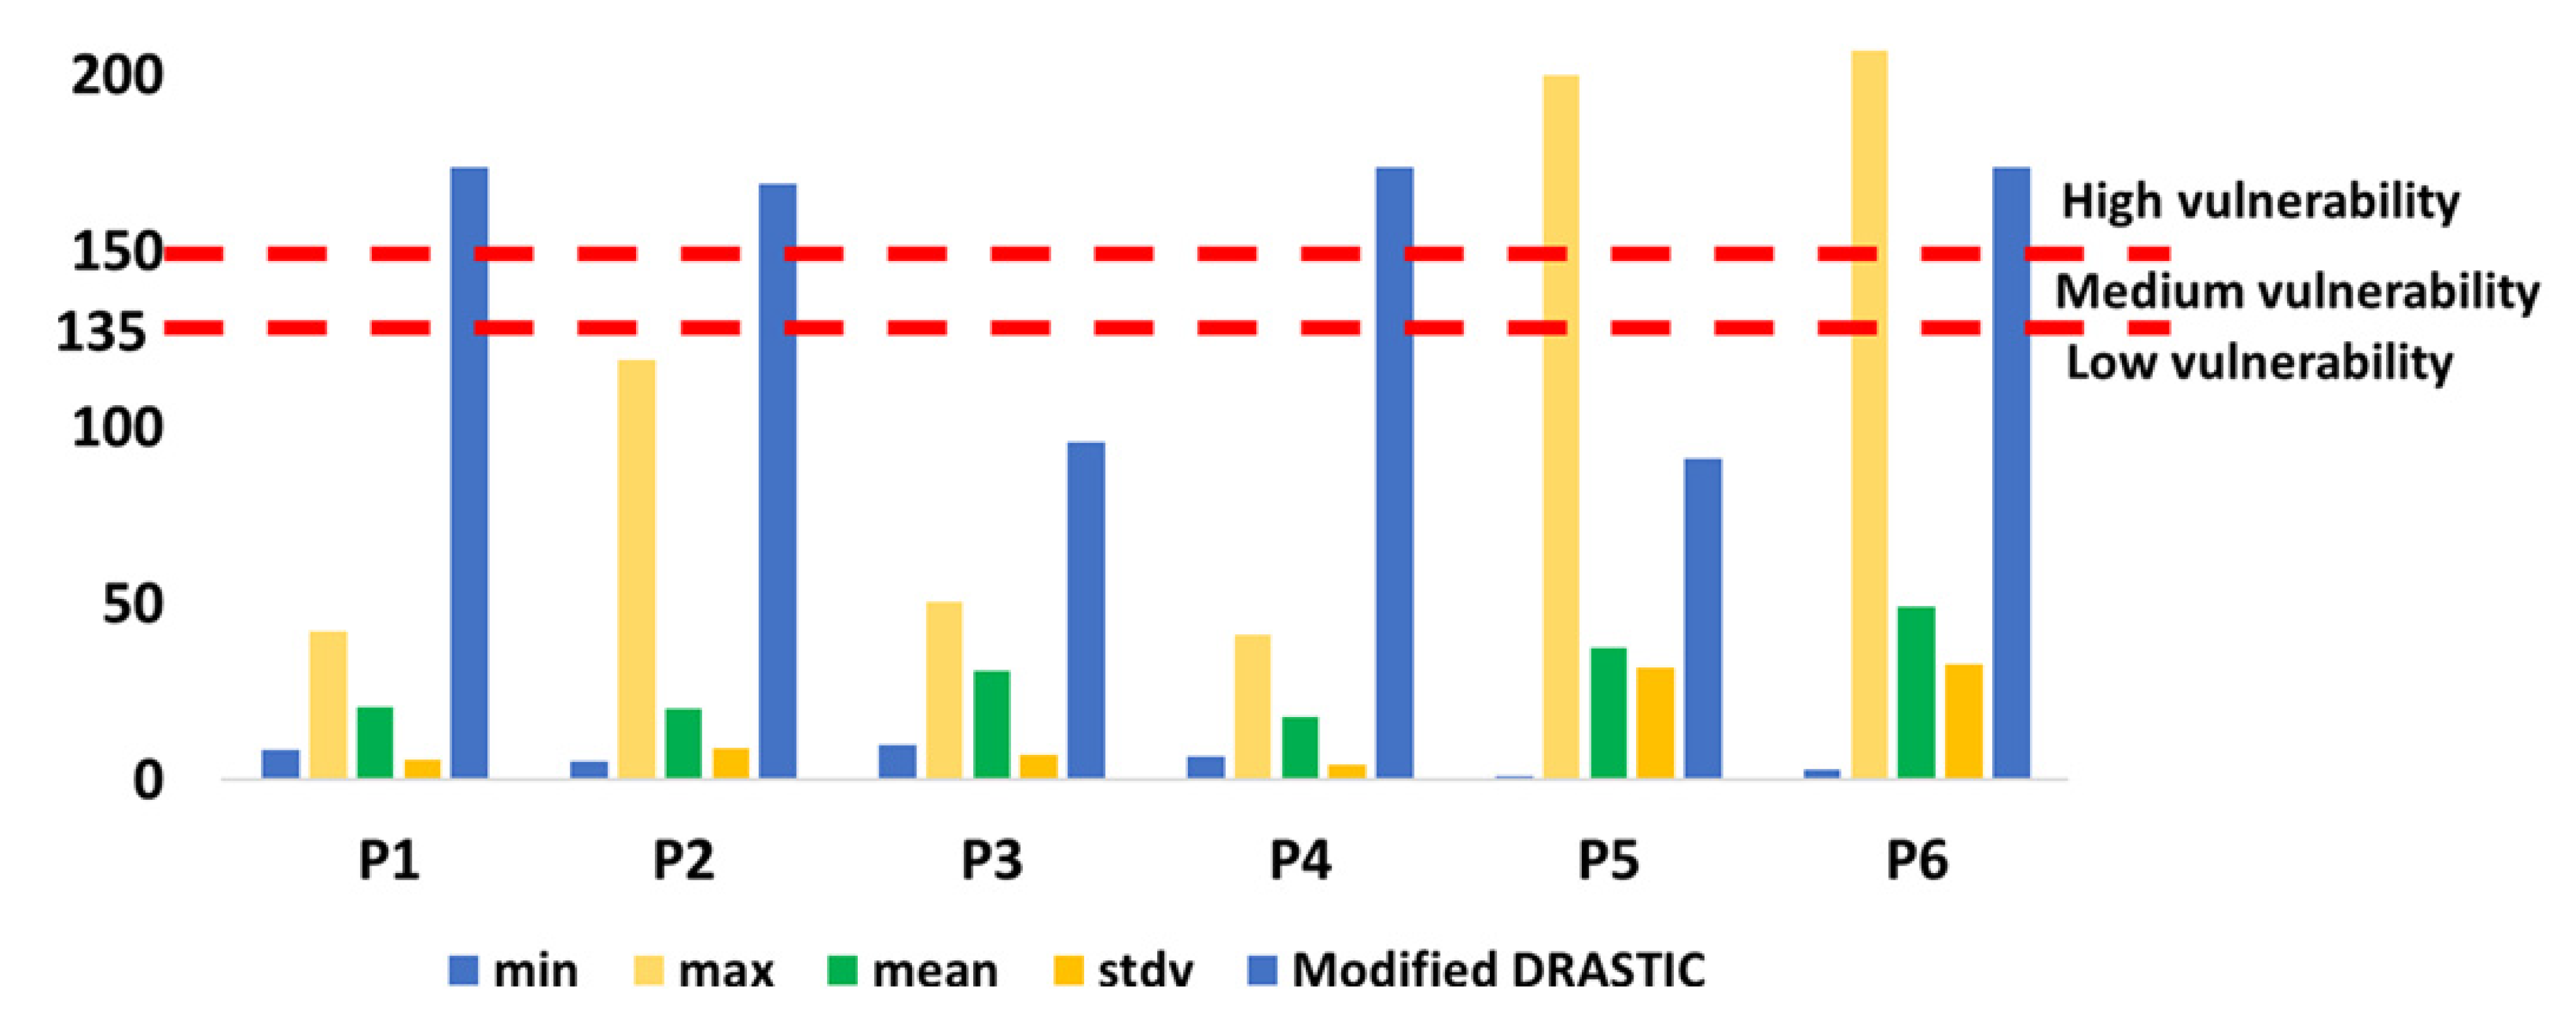
3.3. Descriptive Statistics of Electrical Resistivity and DRASTIC Index
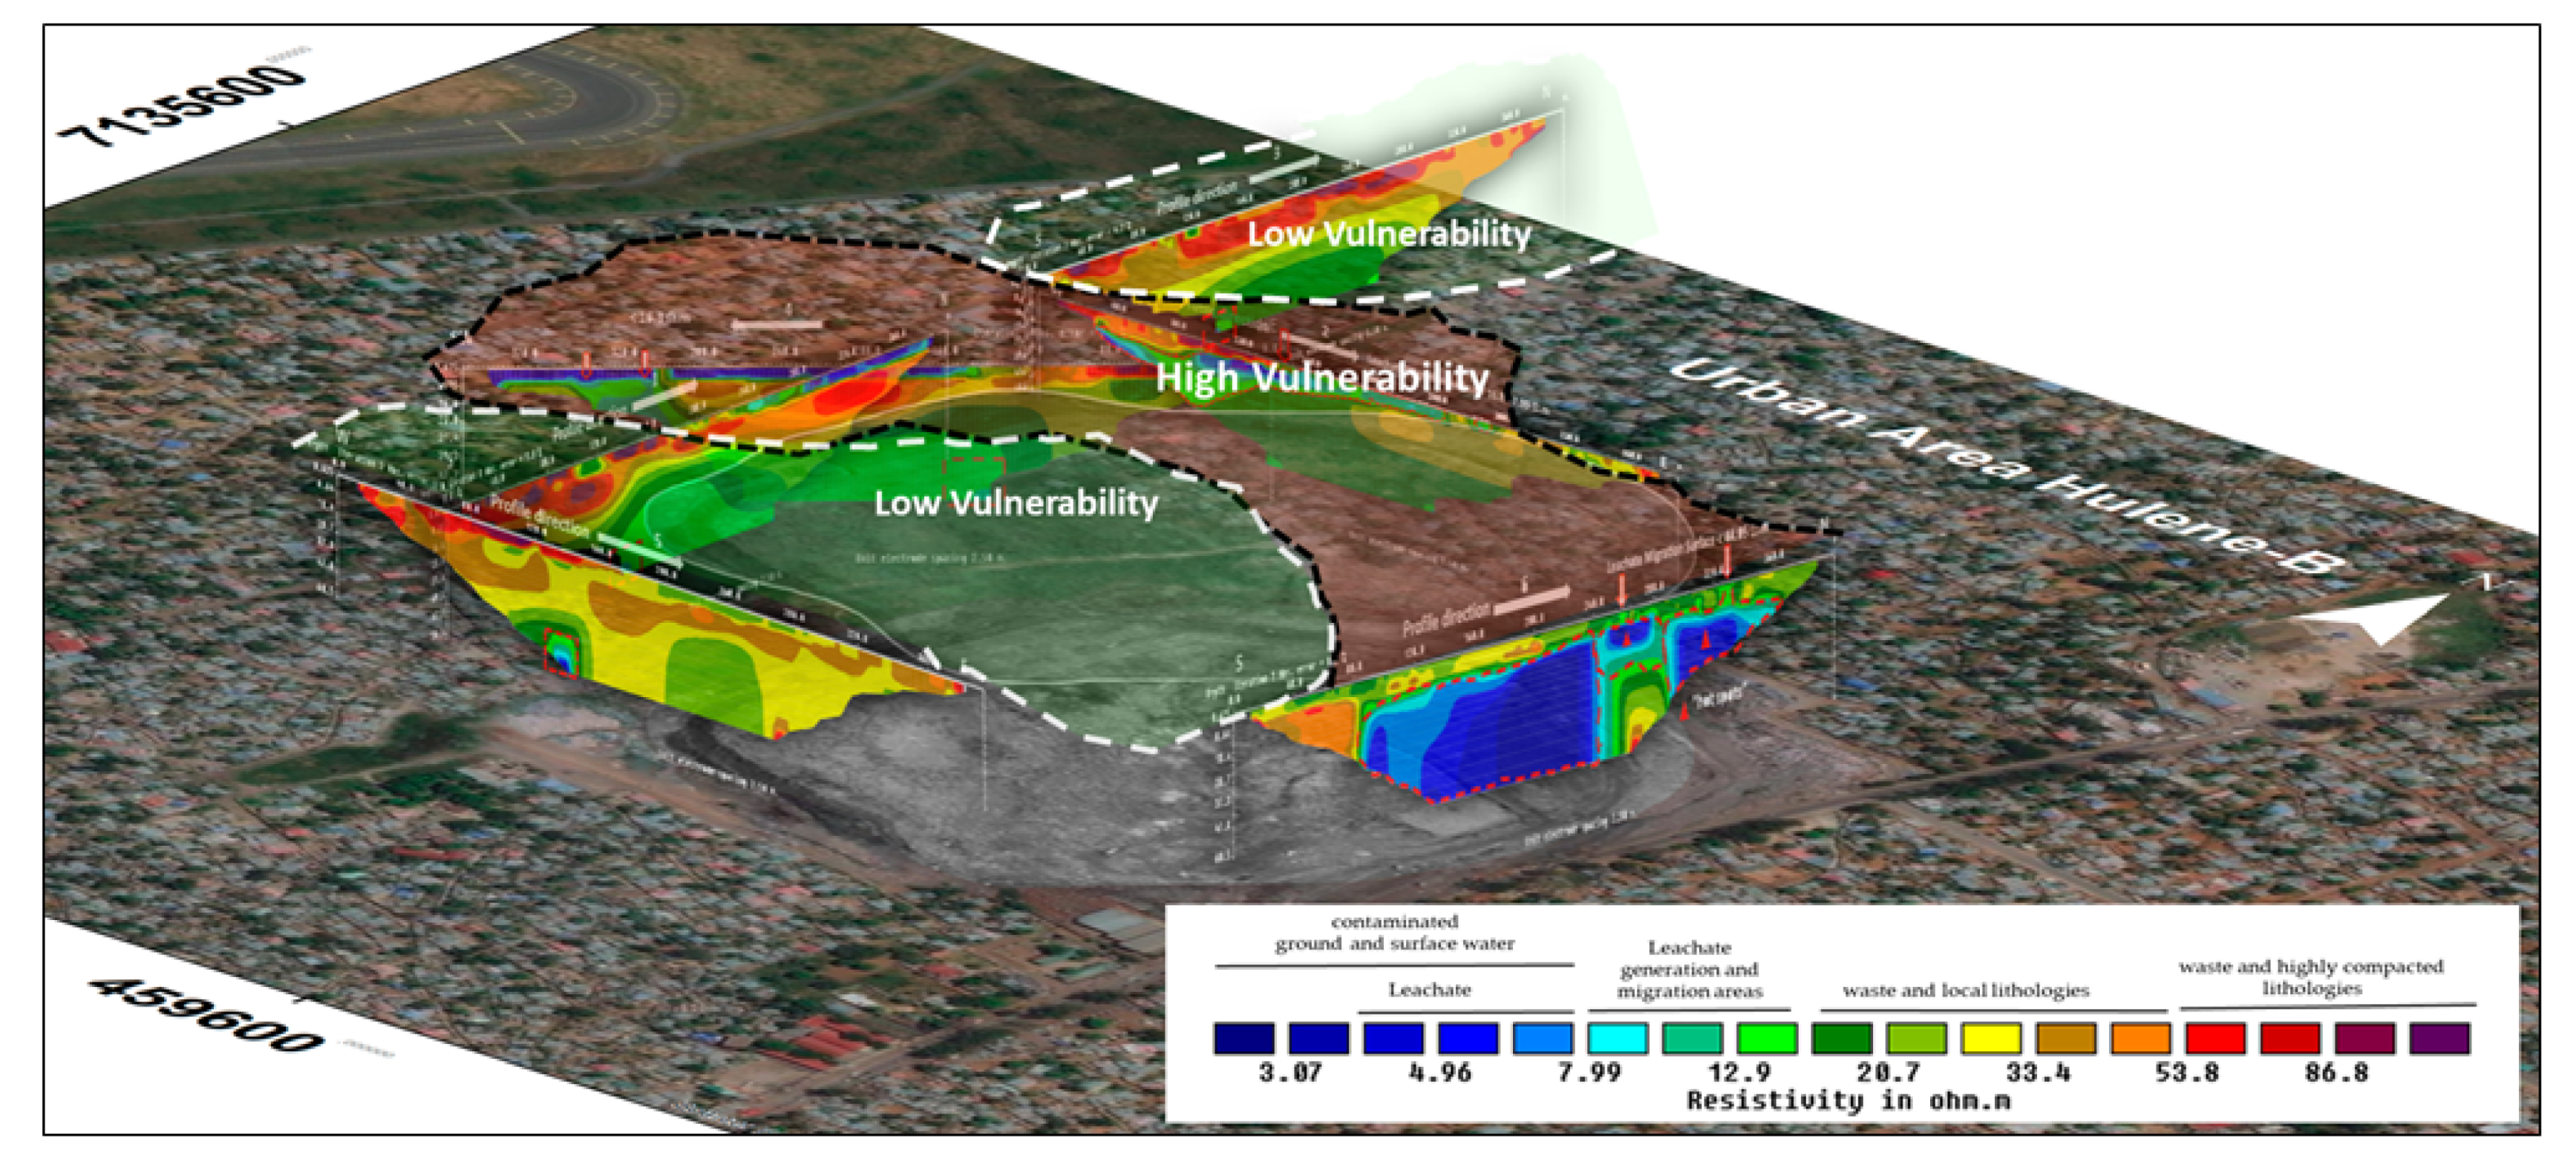
The electrical resistivity values of the areas covered by the profiles were projected with the vulnerability index values (Table 3). In general, the areas covered by profiles 2, 4 and 6 were classified as having a high DRASTIC index. The profile areas 2 and 4, with mean resistivity values of 20.22 and 18.1 Ω.m, respectively, suggested the predominance of lower resistivity across the profile surface area which extends into the groundwater, suggesting successive leachate migration.
The area covered by profile 6 had an average of 49.2 Ω.m, a minimum of 3.06 Ω.m and a maximum of 207 Ω.m. The average resistivity value was relatively higher but showed a much higher standard deviation (32.78 Ω.m), revealing resistivity heterogeneity, marked by the existence of surface anomalous bands that connect with the groundwater at various points, which may be associated with a greater migration of leachates and groundwater contamination.
Areas covered by profiles 3 and 5 revealed a low DRASTIC index and heterogeneous electrical resistivity. Thus, the area covered by profile 1 showed heterogeneity in surface and subsurface anomalies that may be associated with vertical and horizontal migration of contaminants with minimum resistivity values of (1.535–7.99 Ω.m) revealing a higher risk of contamination of the semi-confined aquifers described in profile 2. However, the greater depth at which the groundwater was detected reveals a natural attenuation mechanism of contamination by the underlying lithologies. The area covered by profile 3 showed an average resistivity of 31.01 Ω.m, ranging from 10.12 to 50.8 Ω.m. These results suggest the predominance of high resistivity values, which is translated by a reduced predominance of resistive surfaces that were interpreted as less permeable and less contaminated substrates. The minimum resistivity at great depths (7.99–10.12 Ω.m) may be associated with a saturated area or localized influence of horizontal migration of contaminants, described in profile 2. The area covered by profile 5, presented an average resistivity of 37.35 Ω.m, ranging from 1.04 to 477.1 Ω.m. Groundwater was detected at depths >40 m, with less risk of contamination by vertical migration.
The low DRASTIC values in areas covered by profiles 3, and 5 resulted from the combination of two factors, high resistivities prevailing in the surface lithologies suggesting low infiltration, which greatly reduces the risk of vertical migration of leachate to deep layers, and greater depth at which, resistivities interpreted as groundwater, were found. In general, data showed areas covered by profiles, with high average resistivity, with lower DRASTIC index (profiles 3 and 5) (Figure 6). Exceptionally, the area covered by profile 6 showed a high DRASTIC index with relatively high mean resistivity values due to its higher standard deviation and predominance of resistivities <10.445 Ω.m in a large surface strip that was associated with leachate migration to groundwater at low depth than in all profiles. However, in the area covered by profiles 1, 2 and 4, the presence of resistive anomalies was considered as semi-confined and shallow aquifers and surface anomalies that are conducive to contaminant migration were determining factors for high DRASTIC index.

4. Data Integration

The resistivity data of the areas covered by the profiles 1, 2, 4 and 6, with a predominance of surface and groundwater resistivity anomalies, was described in other studies suggesting leachate migration [54], and groundwater contamination [7], mainly in areas surrounding non-isolated dumps where leachate can freely circulate through adjacent lithologies and subsequently affecting the vadose zone and groundwater [55]. Surface circulation and leachate infiltration are well evidenced in profiles 1, 2, 4 and 6, by surface and subsurface resistive anomalies, indicative of contamination [56].
In the area covered by profiles 1 (in the north), 2 and 4, continuous anomalies from surface to groundwater were noted, described as lithological migration bands of leachate to groundwater [57,58]. The area transacted by profile 6, besides showing an extensive layer with low resistivities (<10.445 Ω.m), has been considered in similar studies as a saturated zone and groundwater under leachate influence [45,59]. In the north of the dump, two localized points of resistive anomalies were identified as “hot spots” [60,61] resulting from vertical migration and localized accumulation of contaminants Feng et al. [62], and may be associated with the confined aquifer system, described in this zone as quite vulnerable to contamination given its proximity to the surface and sandy characteristics of the vadose zone [26].
The electrical resistivity data of the areas covered by profiles 3 and 5 were characterized by high resistivities, and associated with low contaminant infiltration capacity [13], given high surface compaction [63]. The area transacted by profile 3 is located far from the waste dump (>350 m), revealing that contaminants may not be reaching this area. Morita et al. [64] and Touzani et al. [9] demonstrated that a resistivity increase away from dumpsites represents a significant decrease in contamination due to the attenuating role of soils and groundwater. Groundwater at great depths in the area covered by profiles 1, 3 and 5 has been described in similar studies as a determinant of low contamination risk [18,65], which partly explains the low DRASTIC index in these areas. Paul et al. [53] and Boumaiza et al. [66] mentioned that the depth of groundwater and the characteristics of the infiltration zone are the most important factors determining the DRASTIC risk.
Gemail et al. [13], Shah et al. [15] and Nasri et al. [67] integrated electrical conductivity and DRASTIC data and concluded that areas with the highest DRASTIC index around dumps, generally exhibit low electrical resistivity associated with the migration of contamination through adjacent lithologies that may subsequently reach groundwater.
The spatial projection of the Vulnerability Index in the surroundings of the Hulene-B dump was revealed to be higher to the east, southwest and northwest of the dump, with high and transient relief, and lower to the south and west of the dump with low elevation, except for the southern area which is transient (Figure 7). Tan et al. [68] and Blarasin et al. [69] have reported that contamination of the upper levels of water tables leads to the dispersion of contaminants to larger areas.
The combination of electrical resistivity data for the assessment of groundwater vulnerability indices is an important tool for DRASTIC factors assessment, such as: groundwater depth, and intrinsic characteristics of the vadose zone. The modification of the “soil” factor in the original DRASTIC by the “distance between the anomalous surface layer and groundwater” is important in areas with potential contaminant migration to groundwater, as well as in studies aiming to outline remediation measures in areas of groundwater contamination flow.
Measured groundwater depth in the northern well (WN) was 6.5 m, and the southern well (WS) was 5.1 m similar to the electrical resistivity model (Table 4). However, The WS location was further south of the profile 4 area and results showed that groundwater levels tended to be more at the surface when approaching intradunar depression. Groundwater pH and PO43− was 6.1, 1.33 mg/L in WS and, 8.4 and 0.43 mg/L, respectively. Phosphate results were above the natural groundwater reference value of 0.005 to 0.05 mg/L [70]. Previous studies suggested that active waste dumps have a phosphate production of 1–100 mg/L, which can be incorporated into groundwater by leaching [71,72]. The prolonged consumption of water contaminated with high levels of phosphates can damage blood vessels, damage kidneys, cause osteoporosis and induce aging processes [73].

5. Conclusions

In this study, the combination of electrical resistivity and modified DRASTIC models was effective in describing the hydrogeological particularities, estimating in detail groundwater vulnerability, and identifying areas of possible leachate migration into groundwater in the surroundings of the Hulene-B dump. Areas covered by profiles 1 (north), 2, 4 and 6 showed strong indications of possible groundwater contamination, with a modified DRASTIC index which was very high (169–174) due to the proximity of groundwater to the contaminating surface (dump) and the connection of continuous anomalous layers from the surface to the aquifers. In the area of profiles 3 and 5 the index was low (91–96) due to the strong resistivity of the surface layers and the high depth at which groundwater was detected (>40 m).
The overall value of the DRASTIC modified index for the surrounding area was estimated at 146 representing a medium overall vulnerability. However, a higher vulnerability index in areas covered by profiles 1, 2, 4 and 6, given their relatively higher altitude (2 and 6), suggested groundwater contamination by horizontal dilution. Studies were underway to assess areas of suspected vertical migration of leachate by chemical analysis as well as groundwater. Groundwater depth local validation data was similar to the electrical resistivity model. Groundwater contamination risk identified by the modified DRASTIC vulnerability index was confirmed by high levels of phosphates in groundwater samples studied.
Several challenges remain for further studies, such as quantitative studies to validate areas of leachate migration that continuously connect to groundwater in areas covered by profiles 2, 4 and 6 and chemical analysis of surrounding wells water, and contamination studies of surrounding soils at different depths, especially in areas with suspected contaminant migration.

Supplementary Materials

The following supporting information can be downloaded at: https://www.mdpi.com/article/10.3390/w14111746/s1, Figure S1: Sampling and chemical analysis of well water (a) Water collection—South well (b) Result of phosphate analysis —North well; (c) Chemical analysis process (d) South well.

Author Contributions

Methodology, B.B. and F.R.; validation, B.B., C.C. and F.R.; formal analysis, C.C. and F.R.; writing—original draft pr appendix eparation, B.B.; writing—review and editing, B.B., C.C. and F.R.; supervision, F.R. and C.C. All authors have read and agreed to the published version of the manuscript.

Funding

This work was supported by GeoBioTec (UIDB/04035/2020) Research Center, funded by FEDER funds through the Operational Program Competitiveness Factors COMPETE and by National funds through FCT. First author acknowledges grants from the Portuguese Institute Camões and FNI (Investigation National Fund—Mozambique).

Data Availability Statement

Not applicable.

Conflicts of Interest

The authors declare no conflict of interest.

References

  1. González-Arqueros, M.L.; Domínguez-Vázquez, G.; Alfaro-Cuevas-Villanueva, R.; Israde-Alcántara, I.; Buenrostro-Delgado, O. Hazardous solid waste confined in closed dump of Morelia: An urgent environmental liability to attend in developing countries. Sustainability 2021, 13, 2557. [Google Scholar] [CrossRef]
  2. Rathi, B.S.; Kumar, P.S. Critical review on hazardous pollutants in water environment: Occurrence, monitoring, fate, removal technologies and risk assessment. Sci. Total Environ. 2021, 797, 149134. [Google Scholar] [CrossRef] [PubMed]
  3. Boufekane, A.; Yahiaoui, S.; Meddi, H.; Meddi, M.; Busico, G. Modified DRASTIC index model for groundwater vulnerability mapping using geostatistic methods and GIS in the Mitidja plain area (Algeria). Environ. Forensics 2021, 1–18. [Google Scholar] [CrossRef]
  4. Saranya, T.; Saravanan, S. A comparative analysis on groundwater vulnerability models—Fuzzy DRASTIC and fuzzy DRASTIC-L. Environ. Sci. Pollut. Res. 2021, 1–15. [Google Scholar] [CrossRef] [PubMed]
  5. Sresto, M.A.; Siddika, S.; Haque, M.N.; Saroar, M. Groundwater vulnerability assessment in Khulna district of Bangladesh by integrating fuzzy algorithm and DRASTIC (DRASTIC-L) model. Model. Earth Syst. Environ. 2021, 1–15. [Google Scholar] [CrossRef]
  6. Ghosh, R.; Sutradhar, S.; Mondal, P.; Das, N. Application of DRASTIC model for assessing groundwater vulnerability: A study on Birbhum district, West Bengal, India. Model. Earth Syst. Environ. 2021, 7, 1225–1239. [Google Scholar] [CrossRef]
  7. El Mouine, Y.; El Hamdi, A.; Morarech, M.; Kacimi, I.; Touzani, M.; Mohsine, I.; Tiouiouine, A.; Ouardi, J.; Zouahri, A.; Yachou, H.; et al. Landfill pollution plume survey in the Moroccan Tadla using spontaneous potential. Water 2021, 13, 910. [Google Scholar] [CrossRef]
  8. Kayode, J.S.; Arifin, M.H.; Nawawi, M. Characterization of a proposed quarry site using multi-electrode electrical resistivity tomography. Sains Malays. 2019, 48, 945–963. [Google Scholar] [CrossRef]
  9. Touzani, M.; Mohsine, I.; Ouardi, J.; Kacimi, I.; Morarech, M.; El Bahajji, M.H.; Bouramtane, T.; Tiouiouine, A.; Yameogo, S.; El Mahrad, B. Mapping the pollution plume using the self-potential geophysical method: Case of Oum Azza Landfill, Rabat, Morocco. Water 2021, 13, 961. [Google Scholar] [CrossRef]
  10. Zhang, J.; Zhang, J.; Xing, B.; Liu, G.D.; Liang, Y. Study on the effect of municipal solid landfills on groundwater by combining the models of variable leakage rate, leachate concentration, and contaminant solute transport. J. Environ. Manag. 2021, 292, 112815. [Google Scholar] [CrossRef]
  11. Mepaiyeda, S.; Madi, K.; Gwavava, O.; Baiyegunhi, C. Geological and geophysical assessment of groundwater contamination at the Roundhill landfill site, Berlin, Eastern Cape, South Africa. Heliyon 2020, 6, e04249. [Google Scholar] [CrossRef] [PubMed]
  12. Aller, G.; Bennett, L.; Lehr, T.; Petty, J.H.; Hackett, R.J. DRASTIC: A Standardized Method for Evaluating Ground Water Pollution Potential Using Hydrogeologic Settings; USEPA Report 600/2-87/035; U.S. Environmental Protection Agency: Washington, DC, USA, 1987.
  13. Gemail, K.S.; El Alfy, M.; Ghoneim, M.F.; Shishtawy, A.M.; El-Bary, M.A. Comparison of DRASTIC and DC resistivity modeling for assessing aquifer vulnerability in the central Nile Delta, Egypt. Environ. Earth Sci. 2017, 76, 350. [Google Scholar] [CrossRef]
  14. Voudouris, K.; Kazakis, N. Groundwater quality and groundwater vulnerability assessment. Environments 2021, 8, 100. [Google Scholar] [CrossRef]
  15. Shah, S.H.I.A.; Yan, J.; Ullah, I.; Aslam, B.; Tariq, A.; Zhang, L.; Mumtaz, F. Classification of aquifer vulnerability by using the DRASTIC index and geo-electrical techniques. Water 2021, 13, 2144. [Google Scholar] [CrossRef]
  16. Arowoogun, K.I.; Osinowo, O.O. 3D resistivity model of 1D vertical electrical sounding (VES) data for groundwater potential and aquifer protective capacity assessment: A case study. Model. Earth Syst. Environ. 2021, 8, 2615–2626. [Google Scholar] [CrossRef]
  17. Dhakate, R.; Mogali, N.J.; Modi, D. Characterization of proposed waste disposal site of granite quarry pits near Hyderabad using hydro-geophysical and groundwater modeling studies. Environ. Earth Sci. 2021, 80, 516. [Google Scholar] [CrossRef]
  18. George, N.J. Geo-electrically and hydrogeologically derived vulnerability assessments of aquifer resources in the hinterland of parts of Akwa Ibom State, Nigeria. Solid Earth Sci. 2021, 6, 70–79. [Google Scholar] [CrossRef]
  19. Islami, N.; Irianti, M.; Fakhruddin, F.; Azhar, A.; Nor, M. Application of geoelectrical resistivity method for the assessment of shallow aquifer quality in landfill areas. Environ. Monit. Assess. 2020, 192, 606. [Google Scholar] [CrossRef]
  20. El Naqa, A. Aquifer vulnerability assessment using the DRASTIC model at Russeifa landfill, northeast Jordan. Environ. Geol. 2004, 47, 51–62. [Google Scholar] [CrossRef]
  21. Vosoogh, A.; Baghvand, A.; Karbassi, A.; Nasrabadi, T. Landfill site selection using pollution potential zoning of aquifers by modified DRASTIC method: Case study in Northeast Iran. Iran. J. Sci. Technol. Trans. Civ. Eng. 2017, 41, 229–239. [Google Scholar] [CrossRef]
  22. Santhosh, L.G.; Sivakumar Babu, G.L. Landfill site selection based on reliability concepts using the DRASTIC method and AHP integrated with GIS—A case study of Bengaluru city, India. Georisk 2018, 9518, 234–252. [Google Scholar] [CrossRef]
  23. Abad, P.M.S.; Pazira, E.; Abadi, M.H.M. Application AHP-PROMETHEE technic for landfill site selection on based assessment of aquifers vulnerability to pollution. Iran. J. Sci. Technol. Trans. Civ. Eng. 2021, 45, 1011. [Google Scholar] [CrossRef]
  24. Majolagbe, A.O.; Adeyi, A.A.; Osibanjo, O. Vulnerability assessment of groundwater pollution in the vicinity of an active dumpsite (Olusosun), Lagos, Nigeria. Chem. Int. 2016, 2, 232–241. [Google Scholar]
  25. Nogueira, G.; Stigter, T.Y.; Zhou, Y.; Mussa, F.; Juizo, D. Understanding groundwater salinization mechanisms to secure freshwater resources in the water-scarce city of Maputo, Mozambique. Sci. Total Environ. 2019, 661, 723–736. [Google Scholar] [CrossRef] [PubMed]
  26. Cendón, D.I.; Haldorsen, S.; Chen, J.; Hankin, S.; Nogueira, G.; Momade, F.; Achimo, M.; Muiuane, E.; Mugabe, J.; Stigter, T.Y. Hydrogeochemical aquifer characterization and its implication for groundwater development in the Maputo district, Mozambique. Quat. Int. 2019, 547, 113–126. [Google Scholar] [CrossRef]
  27. Bernardo, B.; Candeias, C.; Rocha, F. Characterization of the dynamics of leachate contamination plumes in the surroundings of the Hulene-B waste dump in Maputo, Mozambique. Environments 2022, 9, 19. [Google Scholar] [CrossRef]
  28. Muchimbane, A.B.D. Estudo dos Indicadores da Contaminação das Aguas Subterrâneas por Sistemas de Saneamento in Situ–Distrito Urbano 4, Cidade de Maputo, Moçambique. Master’s Thesis, University of São Paulo, Instituto de Geociências, São Paulo, Brasil, 2010. [Google Scholar] [CrossRef]
  29. Serra, C. Da Problemática Ambiental à Mudança: Rumo à Um Mundo Melhor; Editora Escolar: Maputo, Mozambique, 2012; ISBN 9789896700300. [Google Scholar]
  30. INE (Instituto Nacional de Estatistica). Boletim de Estatísticas Demográficas e Sociais, Maputo Cidade 2019. Available online: http://www.ine.gov.mz/estatisticas/estatisticas-demograficas-e-indicadores-sociais/boletim-de-indicadores-demograficos-22-de-julho-de-2020.pdf/at_download/file (accessed on 10 January 2022).
  31. VOA. Desabamento de Lixeira Deixa 17 Mortos em Maputo. Voice of America News. Available online: https://www.voaportugues.com/a/desabamento-lixeira-17-mortos-maputo/4260624.html (accessed on 30 September 2021).
  32. Ferrão, D.A.G. Evaluation of Removal and Disposal of Solid Waste in Maputo City, Mozambique. Master’s Thesis, University of Cape Town, Cape Town, South Africa, 2006. Available online: http://hdl.handle.net/11427/4851 (accessed on 10 August 2021).
  33. Sarmento, L.; Tokai, A.; Hanashima, A. Analyzing the structure of barriers to municipal solid waste management policy planning in Maputo city, Mozambique. Environ. Dev. 2015, 16, 76–89. [Google Scholar] [CrossRef]
  34. Matsinhe, F.O.; Paulo, M. Estudo etnográfico sobre os catadores de lixo da lixeira de hulene (Maputo). Cad. Afr. Contemp. 2020, 3. [Google Scholar]
  35. Palalane, J.; Segala, I.; Opressa, I. Urbanização e Desenvolvimento Municipal em Moçambique: Gestão de Resíduos Sólidos; Instituto Brasileiro de Administração Municipal, Área de Desenvolvimento Urbano e Meio Ambiente: Rio de Janeiro, RJ, Brazil, 2008; p. 12. Available online: https://www.scribd.com/document/419123335/Gestao-de-Residuos-Solidos-Em-Mocambique (accessed on 7 August 2021).
  36. Vicente, E.M. Aspects of the Enginering Geologic of Maputo City. Ph.D. Thesis, School of Agricultural, Earth and Environmental Sciences, Pietermaritzburg. Soth Africa, 2011; pp. 22–38. Available online: http://hdl.handle.net/10413/8078 (accessed on 10 January 2022).
  37. Vicente, E.M.; Jermy, C.A.; Schreiner, H.D. Urban geology of Maputo, Mocambique. Geol. Soc. 2006, 338, 1–13. Available online: https://citeseerx.ist.psu.edu/viewdoc/download?doi=10.1.1.606.7220&rep=rep1&type=pdf (accessed on 3 January 2022).
  38. Momade, J.T.; Ferrara, F.J.; Oliveira, M. Notícia Explicativa da Carta Geológica 2532 Maputo; Escala: Maputo, Mozambique, 1996. (In Portuguese) [Google Scholar]
  39. CIAT. Climate-Smart Agriculture in Mozambique; International Center for Tropical Agriculture: Cali, Colombia, 2017; pp. 1–25. [Google Scholar]
  40. Dos Muchangos, A. Paisagens e Regiões Naturais, Maputo; Editora Escolar: Lisboa, Maputo, 1999; pp. 5–163. (In Portuguese) [Google Scholar]
  41. Koda, E.; Tkaczyk, A.; Lech, M.; Osiński, P. Application of electrical resistivity data sets for the evaluation of the pollution concentration level within landfill subsoil. Appl. Sci. 2017, 7, 262. [Google Scholar] [CrossRef]
  42. Lau, A.M.P.; Ferreira, F.J.F.; Stevanato, R.; da Rosa Filho, E.F. Geophysical and physicochemical investigations of an area contaminated by tannery waste: A case study from southern Brazil. Environ. Earth Sci. 2019, 78, 517. [Google Scholar] [CrossRef]
  43. Akhtar, J.; Sana, A.; Tauseef, S.M.; Chellaiah, G.; Kaliyaperumal, P.; Sarkar, H.; Ayyamperumal, R. Evaluating the groundwater potential of Wadi Al-Jizi, Sultanate of Oman, by integrating remote sensing and GIS techniques. Environ. Sci. Pollut. Res. 2022, 1–12. [Google Scholar] [CrossRef] [PubMed]
  44. Bernardo, B.; Candeias, C.; Rocha, F. Application of geophysics in geo-environmental diagnosis on the surroundings of the hulene-b waste dump, Maputo, Mozambique. J. Afr. Earth Sci. 2022, 185, 104415. [Google Scholar] [CrossRef]
  45. Adamo, N.; Al-Ansari, N.; Sissakian, V.; Laue, J.; Knutsson, S. Geophysical methods and their applications in dam safety monitoring. J. Earth Sci. Geotech. Eng. 2020, 11, 291–345. [Google Scholar] [CrossRef]
  46. Geotomo. RES2DINV ver. 3.59—Rapid 2-D Resistivity & IP Inversion using the Least-Squares Method Wenner, Dipole-Dipole, Inline Pole-Pole, Pole-Dipole, Equatorial Dipole-Dipole, Offset Pole-Dipole, Wenner-Schlumberger, Gradient and Non-Conventional Arrays, 2010, 1–148. Available online: http://epsc.wustl.edu/~epsc454/instruction-sheets/Res2dinv03.59.pdf (accessed on 10 January 2022).
  47. Asfaw, D.; Mengistu, D. Modeling megech watershed aquifer vulnerability to pollution using modified DRASTIC model for sustainable groundwater management, Northwestern Ethiopia. Groundw. Sustain. Dev. 2020, 11, 100375. [Google Scholar] [CrossRef]
  48. Anshumala, K.; Shukla, J.P.; Patel, S.S.; Singh, A. Assessment of groundwater vulnerability zone in mandideep industrial area using DRASTIC model. J. Geol. Soc. India 2021, 97, 1080–1086. [Google Scholar] [CrossRef]
  49. Hosseini, M.; Saremi, A. Assessment and estimating groundwater vulnerability to pollution using a modified DRASTIC and GODS models (Case study: Malayer plain of Iran). Civ. Eng. J. 2018, 4, 433. [Google Scholar] [CrossRef]
  50. Kozłowski, M.; Sojka, M. Applying a modified DRASTIC model to assess groundwater vulnerability to pollution: A case study in Central Poland. Pol. J. Environ. Stud. 2019, 28, 1223–1231. [Google Scholar] [CrossRef]
  51. Hasan, M.A.; Ahmad, S.; Mohammed, T. Groundwater contamination by hazardous wastes. Arab. J. Sci. Eng. 2021, 46, 4191–4212. [Google Scholar] [CrossRef]
  52. Ersoy, A.; Gültekin, F. DRASTIC-based methodology for assessing groundwater vulnerability in the Gümüşhacıköy and Merzifon basin (Amasya, Turkey). Earth Sci. Res. J. 2013, 17, 33–40. Available online: https://www.scielo.org.co/scielo.php?pid=S1794-61902013000100006&script=sci_arttext&tlng=en (accessed on 15 January 2022).
  53. Paul, S.; Surabhi, C. An investigation of groundwater vulnerability in the North 24 parganas district using DRASTIC and hybrid-DRASTIC models: A case study. Environ. Adv. 2021, 5, 100093. [Google Scholar] [CrossRef]
  54. Parvin, F.; Tareq, S.M. Impact of landfill leachate contamination on surface and groundwater of Bangladesh: A systematic review and possible public health risks assessment. Appl. Water Sci. 2021, 11, 100. [Google Scholar] [CrossRef] [PubMed]
  55. Wysocka, M.E.; Zabielska-Adamska, K. Impact of Protective Barriers on Groundwater Quality. In Proceedings of the 10th International Conference: Environmental Engineering, Vilnius, Lithuania, 27–28 April 2017. [Google Scholar] [CrossRef]
  56. Netto, L.G.; Filho, W.M.; Moreira, C.A.; di Donato, F.T.; Helene, L.P.I. Delineation of necroleachate pathways using electrical resistivity tomography (ERT): Case study on a cemetery in Brazil. Environ. Chall. 2021, 5, 100344. [Google Scholar] [CrossRef]
  57. Yap, C.K.; Chew, W.; Al-Mutairi, K.A.; Nulit, R.; Ibrahim, M.H.; Wong, K.W.; Bakhtiari, A.R.; Sharifinia, M.; Ismail, M.S.; Leong, W.J.; et al. Assessments of the ecological and health risks of potentially toxic metals in the topsoils of different land uses: A case study in Peninsular Malaysia. Biology 2022, 11, 2. [Google Scholar] [CrossRef]
  58. Chetri, J.K.; Reddy, K.R. Advancements in municipal solid waste landfill cover system: A review. J. Indian Inst. Sci. 2021, 1, 557–588. [Google Scholar] [CrossRef]
  59. Brahmi, S.; Baali, F.; Hadji, R.; Brahmi, S.; Hamad, A.; Rahal, O.; Zerrouki, H.; Saadali, B.; Hamed, Y. Assessment of groundwater and soil pollution by leachate using electrical resistivity and induced polarization imaging survey, case of Tebessa municipal landfill, NE Algeria. Arab. J. Geosci. 2021, 14, 249. [Google Scholar] [CrossRef]
  60. Ololade, O.O.; Mavimbela, S.; Oke, S.A.; Makhadi, R. Impact of leachate from northern landfill site in bloemfontein on water and soil quality: Implications for water and food security. Sustainability 2019, 11, 4238. [Google Scholar] [CrossRef] [Green Version]
  61. Marques, T.; Matias, M.S.; Silva, E.F.D.; Durães, N.; Patinha, C. Temporal and spatial groundwater contamination assessment using geophysical and hydrochemical methods: The industrial chemical complex of Estarreja (Portugal) case study. Appl. Sci. 2021, 11, 6732. [Google Scholar] [CrossRef]
  62. Feng, S.J.; Wu, S.J.; Fu, W.D.; Zheng, Q.T.; Zhang, X.L. Slope stability analysis of a landfill subjected to leachate recirculation and aeration considering bio-hydro coupled processes. Geoenvironment. Disasters 2021, 8, 29. [Google Scholar] [CrossRef]
  63. Udosen, N.I. Geo-electrical modeling of leachate contamination at a major waste disposal site in south-eastern Nigeria. Model Earth Syst. Environ. 2022, 8, 847–856. [Google Scholar] [CrossRef]
  64. Morita, A.K.M.; Ibelli-Biancoa, C.; Jamil, A.A.; Jaqueline, A.; Pelinson, C.N.; Nobrega, J.; Rosalema, L.M.P.; Leitea, C.M.C.; Niviadonski, L.M.; Manastella, C.; et al. Pollution threat to water and soil quality by dumpsites and non-sanitary landfills in Brazil: A review. Waste Manag. 2021, 131, 163–176. [Google Scholar] [CrossRef] [PubMed]
  65. Oke, S.A. Regional aquifer vulnerability and pollution sensitivity analysis of drastic application to Dahomey basin of Nigeria. Int. J. Environ. Res. Public Health 2020, 17, 2609. [Google Scholar] [CrossRef] [PubMed] [Green Version]
  66. Boumaiza, L.; Walter, J.; Chesnaux, R.; Brindha, K.; Elango, L. An operational methodology for determining relevant DRASTIC factors and their relative weights in the assessment of aquifer vulnerability to contamination. Environ. Earth Sci. 2021, 80, 281. [Google Scholar] [CrossRef]
  67. Nasri, G.; Hajji, S.; Aydi, W.; Boughariou, E.; Allouche, N.; Bouri, S. Water vulnerability of coastal aquifers using AHP and parametric models: Methodological overview and a case study assessment. Arab. J. Geosci. 2021, 14, 59. [Google Scholar] [CrossRef]
  68. Tan, M.; Wang, K.; Xu, Z.; Li, H.; Qu, J. Study on heavy metal contamination in high water table coal mining subsidence ponds that use different resource reutilization methods. Water 2020, 12, 3348. [Google Scholar] [CrossRef]
  69. Blarasin, M.; Matiatos, I.; Cabrera, A.; Lutri, V.; Giacobone, D.; Quinodoz, F.B. Characterization of groundwater dynamics and contamination in an unconfined aquifer using isotope techniques to evaluate domestic supply in an urban area. J. S. Am. Earth Sci. 2021, 110, 103360. [Google Scholar] [CrossRef]
  70. WHO. Guidelines for Drinking-Water Quality, 4th ed.; Incorporating the First Addendum; WHO: Geneva, Switzerland, 2017; ISBN 978-92-4-154995-0. [Google Scholar]
  71. Akinbile, C.O.; Yusoff, M.S. Environmental impact of leachate pollution on groundwater supplies in Akure, Nigeria. Int. J. Environ. Sci. Dev. 2011, 2, 81–86. [Google Scholar] [CrossRef]
  72. Pan, S.; Dixon, K.L.; Nawaz, T.; Rahman, A.; Selvaratnam, T. Evaluation of galdieria sulphuraria for nitrogen removal and biomass production from raw landfill leachate. Algal Res 2021, 54, 102183. [Google Scholar] [CrossRef]
  73. Isiuku, B.O.; Enyoh, C.E. Pollution and health risks assessment of nitrate and phosphate concentrations in water bodies in South Eastern, Nigeria. Environ. Adv. 2020, 2, 100018. [Google Scholar] [CrossRef]
Figure 1. Study Area (a) intra dune depression; and (b) Hulene-B waste dump.
Water 14 01746 g001
Figure 3. Electrical resistivity profiles and northern (WN) and southern (WS) wells studied, in the surroundings of the Hulene-B waste dump.
Water 14 01746 g003
Figure 4. Calibrated color scale showing the resistivity range of materials and their characteristics.
Water 14 01746 g004
Figure 5. Profiles of the variation of the electrical resistivity in the study area.
Water 14 01746 g005
Figure 6. Electrical resistivity values (minimum, maximum, mean, standard deviation Ω.m) and modified DRASTIC Index. Maximum value of profile 5 (477.1 Ω.m) was set to (200) to maintain the scale within the limits of the perceived index.
Water 14 01746 g006
Figure 7. Spatial projection of the modified DRASTIC in surroundings of the Hulene-B dump: dashed in white represents low vulnerability and in black high vulnerability.
Water 14 01746 g007
Table 1. DRASTIC parameters.
FactorInterval/CharacteristicsValue (r)Weight (w)
(D)
Groundwater depth (m)
0–1.5105
1.5–4.69
4.6–9.37
9.3–155
15–233
23–302
>301
(R)
Net recharge rate (mm/year)
0–5014
50–1003
100–1756
175–2508
>2509
(A)
Aquifer media
Sand73
(S)
Distance between the anomalous surface layer and groundwater
0–1.5102
1.5–4.69
4.6–9.37
9.3–155
15–233
23–302
>301
(T)
Terrain slope (%)
0–2101
2–69
6–125
12–183
>181
(I)
Vadose Zone
Sandstones4–85
Limestones, sandstones, and shales4–8
Sands and gravels with significant silt and clay content4–8
Sands8
(C)
Hydraulic conductivity (m/day)
1–4.113
4.1–12.22
12.2–28.54
28.5–40.76
40.7–81.58
>81.510
Table 2. Parameter values considered in the DRASTIC Index.
Characteristics of the Surroundings of the Waste DumpP1P2P3P4P5P6Mean
Depth of groundwater level454554554531.6
Recharge capacity32323232323232
Sands21212121212121
Distance of anomalous surface layer and groundwater202022022014
Plan, soft dune and interdune depression10510105108.3
Sands40402040204033.3
Hydraulic conductivity6666666
DRASTIC index:1741699617491174146.3
P—Profile.
Table 3. Mean, maximum, minimum, standard deviation of resistivity values (Ω.m) and DRASTIC index.
IDMinMaxMeanSDModified DRASTIC
P18.6442.3620.785.72174
P25.37119.120.229.31169
P310.1250.831.017.396
P46.9841.1918.14.64174
P51.04477.137.3531.8691
P63.0620749.232.78174
SD—standard deviation.
Table 4. Data validation of electrical resistivity and modified DRASTIC.
IDDepthpHRfD [70]PO43−RfD [70]
WS5.1 m6.16.5–8.51.33 mg/L0.005–0.05 mg/L
WN6.5 m8.40.43 mg/L
RfD—Natural reference value.
Publisher’s Note: MDPI stays neutral with regard to jurisdictional claims in published maps and institutional affiliations.

