
Dissolved Phosphorus Concentrations in Surface Runoff from Agricultural Land Based on Calcium–Acetate–Lactate Soluble Phosphorus Soil Contents


Department of Aquatic Environmental Engineering, Institute for Water and River Basin Management, Karlsruhe Institute of Technology (KIT), Gotthard-Franz-Str. 3, 76131 Karlsruhe, Germany
*
Author to whom correspondence should be addressed.
Water 2022, 14(11), 1742; https://doi.org/10.3390/w14111742
Submission received: 4 April 2022
/
Revised: 23 May 2022
/
Accepted: 26 May 2022
/
Published: 28 May 2022
(This article belongs to the Special Issue Monitoring, Modelling and Management of Water Quality II)
Abstract
:The input of phosphorus (P) into aquatic systems can result in eutrophication that might manifest in algal blooms and oxygen deficiency and, subsequently, in a poor ecological status. Substance emission modeling on a river basin scale can help to quantify phosphorus emissions into surface water bodies and to address mitigation measures. The prerequisite is that suitable input data are available. The purpose of this study is to develop a modeling approach that allows the prediction of realistic phosphorus concentrations in surface runoff. During large-scale artificial rain experiments at 23 agricultural sites, dissolved P concentrations in surface runoff and subsurface flow were measured. The characteristics of the experimental sites were investigated by taking and analyzing soil samples and requesting information on the management from the farmers. From the data collected, two linear models were derived. The first model allows the prediction of dissolved phosphorus concentration in surface runoff from PCAL soil content. Applying the second model, the obtained concentration in surface runoff can be transferred to a concentration in subsurface flow. The resulting approaches were derived from realistic field experiments and, for the first time, allow the direct prediction of dissolved phosphorus concentrations in surface runoff and, in a second step, also in subsurface flow from spatially distributed PCAL soil content data. Integrating these approaches into substance emission models can improve their accuracy and, subsequently, allows a better planning of measures for the reduction in phosphorus emissions into surface water bodies.
1. Introduction
The input of phosphorus (P) into aquatic systems can lead to a poor ecological status of surface waters and oceans and result in eutrophication that might manifest in algal blooms and oxygen deficiency. Therefore, the reduction in phosphorus emissions into surface waters is part of the EU Water Frame Directive [1], the Marine Strategy Framework Directive [2], and the HELCOM Baltic Sea Action Plan [3]. Important targets of European water policy are to reach a good chemical state of rivers and lakes and to reduce nutrient inputs to the sea for marine protection.
The Federal Environment Agency reports that the good ecological status according to the water frame directive with regard to the total phosphorus concentration was reached at only 43% of the water quality measurement stations in Germany in 2019 [4].
Because of measures in the past, such as the reduction in the phosphate content in detergents and the implementation of phosphate precipitation in waste water treatment plants, the total phosphorus emissions into German rivers were reduced from about 70,000 t a−1 to one-third since the beginning of the 1990s [5], and, subsequently, concentrations have fallen significantly [4,6,7,8]. However, further measures are necessary to reach a ”good status” of the rivers. By the decrease in the phosphorus emissions from waste water treatment plants, diffuse phosphorus emissions from agriculture have become more important. Soil erosion after heavy rainfall events is a relevant source for the input of phosphorus adsorbed into the soil. Dissolved phosphorus reaches the water bodies inter alia via surface runoff, groundwater, and drainages (cf. [9]). While the surface runoff was assumed not to be a relevant pathway for phosphorus emissions for a long time, in the meantime, many authors underline its importance [10,11,12].
To derive adequate measures for the further reduction in phosphorus emissions into surface water bodies, a spatially differentiated identification of relevant sources and pathways is essential. Therefore, the pathway-specific conceptual modeling of substance emissions on the river basin level can be a useful instrument for the further planning of measures. Common models that are based on this approach are MONERIS [13] and AGRUM-DE [14] for Germany or MODIFFUS 3.0 [15] for Switzerland. Within these models, the pathway usually referred to as “surface runoff” includes not only the actual surface runoff (overland flow) but also the fast-reacting subsurface flow that occurs quite near the surface (also referred to as preferential flow). Focusing on the pathway “phosphorus emissions via surface runoff”, AGRUM-DE [14] and MODIFFUS 3.0 [15] calculate the phosphorus emissions assuming a constant P concentration in the surface runoff. In MONERIS [13], this concentration is derived from the P accumulation that arises from a balance surplus of total phosphorus and is also not available in a high spatial resolution.
For the spatially differentiated implementation of measures, however, it would be preferable to obtain more precise model results by using spatial data of the P concentration in surface runoff instead of constant values. The most important parameter determining the P concentration in surface runoff is probably the solubility of soil phosphorus. In fact, relationships between soil phosphorus content and dissolved reactive phosphorus (DRP) in the surface runoff were found in many studies that were either performed as irrigation experiments within boxes or as plot experiments with artificial rainfall in the field [11,16,17,18,19,20,21,22,23,24,25,26,27]. In all the listed studies, the water-soluble phosphorus (WSP) of the soil was used to derive the relationship. Considering the process of water extracting soil phosphorus during rainfall events, this is quite obvious, but, unfortunately, the determination of water-soluble phosphorus is not established in Germany and, therefore, no spatial data are available. A firmly established method for the determination of plant-available phosphorus, and, subsequently, the determination of the P fertilizer requirement in Germany, is the CAL method [28], which uses calcium–acetate–lactate as the extractant for phosphorus from the soil. The idea of this method is to simulate weak organic acids used by plants for the extraction of phosphorus from the soil. As this method is applied for the determination of the P fertilizer requirement in several federal states of Germany, in these regions, data of the phosphorus content PCAL of the upper soil are available in a very high spatial resolution for different land use classes, such as arable land, pasture, vineyards, and fruits.
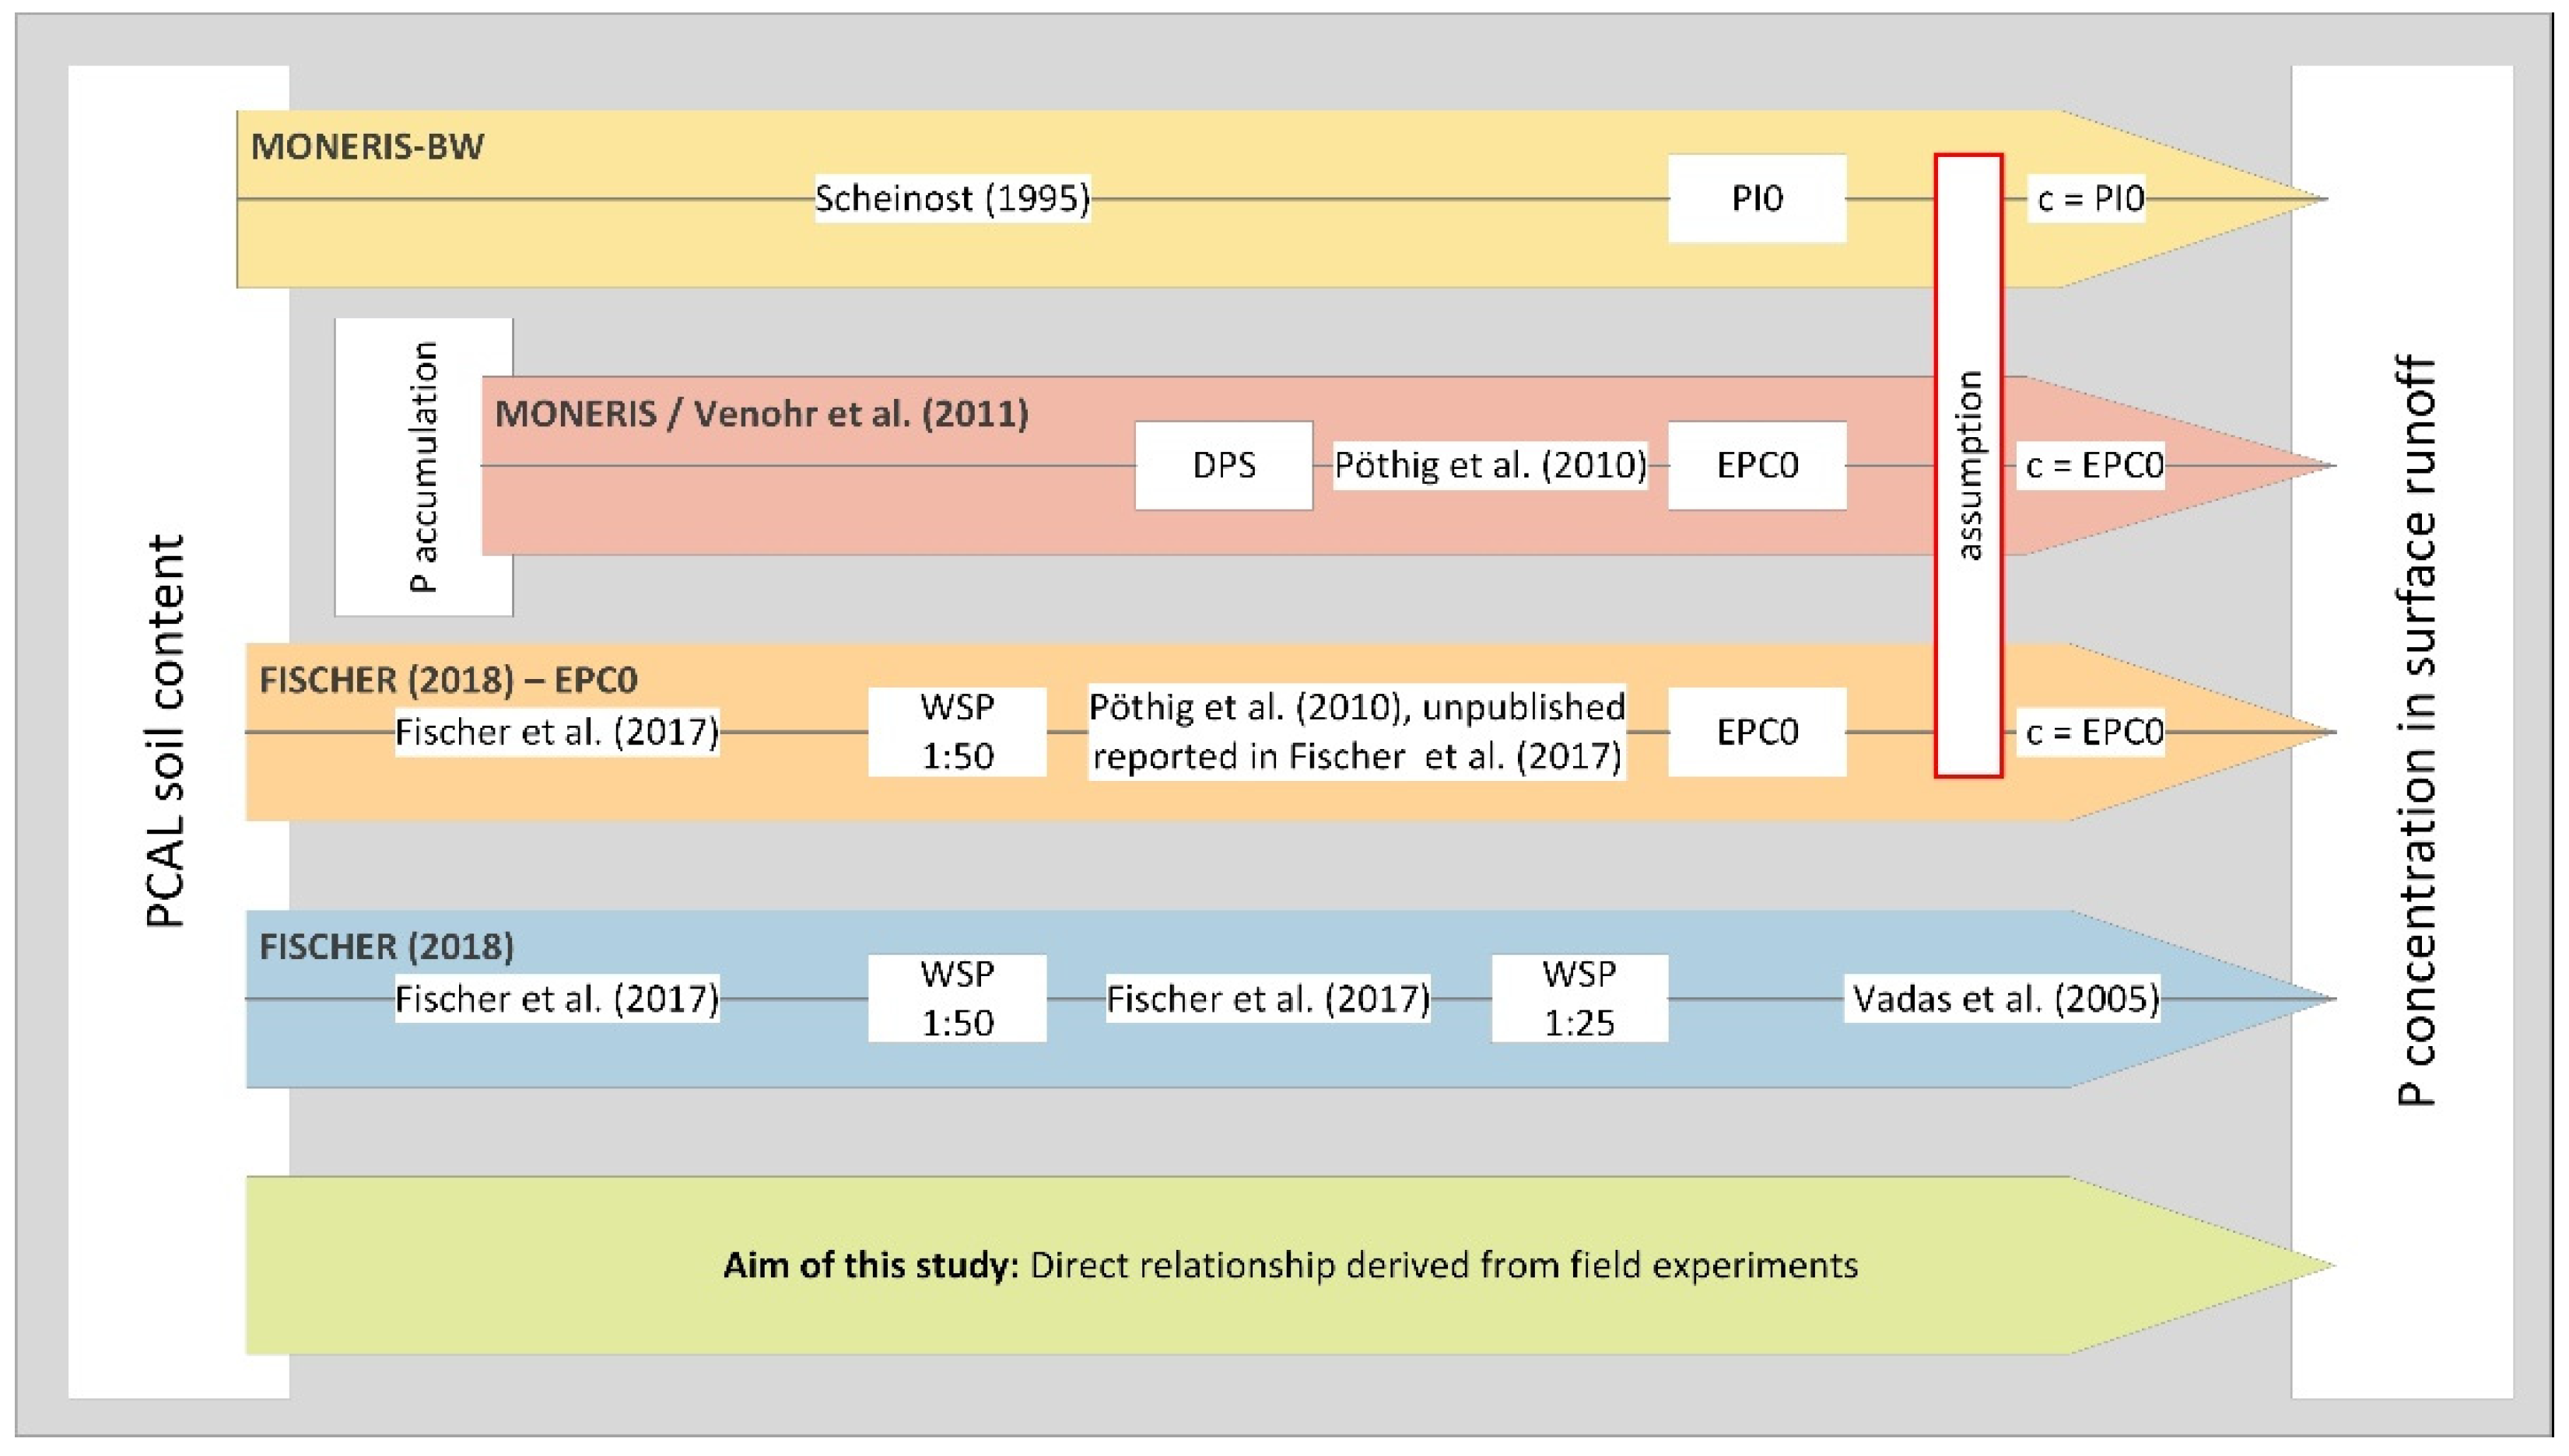
While the substance emission model MONERIS [13] uses the P accumulation to derive a phosphorus concentration in surface runoff for the modeling of emissions, in MONERIS-BW 2015 [29], which is a derivate of MONERIS for Baden-Wuerttemberg, and its earlier versions, PCAL soil contents are used. However, in both models, input data are converted into P equilibrium concentrations (referred to as EPC0, PI0) that are determined in lab sorption–desorption experiments and considered to comply with the dissolved P concentration in surface runoff. Instead of assuming the P equilibrium concentrations to correspond to the dissolved P concentrations in the surface runoff, Fischer [12] suggested to use three relationships in a row, converting PCAL into WSP first and, subsequently, into dissolved P concentrations in the surface runoff using a linear approach that was derived from field experiments (compare Figure 1). However, no direct correlation between the PCAL content of the soil and the dissolved phosphorus concentration in the surface runoff has been used in any of the substance emission models to date.
In the years 2016 and 2017, a study was conducted by Ries et al. [30,31] from the University of Freiburg in which the runoff reaction from extreme rainfall events was investigated with large-scale sprinkling experiments on 23 agricultural sites in the federal state of Baden-Wuerttemberg. Through cooperation, it was possible for us to carry out additional measurements within the given experiment arrangement. We used this possibility to generate a dataset containing, besides other parameters, both the PCAL content of the soil and dissolved phosphorus concentrations in the surface runoff generated by the sprinkling experiments. As explicated above, this dataset is of major interest for the estimation of phosphorus emissions via surface runoff from agricultural land using substance emission models.
The aim of this work is to evaluate this dataset and to derive a relationship between PCAL contents in the soil and dissolved phosphorus concentrations in surface runoff that can be used in different substance emission models in regions where the PCAL content is frequently measured (compare Figure 1). In addition, the influence of parameters other than PCAL and the possibility to predict the dissolved phosphorus concentration in subsurface flow will be examined.
2. Materials and Methods
2.1. Field Work
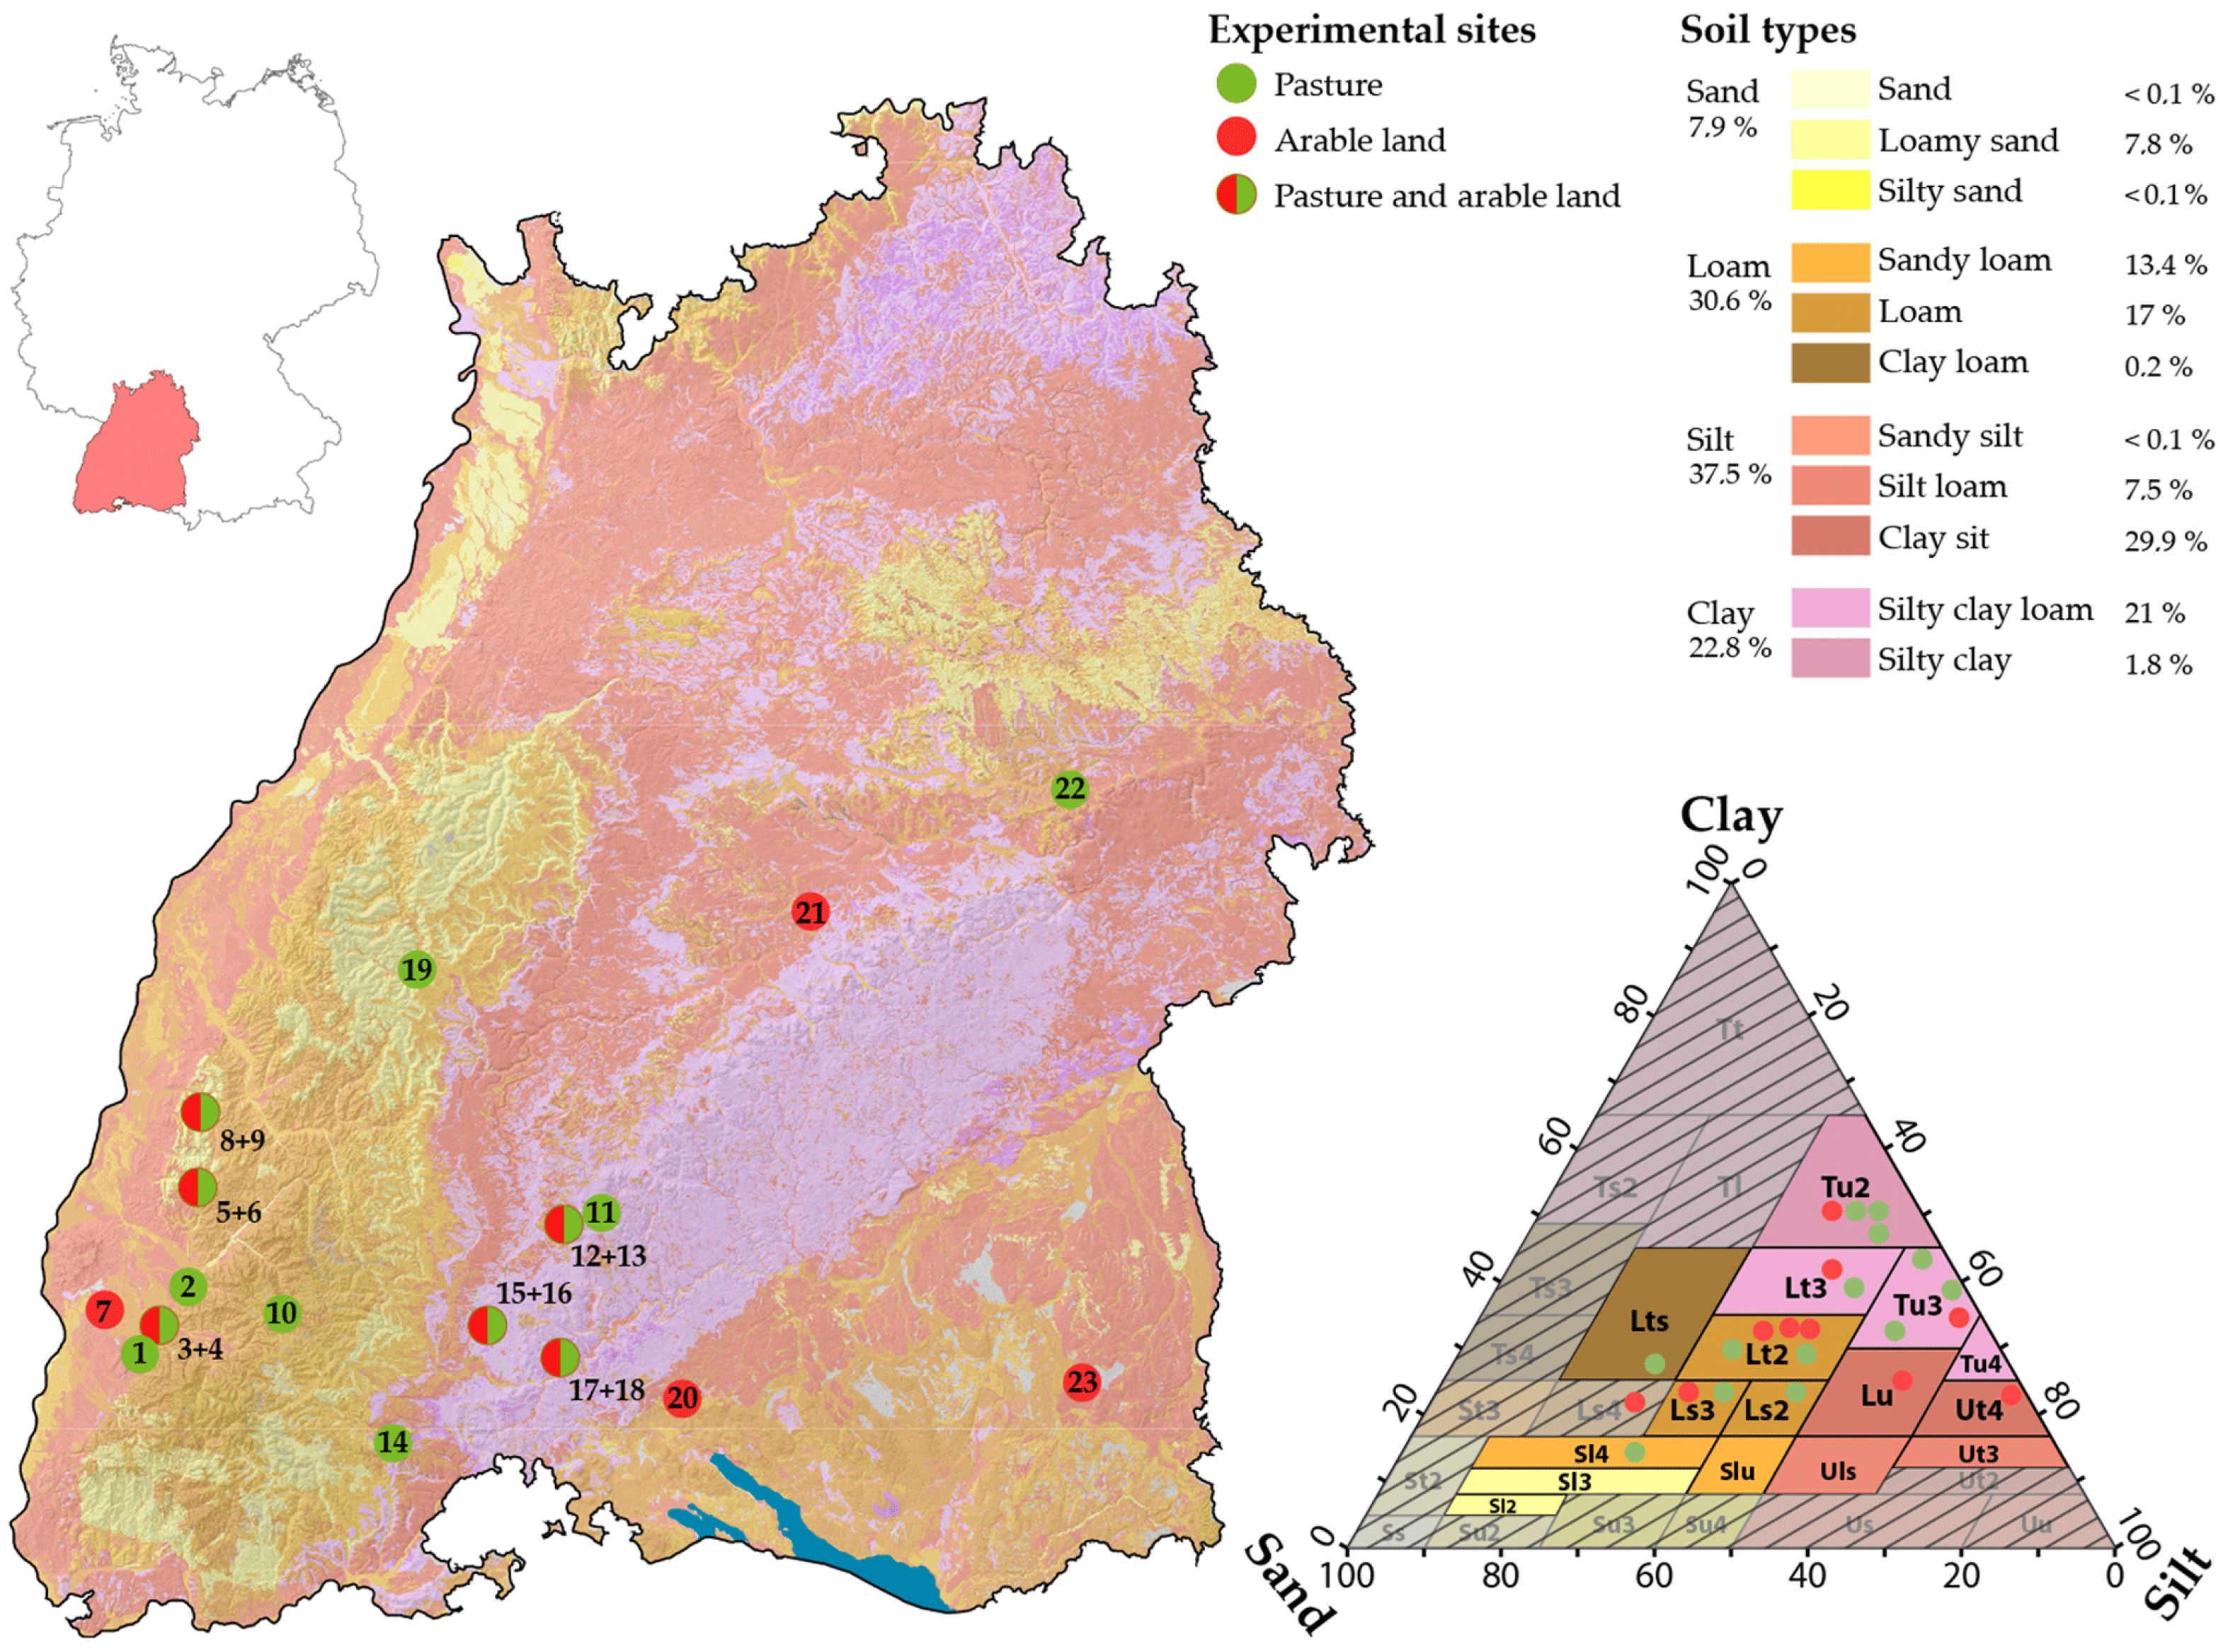
In a study conducted by Ries et al. from the University of Freiburg [30,31], the runoff generation during heavy rainfall events was investigated with artificial rainfall experiments at 23 agricultural sites (arable land and pasture) in the state of Baden-Wuerttemberg, representing a large variety of soils and slopes between 9% and 32%. In Figure 2 [31], Ries et al. show the locations of the experimental sites in a map and illustrate how soil types are distributed in Baden-Wuerttemberg. In a soil texture triangle, they illustrate how the different soil types occurring in Baden-Wuerttemberg were considered when selecting the locations for the experiments. The infrastructure of these ambitious experimental settings was used to generate further data providing information about nutrient concentration in the generated runoff.
2.1.1. Soil Sampling and Analysis
Prior to the irrigation experiments, on each site, one soil sample each of the upper and the lower horizon of the soil were taken. Based on the proceedings of the basic agricultural survey in Germany (“Landwirtschaftliche Grunduntersuchung”), soil samples of the upper horizons were taken at depths of 0–30 cm (arable land) or 0–10 cm (grassland) using a Pürckhauer earth drill. To prevent damage to the soil within the plot, the composite soil samples were taken within a band of 1 m width immediately around the plot area. Soil samples of the lower horizons were taken with a spade at a depth of 30–50 cm from different positions in a hole next to the plot that was dug for the installation of a soil moisture sensor.
All soil samples were cooled during the transport to the lab and air dried at 40 °C. After drying the samples, the soil material <2 mm was ground with a ball mill. These prepared samples were then analyzed for:
- Total phosphorus (TP) according to DIN EN ISO 6878 [36];
- Calcium–acetate–lactate-soluble phosphorus (PCAL) according to VDLUFA method A 6.2.1.1 [28], including a correction for soils with pH >7.1;
- Water-soluble phosphorus (WSP) was determined using a batch extraction test, in which 2 g soil and 100 mL distilled water were merged, shaken for 1 h, centrifuged, and filtered with a vacuum pump (0.45 µm). The filtrate was analyzed photometrically at 700 nm for ortho-phosphate according to DIN EN ISO 6878 [36];
- Granulometry by wet sieving following DIN ISO 11277 [37]. As the humus content of agricultural, non-arid soils is supposed to be <4%, the following steps of the method were omitted: (a) destruction of organic material using H2O2; (b) removal of soluble salts and gypsum by shaking with water; (c) elimination of ferric oxides and carbonates;
- Clay content using the pipet method according to Köhn/DIN ISO 11277 [37];
- Ca with an atomic absorption spectroscopy after an aqua regia digestion according to DIN EN 13346 [40];
- Carbonate (CO32−) volumetrically according to Scheibler/DIN EN ISO 10693 [41];
2.1.2. Interview with the Farmers
The farmers of the experimental sites were interviewed about the agricultural practices. For arable land, information on the last cultivated main fruit and the crop rotation during the last years were collected. Regarding the fertilization, the farmers were asked for date, kind, and quantity of the last fertilization in spring before harvesting the main fruit, but also for date, kind, and quantity of basic fertilizing. A further point of interest was the type and depth of soil cultivation during the period of the last cultivated main fruit. For pasture, information about mowing quantity and the date of the last mowing were collected. Concerning the fertilization, kind and quantity of the last fertilization were requested. Further interesting questions for pasture sites were whether they were used by cattle and, if so, at which time and how many animals per ha were pasturing. A further question raised was whether the field had been used as arable land in the past and, if yes, until when.
To be sure we obtained answers without excessively inconveniencing the farmers, we interviewed them directly. However, in many cases, this resulted in very rough or estimated information (e.g., the amount of fertilizer) that had to be “translated” and unified in numbers suited for use as parameters for the derivation of a model.
2.1.3. Experimental Setup
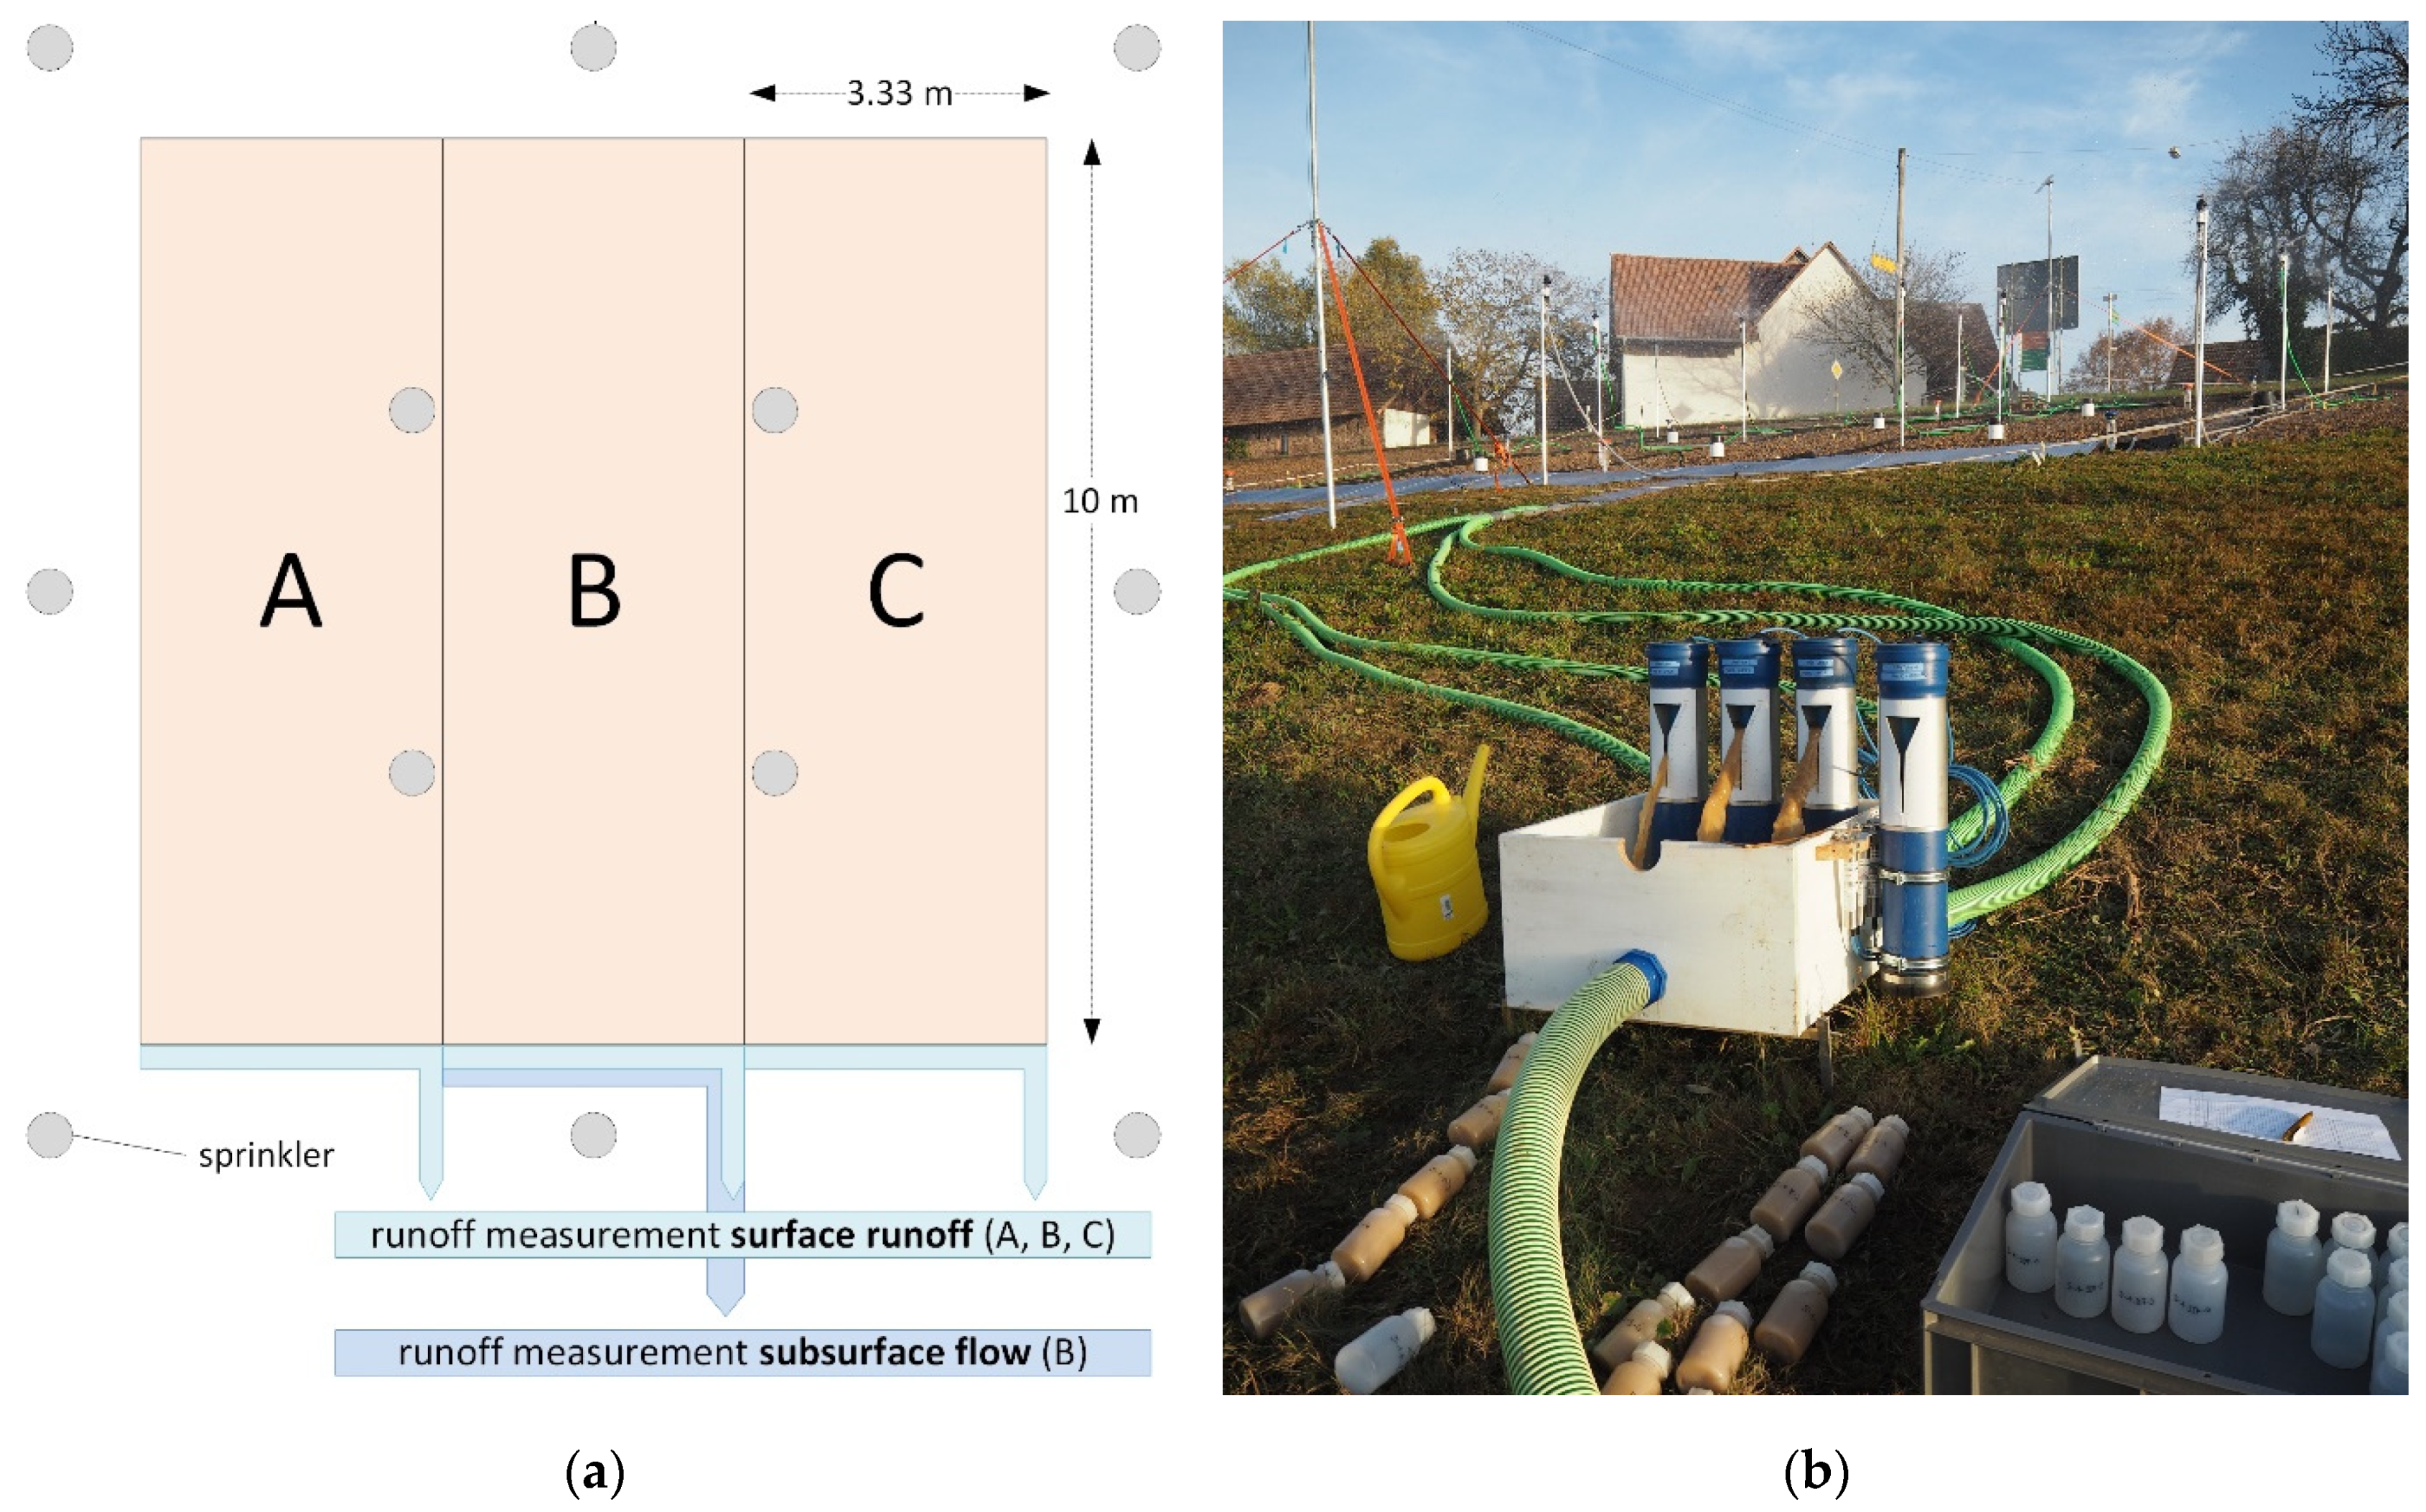
On each experimental site, an experimental plot of 10 m × 10 m was defined. It was divided into three subplots A, B, C 3.33 m in width with the purpose to obtain replicate measured values during the experiments. All borders around the plot and between the subplots were defined with plastic elements that were stuck into the soil to ensure that runoff did not flow across the plot boundaries. According to Figure 3a, twelve sprinklers were installed inside and around the plot to guarantee an equal distribution of the generated rainfall all over the plot. Below the plot, a trench was excavated and rain gutters installed inside to collect surface runoff (overland flow) from the three subplots A, B, and C. The gutters were covered with plastic elements to avoid the collection of rainfall in the gutters. In the middle region, below subplot B, the trench was excavated to a depth of 40 cm and coated with a drainage mat in order to collect subsurface flow from this subplot. Collected runoff from the subplots was transferred downwards in separate pipes and measured with upwelling Bernoulli tubes. The water inflow into the upwelling Bernoulli tube is at the bottom and water rises until it can leave the tube through a double trapezoid-shaped weir. The water level in the tube is measured continuously and can later be converted into runoff. More detailed information about the hydrological planning and setup of the experiments is provided by Ries et al. [30,31]. On each experimental site, six artificial rainfall events experiments were performed:
- 60 min; 100-year return period with 41–69 mm h−1 (dry preconditions)
- 60 min; 100-year return period with 41–69 mm h−1
- 30 min; 100-year return period with 80–113 mm h−1
- 15 min; 100-year return period with 108–173 mm h−1
- 180 min; “worst case” scenario with 46 mm h−1 (highest observed intensity ever in Baden-Württemberg for event of 180 min duration, cf. Ries et al. [31])
- 60 min; “worst case” scenario with 106 mm h−1 (highest observed intensity ever in Baden-Württemberg for event of 60 min duration, cf. Ries et al. [31])
2.1.4. Runoff Sampling and Analysis
Samples were taken during Events 1 and 2. These events represent the initial conditions, not altered by prior events. The intensities are reasonably low (41–69 mm h−1) and considered to be most suitable to represent mean annual conditions. In case that one of the scheduled events could not be sampled due to technical problems or the absence of runoff, Event 5 (180 min; 46 mm h−1) was preferably sampled instead due to its comparatively low intensity of 46 mm h−1.
During each sampled event, three surface runoff samples were taken, filtered in field (0.45 µm), and analyzed photometrically at 700 nm for ortho-phosphate [36]. The first surface runoff sample was taken directly when surface runoff started (0 min). The second sample was a runoff-proportional mixed sample (5, 10, 15, and 20 min after surface runoff started). A third sample was taken 25 min after start of the surface runoff.
In the subsurface flow (upper 30–50 cm of the soil), only one runoff-proportional mixed sample was taken and analyzed (5, 10, 15, and 20 min after the beginning of subsurface runoff).
To further obtain an impression whether concentrations change a great deal after many extreme rainfall events in a row, for the experiments from Site 9 on, additional samples of surface runoff (mixed samples from plots A, B, and C) and subsurface flow at the end of Event 5 (180 min) were taken.
2.2. Data Processing
2.2.1. Derivation of Representative Concentrations for Each Site
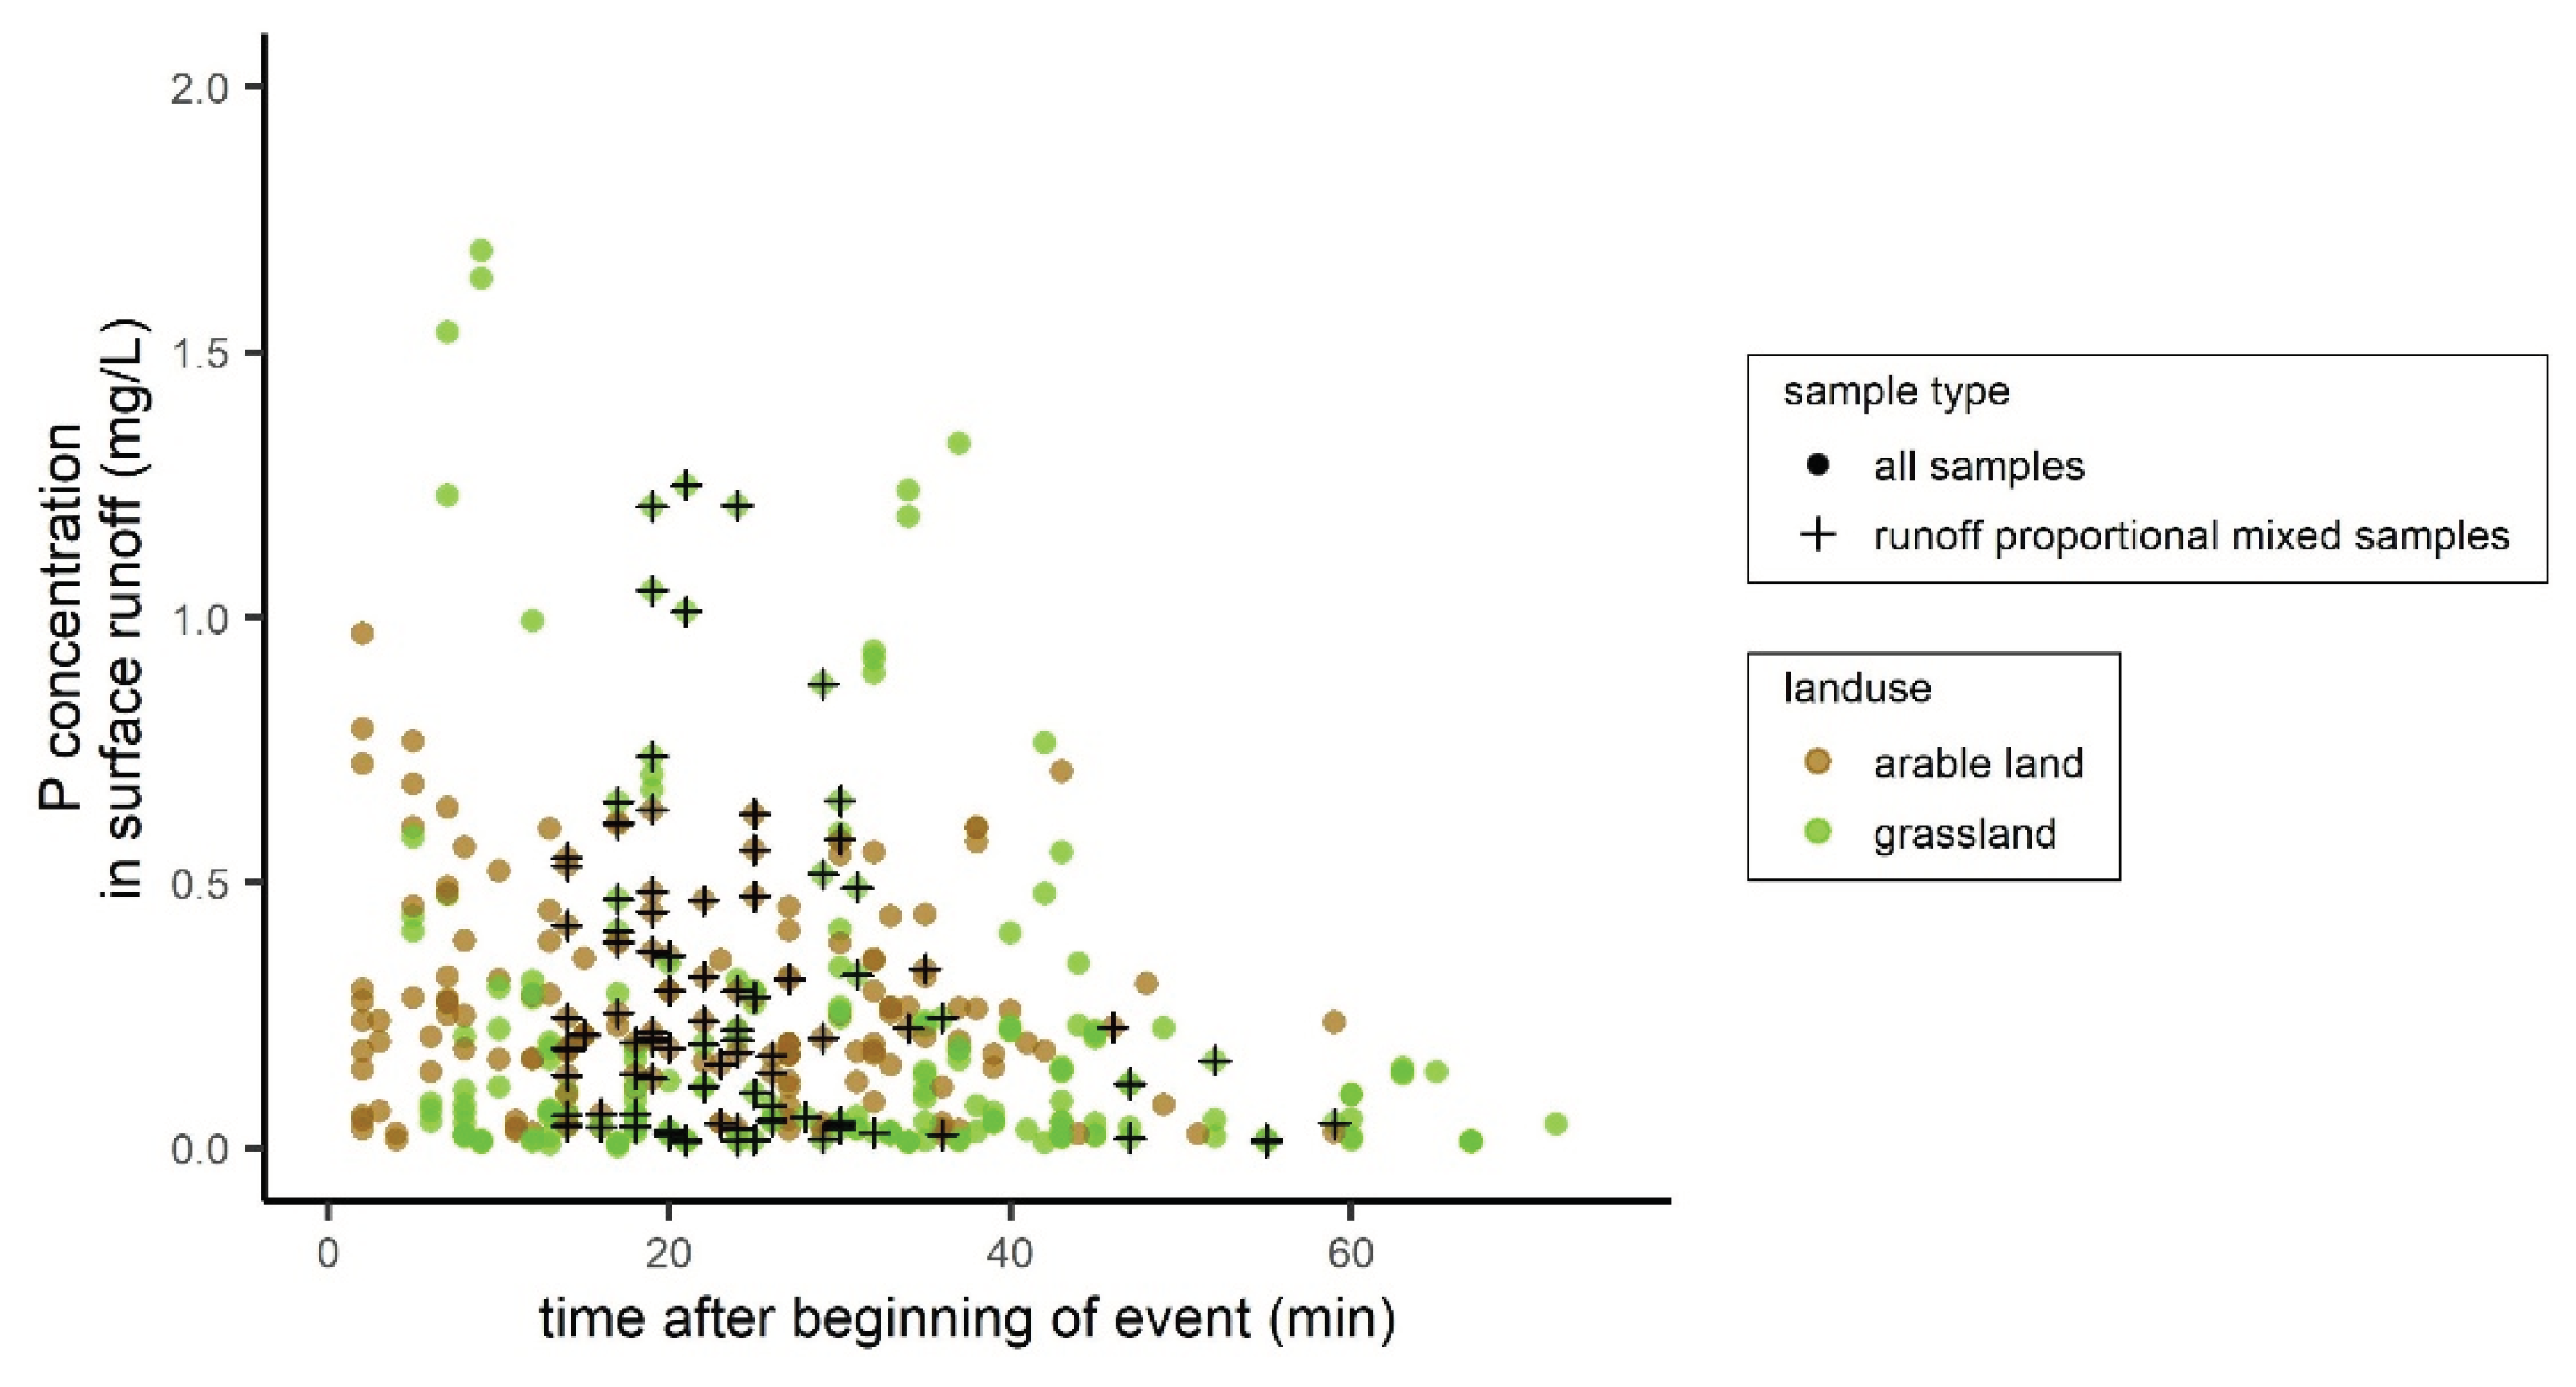
The phosphorus concentration in surface runoff is supposed to depend to a great extent on the P content of the soil but may, furthermore, be influenced, for instance, by the preconditions on the site before the rain event, the duration, and intensity of the event and the exact time of sampling during the event. Figure 4 illustrates the overall dataset of measured P concentrations in surface runoff at 0 min, mixed at 5/10/15/20 min and at 25 min after runoff beginning depending on the time after the beginning of a rain event. As runoff occurs delayed in comparison to the beginning of the rain event, the measured concentrations are widely distributed along the x-axis of the plot. There is no recognizable relation between sampling time and P concentration for either arable land or grassland. This applies to the individual samples as well as to the runoff-proportional mixed samples.
In order to assess which concentrations are representative of the experimental sites, this overall dataset of measured concentrations was analyzed as a whole and assessed from various perspectives. However in fact, with regard to a variation in the concentrations with time or among events, it was not possible to clearly point out any patterns or dependencies. One difficulty was that runoff was not generated during all events and, consequently, the sampled events vary among the experimental sites. For an analysis regarding the temporal variation in concentrations within one event, not enough measurements were available, and, especially, the sample that was directly taken when runoff occurred turned out to be quite prone to external influences, such as contamination, for example.
Therefore, the mean concentration of the six runoff-proportional mixed samples from subplots A, B, and C of both sampled events (normally either Events 1 and 2 or Events 2 and 5) represent a robust mean concentration for the experimental site and are listed in Appendix A, Table A1.
In contrast to the numerous concentration measurements in surface runoff, in subsurface flow during each investigated event, only one runoff-proportional mixed sample and, additionally, from Site 9 on, one sample at the end of Event 5 were taken. Following the data processing for surface runoff concentrations, the mean concentration of the two runoff-proportional mixed samples taken during the two investigated events is considered to be representative of subsurface flow (values listed in the upper part of Appendix A, Table A2).
2.2.2. Statistical Analysis
As the main goal of this study is the prediction of a robust mean phosphorus concentration in surface runoff from the PCAL soil content and other possible parameters, the dataset with derived representative phosphorus concentrations in surface runoff for the experimental sites was used for further statistical analyses.
In the first step, it was investigated whether the unrestricted use of the dataset (Appendix A, Table A1) with representative concentrations for further statistical analyses can be considered to be acceptable. Thereby, one grassland site (Site 22) with an extreme phosphorus concentration of 1.08 mg L−1 was identified. Data from the interviews with the farmers indicate that Site 22 can also be considered “extreme” in terms of fertilization as both the amount of fertilizer was high and it was only one month ago. Due to this fact, it seems to be reasonable not to consider this site for prediction of mean concentrations. However, during the following steps of the statistical analysis, it was also tested whether omitting this site can be justified from a statistical point of view.
For all statistical analyses in this paper, the software package “R” was used.
Several regression models have been considered in a pre-analysis, and it turned out that a simple linear regression best represents the field data. A simple linear regression analysis was performed to find out whether the P concentration in surface runoff can be predicted from the PCAL soil content only. Both the regression of all experimental sites and separate regression models for arable land and grassland were derived. Besides its extreme fertilization, the grassland site (Site 22) could be statistically identified as an outlier with regard to the measured P concentration of 1.08 mg L−1 in surface runoff. Including it in the regression analysis results in a poor linear model and a breach of conditions for a regression analysis. It, furthermore, shows that Site 22 is also a datapoint with a high influence on the course of the model (Cook’s distance criterion), especially when only considering grassland sites. Therefore, it was removed from the dataset and the final regression analysis was performed with the remaining data.
Besides the aspect of the influence of PCAL soil content and the land use, the influence of other parameters measured at the experimental sites on the P concentration in surface runoff was also examined in this study. By performing a correlation analysis between measured field parameters, six independent parameters showing a linear relationship with P concentration in surface runoff could be identified: PCAL soil content, total phosphorus content of the soil, pHCaCl2, clay content, amount of fertilizer, and time since last fertilization (compare Appendix A, Table A1). With respect to the potential applicability to modeling, the parameters pHCaCl2 and clay content could be interesting variables in a model due to the satisfying spatial data availability. Considering pHCaCl2 and clay content in addition to the PCAL soil content in a multivariate linear regression model did not result in substantially better models, it was, therefore, rejected for reasons of simplicity and transparency. The consideration of information on the fertilization of the experimental sites resulted in models with higher accuracy, but, due to the deficient data availability, a model using these parameters is not applicable. However, the influence of information on fertilization shows how sensitive the P concentration is to this parameter.
In addition to the prediction of P concentration in surface runoff, the prediction of the P concentration in subsurface flow was also investigated using the data listed in Appendix A, Table A2. Thereby, in accordance with the proceeding for surface runoff, it was initially examined whether a prediction of P concentrations in subsurface flow from the PCAL soil contents in the lower soil layer is possible with a simple linear regression model. In fact, a good model resulted from the dataset without Site 22 (which was eliminated for the reasons described above). However, as PCAL soil content is not regularly measured in the lower soil layer, this model is not applicable to substance emission modeling. Therefore, in the next step, the possibility to predict the P concentration in subsurface flow from the P concentration in surface runoff was checked.
3. Results
3.1. Derivation and Prediction of Robust Dissolved Phosphorus Concentrations in Surface Runoff
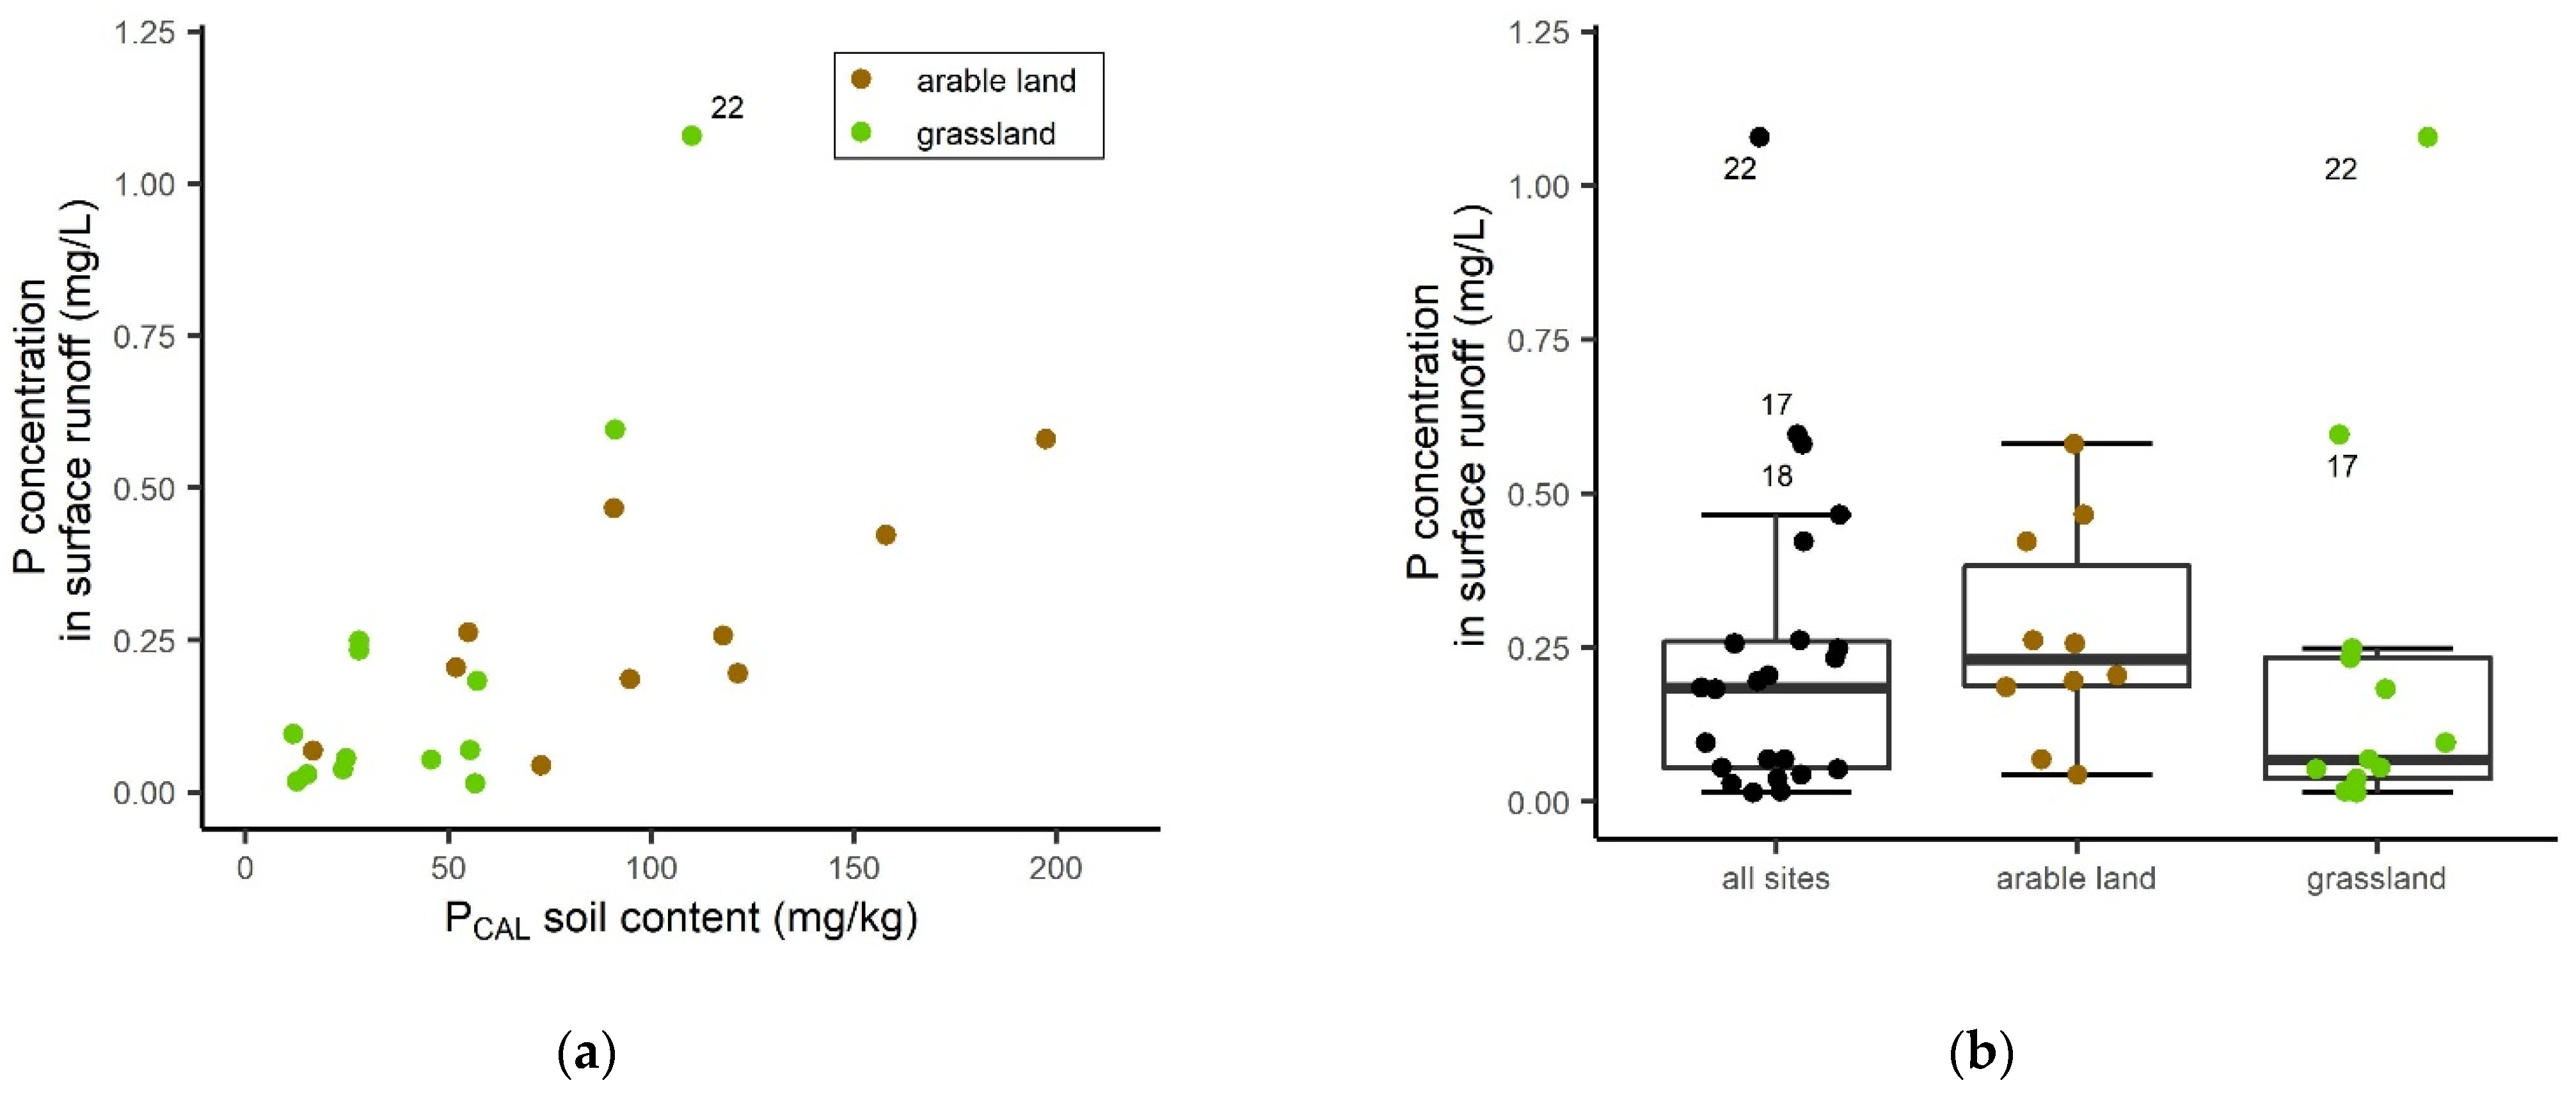
From the numerous concentration measurements that were realized, one representative phosphorus concentration in surface runoff was determined for each experimental site. Figure 5 shows the resulting representative phosphorus concentrations in surface runoff (0.015–1.078 mg L−1) for all the sites depending on the PCAL content of the soil (left) and as boxplots by land use (right). As the extremely fertilized Site 22 was identified as an outlier and datapoint with high influence (compare Chapter 2.2.2), it was removed from the dataset for further analyses.
These representative concentrations can be considered as robust averages for the individual sites and provide the opportunity for further evaluation and analysis. In this study, they were used to derive a model for predicting the phosphorus concentration in the surface runoff from the PCAL soil content.
As can be seen in Figure 6, on average, both the measured PCAL soil contents and phosphorus concentrations in the surface runoff are lower for grassland than for arable land. Due to different vegetation, management, and fertilization practices, it is conceivable that different P concentrations might occur in the runoff from arable land and grassland with the same P supply. Therefore, in addition to a regression model for the overall dataset, separate regression models were derived for the land uses arable land and grassland.
The models were not only calculated for PCAL in mg kg−1 but also for PCAL in mg P2O5 100 g−1 and are provided in both forms as PCAL soil contents are commonly used and supplied by the responsible agricultural authorities as P2O5 in mg 100 g−1.
Evaluating both arable land and grassland sites together results in the linear relationship (n = 22, R2 = 0.52; p < 0.001) between the soil phosphorus content PCAL and the phosphorus concentration in surface runoff CP,SR in mg L−1 given in Equations (1) and (2). Considering that the data were collected in the field and the phosphorus concentration in surface runoff is sensitive to numerous influencing variables, the quality of the resulting model is quite satisfying and realistic.
CP,SR [mg L−1] = 0.00259 * PCAL [mg P kg−1] + 0.0285
CP,SR [mg L−1] = 0.0113 * PCAL [mg P2O5 100 g−1] + 0.0285
Considering only arable land sites results in the linear relationship (n = 10, R2 = 0.56; p < 0.05) described in Equations (3) and (4), which is of similar quality to the overall model. With only ten datapoints, the dataset was indeed small, but, nevertheless, all the criteria for a linear regression were fulfilled.
CP,SR [mg L−1] = 0.00242 * PCAL [mg P kg−1] + 0.03216
CP,SR [mg L−1] = 0.01057 * PCAL [mg P2O5 100 g−1] + 0.03216
Analyzing grassland sites only, the conditions for a linear regression are not clearly given. Performing the regression analysis, nevertheless, results in the comparatively poor model described in Equations (5) and (6) (n = 12, R2 = 0.41; p < 0.05), whose course is decisively influenced by Site 17 (Cook’s distance) and quite different from the course of the overall and arable land models.
CP,SR [mg L−1] = 0.00444 * PCAL [mg P kg−1] − 0.0307
CP,SR [mg L−1] = 0.01938 * PCAL [mg P2O5 100 g−1] − 0.0307
3.2. Prediction of Dissolved Phosphorus Concentrations in Subsurface Flow
Besides concentration measurements in surface runoff, concentration measurements in subsurface flow were also realized in the study. In Figure 7, measured P concentrations in subsurface flow are shown in relation to measured P concentrations in surface runoff. Both mean concentrations of runoff-proportional mixed samples of the two investigated events and concentrations at the end of Event 5 with a duration of 180 min are illustrated.
The data illustrated in Figure 7 show a strong linear relationship (n = 30, R2 = 0.94; p < 0.001) between the measured concentration of dissolved phosphorus in surface runoff CP,SR in mg L−1 and in subsurface flow CP,SSF in mg L−1 that can be expressed as
CP,SSF [mg L−1] = 0.7255 * CP, SR [mg L−1]
Considering that both P concentrations in surface runoff and subsurface flow are exposed to the same influencing site parameters, it is not surprising that a quite strong relationship between the two parameters is found as the influences neutralize each other. Concentrations in subsurface flow are constantly lower than concentrations in surface runoff due to the processes that happen. PCAL contents of the lower soil are lower than in the upper soil. Therefore, on the one hand, less phosphorus is dissolved from the lower soil layer. On the other hand, there is a potential for phosphorus that was already dissolved in the upper soil layer to immobilize and to be re-adsorbed to the soil in the lower layer.
4. Discussion
The aim of this study was to develop a method to derive phosphorus concentrations as input data for modeling on a river basin scale that can be derived from available field data.
Generally, methods for the derivation of phosphorus concentrations as input data for modeling can be derived by two different approaches: either by standardized lab experiments or by measurements in the field. Lab experiments surely have the advantage that they are not that complex and expensive to realize and have a high reproducibility due to standardized proceedings. On the contrary, field experiments are very expensive and time-demanding, but they provide the opportunity to realize measurements under real and undisturbed conditions, which are never given in lab experiments. For example, in natural flowing systems, the P desorption process might be physically limited by the diffusion of P into the outer layer of soil aggregates [43]. In lab experiments, the soil is ground and aggregates are destroyed, which might be the reason that, generally, more P can be desorbed in lab experiments than in the field [44]. Therefore, we think that it is essential to base the derivation of reliable concentrations as model input data on field experiments under as realistic conditions as possible.
However, the characteristics of the artificial rainfall events were predetermined by the focus of the main study designed by Ries et al. from the University of Freiburg [30,31]. For this reason, the intensity and duration of the experiments could not be adjusted. Although the experiments corresponded to heavy rainfall events, no surface runoff was generated at all on the majority of the grassland sites during the first event. Moreover, on some of the arable land sites, hardly any surface runoff was measured [30]. These observations correspond to the fact that real surface runoff is mainly generated during such extreme events (cf. [45]) and only occurs during a few days per year. Considering this, it reveals that the measurement of representative P concentrations in surface runoff for modeling was absolutely legitimate during heavy rainfall events. However, in many substance emission models, the relatively fast-reacting subsurface flow is also considered to be part of the pathway usually referred to as “surface runoff” and means a near surface emission pathway that includes dissolved substances and can clearly be differentiated from the slower-reacting emission pathways “interflow” and “groundwater”. The subsurface flow that was investigated in this study does not occur permanently but is also fast-reacting and a clear result of the heavy rainfall. For this reason, it is legitimate to transfer concentrations measured in the subsurface flow in this study to the subsurface share of runoff that is considered in the modeling pathway surface runoff. Due to climate change, heavy rainfall events are supposed to occur more frequently in the future, and, because of the high amount of resulting surface runoff, concentrations measured under these circumstances will definitely be of great interest for the modeling of P losses from agricultural land and the resulting emissions into the environment in the future.
From the field experiments that were conducted in this study, representative site-specific P concentrations in surface runoff have been derived for 23 agricultural sites. They provide insight regarding the range of phosphorus concentrations that occur under natural conditions. Considering the effort for the realization of such experiments, these resulting concentrations are very valuable, although the number may seem quite small.
With regard to the aim of this study, this dataset was used for the derivation of a model predicting the P concentration in surface runoff from PCAL soil content. In this context, existing approaches to the prediction of the P concentration in surface runoff that are partially used in substance emission modeling (compare Figure 1) should be considered and are discussed in the following. In MONERIS [13] and in MONERIS-BW [29], the P concentration in surface runoff is supposed to correspond to the P equilibrium concentration at zero net sorption and desorption (EPC0 or PI0), which is also referred to as the equilibrium phosphorus concentration in the soil solution. It is determined in a lab with batch sorption–desorption experiments and depends exponentially on the PCAL soil content [32] and the degree of phosphorus saturation [33]. For the following three reasons, we think that the linear approach we derived in this study is better suited for the prediction of the P concentration in surface runoff from PCAL soil contents in the investigated range than the existing approaches mentioned above:
- P equilibrium concentrations in the soil solution (at zero net sorption and desorption) are attained during undisturbed contact of water and soil. During the occurrence of surface runoff, the soil solution is permanently diluted. Although dilution stimulates the desorption process from the labile P pool, the rate of the desorption process might be physically limited when the labile P pool cannot be replenished fast enough by P diffusion into the outer layers of soil aggregates [43]. Yli-Halla et al. [44] found that the concentration of the dissolved reactive phosphorus in the surface runoff is much lower than the EPC0 concentrations calculated from sorption–desorption isotherms. For these reasons, the assumption that the P concentration in surface runoff can be equated to the P equilibrium concentration is untenable.
- In several studies in which plot experiments with artificial rainfall have been performed directly in the field, linear relationships between the P soil content (measured as WSP) and P concentration in surface runoff have been found [11,21,24,25,26,46]. Fischer [12] also recommends the use of a linear relationship for this reason.
- Large datasets of spatially distributed data always show a wide range of values and also contain extreme values. For a small sample size or when only a few or even no extreme values were available for the derivation of an approach, it is obvious that this approach can never be transferred to such extreme values in an adequate way. This is particularly problematic for approaches with steep rising courses as, in addition to the uncertainty concerning the transfer to extreme values, the predicted values increase limitlessly.
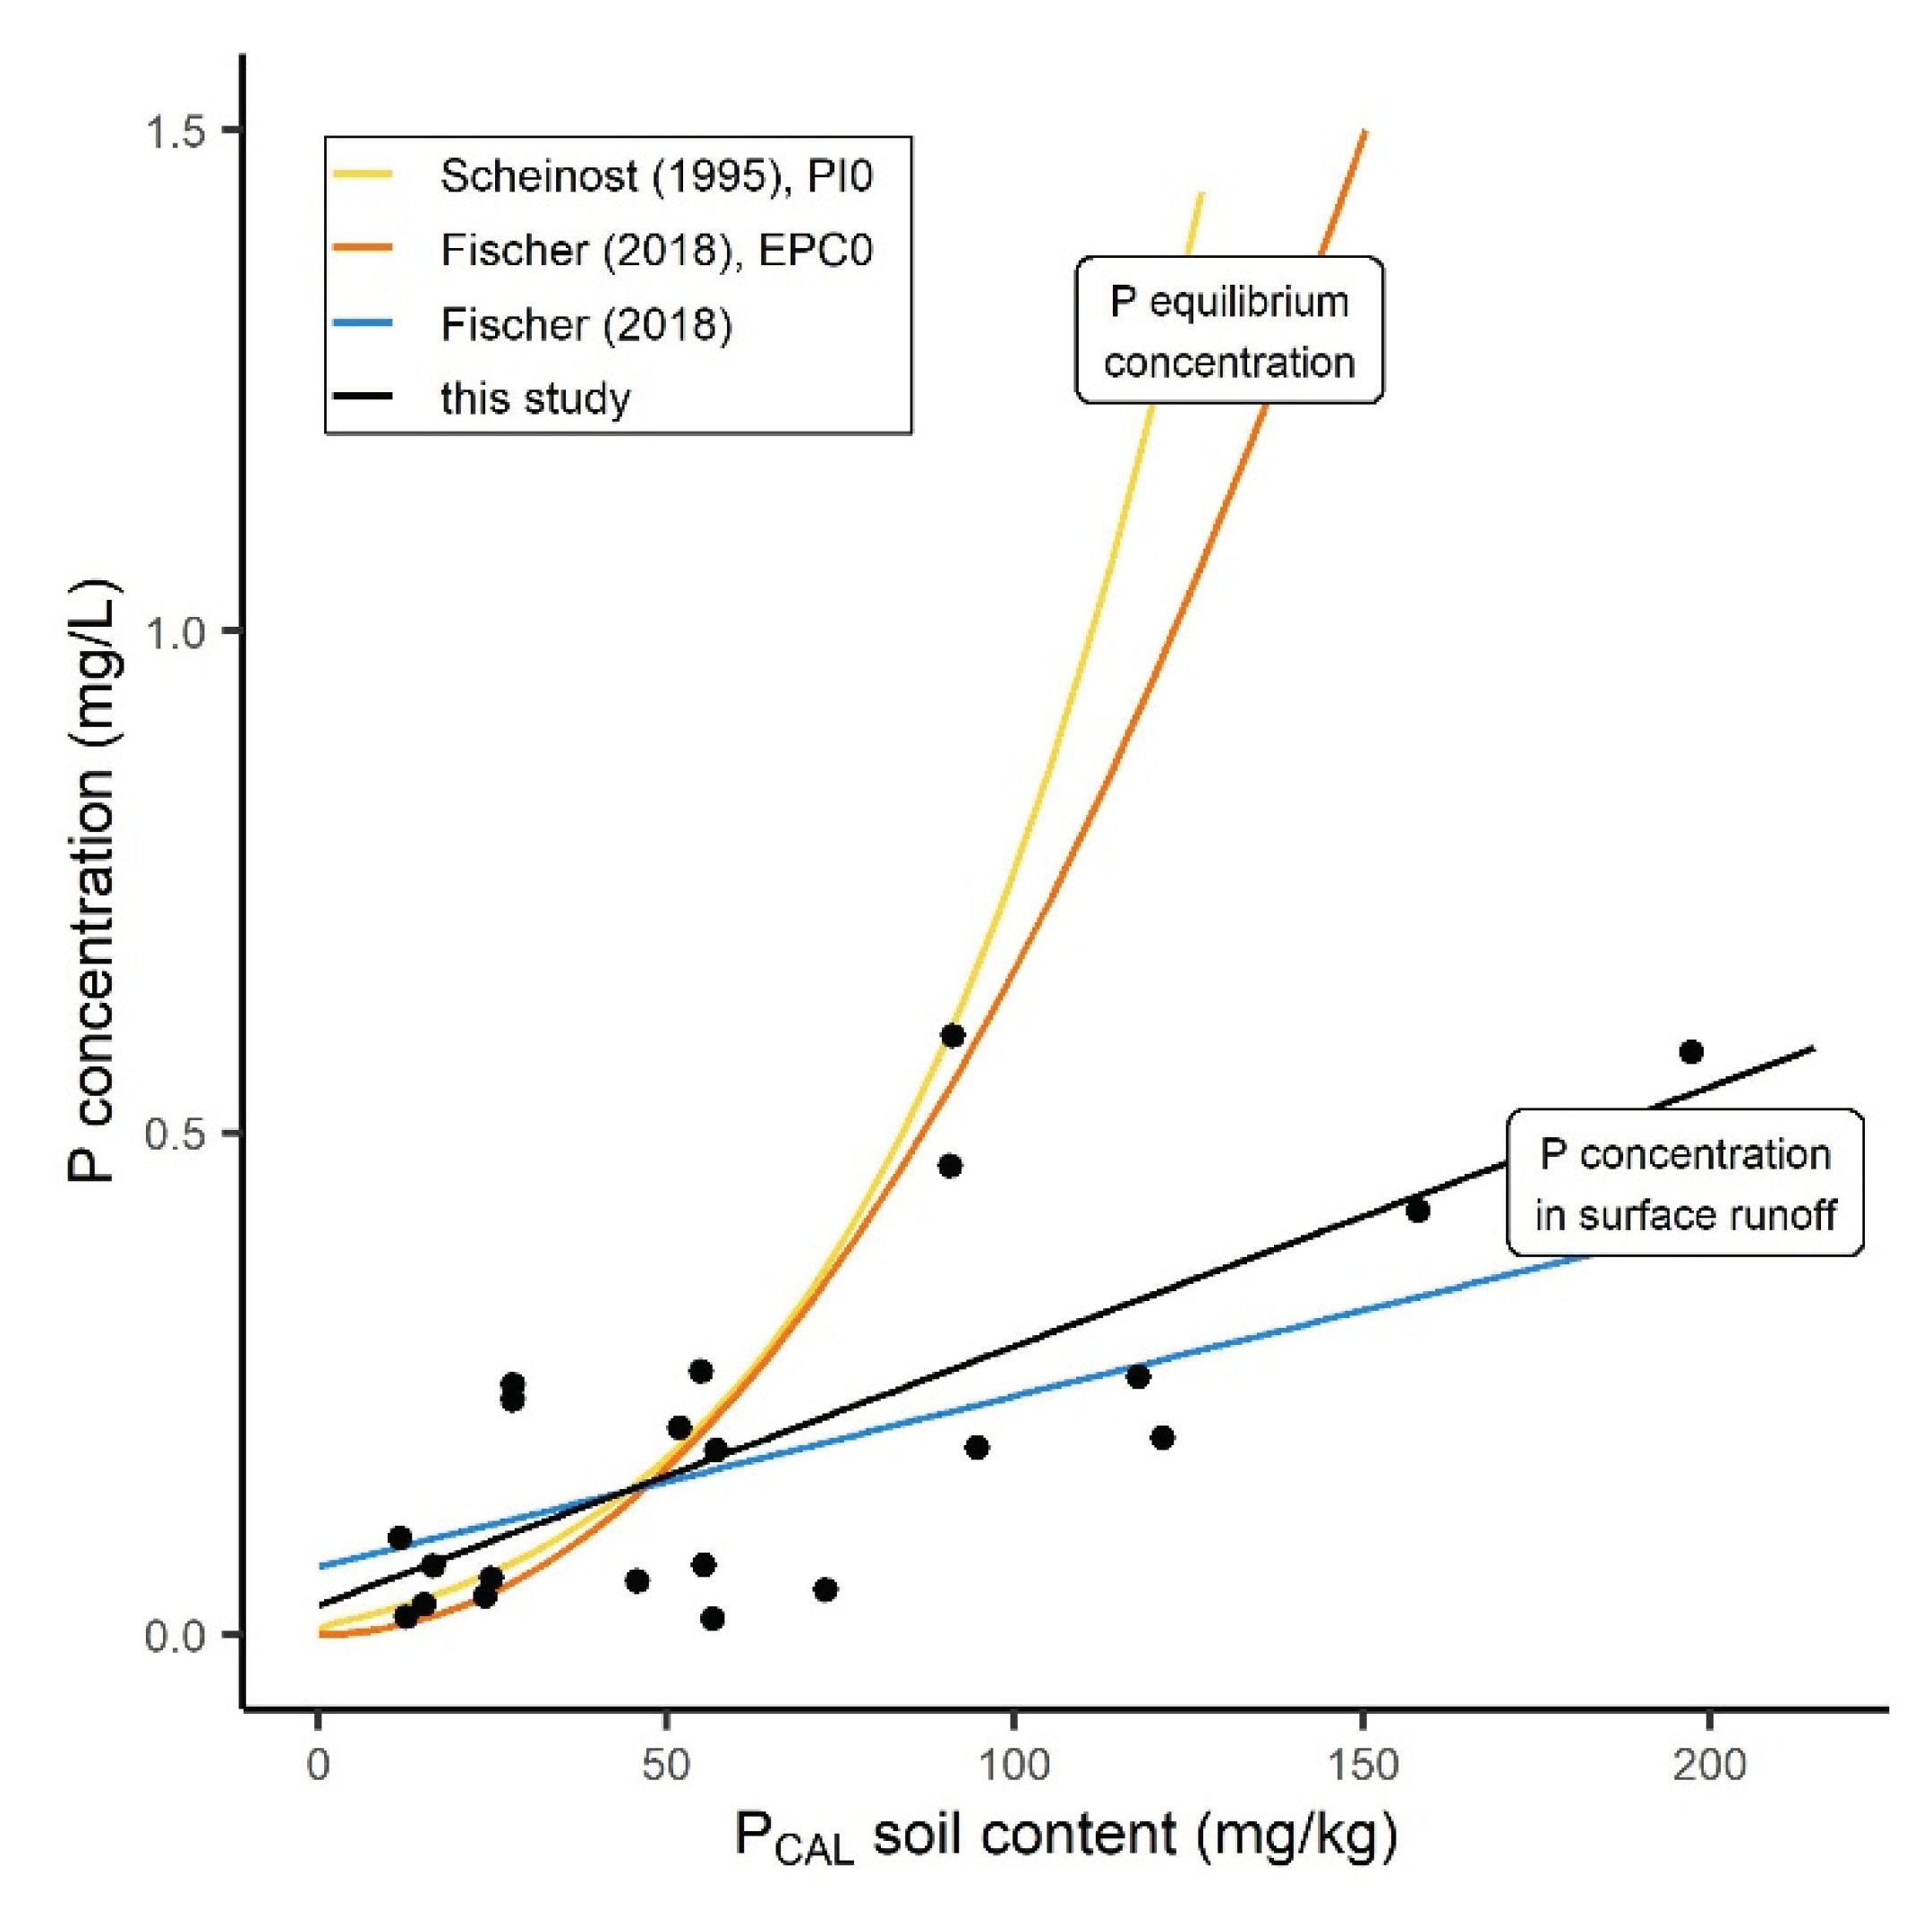
In Figure 8, the data and the model derived in this study are compared to the approaches that were illustrated in Figure 1. It clearly visualizes the difference between approaches that assume that the P concentration in the surface runoff corresponds to the P equilibrium concentration measured in the laboratory and results in an exponential course and approaches that assume concentrations that were originally measured in surface runoff and show a linear course. PCAL soil content data measured in Baden-Wuerttemberg from 2009 to 2014 were condensed to median values for about 3000 districts by LTZ Augustenberg [47]. Considering that, in the case of arable land, 74.1% and, in the case of grassland, 20.3% of these median values exceed 60 mg P kg−1, this underscores how relevant it is to modeling results whether an appropriate modeling approach is applied to measured data.
From the empirical field experiments, a linear modelling approach (Equation (1) or (2)) could be derived, which, for the first time, allows the prediction of the phosphorus concentration in surface runoff directly from PCAL soil content data. Based on the above-mentioned considerations, we clearly recommend it for the application within substance emission models for the investigated range of PCAL values. The recommended approach does not distinguish between arable land and grassland sites. However, from a scientific point of view, this would probably be reasonable as the soils used for grassland might differ in their properties from the soils used for cultivation. Furthermore, different vegetation, management, and fertilization practices might result in different P concentrations for arable land and grassland sites with the same PCAL soil content. However, at a total number of 22 valid experiments, the separated evaluation for arable land and grassland resulted in poorer models with less significance and a higher uncertainty (cf. Equation (3) or (4) and Equation (5) or (6)). Therefore, as a result of this study, only the more stable overall relationship is recommended for the prediction of P concentrations in surface runoff as needed for modeling. Despite the small number of investigated sites and the restrictions due to the predetermined experimental design, the obtained linear model corresponds well to the approach by Fischer [12], who used three linear relationships from the literature in a row to predict the phosphorus concentration in surface runoff from PCAL soil content (compare Figure 1).
In this study, it could also be shown that phosphorus concentrations in the subsurface flow directly depend on P concentrations in surface runoff (compare Equation (7) & Figure 7) and, thereby, indirectly also on the PCAL soil content in the upper soil layer.
PCAL soil content is measured in many federal states of Germany for the determination of fertilizer requirements. By using these data in combination with the recommended linear model approaches derived in this study (Equations (1) or (2) and (7)), phosphorus concentrations in surface runoff and subsurface flow can be predicted in high spatial resolution. In this context, it must be considered that the dissolved P as an ortho-phosphate is only part of the phosphorus pool that is capable of negatively affecting aquatic ecosystems. Phosphorus adsorbed on soil particles and organic fractions may also be bioavailable and is released into surface waters via erosion from agricultural sites. In our study, the total phosphorus concentrations in the mixed surface runoff samples from arable land were up to 60 times higher (from grassland, up to 10 times higher) than the dissolved phosphorus concentrations. This underlines the importance to consider the whole phosphorus pool when estimating the impact of agriculture on the aquatic environment. In most substance emission models, P adsorbed on soil particles is quantified in a separate pathway “erosion”, whereas dissolved P is quantified in the pathway “surface runoff”.
Although the approaches derived in this study only refer to the dissolved emissions via the pathway “surface runoff”, their use within substance emission models can significantly contribute to improve the quality and accuracy of the model results. In the model METRIS-BW 2019, which is an enhanced version of MONERIS-BW, the modeling approaches developed in this study (Equations (1) or (2) and (7)) were applied to PCAL soil content data (median values for about 3000 districts) on a federal state level, resulting in more realistic and accepted modeling results [48]. In an ongoing project, the implementation of these approaches in MoRE [49], which is the national quantification tool for emissions into German river systems, is checked [50].
In this context, the conduction of further experiments and a potential derivation in separate approaches for arable land, grass land sites, and, eventually, further land use classes, is an interesting topic for research in the future.
Concluding, in this field study, a unique dataset of dissolved P concentrations in surface runoff was generated during large-scale and very labor-intensive artificial rainfall experiments under undisturbed conditions on 22 agricultural sites representing a large variety of site conditions. From these field data, a model was derived that, for the first time, allows to realistically use the available spatially distributed data of PCAL soil content for the direct prediction of dissolved phosphorus concentrations in surface runoff and, in a second step, also in subsurface flow. By integration of the derived approaches into substance emission models, it is possible to predict the dissolved P concentrations for application to the pathway surface runoff in high spatial resolution and thereby improve the accuracy of the models.
Author Contributions
Conceptualization, L.K. and S.F.; methodology, L.K.; software, L.K.; validation, L.K. and S.F.; formal analysis, L.K.; investigation, L.K and S.F.; resources, L.K.; data curation, L.K.; writing—original draft preparation, L.K.; writing—review and editing, S.F.; visualization, L.K.; supervision, S.F.; project administration, S.F.; funding acquisition, S.F. All authors have read and agreed to the published version of the manuscript.
Funding
This research was funded by the State Institute for the Environment, Measurements and Conservation of Baden-Wuerttemberg (LUBW). We acknowledge support by the KIT Publication Fund of the Karlsruhe Institute of Technology.
Data Availability Statement
Detailed information on the artificial rain experiments within which our measurement campaign was realized are given in: Ries, Kirn, Weiler. 2019. Runoff response from extreme rainfall events on natural hillslopes: a dataset of 132 large-scale sprinkling experiments in south-west Germany; https://freidok.uni-freiburg.de/data/151460 (accessed on 1 April 2022); Version 2; DOI: https://doi.org/10.6094/UNIFR/151460 (accessed on 1 April 2022).
Acknowledgments
We would like to thank Fabian Ries, Lara Kirn, and Markus Weiler from the University of Freiburg for the possibility to realize our measurements in their field experiments, as well as for their work in the field and the technical support. Furthermore, we would like to thank Katharina Allion and Jakob Pferdmenges for reading the manuscript and discussing its content.
Conflicts of Interest
The authors declare no conflict of interest. The funders had no role in the design of the study; in the collection, analyses, or interpretation of data; in the writing of the manuscript, or in the decision to publish the results.
Appendix A
In the following, data that were used for the derivation of models are provided. Data for prediction of the P concentration in surface runoff are shown in Table A1. Along these lines, data that were used for prediction of the P concentration in subsurface flow are provided in Table A2.

Table A1.
Site-representative phosphorus concentrations in surface runoff and site characteristics that were used for their prediction in models.
Table A1.
Site-representative phosphorus concentrations in surface runoff and site characteristics that were used for their prediction in models.
| Site | P Concentration in Surface Runoff in mg L−1 | PCAL Upper Soilin mg P kg−1 | Total Phosphorus in mg kg−1 | Clay Content in % | pH Value | Time Since Last Fertilization in Days | Amountof Fertilizer in g P m−2 |
|---|---|---|---|---|---|---|---|
| 1 | 0.183 | 57 | 1490 | 34.42 | 5.75 | 120 | 2.62 |
| 2 | 0.234 | 28 | 886 | 20.44 | 5.05 | 30 | 1.75 |
| 3 | 0.055 | 25 | 788 | 18.88 | 4.67 | 180 | 0 |
| 4 | 0.262 | 55 | 935 | 19.21 | 5.8 | 210 | 1.75 |
| 5 | 0.044 | 73 | 1235 | 24.8 | 4.71 | 180 | 0.98 |
| 6 | 0.038 | 24 | 972 | 24.4 | 4.58 | 210 | 0.35 |
| 7 | 0.422 | 158 | 1256 | 18.89 | 7.38 | 60 | 8 |
| 8 | 0.466 | 91 | 1018 | 13.77 | 4.97 | 20 | 3.97 |
| 9 | 0.249 | 28 | 721 | 14.49 | 5.17 | 90 | 1.48 |
| 10 | 0.069 | 55 | 1710 | 23.39 | 4.59 | 3 | 1.05 |
| 11 | 0.096 | 12 | 900 | 37.9 | 5.67 | 360 | 0 |
| 12 | 0.017 | 13 | 1131 | 54.33 | 6.78 | 270 | 1.48 |
| 13 | 0.068 | 17 | 1633 | 45.3 | 6.92 | 360 | 0 |
| 14 | 0.029 | 15 | 887 | 51.46 | 5.61 | 360 | 0 |
| 15 | 0.205 | 52 | 1665 | 43.17 | 7.42 | 5 | 1.75 |
| 16 | 0.053 | 46 | 1401 | 30.29 | 7.34 | 360 | 0 |
| 17 | 0.596 | 91 | 1693 | 43.77 | 7.08 | 30 | 0.87 |
| 18 | 0.580 | 197 | 1622 | 48.53 | 7.28 | 120 | 0.87 |
| 19 | 0.015 | 57 | 761 | 19.43 | 4.52 | 330 | 1.31 |
| 20 | 0.257 | 118 | 916 | 22.13 | 7.38 | 210 | 5.02 |
| 21 | 0.195 | 121 | 1143 | 28.89 | 7.31 | 60 | 3.97 |
| 22 | 1.078 | 110 | 1802 | 53.88 | 7.17 | 30 | 6.55 |
| 23 | 0.186 | 95 | 1122 | 20.09 | 5.89 | 180 | 3.21 |
Table A2.
Phosphorus concentrations in subsurface flow and parameters that were used for their prediction in models.
Table A2.
Phosphorus concentrations in subsurface flow and parameters that were used for their prediction in models.
| Site | P Concentration in Subsurface Flow in mg L−1 | P Concentration in Surface Runoff in mg L−1 | PCAL in the Lower Soil in mg P kg−1 |
|---|---|---|---|
| mean of runoff proportional samples of the two sampled events | |||
| 1 | 0.179 | 0.183 | 9 |
| 2 | 0.130 | 0.234 | 5 |
| 3 | 0.031 | 0.055 | 4 |
| 4 | 0.266 | 0.262 | 20 |
| 6 | 0.022 | 0.038 | 7 |
| 7 | 0.504 | 0.422 | 43 |
| 9 | 0.084 | 0.355 1 | 10 |
| 11 | 0.023 | 0.096 | 3 |
| 12 | 0.007 | 0.017 | 1 |
| 13 | 0.056 | 0.068 | 2 |
| 14 | 0.017 | 0.029 | 3 |
| 16 | 0.055 | 0.052 1 | 9 |
| 17 | 0.352 | 0.596 | 35 |
| 18 | 0.356 | 0.621 1 | 60 |
| 19 | 0.015 | 0.015 | 10 |
| 20 | 0.194 | 0.257 | 10 |
| 21 | 0.105 | 0.195 | 7 |
| 22 | 0.823 | 1.078 | 2 |
| 23 | 0.116 | 0.186 | 4 |
| end of Event 5 (duration 180 min) | |||
| 11 | 0.013 | 0.025 | 3 |
| 12 | 0.008 | 0.011 | 1 |
| 13 | 0.025 | 0.028 | 2 |
| 14 | 0.019 | 0.023 | 3 |
| 16 | 0.010 | 0.017 | 9 |
| 17 | 0.244 | 0.303 | 35 |
| 18 | 0.327 | 0.434 | 60 |
| 19 | 0.019 | 0.008 | 10 |
| 21 | 0.101 | 0.135 | 7 |
| 22 | 0.353 | 0.429 | 2 |
| 23 | 0.136 | 0.160 | 4 |
1 as subsurface flow occurred only during one event, here, for the concentration in surface runoff, only the runoff-proportional mixed samples of this event were considered (instead of both investigated events). For this reason, values in this table differ from values in Appendix A, Table A1.
References
- Directive 2000/60/EC of the European Parliament and of the Council of 23 October 2000 Establishing a Framework for Community Action in the Field of Water Policy. 2000. Available online: https://eur-lex.europa.eu/legal-content/EN/TXT/HTML/?uri=CELEX:32000L0060&from=de (accessed on 2 April 2022).
- Directive 2008/56/EC of the European Parliament and of the Council of 17 June 2008 Establishing a Framework for Community Action in the Field of Marine Environmental Policy (Marine Strategy Framework Directive). 2008. Available online: https://eur-lex.europa.eu/legal-content/EN/TXT/HTML/?uri=CELEX:32008L0056&qid=1648911451878&from=EN (accessed on 2 April 2022).
- HELCOM. HELCOM Baltic Sea Action Plan; HELCOM: Krakow, Poland, 2007. Available online: https://www.helcom.fi/wp-content/uploads/2019/08/BSAP_Final.pdf (accessed on 3 July 2018).
- Umweltbundesamt. Güteklassifikation Gesamtphosphor 1982–2019 (LAWA-Messstellen). Zusammenstellung des Umweltbundesamtes Nach Angaben der Bund/Länderarbeitsgemeinschaft Wasser (LAWA). 2020. Available online: https://www.umweltbundesamt.de/sites/default/files/medien/2875/bilder/dateien/gueteklassen_phosphor_2020.pdf (accessed on 29 March 2022).
- Umweltbundesamt. Stickstoff- und Phosphoreinträge aus Punktquellen und diffusen Quellen in die Oberflächengewässer in Deutschland. Available online: https://www.umweltbundesamt.de/sites/default/files/medien/384/bilder/dateien/2_abb_n-p-eintraege_2020-09-17.pdf (accessed on 29 March 2022).
- Umweltbundesamt. Gewässer in Deutschland: Zustand und Bewertung; Umweltbundesamt: Dessau-Roßlau, Germany, 2017. Available online: https://www.umweltbundesamt.de/sites/default/files/medien/1968/publikationen/170829_uba_fachbroschure_wasse_rwirtschaft_mit_anderung_bf.pdf (accessed on 3 July 2018).
- Krämer, I.; Nausch, M.; Mehl, D.; Nausch, G.; Deutsch, B. Phosphor—Von der Quelle bis ins Meer. Wasser Abfall 2016, 18, 18–22. [Google Scholar] [CrossRef] [Green Version]
- Schulz, F. Trendauswertung der stofflichen Belastung schleswig-holsteinischer Fließgewässer. In Jahresbericht 1999; Landesamt für Natur und Umwelt des Landes Schleswig-Holstein: Flintbek, Germany, 2000; pp. 59–65. [Google Scholar]
- Holsten, B.; Pfannerstill, M.; Trepel, M. Phosphor in der Landschaft: Management Eines begrenzt Verfügbaren Nährstoffs; Institut für Ökosystemforschung, Christian-Albrechts-Universität zu Kiel: Kiel, Germany, 2016; Available online: https://www.ecosystems.uni-kiel.de/en/pdf/phosphor_in_der_landschaft_download.pdf (accessed on 2 April 2022).
- Prasuhn, V. Gülleabschwemmung von Graslandflächen—Versuchsergebnisse aus der Schweiz. In Gülle 11. Gülle- und Gärrestdüngung auf Grünland, Tagungsband Internationale Tagung 17. + 18.10.2011, Kloster Reute; Elsäßer, M., Diepolder, M., Huguenin-Elie, O., Pötsch, E., Nußbaum, H., Messner, J., Eds.; LAZ BW: Aulendorf, Germany, 2011; pp. 185–189. ISBN 3000360565. [Google Scholar]
- Pote, D.H.; Daniel, T.C.; Nichols, D.J.; Sharpley, A.N.; Moore, P.A.; Miller, D.M.; Edwards, D.R. Relationship between Phosphorus Levels in Three Ultisols and Phosphorus Concentrations in Runoff. J. Environ. Qual. 1999, 28, 170–175. [Google Scholar] [CrossRef] [Green Version]
- Fischer, P. The Degree of Phosphorus Saturation of Agricultural Soils in Brazil and Germany: New Approaches for Risk Assessment of Diffuse Phosphorus Losses and Soil Phosphorus Management. Dissertation, Humboldt-Universität Berlin, Berlin, Germany, 2018. [Google Scholar]
- Venohr, M.; Hirt, U.; Hofmann, J.; Opitz, D.; Gericke, A.; Wetzig, A.; Natho, S.; Neumann, F.; Hürdler, J.; Matranga, M.; et al. Modelling of Nutrient Emissions in River Systems—MONERIS—Methods and Background. Int. Rev. Hydrobiol. 2011, 96, 435–483. [Google Scholar] [CrossRef]
- Wendland, F.; Herrmann, F.; Kunkel, R.; Tetzlaff, B.; Wolters, T. AGRUM-DE—Modellbeschreibung mGROWA-DENUZ-WEKU-MEPHOS. 2019. Available online: https://www.thuenen.de/media/institute/lr/Projekt-Downloads-pdf/AGRUM-Modellbeschreibung_aus_Zwischenbericht_2019.pdf (accessed on 14 June 2021).
- Hürdler, J.; Prasuhn, V.; Spiess, E. Abschätzung Diffuser Stickstoff- und Phosphoreinträge in die Gewässer der Schweiz MODIFFUS 3.0. 2015. Available online: https://www.agroscope.admin.ch/agroscope/de/home/themen/umwelt-ressourcen/boden-gewaesser-naehrstoffe/landwirtschaftlicher-gewaesserschutz/modiffus/_jcr_content/par/columncontrols/items/0/column/externalcontent_746471554.bitexternalcontent.exturl.pdf/aHR0cHM6Ly9pcmEuYWdyb3Njb3BlLmNoLzAvQWpheC9FaW56ZW/xwdWJsaWthdGlvbi9Eb3dubG9hZD9laW56ZWxwdWJsaWthdGlv/bklkPTM1NDQx.pdf (accessed on 2 April 2022).
- Aase, J.K.; Bjorneberg, D.L.; Westermann, D.T. Phosphorus Runoff from Two Water Sources on a Calcareous Soil. J. Environ. Qual. 2001, 30, 1315–1323. [Google Scholar] [CrossRef] [Green Version]
- Andraski, T.W.; Bundy, L.G. Relationships between Phosphorus Levels in Soil and in Runoff from Corn Production Systems. J. Environ. Qual. 2003, 32, 310–316. [Google Scholar] [CrossRef]
- Andraski, T.W.; Bundy, L.G.; Kilian, K.C. Manure history and long-term tillage effects on soil properties and phosphorus losses in runoff. J. Environ. Qual. 2003, 32, 1782–1789. [Google Scholar] [CrossRef]
- Daverede, I.C.; Kravchenko, A.N.; Hoeft, R.G.; Nafziger, E.D.; Bullock, D.G.; Warren, J.J.; Gonzini, L.C. Phosphorus Runoff: Effect of Tillage and Soil Phosphorus Levels. J. Environ. Qual. 2003, 32, 1436–1444. [Google Scholar] [CrossRef]
- Davis, R.L.; Zhang, H.; Schroder, J.L.; Wang, J.J.; Payton, M.E.; Zazulak, A. Soil Characteristics and Phosphorus Level Effect on Phosphorus Loss in Runoff. J. Environ. Qual. 2005, 34, 1640–1650. [Google Scholar] [CrossRef]
- Hahn, C.; Prasuhn, V.; Stamm, C.; Schulin, R. Phosphorus losses in runoff from manured grassland of different soil P status at two rainfall intensities. Agric. Ecosyst. Environ. 2012, 153, 65–74. [Google Scholar] [CrossRef]
- McDowell, R.W.; Sharpley, A.N. Approximating Phosphorus Release from Soils to Surface Runoff and Subsurface Drainage. J. Environ. Qual. 2001, 30, 508–520. [Google Scholar] [CrossRef] [Green Version]
- Penn, C.J.; Mullins, G.L.; Zelazny, L.W.; Sharpley, A.N. Estimating Dissolved Phosphorus Concentrations in Runoff from Three Physiographic Regions of Virginia. Soil Sci. Soc. Am. J. 2006, 70, 1967–1974. [Google Scholar] [CrossRef]
- Pote, D.H.; Daniel, T.C.; Moore, P.A.; Nichols, D.J.; Sharpley, A.N.; Edwards, D.R. Relating Extractable Soil Phosphorus to Phosphorus Losses in Runoff. Soil Sci. Soc. Am. J. 1996, 60, 855–859. [Google Scholar] [CrossRef]
- Schroeder, P.D.; Radcliffe, D.E.; Cabrera, M.L.; Belew, C.D. Relationship between Soil Test Phosphorus and Phosphorus in Runoff: Effects of Soil Series Variability. J. Environ. Qual. 2004, 33, 1452–1463. [Google Scholar] [CrossRef] [PubMed] [Green Version]
- Torbert, H.A.; Daniel, T.C.; Lemunyon, J.L.; Jones, R.M. Relationship of Soil Test Phosphorus and Sampling Depth to Runoff Phosphorus in Calcareous and Noncalcareous Soils. J. Environ. Qual. 2002, 31, 1380–1387. [Google Scholar] [CrossRef] [PubMed]
- Turner, B.L.; Kay, M.A.; Westermann, D.T. Phosphorus in Surface Runoff from Calcareous Arable Soils of the Semiarid Western United States. J. Environ. Qual. 2004, 33, 1814–1821. [Google Scholar] [CrossRef] [PubMed] [Green Version]
- Methode A 6.2.1.1: Bestimmung von Phosphor und Kalium im Calcium-Acetat-Lactat-Auszug. Verbandsmethode. In Handbuch der Landwirtschaftlichen Versuchs- und Untersuchungsmethodik (VDLUFA-Methodenbuch): Band I Die Untersuchung von Böden; Verband Deutscher Landwirtschaftlicher Untersuchungs- und Forschungsanstalten (Ed.) VDLUFA-Verlag: Darmstadt, Germany, 2012. [Google Scholar]
- Kiemle, L.; Fuchs, S.; Henning, K. Modellierung der Nährstoffeinträge in der Fließgewässer Baden-Württembergs für Die Aktualisierung der Bewirtschaftungspläne Nach WRRL: Modellbeschreibung und Ergebnisse der MONERIS-BW Version “März 2015”; Landesanstalt für Umwelt, Messungen und Naturschutz Baden-Württemberg (LUBW): Karlsruhe, Germany, 2015; Available online: https://um.baden-wuerttemberg.de/fileadmin/redaktion/m-um/intern/Dateien/Dokumente/3_Umwelt/Wasser/Rechtsvorschriften/WRRL/Zyklus-2/Hintergrund-2/Modellierung_Naehrstoffeintraege_2015.pdf (accessed on 4 July 2018).
- Ries, F.; Kirn, L.; Weiler, M. Experimentelle Untersuchung der Abflussbildung bei Starkregen. Experimental investigation of runoff generation following extreme precipitation. Hydrol. Und Wasserbewirtsch. 2020, 64, 221–236. [Google Scholar] [CrossRef]
- Ries, F.; Kirn, L.; Weiler, M. Runoff reaction from extreme rainfall events on natural hillslopes: A data set from 132 large-scale sprinkling experiments in south-western Germany. Earth Syst. Sci. Data 2020, 12, 245–255. [Google Scholar] [CrossRef] [Green Version]
- Scheinost, A. Pedotransfer-Funktionen zum Wasser- und Stoffhaushalt einer Bodenlandschaft. Dissertation, Shaker-Verlag, Aachen, Germany, 1995. [Google Scholar]
- Pöthig, R.; Behrendt, H.; Opitz, D.; Furrer, G. A universal method to assess the potential of phosphorus loss from soil to aquatic ecosystems. Environ. Sci. Pollut. Res. Int. 2010, 17, 497–504. [Google Scholar] [CrossRef]
- Fischer, P.; Pöthig, R.; Venohr, M. The degree of phosphorus saturation of agricultural soils in Germany: Current and future risk of diffuse P loss and implications for soil P management in Europe. Sci. Total Environ. 2017, 599–600, 1130–1139. [Google Scholar] [CrossRef]
- Vadas, P.A.; Kleinman, P.J.A.; Sharpley, A.N.; Turner, B.L. Relating Soil Phosphorus to Dissolved Phosphorus in Runoff. J. Environ. Qual. 2005, 34, 572–580. [Google Scholar] [CrossRef] [Green Version]
- DIN EN ISO 6878; Wasserbeschaffenheit—Bestimmung von Phosphor—Photometrisches Verfahren Mittels Ammoniummolybdat; Deutsche Fassung EN ISO 6878:2004. Deutsches Institut für Normung e. V.: Berlin, Germany, 2004.
- DIN ISO 11277; Bodenbeschaffenheit—Bestimmung der Partikelgrößenverteilung in Mineralböden—Verfahren Mittels Siebung und Sedimentation. Deutsches Institut für Normung e. V.: Berlin, Germany, 2002.
- Blume, H.-P.; Stahr, K.; Leinweber, P. Bodenkundliches Praktikum: Eine Einführung in Pedologisches Arbeiten für Ökologen, Insbesondere Land- und Forstwirte, und für Geowissenschaftler; 3., Neubearb. Aufl.; Spektrum Akademischer Verlag: Heidelberg, Germany, 2011; ISBN 978-3-8274-2733-5. [Google Scholar]
- DIN 19684-3; Bodenuntersuchungsverfahren im Landwirtschaftlichen Wasserbau—Chemische Laboruntersuchungen—Teil 3: Bestimmung des Glühverlusts und des Glührückstands. Deutsches Institut für Normung e. V.: Berlin, Germany, 2000.
- DIN EN 13346; Charakterisierung von Schlämmen—Bestimmung von Spurenelementen und Phosphor—Extraktionsverfahren mit Königswasser. Deutsche Fassung EN 13346:2000. Deutsches Institut für Normung e. V.: Berlin, Germany, 2001.
- DIN EN ISO 10693; Bodenbeschaffenheit—Bestimmung des Carbonatgehaltes—Volumetrisches Verfahren. Deutsche Fassung EN ISO 10693:2014. Deutsches Institut für Normung e. V.: Berlin, Germany, 2014.
- DIN ISO 10390; Bodenbeschaffenheit—Bestimmung des pH-Wertes. Deutsches Institut für Normung e. V.: Berlin, Germany, 2005.
- Penn, C.J.; Williams, M.R.; Camberato, J.; Wenos, N.; Wason, H. Desorption Kinetics of Legacy Soil Phosphorus: Implications for Non-Point Transport and Plant Uptake. Soil Syst. 2022, 6, 6. [Google Scholar] [CrossRef]
- Yli-Halla, M.; Hartikainen, H.; Ekholm, P.; Turtola, E.; Puustinen, M.; Kallio, K. Assessment of soluble phosphorus load in surface runoff by soil analyses. Agric. Ecosyst. Environ. 1995, 56, 53–62. [Google Scholar] [CrossRef]
- Seibert, S.P.; Auerswald, K. Hochwasserminderung im Ländlichen Raum; Springer Spektrum: Berlin, Heidelberg, 2020; ISBN 978-3-662-61033-6. [Google Scholar]
- Leinweber, P.; Turner, B.L.; Meissner, R. Phosphorus. In Agriculture, Hydrology and Water Quality; Haygarth, P.M., Jarvis, S.C., Eds.; CABI: Wallingford, UK, 2002; ISBN 9780851995458. [Google Scholar]
- Landwirtschaftliches Technologiezentrum Augustenberg. Daten der Grunduntersuchung 2009–2014 in BW: Phosphor (mg/100 g Boden, Angabe als P2O5), gemäß VDLUFA-Methode A 6.2.2.1; Landwirtschaftliches Technologiezentrum Augustenberg: Karlsruhe, Germany, 2018. [Google Scholar]
- Kiemle, L.; Wagner, A.; Hüsener, J.; Fuchs, S.; Henning, K.; Haile, C. Modellierung der Nährstoffeinträge in die Fließgewässer Baden-Württembergs für die Aktualisierung der Bewirtschaftungspläne nach WRRL: Modellbeschreibung und Ergebnisse der METRIS-BW Version “August 2019”; Landesanstalt für Umwelt, Messungen und Naturschutz Baden-Württemberg (LUBW): Karlsruhe, Germany, 2022. (In Bearbeitung) [Google Scholar]
- Fuchs, S.; Kaiser, M.; Kiemle, L.; Kittlaus, S.; Rothvoß, S.; Toshovski, S.; Wagner, A.; Wander, R.; Weber, T.; Ziegler, S. Modeling of Regionalized Emissions (MoRE) into Water Bodies: An Open-Source River Basin Management System. Water 2017, 9, 239. [Google Scholar] [CrossRef]
- Fuchs, S.; Allion, K.; Gebel, M.; Bürger, S.; Uhlig, M.; Halbfaß, S. Phosphoreinträge in die Gewässer bundesweit Modellieren. In Neue Ansätze und Aktualisierte Ergebnisse von MoRE-DE: Abschlussbericht (Forschungskennzahl 3718 72 211 0). TEXTE XX/2022; Umweltbundesamt: Dessau-Roßlau, Germany, 2022. (In Bearbeitung) [Google Scholar]
Figure 1.
Derivation of the dissolved phosphorus concentration in surface runoff from the PCAL topsoil content in different models and approaches, using relationships reported by Scheinost [32], Pöthig et al. [33], Fischer et al. [34], and Vadas et al. [35]. Abbreviations: DPS = degree of phosphorus saturation, PI0/EPC0 = P equilibrium concentration, WSP = water-soluble phosphorus with information on soil-to-solution ratio.

Figure 2.
Map of Baden-Wuerttemberg showing the experimental site locations and the distribution of soil types. In a soil texture triangle, the consideration of soil types occurring in Baden-Wuerttemberg when selecting the locations for the experiments is illustrated [31].
Figure 2.
Map of Baden-Wuerttemberg showing the experimental site locations and the distribution of soil types. In a soil texture triangle, the consideration of soil types occurring in Baden-Wuerttemberg when selecting the locations for the experiments is illustrated [31].

Figure 3.
(a) Scheme of the experimental setup (b) photo showing the experimental setup of the field experiments.
Figure 3.
(a) Scheme of the experimental setup (b) photo showing the experimental setup of the field experiments.

Figure 4.
Measured dissolved P concentrations in surface runoff for the two investigated events at all experimental sites (at 0, mixed at 5/10/15/20, and at 25 min after runoff beginning for subplots A, B, and C) depending on the time after the beginning of the event. Runoff-proportional mixed samples are marked with a black cross.

Figure 5.
Representative dissolved phosphorus concentrations in surface runoff for the investigated experimental sites (a) depending on the PCAL content of the soil and (b) as boxplot for the overall dataset and separated by land use.
Figure 5.
Representative dissolved phosphorus concentrations in surface runoff for the investigated experimental sites (a) depending on the PCAL content of the soil and (b) as boxplot for the overall dataset and separated by land use.

Figure 6.
Representative dissolved phosphorus concentrations in surface runoff for the investigated experimental sites depending on the PCAL content of the soil and the derived linear regression models for all sites (black) for sites with arable land (brown) and grassland sites (green).
Figure 6.
Representative dissolved phosphorus concentrations in surface runoff for the investigated experimental sites depending on the PCAL content of the soil and the derived linear regression models for all sites (black) for sites with arable land (brown) and grassland sites (green).

Figure 7.
Linear relationship between measured dissolved phosphorus concentrations in surface runoff and subsurface flow for phosphorus.
Figure 7.
Linear relationship between measured dissolved phosphorus concentrations in surface runoff and subsurface flow for phosphorus.

Figure 8.
PCAL soil content and P concentration in surface runoff at the 22 agricultural sites evaluated in this study (black points) and different approaches to predict the phosphorus concentration from PCAL soil content (compare Figure 1). The black line refers to the linear model presented in Equation (1) or (2).

Publisher’s Note: MDPI stays neutral with regard to jurisdictional claims in published maps and institutional affiliations. |
© 2022 by the authors. Licensee MDPI, Basel, Switzerland. This article is an open access article distributed under the terms and conditions of the Creative Commons Attribution (CC BY) license (https://creativecommons.org/licenses/by/4.0/).
Share and Cite
MDPI and ACS Style
Kiemle, L.; Fuchs, S. Dissolved Phosphorus Concentrations in Surface Runoff from Agricultural Land Based on Calcium–Acetate–Lactate Soluble Phosphorus Soil Contents. Water 2022, 14, 1742. https://doi.org/10.3390/w14111742
AMA Style
Kiemle L, Fuchs S. Dissolved Phosphorus Concentrations in Surface Runoff from Agricultural Land Based on Calcium–Acetate–Lactate Soluble Phosphorus Soil Contents. Water. 2022; 14(11):1742. https://doi.org/10.3390/w14111742
Chicago/Turabian StyleKiemle, Lisa, and Stephan Fuchs. 2022. "Dissolved Phosphorus Concentrations in Surface Runoff from Agricultural Land Based on Calcium–Acetate–Lactate Soluble Phosphorus Soil Contents" Water 14, no. 11: 1742. https://doi.org/10.3390/w14111742
Note that from the first issue of 2016, this journal uses article numbers instead of page numbers. See further details here.