
The Effects of Algaecides and Herbicides on a Nuisance Microcystis wesenbergii-Dominated Bloom


Agronomy Department, Fort Lauderdale Research and Education Center, University of Florida—IFAS, 3205 College Avenue, Davie, FL 33314, USA
*
Author to whom correspondence should be addressed.
Water 2022, 14(11), 1739; https://doi.org/10.3390/w14111739
Submission received: 12 May 2022
/
Revised: 23 May 2022
/
Accepted: 26 May 2022
/
Published: 28 May 2022
(This article belongs to the Section Water Quality and Contamination)
Abstract
:Microcystis-dominated cyanobacterial harmful algal blooms (cyanoHABs) are a reoccurring problem globally, resulting in widespread economic and health impacts. As public awareness of the risks of blooms increases, there is an urgent need for studies on both short-term and long-term management of cyanoHABs. In order to provide science-based best management practices and treatment options, we tested various concentrations and combinations of USEPA-registered algaecides and herbicides on a Microcystis wesenbergii-dominated bloom. The bloom material was exposed to fifteen different algaecides, herbicides, or combinations, using four different concentrations. Cell abundance and morphology as well as microscopic analyses were undertaken at the time of collection and 72 h post-treatment. Overall, the effectiveness of the chemicals varied with the most efficacious treatments being SeClear®, and a combination of Hydrothol® 191 and GreenClean® Liquid 5.0, both of which resulted in a significant decrease at all tested concentrations after 72 h. Interestingly, Microcystis wesenbergii is more resistant to algaecides than M. aeruginosa. Results from this study provide valuable data for treating cyanoHABs and show the varied efficacy of different algaecidal formulations.
1. Introduction
Cyanobacteria are photosynthetic bacteria essential in the functioning of aquatic systems and notorious for their ability to form cyanobacterial harmful algal blooms (cyanoHABs). In many inland waters, cyanoHABs have increased in frequency and intensity because of rising global temperatures and cultural eutrophication [1,2,3]. These cyanoHABs are detrimental to fresh waters due to the production of several toxic bioactive compounds (cyanotoxins) [4,5] and taste and odor compounds, that depreciate the quality of drinking and recreational waters and may aerosolize [6,7]. While the drivers of these blooms are well-studied, i.e., [1,8,9], methods of their mitigation and control warrant more investigation.
While long-term preventive mitigation and management efforts (i.e., nutrient reduction) are desired, results on cyanoHABs may not be observed or achieved for several decades. Therefore, in many waters experiencing blooms threatening public and environmental health, short-term solutions for immediate control are warranted, including the application of USEPA-registered chemical algaecides. Copper- and hydrogen peroxide-based formulations are commonly used chemical algaecides to treat cyanoHABs [10], while other active ingredients are sometimes used to target eukaryotic algal groups. The application of algaecides is a well-established practice supported by many peer-reviewed studies, i.e., [11,12,13,14,15,16,17,18,19,20,21,22]. However, much of these works are centered on the treatment of toxigenic cyanobacteria such as Microcystis aeruginosa (Kützing) Kützing and Microseira wollei (Farlow ex Gomont) G.B. McGregor and Sendall ex Kenins and few treatment efforts and studies have targeted other, nontoxic, nuisance bloom-forming cyanobacteria.
Microcystis is the most common cyanoHAB-forming genus across the globe. Though much focus is on the toxic species M. aeruginosa, other species of the genus can dominate and form blooms, e.g., Microcystis flos-aquae (Wittrock) Kirchner, M. panniformis Komárek, Komárková-Legnerová, Sant’Anna, M.T.P. Azevedo, and P.A.C. Senna, M. protocystis W.B. Crow, and M. wesenbergii (Komárek) Komárek ex Komárek [23,24,25,26]. In south Florida, M. wesenbergii can dominate blooms during the dry season (winter), but these do not have significant toxin levels (pers. obs.; <0.1 ppb). However, the presence of nontoxigenic cyanoHABs can negatively impact aquatic systems through light reduction for aquatic vegetation, oxygen depletion, taste and odor compound production, and decreased aesthetic value [27]. Therefore, their impact remains problematic and requires mitigation options and solutions.
The aim of this research was to test different chemical treatment methods for the control of a nuisance M. wesenbergii-dominated bloom. Site field bloom material was exposed to label-rate concentrations of algaecides and aquatic herbicides, and combinations thereof, to quantify the effects on cyanobacterial abundance and colony integrity. Understanding the effects of algaecides and herbicides on cyanobacteria at various concentrations will allow for the establishment of improved science-based management practices.
2. Materials and Methods
2.1. Field Collection, Water Chemistry, and Maintenance of Bloom
A crude algal bloom, along with site water, was collected from south Lake Okeechobee (Belle Glade, FL, USA) in early December 2018 and stored in food-safe high-density polyethylene 5-gallon buckets. Water quality was recorded using a YSI EXO3 multiparameter water quality sonde (YSI Inc., Yellow Springs, OH, USA) (Table 1). Bloom material was transported to the Fort Lauderdale Research and Education Center, University of Florida-IFAS (Davie, FL, USA) and placed into a large 66 L plastic tote, diluted to 1 × 10⁶ cells·mL−1 with source water (verified by counting aliquots using Sedgwick-Rafter), and aerated using an industrial air pump with several bubbling stones during the experimental setup; the bloom material was maintained at 25 °C under light using white fluorescent lighting (2.0 k LUX).
2.2. Cyanobacterial Exposures to Algaecides and Herbicides
Exposure treatments were prepared by adding 200 mL of homogenized bloom material to 400 mL Pyrex sterile glass beakers at a concentration of 1 × 10⁶ cells·mL−1. Ten individual algaecide formulations and five combinations of algaecide/herbicide formulations were evaluated at 4 exposure concentrations (n = 3) within legal label rates using relative field concentrations (i.e., application rates) (Table 2). The individual evaluated formulations included five copper-based algaecides (Algimycin® PWF, Argos, Captain® XTR, Cutrine® Ultra, and SeClear®), four hydrogen peroxide-based algaecides (GreenClean® Pro, GreenClean® Liquid 5.0, PAK® 27, and Phycomycin® SCP), and one endothall-based algaecide (Hydrothol® 191). The combination algaecide/herbicide evaluated included Algimycin® PWF and Clipper® SC, Algimycin® PWF and TradeWind® SC, Cutrine® Ultra and Tribune™, GreenClean® Liquid 5.0 and Hydrothol® 191, and Hydrothol® 191 and Tribune™ (Table 2). Untreated controls consisted of site water at the same cell density (1 × 10⁶ cells·mL−1) without product added (n = 3). Treatments were applied by aliquoting appropriate volumes of algaecides and herbicides from stock solutions into the beaker, then stirring to homogenize with a sterile glass rod. Beakers were maintained between 21–23 °C in 12:12 h light:dark period illuminated with cool white fluorescent bulbs.
After a 72 h (3 days after treatment [DAT]) exposure period, treatments were stirred and 40 mL of each treatment was pipetted into a 50 mL sterile falcon tube with the addition of 3 mL of Lugol’s solution. Cyanobacterial abundance was evaluated using cell counts performed on a Sedgewick–Rafter chamber. All images of cyanobacteria were captured on a compound light microscope (Amscope, United Scope LLC, Irvine, CA, USA). All data were graphed using “ggplot2” package v.3.3.5 [28] in R version 4.0.0 [29].
2.3. Chemical Concentration Validation
Water samples were collected from each prepared chemical stock solution and measured to verify exposure concentrations (Table 3). Copper concentrations were confirmed using analysis of acid-soluble copper using inductively coupled plasma mass spectrometry (ICP-OES; PerkinElmer Avio™ 200, Waltman, MA, USA) according to USEPA Method 200.7 [30]. Hydrogen peroxide concentrations were confirmed using a colorimetric method following Klassen et al. [31] in Kinley et al. [32]. Flumioxazin concentrations were evaluated using a liquid–liquid extraction technique using deionized water and ethyl acetate and measured using a GC/MS following Ferrell and Vencill [33].
2.4. Statistical Analysis
A two-way analysis of variance (ANOVA) was used to analyze cell count differences based on two factors—herbicide and herbicide concentrations. A Tukey’s HSD post-hoc test was used for multiple comparison of treatments and treatment concentrations. All data were analyzed using “multcomp” package v 1.4-14 [34] in R version 4.0.0 [29].
3. Results
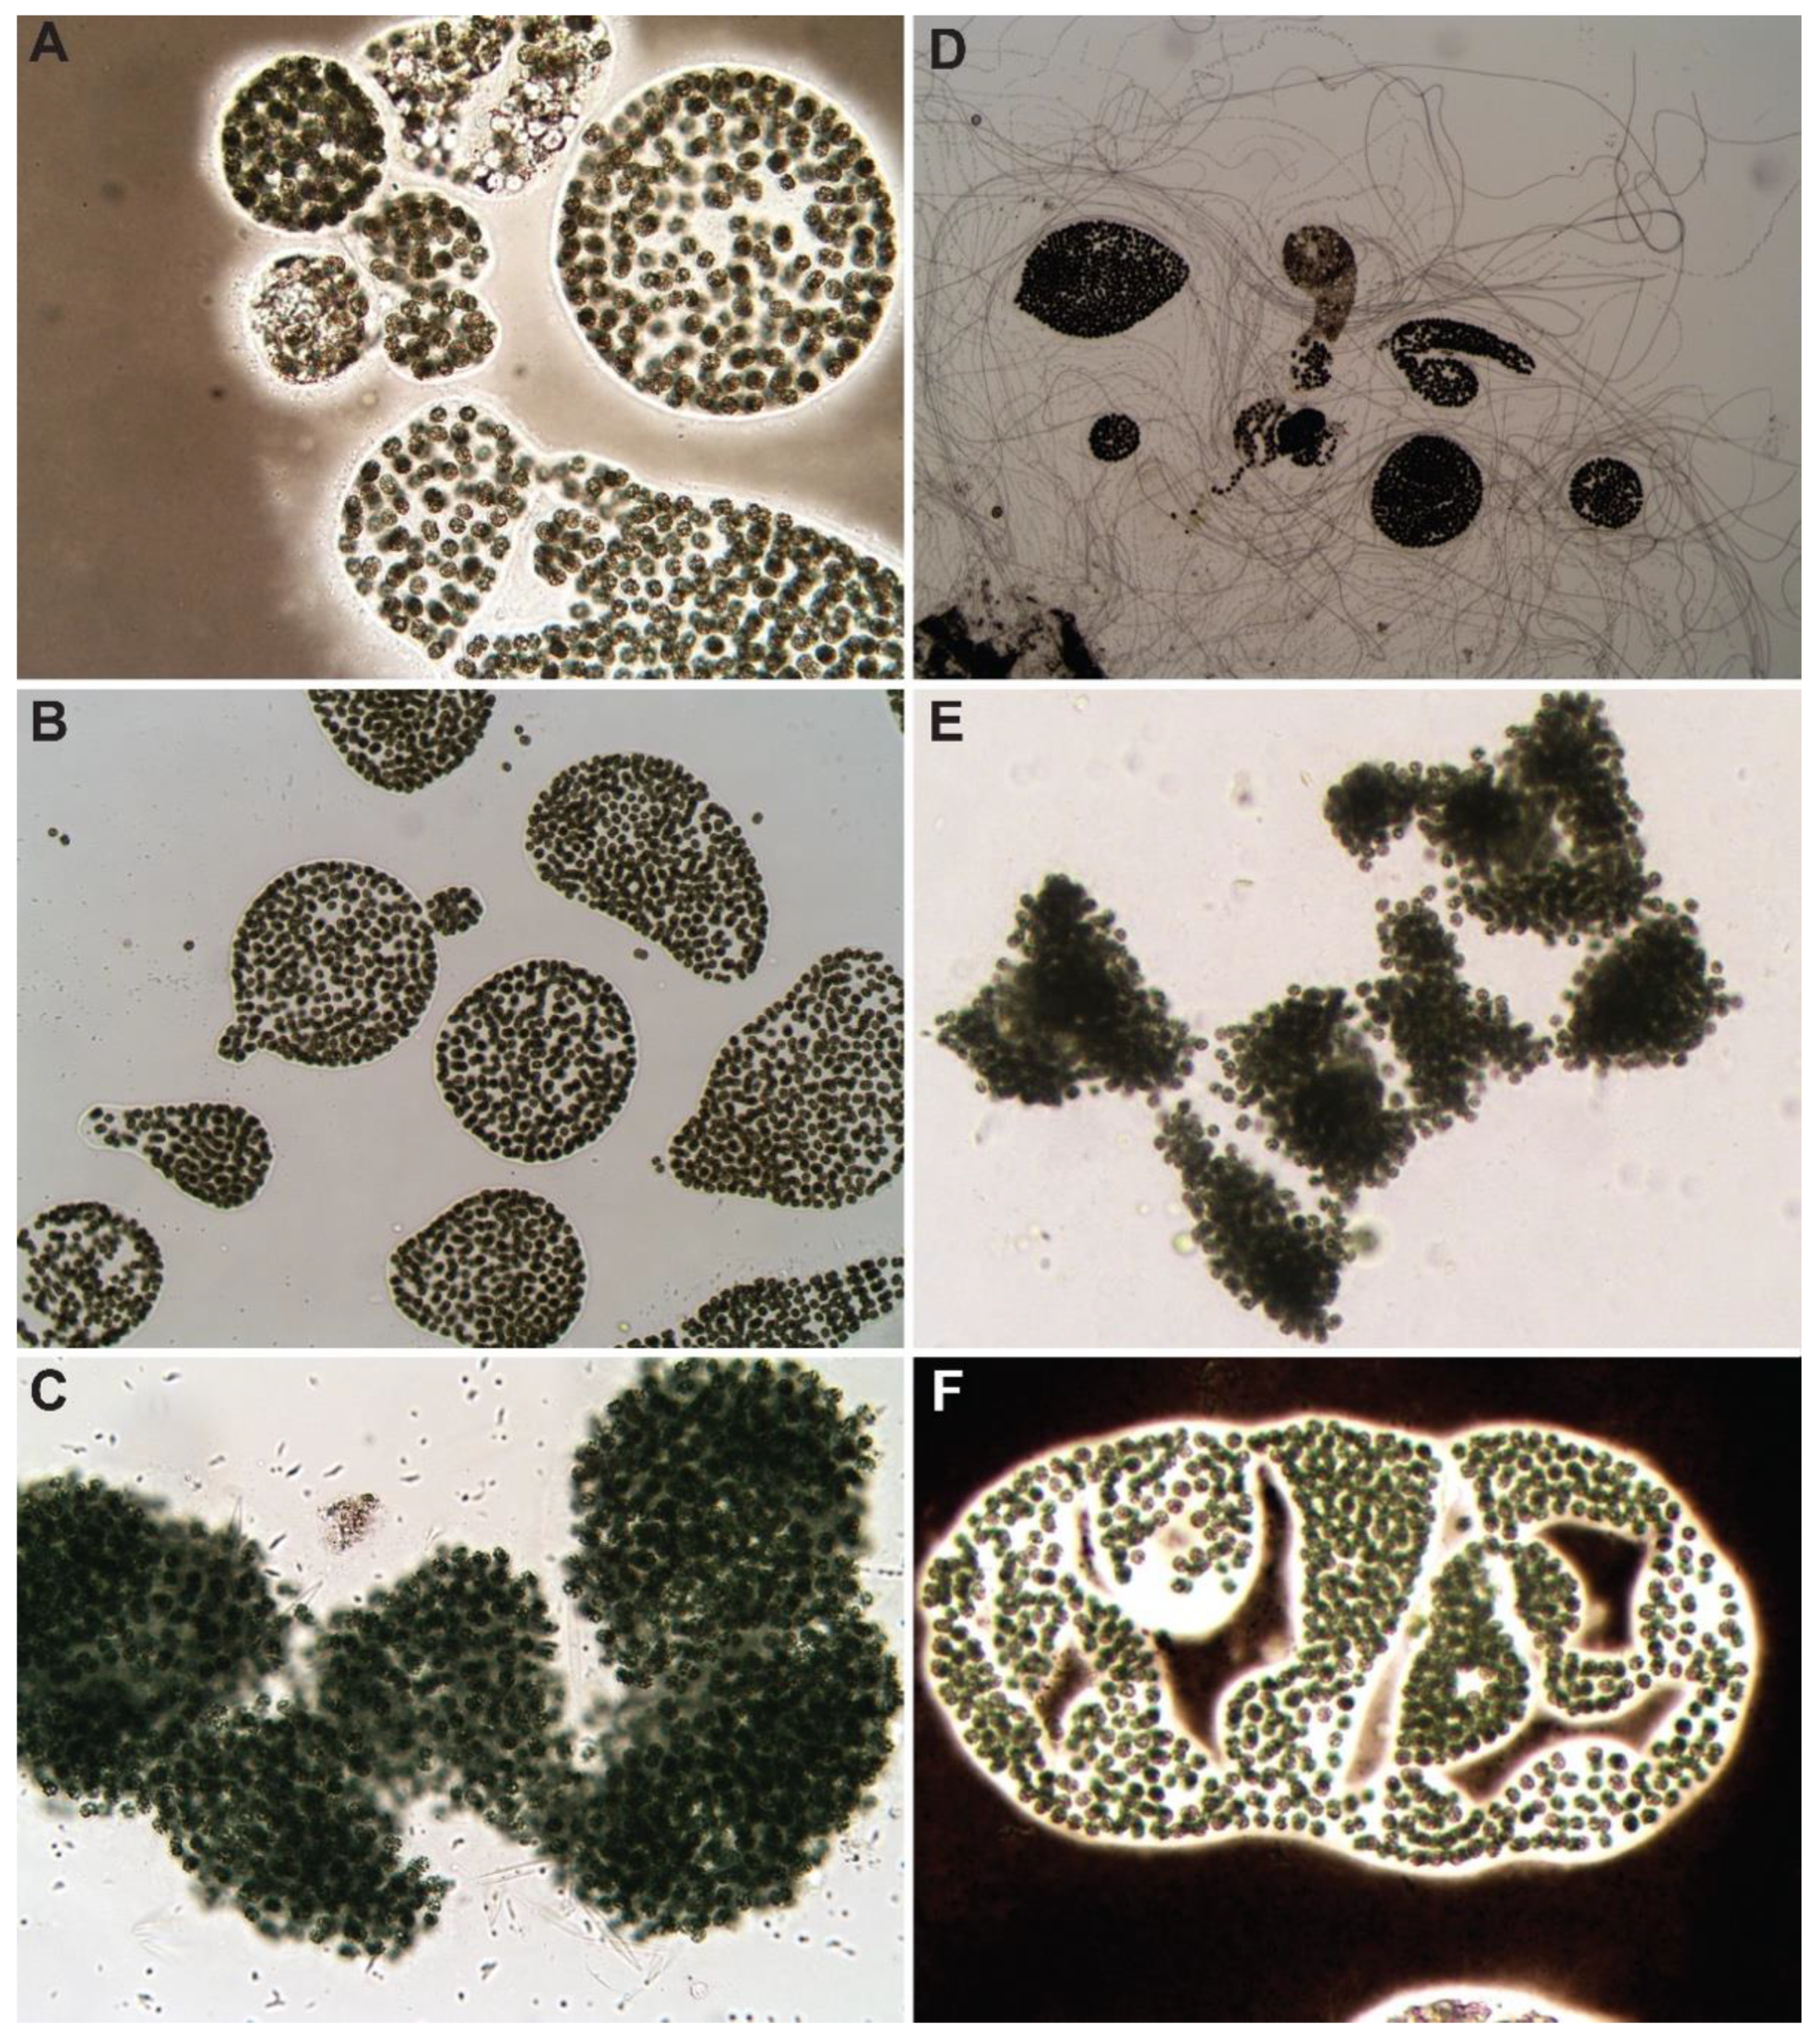
The bloom was dominated by M. wesenbergii (>90%) (Figure 1A,B) with few M. aeruginosa colonies (Figure 1C). Initial bloom microcystin concentration was evaluated using ELISA (Eurofins Abraxis, Warminster, PA, USA) and determined to be too low (<0.1 ppb) for analysis during this experiment.
Bloom response to algaecide application:
3.1. Control
At 72 h after treatment (HAT), the control decreased in abundance from 1 × 10⁶ cells·mL−1 to 6.25 × 10⁵ cells·mL−1 as determined through cell counts. Although there was a decrease in abundance in the control, this decrease did not mask the effects of algaecide treatments on the bloom (Figure 2). At 72 h post-exposure, the control group presented healthy colony formations of M. wesenbergii, with Pseudanabaena sp. also present in the exposure chambers at low abundance (Figure 1D); although it was not detected in the initial microscopic investigation (Figure 1A–C).
3.2. Hydrogen Peroxide-Based Algaecides
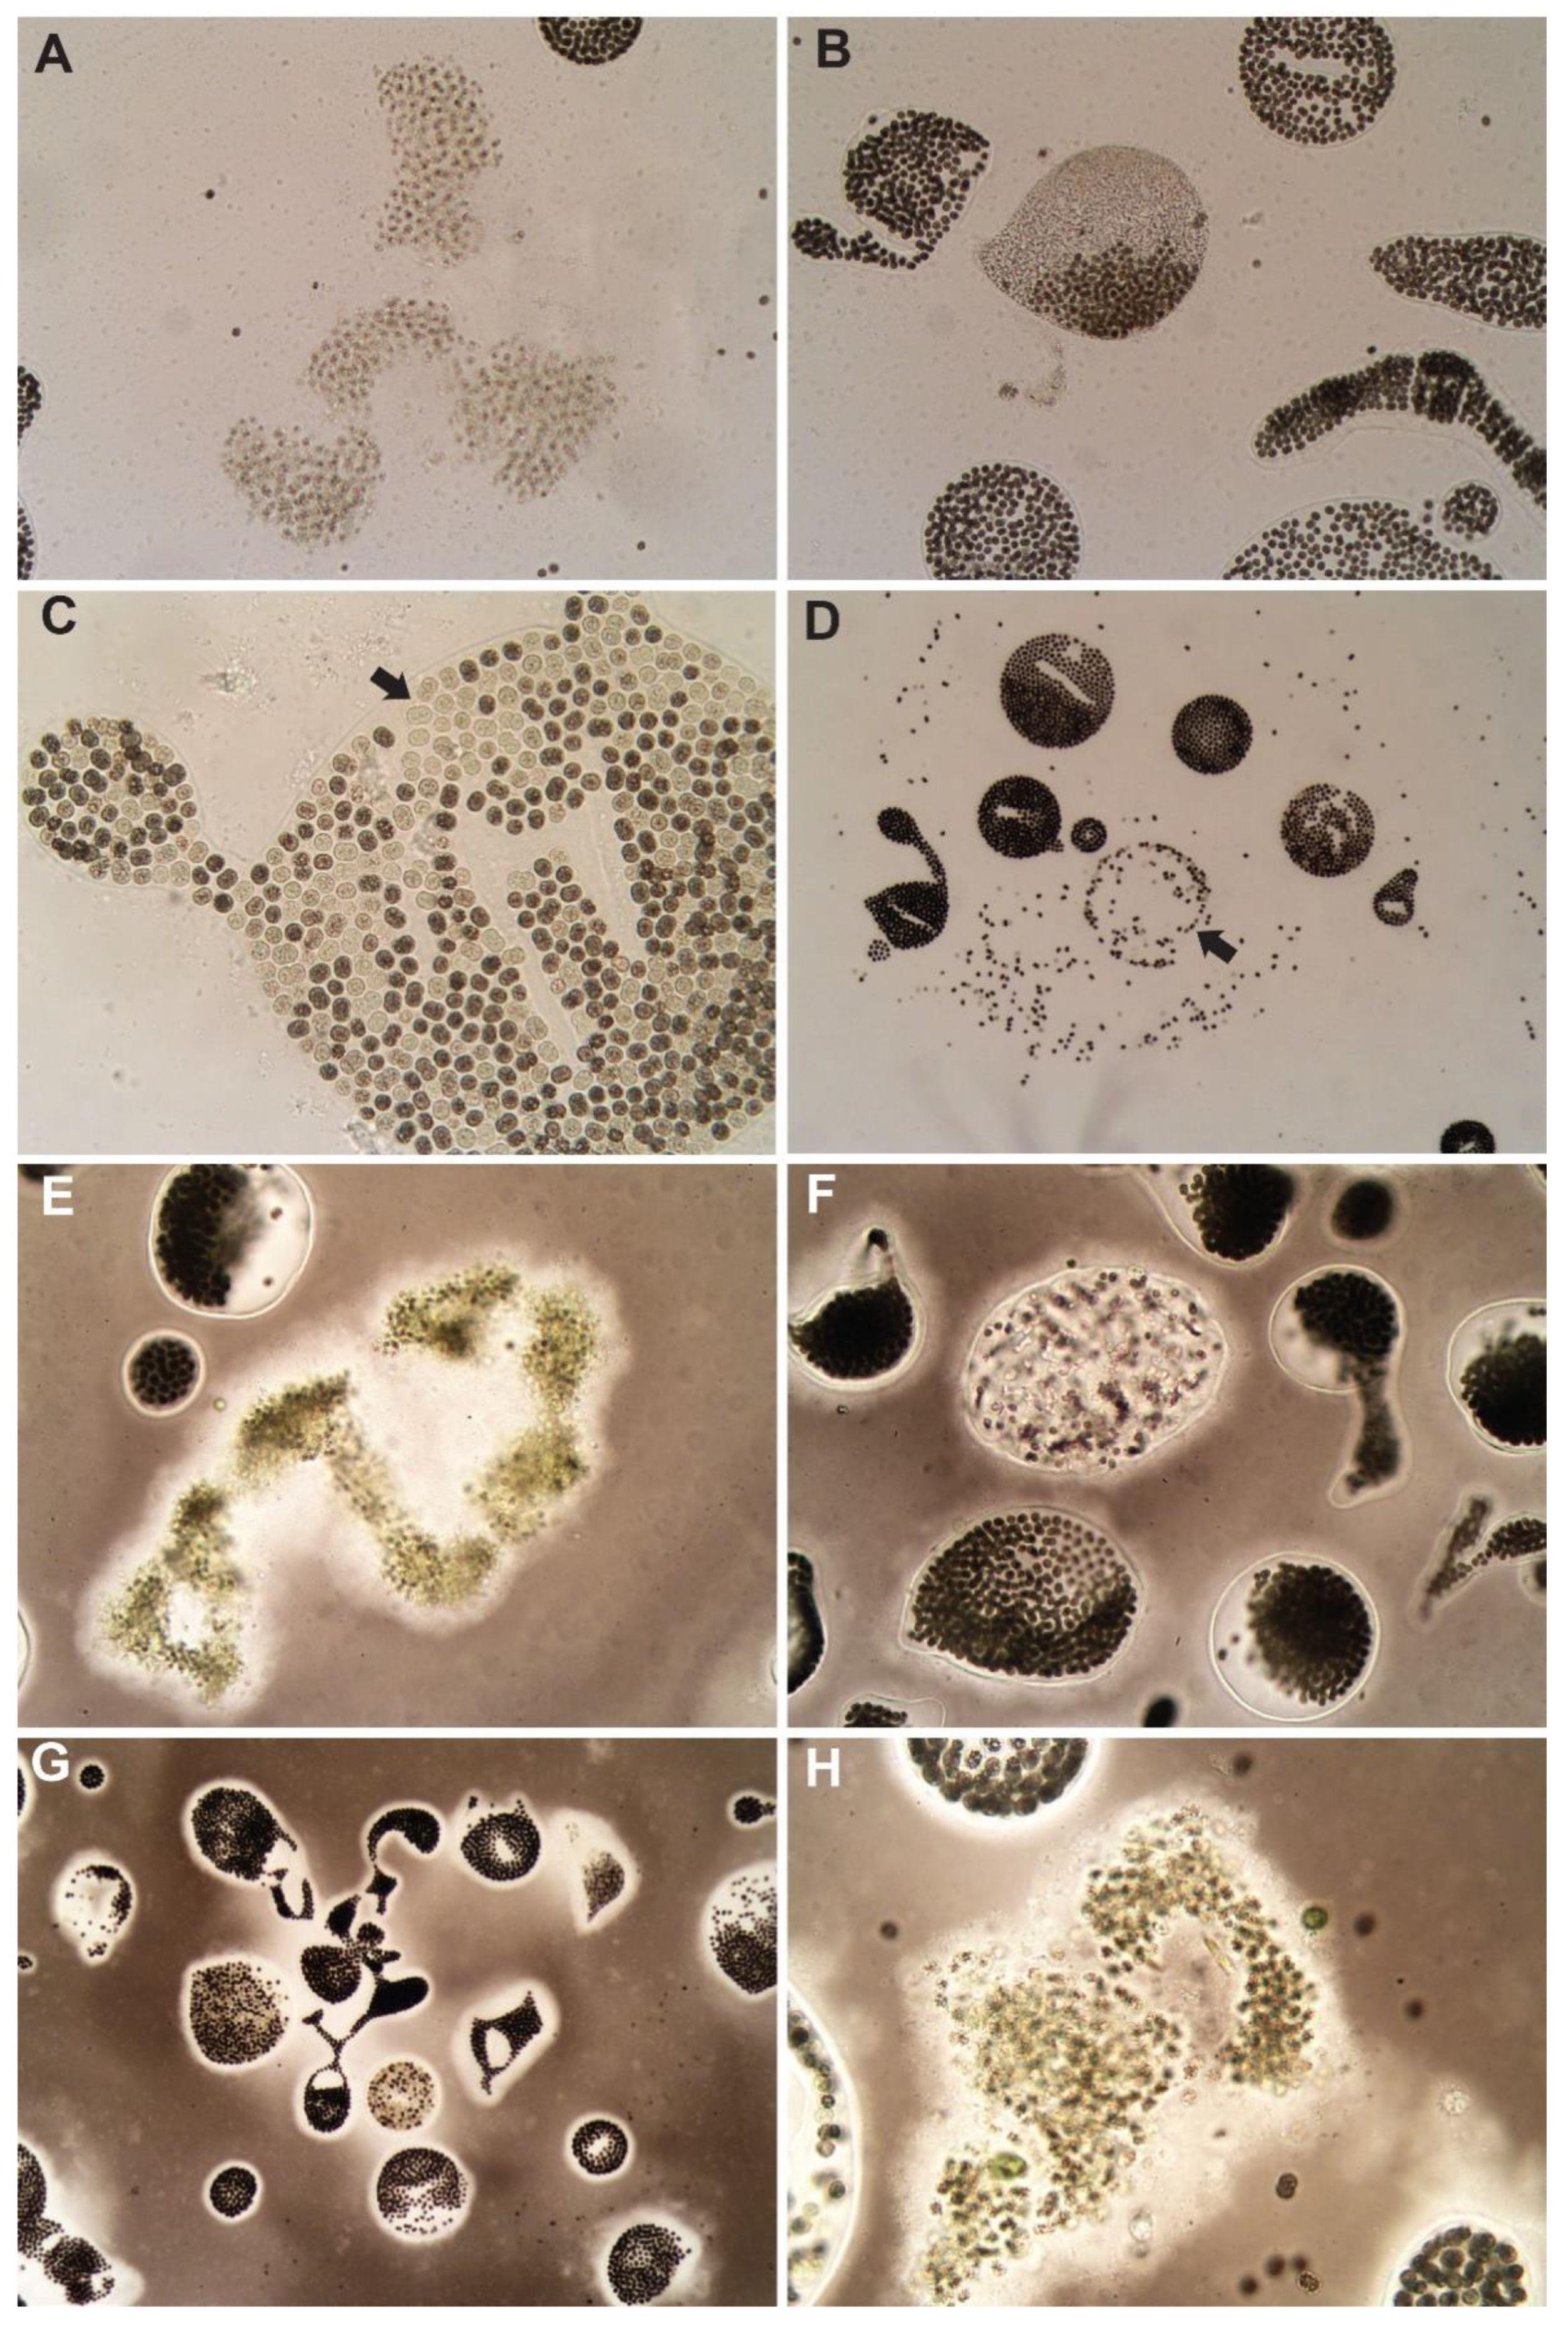
The liquid peroxide-based formula, GreenClean® Liquid 5.0 showed a decrease at all concentrations with a significant decrease at both high and max concentrations (15 and 22 mg H2O2·L−1, respectively). Of the peroxide-based algaecides, GreenClean® Pro at a maximum concentration (10 mg H2O2·L−1) proved most efficacious at decreasing M. wesenbergii concentration 72 HAT. Macroscopically, all treatments induced bleaching at high and max concentrations. Microscopic examinations revealed decaying and colony breakdown of M. wesenbergii (Figure 3B) and dead M. aeruginosa colonies (Figure 3A) at high and maximum concentrations of all products. For the granular peroxide-based algaecides (PAK® 27, Phycomycin® SCP, and GreenClean® Pro), there was a significant reduction in cell abundance at the maximum concentration of PAK® 27 and GreenClean® Pro (Figure 2) only; with several other concentrations of these two algaecides causing a non-significant decrease. Treatments with GreenClean® Pro decreased cell abundance at all concentrations, however, a significant decrease was only observed at the maximum concentration. Bleaching of cells and colony breakdown and distribution of M. wesenbergii cells were observed microscopically (Figure 3C,D). PAK® 27 proved to be effective at high and maximum concentrations (7 and 10 mg H2O2·L−1, respectively), with a significant decrease at maximum concentrations. Microscopically, dead colonies of M. aeruginosa and M. wesenbergii were seen (Figure 3E,F). Phycomycin® SCP did not lead to a significant decrease at any concentration. Microscopic evaluations of the maximum concentration revealed bleaching and colony breakdown of M. wesenbergii and dying M. aeruginosa colonies (Figure 3G,H).
3.3. Copper-Based Algaecides
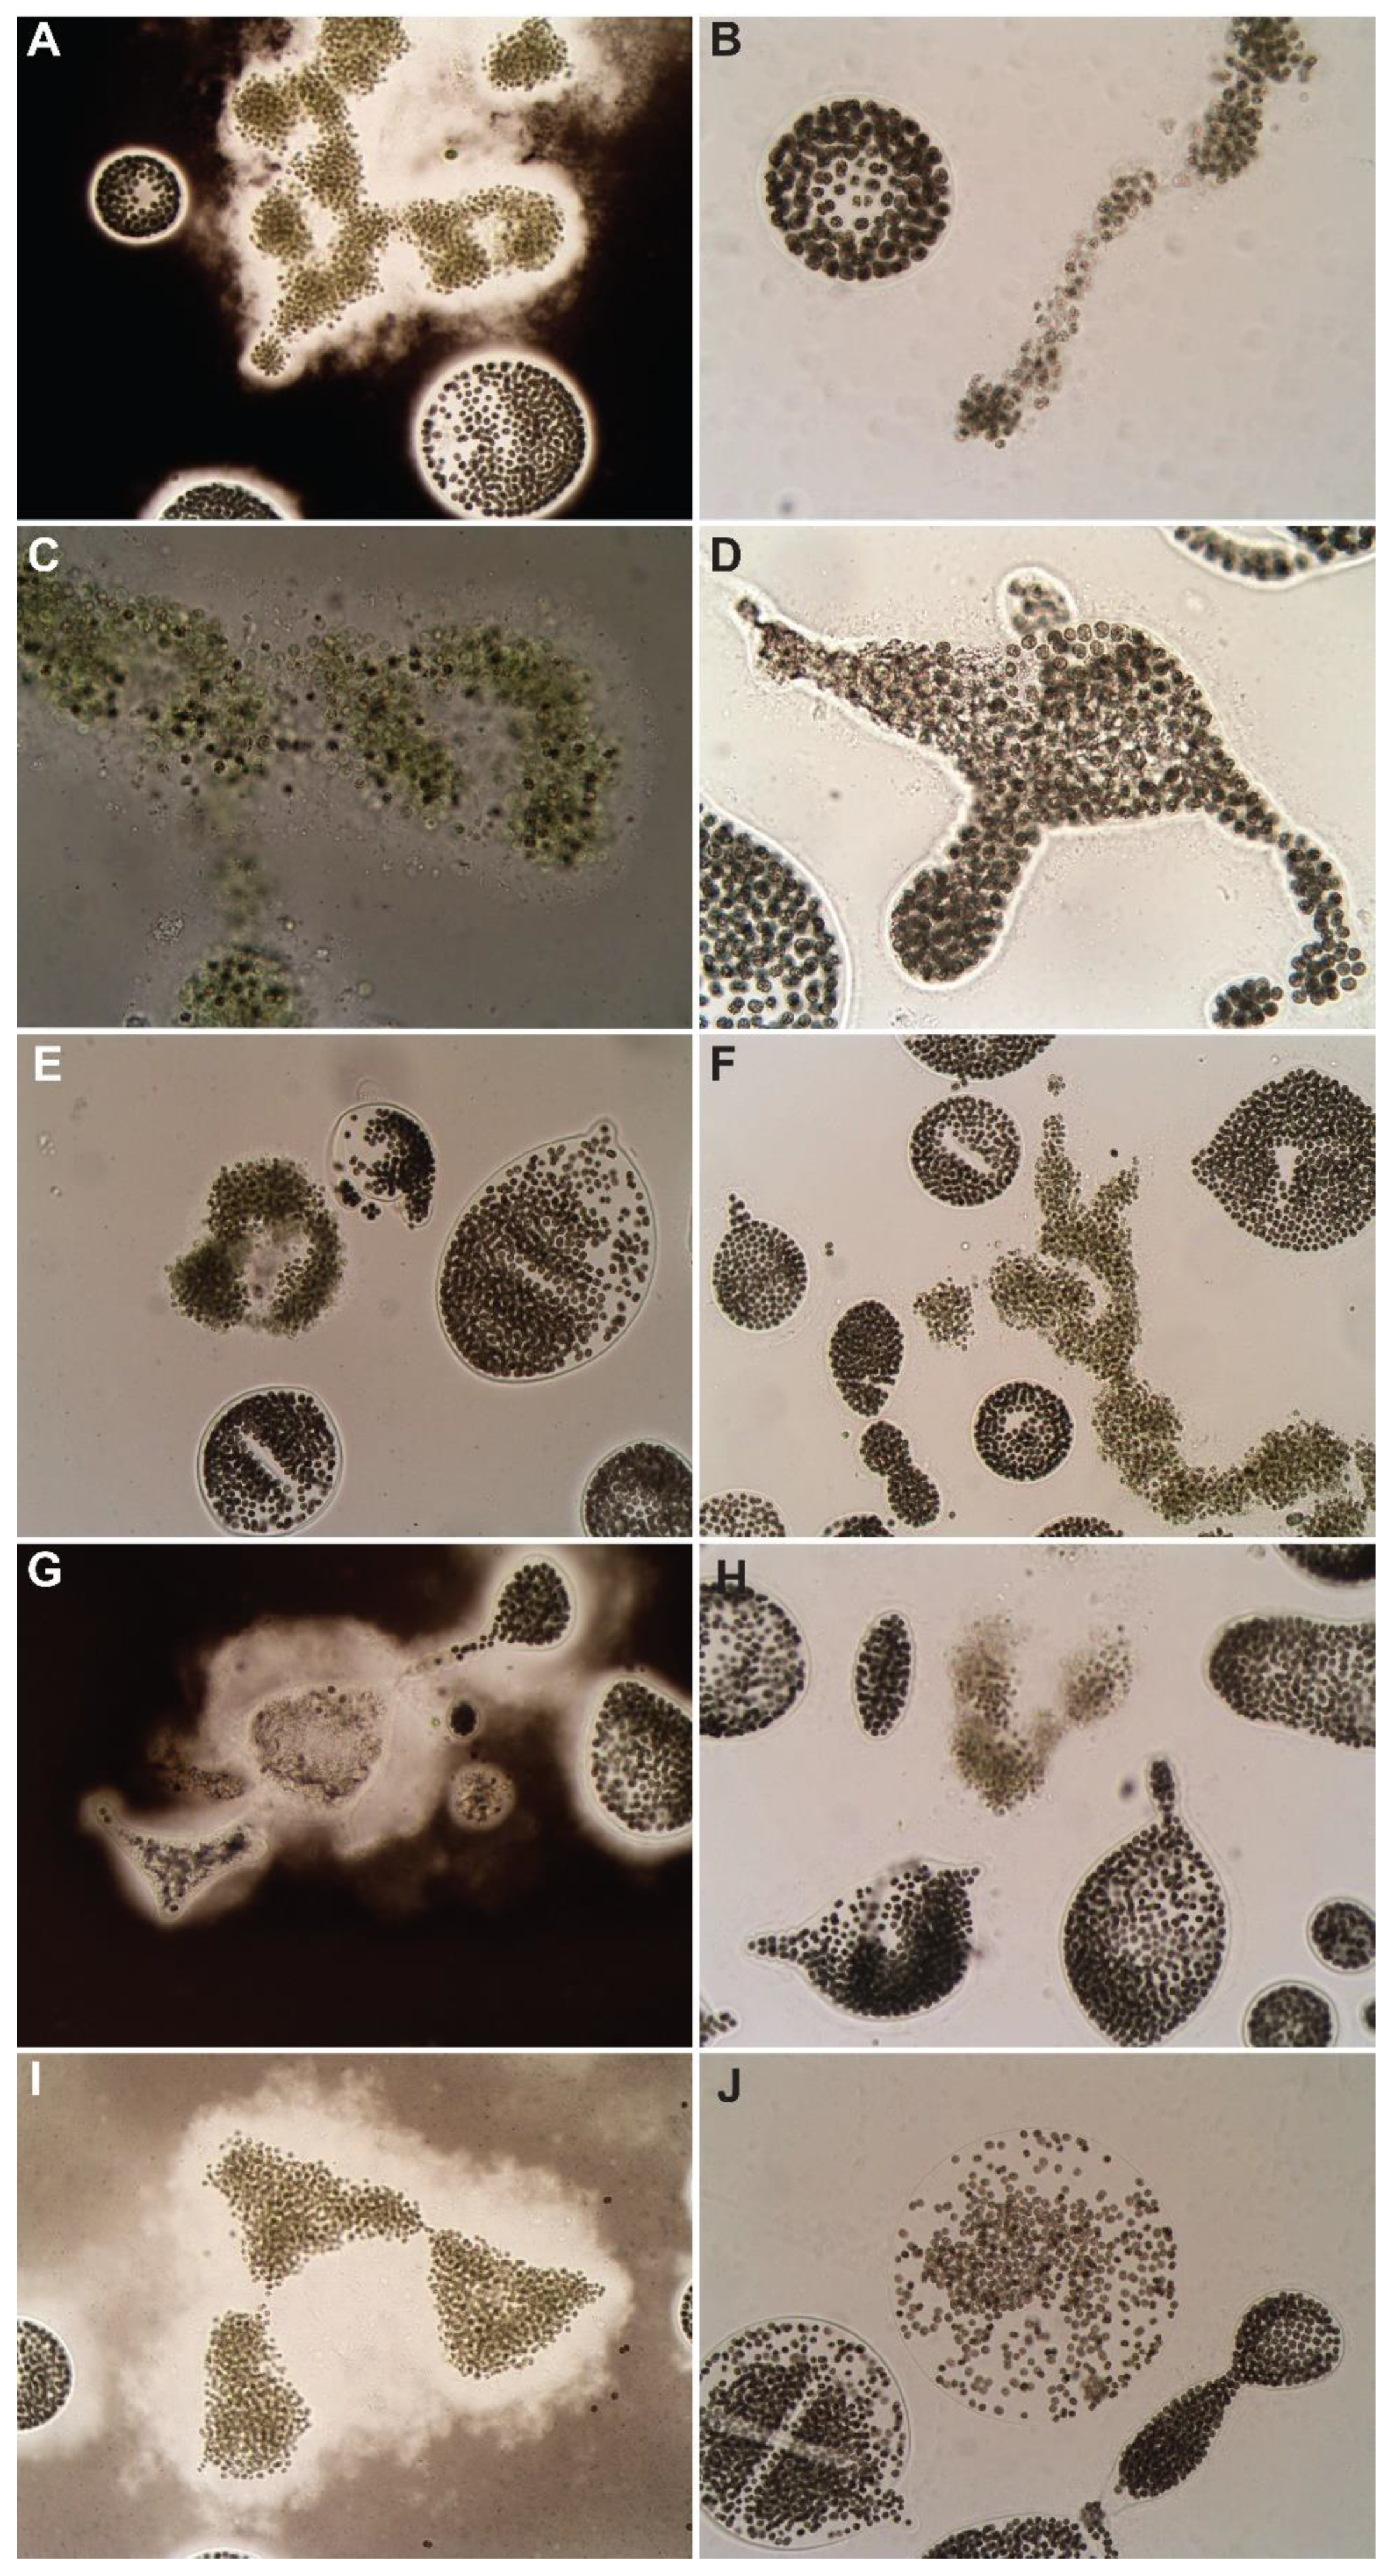
The copper-based algaecide treatments (Algimycin® PWF, Captain® XTR, Cutrine® Ultra, SeClear®, Argos) decreased abundance in at least two concentrations each, while SeClear®, Captain® XTR, and Argos each led to a significant decrease in abundance in at least one concentration (Figure 2). SeClear® significantly decreased cell abundance in all concentrations while Captain® XTR and Argos led to a significant decrease at maximum concentrations (1.0 mg Cu·L−1). The macroscopic evaluation showed bleaching of bloom material for all algaecides at high and maximum concentrations, 0.7 and 1.0 mg Cu·L−1, respectively (Supplementary Material). Microscopically, dead cells and degrading colonies were observed in all formulations (Figure 4). In those colonies that were degrading, live cells could still be observed (Figure 4D,E,J). Increased mucilage was seen for both M. aeruginosa and M. wesenbergii in the high and maximum concentrations of Algimycin® PWF, Cutrine® Ultra, and SeClear® (Figure 4A,G,I), each a different formulation of copper (Table 2). Dying M. aeruginosa could be seen in all treatments (Figure 4A–C,F,H). However, M. wesenbergii colonies were discolored and individual cell dissipation from colonies was observed at maximum exposure to SeClear® (Figure 4J).
3.4. Endothall-Based Algaecide
Hydrothol® 191 decreased cell abundance at all concentrations except the low concentration, with a significant decrease at the maximum concentration. Based on macroscopic observations, adverse effects occurred at the maximum concentration (1 mg·L−1), as the color of the cells changed from blue-green to pale green (Supplementary Material). In the maximum concentration, cells of M. aeruginosa were bleached (Figure 5E), while M. wesenbergii showed some colony breakdown and clumping of the mucilage (Figure 5F).
3.5. Combination Treatments
For the Hydrothol® 191 and GreenClean® Liquid 5.0 combination treatment, all concentrations resulted in a significant decrease in cell abundance (Figure 2). Macroscopically, there was no discernable difference between the combination of algaecides and the algaecides alone (Supplementary Material). At the maximum concentration rate, all M. aeruginosa colonies appeared dead (Figure 5J), while the M. wesenbergii cells had shrunk in size with decreased mucilage and some colony breakdown (Figure 5I).
For the Tradewind® and Algimycin® PWF combination treatment, no exposures resulted in a significant decrease in cell abundance compared to the control. Macroscopically, bloom material in exposures of high and maximum concentrations was discolored (Supplementary Material). Conversely, new growth was observed microscopically in minimum concentrations (Figure 5C), while discolored colonies of both M. aeruginosa and M. wesenbergii were observed at the maximum concentration (Figure 5D).
For the Tribune™ and Cutrine® Ultra combination treatment, all exposures resulted in a decrease in cell abundance, with significant decreases at high and maximum concentrations. Macroscopically, bleaching occurred at maximum concentration. Based on microscopic observations, at minimum concentrations, many M. wesenbergii colonies were discolored and cells were degraded or separated from colony sheaths (Figure 5G). At maximum concentrations, M. wesenbergii colonies appeared to break down, leaving mucilage void of cells (Figure 5H).
For the Clipper® SC and Algimycin® PWF combination treatment, all exposures resulted in reduced abundance with a significant decrease at high and maximum concentrations. Macroscopically, bleaching occurred at high and maximum concentrations. Microscopic observations showed degradation of colonies of M. aeruginosa at the minimum concentration (Figure 5A), as well as some breakdown of M. wesenbergii colonies (Figure 5B). At the maximum concentration, increased degradation of mucilage was observed for both species (Figure 5F).
In the case of the Tribune™ and Hydrothol® 191 combination treatment, exposures resulted in varying effects. The combination led to greater decreases in abundance when compared to Hydrothol® 191 alone at low concentrations, while minimum and high concentrations were not significantly different from the control group. Microscopically, at the minimum concentration, colonies of M. wesenbergii were observed with open spaces within the mucilage, as well as nearly empty mucilage. Additionally in the minimum concentration, M. aeruginosa increased mucilage production. Within the highest concentration evaluated, discoloration of M. wesenbergii cells and colony breakdown were observed with mucilage degradation similar to that of the Hydrothol® 191-only treatment (Figure 5K,L).
3.6. Statistical Analyses
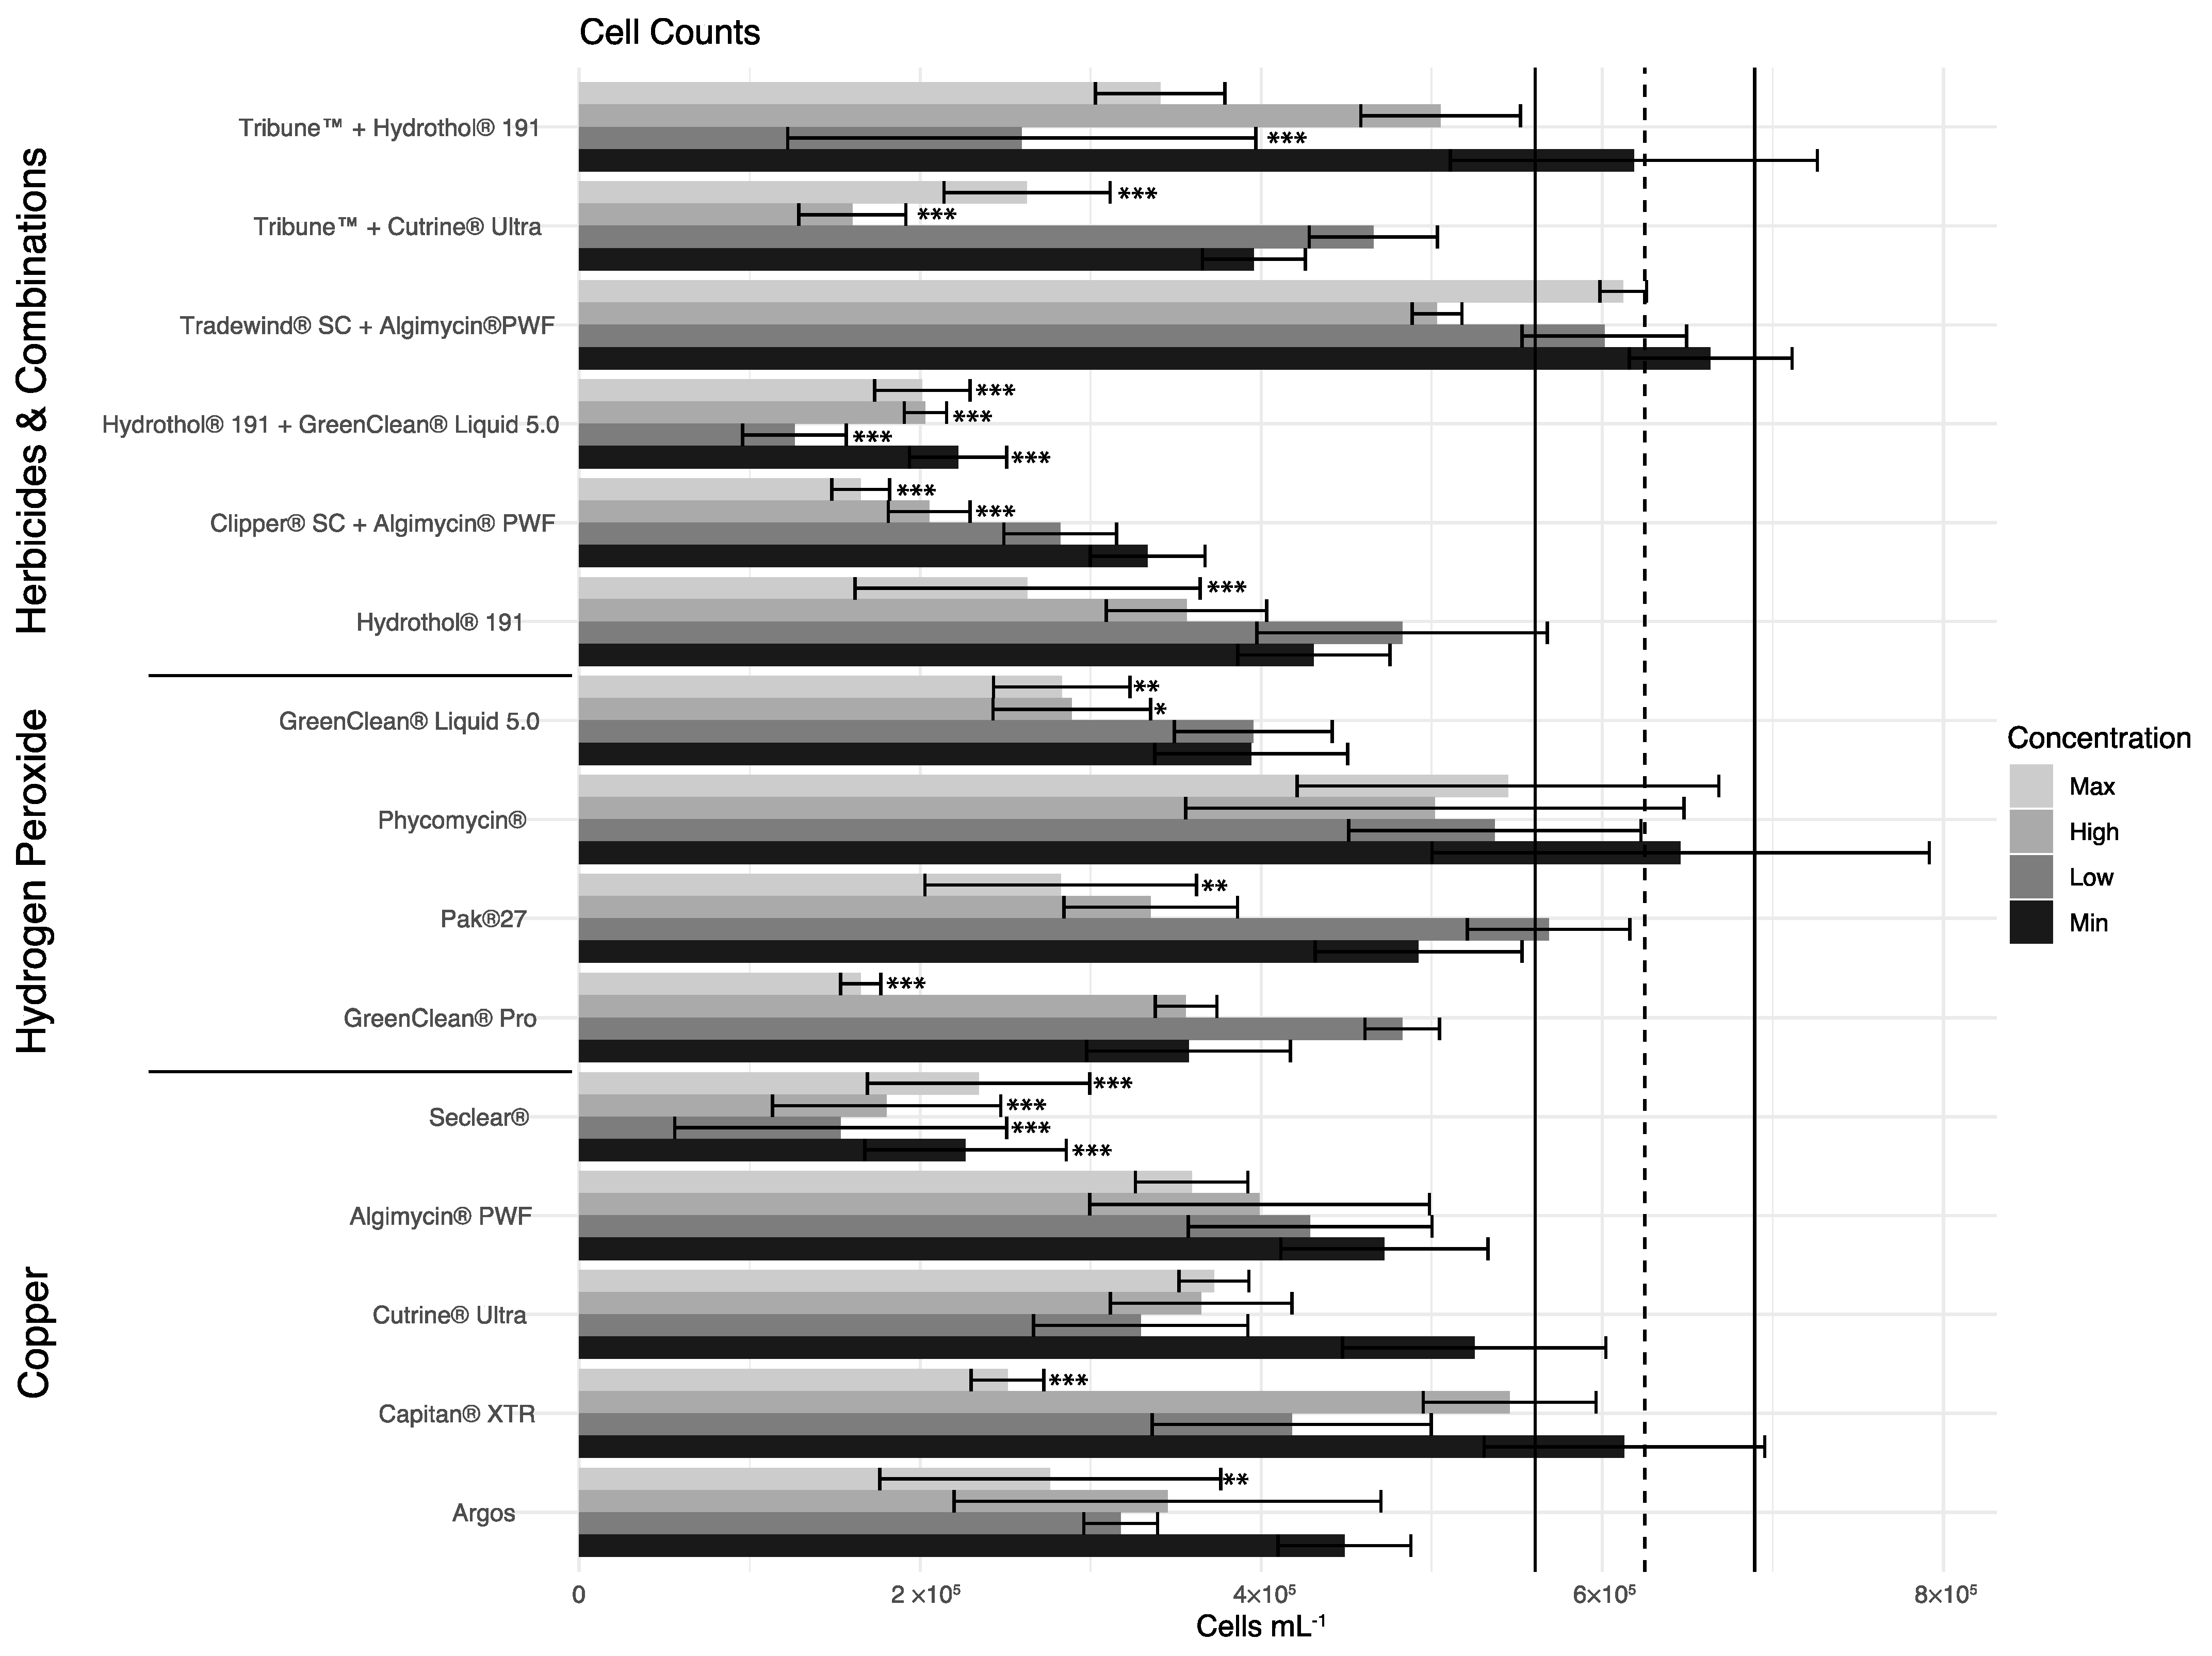
There was an overall significant difference in cell abundance among treatments and treatment concentrations (p < 0.001; p < 0.001) (Figure 2). Multiple comparisons showed only Hydrothol® 191 with GreenClean® Liquid 5.0 and SeClear® were significantly different in cell abundance compared to the control at all treatment concentrations (p ≤ 0.001). Argos, Capitan® XTR, GreenClean® Pro, PAK® 27, GreenClean® Liquid 5.0, Hydrothol® 191, Clipper® SC with Algimycin® PWF, and Tribune™ with Cutrine® Ultra were significantly different in cell abundance compared to the control at the maximum treatment concentration (p ≤ 0.01). GreenClean® Liquid 5.0, Clipper® SC with Algimycin® PWF, and Tribune™ with Cutrine® Ultra were significantly different in cell abundance compared to the control at a high treatment concentration (p ≤ 0.05). Lastly, Tribune™ with Hydrothol® 191 was significantly different in cell abundance compared to the control at a low treatment concentration (p ≤ 0.001). Among the copper treatments, SeClear® had the lowest cell densities at all concentrations at 72 HAT.
4. Discussion
Many abiotic and biotic factors affect the efficacy of algaecides, including pH, dissolved organic matter, temperature, hardness, algal/cyanobacterial species, and initial cell concentrations [21,35,36].
In our study, we found that the efficacy of the different chemical formulations in question varied on M. wesenbergii and that this species was more difficult to control than M. aeruginosa colonies occurring in the bloom. The treatments that were effective at all application rates include SeClear® and the combination of Hydrothol® 191 with GreenClean® Liquid 5.0. Similarly, Argos, Capitan® XTR, GreenClean® Pro, PAK® 27, GreenClean® Liquid 5.0, Hydrothol® 191, a combination of Clipper® SC with Algimycin® PWF, and a combination of Tribune™ with Cutrine® Ultra significantly decreased cell abundance compared to the control at the maximum treatment concentration (p ≤ 0.01). Since some chemicals were unable to significantly decrease cell abundance at any concentration in comparison to the control, we found that Cutrine® Ultra, Phycomycin® SCP, Algimycin® PWF, and a combination of Tradewind® SC with Algimycin® PWF are not effective options for the treatment of this M. wesenbergii-dominated bloom.
All peroxide-based algaecide products elicited a bleaching effect at maximum application rates. While the results of the peroxide-based algaecides are promising for the treatment of this M. wesenbergii-dominated bloom (except for Phycomycin® SCP), there was only a significant decrease in abundance at the maximum concentrations after 72 HAT. Peroxide-based algaecides are seen as relatively benign and a safer alternative to other chemical algaecides as they quickly decay, breaking down into water and oxygen products within 24 h and have little effect on non-target organisms [22,37,38,39]. However, due to fast decay, sequential applications may be required to achieve maximum control, especially at high initial cell concentrations [22]. The lower peroxide concentrations would likely prove more effective at a lower initial cell concentration, over longer periods of time, or after repeated application (i.e., pulses) [20,22,35,36,40].
Nearly all applied rates of the copper-based formulations decreased the abundance of M. wesenbergii cells, though many rates were not significant. The maximum applied concentrations of Argos and Captain® XTR and all concentrations of SeClear® resulted in a significant decrease from the untreated control. This difference in efficacy could partly be due to the chemical formulations of the products, as SeClear® was the only copper sulfate pentahydrate formulation analyzed and studies have shown that the efficacy of copper formulations can differ [15,19,41]. Some studies have indicated that chelated copper formulations are more effective at lower copper concentrations than copper sulfate pentahydrate, for example, in Planktothrix agardhii (Gomont) Anagnostidis and Komárek [15] and Microseira wollei [41]. However, in M. aeruginosa-dominated blooms, Kinley-Baird et al. [19] found that all copper formulations evaluated had a similar effect, but SeClear® had a lower minimum effective concentration compared to other copper formulations, similar to what we observed in the present study. Generally, higher application rates resulted in a greater decrease in abundance and in bleaching. Both SeClear® and Algimycin® PWF, copper sulfate and copper citrate + copper gluconate, respectively, increased the mucilage of the colonies of M. wesenbergii, which is likely a physiological response to protect the organism from the algaecide [42,43]. This increase in mucilage was not observed in treatments with Argos, Cutrine® Ultra, and Captain® XTR, namely all copper ethanolamine products. However, these formulations led to colony degradation for both M. aeruginosa and M. wesenbergii.
The endothall-based formulation, Hydrothol® 191, significantly decreased the cyanobacteria at maximum exposure concentration, though this product is usually used to control filamentous green algae (e.g., Cladophora, Pithophora) and is not suggested for widespread usage above 0.3 mg·L−1 due to potential fish toxicity. Given this density-dependence and potential for adverse effects on non-target organisms at high application rates that may be necessary to achieve control in the field, it might not be practical to consider Hydrothol® 191 for in situ treatment of this M. wesenbergii-dominated bloom.
The combination treatment of Hydrothol® 191 and GreenClean® Liquid 5.0, presented a significant decrease in abundance compared to the control, and an overall greater decrease compared to endothall alone. The combination of Tribune™ and Hydrothol® 191 had varied efficacy, with a significant decrease seen at the low concentration only. Microscopic examination showed colony breakdown and a cell discoloration in both treatments (i.e., with and without the addition of Tribune™) (Figure 5E,F,K,L). It does appear that the addition of Hydrothol® 191 improves the efficacy of GreenClean® Liquid 5.0 at all concentrations, while GreenClean® Liquid 5.0 showed a decrease in all concentrations, the addition of Hydrothol® 191 led to a greater decrease at all concentrations. The combinations of Clipper® SC and Algimycin® PWF also resulted in a significant decrease in abundance at maximum and high concentration, which was greater than that of Algimycin® PWF alone, while Tradewind® SC and Algimycin® PWF resulted in no change from the control. Microscopically, these treatments resulted in cell discoloration, as well as some colony breakdown (Figure 5D) while macroscopically, loss of cell pigments of the bloom material occurred (Supplementary Material). The combination of Tribune™ and Cutrine® Ultra resulted in a significant decrease in abundance for high and maximum concentrations. Microscopic evaluations show cell discoloration, colony degradation, as well as mucilage-lacking cells of the M. wesenbergii colonies (Figure 5H). While combination treatments of herbicides and algaecides may currently be unrealistic for in situ application due to label, these results indicate that for cyanobacteria with thicker sheaths, combination treatments may be required for better control, as was shown for tough aquatic vascular plants, such as Hydrilla verticillata (L.f.) Royle [44].
In summary, SeClear® proved to be the most efficacious algaecide overall, leading to a significant decrease at all concentrations within 72 h, while the combination of Hydrothol® 191 and GreenClean® Liquid 5.0 at the low concentration resulted in the greatest decrease in abundance (Figure 2). Compared to studies on Microcystis aeruginosa and mesocosm studies on natural blooms using some of the same products (e.g., Kinley-Baird et al. [19], Buley et al. [18], Pokrzywinski et al. [22]), M. wesenbergii seems to be a hardier species and more difficult to control as cell counts even in exposures to the best-performing products remained relatively high (Figure 2). These data shed light on viable treatment methods of nuisance cyanoHABs in both recreational and potable waters and indicate that species are also important to consider when determining best practices for the chemical control of cyanoHABs. The authors suggest that products should be used in accordance with directions on the manufacturer’s label and by federal or state law (e.g., application rates, recreational vs. potable waters, lotic vs. lentic waters, etc.).
Supplementary Materials
The following supporting information can be downloaded at: https://www.mdpi.com/article/10.3390/w14111739/s1, File S1: Macroscopic images of cyanobacteria in untreated controls 72-h post exposures.
Author Contributions
Conceptualization, H.D.L.IV and D.E.B.; methodology, H.D.L.IV, F.W.L., M.B. and D.E.B.; software, F.W.L., M.B. and D.E.B.; validation, H.D.L.IV, F.W.L., M.B. and D.E.B.; formal analysis, H.D.L.IV, F.W.L., M.B. and D.E.B.; investigation, H.D.L.IV, F.W.L., M.B. and D.E.B.; resources, H.D.L.IV and D.E.B.; data curation, H.D.L.IV, F.W.L., M.B. and D.E.B.; writing—original draft preparation, H.D.L.IV, F.W.L., M.B. and D.E.B.; writing—review and editing, H.D.L.IV, F.W.L., M.B. and D.E.B.; visualization, F.W.L., M.B. and D.E.B.; supervision, H.D.L.IV and D.E.B.; project administration, H.D.L.IV; funding acquisition, H.D.L.IV. All authors have read and agreed to the published version of the manuscript.
Funding
This research was funded by the Aquatic Ecosystem Restoration Foundation (AERF) and USDA-NIFA Hatch Project #FLA-FTL-00565697.
Data Availability Statement
The data presented in this study are available upon request from the corresponding author.
Acknowledgments
The authors would like to thank Ciera Kinley-Baird for valuable comments on an earlier version of this manuscript and discussions with Kaytee Pokrzywinski and West Bishop. The mention of trade and brand names in this publication is solely for the purpose of providing specific information and does not constitute a recommendation or warranty of the product by the authors or UF/IFAS, nor imply approval to the exclusion of other products of suitable composition. Products should be used in accordance with directions on the manufacturer’s label, and safety equipment required on the label and by federal or state law should be employed. Registrations of algaecides and herbicides may change, so it is the responsibility of the user to ascertain if a product is registered by the appropriate state and federal agencies for the intended use.
Conflicts of Interest
The authors declare no conflict of interest. The funders had no role in the design of the study; in the collection, analyses, or interpretation of data; in the writing of the manuscript, or in the decision to publish the results.
References
- Almanza, V.; Pedreros, P.; Laughinghouse, H.D., IV; Félez, J.; Parra, O.; Azócar, M.; Urrutia, R. Association between trophic state, watershed use, and blooms of cyanobacteria in south-central Chile. Limnologica 2019, 75, 30–41. [Google Scholar] [CrossRef]
- Merel, S.; Walker, D.; Chicana, R.; Snyder, S.; Baurès, E.; Thomas, O. State of knowledge and concerns on cyanobacterial blooms and cyanotoxins. Environ. Int. 2013, 59, 303–327. [Google Scholar] [CrossRef] [PubMed]
- Paerl, H.W.; Huisman, J. Climate change: A catalyst for global expansion of harmful cyanobacterial blooms. Environ. Microbiol. Rep. 2009, 1, 27–37. [Google Scholar] [CrossRef] [PubMed]
- Huang, I.-S.; Zimba, P.V. Cyanobacterial bioactive metabolites—A review of their chemistry and biology. Harmful Algae 2019, 86, 139–209. [Google Scholar] [CrossRef] [PubMed]
- Fiore, M.F.; de Lima, S.T.; Carmichael, W.W.; McKinnie, S.M.K.; Chekan, J.R.; Moore, B.S. Guanitoxin, re-naming a cyanobacterial organophosphate toxin. Harmful Algae 2020, 92, 101737. [Google Scholar] [CrossRef]
- Jang, M.; Berthold, D.E.; Yu, Z.; Silva-Sanchez, C.; Laughinghouse, H.D., IV; Denslow, N.D.; Han, S. Atmospheric Progression of Microcystin-LR from Cyanobacterial Aerosols. Environ. Sci. Technol. Lett. 2020, 7, 740–745. [Google Scholar] [CrossRef]
- Moretto, J.A.; Freitas, P.N.N.; Souza, J.P.; Oliveira, T.M.; Brites, I.; Pinto, E. Off-flavors in Aquacultured Fish: Origins and Implications for consumers. Fishes 2022, 7, 34. [Google Scholar] [CrossRef]
- Paerl, H.W.; Scott, J.T.; McCarthy, M.J.; Newell, S.E.; Gardner, W.S.; Havens, K.E.; Hoffman, D.K.; Wilhelm, S.W.; Wurtsbaugh, W.A. It Takes Two to Tango: When and Where Dual Nutrient (N & P) Reductions Are Needed to Protect Lakes and Downstream Ecosystems. Environ. Sci. Technol. 2016, 50, 10805–10813. [Google Scholar]
- Xu, H.; McCarthy, M.J.; Paerl, H.W.; Brookes, J.D.; Zhu, G.; Hall, N.S.; Qin, B.; Zhang, Y.; Zhu, M.; Hampel, J.J.; et al. Contributions of external nutrient loading and internal cycling to cyanobacterial bloom dynamics in Lake Taihu, China: Implications for nutrient management. Limnol. Oceanogr. 2021, 66, 1492–1509. [Google Scholar] [CrossRef]
- Laughinghouse, H.D., IV; Berthold, D.E.; Bishop, W.M. Approaches to managing cyanobacterial blooms and altering water quality. Aquatics 2020, 42, 13–16. [Google Scholar]
- Peterson, H. Toxicity of hexazinone and diquat to green algae, diatoms, cyanobacteria and duckweed. Aquat. Toxicol. 1997, 39, 111–134. [Google Scholar] [CrossRef]
- Ruzycki, E.M.; Axler, R.P.; Owen, C.J.; Martin, T.B. Response of phytoplankton photosynthesis and growth to the aquatic herbicide hydrothol 191. Environ. Toxicol. Chem. 1998, 17, 1530–1537. [Google Scholar] [CrossRef]
- Hadjoudja, S.; Vignoles, C.; Deluchat, V.; Lenain, J.-F.; Le Jeune, A.-H.; Baudu, M. Short term copper toxicity on Microcystis aeruginosa and Chlorella vulgaris using flow cytometry. Aquat. Toxicol. 2009, 94, 255–264. [Google Scholar] [CrossRef] [PubMed]
- Matthijs, H.C.P.; Visser, P.M.; Reeze, B.; Meeuse, J.; Slot, P.C.; Wijn, G.; Talens, R.; Huisman, J. Selective suppression of harmful cyanobacteria in an entire lake with hydrogen peroxide. Water Res. 2012, 46, 1460–1472. [Google Scholar] [CrossRef]
- Calomeni, A.J.; Rodgers, J.H.; Kinley, C.M. Responses of Planktothrix agardhii and Pseudokirchneriella subcapitata to Copper Sulfate (CuSO4·5H2O) and a Chelated Copper Compound (Cutrine® Ultra). Water Air Soil Pollut. 2014, 225, 2231. [Google Scholar] [CrossRef]
- Calomeni, A.J.; Iwinski, K.J.; Kinley, C.M.; McQueen, A.; Rodgers, J.H. Responses of Lyngbya wollei to algaecide exposures and a risk characterization associated with their use. Ecotoxicol. Environ. Saf. 2015, 116, 90–98. [Google Scholar] [CrossRef]
- Iwinski, K.J.; Calomeni, A.J.; Geer, T.D.; Rodgers, J.H. Cellular and aqueous microcystin-LR following laboratory exposures of Microcystis aeruginosa to copper algaecides. Chemosphere 2016, 147, 74–81. [Google Scholar] [CrossRef]
- Buley, R.P.; Adams, C.; Belfiore, A.P.; Fernandez-Figueroa, A.G.; Gladfelter, M.F.; Garner, B.; Wilson, A.E. Field evaluation of seven products to control cyanobacterial blooms in aquaculture. Environ. Sci. Pollut. Res. 2021, 28, 29971–29983. [Google Scholar] [CrossRef]
- Kinley-Baird, C.M.; Calomeni, A.; Berthold, D.E.; Lefler, F.W.; Barbosa, M.; Rodgers, J.H.; Laughinghouse, H.D., IV. Laboratory-scale evaluation of algaecide effectiveness for control of microcystin-producing cyanobacteria from Lake Okeechobee, Florida (USA). Ecotoxicol. Environ. Saf. 2021, 207, 111233. [Google Scholar]
- Santos, A.; Guedes, D.O.; Barros, M.U.G.; Oliveira, S.; Pacheco, A.B.F.; Azevedo, S.M.F.O.; Magalhães, V.F.; Pestana, C.J.; Edwards, C.; Lawton, L.A.; et al. Effect of hydrogen peroxide on natural phytoplankton and bacterioplankton in a drinking water reservoir: Mesocosm-scale study. Water Res. 2021, 197, 117096. [Google Scholar] [CrossRef]
- Papadimitriou, T.; Katsiapi, M.; Stefanidou, N.; Paxinou, A.; Poulimenakou, V.; Laspidou, C.S.; Moustaka-Gouni, M.; Kormas, K.A. Differential Effect of Hydroxen Peroxide on Toxic Cyanobacteria of Hypertrophic Mediterranean Waterbodies. Sustainability 2022, 14, 123. [Google Scholar] [CrossRef]
- Pokrzywinski, K.L.; Bishop, W.M.; Grasso, C.R.; Fernando, B.M.; Sperry, B.P.; Berthold, D.E.; Laughinghouse, H.D., IV; VanGoethem, E.M.; Volk, K.; Heilman, M.; et al. Evaluation of a Peroxide-Based Algaecide for Cyanobacteria Control: A Mesocosm Trial in Lake Okeechobee, FL, USA. Water 2022, 14, 169. [Google Scholar] [CrossRef]
- Sant’Anna, C.L.; Azevedo, M.T.P. Contribution to the knowledge of potentially toxic Cyanobacteria from Brazil. Nova Hedwig. 2000, 71, 359–385. [Google Scholar] [CrossRef]
- Komárek, O.; Keršner, V. On the dominance of the planktic cyanobacterium Microcystis wesenbergii—Ecological and statistical analysis of the population. Algol. Stud. 2000, 97, 29–42. [Google Scholar]
- Komárek, J.; Komárková-Legnerová, J.; Snat’Anna, C.L.; Azevedo, M.T.P.; Senna, P.A. Two common Microcystis species from tropical America. Criptogam. Algol. 2002, 23, 159–177. [Google Scholar]
- Carvalho, L.R.; Pipole, F.; Werner, V.R.; Laughinghouse, H.D., IV; Camargo, A.C.; Rangel, M.; Konno, K.; Sant’Anna, C.L. A toxic cyanobacterial bloom in an urban coastal lake, Rio Grande do Sul state, Southern Brazil. Braz. J. Microbiol. 2008, 39, 761–769. [Google Scholar] [CrossRef] [Green Version]
- Paerl, H. Mitigating Harmful Cyanobacterial Blooms in a Human- and Climatically-Impacted World. Life 2014, 4, 988–1012. [Google Scholar] [CrossRef] [Green Version]
- Wickham, H. ggplot2: Elegant Graphics for Data Analysis; Springer: New York, NY, USA, 2016. [Google Scholar]
- R Core Team. R: A Language and Environment for Statistical Computing; R Foundation for Statistical Computing: Vienna, Austria, 2020; Available online: https://www.R-project.org/ (accessed on 22 May 2022).
- U.S. EPA. Method 200.7: Determination of Metals and Trace Elements in Water and Wastes by Inductively Coupled Plasma-Atomic Emission Spectrometry; Revision 4.4; U.S. EPA: Cincinnati, OH, USA, 1994.
- Klassen, N.V.; Marchington, D.; McGowan, H.C.E. H2O2 determination by the I3- method and by KMnO4 titration. Anal. Chem. 1994, 66, 2921–2925. [Google Scholar] [CrossRef]
- Kinley, C.M.; Rodgers, J.H.; Iwinski, K.J.; McQueen, A.; Calomeni, A.J. Analysis of Algaecide Exposures: An Evaluation of the I3- Method to Measure Sodium Carbonate Peroxyhydrate Algaecides. Water Air Soil Pollut. 2015, 226, 170. [Google Scholar] [CrossRef]
- Ferrell, J.A.; Vencill, W.K. Gas Chromatographic/Mass Spectrometric Determination of Flumioxazin Extracted from Soil and Water. J. AOAC Int. 2004, 87, 56–59. [Google Scholar] [CrossRef] [Green Version]
- Hothorn, T.; Bretz, F.; Westfall, P. Simultaneous Inference in General Parametric Models. Biom. J. 2008, 50, 346–363. [Google Scholar] [CrossRef] [PubMed] [Green Version]
- Fitzgerald, G.P. Factors in the testing and application of algicides. Appl. Microbiol. 1964, 12, 247–253. [Google Scholar] [CrossRef] [PubMed]
- Kinley, C.M.; Iwinski, K.J.; Hendrikse, M.; Geer, T.D.; Rodgers, J.H., Jr. Cell density dependence of Microcystis aeruginosa responses to copper algaecide concentrations: Implications for microcystin-LR release. Ecotoxicol. Environ. Saf. 2017, 145, 591–596. [Google Scholar] [CrossRef] [PubMed]
- Gaikowski, M.P.; Rach, J.J.; Ramsay, R.T. Acute toxicity of hydrogen peroxide treatments to selected life stages of cold-, cool-, and warmwater fish. Aquaculture 1999, 178, 191–207. [Google Scholar] [CrossRef]
- Bauzá, L.; Aguilera, A.; Echenique, R.; Andrinolo, D.; Giannuzzi, L. Application of Hydrogen Peroxide to the Control of Eutrophic Lake Systems in Laboratory Assays. Toxins 2014, 6, 2657–2675. [Google Scholar] [CrossRef] [PubMed]
- Geer, T.D.; Kinley, C.M.; Iwinski, K.J.; Calomeni, A.J.; Rodgers, J.H., Jr. Comparative toxicity of sodium carbonate peroxyhydrate to freshwater organisms. Ecotoxicol. Environ. Saf. 2016, 132, 202–211. [Google Scholar] [CrossRef]
- Calomeni, A.J.; Kinley, C.M.; Geer, T.D.; Hendrikse, M.; Rodgers, J.H., Jr. Lyngbya wollei responses to copper algaecide exposures predicted using a concentration–exposure time (CET) model: Influence of initial biomass. J. Aquat. Plant Manag. 2018, 56, 73–83. [Google Scholar]
- Bishop, W.M.; Rodgers, J.H. Responses of Lyngbya wollei to Exposures of Copper-Based Algaecides: The Critical Burden Concept. Arch. Environ. Contam. Toxicol. 2012, 62, 403–410. [Google Scholar] [CrossRef]
- Ozturk, S.; Aslim, B. Modification of exopolysaccharide composition and production by three cyanobacterial isolates under salt stress. Environ. Sci. Pollut. Res. Int. 2010, 17, 595–602. [Google Scholar] [CrossRef]
- Yang, Z.; Linlin, G.; Wang, W.; Zhang, J. Combined effects of temperature, light intensity, and nitrogen concentration on the growth and polysaccharide content of Microcystis aeruginosa in batch culture Biochem. Syst. Ecol. 2012, 41, 130–135. [Google Scholar] [CrossRef]
- Pennington, T.G.; Skogerboe, J.G.; Getsinger, K.D. Herbicide/Copper combinations for improved control of Hydrilla verticillata. J. Aquat. Plant Manag. 2001, 39, 56–58. [Google Scholar]
Figure 1.
Microscopic images of the control at 0 h (A–C) and 72 h (D–F). (A) Microcystis wesenbergii colonies stained with ink, (B) M. wesenbergii colonies, (C) M. aeruginosa colony, (D) M. wesenbergii colonies with Pseudanabaena sp., (E) M. aeruginosa colony, and (F) M. wesenbergii colony stained with ink.

Figure 2.
Cell counts of Microcystis spp. at 72 h. Error bars represent standard error. Dotted vertical line represents control mean with solid bars representing standard error. Asterisks represent significance where * = p < 0.05, ** = p <0.01, *** = p < 0.001.
Figure 2.
Cell counts of Microcystis spp. at 72 h. Error bars represent standard error. Dotted vertical line represents control mean with solid bars representing standard error. Asterisks represent significance where * = p < 0.05, ** = p <0.01, *** = p < 0.001.

Figure 3.
Microcystis colonies 72 h post-treatment with peroxide-based algaecides. GreenClean® Liquid 5.0: (A) dead M. aeruginosa colonies, (B) M. wesenbergii colony breakdown and death. GreenClean® Pro: (C) M. wesenbergii colony bleaching, arrow indicates bleached cells, (D) M. wesenbergii colony breakdown and cell bleaching, arrow indicates colony breakdown. PAK® 27: (E) dead M. aeruginosa colony, (F) dead M. wesenbergii colony. Phycomycin® SCP: (G) M. wesenbergii colony breakdown and bleaching, (H) dead M. aeruginosa colony.

Figure 4.
Microcystis colonies 72 h post-treatment with copper-based algaecides. Algimycin® PWF: (A) dead M. aeruginosa colony with increased mucilage and (B) decaying M. aeruginosa colony. Argos: (C) decaying M. aeruginosa colony, (D) decaying M. wesenbergii colony with live cells. Captain® XTR: (E) degrading M. wesenbergii colonies, (F) decaying M. aeruginosa colony. Cutrine® Ultra: (G) decaying M. wesenbergii colony with increased mucilage, (H) dead M. aeruginosa colony. SeClear®: (I) dead M. aeruginosa colony with increased mucilage, (J) decaying M. wesenbergii colony with bleached cells.

Figure 5.
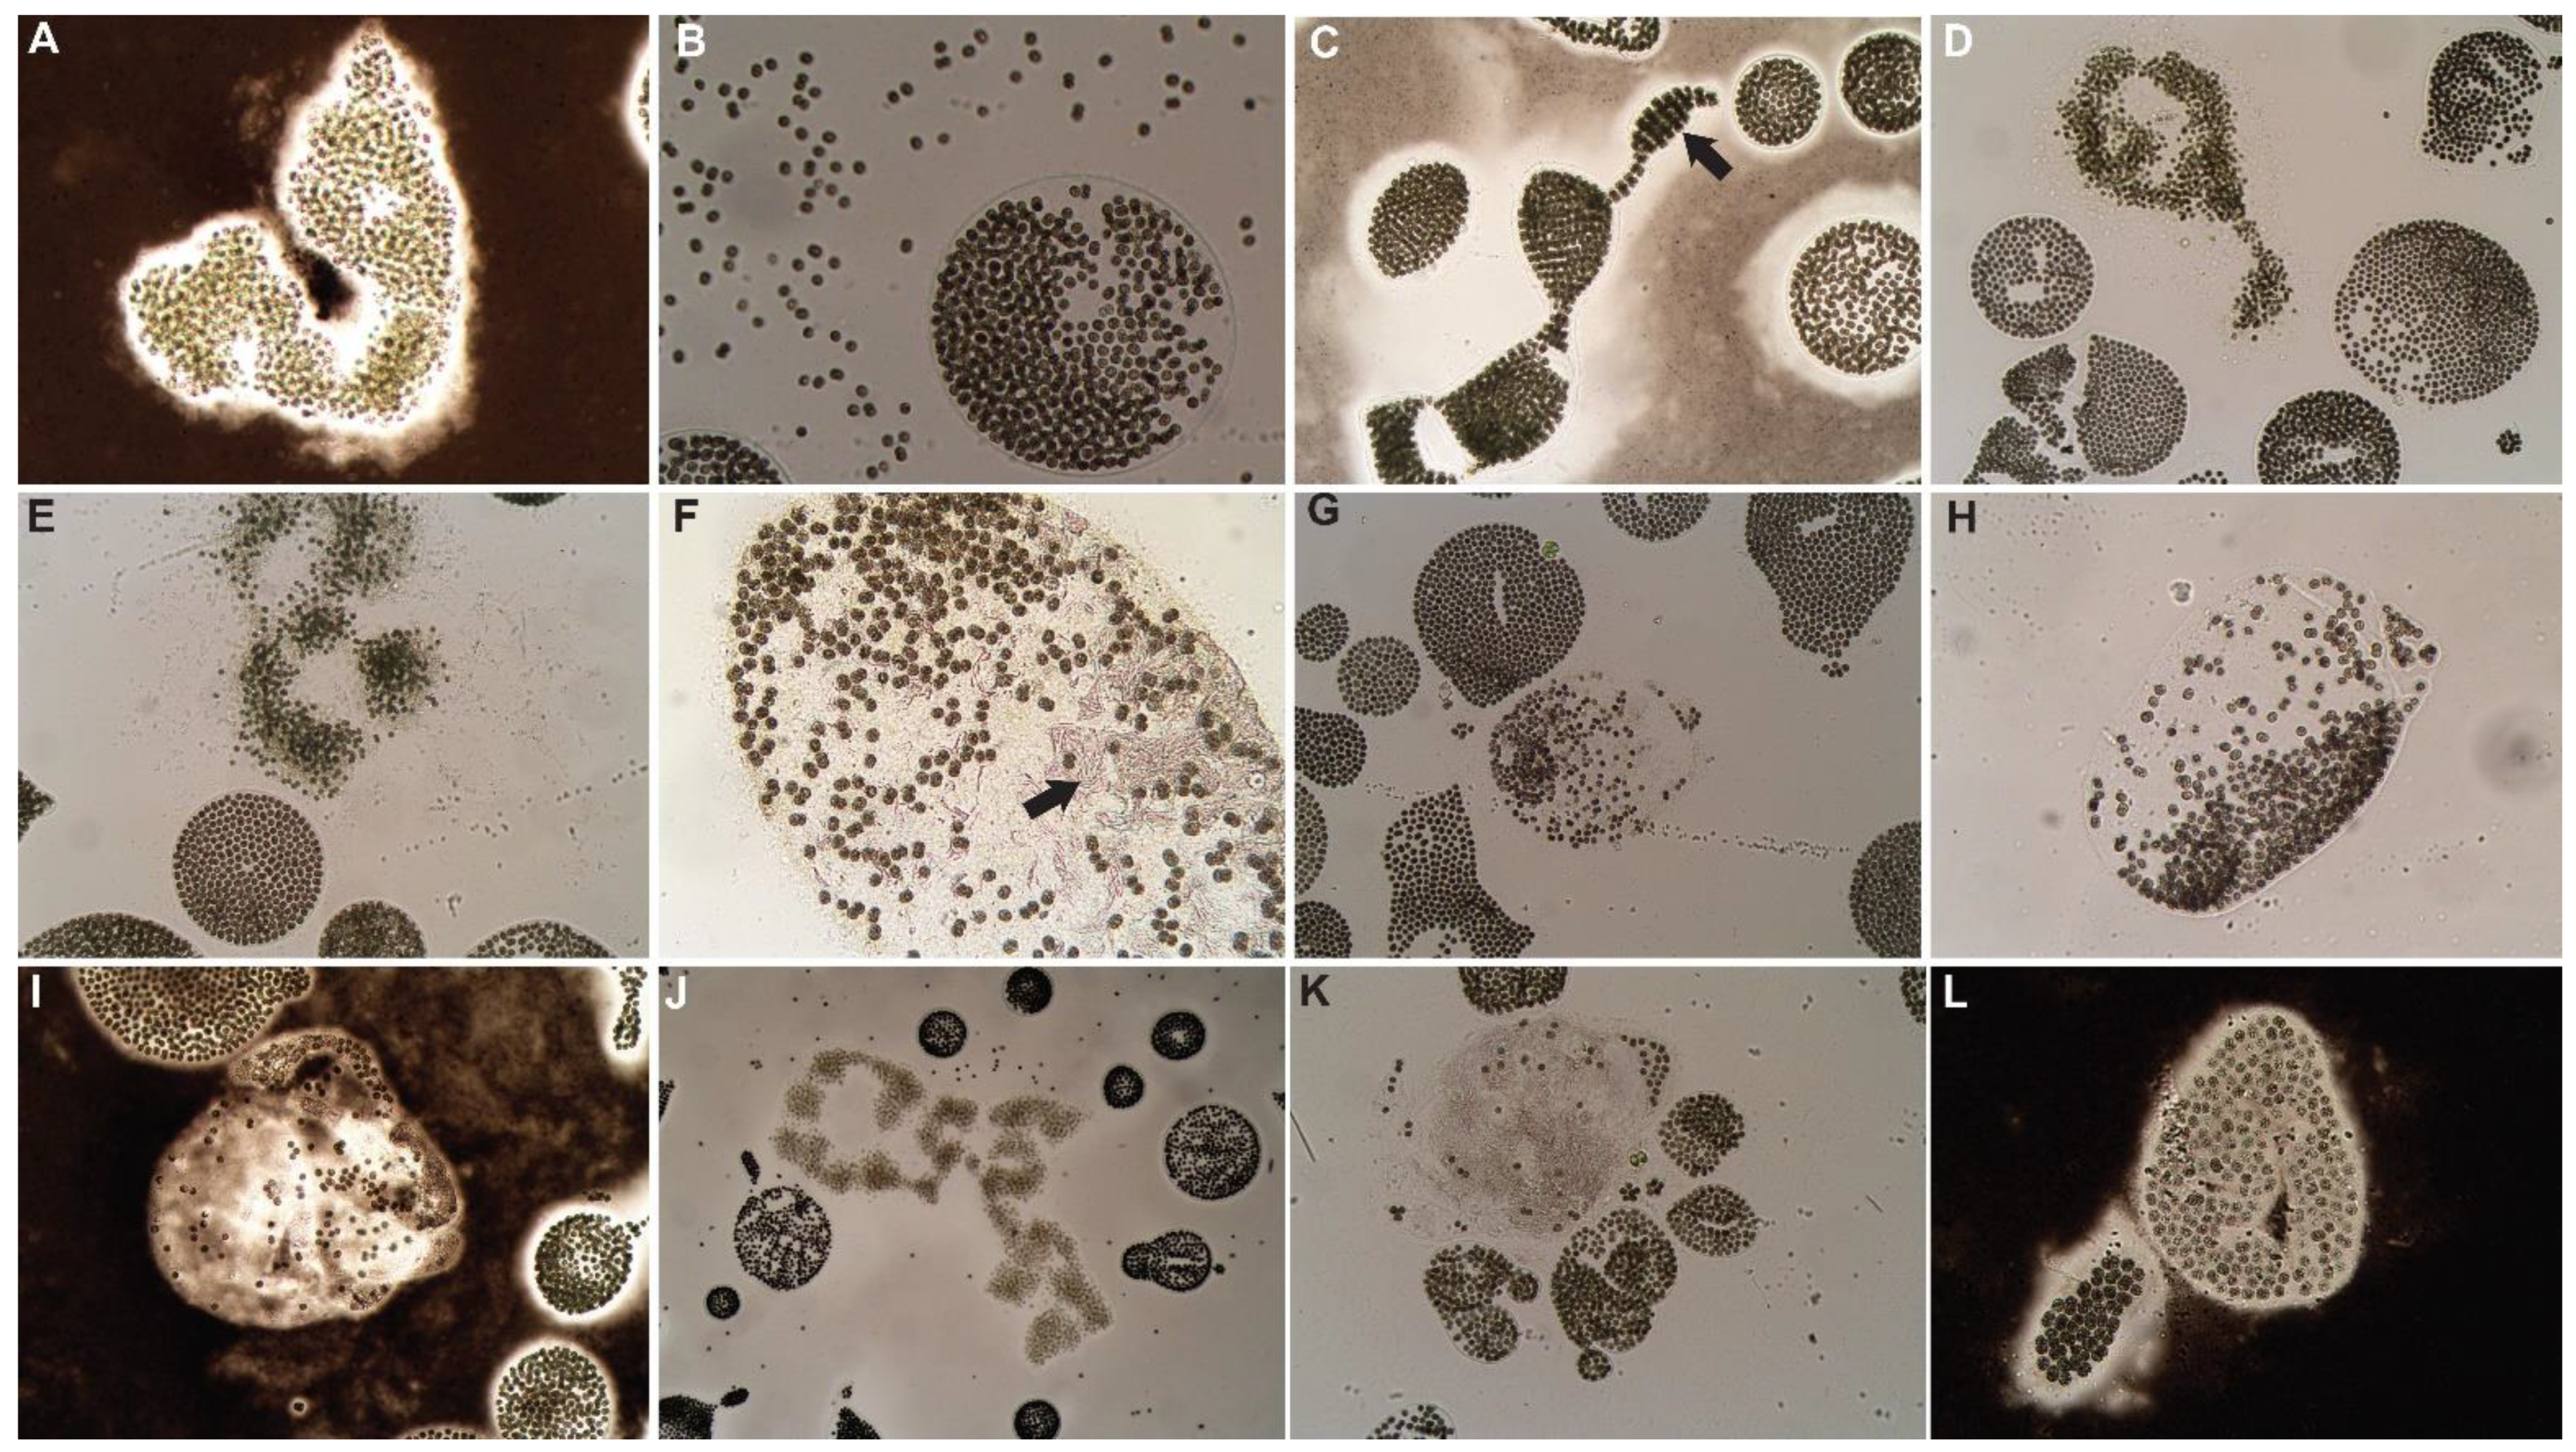
Microcystis colonies 72 h post-treatment with herbicides and herbicide + algaecide combination treatment. Clipper® SC + Algimycin® PWF: (A) dead M. aeruginosa colony, (B) decaying M. aeruginosa colony with released cells. Tradewind® SC + Algimycin® PWF: (C) new growth of M. wesenbergii, indicated by arrow, (D) discolored M. aeruginosa colony. Hydrothol® 191: (E) bleaching of M. aeruginosa colony, (F) breakdown of M. wesenbergii colony with clumping mucilage, indicated by arrow. Tribune™ + Cutrine® Ultra: (G) breakdown and bleaching of M. wesenbergii colony, (H) breakdown of M. wesenbergii colony. Hydrothol® 191 + GreenClean® Liquid 5.0: (I) breakdown of M. wesenbergii colony, (J) dead M. aeruginosa colony. Tribune™ + Hydrothol® 191: (K) breakdown of M. wesenbergii colony with clumping mucilage, (L) bleaching of M. wesenbergii cells.
Figure 5.
Microcystis colonies 72 h post-treatment with herbicides and herbicide + algaecide combination treatment. Clipper® SC + Algimycin® PWF: (A) dead M. aeruginosa colony, (B) decaying M. aeruginosa colony with released cells. Tradewind® SC + Algimycin® PWF: (C) new growth of M. wesenbergii, indicated by arrow, (D) discolored M. aeruginosa colony. Hydrothol® 191: (E) bleaching of M. aeruginosa colony, (F) breakdown of M. wesenbergii colony with clumping mucilage, indicated by arrow. Tribune™ + Cutrine® Ultra: (G) breakdown and bleaching of M. wesenbergii colony, (H) breakdown of M. wesenbergii colony. Hydrothol® 191 + GreenClean® Liquid 5.0: (I) breakdown of M. wesenbergii colony, (J) dead M. aeruginosa colony. Tribune™ + Hydrothol® 191: (K) breakdown of M. wesenbergii colony with clumping mucilage, (L) bleaching of M. wesenbergii cells.


Table 1.
Water characteristics measured in situ before experimental algaecide applications.
| Parameter | |
|---|---|
| Temperature (°C) | 19.8 |
| Dissolved Oxygen (%) | 83.3 |
| Conductivity (µS/cm) | 321.3 |
| pH (S.U.) | 7.94 |
Table 2.
Algaecide and herbicide formulations and concentrations evaluated.
| Product Name | Active Ingredient (s) | Range of Concentrations Evaluated as Active Ingredient | Concentrations in Terms of Application Concentration of Product |
|---|---|---|---|
| Cutrine® Ultra | Copper ethanolamine Complex | 0.3, 0.5, 0.7, 1.0 mg Cu·L−1 | 0.9, 1.5, 2.1, 3.0 gallons·acre-ft−1 as Cutrine® Ultra |
| Algimycin® PWF | Copper citrate and copper gluconate | 0.3, 0.5, 0.7, 1.0 mg Cu·L−1 | 1.59, 2.66, 3.72, 5.31 gallons·acre-ft−1 as Algimycin® PWF |
| Phycomycin® SCP | Sodium carbonate peroxyhydrate | 2, 5, 7, 10 mg H2O2·L−1 | 20, 49, 69, 100 lbs·acre-ft−1 as Phycomycin® SCP |
| GreenClean® Pro | Sodium carbonate peroxyhydrate | 2, 5, 7, 10 mg H2O2·L−1 | 20, 49, 69, 100 lbs·acre-ft−1 as GreenClean® Pro |
| GreenClean® Liquid 5.0 | Hydrogen peroxide and peroxyacetic acid | 4, 10, 15, 22 mg H2O2·L−1 | 5, 13, 20, 28.5 gallons·acre-ft−1 as GreenClean® Liquid 5.0 |
| SeClear® | Copper sulfate pentahydrate | 0.3, 0.5, 0.7, 1.0 mg Cu·L−1 | 1.95, 3.25, 4.55, 6.5 gallons·acre-ft−1 as SeClear® |
| PAK® 27 | Sodium carbonate peroxyhydrate | 2, 5, 7, 10 mg H2O2·L−1 | 20, 49, 69, 100 lbs·acre-ft−1 as PAK® 27 |
| Captain® XTR | Copper ethanolamine complex | 0.3, 0.5, 0.7, 1.0 mg Cu·L−1 | 0.9, 1.5, 2.1, 3 gallons·acre-ft−1 as Captain® XTR |
| Hydrothol® 191 | Amine salt of endothall | 0.15, 0.3, 0.5, 1.0 mg acid equivalents endothall·L−1 | 2.25, 4.5, 7.5, 15 gallons·acre-ft−1 as Hydrothol® 191 |
| GreenClean® Liquid 5.0 + Hydrothol® 191 | Hydrogen peroxide with peroxyacetic acid + Amine salt of endothall | 4, 10, 15, 22 mg H2O2·L−1 each with 0.3 mg acid equivalents endothall·L−1 mixed at the same time | 5, 13, 20, 28.5 gallons·acre-ft−1 of GreenClean Liquid 5.0 and 4.5 gallons·acre-ft−1 as Hydrothol® 191 |
| Argos | Copper ethanolamine complex | 0.3, 0.5, 0.7, 1.0 mg Cu·L−1 | 0.9, 1.5, 2.1, 3 gallons·acre-ft−1 as Argos |
| Algimycin® PWF + Clipper® SC | Copper citrate and copper gluconate + Flumioxazin | 0.1, 0.3, 0.5, 0.7 mg Cu·L−1 each mixed with 200 µg·L−1 flumioxazin | 0.53, 1.59, 2.66, 3.72 gallons·acre-ft−1 as Algimycin® PWF with 1.1 pounds·surface acre−1 of Clipper® SC |
| Algimycin® PWF + Tradewind® | Copper citrate and copper gluconate + bispyribac sodium | 0.1, 0.3, 0.5, 0.7 mg Cu·L−1 each mixed with 45 µg·L−1 bispyribac sodium | 0.53, 1.59, 2.66, 3.72 gallons·acre-ft−1 as Algimycin® PWF with 0.15 pounds·acre-ft−1 of Tradewind® |
| Cutrine® Ultra + Tribune™ | Copper ethanolamine complex + Diquat dibromide | 0.3, 0.5, 0.7, 1.0 mg Cu·L−1 each mixed with 0.37 mg diquat cation·L−1 (equivalent to 0.69 mg diquat dibromide·L−1) | 0.9, 1.5, 2.1, 3 gallons·acre-ft−1 of Cutrine® Ultra mixed with 0.5 gallons·acre-ft−1 of Tribune™ |
| Hydrothol® 191 + Tribune™ | Amine salt of endothall + Diquat dibromide | 0.15, 0.3, 0.5, 1.0 mg acid equivalents·L−1 as Hydrothol® 191 and 0.37 mg diquat cation·L−1 (equivalent to 0.69 mg diquat dibromide·L−1) | 2.25, 4.5, 7.5, 15 gallons·acre-ft−1 as Hydrothol® 191 and 0.5 gallons·acre-ft−1 of Tribune™ |
Table 3.
Average (n = 3) measured stock concentrations for each formulation or combination thereof. nd = not determined.
Table 3.
Average (n = 3) measured stock concentrations for each formulation or combination thereof. nd = not determined.
| Active Ingredient | Algaecide/Herbicide | Targeted Stock Concentration (mg·L−1) | Measured Stock Concentration (mg Active Ingredient·L−1 ± Standard Deviation) |
|---|---|---|---|
| Flumioxazin | Clipper® SC | 100 | 103.10 ± 6.05 |
| Endothall | Hydrothol® 191 | 100 | nd |
| Copper (Cu) | SeClear® | 100 | 96.81 ± 0.80 |
| Algimycin® PWF | 100 | 148.8 ± 0.59 | |
| Cutrine® Ultra | 100 | 100.23 ± 1.4 | |
| Argos | 100 | 96.45 ± 0.59 | |
| Captain® XTR | 100 | 99.94 ± 1.46 | |
| Peroxide (H2O2) | GreenClean® Liquid 5.0 | 2200 | 2154.83 ± 20.75 |
| GreenClean® Pro | 1000 | 822.42 ± 28.81 | |
| Phycomycin® SCP | 1000 | 803.98 ± 1.25 | |
| PAK® 27 | 1000 | 793.98 ± 12.98 |
Publisher’s Note: MDPI stays neutral with regard to jurisdictional claims in published maps and institutional affiliations. |
© 2022 by the authors. Licensee MDPI, Basel, Switzerland. This article is an open access article distributed under the terms and conditions of the Creative Commons Attribution (CC BY) license (https://creativecommons.org/licenses/by/4.0/).
Share and Cite
MDPI and ACS Style
Lefler, F.W.; Berthold, D.E.; Barbosa, M.; Laughinghouse, H.D., IV. The Effects of Algaecides and Herbicides on a Nuisance Microcystis wesenbergii-Dominated Bloom. Water 2022, 14, 1739. https://doi.org/10.3390/w14111739
AMA Style
Lefler FW, Berthold DE, Barbosa M, Laughinghouse HD IV. The Effects of Algaecides and Herbicides on a Nuisance Microcystis wesenbergii-Dominated Bloom. Water. 2022; 14(11):1739. https://doi.org/10.3390/w14111739
Chicago/Turabian StyleLefler, Forrest W., David E. Berthold, Maximiliano Barbosa, and H. Dail Laughinghouse, IV. 2022. "The Effects of Algaecides and Herbicides on a Nuisance Microcystis wesenbergii-Dominated Bloom" Water 14, no. 11: 1739. https://doi.org/10.3390/w14111739
Note that from the first issue of 2016, this journal uses article numbers instead of page numbers. See further details here.