
Experimental Data and Modeling the Adsorption-Desorption and Mobility Behavior of Ciprofloxacin in Sandy Silt Soil


1
College of Chemistry and Materials, Longyan University, Longyan 364012, China
2
Fujian Provincial Colleges and University Engineering Research Center of Solid Waste Resource Utilization, Longyan 364012, China
3
School of Environmental Science and Engineering, Shanghai Jiao Tong University, Shanghai 200240, China
4
College of Marine Ecology and Environment, Shanghai Ocean University, Shanghai 201306, China
*
Authors to whom correspondence should be addressed.
Water 2022, 14(11), 1728; https://doi.org/10.3390/w14111728
Submission received: 16 April 2022
/
Revised: 22 May 2022
/
Accepted: 25 May 2022
/
Published: 27 May 2022
(This article belongs to the Special Issue Advances in Hydrogeology and Groundwater Management Research)
Abstract
:The improved understanding of the behavior of antibiotics in soil is of great importance due to their environmental hazard and frequent detection. In this work, the adsorption-desorption and mobility behaviors of ciprofloxacin in sandy silt soil, affecting the fate of ciprofloxacin in the environment, were studied by a series of batch tests and column tests. In batch tests, the effects of contact time, initial ciprofloxacin concentration, sandy silt soil dosage, solution pH, and ionic strength on ciprofloxacin adsorption and desorption in sandy silt soil were considered. Adsorption results were satisfactorily modeled, with good fittings to the pseudo-second-order model (R2 > 0.999) and Langmuir model (R2 > 0.991), with the value for Langmuir’s maximum adsorption capacity (qm) 5.50 mg g−1. Ciprofloxacin adsorption decreased sharply by increasing the pH from 7.0 to 10.0 and the ionic strength from 0.01 to 0.2 mol L−1 CaCl2. Comparatively, ciprofloxacin was more readily desorbed from sandy silt soil at alkaline and high ionic strength conditions. Breakthrough curves of ciprofloxacin obtained from the column experiments were described by the two-site model, Thomas model, and Yan mode. Of these models, the two-site model was the most suitable to describe the mobility of ciprofloxacin. The retardation factor (R) obtained in the two-site model was 345, suggesting strong adsorption affinity with ciprofloxacin on the sandy silt soil surface. The results from the Thomas model suggested the extremely small external and internal diffusion resistances. The Yan model was not suitable. Cation exchange interaction, electrostatic interaction, mechanical resistance, entrapment between porous media, and gravity sedimentation were proposed to be the important adsorption mechanisms.
1. Introduction
Antibiotics are generally applied to treat infectious diseases in both humans and animals [1]. However, their widespread usage and continuous emission have made them a persistent or pseudo-persistent existence in the environment, and a potential hazard to human health [2]. This is mainly attributed to the antibiotic resistance phenomena [3,4], in which the resistance genes could be transferred from non-pathogenic bacteria to pathogenic bacteria [5,6]. In particular, there have been numerous reports on resistant bacteria transmitting from the environment to humans via direct or indirect mode [7,8].
Ciprofloxacin (CPX), a third-generation of fluoroquinolones, is one of the most widely used broad-spectrum antibiotics in human and veterinary medicines [9]. Generally, CPX acts by inhibiting bacterial DNA gyrase enzyme required for DNA replication, but cannot be fully utilized in humans and animals. About 30–90% of CPX is excreted from the organism as the parent compound or its metabolites [10]. What is worse, owing to the bacteria-inhibiting effect, CPX cannot be completely removed by conventional wastewater treatments [11]. This inevitably resulted in the frequent detection of CPX in various environments, including surface water, groundwater, sludge, and soil [12,13,14,15,16,17]. The emission sources include pharmaceutical industries, hospitals, wastewater treatment plants, and livestock and aquaculture farms [14,15]. CPX concentrations were reported to be 14 μg L−1 in groundwater within the proximity of the effluent treatment plant, 0.001 mg L−1 in effluent and surface water, more than 0.15 mg L−1 in hospital wastewater, 30 mg L−1 in pharmaceutical wastewater, approximately 10 mg kg−1 in surface soil and 13 mg kg−1 in sludge from sewage treatment plants [12,13,14,15,16,17]. Consequently, CPX has attracted much attention due to its potential adverse effect on human health and the ecosystem [8] and exploring its occurrence, migration, and fate is of great importance [18].
Sorption and desorption of chemicals into the soil are critical dynamic processes controlling their environmental fates [19,20]. Many studies were conducted to investigate the adsorption behavior, influencing factors, and mechanisms of highly used antibiotics on soils, sediments, and sludge [19,21,22,23,24]. Sorption of antibiotics onto solid matrix is affected by multiple factors, including the physicochemical properties of soils and antibiotics and various environmental conditions (i.e., pH, ionic strength, organic matter, temperature). Soil properties such as pH value, organic matter, CEC, and texture play important roles. Depending on the pKa values of antibiotics and soil pH, antibiotics can emerge in nonionic, anionic, cationic, or zwitterionic modalities individually or simultaneously. Sorption of nonionic molecules to soil organic matter is controlled by hydrophobic partitioning via weak van der Waals forces and electron donor-acceptor interactions. Ionic compounds interact with surface-charged soils through electrostatic interactions such as cation exchange, cation bridging, complexation, and hydrogen bonding. Cationic molecules are mainly adsorbed on negatively charged clay surfaces, and anionic molecules are principally controlled by the positive charges on the solid surface [25]. Ionic strength has significant effects on sorption as well. In general, the sorption of antibiotics is affected by electrostatic interaction, cation bridging, surface complexation, hydrogen bonding, van der Waals forces, and hydrophobic partition. Commonly, adsorption kinetics data are best fitted by the pseudo-second-order model [26,27]. The adsorption equilibrium data are best described by the linear model, Langmuir model, or Freundlich model [24,26,28,29].
However, less attention has been paid to antibiotics desorption from soil [30]. It is worth mentioning that desorption of antibiotics would lead to the release of antibiotics from the soil into groundwater, thus becoming a persistent pollution source. Furthermore, the fate of CPX in soil depends not only on equilibrium adsorption/desorption concentrations but also on the transport phenomena associated with the soil. To date, there are few reports simultaneously on the adsorption, desorption, and mobility of CPX in the soil, especially in the deep soil, which can provide much valuable insight into its environmental fate. The components of deep soils are different from that of shallow soils, leading to different adsorption and retardation behaviors.
Hence, this work investigated the adsorption, desorption, and transport processes of CPX in sandy silt soil (deep soil) in this work. The major objectives were to: (i) evaluate, in detail, the adsorption and desorption characteristics of CPX under several physiochemical conditions by using batch experiments, (ii) evaluate the mobility behavior of CPX by employing the column experiments, and (iii) further model and assess the adsorption, desorption and mobility behavior of CPX.
2. Materials and Methods
2.1. Materials
The sandy silt soil sample was collected from the tenth soil layer that was approximately 45 m below the ground in Shanghai city. The sample was dried at 343 K for 48 h, sieved to a particle size <1 mm without washing, and was kept in a desiccator before being used. The properties of the sandy silt soil sample are listed in Table 1. The particle size distribution and special surface area of the soil were determined by a laser diffraction particle size analyzer (Mastersizer 3000, Malvern Instruments Ltd., Worcestershire, UK) with a detection limit of 0.01 μm. The total organic carbon was analyzed by a TOC-TN multi 3100 analyzer (Analytik Jena AG, Jena, Germany).
All chemical reagents were of analytical grades and were used without further purification. Ciprofloxacin (CPX, C17H18FN3O3, ≥98 wt%, 331.35 g mol−1) was purchased from Macklin Biochemical Technology Co. (Shanghai, China). Other reagents were supplied by Sinopharm Chemical Reagent Co., Ltd. (Shanghai, China). Deionized water used in all procedures was prepared in a Milli-Q purification system.
2.2. Batch Adsorption-Desorption Experiments
Batch adsorption experiments were carried out in the 50-mL polypropylene centrifuge tubes with 25 mL of CPX solution at a known initial concentration. After adding sandy silt soil, the tubes were placed in a thermostatic shaker (TS-2102C, Shanghai Tensuclab Instruments Manufacturing Co., Led., Shanghai, China) at 298 K and 110 rpm.
The sorption kinetics of CPX to sandy silt soil were carried out by mixing 100 mg sandy silt soil with 25 mL of 50 mg L−1 CPX solution (background electrolyte: 0.01 mol L−1 CaCl2) in each 50-mL centrifuge tube in a thermostatic shaker at 110 rpm for the following durations: 0.5, 1, 6, 12, 24, and 48 h.
The soil adsorption isotherms were performed by mixing 25 mL CPX solution (background electrolyte: 0.01 mol L−1 CaCl2) at initial concentrations of 10, 20, 30, 40, 50, 60, 80, and 100 mg L−1 with 100 mg sandy silt soil in each 50-mL centrifuge tube in a thermostatic shaker at 110 rpm for 48 h.
Effects of sandy silt soil dosage on adsorption were determined by mixing 25 mL of 50 mg L−1 CPX solution (background electrolyte: 0.01 mol L−1 CaCl2) with sandy silt soil at a dosage of: 20, 50, 100, 150, 200, 300, 400, and 500 mg in each 50-mL centrifuge tube in a thermostatic shaker at 110 rpm for 48 h.
For the study of the influence of solution pH on adsorption, 100 mg sandy silt soil and 25 mL of 50 mg L−1 CPX solution (background electrolyte: 0.01 mol L−1 CaCl2) at initial pH of 4.0, 5.0, 6.0, 7.0, 8.0, 9.0, and 10.0 were mixed in each 50-mL centrifuge tube in a thermostatic shaker at 110 rpm for 48 h. 0.1 M HCl or NaOH were used to adjust pH.
For the study of the influence of solution ionic strength on adsorption, 100 mg sandy silt soil and 25 mL of 50 mg L−1 CPX solution with different ionic strengths (0.01, 0.05, 0.10, 0.2 mol L−1 CaCl2) were mixed in each 50-mL centrifuge tube in a thermostatic shaker at 110 rpm for 48 h. Ionic strength was controlled with CaCl2 solid.
In the adsorption study, each tube was taken out at predetermined times and centrifuged at 4000 rpm for 5 min and filtered through 0.45 μm PTFE syringe-tip filters. The residual CPX concentration was determined by an UV-vis spectrophotometer (UV-754, Shanghai) at a wavelength of 273 nm. The pH value was only adjusted in the pH effect experiment.
All experiments were performed in triplicates and the averaged results were applied. Blank samples were prepared simultaneously under the same conditions, showing the negligible loss of CPX during the contact time.
Desorption experiments were conducted immediately after the sorption experiments in the same centrifuge tubes. In brief, an amount of deionized water equal to the amount of decanted supernatant was added to each tube, which was then shaken and centrifuged under the same conditions in the sorption experiments. The effects of contact time (1–48 h), initial CPX concentration (10–100 mg L−1), pH (4.0–10.0), and ionic strength (0.01–0.2 mol L−1 CaCl2) on desorption by sandy silt soil were investigated. The amount of CPX that remained after desorption was calculated from the difference between the amount of equilibrium adsorption and the CPX concentration in the supernatant [31].
2.3. Column Experiments
Dynamic sorption, desorption, and transport of CPX were conducted using a plexiglas column (length 34 cm, inner diameter 5 cm), which was manually wet packed with sandy silt soil to form a packed bed. A thin layer (2 cm) of inert glass beads (0.3 mm grains) was placed at the top and bottom of the column for a uniform distribution of the flow. A stainless steel mesh with 0.15 mm openings was installed at both ends of the column between glass beads and soil to minimize soil loss. A length of 30 cm layer of the uniformly sandy silt soil with a good mixing before the filling was wet-packed between two supporting layers of glass beads. The flow-through column, positioned vertically, was first flushed with deionized water slowly from the bottom by a peristaltic pump for about 24 h to replace the entrapped air [32]. The characteristics of the sandy silt soil column are provided in Table 1.
Saturated hydraulic conductivity K was measured by the constant head method of Klute and Dirksen [33] according to the Darcy’s Law equation, , where, Q (mL h−1) is the water flow rate, L (cm) is the vertical filling length of the column, A (cm2) is the cross sectional area of the column, and ΔH (cm) is the hydraulic head difference between inlet and outlet.
Before the experiment, approximately 20 pore volumes (PV) of deionized water were introduced upward into the column to establish a steady-state flow. A tracer test was performed using KCl for characterizing the sandy silt soil column and the hydraulic conditions. The experiment was then commenced by pumping 500 mg L−1 KCl solution to the column at a constant flow rate of 174 mL h−1 using a peristaltic pump (BT100-2J, Longer Pump, China). The room temperature was 288 K during the column tests, and the effluent samples were collected at determined time intervals.
After completion of the tracer experiment, the column was pre-equilibrated with deionized water. CPX solution of 50 mg L−1 was injected into the column in an upward mode by a peristaltic pump at a flow rate of 174 mL h−1. Column effluents were collected at specified intervals. The transport experiment continued until saturation state, where C/Co reached unity or the concentration remained constant along the time. C0 corresponds to the initial concentration of the CPX solution (50 mg L−1), and C is the effluent concentration over percolation time. The concentration of CPX in the effluents was then analyzed to develop the breakthrough curve.
2.4. Data Analysis
The adsorbed amount of CPX to sandy silt soil was calculated based on the difference between the initial and final concentration in the aqueous phase, as follows:
where t (h) is the adsorption time, qt (mg g−1) is the adsorption amount in the solid phase at the adsorption time t, C0 (mg L−1) is the initial concentration of CPX of the aqueous phase, Ct (mg L−1) is the concentration of CPX at time t, V (mL) represents the solution volume and (mg) is the weight of sandy silt soil used.
The pseudo-first-order (Equation (2)) and pseudo-second-order (Equation (3)) models were used to fit the adsorption and desorption kinetic data:
where qe is the adsorption concentration of CPX at equilibrium in the solid matrix (mg g−1), k1 (h−1) and k2 (g mg−1h−1) are adsorption rate constant for the pseudo-first-order and pseudo-second-order models, respectively.
The adsorption and desorption isotherm data were fitted to both the Langmuir (Equation (4)) and the Freundlich (Equation (5)) models to assess their efficiencies:
where qm (mg g−1) is the maximum adsorption concentration in the solid matrix, Ce (mg L−1) is the equilibrium concentration of CPX in an aqueous solution. KL and KF (L mg−1) are Langmuir and Freundlich distribution constants, respectively. is the Freundlich linearity index.
Average sorption coefficient, named distribution coefficient (Kd, L g−1) was calculated for adsorption isotherm data using the following equation:
The desorption coefficient (Kdes, L g−1) was calculated as [34]:
where (mg L−1) is the equilibrium concentration of CPX in aqueous solution at desorption equilibrium, (mg) is the weight of sandy silt soil, and V (mL) represents the solution volume.
The percentage of CPX desorbed was calculated according to the equation:
The breakthrough curve was used to assess the transport performance of the solute. The breakthrough process of KCl was simulated using the one-dimensional advection-dispersion equation (ADE) as follows [35,36]:
where t (h) is the time, C (mg L−1) is the aqueous phase solute concentration at time t, C0 (mg L−1) is the influent solute concentration, D (cm2 h−1) is the hydrodynamic dispersion coefficient, (cm) is the distance from the solute application, and (cm h−1) is the average pore water velocity which is defined as Q/, where Q (mL h−1) is the solution flow rate, A (cm2) is the cross-section area of the column, and is the effective porosity. R is the retardation factor, which is defined as:
where (g cm−3) is the bulk density of the packed soil.
Solute transport in the soil is often associated with physical and chemical non-equilibrium processes [37]. The physical non-equilibrium can be described by a “two-region model” (TRM) with the mobile region where all advection-dispersion transport occurred, and the immobile region where diffusive transport was responsible for the exchange of solute between the mobile and immobile regions. Chemical non-equilibrium can be described by the “two-site model” (TSM) with instantaneous and time-limited adsorption sites. If dimensionless parameters are used, then the TRM and TSM are transformed to their dimensionless forms as follows:
where the subscript 1 and 2 refer to the mobile/immobile regions (TRM), or instantaneous/time-limited adsorption sites (TSM), respectively; T is the normalized dimensionless time (), L (cm) is the length of the column, Z is the normalized distance (); β is the partitioning coefficient of the soil water between mobile and immobile regions in TRM, or between instantaneous and time-limited sorption domains; ω is the dimensionless mass transfer coefficient; P is Peclet number, represents the relative contribution of advection and diffuse transport in solute transport.
The breakthrough curve of CPX was evaluated by the non-linear regression analysis using various models, including the non-equilibrium two-site model, the Thomas model, and the Yan model. The Thomas model was expressed in the following form [38]:
where Ct (mg L−1) is the effluent CPX concentration at time t, C0 (mg L−1) is the influent CPX concentration, qT (mg g−1) is the equilibrium adsorption capacity of CPX onto sandy silt soil, KT (L mg−1h−1) is the Thomas rate constant, m (mg) is the mass of adsorbent, and Q (mL h−1) is the influent flow rate.
Yan et al. [39,40] proposed an empirical equation that rectified the deficiencies in the Thomas model, especially for its serious deficiency in predicting the effluent concentration on zero time. The equation was defined as follows:
where , KY (L2 g−1h−1) and qY (mg g−1) are the adsorption rate constant and the maximum adsorption capacity, Q (mL h−1) is the influent flow rate, (g) is the weight of packed sandy silt soil, and t (h) is the influent time.
3. Results and Discussion
3.1. Adsorption and Desorption Kinetics of CPX
Figure 1 shows the relationship between adsorption or desorption amounts and contact time for CPX. The adsorption amount by sandy silt soil increased rapidly at first 0.5 h, then gradually slowed down, and finally reached the maximum adsorption capacity at approximately 12 h. The initial rapid adsorption may be due to the fast surface adsorption, followed by the slow internal diffusion or adsorption [41]. In other words, the initially activated and available sites of sandy silt soil were utilized by CPX, and then the rate of adsorption was reduced and progressively reached an equilibrium point.
The pseudo-first-order and pseudo-second-order adsorption and desorption kinetics were then used for predicting the CPX sorption mechanism on sandy silt soil. The model parameters are provided in Table 2. In contrast to the pseudo-first-order model, the correlation coefficient for the pseudo-second-order model was higher than 0.99. Moreover, the calculated adsorption and desorption capacities by the pseudo-second-order model were more similar to the experimental data. Therefore, the adsorption and desorption of CPX by sandy silt soil should follow the pseudo-second-order model. According to the pseudo-second-order model, the qe value of the adsorption process was 3.55 mg g−1 compared to 725 mg g−1 for CPX on a Na montmorillonite [42]. The fitted rate constant k2 (1.74 g mg−1h−1) was higher than 0.14 g mg−1h−1 for CPX adsorption on a Na montmorillonite [42] and should be mainly controlled by the cation exchange interaction [43].
3.2. Adsorption and Desorption Isotherm of CPX
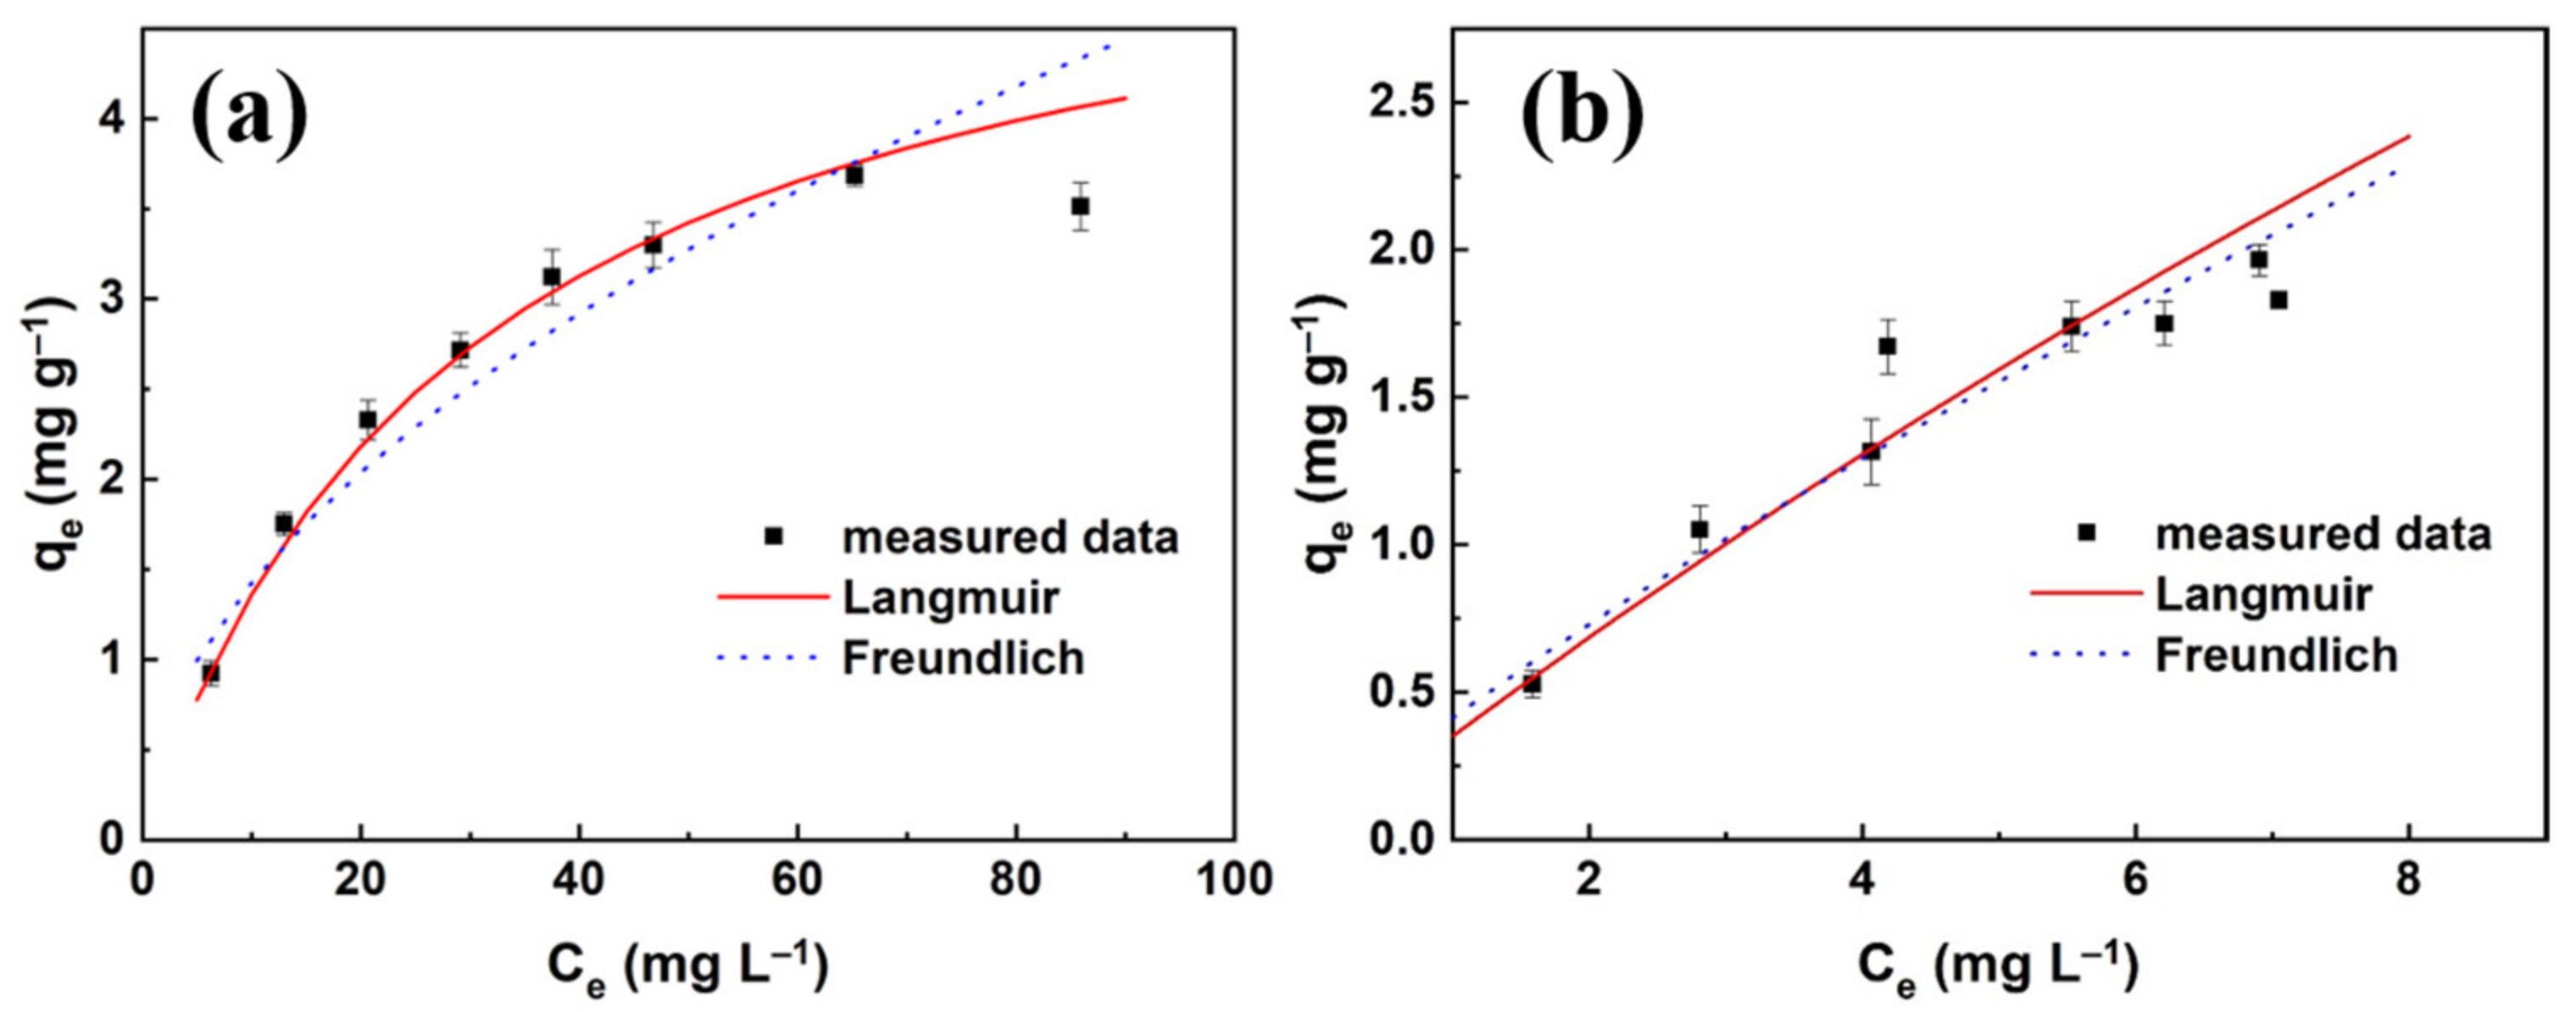
To gain insights into the CPX sorption mechanism onto sandy silt soil, two frequently used isotherm models (Langmuir and Freundlich) were employed to fit the equilibrium adsorption and desorption data. Two sorption isotherms are provided in Figure 2, and the isotherm parameters are presented in Table 3.
The results showed that both Langmuir and Freundlich models fitted the adsorption and desorption data well with similar correlation coefficients (>0.90). However, the Langmuir isotherm gave a better fit (>0.98), suggesting monolayer adsorption and desorption of CPX on sandy silt soil. This was consistent with the previous studies that CPX sorption on kaolinite and montmorillonite also followed the Langmuir adsorption isotherm [42,44,45]. The fitted maximum adsorption capacity qm value was 5.50 mg g−1 (16.6 mmol kg−1), compared to the adsorption capacity of 19 mmol kg−1 on kaolinite [45], 60–150 mmol kg−1 on goethite [46,47], 41 mmol kg−1 on hydrous aluminous oxides [46], and 1000–1200 mmol kg−1 on montmorillonite [42,44]. Sandy silt soil seemed to exhibit slightly lower adsorption of CPX.
According to Table 3, the CPX adsorption with the initial CPX concentration of 50 mg L−1 onto sandy silt soil was favored because of the RL () value in the range 0–1. In the Freundlich model, the value of > 1 represented the favorable nature of adsorption [48]. The values of Kd and Kdes were calculated by Equations (6) and (7) to be 0.0307 and 0.250 L g−1, respectively. The very high desorption coefficient of CPX showed that it practically remained adsorbed on sandy silt soil.
Also from Figure 2, a higher initial CPX concentration resulted in more loading mass on sandy silt soil, and a lower percentage of CPX desorbed.
3.3. Effect of Sandy Silt Soil Dosage on the CPX Adsorption and Desorption
The effect of sandy silt soil dosage on the sorption of CPX is shown in Figure 3a. The adsorption amounts decreased from 4.55 to 1.58 mg g−1 when the dosage of sandy silt soil increased from 20 to 500 mg. The result provided an obvious reason for the equilibrium isotherm capacity being highly dependent on the adsorbent dosage. This is due to the fact that at the low dosage of adsorbent, all of the adsorption sites are exposed and the surface adsorption is saturated faster, leading to a higher adsorption capacity [49]. With the increasing adsorbent mass, accumulation and aggregation of adsorbent and compressibility of functional groups on the adsorbent surface would cause repulsion, thus decreasing the amount of CPX adsorbed per unit weight of adsorbent [50]. Our data were consistent with the literature where many studies had observed the opposite effect of adsorbent dosage to adsorption amount [49,50]. As a compromise between the amount of adsorbent and the adsorption capacity, 100 mg of sandy silt soil dosage was selected for further study.
The desorption capacity decreased from 2.85 to 0.311 mg g−1 when the dosage of sandy silt increased from 20 to 500 mg (see Figure 3a). In Figure 3d, the desorption percentages Kp of CPX in various sandy silt soil dosages decreased sharply from 62.0% to 28.5% at the adsorbent range of 20 to 200 mg. As the sandy silt soil dosages continued to increase from 200 to 500 mg, the desorption percentages decreased slightly from 28.5% to 18.6%. The lower percentage of CPX desorbed suggested that the adsorbed CPX in the interlayer could not be easily released, relative to the CPX adsorbed on the external surfaces.
3.4. Effect of Solution pH on the CPX Adsorption and Desorption
Solution pH can change the speciation of adsorbate and surface functional groups of adsorbent, thus playing a critical role in the sorption process [51,52]. Adsorption and desorption of CPX in sandy silt soil were conducted at different solution pHs of 4.0–10.0 (Figure 3b). The amounts of CPX adsorption were relatively constant at 3.79 to 3.62 mg g−1 in the pH range of 4.0–7.0. As the pH increased, the CPX sorption decreased sharply to 2.12 mg g−1 at pH 10.0, showing the substantial influence on the adsorption of CPX in alkaline conditions. The influence of solution pH on CPX adsorption was similar to that of Na montmorillonite [42].
Typically, the groups of CPX molecules should undergo a protonation-deprotonation reaction against an aqueous solution. The CPX groups are protonated with a positive charge with pH < 5.9; are deprotonated and become negatively charged with pH > 8.89, and form zwitterionic species at 5.9 < pH < 8.89. Under the experimental condition (pH = 4.0–10.0), sandy silt soil was negatively charged. The strong electrostatic attraction thus can be expected between opposite charged CPX and sandy silt soil. Although the pKa1 value of CPX is 5.9, the invariance of CPX adsorption when pH was greater than the pKa1 suggested that the ammonium group of the zwitterions could still contribute to the adsorption. As the pH increased from 5.9 to 10.0, more anionic species resulted in repulsion between anions of CPX and soil, which resulted in the decrease of adsorption amounts [44]. Hence, the adsorption amounts of CPX in sandy silt soil were reduced by increasing pH, especially from pH 7.0 to 10.0. The sharp decrease in CPX adsorption when solution pH was approaching pKa2 (8.89) confirmed that the electrostatic interaction mechanism was important.
In Figure 3e, the percentage of CPX desorbed increased as the pH rose from 4.0 to 10.0 except for pH 9.0. All desorption percentages were lower than 50% except for pH 9.0. The low values showed that most of the adsorbed CPX might be dominantly in the interlayer position, compared to the surface adsorption. The maximum desorption percentage was obtained at pH 9.0 approximately to pKa2 (8.89), suggesting that the electrostatic repulsion between CPX and negatively charged sandy silt soil surfaces inhabited the adsorption of CPX. The electrostatic interaction was also an important adsorption mechanism besides cation exchange interaction.
3.5. Effect of Ionic Strength on the CPX Adsorption and Desorption
To investigate the effect of ionic strength on CPX adsorption and desorption by sandy silt soil, CaCl2 was added into the CPX solution without adjusting pH. Figure 3c showed the adsorption amounts of CPX in sandy silt soil decreased by about 80% by increasing CaCl2 concentration from 0.01 to 0.2 mol L−1. CPX tended to be retained in sandy silt soil in low ionic strength conditions while CPX tended to leach into groundwater in high ionic strength conditions. The reduction of sorption under high ionic strength could be attributed to the competition of Ca2+ and positively charged CPX for adsorption sites on sandy silt surfaces. Therefore, the electrostatic interaction was further confirmed to be the important adsorption mechanism.
In Figure 3f, the percentages of CPX desorbed increased sharply from 32.8% to 97.7% at the ionic strength range of 0.01 to 0.2 mol L−1 CaCl2. The presence of Ca2+ in solution significantly promoted CPX desorption from sandy silt soil. The study of desorption processes in various ionic strengths indicated that CPX adsorption occurred mainly on the external exchangeable sites in the higher ionic strength condition. In contrast, the CPX adsorption in the lower ionic strength condition could be intercalated into the interlayer of sandy silt soil.
3.6. Transport and Retention of CPX in Sandy Silt Soil Column
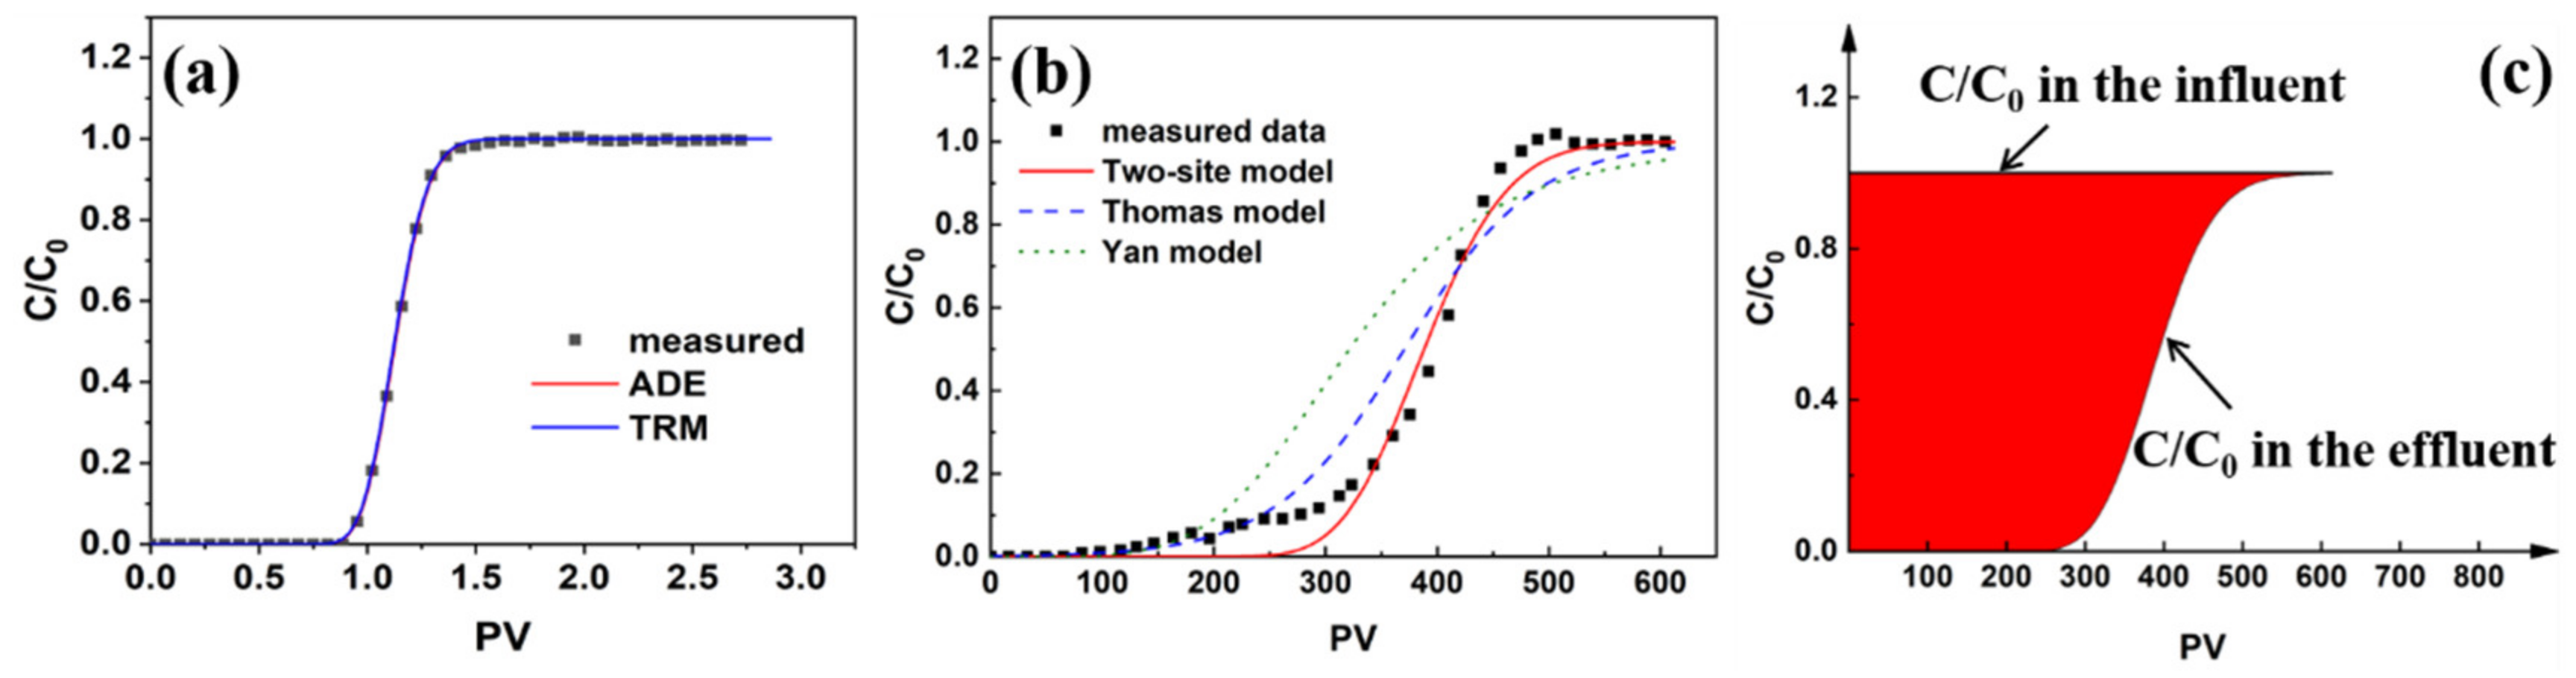
The breakthrough curves were expressed in the form of relative concentration (C/Co) versus cumulative column pore volume (PV). The experimental and modeling breakthrough curves of KCl and CPX in the sandy silt soil column are shown in Figure 4, and associated parameters estimated by the aforementioned models are listed in Table 4. As shown in Figure 4a, the shape of the breakthrough curve of KCl was the ideal sigmoid style indicating no adsorption between KCl and sandy silt soil. The breaking point (C/Co = 0.05) and exhaustion time (C/Co = 0.9) occurred in 0.9 PV and 1.4 PV. As shown in Figure 4b, CPX leached slowly in the soil column. The breakthrough curve reached a breaking point at 170 PV and exhaustion at 470 PV. Compared to the KCl breakthrough curve in the column, the breakthrough response of CPX showed enormous delay, indicating its retardation in sandy silt soil.
The KCl breakthrough data was fitted using the advection-dispersion equation (ADE, Equation (9)) and the two-region model (TRM, Equations (11)–(13)) through the computer package CXTFIT 2.1 code [53]. According to the measured flux, the cross-section area of the column, and the effective porosity, average pore velocity was calculated. The initial values in the inverse problem mode were: = 24.5 cm h−1, D = 20 cm2 h−1, R = 1. Average pore velocity and hydrodynamic dispersion coefficient D were fitting in the ADE, while D, β and ω were fitting in the TRM. Both the ADE and TRM were able to adequately simulate the experimental data (R2 = 0.999). The model fittings based on the two models nearly coincide, indicating that there were no significant effects of immobile water under steady-state conditions. The relevant transport parameters derived from the ADE were in accord with those from the TRM (Table 4). The partitioning coefficient β was determined to be 0.999 by fitting the TRM to the breakthrough curve with R set to 1. The immobile water in the column accounted for approximately 0.1%. Therefore, the ADE was sufficient to describe the tracer transport. The fitting value of hydrodynamic dispersion coefficient D is 4.82 cm2 h−1 obtained according to ADE.
Based on the tracer test, immobile water in the soil columns was negligible and no physical non-equilibrium was evident. Consequently, the two-site model was employed to simulate the CPX breakthrough data. Note that for the two-site model, the fitting parameters included R, β and ω. The breakthrough curve analysis was carried out by the two-site model, the Thomas model, and the Yan model. According to Figure 4b and Table 4, the two-site model with a correlation coefficient of 0.986 could be fitted best with CPX breakthrough data among these three models.
Retardation factor R was a derived parameter to quantify the slowing down of solute transport. According to the two-site model, R was 345 with an initial CPX concentration of 50 mg L−1 and an average pore water velocity of 24.6 cm h−1. The large value of R meant strong retention of CPX in sandy silt soil, which was consistent with the aforementioned results of batch sorption experiments.
Partitioning coefficient β and mass transfer coefficient ω can be used to evaluate potential contributions from the chemical-related non-equilibrium. The two-site model-fitted value of instantaneous adsorption site fraction β was 0.248, indicating a part of the sorption sites did not participate in instantaneous adsorption, i.e., CPX adsorption was in the non-equilibrium state. Thus, the two-site model is more adequate for simulating CPX transport in the sandy silt soil than the ADE. The fitting mass transfer coefficient ω was 100, indicating the fast mass transfer between mobile and immobile water. Peclet number was 173.5, accounting for advection made a greater relative contribution to migration.
For the other models, the correlation coefficient obtained from the Thomas model was 0.902, suggesting that external and internal diffusion resistances were extremely small, while the Yan model could not describe the breakthrough curve of CPX in the sandy silt soil column with the correlation coefficient of 0.755.
The retention percentage of CPX in the sandy silt soil column was then calculated using the numerically integrated method [54]. From Figure 4c, the red area enclosed by the C/Co = 1 line, C/Co = 0 line, C/Co line, and Y-axis indicated the mass deposition in the soil column. The area below the C/Co = 1 line was the influent CPX mass. Accordingly, the retention percentage was 99.7%, 94.6%, and 83.2%, respectively, in break time, median time (C/Co = 0.5), and exhaustion time.
The sorptive exchange of CPX between the water phase and sandy silt soil was characterized by the sorption coefficient Kd. According to the batch isotherm data and Equation (6), the Kd value was determined to be 0.0307 L g−1. Based on Equation (10), the retardation factor R was determined to be 123, which differed markedly from that determined from the column test data (R = 345).
The calculated qT in the Thomas model was 4.67 mg g−1, slightly lower than the measured adsorption capacity in batch experiments. It was a positive result that the Thomas model was suitable for this condition. All the parameters of the retention percentages, fitting Kd and qT values, showed slightly stronger sorption affinity in the column test than in the batch sorption test. This conclusion agreed with the literature [10]. This might be attributed to the mechanical resistance, entrapment between the porous media of soil matrix, and gravity sedimentation, all of which were important to CPX transport in sandy silt soil environment besides the cation exchange interaction and the electrostatic interaction. Therefore, we obtained a better understanding of CPX behaviors in the soil environment.
4. Conclusions
Adsorption and desorption of CPX on sandy silt soil were studied by the batch tests. The sorption kinetic data conformed to the pseudo-second-order model with a large rate constant. The adsorption and desorption experimental data fitted quite satisfactorily to the Langmuir model. The maximum adsorption capacity for CPX according to the Langmuir model was 5.50 mg g−1. The percentages of CPX desorbed increased with increasing pH and ionic strength, and with decreasing sandy silt soil dosage. Comparatively, CPX was more readily desorbed from sandy silt soil at alkaline and higher ionic strength conditions.
The mobility behaviors of CPX in sandy silt soil were investigated by laboratory column experiments. The two-site model can describe the mobility behaviors of CPX well. Retardation factor R derived from two-site model was 345, suggesting a strong adsorption affinity of CPX in sandy silt soil. For the Thomas model, results suggested that external and internal diffusion resistances were extremely small. The experimental results showed that CPX tended to accumulate in sandy silt soil rather than leaching into groundwater. Cation exchange interaction, electrostatic interaction, mechanical resistance, entrapment between porous media, and gravity sedimentation were the important adsorption mechanisms. These results improved our understanding of the adsorption, desorption, and mobility of CPX in the sandy silt soil environment.
Author Contributions
Conceptualization, Y.W. and P.Z.; methodology, P.Z. and F.Y.; formal analysis, P.Z.; investigation, P.Z.; resources: Y.W. and P.Z.; data curation: P.Z. and F.Y.; writing—original draft preparation, P.Z.; writing—review and editing, Y.W. and F.Y.; visualization: P.Z.; funding acquisition, P.Z. All authors have read and agreed to the published version of the manuscript.
Funding
This research was funded by the Research Launching Funds of Longyan University (No. LB2018025), the Science and Technology Program of Longyan City, China (No. 2019LYF13012).
Institutional Review Board Statement
Not applicable.
Informed Consent Statement
Not applicable.
Acknowledgments
The authors gratefully acknowledge the financial support from the Research Launching Funds of Longyan University (No. LB2018025), the Science and Technology Program of Longyan City, China (No. 2019LYF13012). We express special thanks to Dean Song for his efforts in the revision of the manuscript. The authors thank the editors and reviewers for their pertinent comments and suggestions.
Conflicts of Interest
The authors declare no conflict of interest.
References
- Yin, Z. Distribution and Ecological Risk Assessment of Typical Antibiotics in the Surface Waters of Seven Major Rivers, China. Environ. Sci. Processes Impacts 2021, 23, 1088–1100. [Google Scholar] [CrossRef] [PubMed]
- Serwecińska, L. Antimicrobials and Antibiotic-Resistant Bacteria: A Risk to the Environment and to Public Health. Water 2020, 12, 3313. [Google Scholar] [CrossRef]
- Xiong, J.-Q.; Kurade, M.B.; Kim, J.R.; Roh, H.-S.; Jeon, B.-H. Ciprofloxacin Toxicity and Its Co-Metabolic Removal by a Freshwater Microalga Chlamydomonas mexicana. J. Hazard. Mater. 2017, 323, 212–219. [Google Scholar] [CrossRef] [PubMed]
- Ning, Q.; Wang, D.; You, J. Joint Effects of Antibiotics and Quorum Sensing Inhibitors on Resistance Development in Bacteria. Environ. Sci. Processes Impacts 2021, 23, 995–1005. [Google Scholar] [CrossRef]
- Wang, Z.; Han, M.; Li, E.; Liu, X.; Wei, H.; Yang, C.; Lu, S.; Ning, K. Distribution of Antibiotic Resistance Genes in an Agriculturally Disturbed Lake in China: Their Links with Microbial Communities, Antibiotics, and Water Quality. J. Hazard. Mater. 2020, 393, 122426. [Google Scholar] [CrossRef]
- Cheng, D.; Hao Ngo, H.; Guo, W.; Wang Chang, S.; Duc Nguyen, D.; Liu, Y.; Zhang, X.; Shan, X.; Liu, Y. Contribution of Antibiotics to the Fate of Antibiotic Resistance Genes in Anaerobic Treatment Processes of Swine Wastewater: A Review. Bioresour. Technol. 2020, 299, 122654. [Google Scholar] [CrossRef]
- Gasparrini, A.J.; Markley, J.L.; Kumar, H.; Wang, B.; Fang, L.; Irum, S.; Symister, C.T.; Wallace, M.; Burnham, C.-A.D.; Andleeb, S.; et al. Tetracycline-Inactivating Enzymes from Environmental, Human Commensal, and Pathogenic Bacteria Cause Broad-Spectrum Tetracycline Resistance. Commun. Biol. 2020, 3, 241. [Google Scholar] [CrossRef]
- Amarasiri, M.; Sano, D.; Suzuki, S. Understanding Human Health Risks Caused by Antibiotic Resistant Bacteria (ARB) and Antibiotic Resistance Genes (ARG) in Water Environments: Current Knowledge and Questions to Be Answered. Crit. Rev. Environ. Sci. Technol. 2020, 50, 2016–2059. [Google Scholar] [CrossRef]
- Ojkic, N.; Lilja, E.; Direito, S.; Dawson, A.; Allen, R.J.; Waclaw, B. A Roadblock-and-Kill Mechanism of Action Model for the DNA-Targeting Antibiotic Ciprofloxacin. Antimicrob. Agents Chemother. 2020, 64, e02487-19. [Google Scholar] [CrossRef]
- Maszkowska, J.; Kolodziejska, M.; Bialk-Bielinska, A.; Mrozik, W.; Kumirska, J.; Stepnowski, P.; Palavinskas, R.; Krueger, O.; Kalbe, U. Column and Batch Tests of Sulfonamide Leaching from Different Types of Soil. J. Hazard. Mater. 2013, 260, 468–474. [Google Scholar] [CrossRef]
- Sabri, N.A.; van Holst, S.; Schmitt, H.; van der Zaan, B.M.; Gerritsen, H.W.; Rijnaarts, H.H.M.; Langenhoff, A.A.M. Fate of Antibiotics and Antibiotic Resistance Genes during Conventional and Additional Treatment Technologies in Wastewater Treatment Plants. Sci. Total Environ. 2020, 741, 140199. [Google Scholar] [CrossRef]
- Arun, S.; Kumar, R.M.; Ruppa, J.; Mukhopadhyay, M.; Ilango, K.; Chakraborty, P. Occurrence, Sources and Risk Assessment of Fluoroquinolones in Dumpsite Soil and Sewage Sludge from Chennai, India. Environ. Toxicol. Pharmacol. 2020, 79, 103410. [Google Scholar] [CrossRef]
- Zainab, S.M.; Junaid, M.; Xu, N.; Malik, R.N. Antibiotics and Antibiotic Resistant Genes (ARGs) in Groundwater: A Global Review on Dissemination, Sources, Interactions, Environmental and Human Health Risks. Water Res. 2020, 187, 116455. [Google Scholar] [CrossRef]
- Chen, H.; Jing, L.; Yao, Z.; Meng, F.; Teng, Y. Prevalence, Source and Risk of Antibiotic Resistance Genes in the Sediments of Lake Tai (China) Deciphered by Metagenomic Assembly: A Comparison with Other Global Lakes. Environ. Int. 2019, 127, 267–275. [Google Scholar] [CrossRef]
- Moles, S.; Gozzo, S.; Ormad, M.P.; Mosteo, R.; Gómez, J.; Laborda, F.; Szpunar, J. Long-Term Study of Antibiotic Presence in Ebro River Basin (Spain): Identification of the Emission Sources. Water 2022, 14, 1033. [Google Scholar] [CrossRef]
- Kaiser, R.A.; Polk, J.S.; Datta, T.; Parekh, R.R.; Agga, G.E. Occurrence of Antibiotic Resistant Bacteria in Urban Karst Groundwater Systems. Water 2022, 14, 960. [Google Scholar] [CrossRef]
- Malakootian, M.; Faraji, M.; Malakootian, M.; Nozari, M.; Malakootian, M. Ciprofloxacin removal from aqueous media by adsorption process: A systematic review and meta-analysis. Desalination Water Treat. 2021, 222, 1–32. [Google Scholar] [CrossRef]
- Pan, M.; Chu, L.M. Fate of Antibiotics in Soil and Their Uptake by Edible Crops. Sci. Total Environ. 2017, 599–600, 500–512. [Google Scholar] [CrossRef]
- Xu, Y.; Yu, X.; Xu, B.; Peng, D.; Guo, X. Sorption of Pharmaceuticals and Personal Care Products on Soil and Soil Components: Influencing Factors and Mechanisms. Sci. Total Environ. 2021, 753, 141891. [Google Scholar] [CrossRef]
- Conde-Cid, M.; Fernández-Calviño, D.; Núñez-Delgado, A.; Fernández-Sanjurjo, M.J.; Arias-Estévez, M.; Álvarez-Rodríguez, E. Estimation of Adsorption/Desorption Freundlich’s Affinity Coefficients for Oxytetracycline and Chlortetracycline from Soil Properties: Experimental Data and Pedotransfer Functions. Ecotoxicol. Environ. Saf. 2020, 196, 110584. [Google Scholar] [CrossRef]
- Muendo, B.M.; Shikuku, V.O.; Getenga, Z.M.; Lalah, J.O.; Wandiga, S.O.; Rothballer, M. Adsorption-Desorption and Leaching Behavior of Diuron on Selected Kenyan Agricultural Soils. Heliyon 2021, 7, e06073. [Google Scholar] [CrossRef] [PubMed]
- Zhang, D.; Yang, S.K.; Wang, Y.N.; Yang, C.Y.; Chen, Y.Y.; Wang, R.Z.; Wang, Z.Z.; Yuan, X.Y.; Wang, W.K. Adsorption Characteristics of Oxytetracycline by Different Fractions of Organic Matter in Sedimentary Soil. Environ. Sci. Pollut. Res. 2019, 26, 5668–5679. [Google Scholar] [CrossRef] [PubMed]
- Septian, A.; Oh, S.; Shin, W.S. Sorption of Antibiotics onto Montmorillonite and Kaolinite: Competition Modelling. Environ. Technol. 2019, 40, 2940–2953. [Google Scholar] [CrossRef]
- Deng, X.; Jiang, Y.; Zhang, M.; Nan, Z.; Liang, X.; Wang, G. Sorption properties and mechanisms of erythromycin and ampicillin in loess soil: Roles of pH, ionic strength, and temperature. Chem. Eng. J. 2022, 434, 134694. [Google Scholar] [CrossRef]
- Call, J.J.; Rakshit, S.; Essington, M.E. The Adsorption of Tylosin by Montmorillonite and Vermiculite: Exchange Selectivity and Intercalation. Soil Sci. Soc. Am. J. 2019, 83, 584–596. [Google Scholar] [CrossRef]
- Pavlovic, D.M.; Curkovic, L.; Grcic, I.; Simic, I.; Zupan, J. Isotherm, kinetic, and thermodynamic study of ciprofloxacin sorption on sediments. Environ. Sci. Pollut. Res. 2017, 24, 10091–10106. [Google Scholar] [CrossRef]
- Franklin, A.M.; Williams, C.; Andrews, D.M.; Watson, J.E. Sorption and desorption behavior of four antibiotics at concentrations simulating wastewater reuse in agricultural and forested soils. Chemosphere 2022, 289, 133038. [Google Scholar] [CrossRef]
- Xu, X.; Ma, W.; An, B.; Zhou, K.; Mi, K.; Huo, M.; Liu, H.; Wang, H.; Liu, Z.; Cheng, G.; et al. Adsorption/desorption and degradation of doxycycline in three agricultural soils. Ecotoxicol. Environ. Saf. 2021, 224, 112675. [Google Scholar] [CrossRef]
- Álvarez-Esmorís, C.; Conde-Cid, M.; Fernández-Calviño, D.; Fernández-Sanjurjo, M.J.; Núñez-Delgado, A.; Álvarez-Rodríguez, E.; Arias-Estévez, M. Adsorption-desorption of doxycycline in agricultural soils: Batch and stirred-flow-chamber experiments. Environ. Res. 2020, 186, 109565. [Google Scholar] [CrossRef]
- Conde-Cid, M.; Fernández-Calviño, D.; Nóvoa-Muñoz, J.C.; Núñez-Delgado, A.; Fernández-Sanjurjo, M.J.; Arias-Estévez, M.; Álvarez-Rodríguez, E. Experimental Data and Model Prediction of Tetracycline Adsorption and Desorption in Agricultural Soils. Environ. Res. 2019, 177, 108607. [Google Scholar] [CrossRef]
- Wu, Q.; Li, Z.; Hong, H.; Li, R.; Jiang, W.-T. Desorption of Ciprofloxacin from Clay Mineral Surfaces. Water Res. 2013, 47, 259–268. [Google Scholar] [CrossRef]
- Zhao, P.; Zhang, X.; Sun, C.; Wu, J.; Wu, Y. Experimental Study of Conservative Solute Transport in Heterogeneous Aquifers. Environ. Earth Sci. 2017, 76, 421. [Google Scholar] [CrossRef]
- Klute, A.; Dirksen, C. Hydraulic conductivity and diffusivity: Laboratory methods. In Methods of Soil Analysis: Part 1 Physical and Mineralogical Methods; Klute, A., Ed.; SSSA: Madison, WI, USA, 1986; pp. 687–734. [Google Scholar]
- Zhang, Y.; Price, G.W.; Jamieson, R.; Burton, D.; Khosravi, K. Sorption and desorption of selected non-steroidal anti-inflammatory drugs in an agricultural loam-textured soil. Chemosphere 2017, 174, 628–637. [Google Scholar] [CrossRef]
- Zhang, H.; Xu, S.; Lin, Q. Influence of Metal Cation and SurfaceIron Oxide on the Transport of Sulfadiazine in Saturated Porous Media. Sci. Total Environ. 2021, 758, 143621. [Google Scholar] [CrossRef]
- Park, I.; Shin, J.; Seong, H.; Rhee, D.S. Comparisons of Two Types of Particle Tracking Models Including the Effects of Vertical Velocity Shear. Water 2020, 12, 3535. [Google Scholar] [CrossRef]
- Van Genuchten, M.T.; Simunek, J.; Leij, F.J.; Toride, N.; Sejna, M. Stanmod: Model Use, Calibration, and Validation. Trans. ASABE 2012, 55, 1353–1366. [Google Scholar] [CrossRef]
- Xu, Z.; Cai, J.G.; Pan, B.C. Mathematically Modeling Fixed-Bed Adsorption in Aqueous Systems. J. Zhejiang Univ. Sci. A 2013, 14, 155–176. [Google Scholar] [CrossRef] [Green Version]
- Yan, G.Y.; Viraraghavan, T.; Chen, M. A New Model for Heavy Metal Removal in a Biosorption Column. Adsorpt. Sci. Technol. 2001, 19, 25–43. [Google Scholar] [CrossRef]
- Pokhrel, D.; Viraraghavan, T. Arsenic Removal in an Iron Oxide-Coated Fungal Biomass Column: Analysis of Breakthrough Curves. Bioresour. Technol. 2008, 99, 2067–2071. [Google Scholar] [CrossRef]
- Yan, B.; Niu, C.H. Modeling and Site Energy Distribution Analysis of Levofloxacin Sorption by Biosorbents. Chem. Eng. J. 2017, 307, 631–642. [Google Scholar] [CrossRef]
- Wu, Q.; Li, Z.; Hong, H.; Yin, K.; Tie, L. Adsorption and Intercalation of Ciprofloxacin on Montmorillonite. Appl. Clay Sci. 2010, 50, 204–211. [Google Scholar] [CrossRef]
- Wu, M.; Zhao, S.; Jing, R.; Shao, Y.; Liu, X.; Lv, F.; Hu, X.; Zhang, Q.; Meng, Z.; Liu, A. Competitive Adsorption of Antibiotic Tetracycline and Ciprofloxacin on Montmorillonite. Appl. Clay Sci. 2019, 180, 105175. [Google Scholar] [CrossRef]
- Wang, C.-J.; Li, Z.; Jiang, W.-T.; Jean, J.-S.; Liu, C.-C. Cation Exchange Interaction between Antibiotic Ciprofloxacin and Montmorillonite. J. Hazard. Mater. 2010, 183, 309–314. [Google Scholar] [CrossRef] [PubMed]
- Li, Z.; Hong, H.; Liao, L.; Ackley, C.J.; Schulz, L.A.; MacDonald, R.A.; Miheliche, A.L.; Emard, S.M. A Mechanistic Study of Ciprofloxacin Removal by Kaolinite. Colloids Surf. B Biointerfaces 2011, 88, 339–344. [Google Scholar] [CrossRef]
- Gu, C.; Karthikeyan, K.G. Sorption of the Antimicrobial Ciprofloxacin to Aluminum and Iron Hydrous Oxides. Environ. Sci. Technol. 2005, 39, 9166–9173. [Google Scholar] [CrossRef]
- Zhang, H.; Huang, C.-H. Adsorption and Oxidation of Fluoroquinolone Antibacterial Agents and Structurally Related Amines with Goethite. Chemosphere 2007, 66, 1502–1512. [Google Scholar] [CrossRef] [PubMed]
- Lalley, J.; Han, C.; Li, X.; Dionysiou, D.D.; Nadagouda, M.N. Phosphate Adsorption Using Modified Iron Oxide-Based Sorbents in Lake Water: Kinetics, Equilibrium, and Column Tests. Chem. Eng. J. 2016, 284, 1386–1396. [Google Scholar] [CrossRef]
- Li, S.Q.; Zhang, X.D.; Huang, Y.M. Zeolitic Imidazolate Framework-8 Derived Nanoporous Carbon as an Effective and Recyclable Adsorbent for Removal of Ciprofloxacin Antibiotics from Water. J. Hazard. Mater. 2017, 321, 711–719. [Google Scholar] [CrossRef]
- Valizadeh, S.; Younesi, H.; Bahramifar, N. Highly Mesoporous K2CO3 and KOH/Activated Carbon for SDBS Removal from Water Samples: Batch and Fixed-Bed Column Adsorption Process. Environ. Nanotechnol. Monit. Manag. 2016, 6, 1–13. [Google Scholar] [CrossRef]
- Li, M.-f.; Liu, Y.-g.; Liu, S.-b.; Shu, D.; Zeng, G.-m.; Hu, X.-j.; Tan, X.-f.; Jiang, L.-h.; Yan, Z.-l.; Cai, X.-x. Cu(II)-Influenced Adsorption of Ciprofloxacin from Aqueous Solutions by Magnetic Graphene Oxide/Nitrilotriacetic Acid Nanocomposite: Competition and Enhancement Mechanisms. Chem. Eng. J. 2017, 319, 219–228. [Google Scholar] [CrossRef]
- Chen, H.; Gao, B.; Li, H. Removal of Sulfamethoxazole and Ciprofloxacin from Aqueous Solutions by Graphene Oxide. J. Hazard. Mater. 2015, 282, 201–207. [Google Scholar] [CrossRef]
- Toride, N.; Leij, F.J.; Van Genuchten, M.T. The CXTFIT Code for Estimating Transport Parameters from Laboratory or Field Tracer Experiments. version 2.1; U.S. Salinity Laboratory, Agricultural Research Service, U.S. Department of Agriculture: Riverside, CA, USA, 1999. [Google Scholar]
- Zhou, D.; Li, Y.; Zhang, Y.; Zhang, C.; Li, X.; Chen, Z.; Huang, J.; Li, X.; Flores, G.; Kamon, M. Column Test-Based Optimization of the Permeable Reactive Barrier (PRB) Technique for Remediating Groundwater Contaminated by Landfill Leachates. J. Contam. Hydrol. 2014, 168, 1–16. [Google Scholar] [CrossRef]
Figure 1.
Effect of contact time for CPX adsorption (a) and desorption (b) by sandy silt soil. The adsorption and desorption tests were conducted with an initial CPX concentration of 50 mg L−1 without adjusting pH for 48 h under an oscillation rate of 110 rpm and 298 K.
Figure 1.
Effect of contact time for CPX adsorption (a) and desorption (b) by sandy silt soil. The adsorption and desorption tests were conducted with an initial CPX concentration of 50 mg L−1 without adjusting pH for 48 h under an oscillation rate of 110 rpm and 298 K.

Figure 2.
Adsorption (a) and desorption (b) isotherms of CPX in sandy silt soil. The adsorption and desorption tests were conducted with different initial CPX concentrations (10, 20, 30, 40, 50, 60, 80, and 100 mg L−1) at an ionic strength of 0.01 mol L−1 CaCl2 without adjusting pH for 48 h under an oscillation rate of 110 rpm and 298 K.

Figure 3.
Effect of (a) sandy silt soil dosage, (b) solution pH, and (c) ionic strength on the adsorption and desorption of CPX by sandy silt soil. Effect of (d) sandy silt soil dosage, (e) solution pH, and (f) ionic strength on the desorption percentages.
Figure 3.
Effect of (a) sandy silt soil dosage, (b) solution pH, and (c) ionic strength on the adsorption and desorption of CPX by sandy silt soil. Effect of (d) sandy silt soil dosage, (e) solution pH, and (f) ionic strength on the desorption percentages.

Figure 4.
Measured and fitting breakthrough curves of (a) KCl and (b) CPX in sandy silt soil column; and (c) sketch showing expected change with PV in the normal concentration ratio of CPX in the effluent.
Figure 4.
Measured and fitting breakthrough curves of (a) KCl and (b) CPX in sandy silt soil column; and (c) sketch showing expected change with PV in the normal concentration ratio of CPX in the effluent.


Table 1.
Properties of the sandy silt soil and soil column applied for this work.
| Particle Size Fraction | Specific Surface Area (m2 kg) | Total Organic Carbon (g kg−1) | Total Porosity, θ | Bulk Density, ρ (g cm−3) | Hydraulic Conductivity, K (cm h−1) | ||
|---|---|---|---|---|---|---|---|
| Clay (%) | Silt (%) | Sand (%) | |||||
| 3 | 59 | 38 | 321 | 3.34 | 0.362 | 1.44 | 0.058 |
Table 2.
Kinetic parameters for the pseudo-first-order and pseudo-second-order models.
| Kinetic Model | k1 | k2 (g mg−1h−1) | Calculated qe (mg g−1) | Experimental qe (mg g−1) | R2 |
|---|---|---|---|---|---|
| pseudo-first- order adsorption | 0.100 | - | 0.315 | 3.55 | 0.909 |
| pseudo-second- order adsorption | 1.74 | 3.55 | 3.55 | 0.999 | |
| pseudo-first- order desorption | 0.116 | - | 0.0535 | 1.34 | 0.170 |
| pseudo-second- order desorption | - | 1.84 | 1.34 | 1.34 | 0.999 |
Table 3.
Parameters for the Langmuir and Freundlich models.
| Process | Isotherm Model | qm (mg g−1) | KL (L mg−1) | RL | KF (L mg−1) | n | R2 |
|---|---|---|---|---|---|---|---|
| Adsorption | Langmuir | 5.50 | 0.0329 | 0.378 | - | - | 0.991 |
| Freundlich | - | - | - | 0.433 | 1.92 | 0.907 | |
| Desorption | Langmuir | 19.6 | 0.0179 | 0.527 | - | - | 0.982 |
| Freundlich | - | - | - | 0.378 | 0.88 | 0.974 |
Table 4.
Parameters of the ADE of KCl and TRM, Thomas and Yan models of CPX for fitting breakthrough curves.
Table 4.
Parameters of the ADE of KCl and TRM, Thomas and Yan models of CPX for fitting breakthrough curves.
| Model | Parameters | KCl | CPX |
|---|---|---|---|
| ADE | (cm h−1) | 24.6 | - |
| D (cm2 h−1) | 4.82 | - | |
| R2 | 0.999 | - | |
| Two-region model | (cm h−1) | 24.6 | - |
| D (cm2 h−1) | 4.90 | - | |
| β | 0.999 | - | |
| ω | 100 | - | |
| R2 | 0.999 | - | |
| Two-site model | (cm h−1) | 24.6 | - |
| D (cm2 h−1) | - | 4.82 | |
| R | - | 345 | |
| β | - | 0.248 | |
| ω | - | 100 | |
| R2 | - | 0.986 | |
| P | 173.5 | ||
| Thomas model | KT (L2 g−1h−1) | - | 0.000280 |
| qT (mg g−1) | - | 4.67 | |
| R2 | - | 0.902 | |
| Yan model | a | - | 4.87 |
| qY (mg g−1) | - | 4.05 | |
| R2 | - | 0.755 |
Publisher’s Note: MDPI stays neutral with regard to jurisdictional claims in published maps and institutional affiliations. |
© 2022 by the authors. Licensee MDPI, Basel, Switzerland. This article is an open access article distributed under the terms and conditions of the Creative Commons Attribution (CC BY) license (https://creativecommons.org/licenses/by/4.0/).
Share and Cite
MDPI and ACS Style
Zhao, P.; Wu, Y.; Yu, F. Experimental Data and Modeling the Adsorption-Desorption and Mobility Behavior of Ciprofloxacin in Sandy Silt Soil. Water 2022, 14, 1728. https://doi.org/10.3390/w14111728
AMA Style
Zhao P, Wu Y, Yu F. Experimental Data and Modeling the Adsorption-Desorption and Mobility Behavior of Ciprofloxacin in Sandy Silt Soil. Water. 2022; 14(11):1728. https://doi.org/10.3390/w14111728
Chicago/Turabian StyleZhao, Pingping, Yanqing Wu, and Fei Yu. 2022. "Experimental Data and Modeling the Adsorption-Desorption and Mobility Behavior of Ciprofloxacin in Sandy Silt Soil" Water 14, no. 11: 1728. https://doi.org/10.3390/w14111728
Note that from the first issue of 2016, this journal uses article numbers instead of page numbers. See further details here.