Article

Impact of Flooding on Shallow Groundwater Chemistry in the Taklamakan Desert Hinterland: Remote Sensing Inversion and Geochemical Methods

College of Ecology and Environment, Xinjiang University, Urumqi 830046, China
*
Author to whom correspondence should be addressed.
Water 2022, 14(11), 1724; https://doi.org/10.3390/w14111724
Submission received: 23 April 2022 / Revised: 21 May 2022 / Accepted: 25 May 2022 / Published: 27 May 2022
(This article belongs to the Section Hydrogeology)

Abstract

:
Understanding the effect of flooding on groundwater quality is imperative for oasis vegetation protection and local ecological environment development. We used geochemical and remote sensing inversion methods to evaluate the effects of flood recharge on the groundwater hydrochemical and geochemical processes in the Daliyaboy Oasis. Groundwater samples were collected from 30 ecological observation wells in the study area before (PRF) and after (POF) the flood. Except for small changes in HCO3 and K+ and a decrease in pH, ion levels were higher POF than PRF, and the water chemistry was essentially unchanged. In the POF groundwater, HCO3 was correlated with Cl, Na+, Mg2+, total soluble solids (TDS), and electrical conductivity (EC), but not with SO42−, Ca2+, K+, or pH, and was positively correlated with all other variables, while the remaining variables, except for pH, were strongly positively correlated with each other. PRF water chemistry was controlled by silicate and evaporite mineral weathering and evaporation processes, resulting in high groundwater TDS, EC, and a major ion content, while POF major groundwater ions were regulated by mineral weathering and flood recharge. We demonstrated the high accuracy of remote sensing inversion, confirming this as a reliable method for evaluating groundwater chemistry. The results of the study help to reshape and predict the history of the regional hydrogeological environment and hydrogeochemical development, and provide a theoretical basis for assessing the rational use of local water resources and protecting the ecological environment.

1. Introduction

Analysis of the hydrochemical composition of natural water bodies and their origins is useful in reshaping and predicting the regional hydrogeological environment and the history of hydrogeochemical development, as well as acting as a basis for the evaluation of water resources [1]. Deserts in arid to semi-arid regions of China are water-scarce, and their hydrospheric dynamics have a profound impact on the fragile ecological status of the region [2]. A comprehensive understanding of natural water bodies in the region and the factors underlying their persistence is important for the maintenance not only of ecological balance, but also for implementing science-driven water management strategies to ensure sustainability.
The Taklamakan Desert, located in the deepest parts of mid-China, has little rain, high evaporation, and sparse vegetation; this makes it one of the most arid and water-scarce regions in China [3]. The study area, Daliyaboy Oasis, is located in the desert hinterland [4]. The persistence of the oasis is dependent upon interstitial recharge by the Kriya River [5,6]. In this region, groundwater has become the main source of water for domestic and agricultural use. With the massive exploitation of groundwater due to global climate change, the frequency of climate extremes, melting glaciers, resulting in increased flooding events, and the increased salinity of groundwater and surface water, the response to climate change is becoming more pronounced and has a dramatic impact on the composition of groundwater [7,8,9], population growth [10], overgrazing, and the cultivation of cash crops (such as cistanche), which have left water resources strained. Annually, the oasis is recharged by upstream floods, which influence the groundwater quality. Since changes in water quality can affect local life [11], the economy, and the surrounding ecological space, it is important to understand the effect of flooding on the groundwater quality in this area. This would allow for an evidence-based approach to be taken for the protection of the oasis and the various spheres dependent on its health and persistence (i.e., people, vegetation, animals, etc.).
During runoff and surface water recharge, groundwater is constantly in contact with rocks and soil, which influence its chemical composition. The natural ionic composition of groundwater is an important factor in identifying and judging its chemical characteristics and their underlying elements [12]. For example, Bayanzul et al. [13] used a hydrogeochemical method to perform a study on the recharge and evolution process of groundwater in the Ulaanbaatar Desert; their results showed that the chemical composition of shallow groundwater is controlled by evaporation and concentration, whereas, that of deep groundwater is controlled by rock weathering, as atmospheric precipitation has almost no effect on the groundwater at such depths. Xiao et al. [14] also conducted a study on shallow groundwater in a desert environment, specifically the Dachaidan area of the Qaidam Basin, Qinghai, China. Using hydrochemical maps, ion ratio analysis, and saturation indices, a summary of the evolution of groundwater recharge, runoff, and discharge in the northwest arid region was created. Masoud et al. [15] analyzed the chemical properties of groundwater and its spatial patterns in the Dakhla Oasis, Egypt, using factor analysis; their results showed that evaporation and ion exchange are the main controlling factors of groundwater evolution. Cook et al. [16] show that flooding may affect the hydrodynamic behavior of the system and influence the hydrochemical composition of the groundwater by examining the physical and biological properties of riverine ecosystems interacting in complex ways. The abovementioned studies mainly focused on the evolution of groundwater processes and causal analyses of desert edge oases, while evolutionary patterns of desert hinterlands and desert edge oasis groundwater remain mostly unexplored.
The use of mathematical and statistical methods in groundwater hydrochemical research can provide a comprehensive characterization of groundwater dynamics in a specific area; however, this approach tends to have the drawback of requiring intensive sample collection efforts and human resources [17,18]. Additionally, this approach lacks sufficient persuasive power, simply by virtue of sampling efforts occurring in a restricted geographic range. This means many subtle, regional differences can remain undetected via this method. In contrast, remote sensing tools can use relevant covariates to model with actual sample points in order to predict values in other regions and reflect ecological problems in two dimensions [19]. This can be achieved without the complex and expensive logistical efforts that are seen during field trips. To better assess groundwater ion content and understand its potential ion dynamics, it is necessary to study the spatial variation of ions from the perspective of remote sensing inversion. At present, numerous researchers around the world have collectively created a respectable research base on the physiochemical properties of groundwater at the edge of the oases [20,21,22]. However, the conversion relationships between the desert edge, hinterland, and flooding within the context of groundwater’s hydrochemical characteristics and evolutionary laws have not been systematically reported.
In particular, hydrological data-driven models have an important role in solving hydrological problems. Noori et al. [23] developed a robust method to predict the total sand transport TSL of rivers based on principal component analysis (PCA), modified multiple linear regression (MLR), and support vector regression (SVR) models. Behzad Ghiasi et al. [24] developed an artificial intelligence-based prediction model that couples granularity computing and a neural network model (GrC-ANN) to evaluate water quality and water quality improvement strategies in natural rivers. Borzooei et al. [25] applied two clustering methods, the K-means algorithm and Gaussian mixture model (GMM) based on the expectation maximization (EM) algorithm, to a wide range of historical and meteorological record datasets. This study addressed the problem of determining the intrinsic structure of clustered data when no information other than observations is available. In this study, traditional methods such as statistics, correlation analysis, Piper’s trilinear plot, the Gibbs model, and the ion ratio were combined with new methods such as random forest modeling and remote sensing inversion to predict the entire study area using environmental covariates with measured data for random forest modeling information for the entire study area. Remote sensing inversion showed high accuracy, confirming the close relationship between environmental covariates and groundwater chemistry, which can be applied to future studies in the area, providing a scientific basis for water resource use and vegetation conservation in arid areas.

2. Materials and Methods
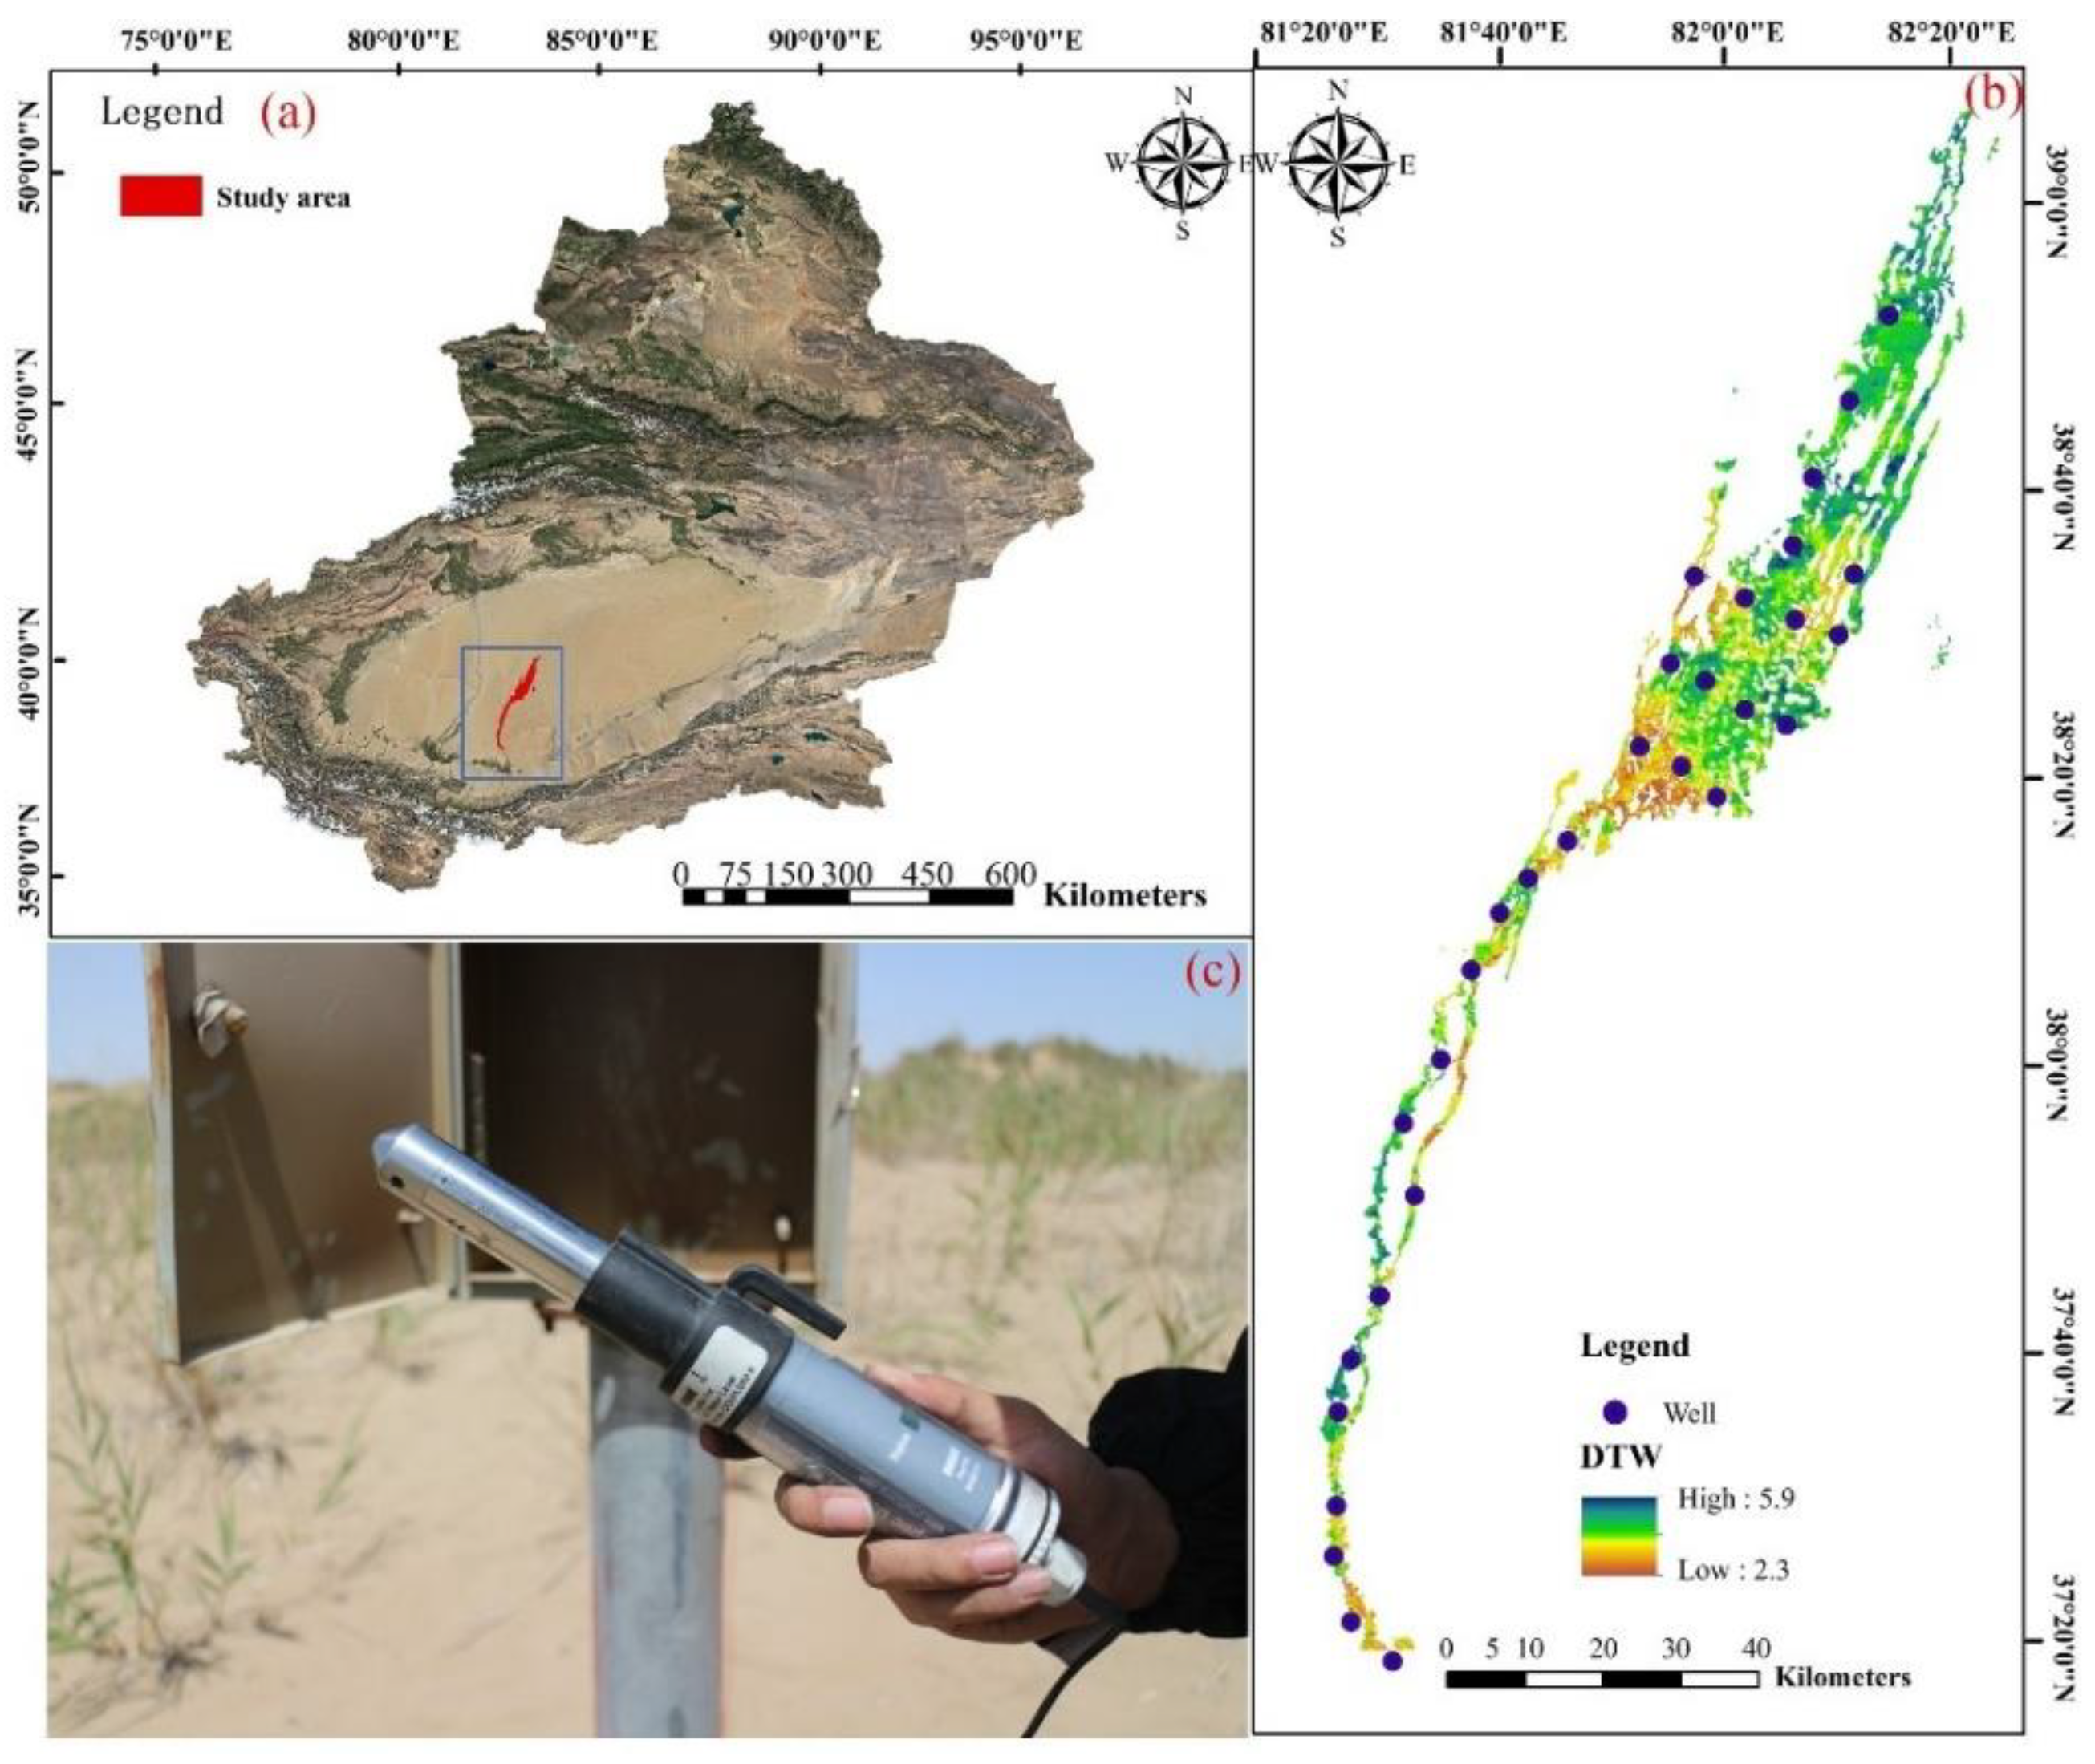
2.1. Study Area

The Daliyaboy Oasis is located 250 km off the coast in the hinterland of the Taklamakan Desert, the largest desert in China. It is a leafy coccyx oasis formed and supported by the lower reaches of the Kriya River [26]. The geographical coordinates are 81°90′15″–82°23′41″ E, 37°20′39″–39°10′35″ N (Figure 1b). The terrain is high in the south and low in the north and the oasis is approximately 80 km long, 7–15 km wide, with a total area of 342 km2 and an altitude of 1161–1300 m [27]. The area has a temperate continental arid desert climate and is characterized by high evaporation, low rainfall, a large diurnal temperature difference, and a long frost-free period. The main water source in the study area is the Kriya River, which runs through the whole area from south to north, with the oasis lying predominantly on the alluvial plain along the Kriya River, before the river breaks off to the desert hinterland. The groundwater recharges mainly by river water seepage and atmospheric precipitation, while the mode of underground runoff is determined by the steep south–north topography. The mode of groundwater discharge is predominantly via evaporation, lateral runoff, and artificial mining. Due to the study area being located in the hinterland of a desert, the soil type is relatively homogeneous; the upper layer is mainly sandy soil, and the lower layer is mainly evaporite rocks such as slate gypsum layers, mannite, rock salt, and potash [28,29]. In this paper, soil property characteristics and hydrogeological information of the study area were obtained through field survey and field infiltration experiments. Among them, the double-loop method was used to determine the soil infiltration coefficient K. The survey and experimental results showed that the soil and hydrogeological conditions in the study area were basically homogeneous and the soil structure was single, and the infiltration coefficients were almost similar, with values ranging from 8.84 to 9.36 m/d.

2.2. Data

2.2.1. Groundwater Ions, Groundwater Depth, TDS, and EC Data

In October 2018 and May 2019, samples were collected from 30 groundwater ecological monitoring stations in the study area before (PRF) and after (POF) the floods (Figure 1). Prior to the sampling, pre-sterilized polyethylene bottles were washed three times with water samples. The water samples were taken, preserved, and transported according to the Technical Specification for Environmental Monitoring (HJ/T164-2004). The samples were then assayed by the Ecological and Environmental Analysis and Testing Center of Xinjiang Institute of Ecology and Geography, China, and tested for eight ions (K+, Na+, Ca2+, Mg2+, HCO3, CO32−, Cl, and SO42−), pH, electrical conductivity (EC), and total soluble solids (TDS). K+, Na+, Ca2+, and Mg2+ were determined via flame atomic absorption spectrophotometry; HCO3 and CO32− were determined via disodium EDTA titration (CO32− ions were not detected); and Cl and SO42− were determined via ion chromatography. Hassi multiparameter portable instrument (HQ40D, Hach, Loveland, CO, USA; Shanghai Yixiang Environmental Protection Technology Co., Shanghai, China) was used to determine the pH and EC. Finally, the dry-weight method was used to determine TDS.

2.2.2. Environmental Covariates for Groundwater Indicator Inversion

For the inversion of groundwater indicators in the study area, 17 environmental covariates were selected based on their correlation with groundwater. The obtained climatic factors, digital elevation models, surface features, and soil types (Table 1) were selected for this study with a spatial resolution of 90 m (determined by the size of the study area). The covariates, with various resolutions, were then normalized in ArcGIS 10.8 and re-projected to the World Geodetic System (WGS) coordinate system.

2.3. Random Forest Model

Modeling between groundwater indicators and environmental covariates was performed using Random Forests in matlab2018b. Random Forest (RF) models [34,35] are an ensemble of decision trees (ntrees) with a high generalization ability. The advantage of RF models is the introduction of “randomness” to deal with “overfitting” by an iterative bootstrap method known as out-of-bag (OOB), which allows for unbiased estimation during decision tree generation.
A large number of theoretical and practical studies have proved that the RF algorithm has high accuracy and stability, owning good tolerance for abnormal value and noise and hardly to over fit [36]. The RF has gotten so many positive evaluations in machine learning, data mining, and many other fields [37,38]. Furthermore, Fernandez et al. evaluated 179 classifiers algorithms, and the results showed that RF is the most outstanding one among these algorithms [39].
First of all, we created the tree structure regression classifier; for data set of X that was needed for prediction, we used the following equation to calculate the corresponding parameters’ concentration (Yk):
Y k = a r g a v e ( i n h i ( x k | ( f i ) ) )
where Yk is the prediction result of the kth sample set, argave(·) is averaging algorithm, hi(·) is the calculation result of the ith regression tree, and xk|(·) is the kth input sample set.
Then, the accuracy of the model’s prediction result is described by the mean square value of generalization error of the vector h(X) that needs to be forecasted, which is calculated by Equation:
E X , Y ( Y h ( X ) ) 2
where Y is the actual parameters’ concentration of the training set X and h(X) is the predicted concentration of X. EX,Y(·)2 represents the following equation:
E X , Y ( · ) 2 = 1 n t = 1 n ( · ) 2

2.4. Verification of Model Accuracy

To validate the spatiotemporal prediction ability (or robustness) of the RF model, we adopted the 10-fold cross-validation method, which involved dividing the initial training samples taken during 2018 and 2019 into 10 equal parts. For each split, 9/10 of the initial training samples were used to build a new model and the remaining sample (1/10) was used to validate the model. Thus, 10 groups of training and testing samples were obtained. The cross-validation method can predict the performance of the model not only for the spatial variability of groundwater parameters, but also for the temporal variability of groundwater parameters, at least between time periods. Statistical indices of the coefficient of determination (R2) and the root mean square error (RMSE) were used to quantify the bias of the RF models [40]. To test the lack of bias in the model sampling, we detected the spatial distributions of the training and testing samples. By combining the validation strategy for the time-varying prediction of the RF models and the 10-fold cross-validation, we were able to fully ascertain the spatiotemporal prediction capability of the RF model for groundwater parameters.

3. Results and Discussion

3.1. Spatial and Temporal Variation Characteristics of Major Groundwater Ions

We quantified the maximum, minimum, mean, standard deviation, and coefficient of variation of chemical indicators of water samples in October 2018 (pre-flood, PRF) and April 2019 (post-flood, POF) using Excel. The results (Table 2) showed that PRF, the river pH ranged from 7.51 to 8.63 with a mean of 8.15 and the oasis groundwater pH ranged from 8.10 to 8.84 with a mean of 8.43. The post-flood (POF) pH was also weakly alkaline, but was significantly lower than the PRF pH; the river pH ranged from 7.61 to 8.23 with a mean of 7.83, and the oasis pH ranged from 7.88 to 9.19 with a mean of 8.22. The mean TDS values in the river and oasis were 3478.71 and 3326.50 mg/L PRF, and 3894.05 and 3350.7 mg/L PF, respectively. The TDS was significantly higher POF compared to PRF in the river, but not in the oasis, with the highest contributors to the increase being in brackish water (TDS: 1–3 g/L) and salty water (TDS: 3–10 g/L). The total electrical conductivity (EC) PRF ranged from 0.91 to 15.54 mS/cm with a mean of 5.04, and this increased significantly POF, ranging from 1.38 to 18.84 mS/cm with a mean of 5.53.
In terms of cation concentration, Na+ was the most abundant, and K+ was the least abundant. POF, the groundwater cation content of Na+ and Mg2+ increased in both the oasis and river, Ca2+ increased in the river and decreased in the oasis, and K+ did not change significantly. In terms of anion content, the order of abundance was consistently Cl > SO42− > HCO3−, and there was an increase in abundance in the river water POF, with no significant change in the oasis. POF, the coefficient of variation of all ions increased in the river, and decreased in the oasis, with the exceptions of K+ and HCO3, respectively, indicating that the river is more sensitive to environmental changes than the oasis. This is consistent with the results in E. Manikandan’s [41] study which show that, during the monsoon, recharge water flushes the weathered layer and dissolves soil CO2 in the seepage zone, thus increasing the concentration of Na+ in the aquifer, in contrast to the increase in HCO3, probably due to the inconsistent source of ions in the region.

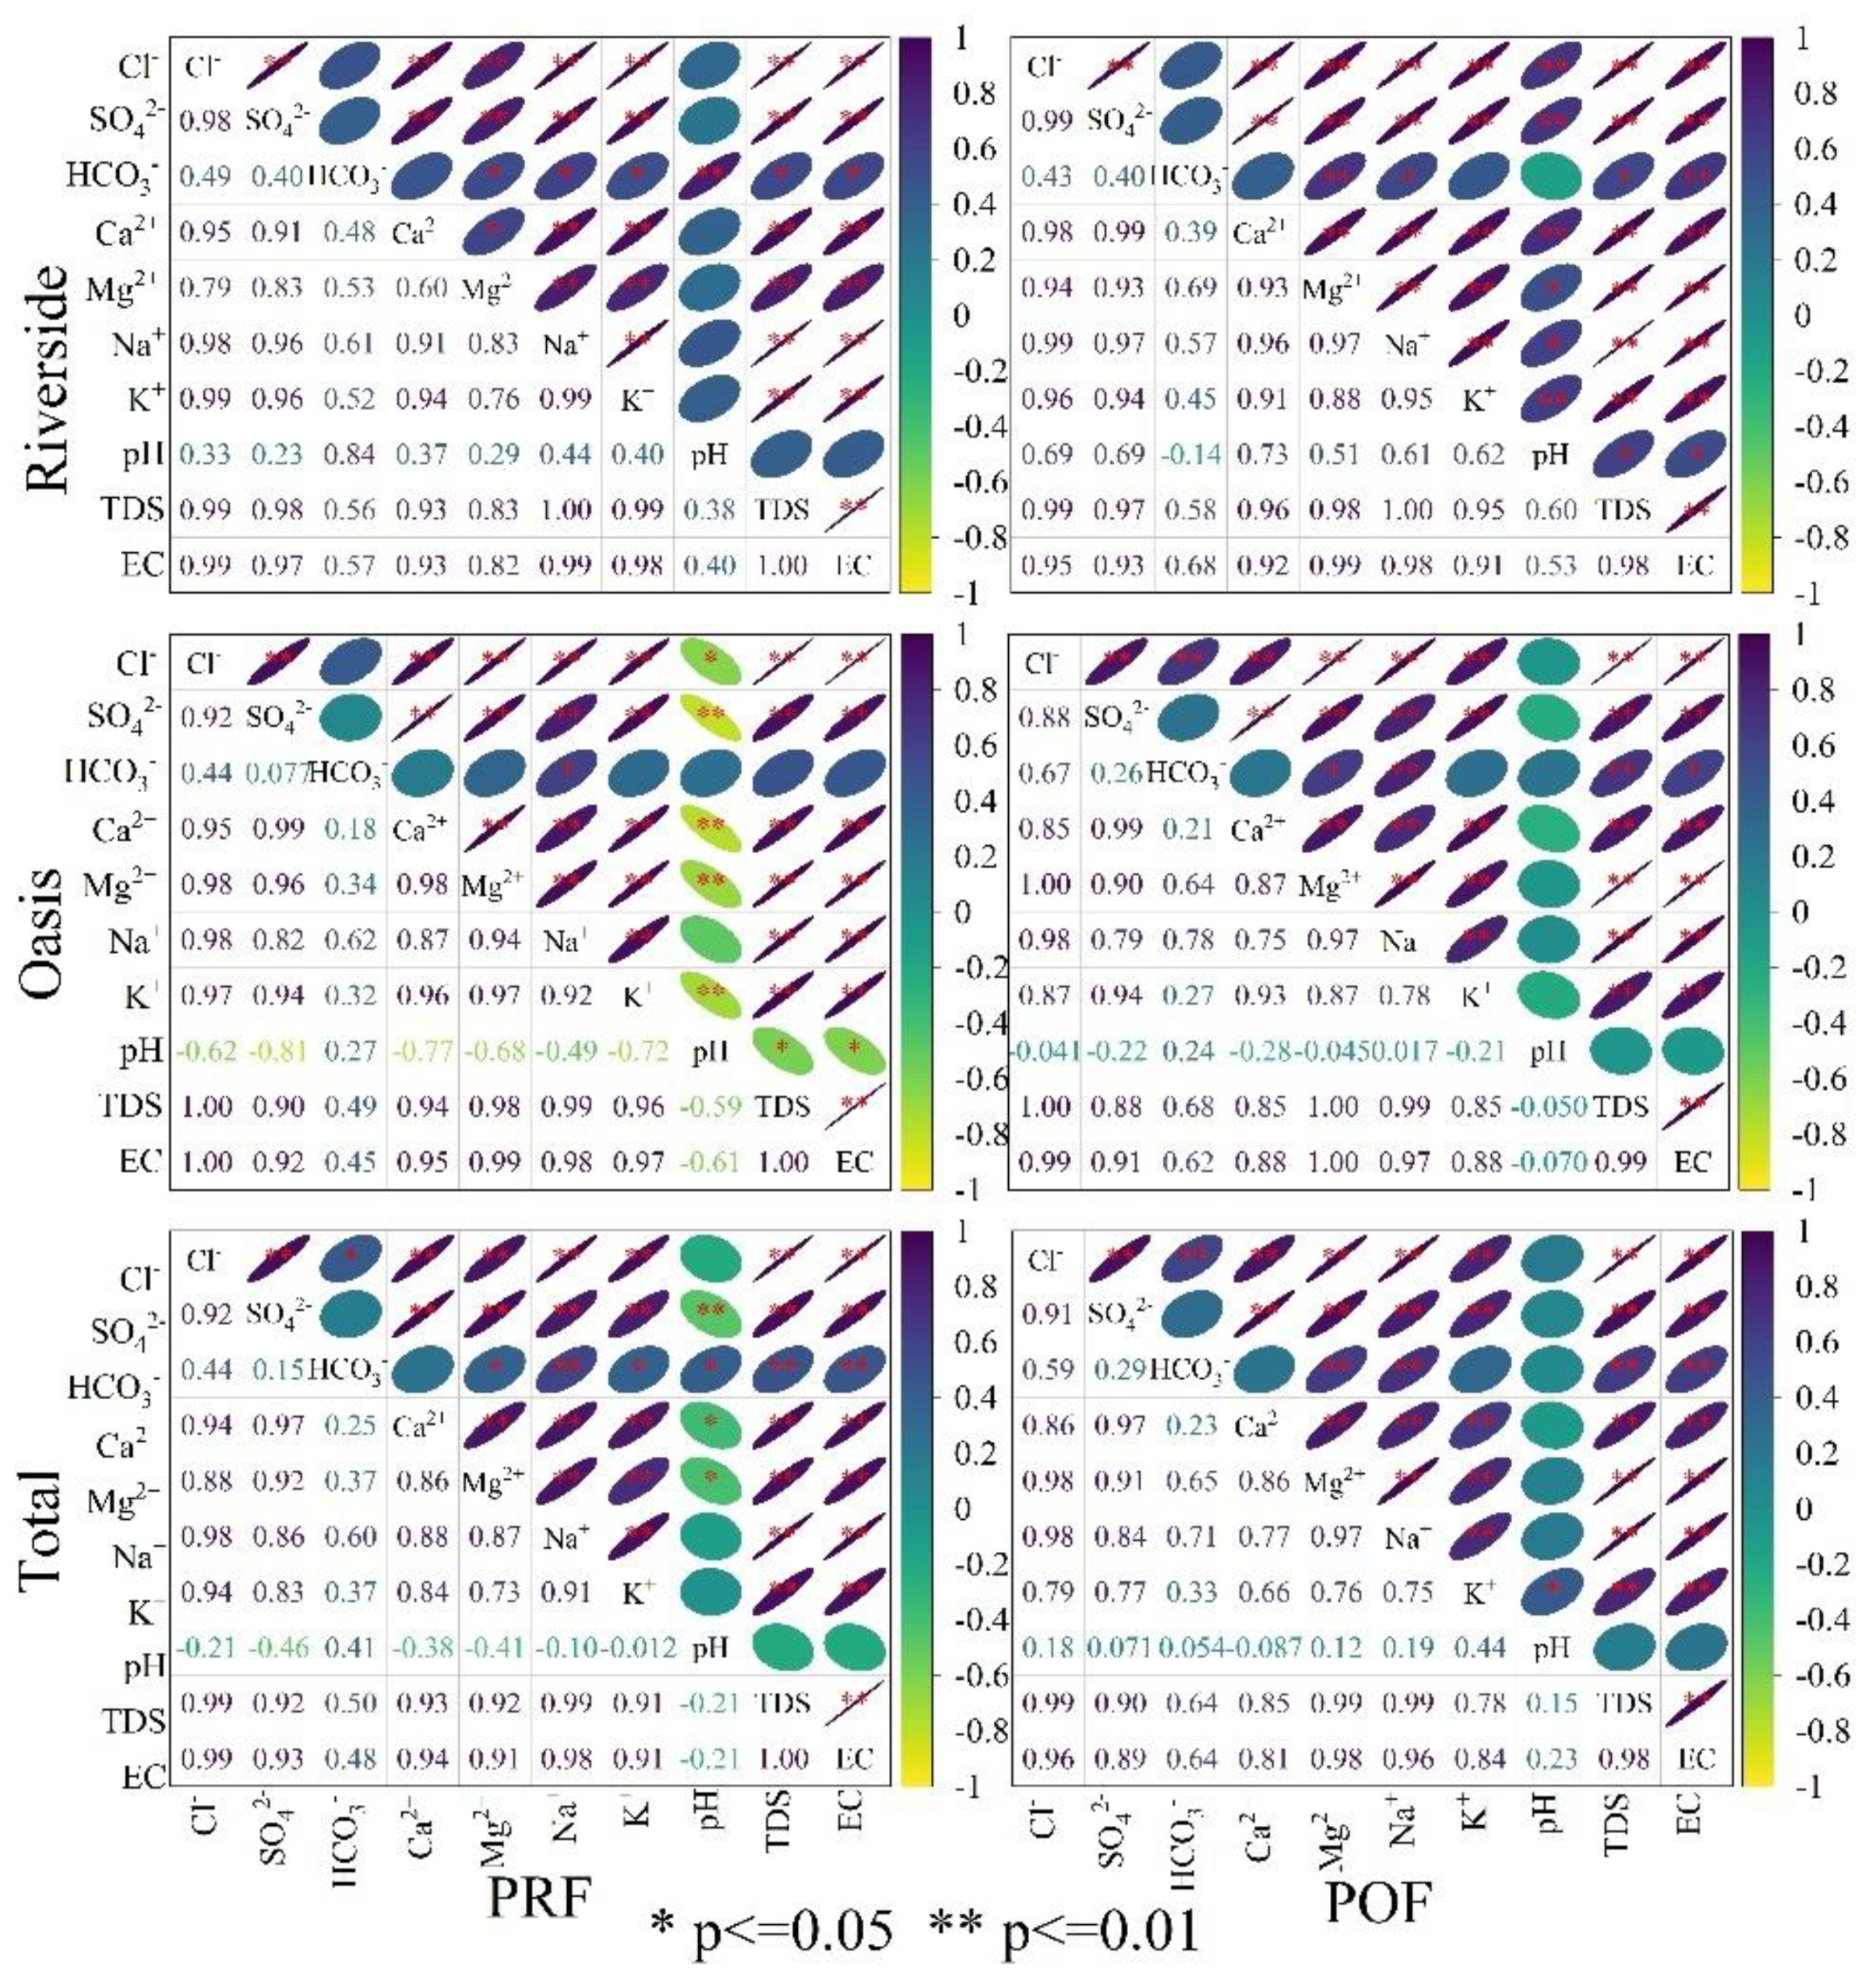
3.2. Correlation of Individual Ions

Figure 2 shows the results of Pearson correlation analysis for PRF and POF data. During the PRF season, the riverside pH was strongly positively correlated with HCO3 (p < 0.01), but no other variables, while moderate correlations were found between HCO3 and the other variables (p < 0.05). K+, Ca2+, Na+, Mg2+, Cl, and SO42− displayed strong positive correlations with all other variables (p < 0.01), while Cl and SO42− were strongly positively correlated with EC, TDS, and major cations (p < 0.01). Within the oasis, K+, Ca2+, Na+, Mg2+, Cl, and SO42− had significant correlations with all other variables, with the cations Na+ and Mg2+ having the highest correlations with the anions Cl, TDS, and EC. With the exception of pH and HCO3, all variables in the study area had highly significant correlations with TDS (p > 0.01), while the cations Na+ and Mg2+ had the highest correlations with Cl, TDS, and EC. The pH was not significantly correlated with the other parameters. In general, these results showed that pH and HCO3 were not strongly correlated with other variables, whereas the other ions and variables were strongly correlated throughout the study area.
During the POF season, the riverside pH lost its correlation with HCO3 and was only moderately correlated with other variables (p < 0.05), while the other variables displayed strong positive correlations with each other (p < 0.01). In the oasis, the pH showed no correlations, while HCO3 showed strong positive correlations with Na+, TDS, and Cl, and moderate correlations with Mg2+ and EC (p < 0.05). HCO3 did not correlate with the remaining variables, though there were strong correlations of these other variables with each other (p < 0.01). Throughout the study area, HCO3 displayed no correlation with SO42−, Ca2+, K+, or pH, but positively correlated with the other variables (p < 0.01). Meanwhile, pH was not correlated with other variables, and the remaining variables were positively correlated with each other (p < 0.01).
In general, the correlations of all parameters with TDS in the study area were highly significant (p > 0.01), except for pH and HCO3, indicating that their sources are somewhat similar, among which, the highest correlations were found between cationic Na+ and anionic Cl and TDS, with correlation coefficients reaching 0.99, indicating that the variation of TDS in the area is mainly influenced by these two factors. The pH was not significantly correlated with other parameters, indicating that the groundwater ions are less affected by pH. The correlation between the pH and other parameters was not significant, indicating that each ion of its groundwater is less affected by pH, which is also consistent with the pattern of high saline water quality exhibited by the local extreme arid ecological environment.

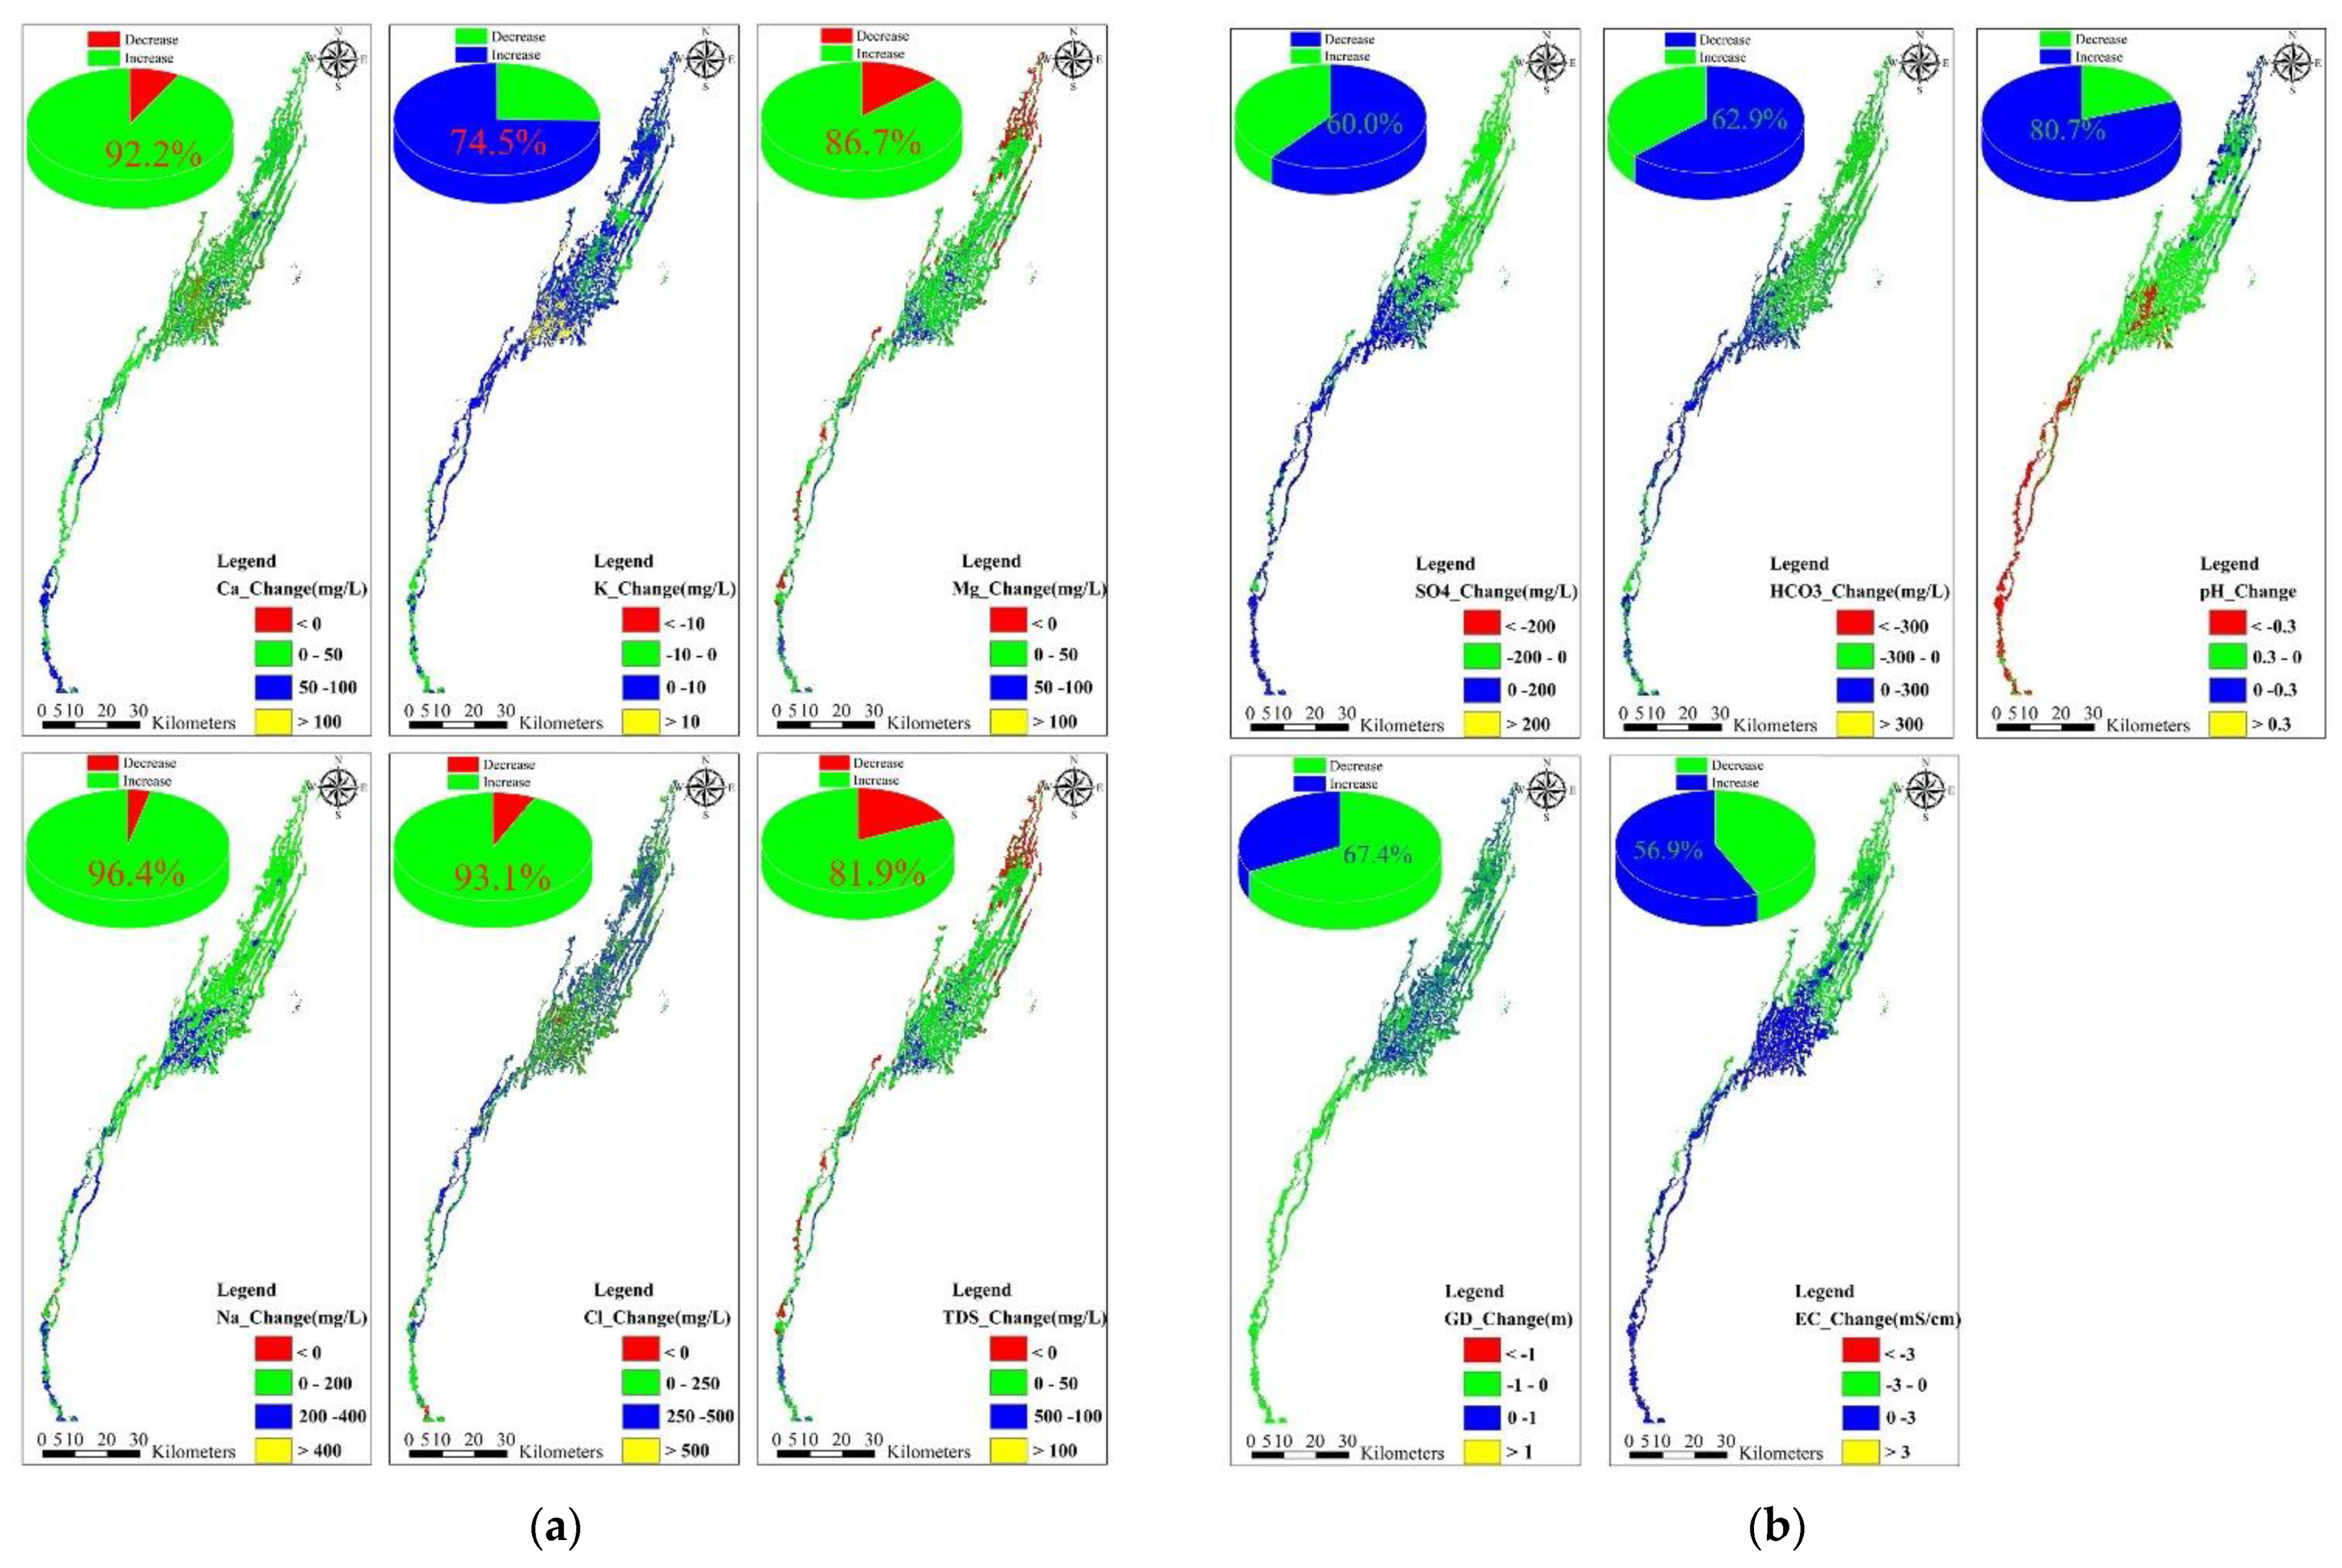
3.3. Changes in Groundwater Chemical Characteristics in the Study Area Based on Remote Sensing Inversion

The results (Figure 3a,b) demonstrated that pH, SO42−, and HCO3 all decreased in the study area POF, while the groundwater depth, Ca2+, Cl, Na+, Mg2+, TDS, and K+ all showed an overall increasing trend, which was more significant than the change seen in the variables that decreased. Meanwhile, the changes in EC were not significant.
The pH of the riverside was obviously lower than that of the oasis PRF, but the overall pH of the study area showed a decreasing trend POF (Figures S1b and S2b). The decrease in pH was evident in 80.7% of the samples, with the most marked decrease observed in the groundwater in the center of the riverside and the oasis. Meanwhile, only 19.3% of samples displayed an increase in pH, which were mainly concentrated in the breakwater. Both PRF and POF, the depth of buried groundwater increased with the increase in latitude, which was consistent with the flow direction of the river. The floodwater is mainly concentrated on the two sides of the oasis rather than the center due to human development, meaning that the flood does not easily reach the center of the oasis. The changes in SO42− and HCO3 are consistent with the changes in burial depth; both decrease with the increase in latitude. Both SO42− and HCO3 have the lowest content at the entrance of the oasis, while the content of HCO3 is highest at the center of the oasis (Figures S1b and S2b). POF, the ion content of the river and the first half of the oasis increases more obviously, with SO42− and HCO3 accounting for 60.5% and 62.9% of the increase, respectively. Meanwhile, the ion content decreases in the second half of the oasis, due to the relatively low quantity of flood water reaching this area; the further downstream the oasis, the lower the water availability.
Na+, Ca2+, Mg2+, K+, and other cations showed an increasing trend POF (Figure 3a). Na+ was relatively evenly distributed PRF, and increased in 96.4% of the samples POF, with the majority of the increase seen in the first half of the river, little change in the second half and the inlet, and a significant increase evident in the center of the oasis. Ca2+ was higher in the river than in the oasis both PRF and POF and showed an increasing trend POF, increasing evenly in all regions. Mg2+ was evenly distributed PRF and generally showed an increasing trend POF, with an increase of 86.7%. The Mg2+ was enriched in the center of the oasis POF and evenly distributed in other regions, probably due to the low-lying center of the oasis. K+ had a lower content compared with other cations, and little variation was observed in real sample testing results. However, in the remote sensing inversion results, the magnitude change was more drastic, and the spatial distribution was more profound. The enrichment of K+ was more obvious in the center of the oasis due to the low terrain, while the latter part of the oasis was more enriched in groundwater K+ than the river due to the river break. This resulted in a trend of lower groundwater K+ content in the river and a higher content in the oasis. POF, the trend of increasing K+ was more obvious (increasing in 74.5% of the total samples), whereas there was a decreasing trend in the tail of the oasis, likely due to the reduced availability of river water. Cl was the only anion that displayed an increase POF (Figures S1a and S2a), increasing in 93.1% of samples, likely due to the evaporation of the groundwater in the desert and an increase in high saline water bodies. The TDS content was mainly enriched in the center of the oasis PRF, but this enrichment was further enhanced POF (Figures S1a and S2a), with significant enrichments also seen in other areas. An increase in TDS was seen in 81.9% of samples, and a decrease was seen only at the tail end of the oasis, probably because this area was out of reach of the water flow; thus, the groundwater was not replenished. The remote sensing inversion results are largely consistent with the sampling results, indicating that the remote sensing inversion method is relatively reliable.

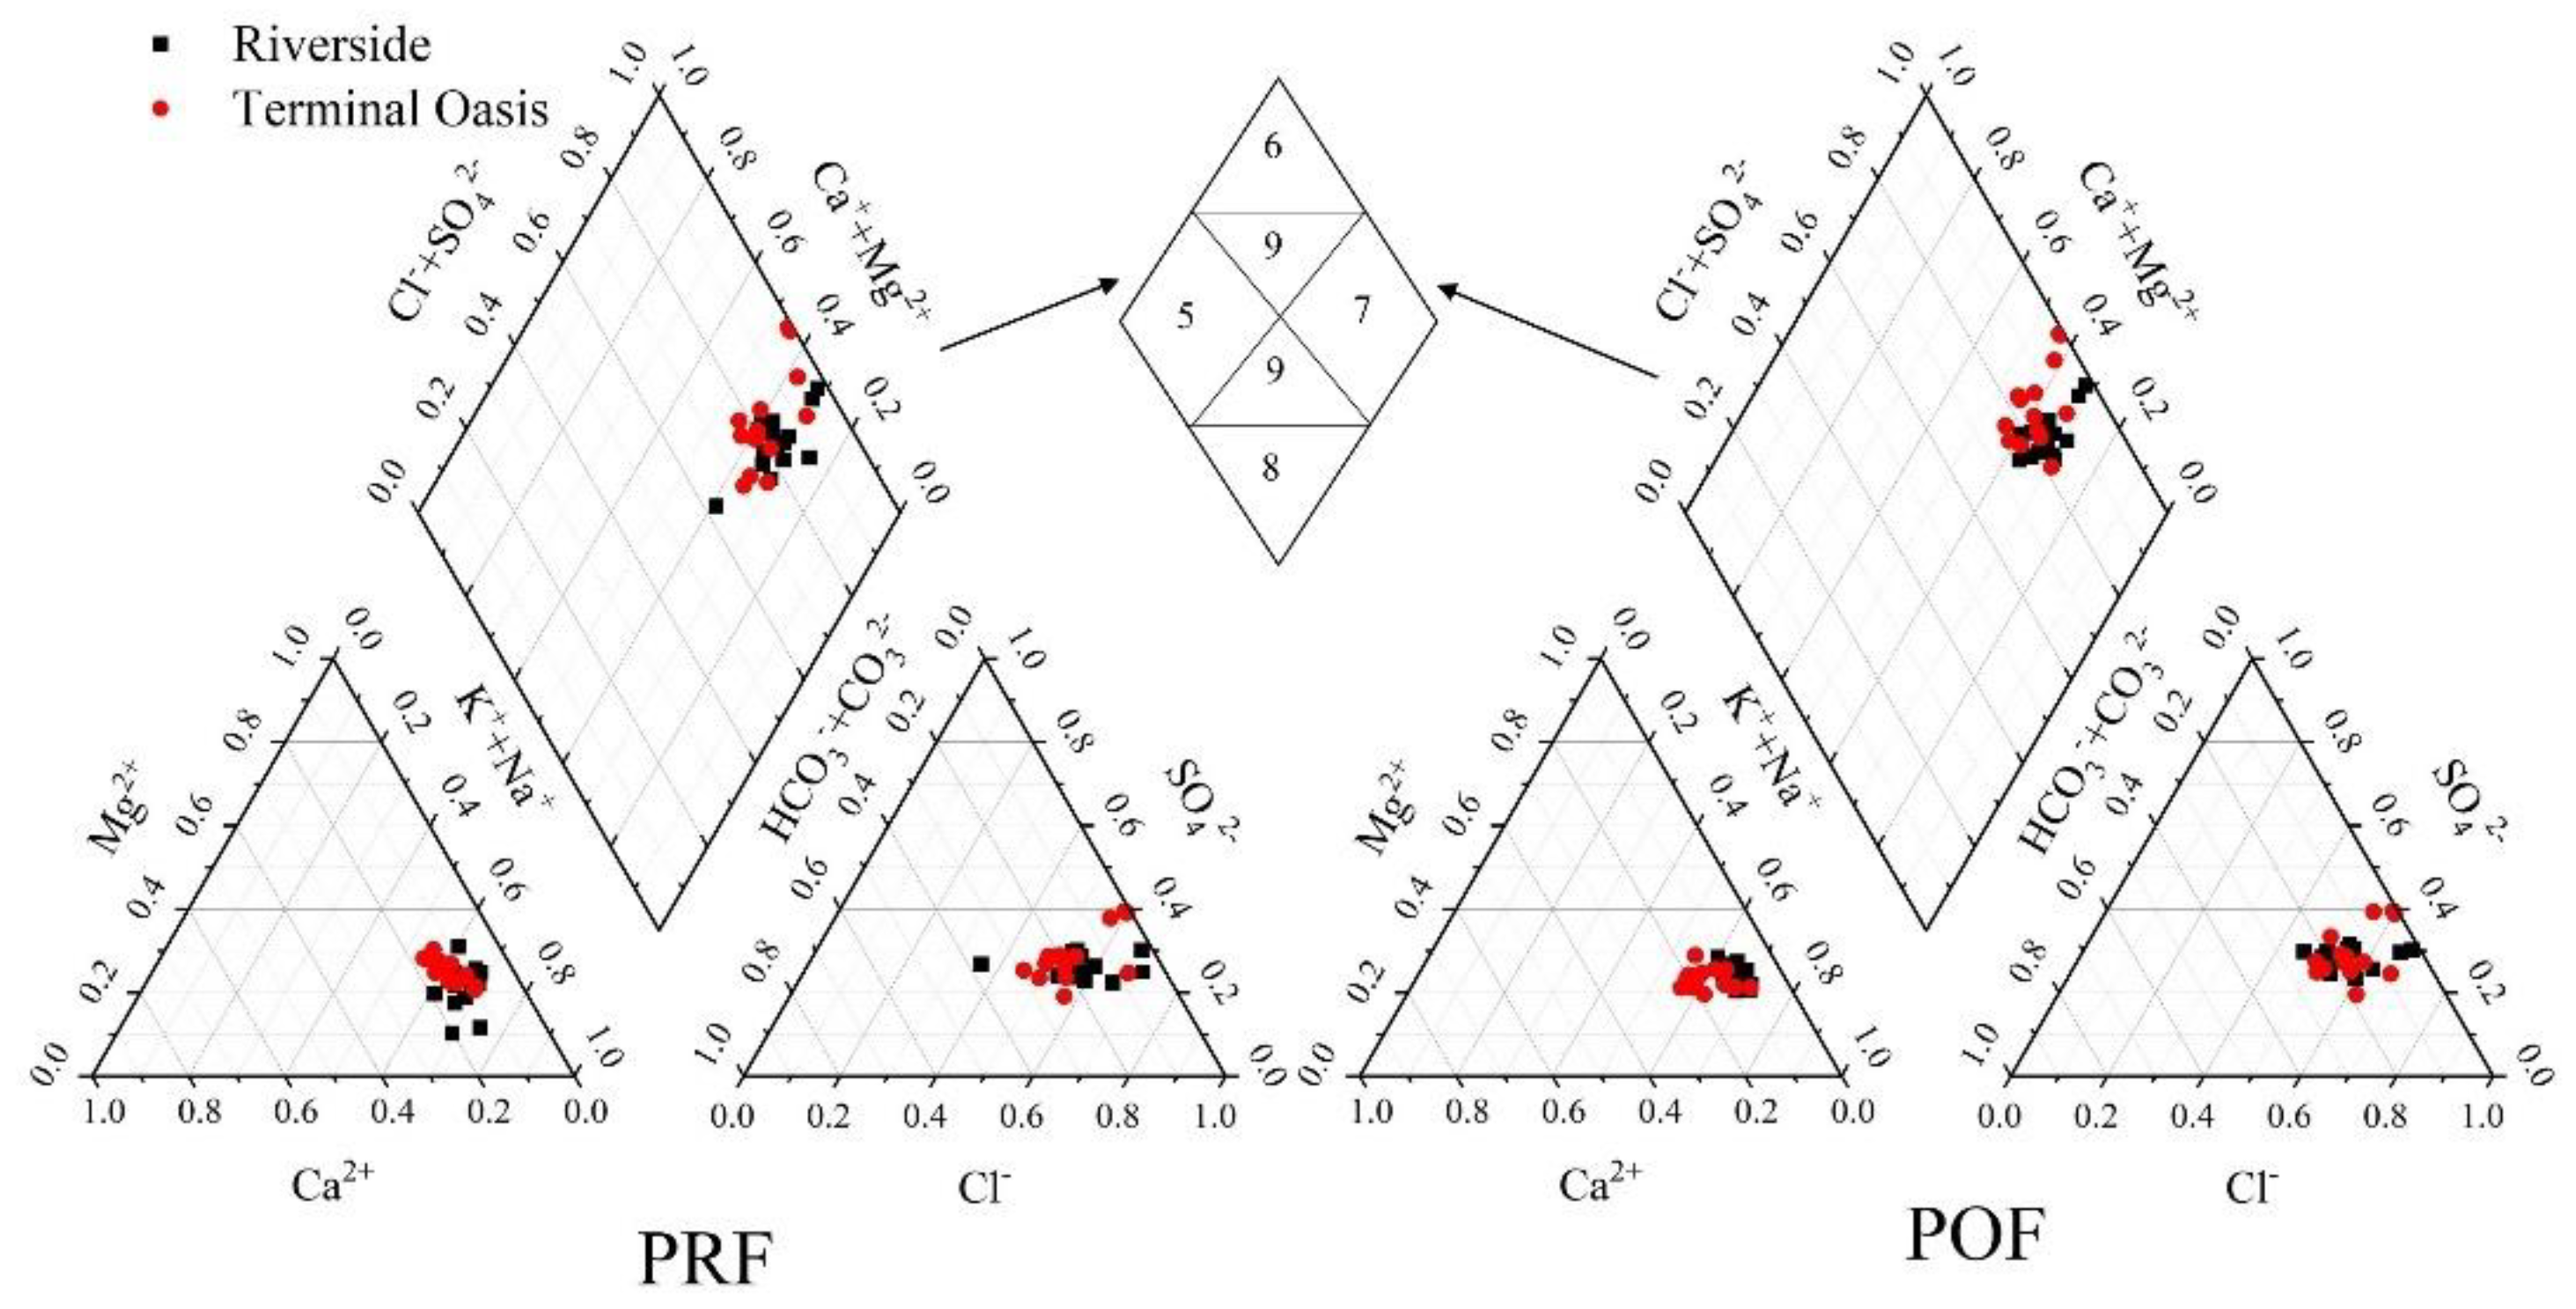
3.4. Water Chemistry Analysis

The Piper trilinear diagram is used to analyze the hydrochemical characteristics (the equivalent % of anions and cations per milliliter) of groundwater samples in the study area to determine the relative contribution of different types of rock to groundwater ion concentrations upon weathering [42]. When carbonate weathering is predominant, the anions and cations are mainly near the HCO3 and Ca2+ end of the scale, respectively, while when evaporite salt weathering is predominant, the anions and cations are mainly near the SO42−–Cl and K+–Na+ ends of the scale, respectively [43,44]. As shown in Figure 4, PRF and POF, cations are mainly concentrated at the K+–Na+ end and anions are mainly concentrated at the SO42−–Cl end of the scale. The distribution of anions and cations in the piper trilinear diagram is indicative of the groundwater ions in the study area mainly stemming from evaporite salt weathering.
The diamond-shaped regions of the Piper trilinear diagram are divided into nine zones. These zones are representative of the nine chemical types including Ca2+–HCO3, Ca2+–SO42−, Na+–Cl, Na+–HCO3, and mixed types (no particular anion/cation pair comprise over 50%: regions five, six, seven, eight, and nine in the diamond-shaped region) [45,46]. In the downstream area of the Kriya River, the groundwater samples were more concentrated in zone seven after flood onset, showing a Na+~Cl type, with the river groundwater concentrated in the upper part of zone six and the oasis more concentrated in the lower part of zone seven. The rectangular water chemistry type map is a further improvement on the Piper map, which more directly classifies the water chemistry and reveals the hydrogeochemical laws (Figure 4). The spatial evolution of the water chemistry types in different geomorphological units and different water sampling points can be shown on the map. From (Figure 5), it can be seen that PRF, the water chemistry types are mainly distributed in zone 6 and a few in zone 15, and POF, the groundwater water chemistry is more concentrated in zone six, indicating that the flood has an enrichment effect on groundwater water chemistry types. This is consistent with the results shown in the Piper diagram.

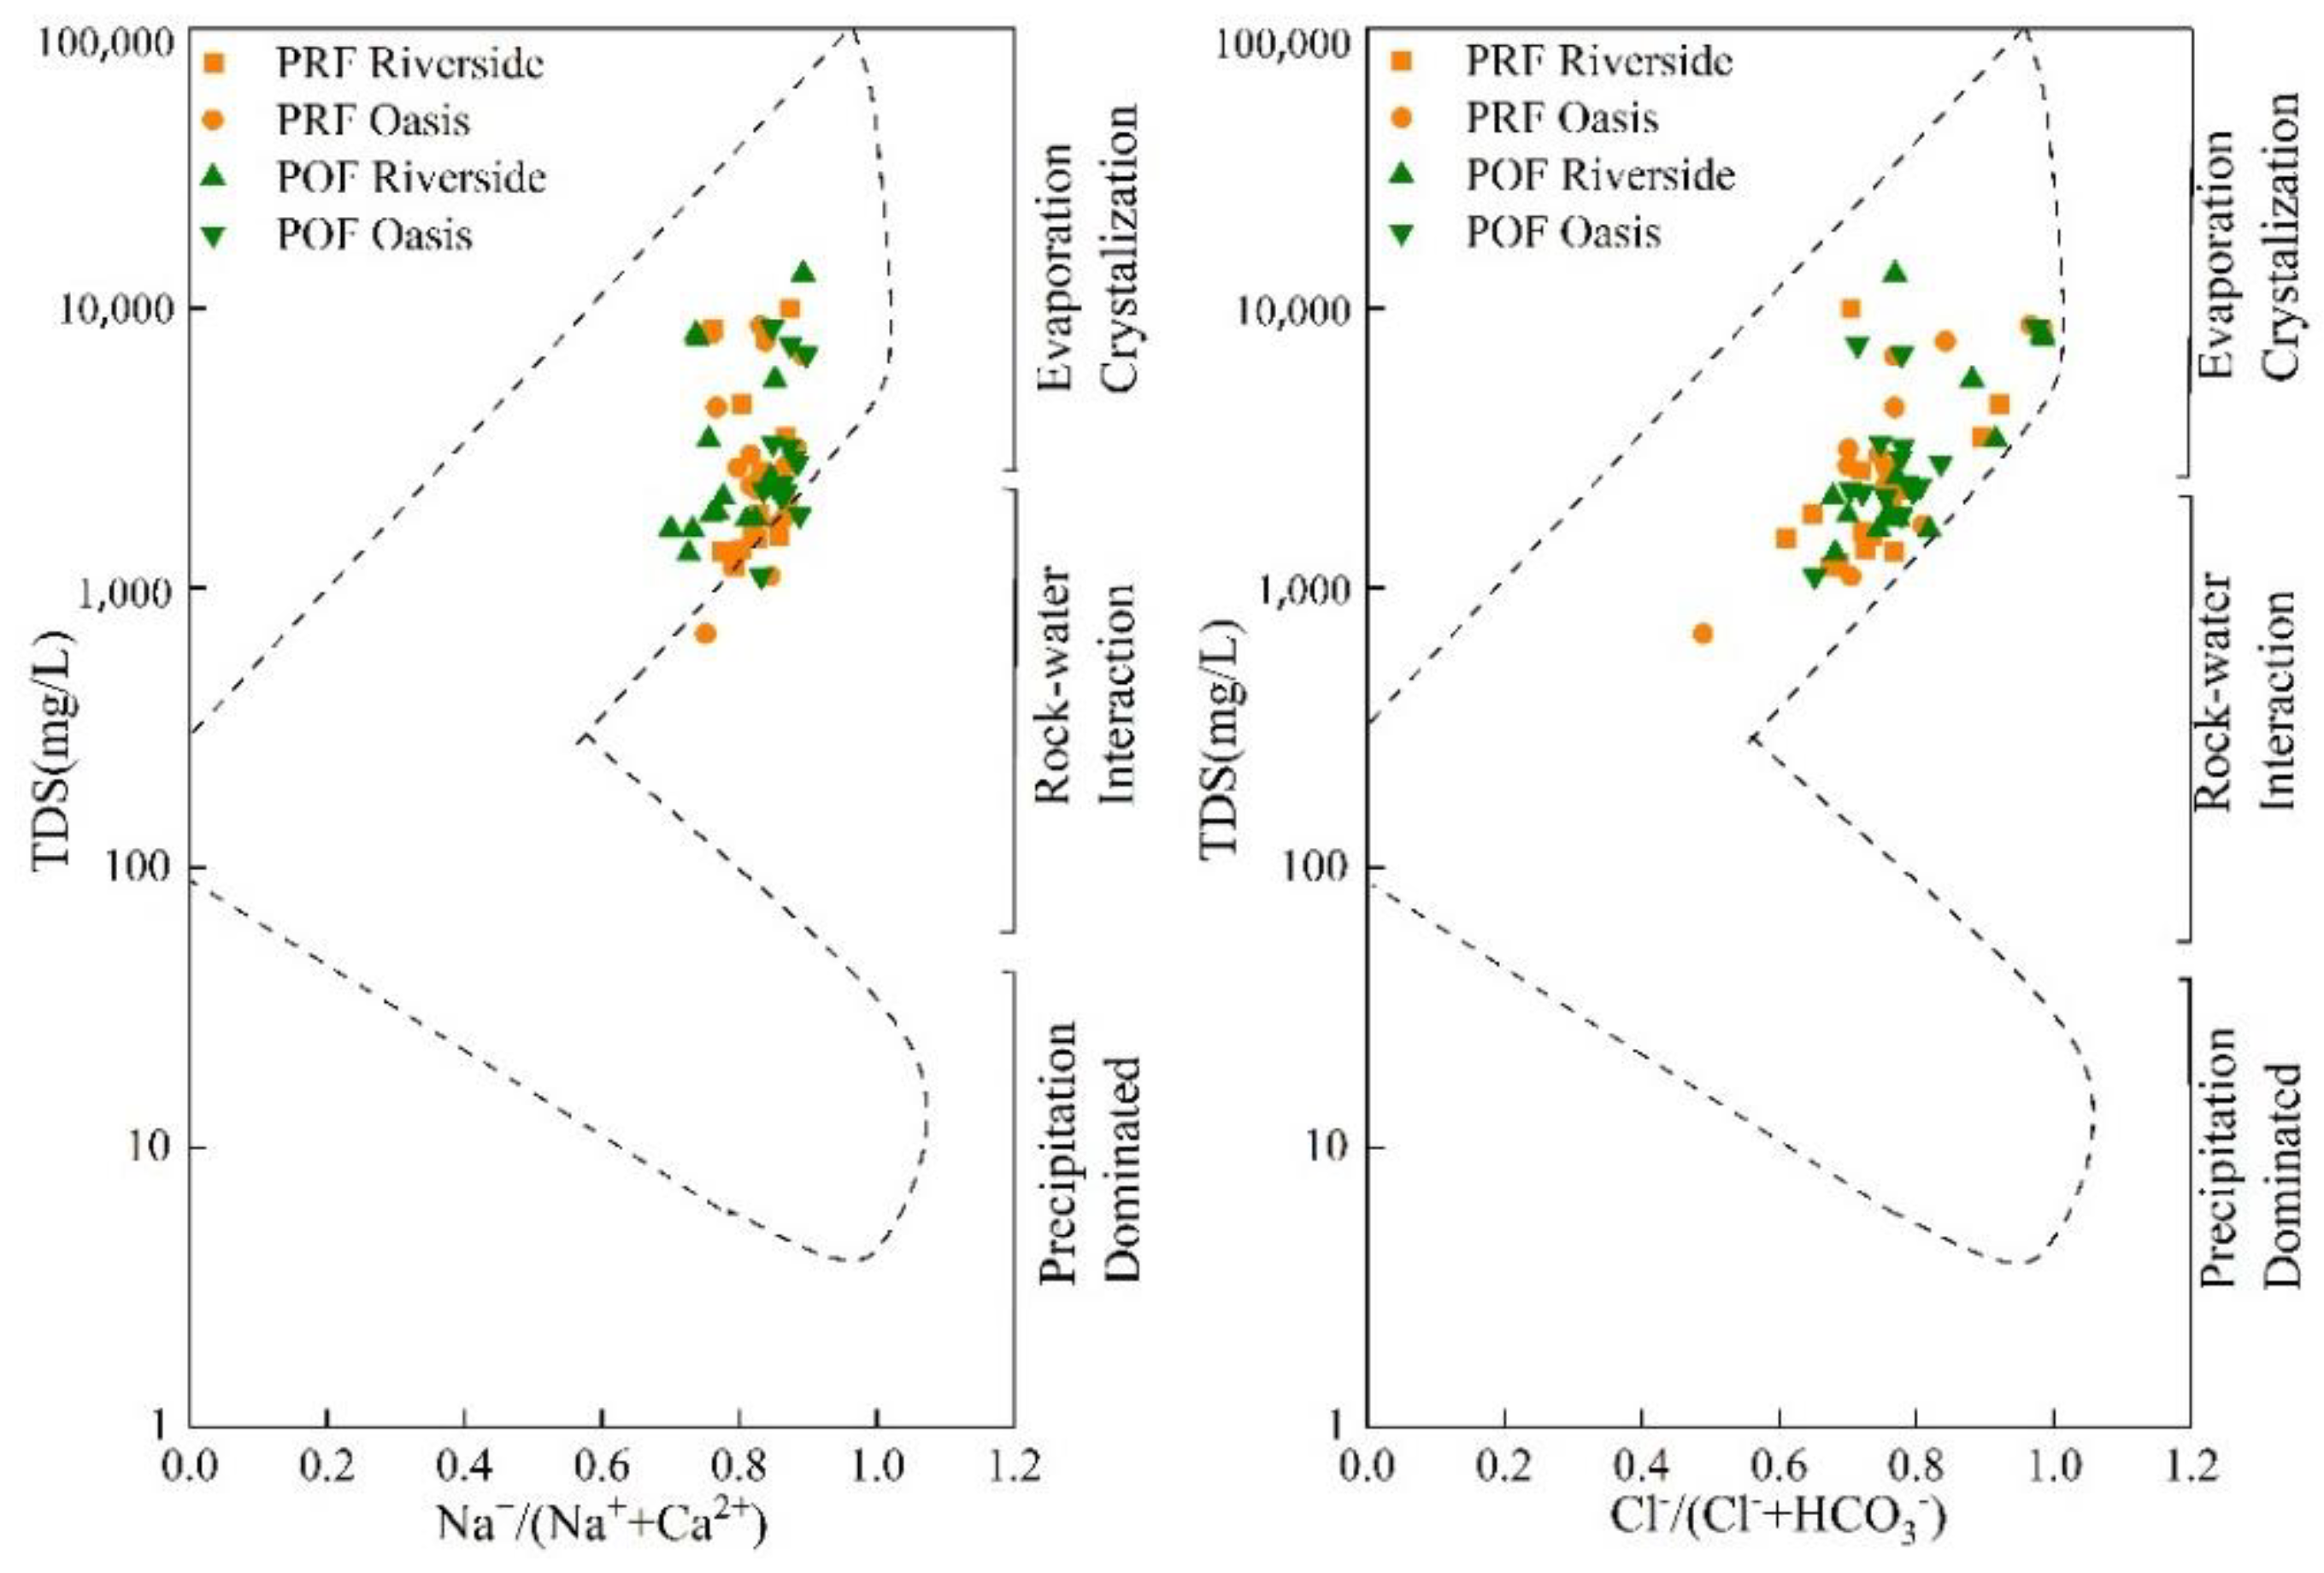
3.5. Gibbs-Based Groundwater Chemical Mechanism Analysis

The Gibbs plot is based on the correlation between Na+/(Na+ + Ca2+), Cl/(Cl + HCO3), and TDS in rivers, lakes, and oceans, and is used to determine the mechanism of the genesis of groundwater in the study area [47]. In the Gibbs plot, low, medium, and high mineralization represent the combined contribution of atmospheric precipitation, rock weathering, and evaporative crystallization on groundwater, respectively [48]. As can be seen from the Gibbs plot (Figure 6), the chemical composition of groundwater in the study area before and after the winter flood is mostly distributed in the upper right corner of the model, and the ratio of Na+/(Na+ + Ca2+), Cl/(Cl + HCO3) is close to one, which indicates that the chemical composition of groundwater is mainly influenced by evaporative crystallization [49]. The observation-based well data of each region are distributed in a more concentrated manner in the plot with no obvious differences. The coccyx A part of the groundwater of the coccyx oasis falls in the middle (rock weathering zone) [50], indicating that rock weathering also has an effect on the groundwater component of the coccyx oasis, though the effect is small. In addition, a small part of the groundwater along the river and coccyx oasis is outside the model, indicating that the groundwater component of the study area is also influenced by anthropogenic factors [47,51].

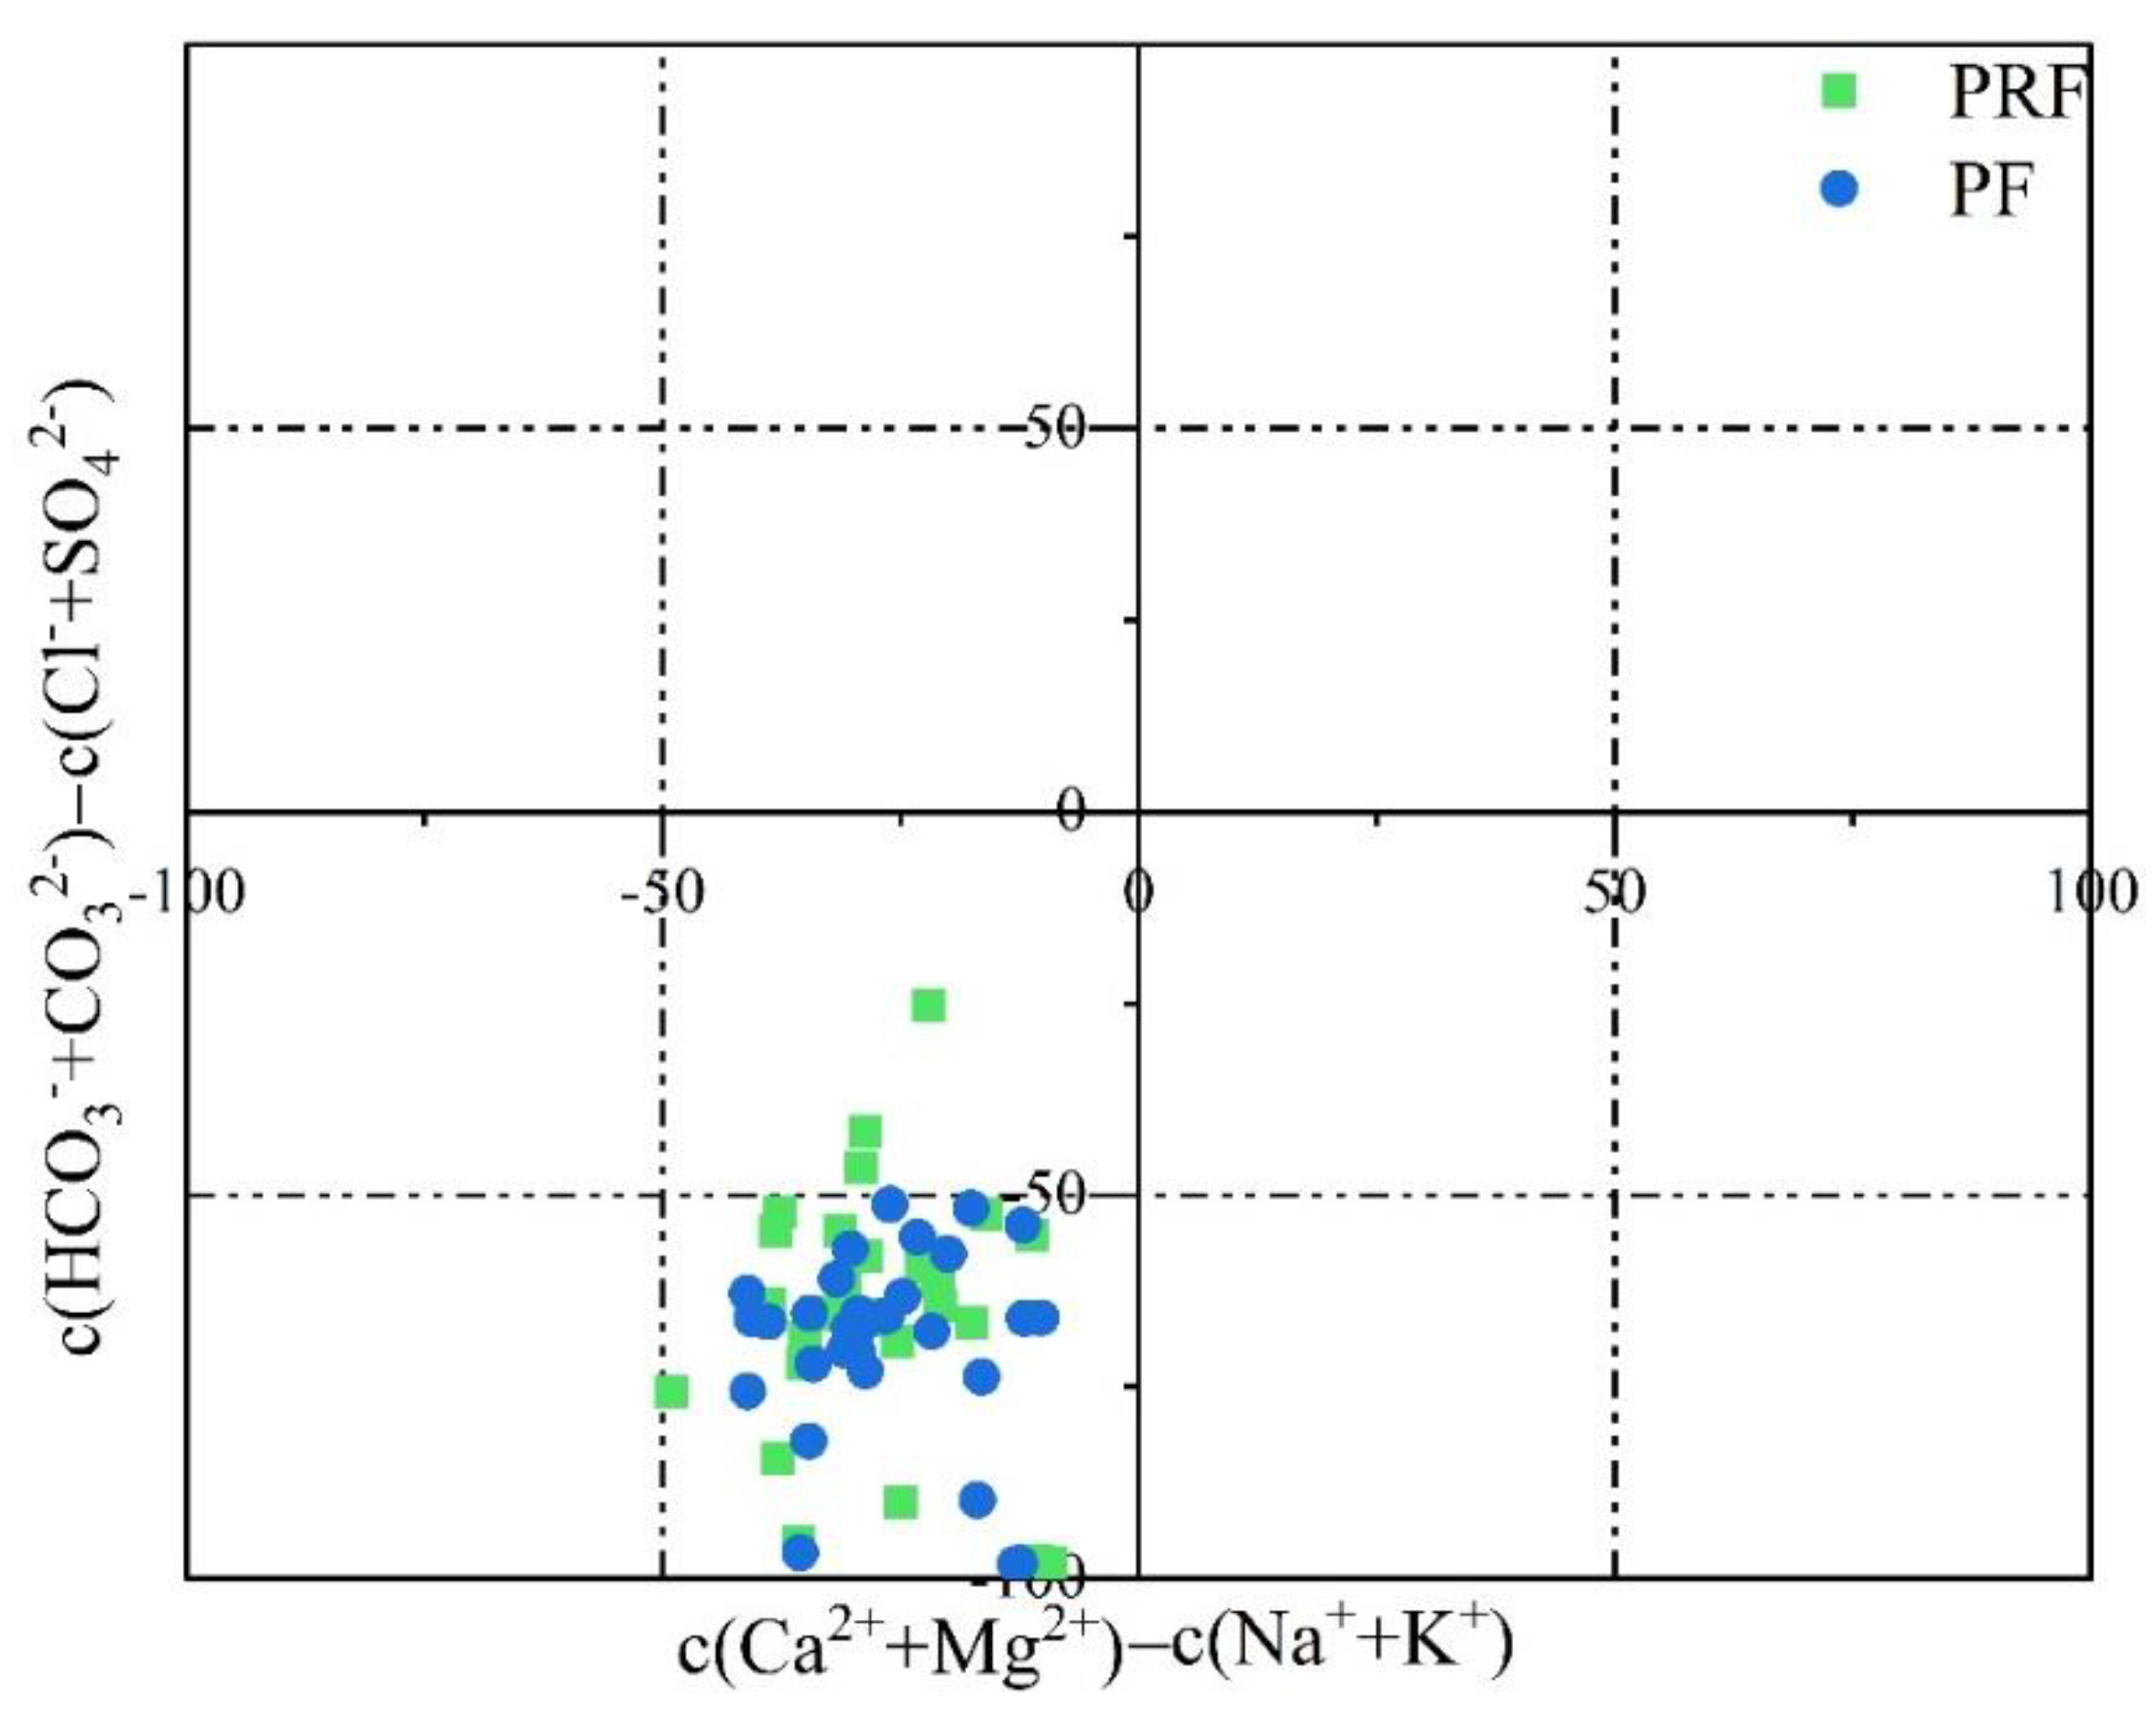
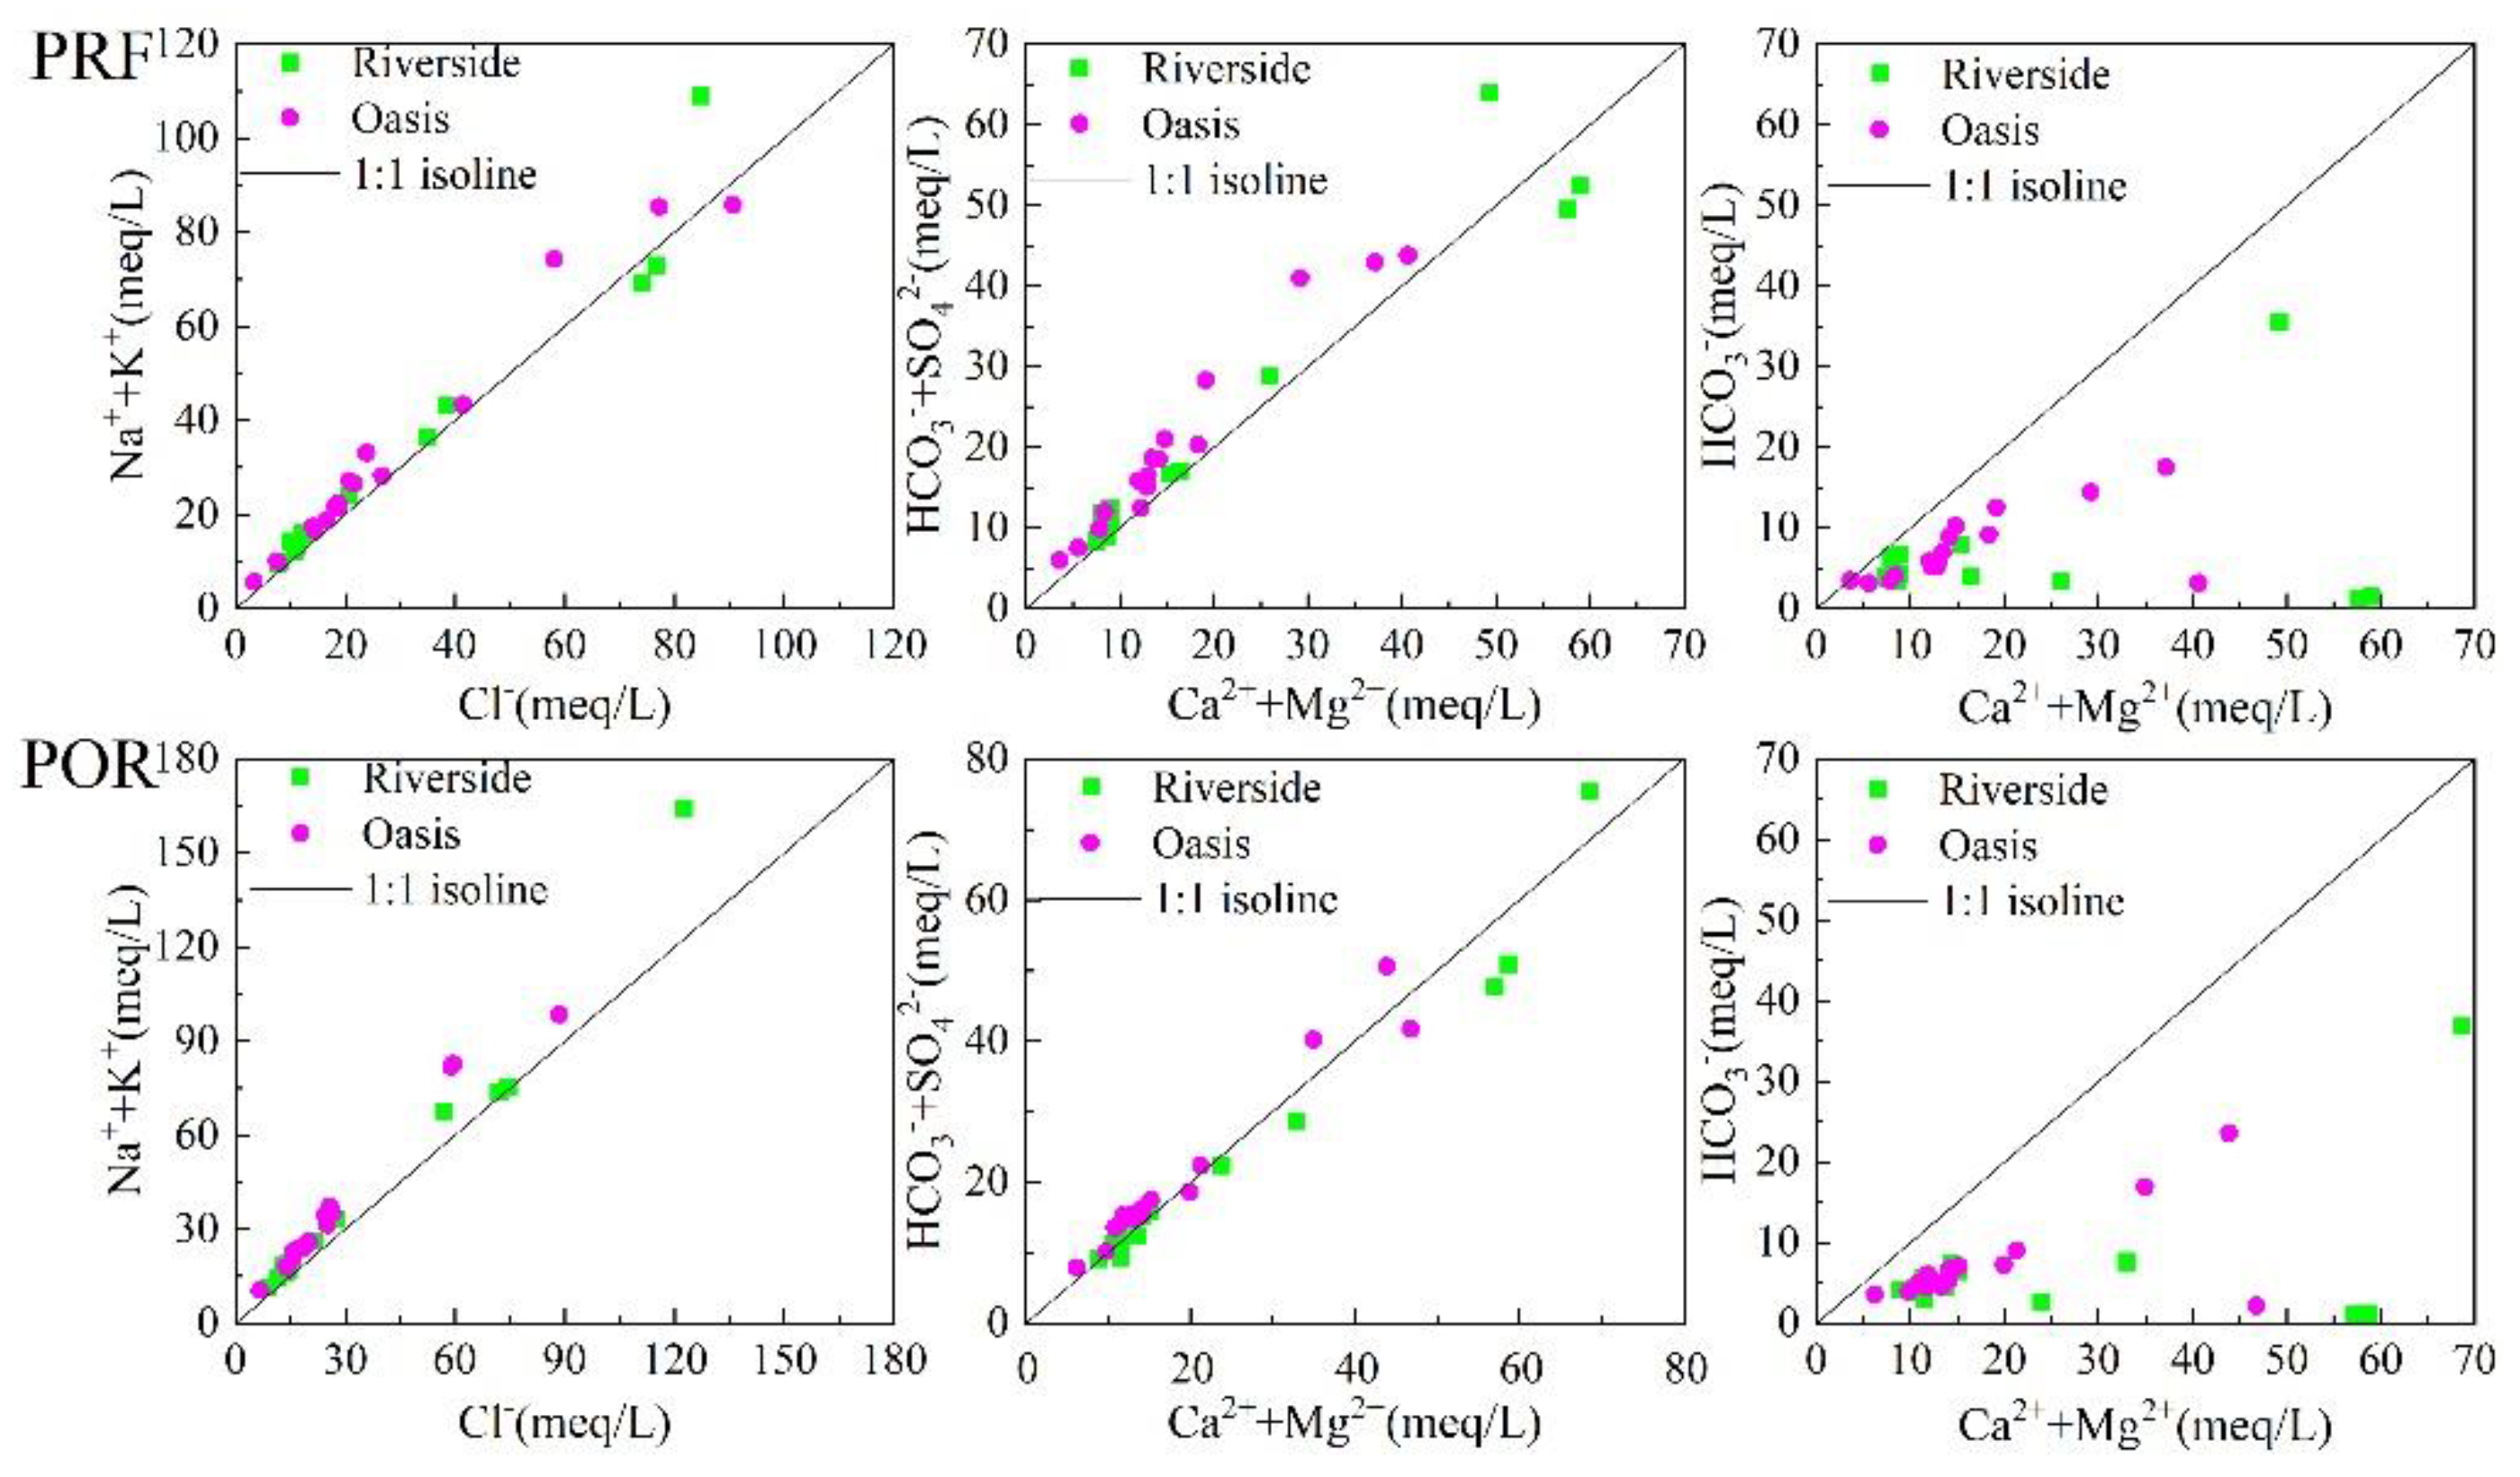
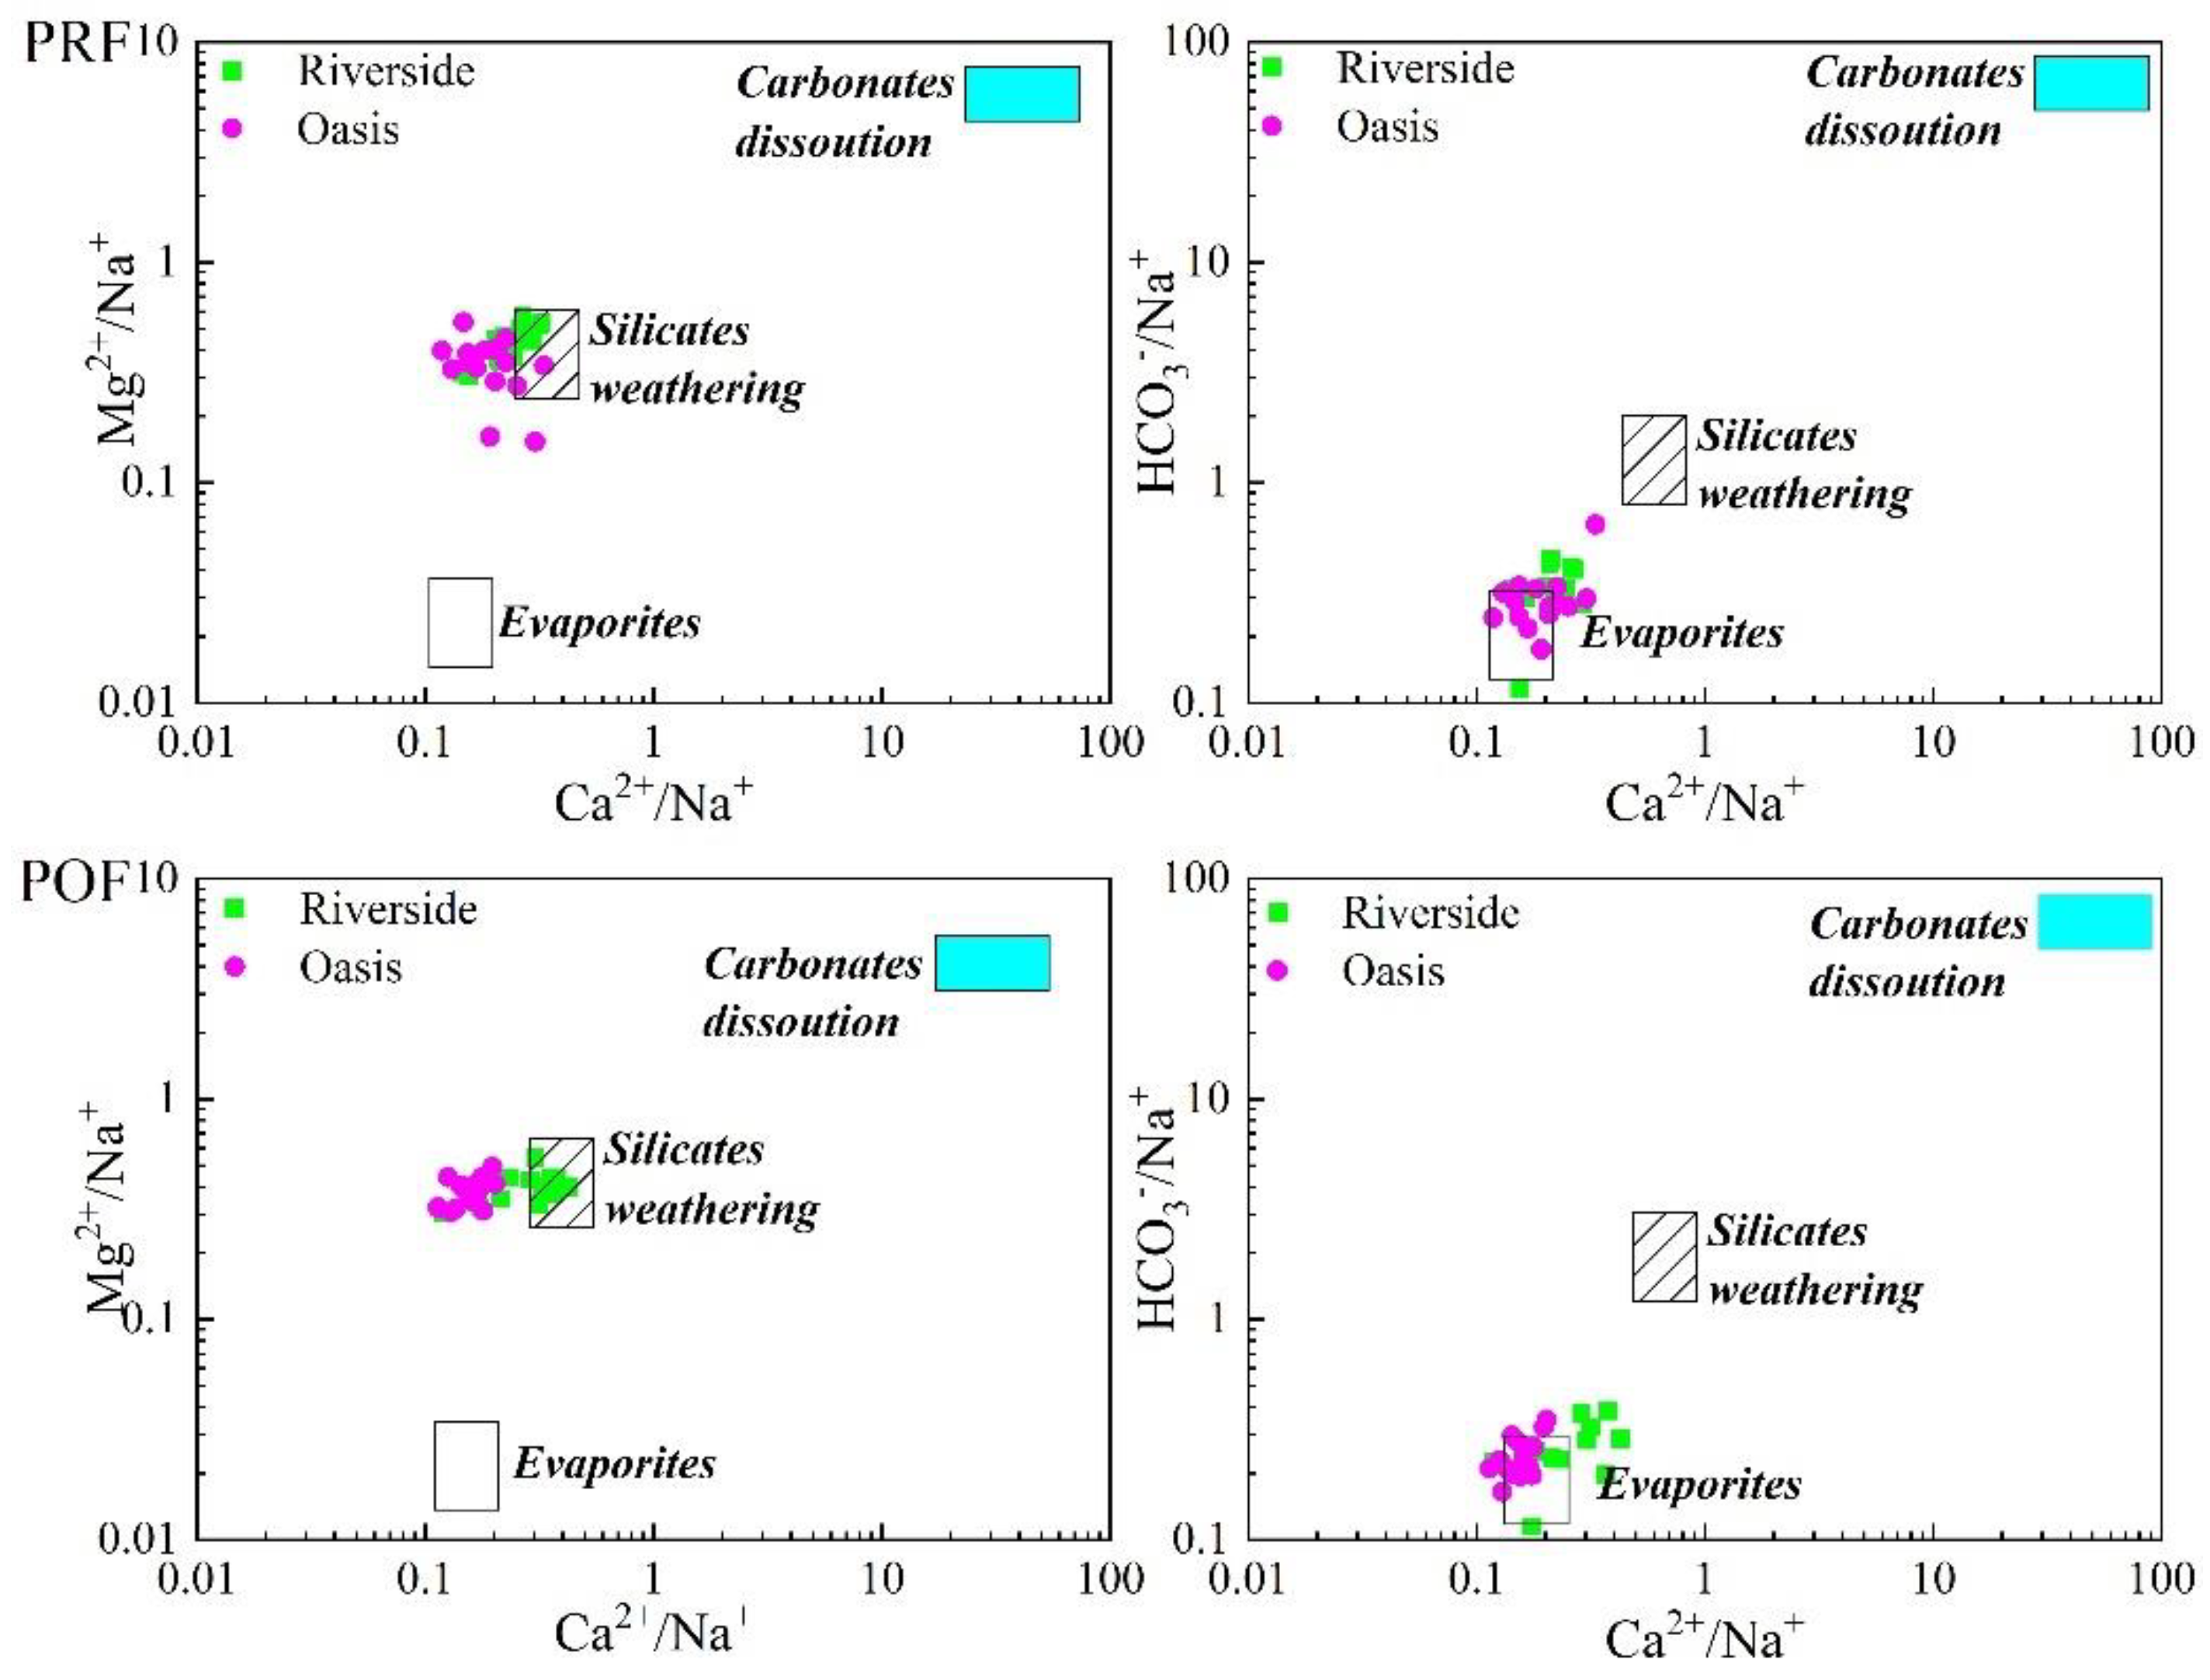
3.6. Groundwater Chemical Mechanism Analysis Based on Ionic Proportionality Factor

The ratio of Na+ + K+ to Cl is equal to one, indicating that the chemical composition of the water body is mainly derived from evaporite dissolution [52]. Figure 7 shows that both PRF and PF, some samples are located on the 1:1 contour, indicating that their chemical composition is related to evaporation. The groundwater samples are particularly close to the 1:1 contour, indicating that evaporite dissolution has a more significant effect on their chemical composition. The majority of the samples, however, are on the upper left of the contour, indicating that Na+ and K+ are in surplus compared to Cl. The Na++K+ combination is usually considered to originate from evaporites or the weathering of silicate rocks [53]. There are many types of silicate rocks in desert areas, and one of the more typical silicate rock weathering processes is the hydrolysis of sodium and potassium feldspar to produce Na+ and K+ [54].
In terms of the ratio of HCO3+SO42− to Ca2++ Mg2+, if a sample lies on the 1:1 isoline, it indicates that Ca2+ and Mg2+ originate from the combined effect of silicate rock, evaporite weathering dissolution, and carbonate rock dissolution [55]. Samples located in the lower right of the contour likely contain Ca2+ and Mg2+, originating from the dissolution of carbonate rocks [56], whereas samples located in the upper left of the contour are more likely to contain Ca2+ and Mg2+, originating from silicate weathering [56]. The groundwater samples PRF were predominantly in the upper left of the contour without excessive deviation, indicating that Ca2+ and Mg2+ originated from the dissolution of silicate rocks and evaporates. However, POF, some samples deviated to the lower right of the 1:1 isoline, indicating that the flood partially dissolved the carbonate rocks. The distribution of the groundwater sample points indicates that the dissolution of silicate rock and evaporite is the dominant contributor to the ions in water, and that the dissolution of carbonate rock is not significant. This conclusion can be further verified by the plot of HCO3 versus Ca2+ and Mg2+.
Mg2+/Na+, Ca2+/Na+, and HCO3/Na+ water ratios are often used to study the interaction between water bodies and various rock bodies [57]. The groundwater points in the study area are mainly distributed between silicate rocks and evaporite control end members (Figure 8) and are closer to silicate rock control end members. This indicates that groundwater chemical components are mainly controlled by the weathering of both silicate rocks and evaporite rocks, but that silicate rocks have the largest contribution to the water chemistry. This is consistent with the ion ratio results.

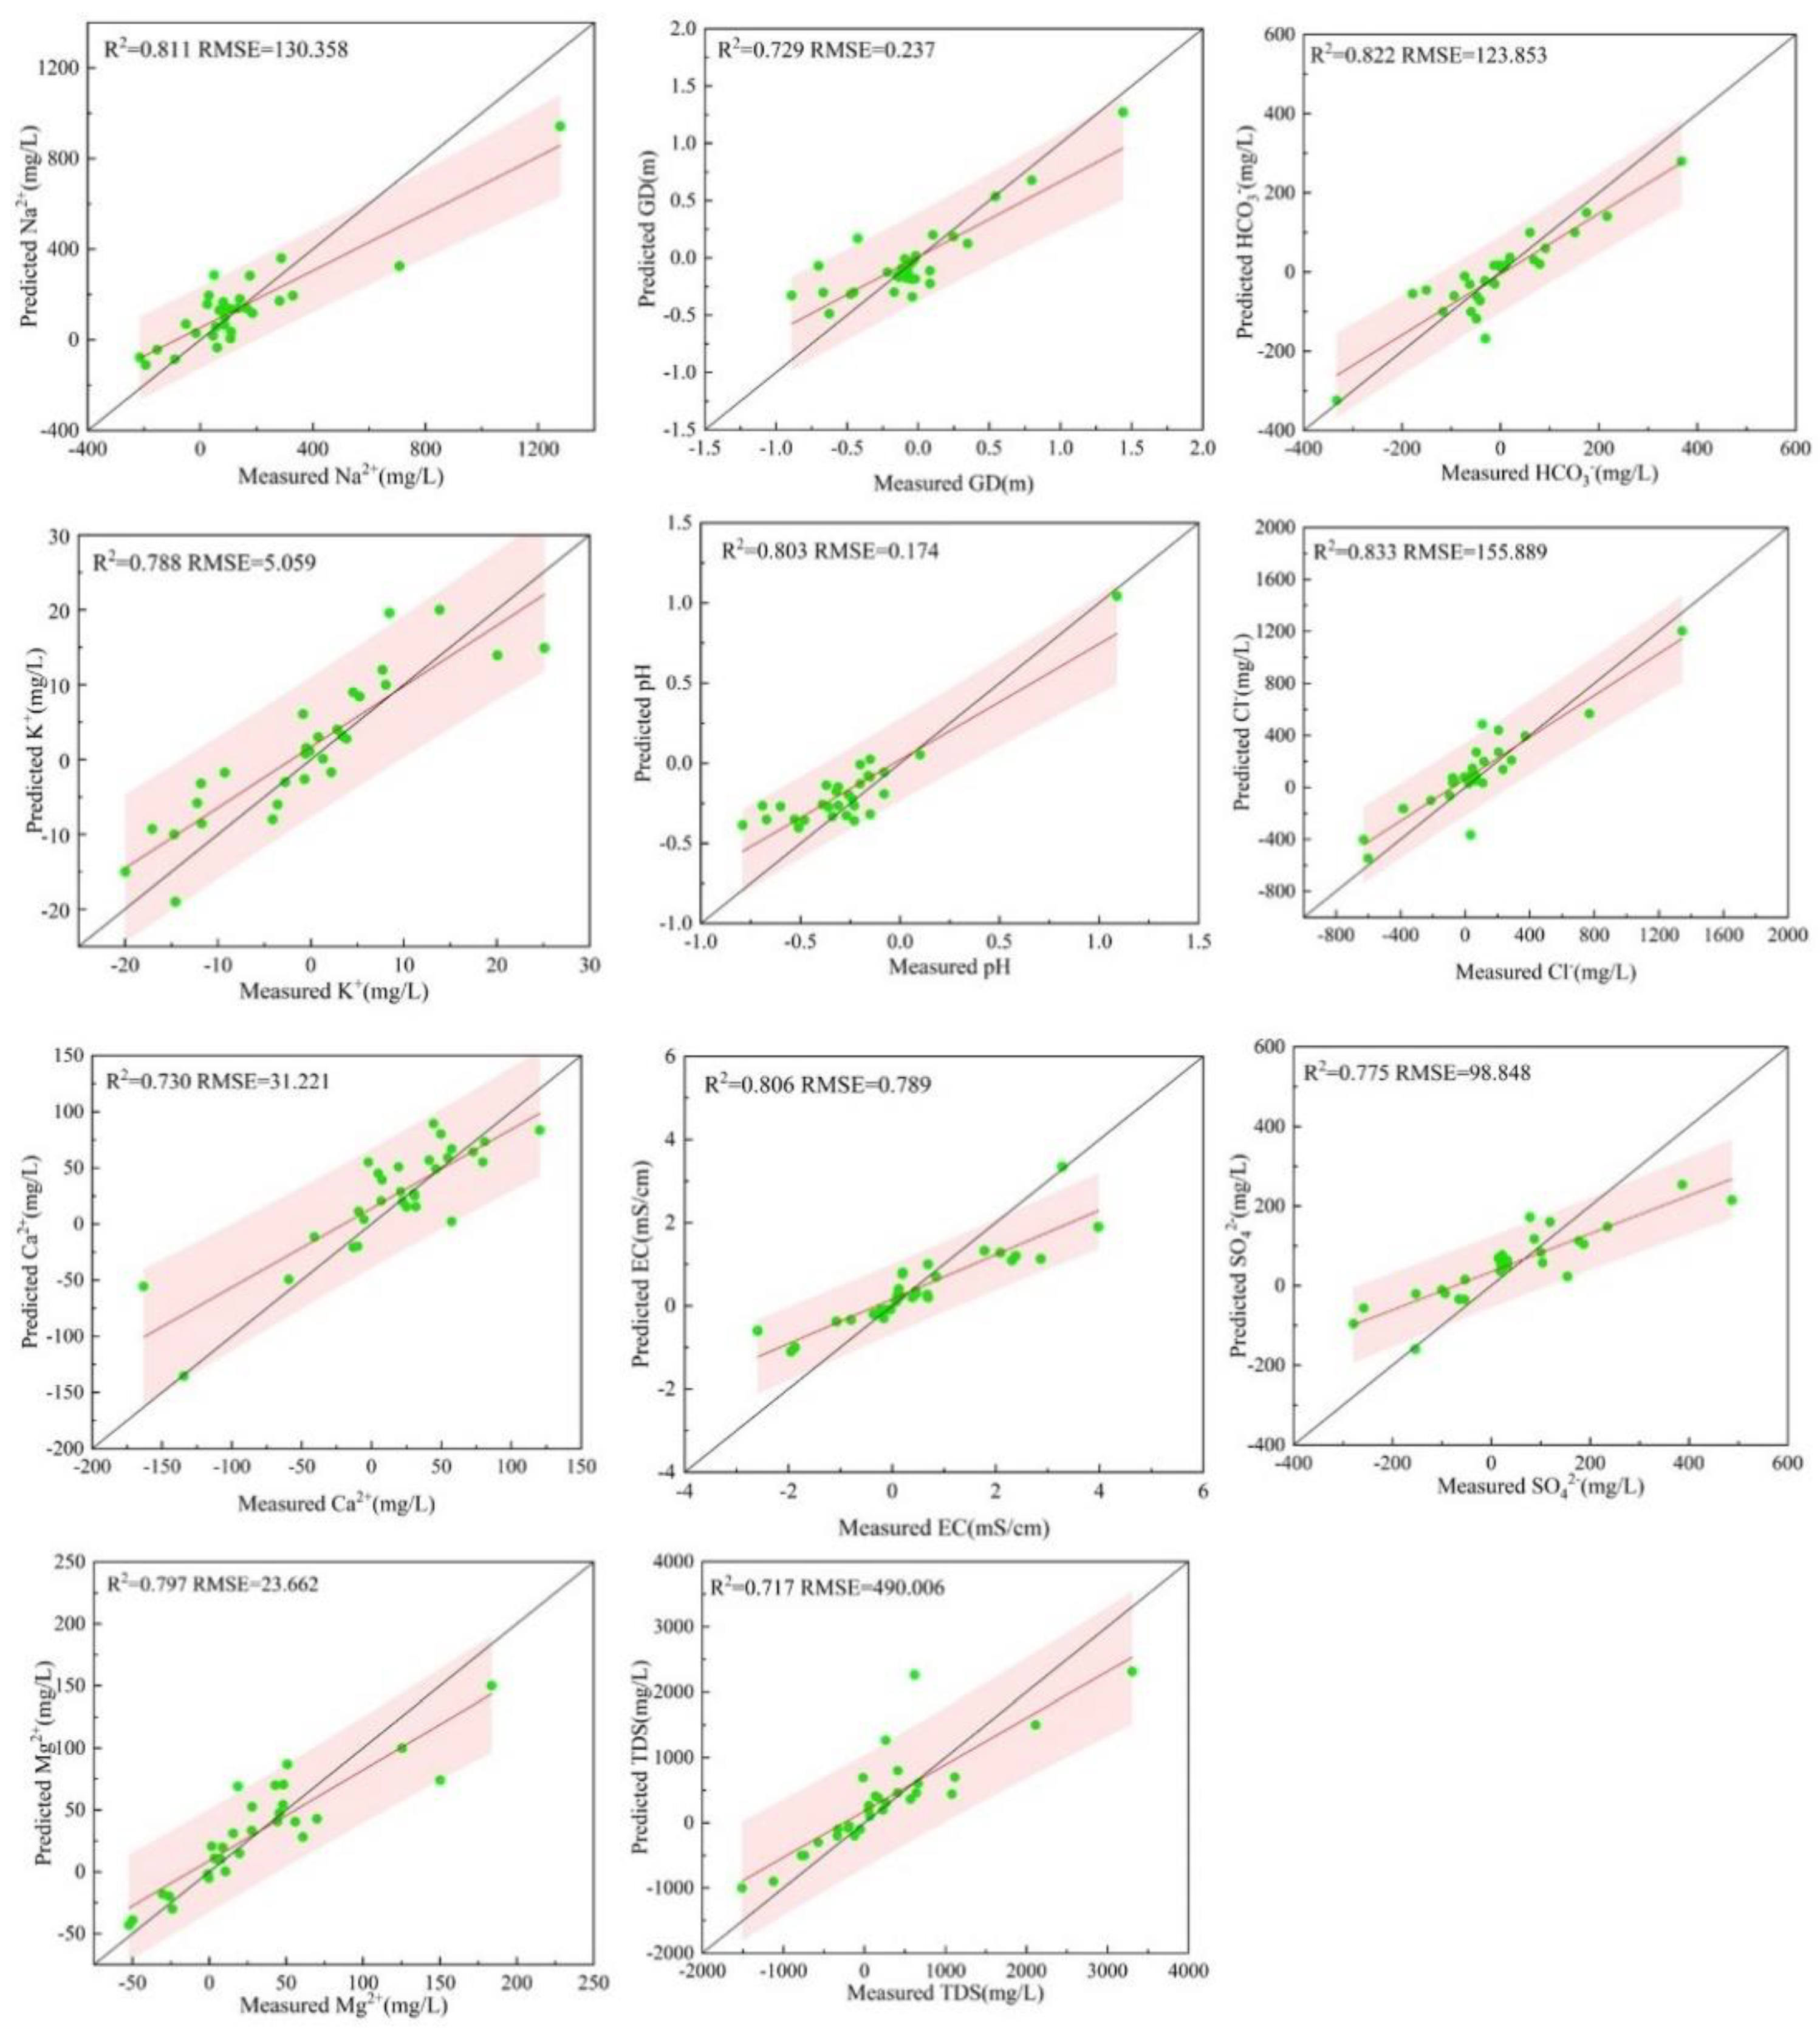
3.7. Remote Sensing Verification Analysis

The RF prediction model was constructed using environmental covariates and remotely inverted for each groundwater parameter before and after the flood prior to cross-validation. The scatter plots of the validation accuracy (Figure 9, Figures S3 and S4) show that the slope of the regression line obtained was generally less than one. Many studies have found that RF models tend to overestimate parameters at low concentrations and underestimate parameters at high concentrations [58]. The lower RMSE and higher R2 indicate that the inversion accuracy of the groundwater parameters is generally higher and the inversion results are better [59].

4. Conclusions

In this study, we used mathematical and statistical methods to demonstrate that floods have a small effect on groundwater chemical types (mainly Na+~Cl) in the study area. The coefficient of variation shows that river groundwater ions are more sensitive to floods than those of the oases. The Piper trilinear plot and ion ratios suggest that the sources of the groundwater ions in the study area are mainly evaporite and silicate rock weathering. The ion differences before and after the flood generally indicate that the flood has an enrichment effect on groundwater ions. The correlation between the groundwater pH and HCO3 with other ions in the study area is not strong, while the correlation between other ions is strong, and the flood affects the correlation between pH and HCO3. The Gibbs plot shows that groundwater ions in the study area are mainly controlled by evaporite crystallization. The remote sensing inversion of groundwater parameters using environmental variables was proven to be effective, and the production of distribution maps of each parameter enabled the effective prediction of the model. The results show that the environmental variables have a good relationship with the groundwater parameters, providing a reliable method for estimating groundwater ions and other parameters in other regions using environmental covariates.

Supplementary Materials

The following supporting information can be downloaded at: https://www.mdpi.com/article/10.3390/w14111724/s1, Figure S1a: During the PRF Ca2+, K+, Na+, Mg2+, Cl, TDS inversion results; Figure S1b: During the PRF, SO42−, HCO3, pH, GD, EC inversion results; Figure S2a: During the POF, Ca2+, K+, Na+, Mg2+, Cl, TDS inversion results; Figure S2b: During the POF, SO42−, HCO3, pH, GD, EC inversion results; Figure S3: Scatter plot for accuracy verification of pre-flood groundwater parameter inversion results (The bright pink area in the figure covers the true fit line with 95% probability); Figure S4: Scatter plot for accuracy verification of post-flood groundwater parameter inversion results (The bright pink area in the figure covers the true fit line with 95% probability).

Author Contributions

Conceptualization, L.P.; formal analysis, L.P.; funding acquisition, Q.-D.S.; investigation, L.P., Y.-B.W. and H.-B.S.; methodology, L.P.; project administration, Q.-D.S.; software, Y.-j.K. and A.A.; supervision, Q.-D.S.; validation, L.P., H.-B.S., A.A. and Y.-j.K.; visualization, L.P.; writing—original draft, L.P.; writing—review and editing. All authors have read and agreed to the published version of the manuscript.

Funding

This research was funded by the National Natural Science Foundation of China, grant number U1703237.

Data Availability Statement

Not applicable.

Acknowledgments

The authors thank Zipeng Zhang of the School of Geography, Xinjiang University, for technical support.

Conflicts of Interest

The authors declare no conflict of interest.

References

  1. Bauer-Gottwein, P.; Gondwe, B.R.N.; Charvet, G.; Marín, L.E.; Rebolledo-Vieyra, M.; Merediz-Alonso, G. Review: The Yucatán Peninsula karst aquifer, Mexico. Hydrogeol. J. 2011, 19, 507–524. [Google Scholar] [CrossRef]
  2. Wortmann, M.; Bolch, T.; Menz, C.; Tong, J.; Krysanova, V. Comparison and Correction of High-Mountain Precipitation Data Based on Glacio-Hydrological Modeling in the Tarim River Headwaters (High Asia). J. Hydrometeorol. 2018, 19, 777–801. [Google Scholar] [CrossRef]
  3. Chen, B.; Yang, X.; Jiang, Q.; Liang, P.; Lattin Mackenzie, L.; Zhou, Y. Geochemistry of aeolian sand in the Taklamakan Desert and Horqin Sandy Land, northern China: Implications for weathering, recycling, and provenance. Catena 2022, 208, 105769. [Google Scholar] [CrossRef]
  4. Li, H.; Shi, Q.; Wan, Y.; Shi, H.; Imin, B. Using Sentinel-2 Images to Map the Populus euphratica Distribution Based on the Spectral Difference Acquired at the Key Phenological Stage. Forests 2021, 12, 147. [Google Scholar] [CrossRef]
  5. Allison, G.B.; Gee, G.W.; Tyler, S.W. Vadose-Zone Techniques for Estimating Groundwater Recharge in Arid and Semiarid Regions. Soil Sci. Soc. Am. J. 1994, 58, 6. [Google Scholar] [CrossRef]
  6. Gee, G.W.; Hillel, D. Groundwater recharge in arid regions: Review and critique of estimation methods. Hydrol. Process. 1988, 2, 255–266. [Google Scholar] [CrossRef]
  7. Cook, B.I.; Mankin, J.S.; Anchukaitis, K.J. Climate Change and Drought: From Past to Future. Curr. Clim. Chang. Rep. 2018, 4, 164–179. [Google Scholar] [CrossRef]
  8. Lashford, C.; Rubinato, M.; Cai, Y.; Hou, J.; Abolfathi, S.; Coupe, S.; Charlesworth, S.; Tait, S. SuDS & Sponge Cities: A Comparative Analysis of the Implementation of Pluvial Flood Management in the UK and China. Sustainability 2019, 11, 213. [Google Scholar] [CrossRef] [Green Version]
  9. Salauddin, M.; O’Sullivan, J.J.; Abolfathi, S.; Pearson, J.M. Eco-Engineering of Seawalls—An Opportunity for Enhanced Climate Resilience from Increased Topographic Complexity. Front. Mar. Sci. 2021, 8, 628. [Google Scholar] [CrossRef]
  10. Marques, A.; Martins, I.S.; Kastner, T.; Plutzar, C.; Theurl, M.C.; Eisenmenger, N.; Huijbregts, M.A.; Wood, R.; Stadler, K.; Bruckner, M. Increasing impacts of land use on biodiversity and carbon sequestration driven by population and economic growth. Nat. Ecol. Evol. 2019, 3, 628–637. [Google Scholar] [CrossRef]
  11. Tang, C.; Yi, Y.; Yang, Z.; Zhang, S.; Liu, H. Effects of ecological flow release patterns on water quality and ecological restoration of a large shallow lake. J. Clean. Prod. 2018, 174, 577–590. [Google Scholar] [CrossRef]
  12. Lewandowski, J.; Meinikmann, K.; Nützmann, G.; Rosenberry, D.O. Groundwater–the disregarded component in lake water and nutrient budgets. Part 2: Effects of groundwater on nutrients. Hydrol. Process. 2015, 29, 2922–2955. [Google Scholar] [CrossRef]
  13. Bayanzul, B.; Nakamura, K.; Machida, I.; Watanabe, N.; Komai, T. Construction of a conceptual model for confined groundwater flow in the Gunii Khooloi Basin, Southern Gobi Region, Mongolia. Hydrogeol. J. 2019, 27, 1581–1596. [Google Scholar] [CrossRef]
  14. Xiao, Y.; Shao, J.; Cui, Y.; Zhang, G.; Zhang, Q. Groundwater circulation and hydrogeochemical evolution in Nomhon of Qaidam Basin, northwest China. J. Earth Syst. Sci. 2017, 126, 26. [Google Scholar] [CrossRef]
  15. Masoud, A.A.; El-Horiny, M.M.; Atwia, M.G.; Gemail, K.S.; Koike, K. Assessment of groundwater and soil quality degradation using multivariate and geostatistical analyses, Dakhla Oasis, Egypt. J. Afr. Earth Sci. 2018, 142, 64–81. [Google Scholar] [CrossRef]
  16. Cook, S.; Price, O.; King, A.; Finnegan, C.; van Egmond, R.; Schafer, H.; Pearson, J.M.; Abolfathi, S.; Bending, G.D. Bedform characteristics and biofilm community development interact to modify hyporheic exchange. Sci. Total Environ. 2020, 749, 141397. [Google Scholar] [CrossRef]
  17. Shao, T.; Zhao, J.; Zhou, Q.; Dong, Z.; Ma, Y. Recharge sources and chemical composition types of groundwater and lake in the Badain Jaran Desert, northwestern China. J. Geogr. Sci. 2012, 22, 479–496. [Google Scholar] [CrossRef]
  18. Xu, J.; Ling, H.; Zhang, G.; Yan, J.; Deng, M.; Wang, G.; Xu, S. Variations in the dissolved carbon concentrations of the shallow groundwater in a desert inland river basin. J. Hydrol. 2021, 602, 126774. [Google Scholar] [CrossRef]
  19. Enemark, T.; Peeters, L.; Mallants, D.; Flinchum, B.; Batelaan, O. A systematic approach to hydrogeological conceptual model testing, combining remote sensing and geophysical data. Water Resour. Res. 2020, 56, e2020WR027578. [Google Scholar] [CrossRef]
  20. Jia, B.; Si, J.; Xi, H.; Qin, J. A Characterization of the Hydrochemistry and Main Controlling Factors of Lakes in the Badain Jaran Desert, China. Water 2021, 13, 2931. [Google Scholar] [CrossRef]
  21. Rahman, A.; Tiwari, K.; Mondal, N. Assessment of hydrochemical backgrounds and threshold values of groundwater in a part of desert area, Rajasthan, India. Environ. Pollut. 2020, 266, 115150. [Google Scholar] [CrossRef] [PubMed]
  22. Su, C.; Wang, Y.; Ge, S.; Li, Z.; Li, J. Origin of the Crescent Moon Spring in the Gobi Desert of northwestern China, based on understanding groundwater recharge. J. Hydrol. 2020, 580, 124344. [Google Scholar] [CrossRef]
  23. Noori, R.; Ghiasi, B.; Salehi, S.; Esmaeili Bidhendi, M.; Raeisi, A.; Partani, S.; Meysami, R.; Mahdian, M.; Hosseinzadeh, M.; Abolfathi, S. An Efficient Data Driven-Based Model for Prediction of the Total Sediment Load in Rivers. Hydrology 2022, 9, 36. [Google Scholar] [CrossRef]
  24. Ghiasi, B.; Noori, R.; Sheikhian, H.; Zeynolabedin, A.; Sun, Y.; Jun, C.; Hamouda, M.; Bateni, S.M.; Abolfathi, S. Uncertainty quantification of granular computing-neural network model for prediction of pollutant longitudinal dispersion coefficient in aquatic streams. Sci. Rep. 2022, 12, 4610. [Google Scholar] [CrossRef]
  25. Borzooei, S.; Miranda, G.H.B.; Abolfathi, S.; Scibilia, G.; Meucci, L.; Zanetti, M.C. Application of unsupervised learning and process simulation for energy optimization of a WWTP under various weather conditions. Water Sci. Technol. 2020, 81, 1541–1551. [Google Scholar] [CrossRef]
  26. Shi, H.; Shi, Q.; Zhou, X.; Imin, B.; Li, H.; Zhang, W.; Kahaer, Y. Effect of the competition mechanism of between co-dominant species on the ecological characteristics of Populus euphratica under a water gradient in a desert oasis. Glob. Ecol. Conserv. 2021, 27, e01611. [Google Scholar] [CrossRef]
  27. Imin, B.; Dai, Y.; Shi, Q.; Guo, Y.; Li, H.; Nijat, M. Responses of two dominant desert plant species to the changes in groundwater depth in hinterland natural oasis, Tarim Basin. Ecol. Evol. 2021, 11, 9460–9471. [Google Scholar] [CrossRef]
  28. Che, Q.; Su, X.; Wang, S.; Zheng, S.; Li, Y. Hydrochemical Characteristics and Evolution of Groundwater in the Alluvial Plain (Anqing Section) of the Lower Yangtze River Basin: Multivariate Statistical and Inversion Model Analyses. Water 2021, 13, 2403. [Google Scholar] [CrossRef]
  29. Zhou, Y.; Yang, X.; Zhang, D.; Mackenzie, L.L.; Chen, B. Sedimentological and geochemical characteristics of sediments and their potential correlations to the processes of desertification along the Keriya River in the Taklamakan Desert, western China. Geomorphology 2021, 375, 107560. [Google Scholar] [CrossRef]
  30. Peng, S.; Ding, Y.; Liu, W.; Li, Z. 1 km monthly temperature and precipitation dataset for China from 1901 to 2017. Earth Syst. Sci. Data 2019, 11, 1931–1946. [Google Scholar] [CrossRef] [Green Version]
  31. Wu, H.; Yang, C.; Chen, J.; Yang, S.; Lu, T.; Lin, X. Effects of Green space landscape patterns on particulate matter in Zhejiang Province, China. Atmos. Pollut. Res. 2018, 9, 923–933. [Google Scholar] [CrossRef]
  32. Yan, F.; Shangguan, W.; Zhang, J.; Hu, B. Depth-to-bedrock map of China at a spatial resolution of 100 meters. Sci. Data 2020, 7, 2. [Google Scholar] [CrossRef] [PubMed] [Green Version]
  33. Liu, F.; Rossiter, D.G.; Zhang, G.-L.; Li, D.-C. A soil colour map of China. Geoderma 2020, 379, 114556. [Google Scholar] [CrossRef]
  34. Breiman, L. Random forests. Mach. Learn 2001, 45, 5–32. [Google Scholar] [CrossRef] [Green Version]
  35. Peters, J.; Baets, B.D.; Verhoest, N.E.C.; Samson, R.; Degroeve, S.; Becker, P.D.; Huybrechts, W. Random forests as a tool for ecohydrological distribution modelling. Ecol. Model. 2007, 207, 304–318. [Google Scholar] [CrossRef]
  36. Rodriguez-Galiano, V.; Mendes, M.P.; Garcia-Soldado, M.J.; Chica-Olmo, M.; Ribeiro, L. Predictive modeling of groundwater nitrate pollution using Random Forest and multisource variables related to intrinsic and specific vulnerability: A case study in an agricultural setting (Southern Spain). Sci. Total Environ. 2014, 476–477, 189–206. [Google Scholar] [CrossRef]
  37. Verikas, A.; Gelzinis, A.; Bacauskiene, M. Mining data with random forests: A survey and results of new tests. Pattern Recognit 2011, 44, 330–349. [Google Scholar] [CrossRef]
  38. Zhang, H.; Wu, P.; Yin, A.; Yang, X.; Zhang, M.; Gao, C. Prediction of soil organic carbon in an intensively managed reclamation zone of eastern China: A comparison of multiple linear regressions and the random forest model. Sci. Total Environ. 2017, 592, 704–713. [Google Scholar] [CrossRef]
  39. Fernández-Delgado, M.; Cernadas, E.; Barro, S.; Amorim, D. Do we need hundreds of classifiers to solve real world classification problems? J. Mach. Learn. Res. 2014, 15, 3133–3181. [Google Scholar]
  40. Hamidi, O.; Tapak, L.; Abbasi, H.; Maryanaji, Z. Application of random forest time series, support vector regression and multivariate adaptive regression splines models in prediction of snowfall (a case study of Alvand in the middle Zagros, Iran). Theor. Appl. Climatol. 2017, 134, 769–776. [Google Scholar] [CrossRef]
  41. Manikandan, E.; Rajmohan, N.; Anbazhagan, S. Monsoon impact on groundwater chemistry and geochemical processes in the shallow hard rock aquifer. Catena 2020, 195, 104766. [Google Scholar] [CrossRef]
  42. Ali, S.A.; Ali, U. Hydrochemical characteristics and spatial analysis of groundwater quality in parts of Bundelkhand Massif, India. Appl. Water Sci. 2018, 8, 39. [Google Scholar] [CrossRef] [Green Version]
  43. Hua, K.; Xiao, J.; Li, S.; Li, Z. Analysis of hydrochemical characteristics and their controlling factors in the Fen River of China. Sustain. Cities Soc. 2020, 52, 101827. [Google Scholar] [CrossRef]
  44. Yu, Z.; Yan, N.; Wu, G.; Xu, T.; Li, F. Chemical weathering in the upstream and midstream reaches of the Yarlung Tsangpo basin, southern Tibetan Plateau. Chem. Geol. 2021, 559, 119906. [Google Scholar] [CrossRef]
  45. Piper, A.M. A graphic procedure in the geochemical interpretation of water-analyses. Eos Trans. Am. Geophys. Union 1944, 25, 914–928. [Google Scholar] [CrossRef]
  46. Sadashivaiah, C.; Ramakrishnaiah, C.; Ranganna, G. Hydrochemical analysis and evaluation of groundwater quality in Tumkur Taluk, Karnataka State, India. Int. J. Environ. Res. Public Health 2008, 5, 158–164. [Google Scholar] [CrossRef] [PubMed]
  47. He, S.; Wu, J. Hydrogeochemical characteristics, groundwater quality, and health risks from hexavalent chromium and nitrate in groundwater of Huanhe Formation in Wuqi county, northwest China. Expo. Health 2019, 11, 125–137. [Google Scholar] [CrossRef]
  48. Modibo Sidibé, A.; Lin, X.; Koné, S. Assessing groundwater mineralization process, quality, and isotopic recharge origin in the Sahel Region in Africa. Water 2019, 11, 789. [Google Scholar] [CrossRef] [Green Version]
  49. Gao, Z.; Wang, Z.; Wang, S.; Wu, X.; An, Y.; Wang, W.; Liu, J. Factors that influence the chemical composition and evolution of shallow groundwater in an arid region: A case study from the middle reaches of the Heihe River, China. Environ. Earth Sci. 2019, 78, 390. [Google Scholar] [CrossRef]
  50. Hui, T.; Jizhong, D.; Shimin, M.; Zhuang, K.; Yan, G. Application of water quality index and multivariate statistical analysis in the hydrogeochemical assessment of shallow groundwater in Hailun, northeast China. Hum. Ecol. Risk Assess.Int. J. 2021, 27, 651–667. [Google Scholar] [CrossRef]
  51. Li, P.; He, S.; He, X.; Tian, R. Seasonal hydrochemical characterization and groundwater quality delineation based on matter element extension analysis in a paper wastewater irrigation area, northwest China. Expo. Health 2018, 10, 241–258. [Google Scholar] [CrossRef]
  52. Pant, R.R.; Zhang, F.; Rehman, F.U.; Wang, G.; Ye, M.; Zeng, C.; Tang, H. Spatiotemporal variations of hydrogeochemistry and its controlling factors in the Gandaki River Basin, Central Himalaya Nepal. Sci. Total Environ. 2018, 622, 770–782. [Google Scholar] [CrossRef] [PubMed]
  53. Liu, J.; Han, G.; Liu, M.; Zeng, J.; Liang, B.; Qu, R. Distribution, sources and water quality evaluation of the riverine solutes: A case study in the lancangjiang river basin, tibetan plateau. Int. J. Environ. Res. Public Health 2019, 16, 4670. [Google Scholar] [CrossRef] [PubMed] [Green Version]
  54. Vital, M.; Daval, D.; Clément, A.; Quiroga, S.; Fritz, B.; Martinez, D.E. Importance of accessory minerals for the control of water chemistry of the Pampean aquifer, province of Buenos Aires. Argent. Catena 2018, 160, 112–123. [Google Scholar] [CrossRef]
  55. Li, C.; Gao, X.; Wang, Y. Hydrogeochemistry of high-fluoride groundwater at Yuncheng Basin, northern China. Sci. Total Environ. 2015, 508, 155–165. [Google Scholar] [CrossRef]
  56. Elango, L.; Kannan, R. Rock–water interaction and its control on chemical composition of groundwater. Dev. Environ. Sci. 2007, 5, 229–243. [Google Scholar] [CrossRef]
  57. Xiao, J.; Jin, Z.; Zhang, F.; Wang, J. Major ion geochemistry of shallow groundwater in the Qinghai Lake catchment, NE Qinghai-Tibet Plateau. Environ. Earth Sci. 2012, 67, 1331–1344. [Google Scholar] [CrossRef]
  58. Zhang, Z.; Ding, J.; Zhu, C.; Chen, X.; Wang, J.; Han, L.; Ma, X.; Xu, D. Bivariate empirical mode decomposition of the spatial variation in the soil organic matter content: A case study from NW China. Catena 2021, 206, 105572. [Google Scholar] [CrossRef]
  59. Zhang, Z.; Ding, J.; Wang, J.; Ge, X. Prediction of soil organic matter in northwestern China using fractional-order derivative spectroscopy and modified normalized difference indices. Catena 2020, 185, 104257. [Google Scholar] [CrossRef]
Figure 1. Location map of the research area (a) Xinjiang, (b) Study area, (c) Groundwater observation wells and HOBO instruments.
Water 14 01724 g001
Figure 2. Results of Pearson correlation analysis.
Water 14 01724 g002
Figure 3. Changes in groundwater parameters pre-flood (PRF) and post-flood (POF) from remote sensing inversion results. (a) Content of groundwater water chemical parameters is increased. (b) GD and EC are increased and the content of groundwater water chemical parameters is decreased.
Water 14 01724 g003
Figure 4. Groundwater piper trilinear map.
Water 14 01724 g004
Figure 5. Groundwater types and their variation pre-flood (PRF) and post-flood (POF).
Water 14 01724 g005
Figure 6. Gibbs diagrams signifying the control mechanism of groundwater chemistry.
Water 14 01724 g006
Figure 7. Ratio of major ions in groundwater.
Water 14 01724 g007
Figure 8. The ratio of Mg2+/Na+ to Ca2+/Na+, and HCO3/Na+ to Ca2+/Na+ in the groundwater of the study area.
Water 14 01724 g008
Figure 9. Scatter plot for accuracy verification of groundwater parameter difference inversion results (the bright pink area in the figure covers the true fit line with 95% probability, The red line is the fitted line, the black line is the 1:1 isoline, Scatter plots of laboratory-measured groundwater parameters with RF in the calibration and validation datasets).
Water 14 01724 g009
Table 1. Environmental covariates used for modeling the spatial patterns of groundwater parameters in the Daliyaboy Oasis.
VariablesNative ScaleReference
Mean month Temperature (Tem) 2018.10 and 2019.51000 m[30]
Mean month Evapotranspiration (ET) 2018.10 and 2019.51000 m[30]
Digital elevation model (DEM)90 m(http://www.resdc.cn (accessed on 20 April 2019))
Gross primary productivity (GPP)500 mAqua
Net primary productivity (NPP)500 mAqua
Land use and Land cover change (LULC)10 m[31]
World Reference Base for Soil Resources (WRB)250 m(https://soilgrids.org/(accessed on 20 April 2019))
Plan curvature90 mDEM
Depth to bedrock (DTB)100 m[32]
Soil color (0–5 cm)1000 m[33]
Soil Bulk Density (BD)250 m(https://soilgrids.org/(accessed on 20 April 2019))
Landsat current month NDVI100 m(https://www.resdc.cn/data(accessed on 20 April 2019))
Geomorphons90 mGRASS GIS
Silt250 m(https://soilgrids.org/(accessed on 20 April 2019))
Clay250 m(https://soilgrids.org/(accessed on 20 April 2019))
Sand250 m(https://soilgrids.org/(accessed on 20 April 2019))
Slope90 mDEM
Table 2. Descriptive statistics of the hydrochemical parameters of groundwater in the study area.
ClSO42−HCO3Ca2+Mg2+Na+K+pHTDSEC
Pre-flood (PRF) (n = 30)
Riverside (n = 14)Max3009.262452.902164.55444.03441.262463.0183.878.639982.0015.54
Min278.96217.7374.4347.3958.27204.1614.277.511195.001.19
Mean1047.98752.88394.01146.59159.91734.1236.178.153478.715.07
SD1002.47783.63521.64143.80149.13689.0422.850.313079.885.26
CV%95.7104.1132.498.193.393.963.23.888.5103.9
Oasis
(n = 16)
Max3217.341949.811069.48335.02343.881903.96120.588.848680.0013.85
Min119.23120.67193.7935.0422.15124.7110.758.10685.000.91
Mean1048.16631.36454.40124.25122.32745.4746.468.433326.505.02
SD883.69470.27264.8996.1783.96568.5733.440.212342.023.97
CV%84.374.558.377.468.676.372.02.570.479.0
Total
(n = 30)
Max3217.342452.902164.55444.03441.262463.01120.588.849982.0015.54
Min119.23120.6774.4335.0422.15124.7110.757.51685.000.91
Mean1048.07688.07426.22134.67139.86740.1741.668.303397.535.04
SD924.34627.27399.02119.09118.23616.5028.980.302663.694.53
CV%88.291.293.688.484.583.369.603.678.489.9
Post-flood (POF) (n = 30)
Riverside (n = 14)Max4353.202387.832244.37523.71590.173741.9372.058.2313,287.1818.41
Min316.49237.4271.0978.0457.30247.8118.707.611331.741.38
Mean1219.25822.33405.24196.08181.43923.4635.567.833894.055.35
SD1212.20766.37543.10159.44162.61962.9519.110.193547.725.37
CV%99.493.2134.081.389.6104.353.72.591.1100.2
Oasis
(n = 16)
Max3142.291897.141437.28341.92389.512191.91118.979.198492.1814.63
Min235.68207.8134.3740.7249.98231.8419.227.881097.981.60
Mean1001.3642.33440.78110.1159.02827.6145.938.223350.75.68
SD772.62432.95333.2478.39101.71584.629.240.32178.644.09
CV%77.267.475.671.264.070.663.73.665.072.0
Total
(n = 30)
Max4353.202387.832244.37523.71590.173741.93118.979.1913,287.1818.41
Min235.68207.8071.0940.7249.98231.8418.707.611097.981.38
Mean1103.01726.33424.20150.22169.48872.3441.098.043604.265.53
SD989.80607.11435.87128.37131.66771.2425.170.322858.894.65
CV%89.783.6102.885.477.788.461.34.079.384.1
Note: Unit of each ion (mg/L), EC unit (mS/cm).
Publisher’s Note: MDPI stays neutral with regard to jurisdictional claims in published maps and institutional affiliations.

