
Spatiotemporal Response of Fish Aggregations to Hydrological Changes in the Lower Pearl River, China, during the Main Spawning Season

 ,
,
Abstract
:1. Introduction
2. Materials and Methods
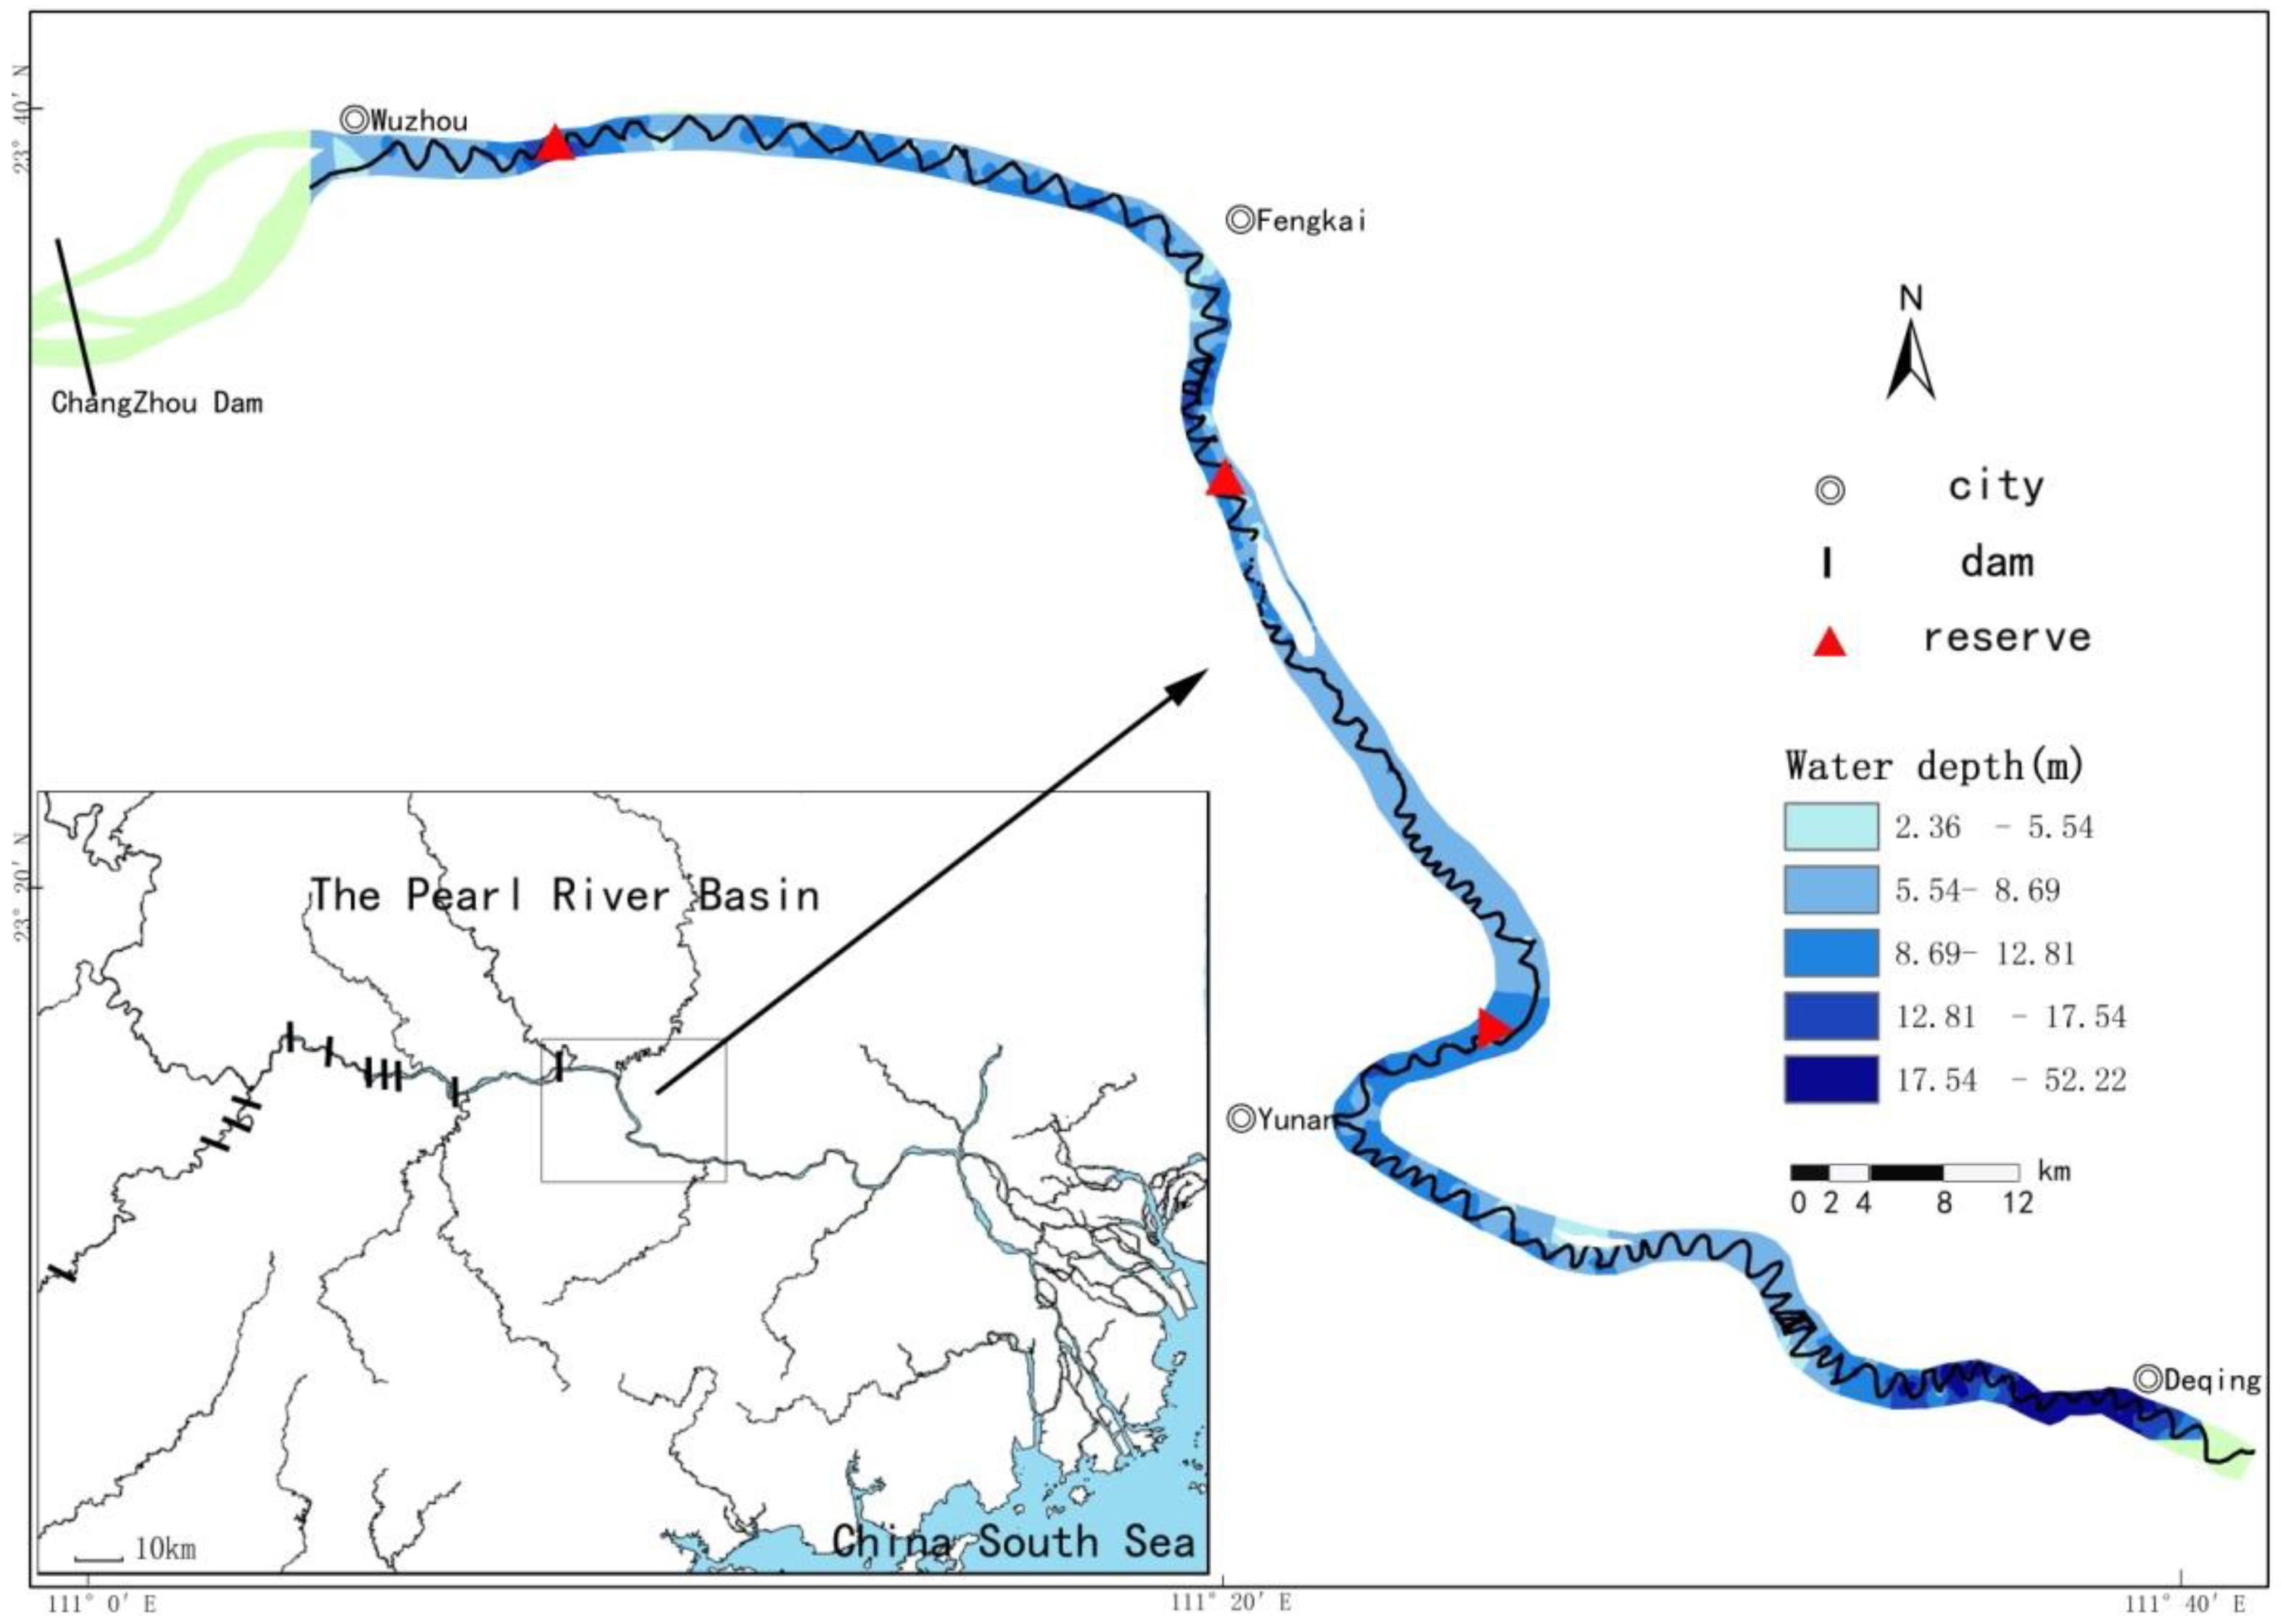
2.1. Study Area
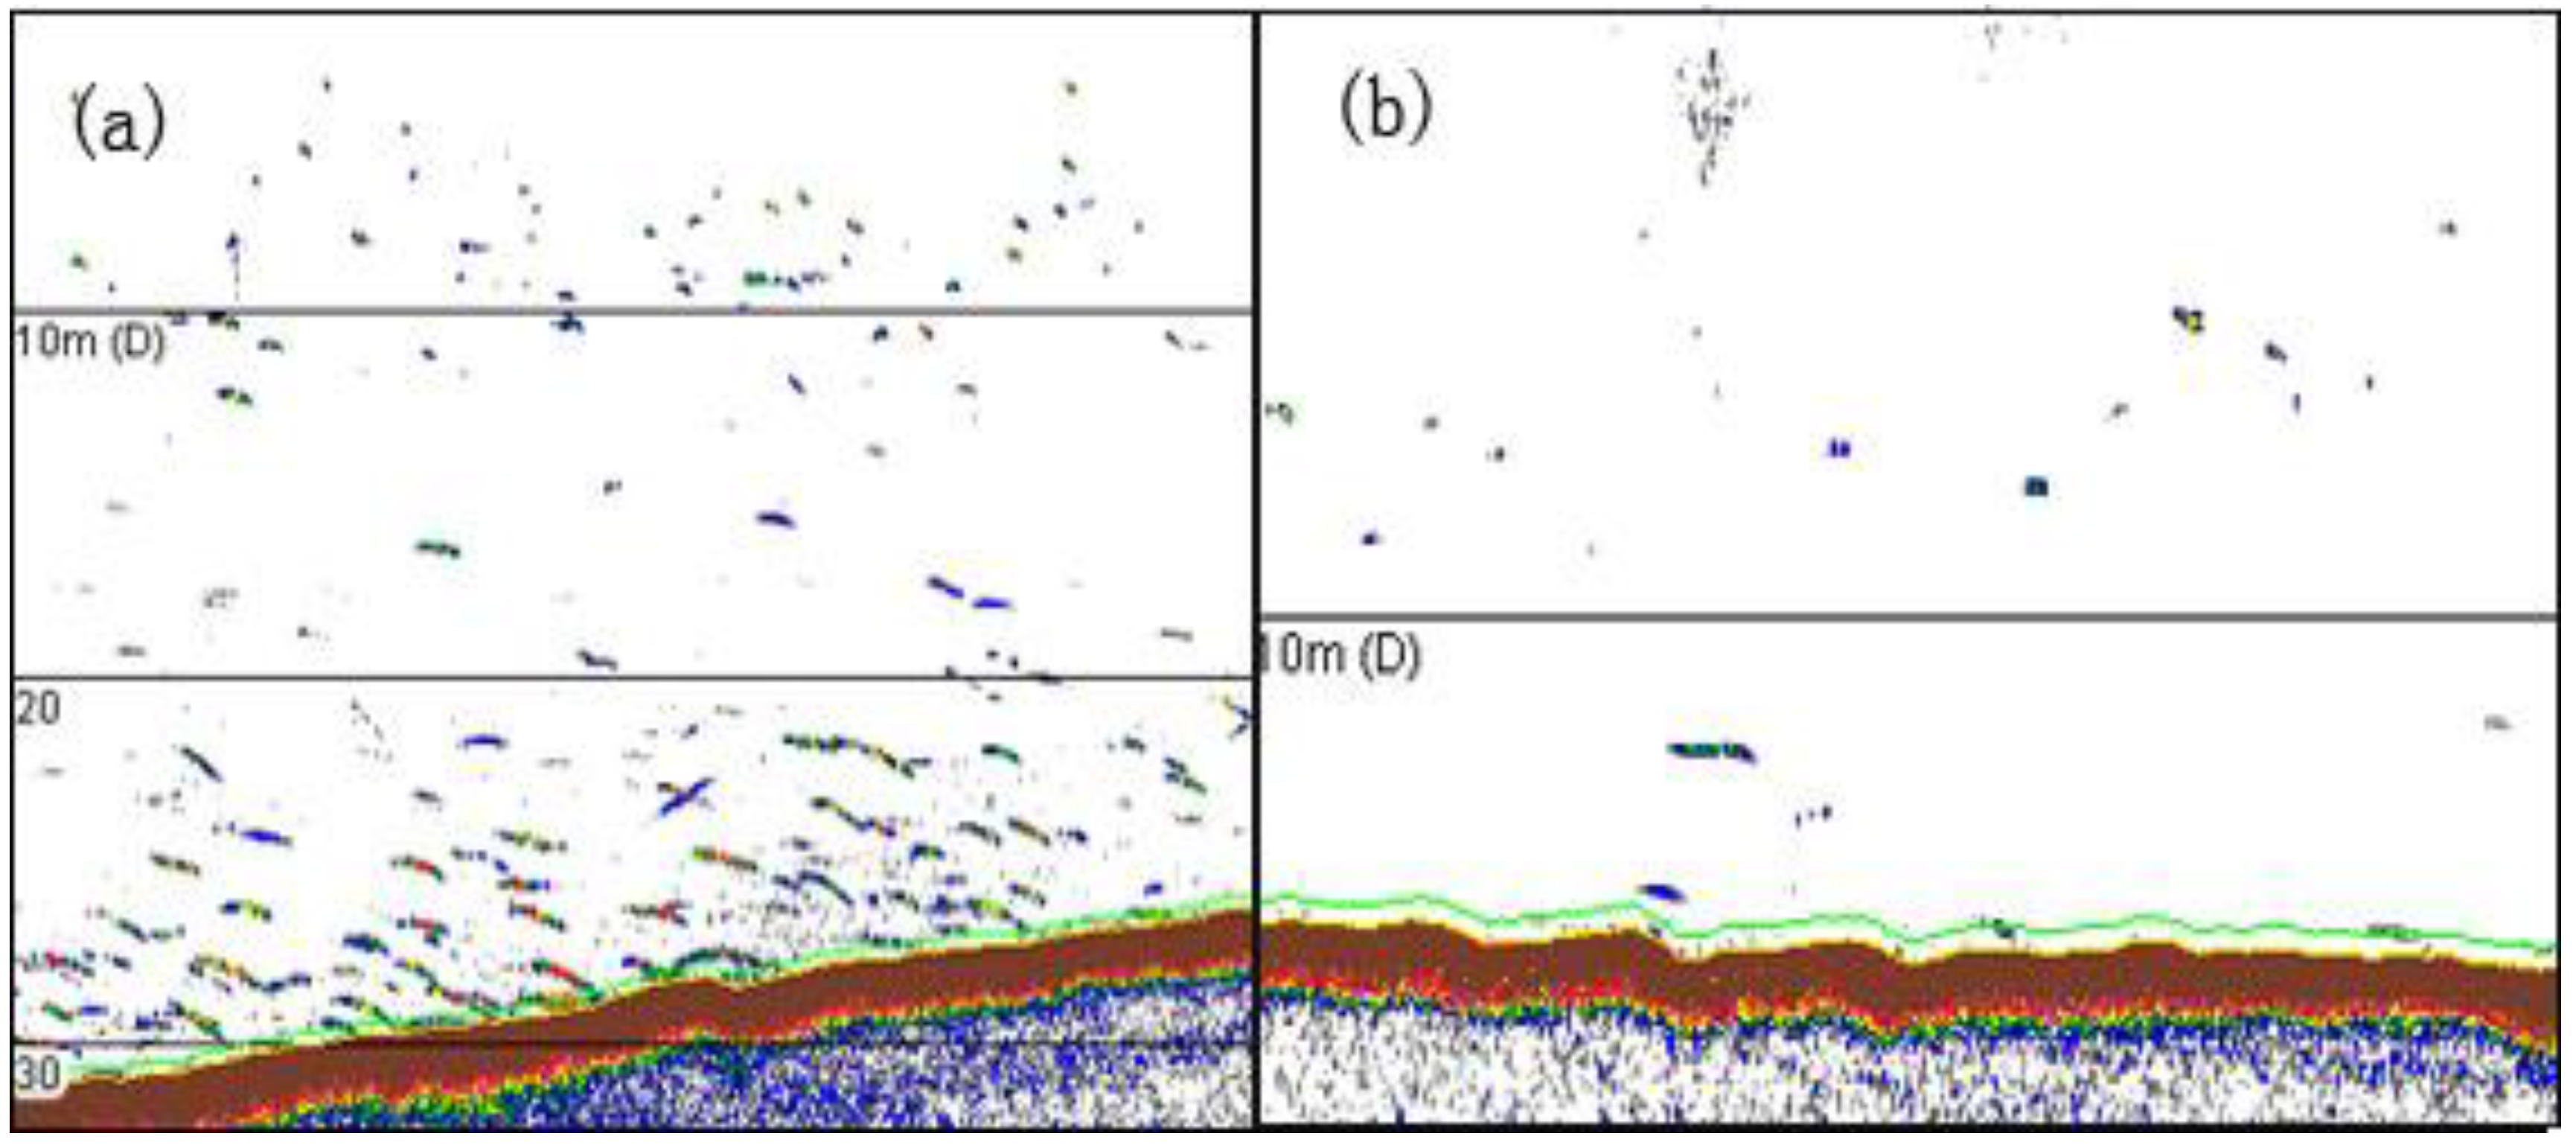
2.2. Acoustic Study
2.3. Data Analysis
3. Results
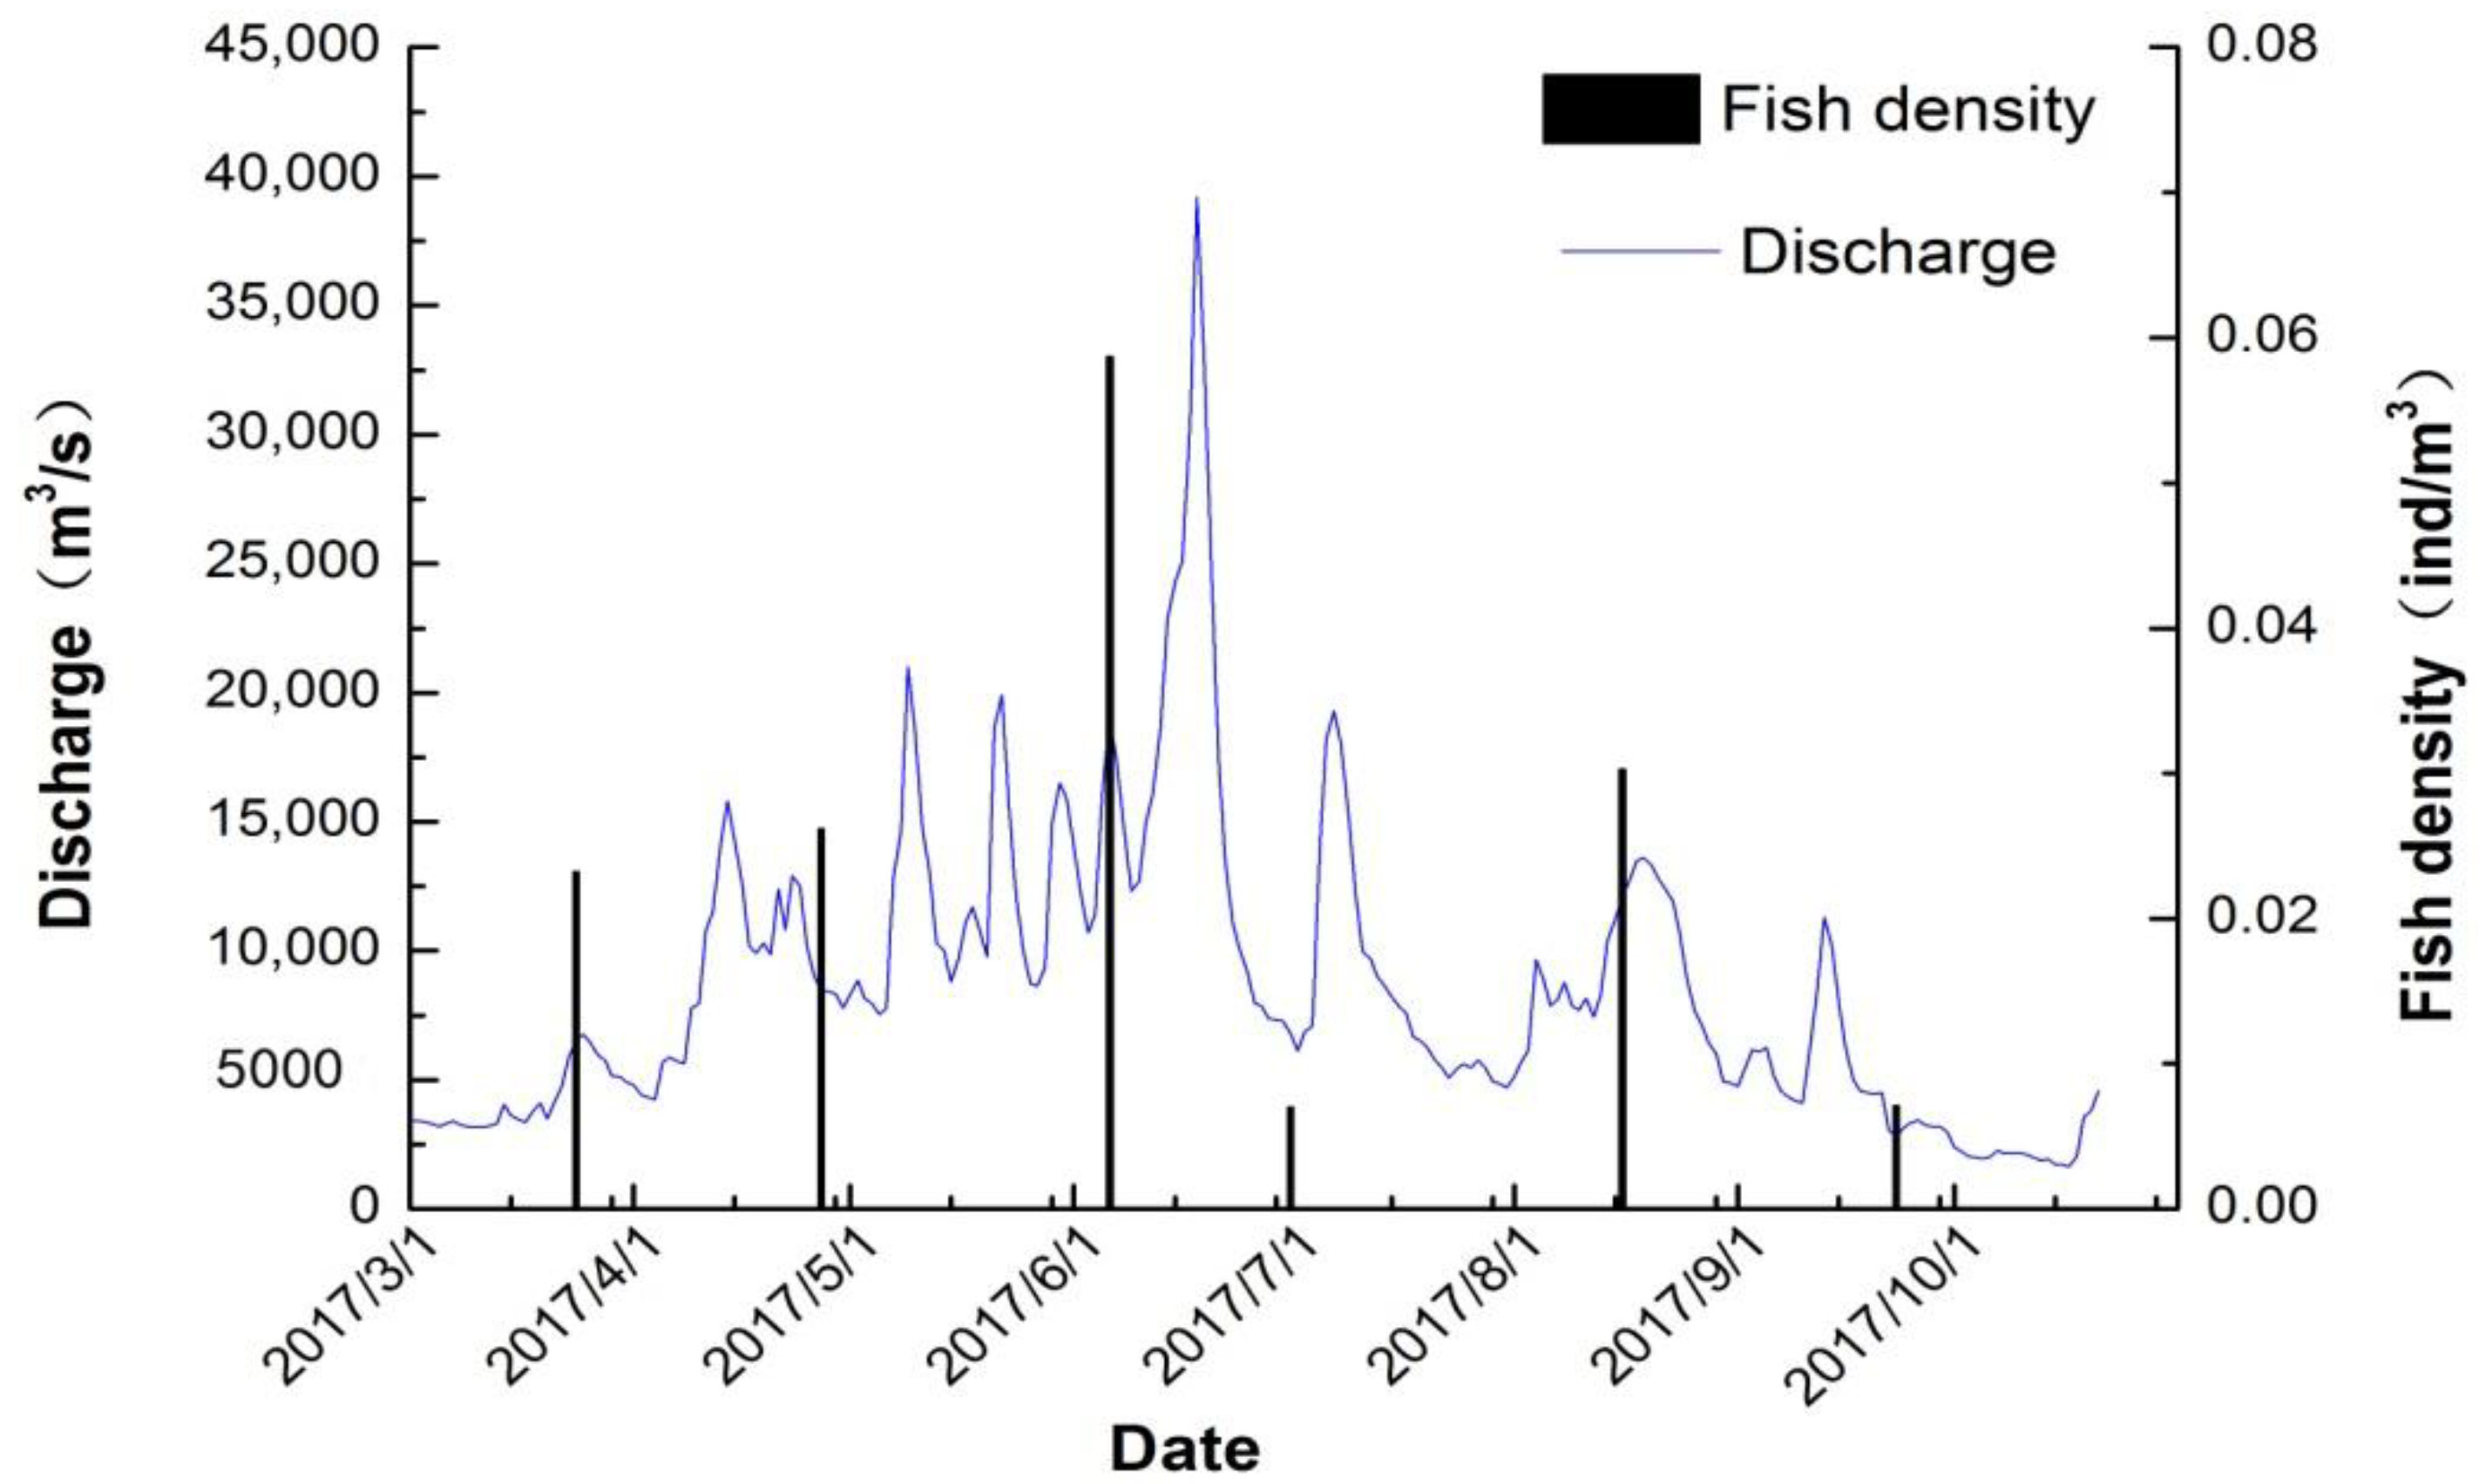
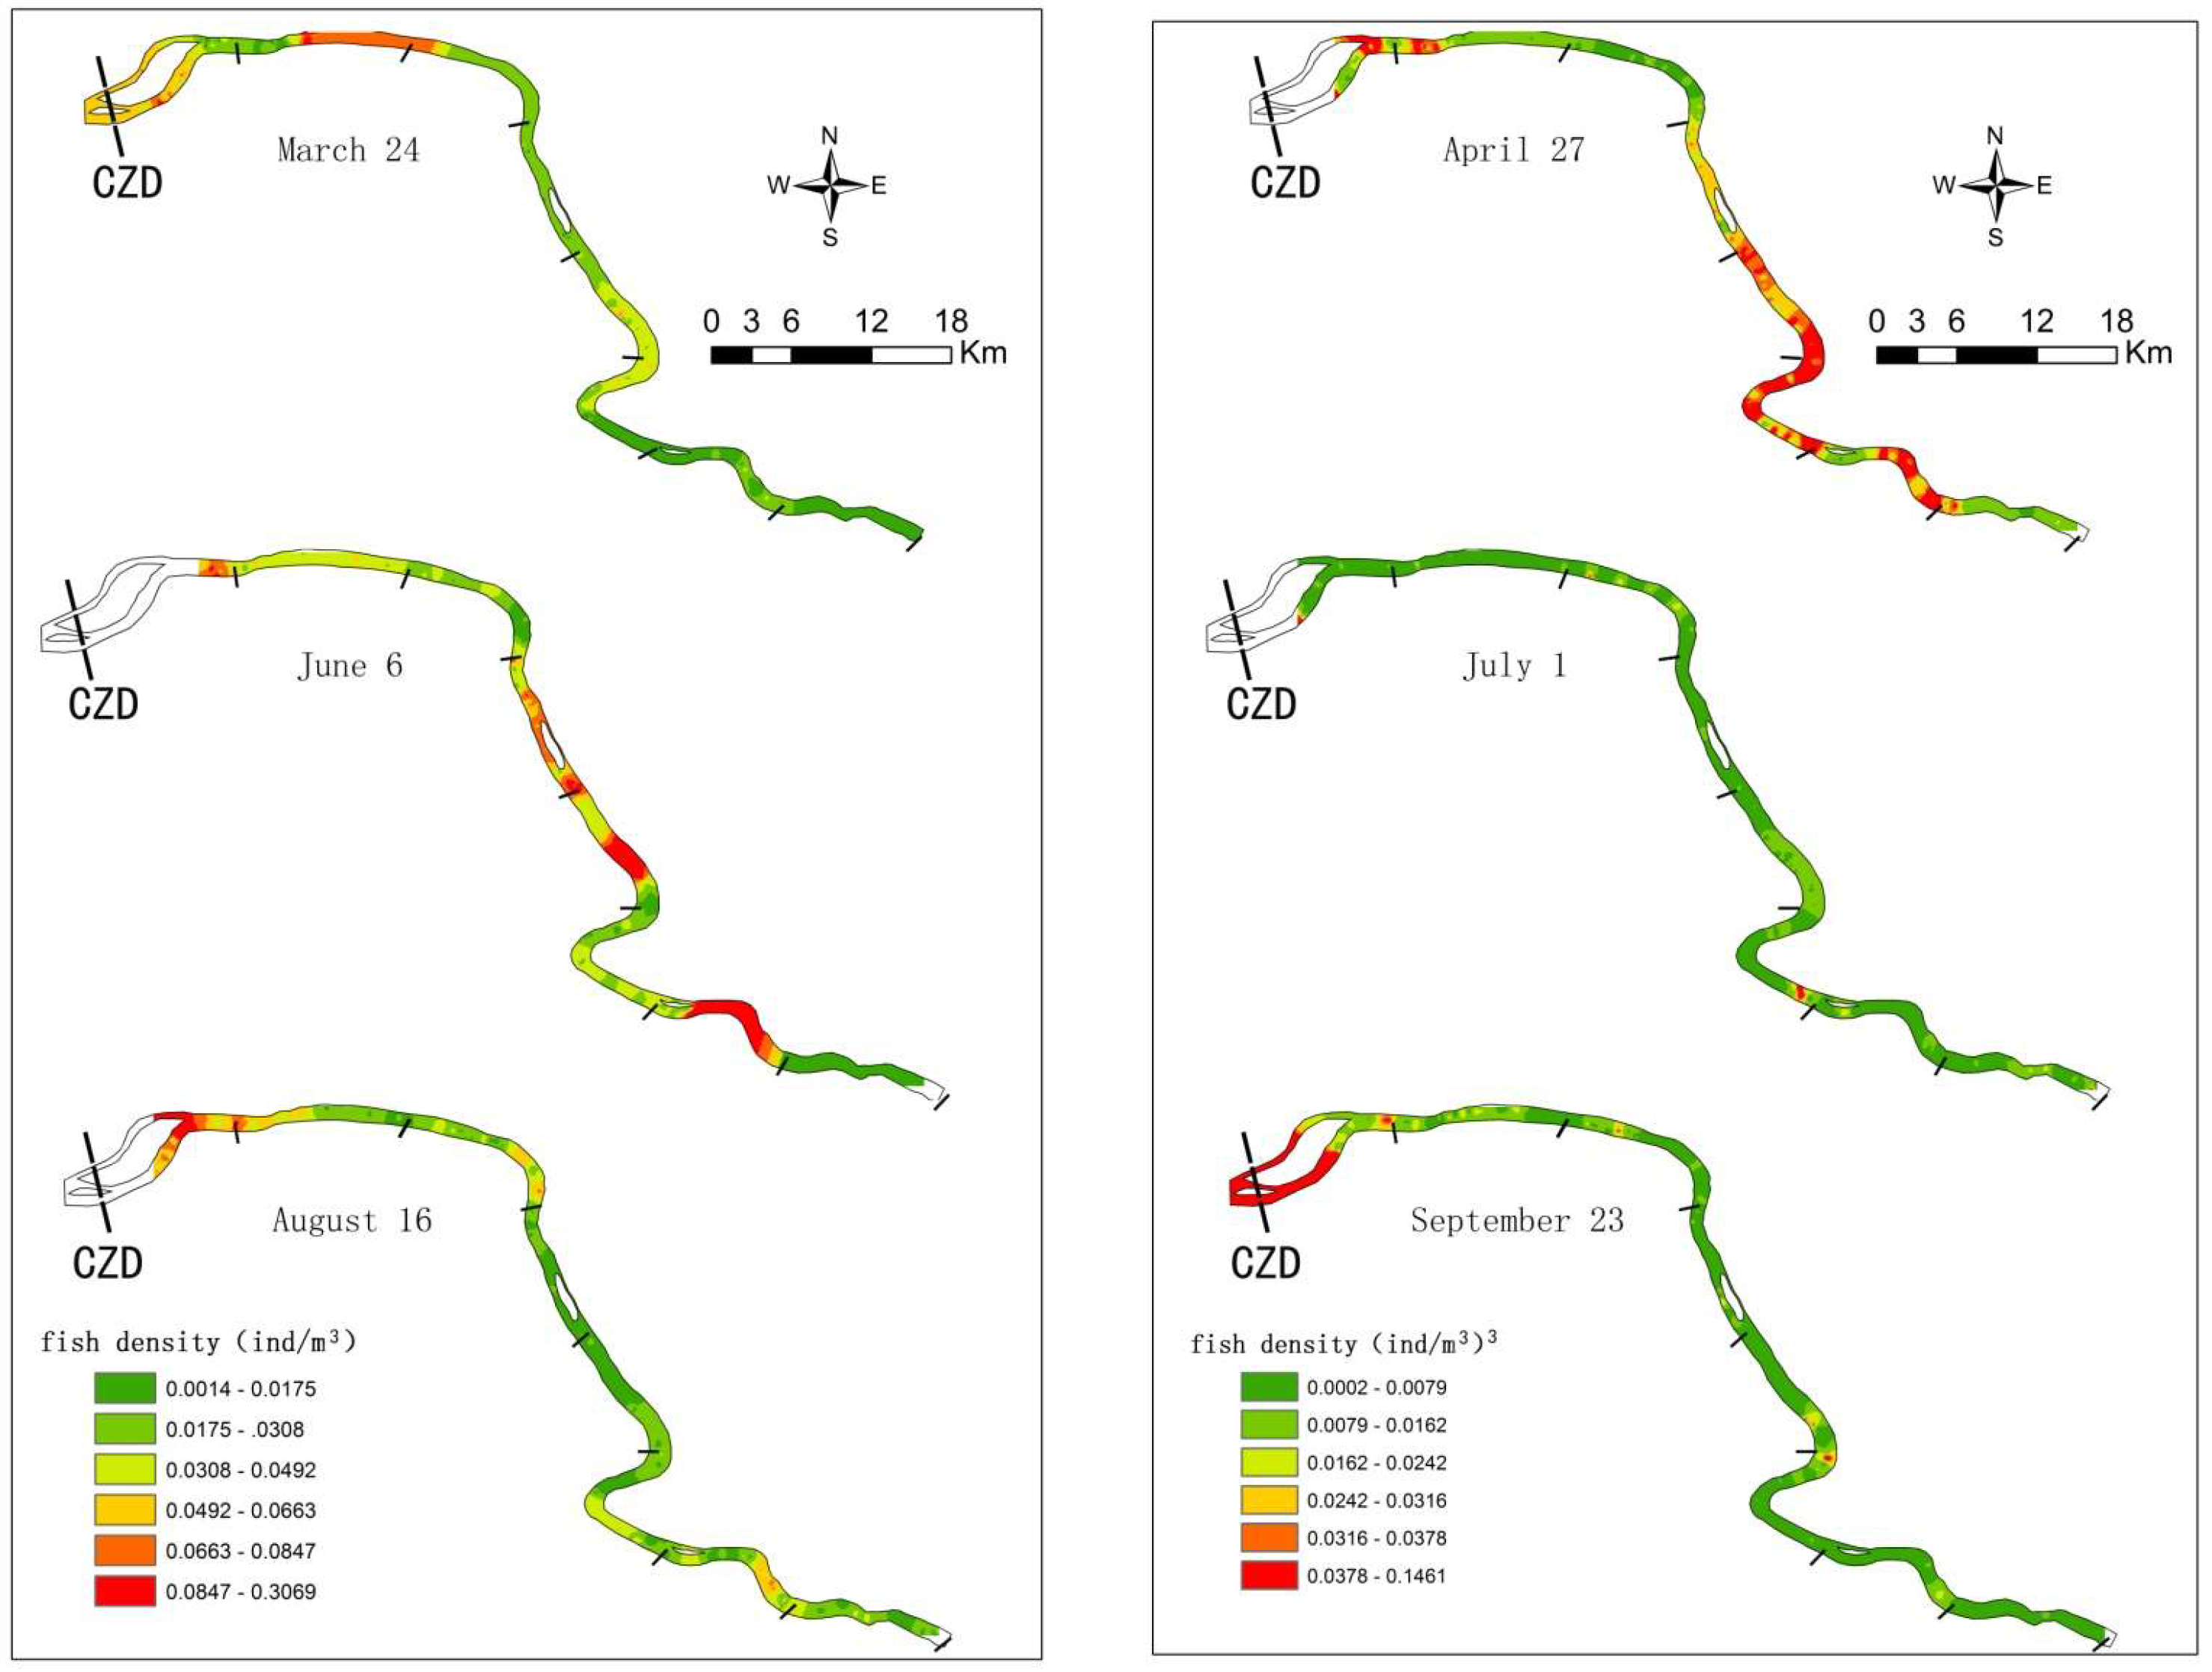
3.1. Fish Spatiotemporal Distribution
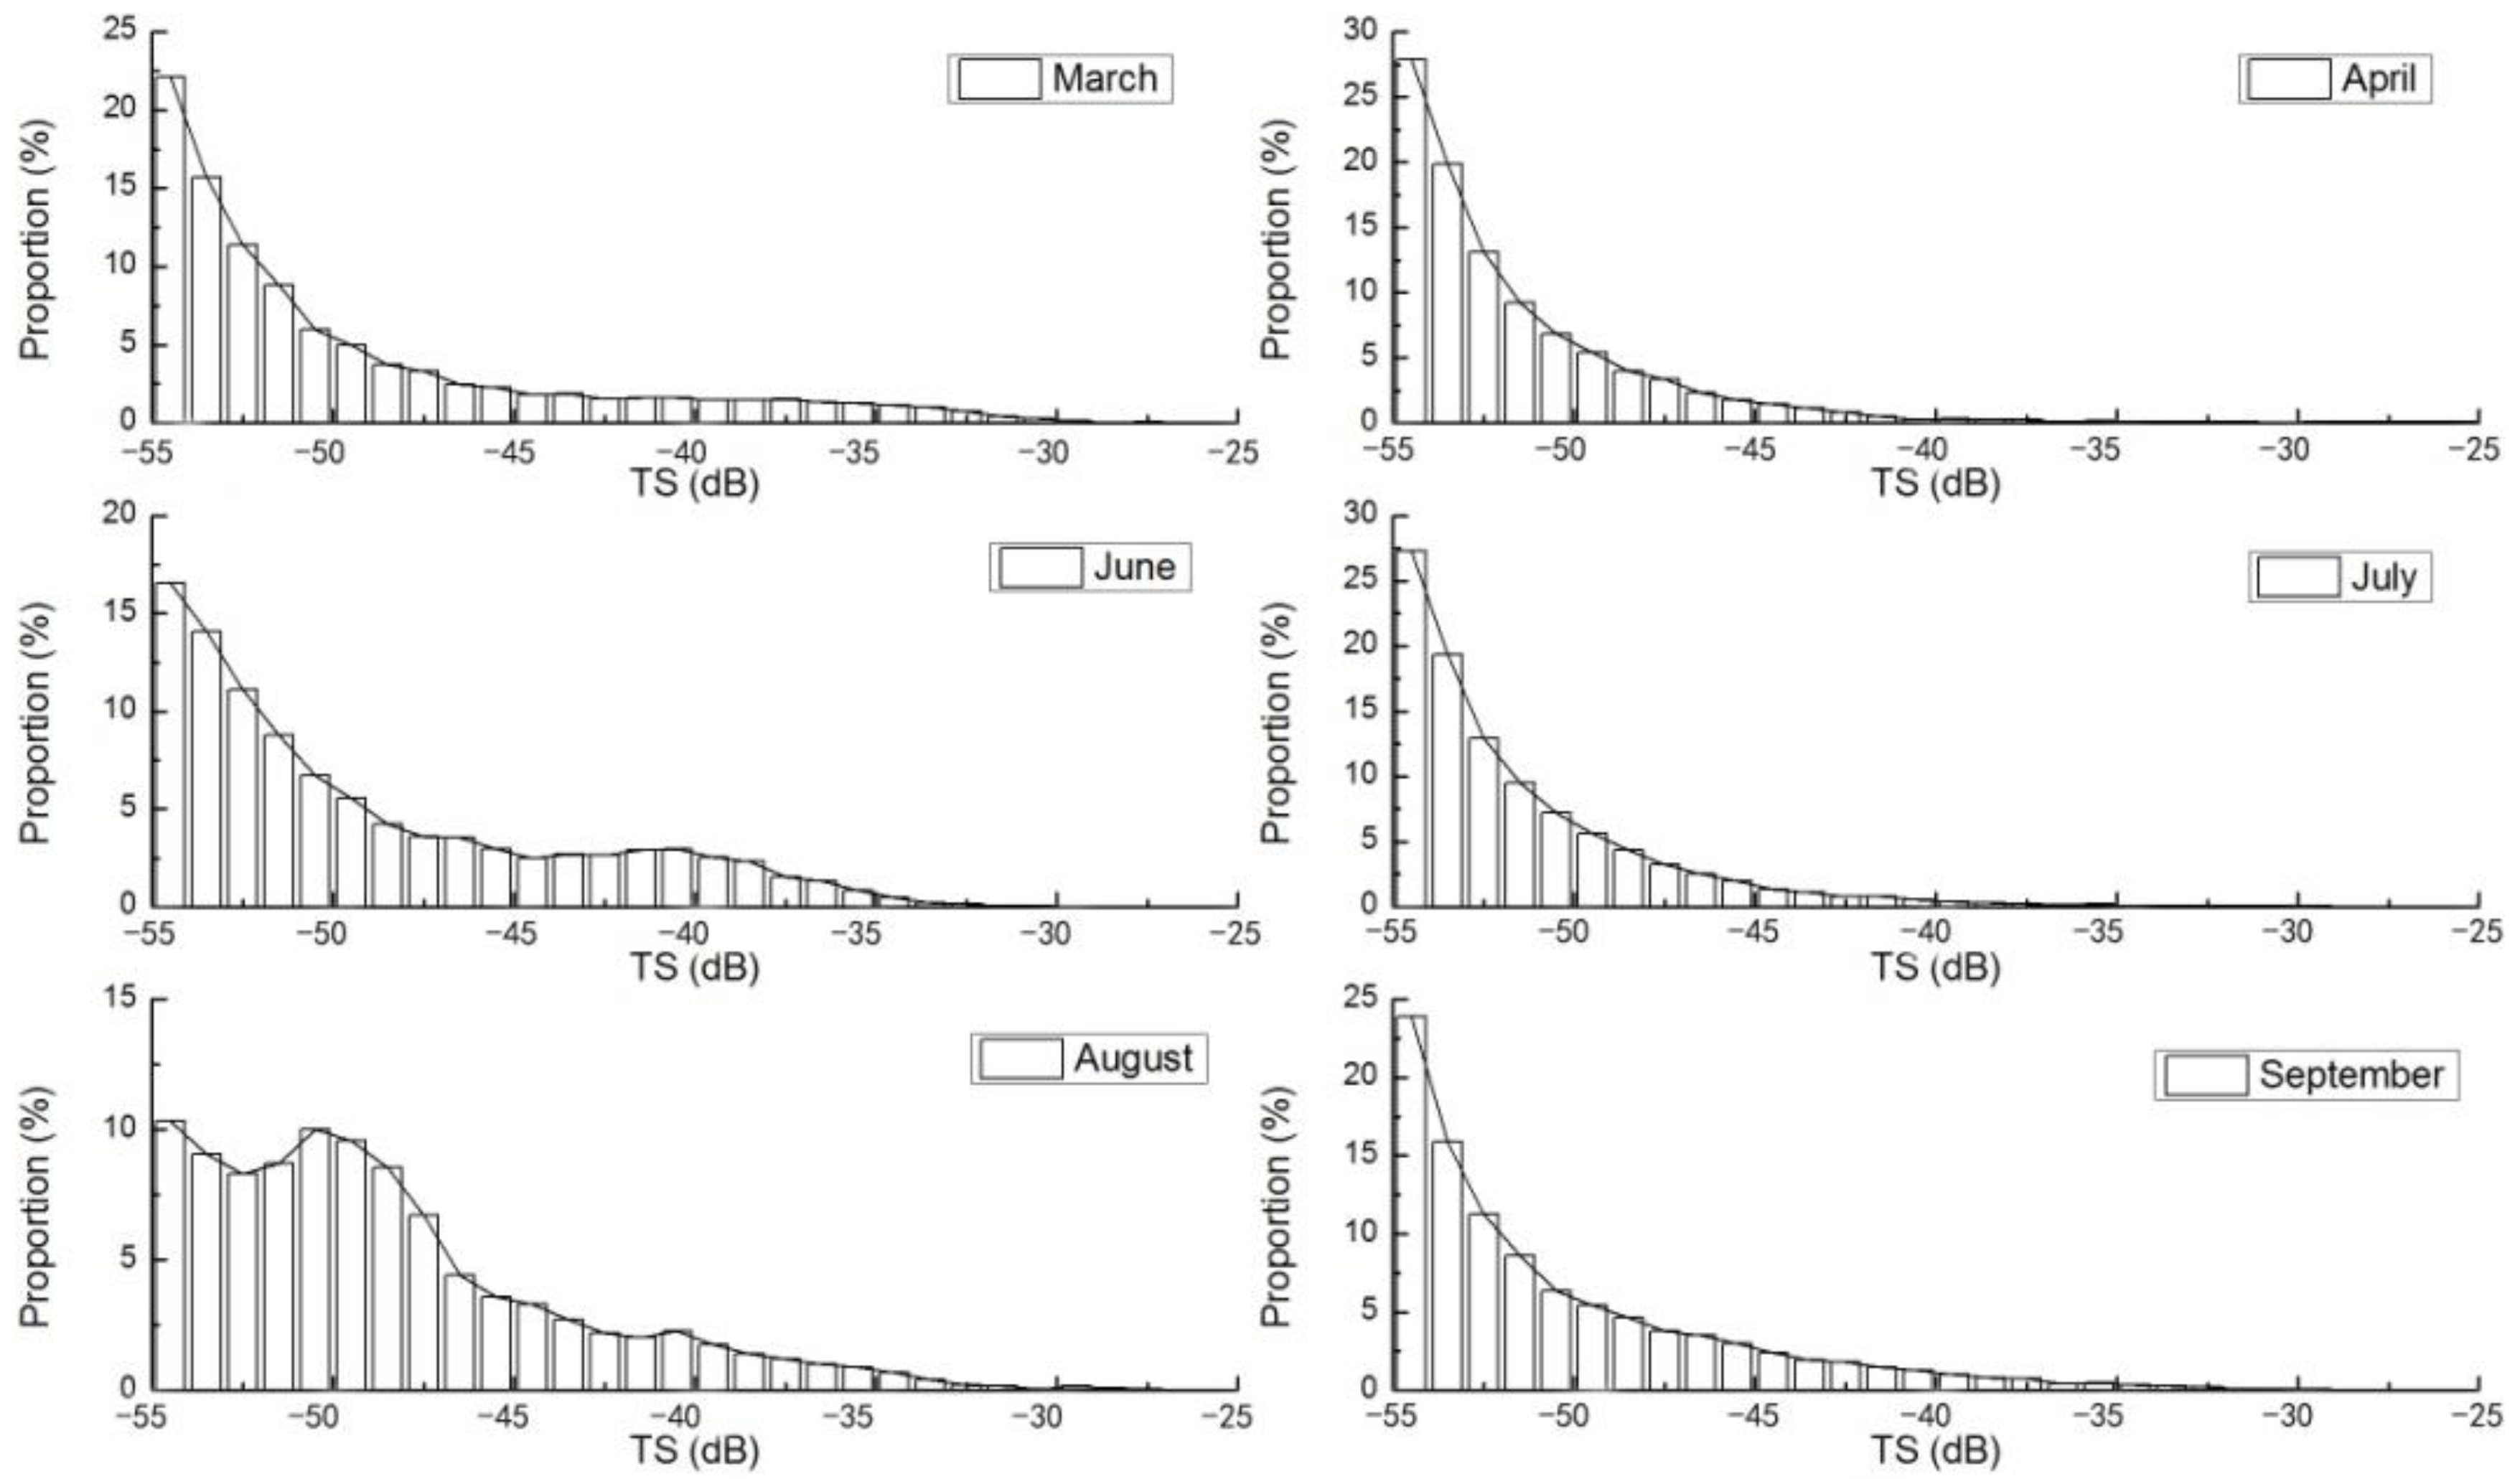
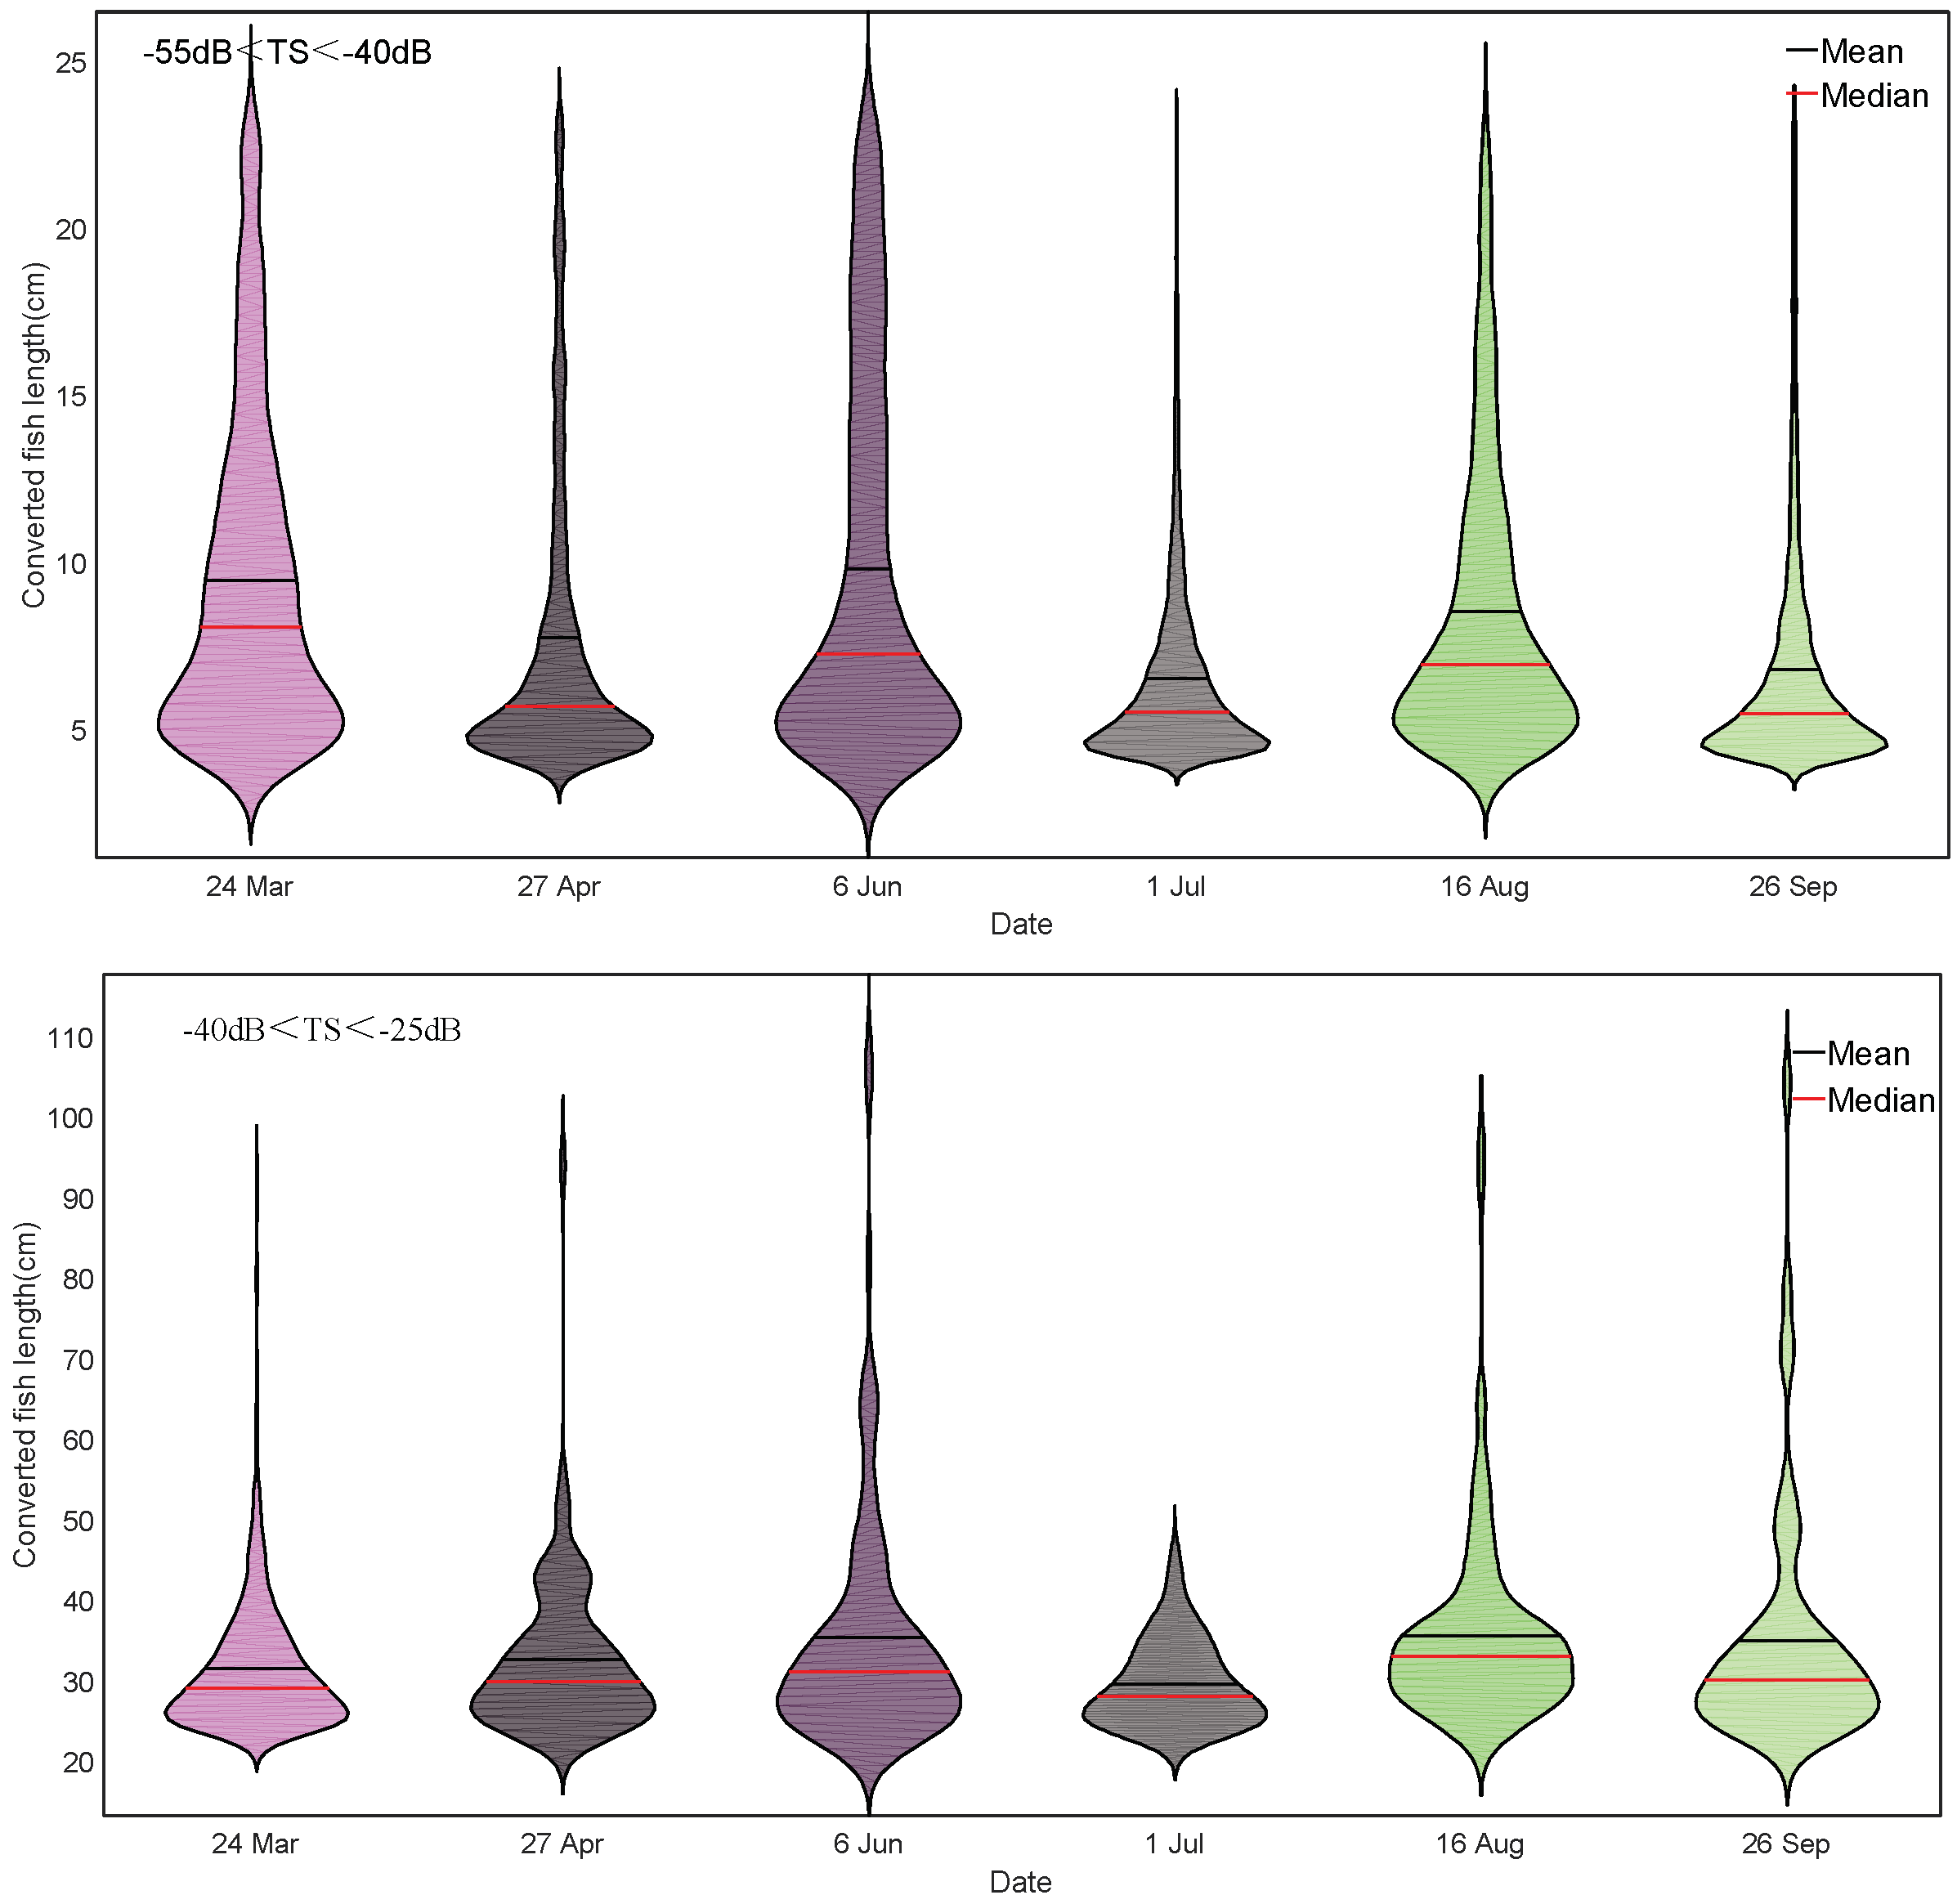
3.2. Fish Size Differences
4. Discussion
Author Contributions
Funding
Acknowledgments
Conflicts of Interest
References
- Dudgeon, D. Large-Scale Hydrological Changes in Tropical Asia: Prospects for Riverine Biodiversity. Bioscience 2000, 50, 793–806. [Google Scholar] [CrossRef]
- Baumgartner, L.J.; Conallin, J.; Wooden, I.; Campbell, B.; Gee, R.; Robinson, W.A.; Mallen-Cooper, M. Using flow guilds of freshwater fish in an adaptive management framework to simplify environmental flow delivery for semi-arid riverine systems. Fish Fish. 2014, 15, 410–427. [Google Scholar] [CrossRef]
- De Bem, J.; Ribolli, J.; Röpke, C.; Winemiller, K.O.; Zaniboni-Filho, E. A cascade of dams affects fish spatial distributions and functional groups of local assemblages in a subtropical river. Neotrop. Ichthyol. 2021, 19, e200133. [Google Scholar] [CrossRef]
- Xie, P. Three-Gorges Dam: Risk to Ancient Fish. Science 2003, 302, 1149–1151. [Google Scholar] [CrossRef] [Green Version]
- Tao, J.; Yang, Z.; Cai, Y.; Wang, X.; Chang, J. Spatiotemporal response of pelagic fish aggregations in their spawning grounds of middle Yangtze to the flood process optimized by the Three Gorges Reservoir operation. Ecol. Eng. 2017, 103, 86–94. [Google Scholar] [CrossRef]
- Zhou, L.; Zeng, L.; Fu, D.; Xu, P.; Zeng, S.; Tang, Q.; Chen, Q.; Chen, L.; Li, G. Fish density increases from the upper to lower parts of the Pearl River Delta, China, and is influenced by tide, chlorophyll-a, water transparency, and water depth. Aquat. Ecol. 2016, 50, 59–74. [Google Scholar] [CrossRef]
- Petitgas, P.; Woillez, M.; Doray, M.; Rivoirard, J. A Geostatistical Definition of Hotspots for Fish Spatial Distributions. Math. Geosci. 2016, 48, 65–77. [Google Scholar] [CrossRef] [Green Version]
- Li, J.; Zhang, H.; Lin, D.; Wu, J.; Wang, C.; Xie, X.; Wei, Q. Spatiotemporal Distribution and Assemblages of Fishes below the Lowermost Dam in Protected Reach in the Yangtze River Main Stream: Implications for River Management. BioMed Res. Int. 2016, 2016, 4290793. [Google Scholar] [CrossRef] [Green Version]
- Xing, Y.; Zhang, C.; Fan, E.; Zhao, Y. Freshwater fishes of China: Species richness, endemism, threatened species and conservation. Divers. Distrib. 2016, 22, 358–370. [Google Scholar] [CrossRef] [Green Version]
- Xia, Y.; Zhao, W.; Xie, Y.; Xue, H.; Li, J.; Li, Y.; Chen, W.; Huang, Y.; Li, X. Ecological and economic impacts of exotic fish species on fisheries in the Pearl River basin. Manag. Biol. Invasions 2019, 10, 127–138. [Google Scholar] [CrossRef] [Green Version]
- Tan, X.; Li, X.; Lek, S.; Li, Y.; Wang, C.; Li, J.; Luo, J. Annual dynamics of the abundance of fish larvae and its relationship with hydrological variation in the Pearl River. Environ. Biol. Fishes 2010, 88, 217–225. [Google Scholar] [CrossRef]
- Lasne, E.; Lek, S.; Laffaille, P. Patterns in fish assemblages in the Loire floodplain: The role of hydrological connectivity and implications for conservation. Biol. Conserv. 2007, 139, 258–268. [Google Scholar] [CrossRef]
- Tan, X.; Li, X.; Chang, J.; Tao, J. Acoustic Observation of the Spawning Aggregation of Megalobrama hoffmanni in the Pearl River. J. Freshw. Ecol. 2009, 24, 293–299. [Google Scholar] [CrossRef]
- Li, J.; Li, X.; Jia, X.; Li, Y.; He, M.; Tan, X.; Wang, C.; Jiang, W. Evolvement and diversity of fish community in Xijiang River. J. Fish. Sci. China 2010, 17, 298–311. [Google Scholar]
- Shuai, F.; Li, X.; Li, Y.; Li, J.; Yang, J.; Lek, S. Temporal patterns of larval fish occurrence in a Large Subtropical River. PLoS ONE 2016, 11, e0146441. [Google Scholar] [CrossRef] [Green Version]
- Zhang, Y.; Li, X.; Li, J.; Li, Y. Grass carp larval density synchronised with river discharge fluctuations in the subtropical Pearl River, China. Ecohydrology 2022, 15, e2355. [Google Scholar] [CrossRef]
- Xia, Y.; Li, X.; Yang, J.; Zhu, S.; Wu, Z.; Li, J.; Li, Y. Elevated Temperatures Shorten the Spawning Period of Silver Carp (Hypophthalmichthys molitrix) in a Large Subtropical River in China. Front. Mar. Sci. 2021, 8, 708109. [Google Scholar] [CrossRef]
- Shuai, F.; Lek, S.; Baehr, C.; Park, Y.-S.; Li, Y.; Li, X. Silver carp larva abundance in response to river flow rate revealed by cross-wavelet modelling. Ecol. Model. 2018, 383, 98–105. [Google Scholar] [CrossRef]
- Zhang, Y.; Li, Y.; Zhang, L.; Wu, Z.; Zhu, S.; Li, J.; Li, X. Site Fidelity, Habitat Use, and Movement Patterns of the Common Carp during Its Breeding Season in the Pearl River as Determined by Acoustic Telemetry. Water 2020, 12, 2233. [Google Scholar] [CrossRef]
- Zhang, Y.; Huang, D.; Li, X.; Liu, Q.; Li, J.; Li, Y.; Yang, J.; Zhu, S. Fish community structure and environmental effects of West River. South China Fish. Sci. 2020, 16, 42–52. [Google Scholar] [CrossRef]
- Tan, X.; Huang, H.; Tao, J.; Li, S. Fish population structure in the fishway of Changzhou hydro-junction. Chin. J. Appl. Ecol. 2015, 5, 1548–1552. [Google Scholar] [CrossRef]
- Tao, J.; Tan, X.; Yang, Z.; Wang, X.; Cai, Y.; Qiao, Y.; Chang, J. Fish migration through a fish passage associated with water velocities at the Changzhou fishway (Pearl River, China). J. Appl. Ichthyol. 2015, 31, 72–76. [Google Scholar] [CrossRef]
- Tan, X.; Kang, M.; Tao, J.; Li, X.; Huang, D. Hydroacoustic survey of fish density, spatial distribution, and behavior upstream and downstream of the Changzhou Dam on the Pearl River, China. Fish. Sci. 2011, 77, 891–901. [Google Scholar] [CrossRef]
- Foote, K.; Knudsen, H.; Vestnes, G.; MacLennan, D.; Simmonds, E. Calibration of Acoustic Instruments for Fish Density Estimation: A Practical Guide; ICES Cooperative Research Report; ICES: Bergen, Norway, 1987; pp. 1–69. [Google Scholar]
- Demer, D.; Berger, L.; Bernasconi, M.; Bethke, E.; Boswell, K.; Chu, D.; Domokos, R.; Dunford, A.; Fässler, S.; Gauthier, S. Calibration of Acoustic Instruments; ICES Cooperative Research Report No. 326; ICES: Copenhagen, Denmark, 2015; p. 133. [Google Scholar]
- Godlewska, M.; Długoszewski, B.; Doroszczyk, L.; Jóźwik, A. The relationship between sampling intensity and sampling error—empirical results from acoustic surveys in Polish vendace lakes. Fish. Res. 2009, 96, 17–22. [Google Scholar] [CrossRef]
- Guillard, J.; Vergès, C. The Repeatability of Fish Biomass and Size Distribution Estimates Obtained by Hydroacoustic Surveys Using Various Sampling Strategies and Statistical Analyses. Int. Rev. Hydrobiol. 2007, 92, 605–617. [Google Scholar] [CrossRef]
- Higginbottom, I.; Woon, S.; Schneider, P. Hydroacoustic Data Processing for Standard Stock Assessment Using Echoview: Technical Manual; FAO/AdriaMed: Battery Point, TAS, Australia, 2008; pp. 40–59. [Google Scholar]
- Rudstam, L.G.; Parker-Stetter, S.L.; Sullivan, P.J.; Warner, D.M. Towards a standard operating procedure for fishery acoustic surveys in the Laurentian Great Lakes, North America. ICES J. Mar. Sci. J. Du Cons. 2009, 66, 1391–1397. [Google Scholar] [CrossRef] [Green Version]
- Balk, H.; Lindem, T. Improved fish detection in data from split-beam sonar. Aquat. Living Resour. 2000, 13, 297–303. [Google Scholar] [CrossRef]
- Foote, K.G. Fish target strengths for use in echo integrator surveys. J. Acoust. Soc. Am. 1987, 82, 981–987. [Google Scholar] [CrossRef] [Green Version]
- Draštík, V.; Kubečka, J.; Tušer, M.; Čech, M.; Frouzová, J.; Jarolím, O.; Prchalová, M. The effect of hydropower on fish stocks: Comparison between cascade and non-cascade reservoirs. Hydrobiologia 2008, 609, 25–36. [Google Scholar] [CrossRef]
- Georgakarakos, S.; Kitsiou, D. Mapping abundance distribution of small pelagic species applying hydroacoustics and Co-Kriging techniques. Hydrobiologia 2008, 612, 155–169. [Google Scholar] [CrossRef]
- Yu, L.; Lin, J.; Chen, D.; Duan, X.; Peng, Q.; Liu, S. Ecological Flow Assessment to Improve the Spawning Habitat for the Four Major Species of Carp of the Yangtze River: A Study on Habitat Suitability Based on Ultrasonic Telemetry. Water 2018, 10, 600. [Google Scholar] [CrossRef] [Green Version]
- Wang, C.; Lai, Z.; Li, X.; Gao, Y.; Li, Y.; Yu, Y. Annual variation pattern of phytoplankton community at the downstream of Xijiang River. Acta Ecol. Sin. 2013, 33, 4398–4408. [Google Scholar] [CrossRef] [Green Version]
- Lin, P.; Chen, L.; Gao, X.; Wang, C.; Gao, X.; Kang, M. Spatiotemporal Distribution and Species Composition of Fish Assemblages in the Transitional Zone of the Three Gorges Reservoir, China. Water 2020, 12, 3514. [Google Scholar] [CrossRef]
- Shuai, F.; Li, X.; Li, Y.; Yang, J.; Li, J. Analysis of the ecohydrological demands of bighead carp breeding in the Dongta spawning grounds of the Pearl River, via cross-wavelet analysis. Acta Ecol. Sin. 2016, 36, 6071–6078. [Google Scholar] [CrossRef]
- Wu, Z.; Zhu, S.L.; Li, J.; Yang, J.P.; Li, Y.F.; Li, X.H. Acoustic assessment of fish resources in subtropical run-off-river hydropower plant in the Pearl River. IOP Conf. Ser. Earth Environ. Sci. 2017, 82, 012082. [Google Scholar] [CrossRef] [Green Version]
- Zhi, W.; Tan, X.C.; Tao, J.P.; Yong, T.; Li, X.H.; Shuli, Z. Hydroacoustic monitoring of fish migration in the Changzhou Dam fish passage. J. Appl. Ichthyol. 2013, 29, 1445–1446. [Google Scholar] [CrossRef]
- Tao, J.; Wang, X.; Tan, X.; Cai, Y.P.; Qiao, Y.; Chang, J.B. Diel pattern of fish presence at the Changzhou fishway (Pearl River, China) during the flood season. J. Appl. Ichthyol. 2015, 31, 451–458. [Google Scholar] [CrossRef]
- Simmonds, J.E.; Maclennan, D.N. Fisheries Acoustics: Theory and Practice, 2nd ed.; Blackwell: London, UK, 2005; pp. 217–232. [Google Scholar]
- Ostrovsky, I. Hydroacoustic assessment of fish abundance in the presence of gas bubbles. Limnol. Oceanogr. Methods 2009, 7, 309–318. [Google Scholar] [CrossRef]
- Tao, J.P.; Gong, Y.T.; Tan, X.C.; Yang, Z.; Chang, J.B. Spatiotemporal patterns of the fish assemblages downstream of the Gezhouba Dam on the Yangtze River. Sci. China Life Sci. 2012, 55, 626–636. [Google Scholar] [CrossRef] [Green Version]
- Chen, W.; Li, C.; Yang, J.; Zhu, S.; Li, J.; Li, Y.; Li, X. Temporal species-level composition of larvae resources in the lower Pearl River drainage and implications for species’ reproductive cycles. Gene 2020, 776, 145351. [Google Scholar] [CrossRef]
- Shuai, F.; Li, X.; He, A.; Liu, Q.; Zhang, Y.; Wu, Z.; Zhu, S. Fish diversity and distribution pattern of the Pearl River system in Guangxi. Acta Hydrobiol. Sin. 2020, 44, 819–828. [Google Scholar] [CrossRef]
- Lu, K. Fishery Resource Investigation in the Pearl River; Guangdong Province Science Publication: Guangzhou, China, 1990; pp. 139–163. [Google Scholar]
- Miller, H.; Winfield, I.J.; Fletcher, J.M.; Ben James, J.; Van Rijn, J.; Bull, J.M.; Cotterill, C.J. Distribution, characteristics and condition of Arctic charr (Salvelinus alpinus) spawning grounds in a differentially eutrophicated twin-basin lake. Ecol. Freshw. Fish 2015, 24, 32–43. [Google Scholar] [CrossRef] [Green Version]


| Survey Period | Discharge (m3/s) | Depth (m) | Area (km2) | Temperature (°C) | Dc | Hydrological Condition |
|---|---|---|---|---|---|---|
| 24–25 March | 4083 | 11.48 | 115 | 18.00 | 8.6 | + |
| 27–28 April | 10,593 | 13.15 | 115 | 22.37 | 11.3 | - |
| 6–7 June | 12,833 | 16.41 | 115 | 22.36 | 12.2 | + |
| 1–2 July | 7500 | 13.47 | 115 | 28.06 | 9.8 | - |
| 16–17 August | 9960 | 13.07 | 115 | 30.24 | 11 | + |
| 23–24 September | 3670 | 11.36 | 115 | 29.41 | 8.7 | - |
| Date | Average Density (ind/m3) | SD | Max | 95% Confidence Interval | CV (%) |
|---|---|---|---|---|---|
| 24 March | 0.0232 A | 0.0141 | 0.0813 | (0.0209, 0.0255) | 60.78 |
| 27 April | 0.0262 B | 0.0207 | 0.2075 | (0.0167, 0.0222) | 79.01 |
| 6 June | 0.0587 C | 0.1581 | 0.9883 | (0.0666, 0.1326) | 269.34 |
| 1 July | 0.0089 D | 0.0071 | 0.0619 | (0.0043, 0.0065) | 79.78 |
| 16 August | 0.0303 A | 0.0238 | 0.1238 | (0.0218, 0.0274) | 138.03 |
| 23 September | 0.0071 BD | 0.0098 | 0.0983 | (0.0085, 0.0128) | 78.55 |
Publisher’s Note: MDPI stays neutral with regard to jurisdictional claims in published maps and institutional affiliations. |
© 2022 by the authors. Licensee MDPI, Basel, Switzerland. This article is an open access article distributed under the terms and conditions of the Creative Commons Attribution (CC BY) license (https://creativecommons.org/licenses/by/4.0/).
Share and Cite
Wu, Z.; Zhu, S.; Li, Y.; Xia, Y.; Zhang, Y.; Li, X.; Li, J. Spatiotemporal Response of Fish Aggregations to Hydrological Changes in the Lower Pearl River, China, during the Main Spawning Season. Water 2022, 14, 1723. https://doi.org/10.3390/w14111723
Wu Z, Zhu S, Li Y, Xia Y, Zhang Y, Li X, Li J. Spatiotemporal Response of Fish Aggregations to Hydrological Changes in the Lower Pearl River, China, during the Main Spawning Season. Water. 2022; 14(11):1723. https://doi.org/10.3390/w14111723
Chicago/Turabian StyleWu, Zhi, Shuli Zhu, Yuefei Li, Yuguo Xia, Yingqiu Zhang, Xinhui Li, and Jie Li. 2022. "Spatiotemporal Response of Fish Aggregations to Hydrological Changes in the Lower Pearl River, China, during the Main Spawning Season" Water 14, no. 11: 1723. https://doi.org/10.3390/w14111723