
Design Combination Optimized Approach for Urban Stormwater and Drainage Systems Using Copula-Based Method


1
School of Geography and Planning, Sun Yat-Sen University, Guangzhou 510006, China
2
China Water Resources Pearl River Planning, Surveying & Designing Co., Ltd., Guangzhou 510610, China
*
Author to whom correspondence should be addressed.
Water 2022, 14(11), 1717; https://doi.org/10.3390/w14111717
Submission received: 28 March 2022
/
Revised: 8 May 2022
/
Accepted: 20 May 2022
/
Published: 27 May 2022
(This article belongs to the Special Issue Urban Water Security and Sustainable Development)
Abstract
:Waterlogging disasters cause huge loss of life and property damage every year. In this research, a Copula-based optimization method is proposed to solve the problems in bivariate design of urban stormwater and drainage systems resulting from ignorance of precipitation temporal dependence and discrepancy between different design codes. Optimized design combinations of stormwater and drainage systems conditioned on given Kendall bivariate return periods or return periods of either system can be obtained using the optimization method for the case study of Zhongshan and Zhuhai. Results show that the temporal dependencies between precipitation series with different durations should be carefully considered, which can be sufficiently described by Copula functions. Based on the optimized design combinations, it is found that the planned return periods of stormwater systems in Sponge City Plans are underestimated for both Zhongshan and Zhuhai, which restricts the full use of the drainage systems. According to the optimized results, the planned return periods of stormwater systems in Zhongshan (Zhuhai) should be adjusted to 8.04 a (6.76 a) for the downtown area and 6.52 a (5.59 a) for other areas, conditioned on the planned return periods for P24 h in Sponge City Plans. The proposed optimization method provides a useful approach for the bivariate design of stormwater and drainage systems. The results of this research can give stakeholders references in compiling engineering plans for urban waterlogging prevention and help better balance the conflicts between waterlogging safety and economic efficiency.
1. Introduction
According to the “China Statistical Yearbook 2021” [1], China’s urban population reached 914.23 million at the end of 2021. The urbanization rate increased from 17.92% in 1978, when the reform and opening up started, to 64.72% in 2021, with the ever-increasing possibility of and damage from urban waterlogging disasters. According to a survey in 2010 by the Ministry of Housing and Urban-Rural Development of the People’s Republic of China (PRC), 213 cities among the 351 cities investigated suffered from waterlogging disasters from 2008 to 2010 and 137 cities experienced more than three waterlogging disasters, indicating a severe need for urban waterlogging prevention in China. During the past decade, waterlogging disasters caused huge economic and life losses in China. The super storm event occurring on 21 July 2012 in Beijing caused 79 deaths and great economic loss, and the city’s traffic network was affected for several days, which resulted in great attention being paid to urban waterlogging disasters by the public and stakeholders. With the impact of the El Niño event in 2016, 192 cities in mainland China suffered waterlogging disasters, including regional capital cities along the Yangtze River, such as Wuhan and Nanjing. In addition, the waterlogging disaster caused by an extreme heavy rainstorm in Handan city, Hebei province, on 18 July 2016, resulted in 114 deaths and 111 residents missing, and the super storm disaster occurring on 20 July 2021 in Zhengzhou city, Henan province, took 380 lives (The State Council of PRC, 2022) [2]. In response to these urban waterlogging disasters, the State Council issued several policies on improving the capacity of urban infrastructure in 2013, pointing out the urgent need of optimizing urban drainage systems within the next decade. In 2015 and 2016, a total of 30 cities were selected as pilot projects, or sponge cities, to promote related technologies and explore approaches to prevent urban waterlogging disasters. Thus, the role of urban drainage management and disaster prevention is becoming more and more important and is attracting much attention from researchers [3,4,5].
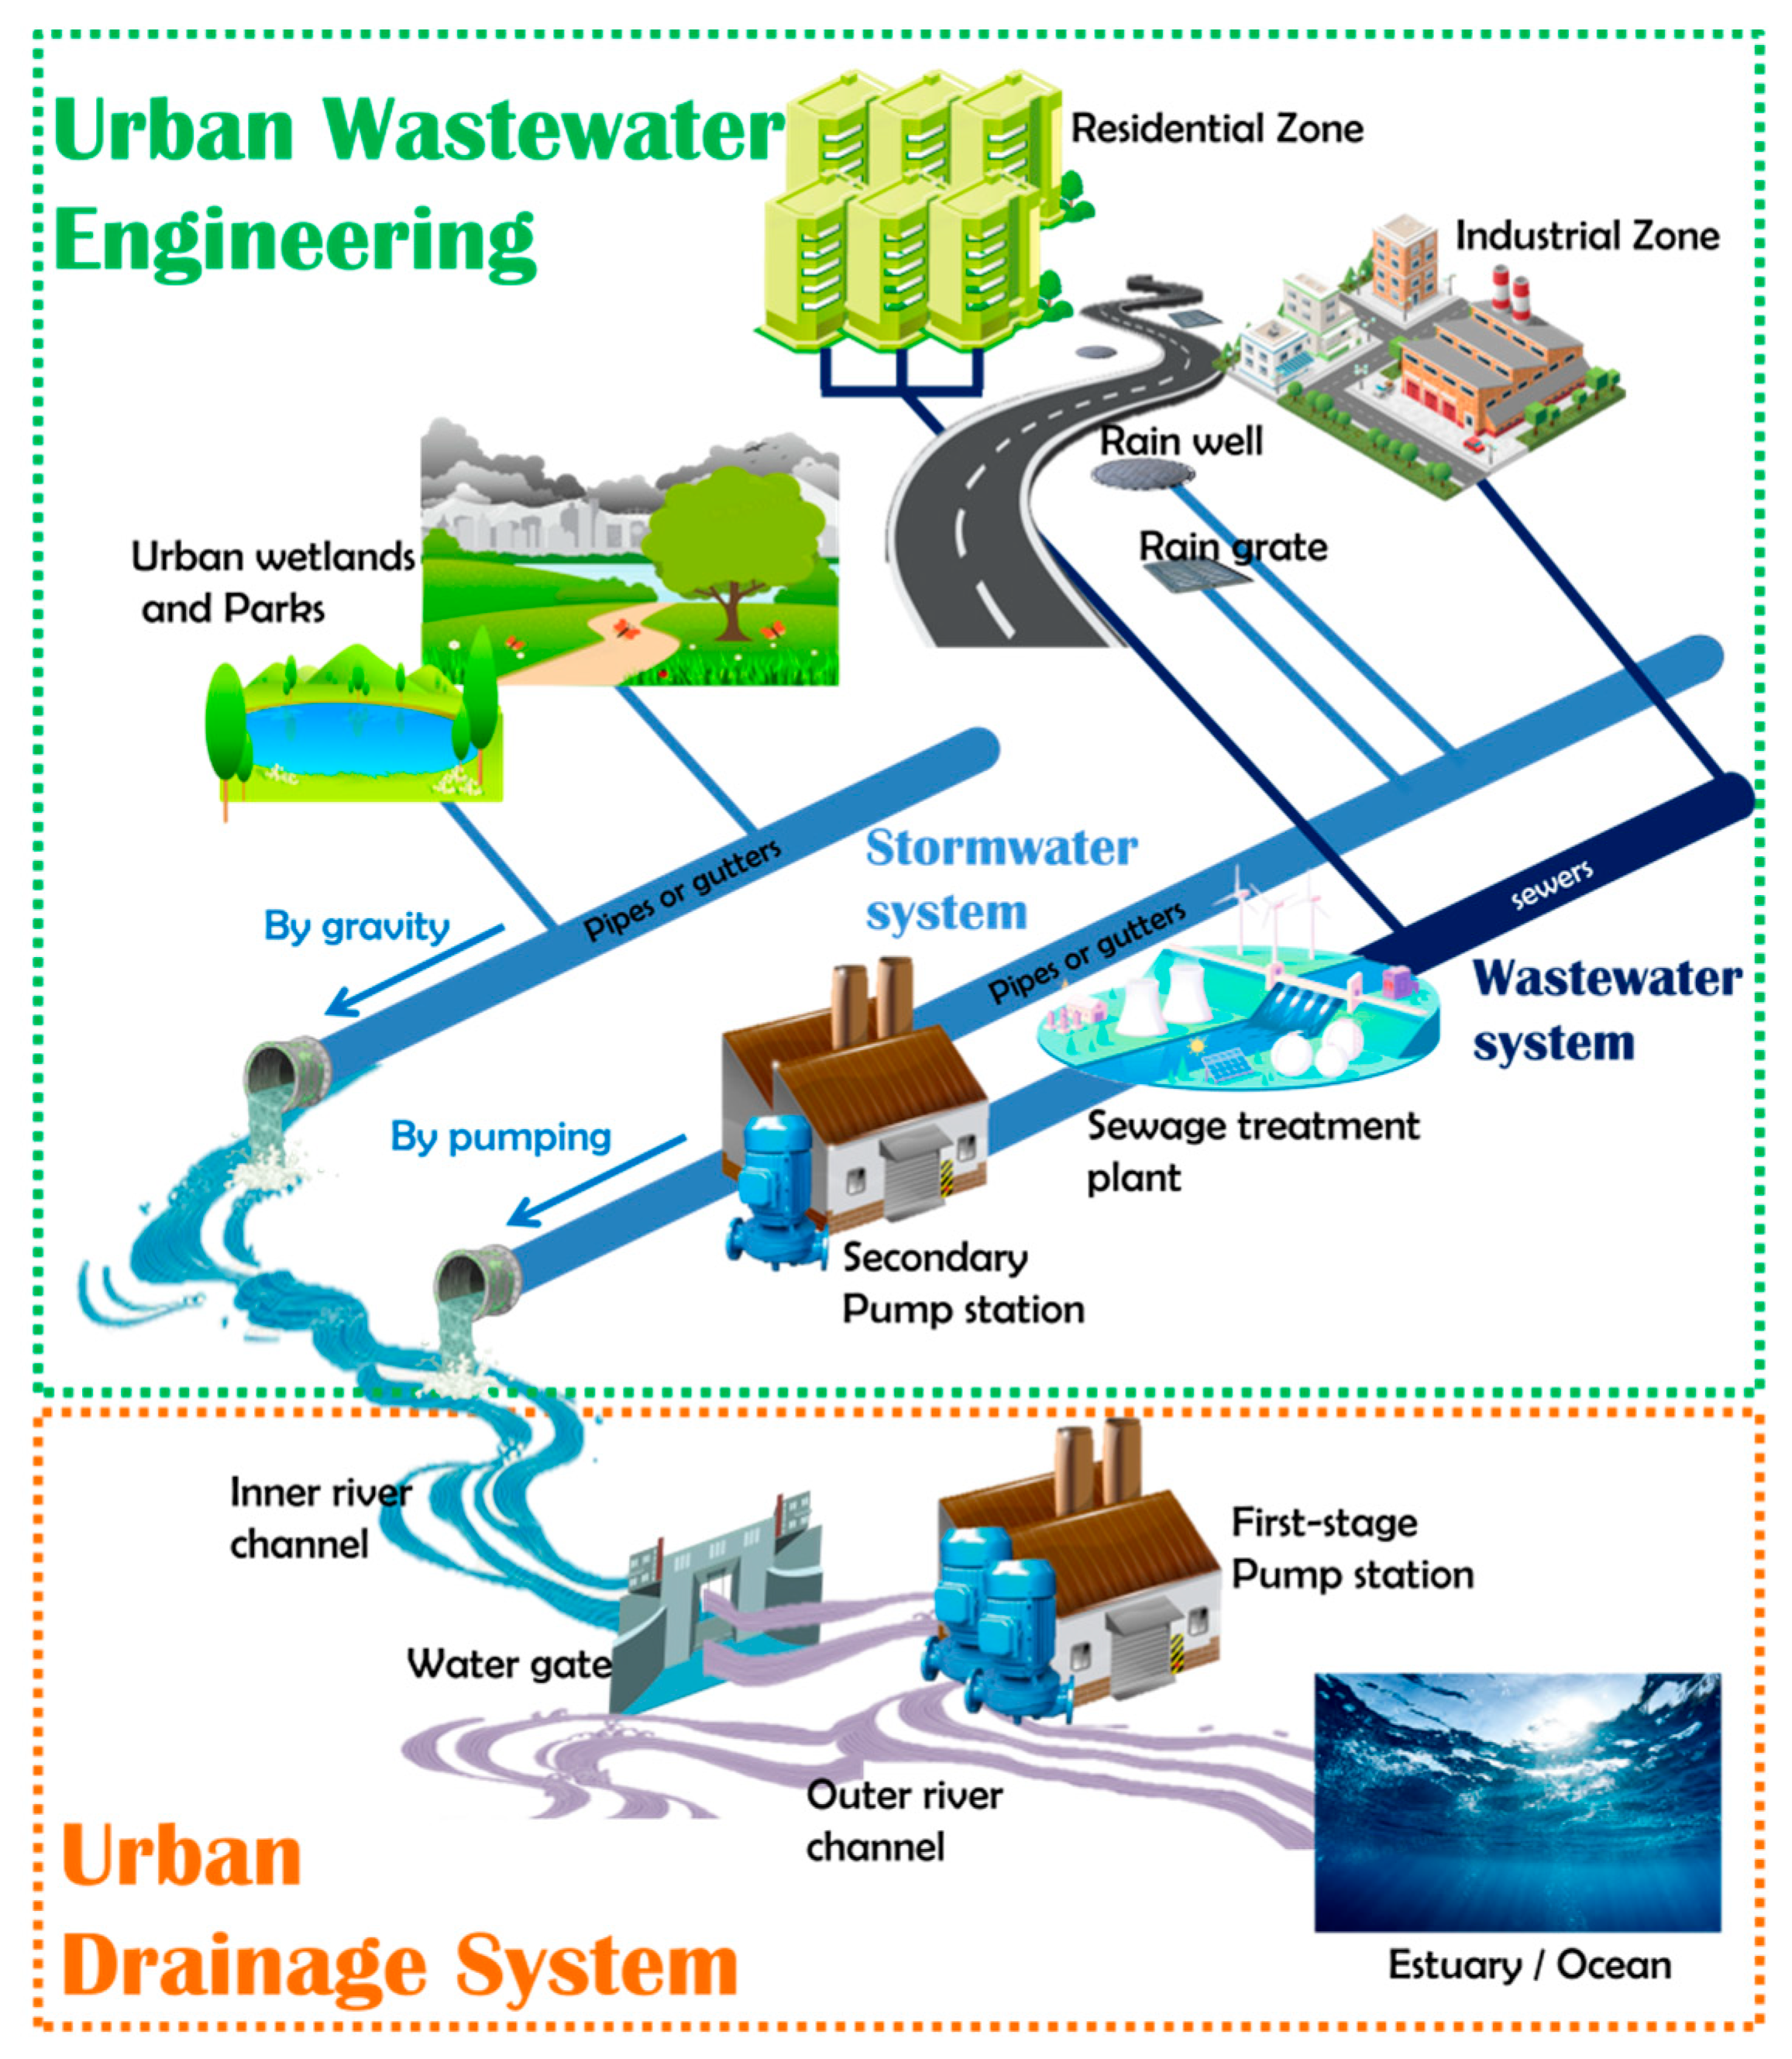
Design codes of stormwater and drainage systems are a vital basis for sponge city construction, because they directly determine the city’s security capability for waterlogging prevention. However, the drainage systems and stormwater systems in China have long been governed by different departments and obey different design codes [6], resulting in management chaos and incoordination of construction scales. As part of urban wastewater engineering [7], urban stormwater systems are mainly managed by municipal departments and are expected to collect stormwater converged from small areas like streets, parks, business zones and residential districts. Urban drainage systems are mainly managed by water conservancy departments and are responsible for passing stormwater gathering in the stormwater system from the whole city to outer river channels. As shown in Figure 1, when a storm event occurs, the stormwater is first converged into water pipes through gutters, rain grates and rain wells and then transported to inner river channels or drainage pipes of the drainage system, either by gravity or second-stage pumps. After this, the drainage system drains off the stormwater into outer river channels, lakes or seas with the help of gravity and first-stage pumping stations.
Since the stormwater system is designed to cope with a relatively small water volume, its design scale usually focuses on peak flow, produced from short-duration precipitation, i.e., design 1 h precipitation (P1 h) in the Code for design of outdoor wastewater engineering (GB50014-2021) [7]. In contrast, the drainage system focuses on water volume rather than peak flow, since it deals with stormwater generated in the whole city. Hence, the design scale of the drainage system is using long-duration precipitation, i.e., design 6 h~24 h precipitation (P6 h~P24 h) in the Code for design of urban flood control project (GB/T 50805-2012) [8] and the Standard for waterlogging control (SL 723-2016) [9]. The Code for design of urban flood control project points out that the capability of the drainage system should carefully consider the scale of urban wastewater engineering, including wastewater systems and stormwater systems. The Standard for waterlogging control also notes that the drainage system design should consider the short-duration precipitation used for stormwater system design and the capability of the stormwater system. However, there is no definite guidance for coherent design of the two systems in current codes. The discrepancies in management modes and design codes of urban stormwater and drainage systems can lead to hydraulic and municipal engineers confusing the stormwater and drainage design codes in practice [10]. In addition, the inherent temporal dependence between precipitations with different durations for different system design works is also ignored. As a result, the design combination of urban stormwater and drainage systems usually lacks coordination, which can be divided into the following situations: (1) when a storm event occurs, the stormwater system of each small zone can successfully transport stormwater through pipes and gutters, while the drainage system cannot handle the huge stormwater volume; in this case, the water level of the inner river channel will rise, making it hard for stormwater systems to pass stormwater, since the hydraulic slopes decrease and the outlets of pipes or gutters may be submerged by the inner river. In this case, a waterlogging disaster takes place in the city. (2) In another situation, the drainage system is oversized, and the stormwater passed by the stormwater systems of the whole city can successfully be drained into outer rivers, lakes or seas; thus, waterlogging disasters may not happen. Certain capabilities of the drainage system will never be used, which means the investment in the drainage system is excessive.
Intuitively, the security capability for urban waterlogging prevention can be strengthened by increasing the construction scale of either the stormwater system or drainage system, while a series of constraint factors like land condition, existing or planned buildings, topography and financial budgets limit the infinite promotion of system construction scales. Thus stakeholders tend to seek help from design combination optimization methods to balance the contradiction between waterlogging risk and investment budgets. The scope of design combination optimization is to determine the most suitable construction scales of urban stormwater and drainage systems under certain criteria and ensure coordination of the design scales. To this end, the lack of coordination throughout the design processes of stormwater and drainage systems should be explored; this mainly comes from two aspects. First, during the precipitation data sampling process, the Annual Multi-Sampling (AMS) method is recommended for stormwater systems while the Annual Maximum (AM) method is used for drainage systems, as ruled by each system’s respective design codes [7,8,9]. Hereafter in this paper, the default sampling method is AM, unless AMS is marked. Deng et al. [11] established the conversion formula between return periods (RP) calculated with AMS and AM methods, and revealed that for RPs less than 20 years, the design results obtained with AMS and AM methods have significant differences. The research of many others also presents similar conclusions [12,13,14]. Second, there remains the problem of how to consider the temporal dependence structure of different precipitation series in system design. Zhang et al. [12] derived the coordination relationship of stormwater and drainage systems based on Chicago rain patterns and statistical methods. Their results show that in order to cope with a storm of a certain magnitude, the design RP of drainage is about five times that of the stormwater system. Li and Xu [15] noticed that one of the most important problems leading to waterlogging disasters is that the drainage system fails to drain stormwater into outer river channels, and the stormwater system then cannot pass the stormwater fluently due to the backwater effect by high water levels of the inner river channel. They also discuss how to optimize the combination of stormwater and drainage system design standards. Chen et al. [16] proposed to establish a coordination relationship between stormwater and drainage systems with the help of the Storm Water Management Model (SWMM). Design storm processes with different durations were used as SWMM inputs. By matching the peak flow of the simulation stormflow hydrographs, the coordinate relationship between stormwater and drainage systems were described quantitatively. Yang et al. [17] calculated the risk rates of different design combinations of stormwater and drainage systems based on Bayesian theory. They found that in order to reduce investment and ensure waterlogging prevention capability at the same time, the multivariate risk rates should be appropriate to the design standard of drainage systems rather than stormwater systems. Chen et al. [18] used Copula theory to describe the temporal dependence between different precipitation series and obtained optimized design RPs of stormwater and drainage systems. However, the criterion for optimizing design combinations is not clear in previous studies. Most of the research fails to consider the problems of discrepancy in design codes and neglects temporal dependence, thus lacking practicability.
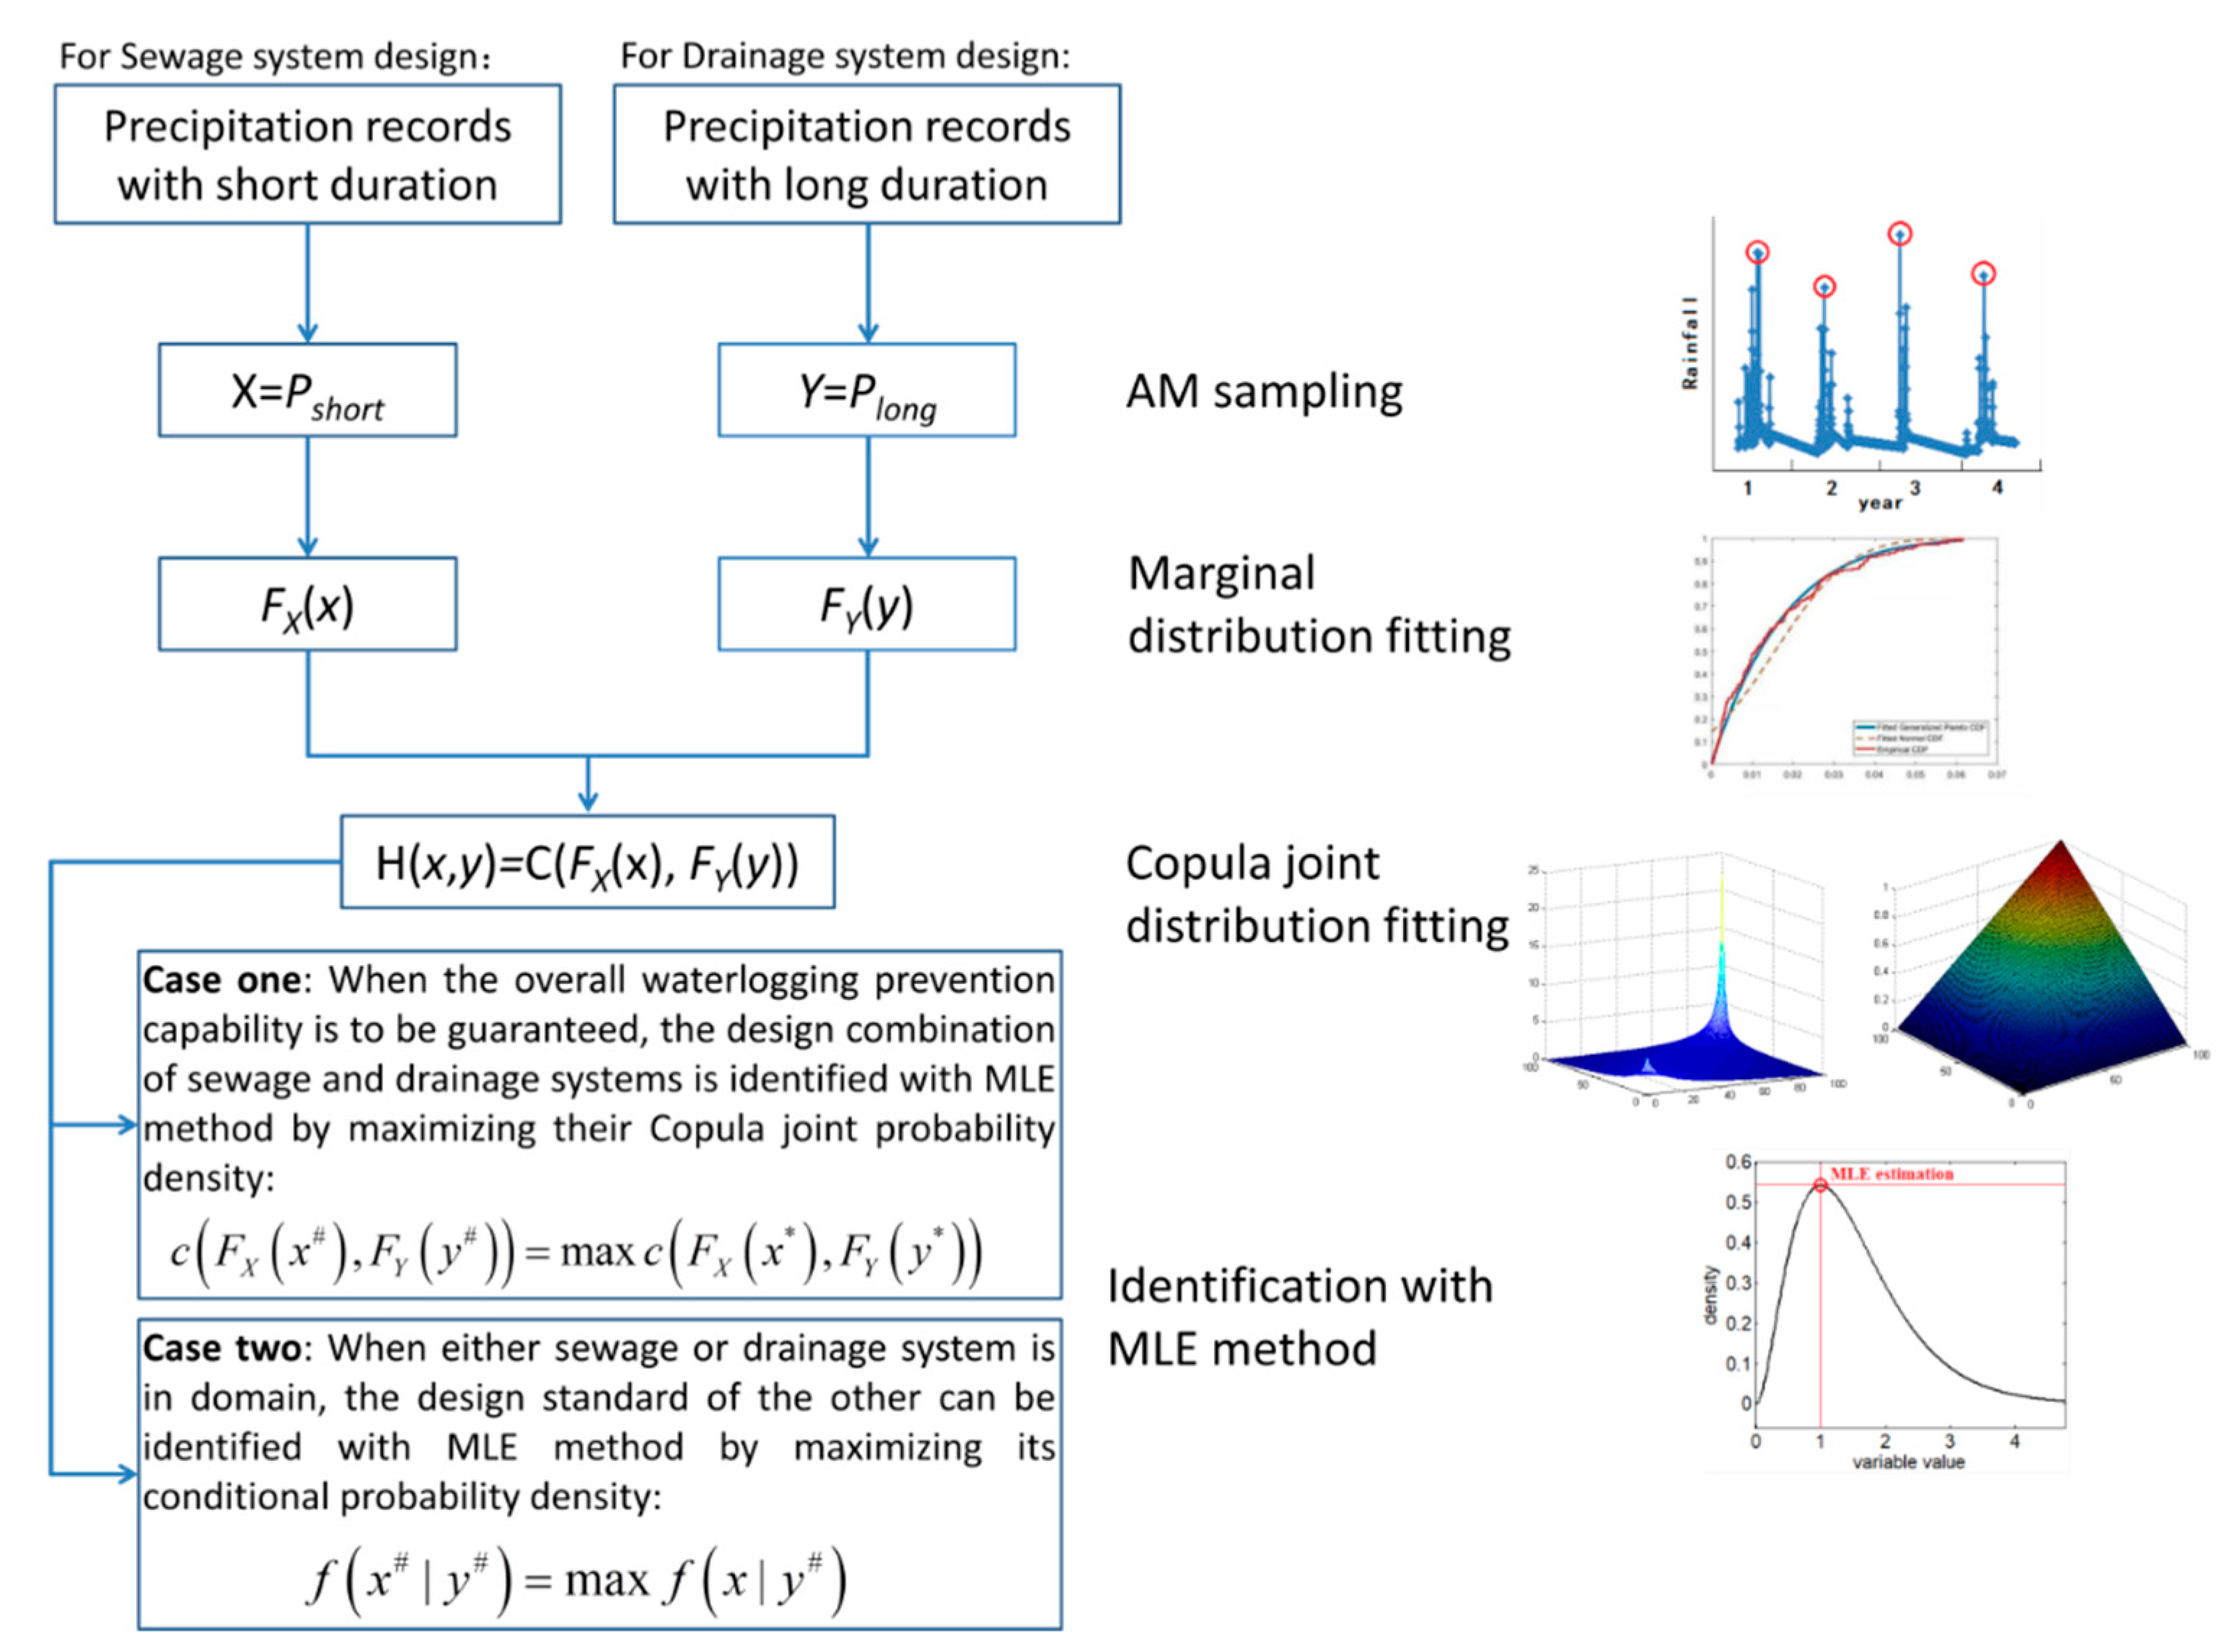
On the basis of the previous works, this research intends to propose a method for the bivariate design of urban stormwater systems and drainage systems and address the design incoordination caused by independent design processes and different design codes. Figure 2 shows the flowchart of the proposed method. First, marginal distributions of precipitation series with different durations are fitted. Then, joint distribution is established based on Copula theory to describe the temporal dependence between precipitation series with different durations. Subsequently, the design combination of urban stormwater and drainage systems is optimized under the Most-Likely Estimation (MLE) criterion. Two cities vulnerable to urban waterlogging disasters, i.e., Zhongshan and Zhuhai in South China, were selected to demonstrate the design combination optimization method. The remainder of this paper is as follows. Section 2 introduces the main methodologies used in this research. Section 3 provides information about the study area and data. Section 4 displays results and discussion, and Section 5 gives the main conclusions of this research.
2. Methodology
2.1. Copula Theory
Copula is a cluster of functions that connects multivariate probability distribution to one-dimensional marginal distributions [19]; it has been widely used in the fields of hydrology and risk analysis [20,21,22,23,24,25,26,27]. Conventional parametric multivariate probability distributions have many limitations, such as the assumption of a linear relation between the variables involved and that all the variables must follow the same marginal distribution [28], which restrict their application in hydrology field. A common adaptation is first conducting Gaussian transformation to variables and then using multi-dimensional normal distribution to describe the dependence structure of the transformed variables; however, this will not always work and may introduce additional errors during the transformation and reversion processes [29]. In comparison, the Copula function gives flexibility in choosing arbitrary marginal distributions and Copula joint functions.
According to Sklar’s theorem [30], the multivariate cumulative distribution function (CDF) can be obtained in terms of the marginal distributions of the variables and the associated dependence function:
where denotes the n-dimensional CDF of Xi, i = 1,2,…,n; Fi(xi) denotes the marginal CDF of Xi, i = 1,2,…,n; Cn(·) denotes the Copula function, which is uniquely selected whenever Fi(xi) are continuous and should be able to capture the essential features of the dependence structure of the random variables.
To describe the correlation structures between precipitation series with different durations, e.g., P1 h and P12 h, a bivariate Copula is sufficient, which can be expressed as
where X denotes precipitation with short duration and Y denotes precipitation with long duration; u = FX(x) and v = FY(y) denote the marginal CDF of x and y, respectively.
It is obvious from the expression of Copula in Equations (1) and (2) that the construction of multivariate CDF can be divided into two separate steps, i.e., (1) determining the marginal probability distribution of each variable and (2) selecting the Copula joint function for dependence structure. According to the regulation for calculating the flood design of water resources and hydropower projects (SL44-2006) [31], the Pearson Type-III (P3) distribution is recommended for precipitation series. In addition, the Generalized Extreme Value (GEV) and Log-Normal (LN) distributions are also widely used as precipitation probability distribution in many works [32,33,34,35]. Thus P3, GEV and LN distributions are selected as marginal distribution candidates for precipitation series in this study. Table 1 provides information on these distributions. For the Copula joint function, the three most widely used one-parameter Archimedean Copula distributions include the Gumbel, Frank and Clayton copulas [30]; these are selected as candidates. These three copulas can describe a wide range of hydrologic processes and are used in many relevant works [29,36,37,38,39]. Information on these copulas and their parameter θ estimated by the Kendall correlation coefficient τ are listed in Table 2. τ is estimated using the following formula:
where n is the length of X and Y; sign (·) is a symbolic function, which is 1 when its argument is positive, 0 when its argument is 0 and −1 when its argument is negative.
Though Copula theory has been used in many fields of hydrology, there are very few applications in the coordinate design combination of urban stormwater and drainage systems, with the exceptions of Chen et al. [18] and Wang et al. [40]. Chen et al. [18] proposed a method based on Copula to derive a proper design combination of stormwater and drainage systems. However, their research ignored the fact that different Copula joint functions are suitable for different dependence structures due to their tail features, which can significantly affect the design values of long RPs. In addition, in practice, the determination of the security capability against urban waterlogging is usually officially dominated by a single department, which means if the water conservancy department is dominant, the drainage system design standard is determined first, and the stormwater system design standard is determined based on this. This highlights the importance of deriving sufficient conditional design values, which is not discussed in the work of Chen et al. [18]. Wang et al. [40] constructed a 3D Copula-based model to evaluate the rationality of rainfall spatial distribution in Tai Lake Basin. However, their research failed to propose objective criteria for optimizing the rationality of the design schemes, which restricts its application.
2.2. Goodness-of-Fit Evaluation
Goodness-of-fit evaluation is necessary for determining marginal distributions. Relevant research have proven that no single indicator can give objective evaluation results; thus, different test criteria are used in this paper. Root mean square error (RMSE) is amongst the most popular and useful goodness-of-fit statistics [41], which can be expressed as
where denote the theoretical and empirical CDF values of the ith sample, respectively, i = 1,2,…,n; n is the data length. The RMSE is a negative-oriented indicator, which means a smaller RMSE indicates better distribution fitness. The RMSE of CDF ranges from 0 to 1.
The empirical CDFs of marginal distribution in Equation (4) can be calculated using the expectation formula, as follows:
where I (·) is the indicator function; when the condition inside the brackets is satisfied its value is 1, otherwise it is 0.
The Kolmogorov–Smirnov (KS) test is a non-parametric goodness-of-fit method that can be applied to determine whether data samples X follow the hypothesized, continuous, cumulative distribution function [36]. The KS test static Dn is the maximum absolute difference between the empirical distribution and the hypothesized probability distribution [42] and can be expressed as
where Fn(x) is the empirical distribution function of data samples, which can be estimated by Equation (5); F(x) is the hypothesized distribution or theoretical distribution. The distribution leading to the smallest Dn is preferred.
Given the significance level α, the critical value Dn,α for the KS test can be obtained. The KS test determines whether the hypothesized distribution is accepted by comparing Dn and Dn,α. When Dn is smaller than or equal to Dn,α, then the hypothesized distribution cannot be rejected. Otherwise, the hypothesized distribution is rejected by the KS test. In this research, the significance level α is set to be 10%; thus, Dn,α can be estimated by the following equation:
The Akaike Information Criterion statistic AIC [43] not only considers the goodness-of-fit but also avoids overfitting and unreliability with too many model parameters. It has been widely applied in distribution goodness-of-fit evaluation [19,44,45,46]. AIC can be expressed as follows [36]:
where n is the data length; k is the number of distribution parameters, which is 1 for one-parameter Archimedean copula functions. The distribution leading to the minimum AIC value should be selected.
2.3. Bivariate Return Period
The traditional definition of RP is “the average time elapsing between two successive realizations of a prescribed event”, which is widely used and accepted in the hydrology field for the identification of dangerous events and gives reference for formulating prevention strategies [47,48]. As for bivariate cases, the RP of a critical event should be defined considering both variables, which is specifically referred as the Bivariate Return Period (BRP) [49]. The “OR” return period (BRPOR) and “AND” return period (BRPAND) are the most widely used definitions for BRP, which can be expressed with the help of the Copula distribution, as follows:
- (1)
- BRPOR: , i.e., one of the components exceeds the design thresholds.
- (2)
- BRPAND: , i.e., all of the components exceed the design thresholds.
Recently, some researchers have indicated that BRPOR and BRPAND have inherent shortages. As demonstrated by Salvadori et al. [50], these two BRPs are incoherent tools for dealing with multivariate RPs, since different design combinations that have the same joint probability lead to different subcritical or safe areas, which is incorrect from the perspective of measurement theory. They proposed to bypass the inconsistency problem with Kendall’s measure KC and Kendall’s Return Period (BRPK), which is defined as follows:
where t is the Copula joint CDF value; is the Copula generator, which varies with different Copula joint functions, as shown in Table 2.
2.4. Design Combination Optimization Method
The design combination optimization of urban stormwater and drainage systems is a multivariate design problem. Since the combinations of variables leading to same joint probability are countless, the selection of design combination is usually subjective [5,18,47]. Chebana and Ouarda [51] pointed out that the different likelihood of each combination makes it possible to identify the most appropriate design result, which provides a principle for multivariate design combination optimization. Therefore, the Most-Likely Estimation (MLE) method is used to optimize the design combinations of urban stormwater and drainage systems [47,52]. The essence of the MLE method is straightforward in that the multivariate design realization that satisfies the artificial demands of stakeholders and has the largest joint probability density should be selected. The MLE method can provide a useful approach for multivariate design because it avoids arbitrary selection, which strongly relies on the designer’s experience and satisfies the instinctive need in design work that the most possible and risky event should be the focus.
The wo design processes that are most widely applied for urban stormwater and drainage systems have different optimization schemes. For scheme one, both the stormwater and drainage systems have generally equal importance. The overall waterlogging prevention capability of the city is determined first, in the form of multivariate RP. For scheme two, either the stormwater system or drainage system is more important than the other in the stakeholder’s mind. In this case, first, the design scale of the more concerned system is determined according to its design code. Subsequently, the design scale of the other system is optimized under the condition of the former system scale using the MLE method. The specific steps of design combination optimization schemes for both cases are given in detail as follows.
Scheme one: Supposing the security capability for urban waterlogging prevention is once-in-n-years, all the possible design combinations of stormwater and drainage systems that have joint probability contributing to the given BRP can be derived by solving the following equation:
where BRP (·) is the BRP function with joint probability as input, which varies with the BRP type as illustrated in Section 2.3; C (·) is the Copula joint CDF of X and Y.
Subsequently, the design combination is optimally selected by MLE method. That is, the design combination having the largest joint probability density should be selected:
Scheme two: When either the stormwater system or drainage system is more concerned, e.g., the design RP of stormwater system is set to be once-in-n-years, the conditional probability density of drainage system design precipitation x can be expressed as
where y# is the design precipitation of the stormwater system with an n-year RP. Based on the MLE method, the design precipitation of the drainage system x# can be optimally selected as follows:
The design precipitation of stormwater system y# conditioned on certain design precipitation of drainage system x# can be analogously obtained when the drainage system is more concerned.
3. Study Area and Data
3.1. Study Area
Zhongshan and Zhuhai, located in the Pearl River Delta area in South China, were selected as the study areas of this research; they are displayed in Figure 3 with a topology layer. Both cities are listed in the Outline Development Plan for the Guangdong-Hongkong-Macao Greater Bay Area [53] as important hub cities and thus have significant strategic roles in China. Zhongshan and Zhuhai are economically developed regions, with a total population of 4.41 million and 2.44 million at the end of 2021, respectively. The land areas of Zhongshan and Zhuhai are 1784 km2 and 1736 km2, respectively. Both cities have long suffered from waterlogging disasters at the cost of huge economic loss, social unsteadiness and casualties. The origins of waterlogging in Zhongshan and Zhuhai are comprehensive. From a meteorological perspective, storm events occur frequently in the study area. Take Zhuhai as an example, its annual average wet days are over 130 days, and the rainfall of the flood season (April and May) accounts for more than 30%, with frequent high-intensity and short-duration storm events. Moreover, when storm events encounter floods from the upper Pearl River basin or high tide at the estuary, the lockup effect due to high water levels of the river channels makes it difficult for drainage and leads to waterlogging. The relative low elevation of the study areas strengthens the possibility of the lockup effect and puts forward higher requirements for stormwater and drainage systems. In addition, rapid urbanization has changed the characteristics of runoff and confluence in the study areas, where rainfall now yields more runoff and stormwater converges faster than before, which increases the potential hazard of waterlogging disasters. In order to handle the increasing waterlogging risks, sustainable urban drainage systems (SUDS) have been developed to store, attenuate and treat surface water through infiltration processes and thus can help reduce surface runoff and urban flooding. SUDS have provided sufficient tools for urban waterlogging prevention and have had successful applications in many cities [54,55,56].
The existing stormwater and drainage systems of Zhongshan and Zhuhai were constructed in last century. With the reconstruction projects during recent years, the wastewater engineering in the two cities generally works in separate modes, i.e., stormwater and wastewater are collected by different sewer systems. The stormwater passing through stormwater systems is transported through inner river channels to the Xijiang River, to the mainstream of the Pearl River, and finally flows into the South China Sea. However, due to rapid urbanization, climate change and aging of the systems, the security capability for waterlogging prevention of the two cities can no longer meet the demands under current conditions. Recently, the governments of Zhongshan and Zhuhai realized that the backward stormwater and drainage systems have hindered urban sustainable development and published plans for urban waterlogging prevention in 2015, which propose to make comprehensive use of engineering and non-engineering measures to solve the waterlogging problem, with construction and improvement of stormwater and drainage systems listed as key tasks. Design combinations of urban stormwater and drainage systems are very important parameters for determining system construction scales and thus must be carefully considered. Therefore, the proposed optimization method is applied in Zhongshan and Zhuhai. Based on the optimization results, rationality analysis is conducted to validate the planned design RPs for the Sponge City Plans of both cities.
3.2. Data and Sampling Method
The raw data used in this research include hourly precipitation series of Zhongshan and Zhuhai rain stations from 1962 to 2010. The data are provided by the Pearl River Water Resources Commission (PRWRC) and have gone through strict quality control procedures.
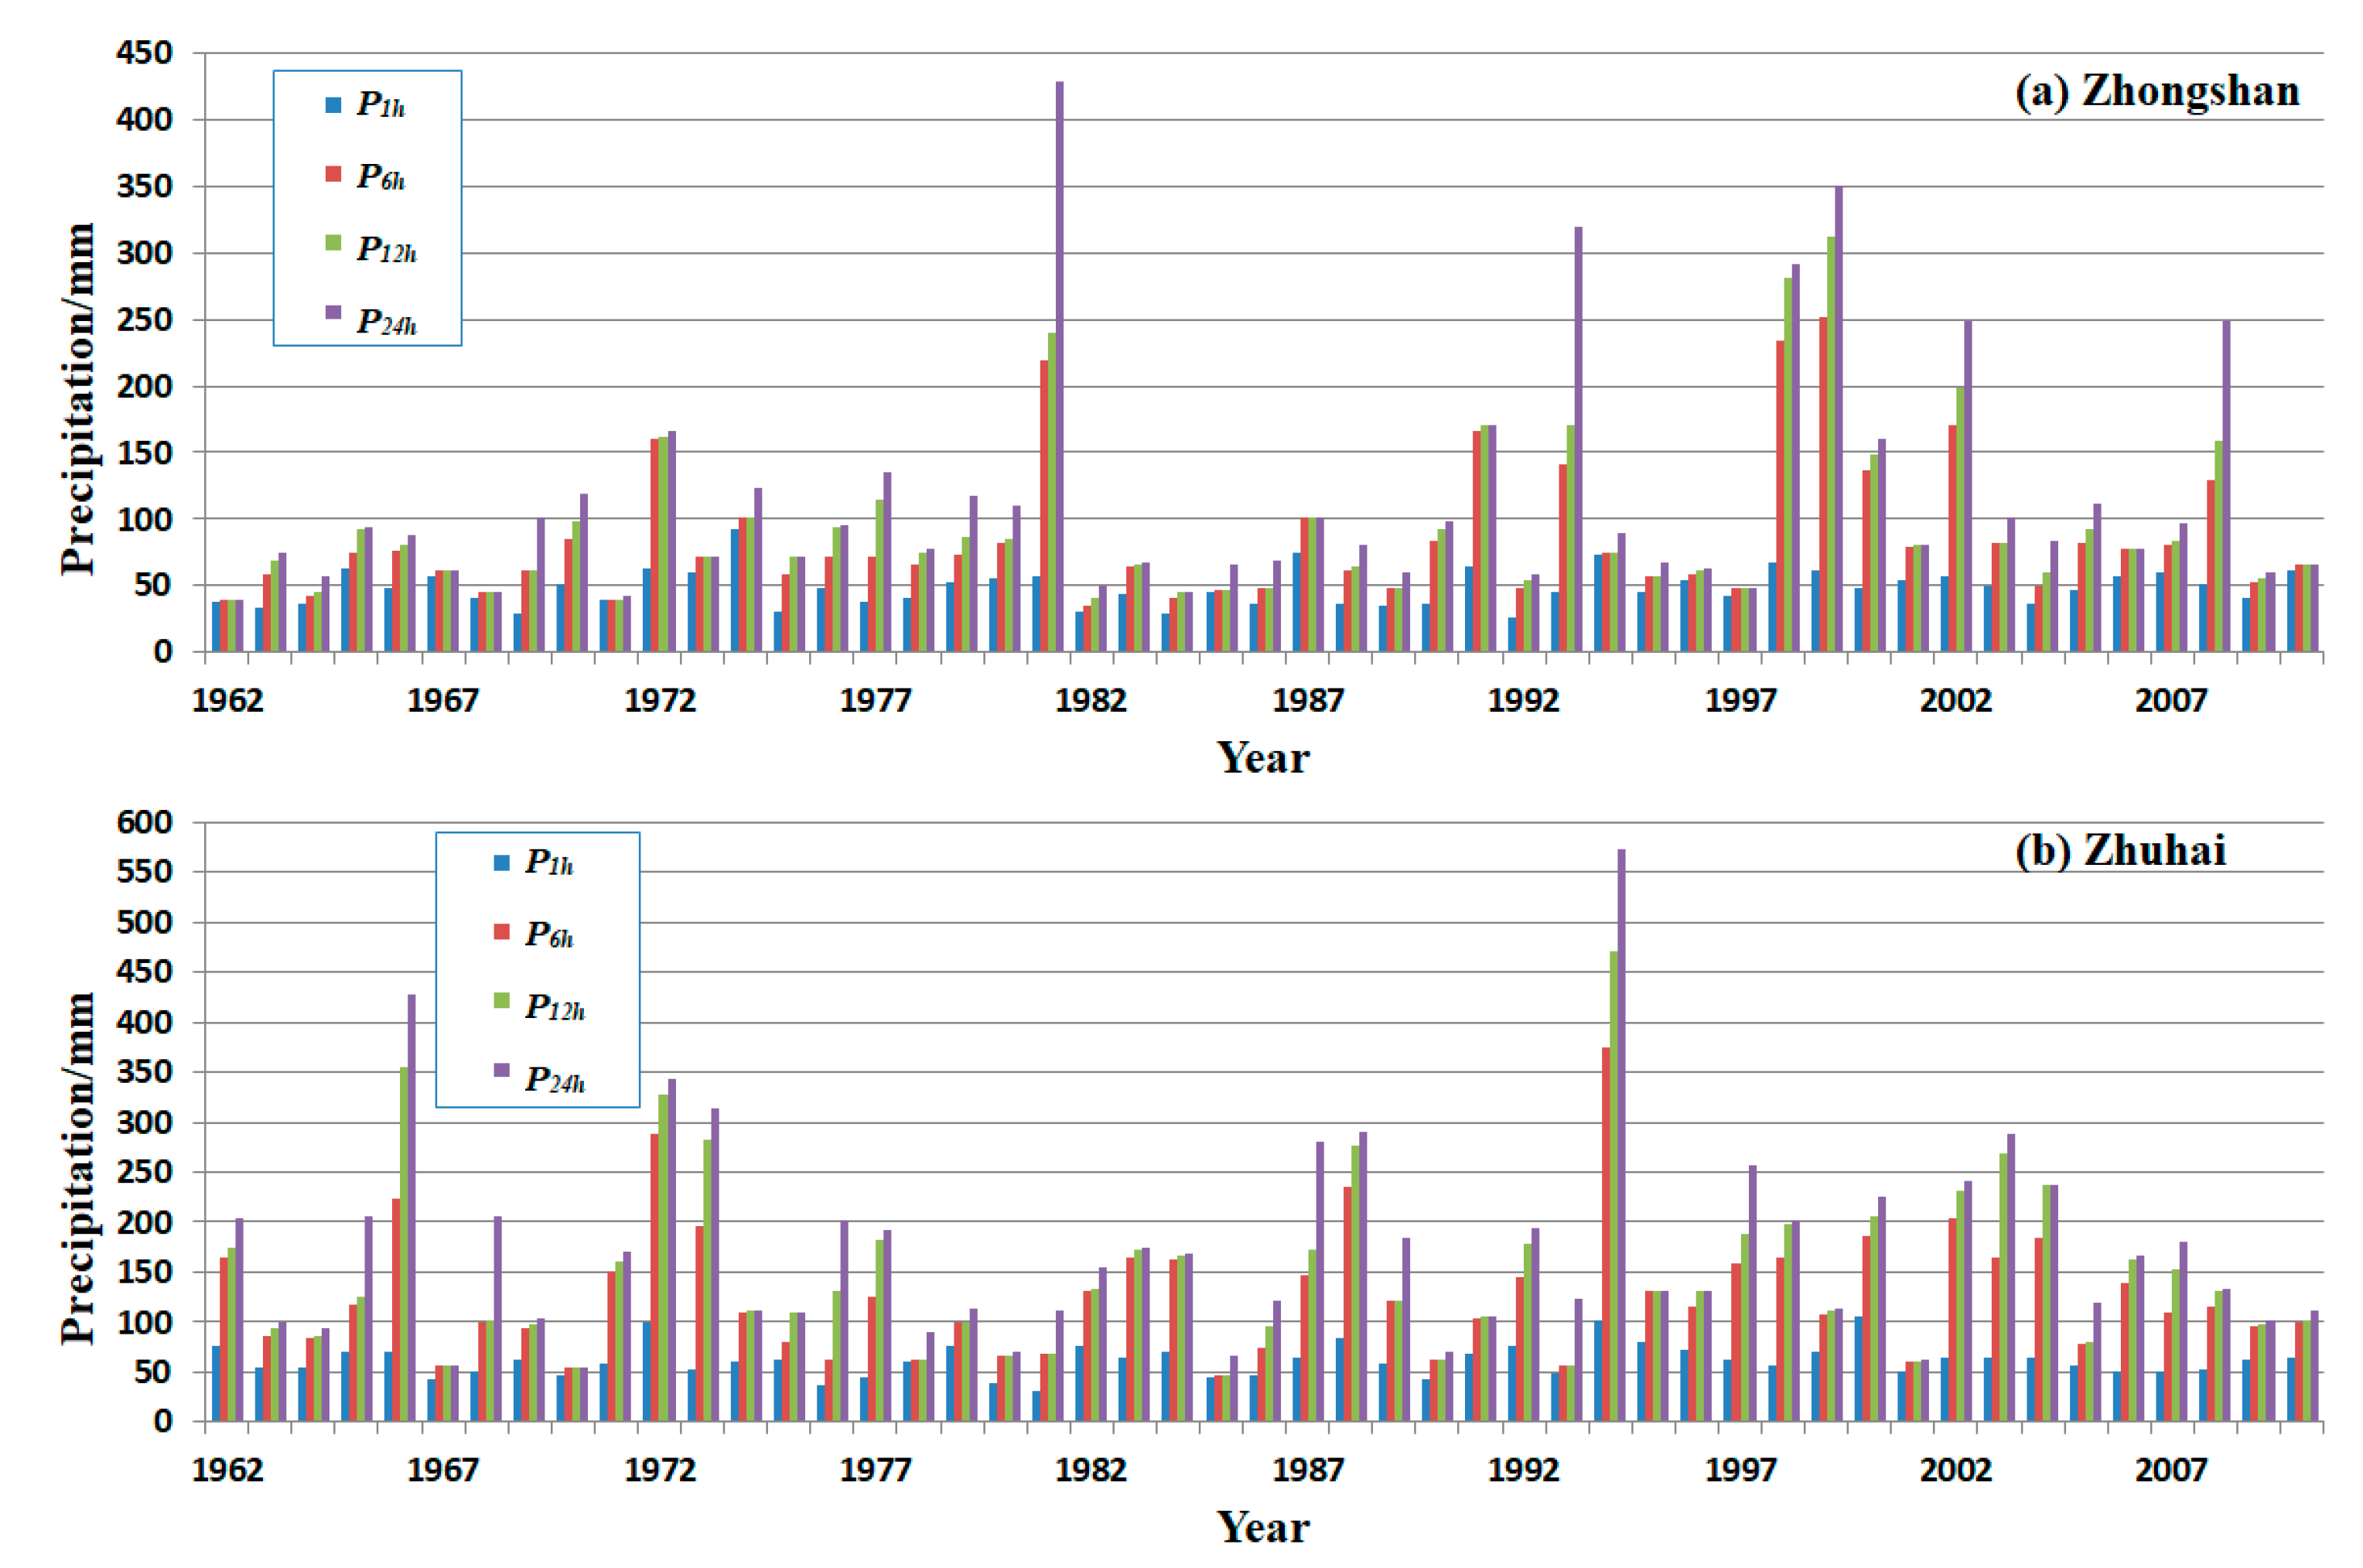
According to the design codes, when rain record length exceeds 20 years, the AM method is recommended for data sampling. In this research, annual maximum 1 h precipitation (i.e., P1 h) samples were used to derive the design standard of the stormwater system, and the corresponding maximum 6 h, 12 h and 24 h precipitation (i.e., P6 h, P12 h and P24 h) samples from the same storm events of P1 h were used to derive the design standard of the drainage system. The rationality that precipitation samples with different durations should come from the same storm events is that temporal dependence structure is vital for the design combination of stormwater and drainage systems. The temporal distributions of precipitation samples are shown in Figure 4. It can be seen from Figure 4 that extreme storm events have occurred occasionally since the 1960s. The extreme storm events of the two cities are intuitively asynchronous, despite the two cities being geographically proximal.
4. Result Analysis
4.1. Marginal Distribution
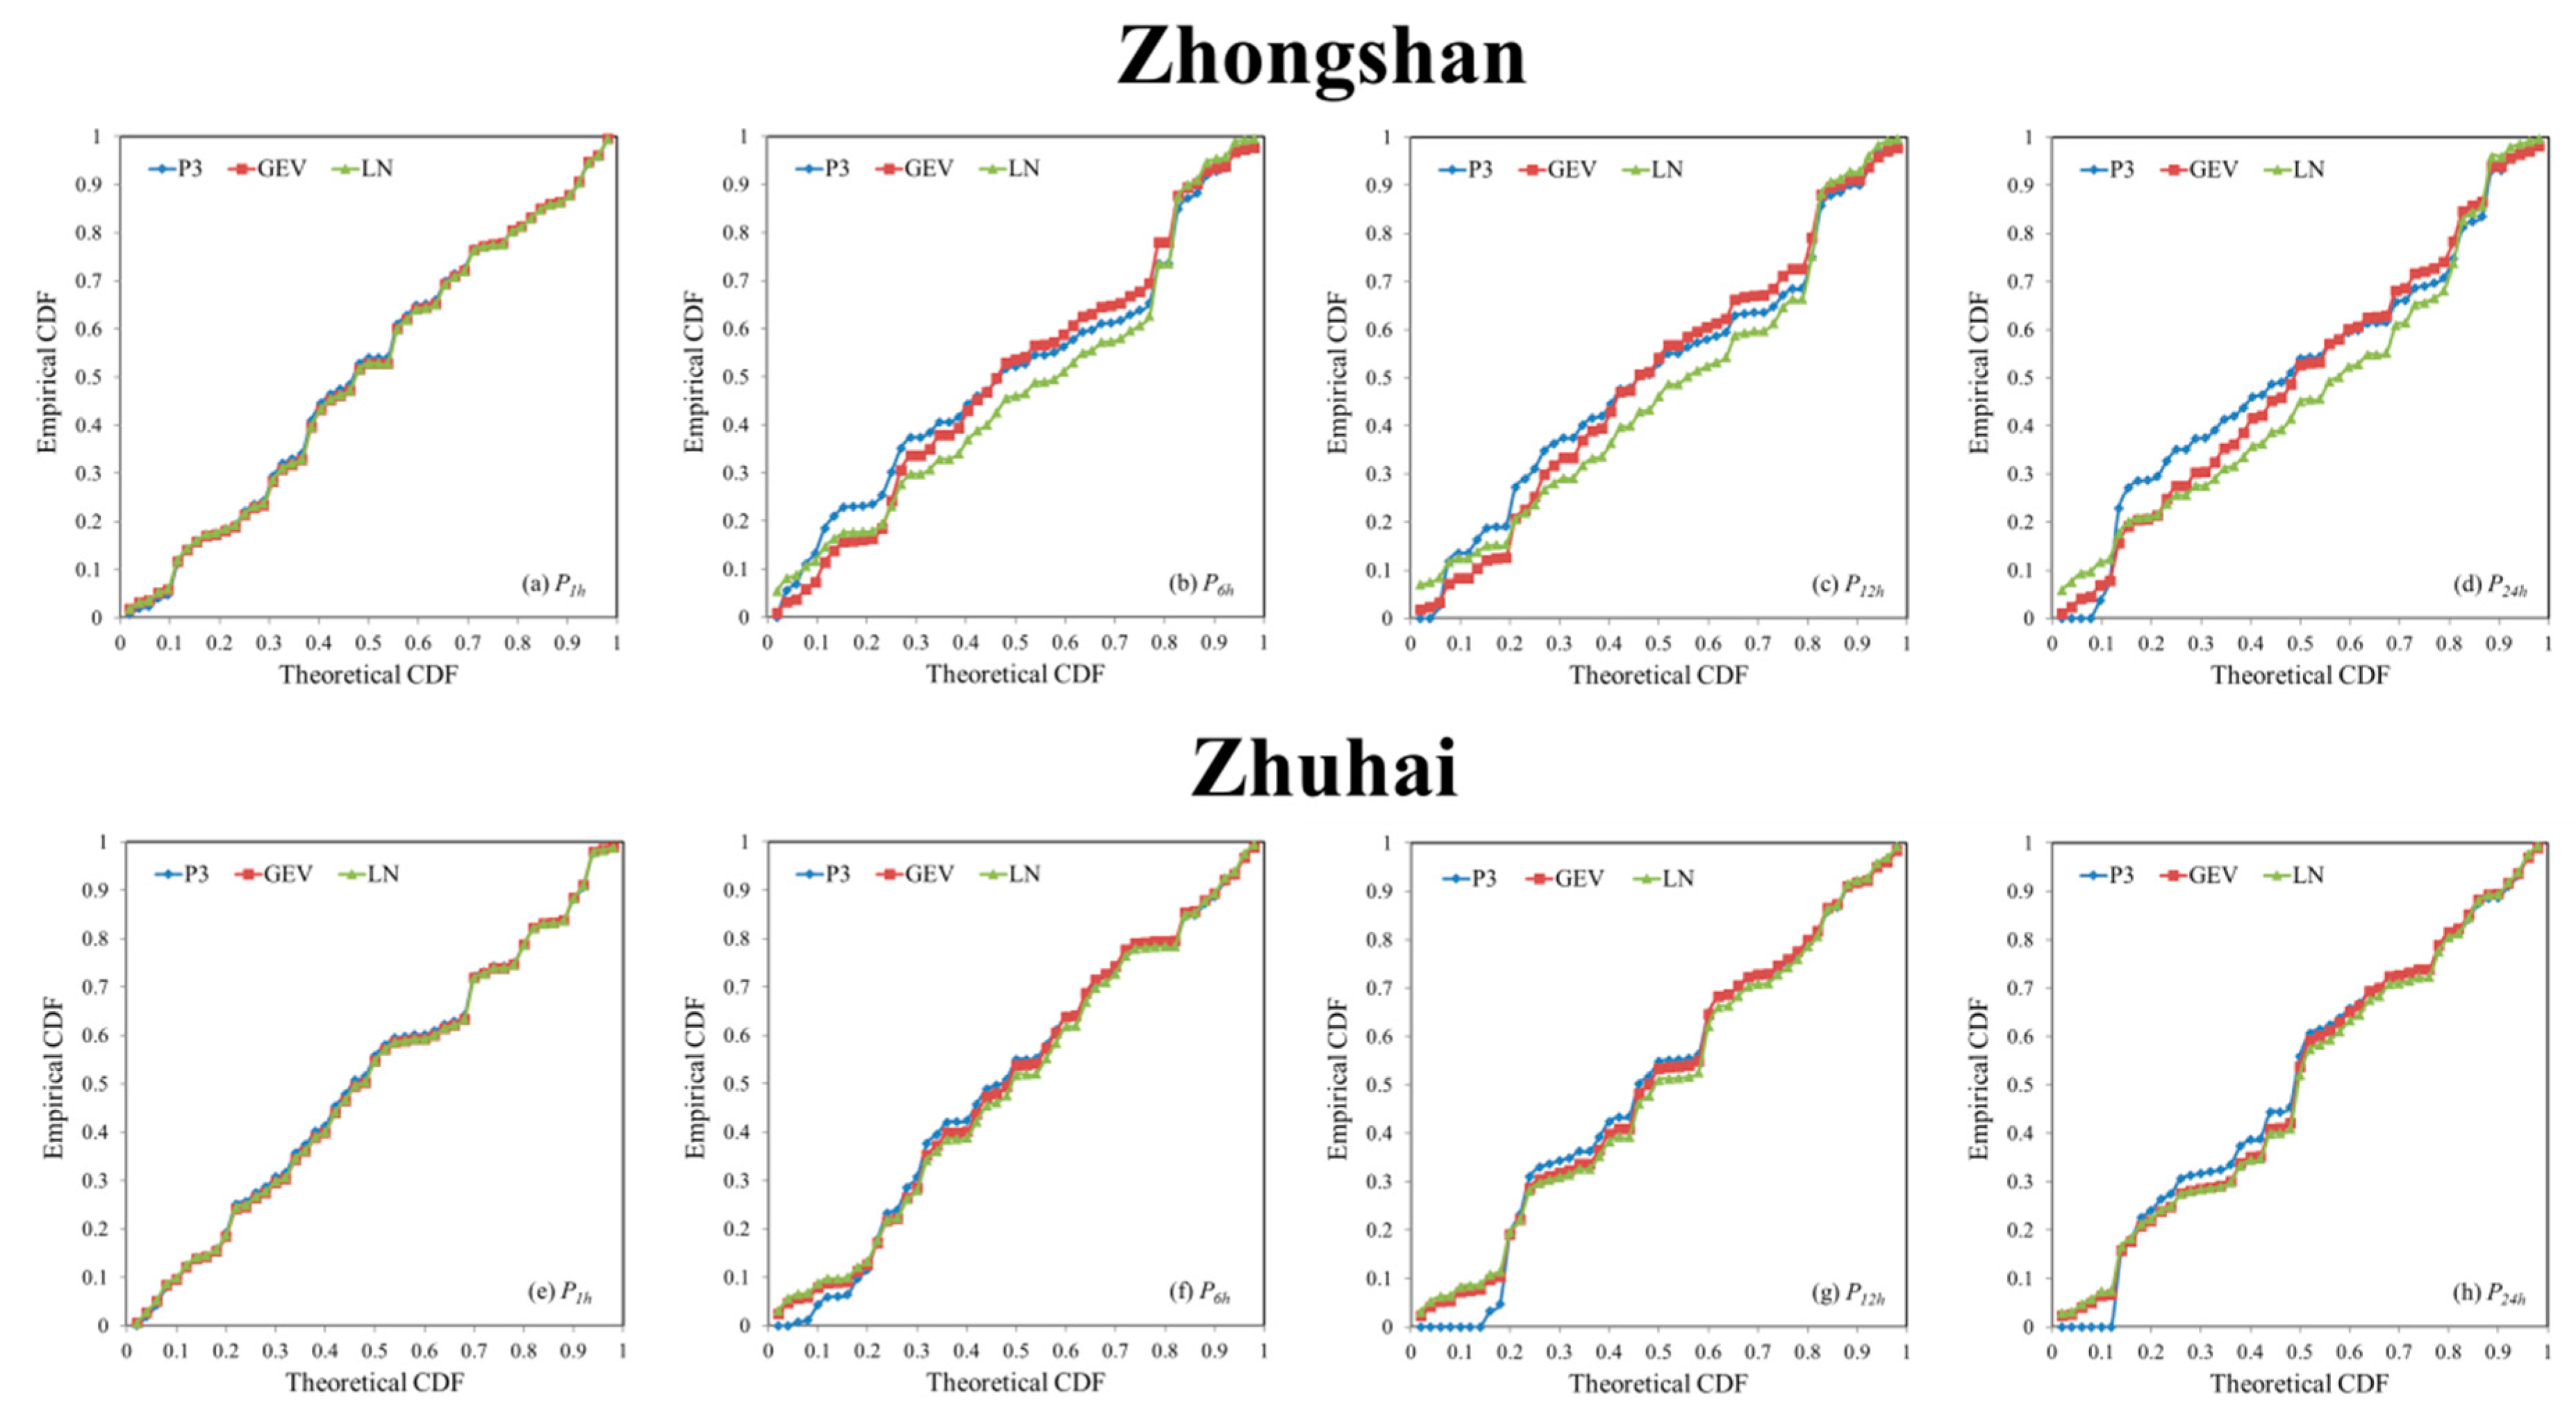
Table 3 shows the fitting results of different evaluation indicators, and Figure 5 shows the Q-Q plots of different marginal distributions. It can be seen from Table 3 that at the 10% significance level, all three alternative distributions pass the KS test, since their Dn values are smaller than the given threshold. Furthermore, based on the analysis of RMSE and AIC, the GEV distribution was found to have the smallest RMSE and AIC values for Zhongshan, while the LN distribution had the smallest RMSE and AIC values for Zhuhai station. Therefore, GEV distribution and LN distribution were selected to fit the marginal distributions of precipitation series in Zhongshan and Zhuhai station, respectively. It is worth noting that the P3 distribution recommended by the design codes does not have the best performance for either meteorological station.
4.2. Copula Joint Distribution
After the marginal distributions were fitted, the Copula bivariate functions between P1 h and the other three precipitation series (i.e., P6 h, P12 h and P24 h) were constructed with three different Archimedean Copulas. Table 4 shows the correlation coefficients between the different precipitation series. The goodness-of-fit results of the Copula functions and estimated Copula parameters are displayed in Table 5. The KS test results reveal that Gumbel, Frank and Clayton Copula distributions cannot be rejected at the 10% significance level for P1 h, P6 h, P12 h or P24 h of the Zhongshan and Zhuhai stations.
As for the three goodness-of-fit statistics, the results in Table 4 show obvious inconsistent evaluation performances for different Copula functions. The RMSE values indicate that Frank (Frank), Clayton (Frank) and Frank (Gumbel) Copulas should be selected for P1 h~6 h, P1 h~12 h and P1 h~24 h bivariate distribution constructions for Zhongshan (Zhuhai), respectively. While based on the KS statistic Dn, the results indicate that Clayton (Gumbel), Clayton (Gumbel) and Clayton (Frank) Copulas should be selected for P1 h~6 h, P1 h~12 h and P1 h~24 h bivariate distribution constructions for Zhongshan (Zhuhai), respectively. The evaluation results of AIC are also different, which indicate that Frank (Frank), Clayton (Gumbel) and Frank (Frank) Copula should be selected for P1 h~6 h, P1 h~12 h and P1 h~24 h bivariate distribution construction for Zhongshan (Zhuhai) city, respectively. In conclusion, the evaluation statistics fail to distinguish the ability of describing dependence structures using different Copula functions. Recently, Nguyen and Jayakumar [57] established a method for bivariate Copula selection based on the tail dependence test. Their research indicates that huge differences exist in the joint RP estimation using the families of extreme value Copulas and no upper tail Copulas (e.g., Frank and Clayton) if there is asymptotic dependence between the two variables. While Frank and Clayton Copula functions are not able to describe upper tail dependence, the Gumbel Copula is an upper tail–dependent Copula function. Considering the upper tail dependence structure is very important for the design combination of urban stormwater and drainage systems, especially for large RPs and sensitivity to high distribution quantiles, the Gumbel Copula was selected for further investigation.
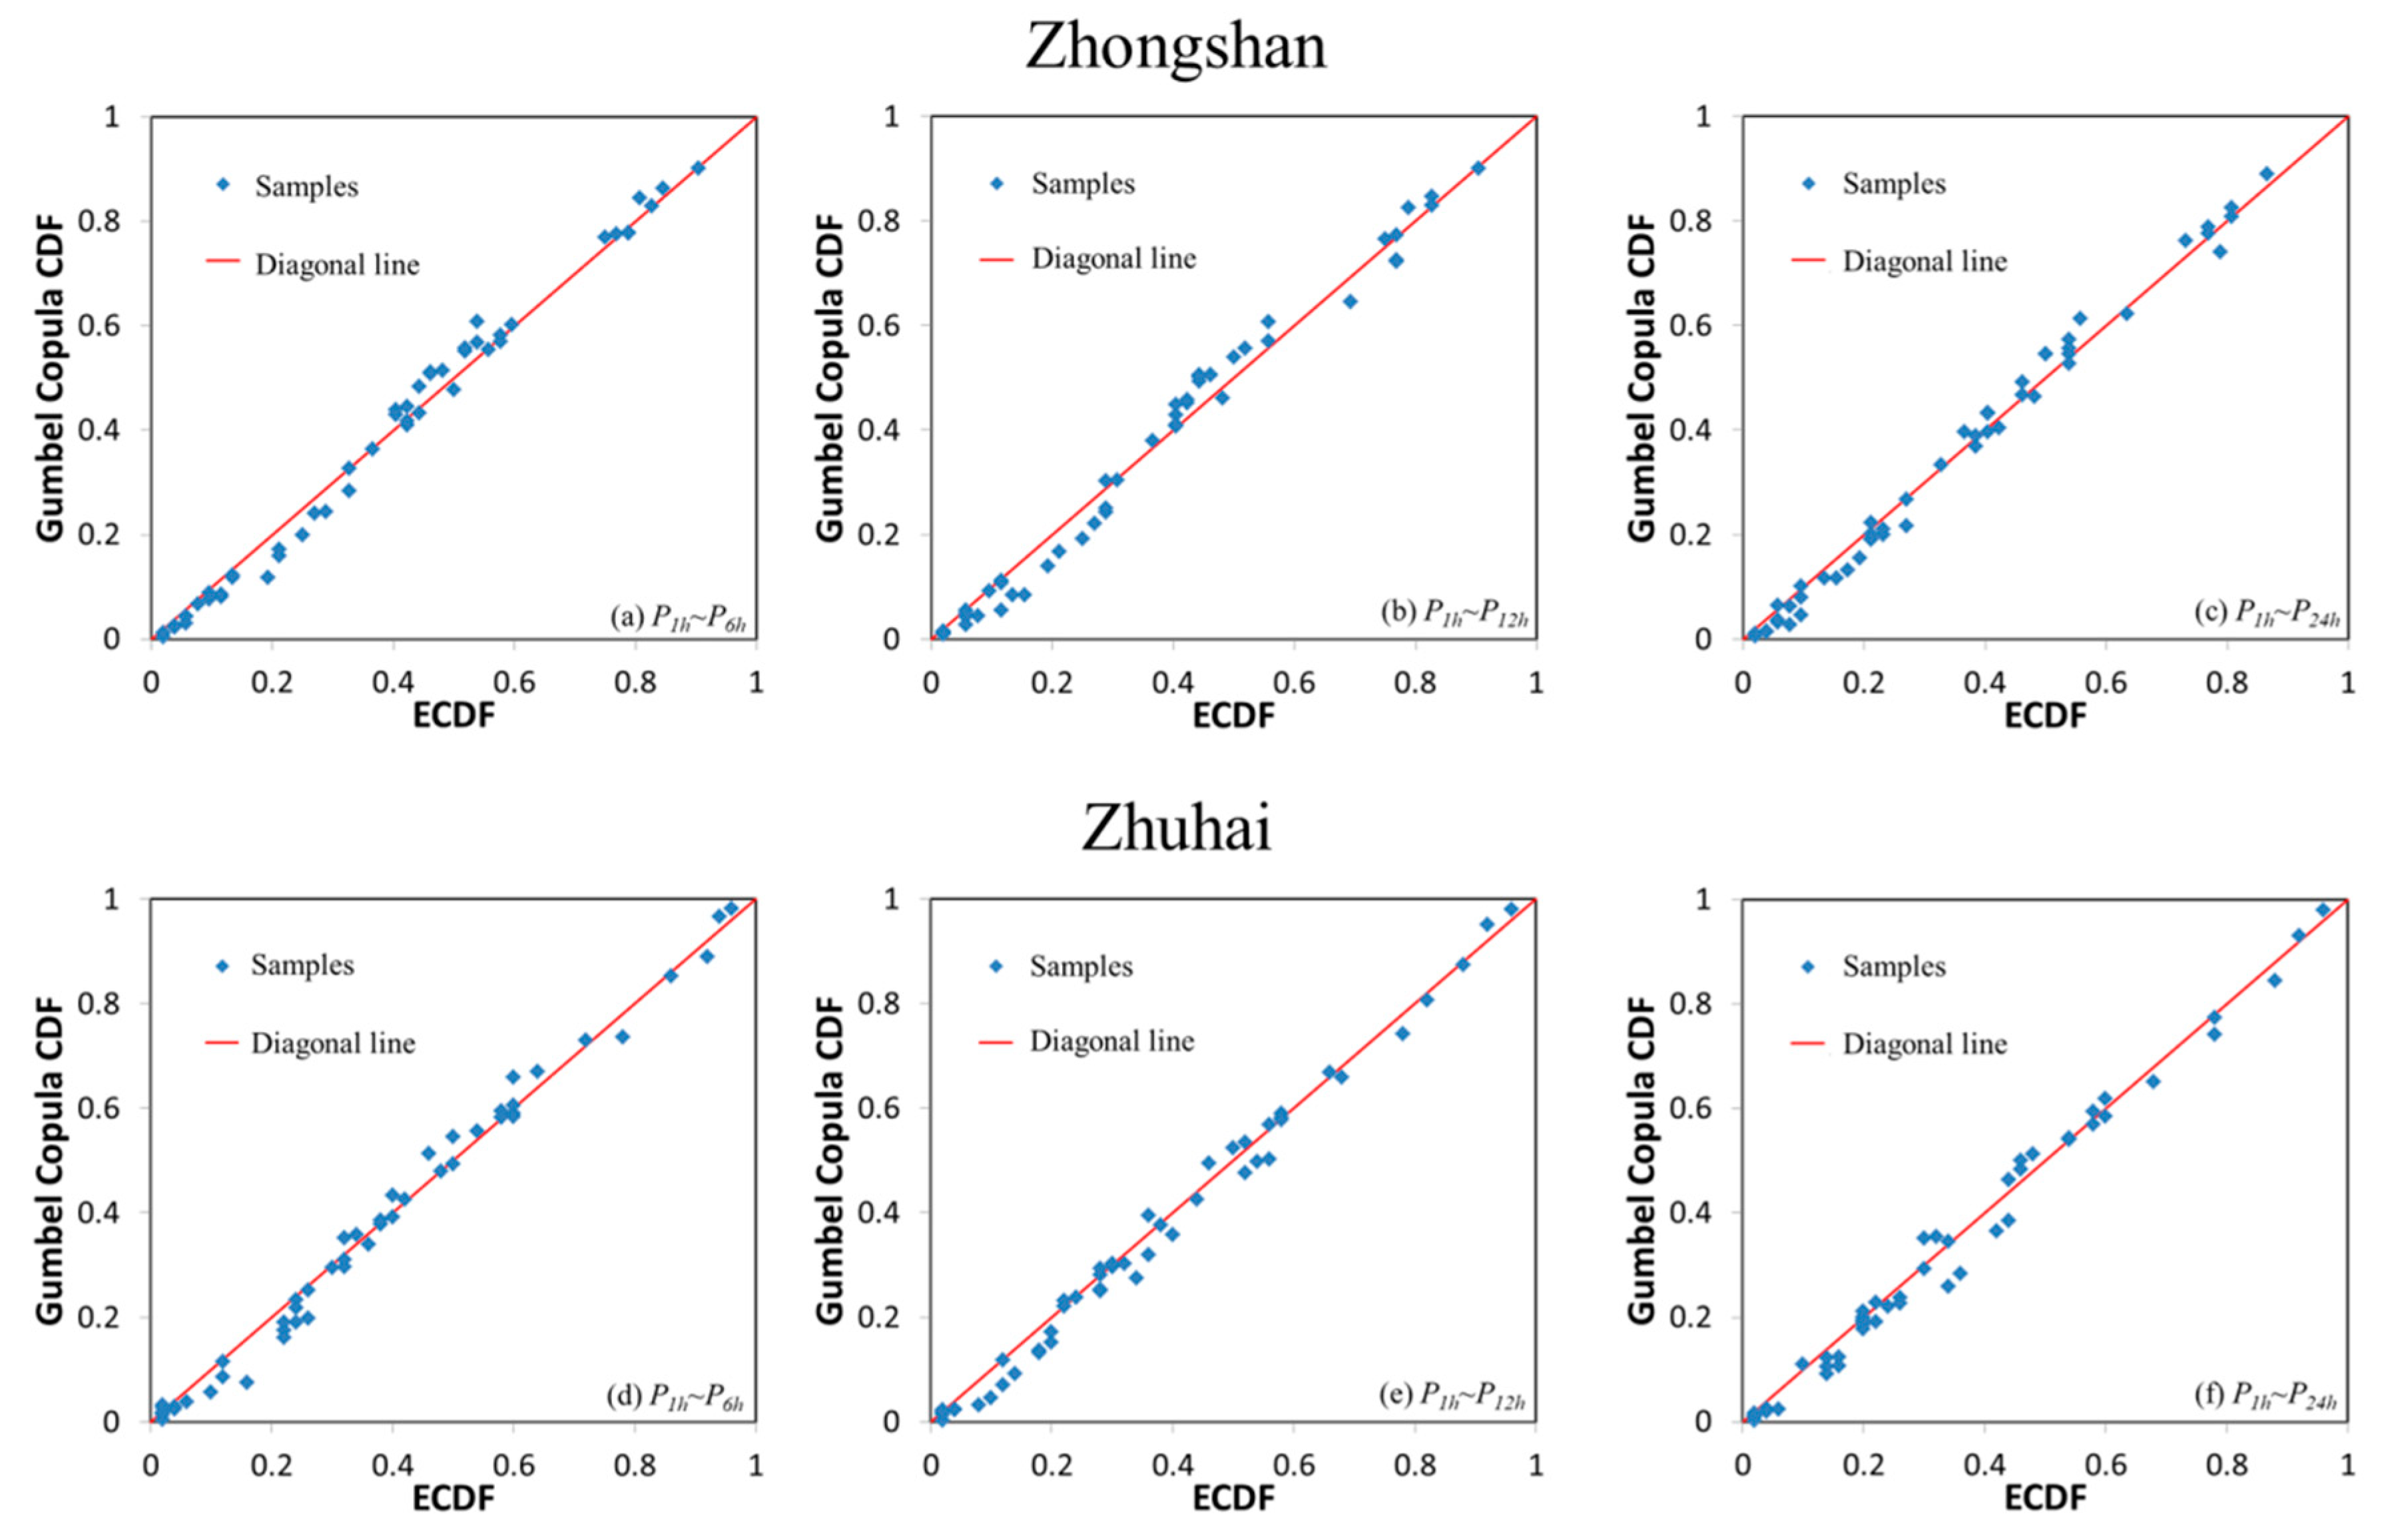
Figure 6 displays the Q-Q plots of the Gumbel Copula CDF values and bivariate empirical CDF values for P1 h~6 h, P1 h~12 h and P1 h~24 h. Ideally, the two CDF series will be equal, and thus the Q-Q curves are 1:1 diagonal straight lines. The RMSE values of the Gumbel Copula in Table 5 are quite small and represent the deviation of Gumbel Copula CDF curves from 1:1 line; thus, the constructed Copula distributions have good fitting efficiencies. The results in Figure 6 also indicate that Q-Q curves are close to the diagonal straight lines. It can be concluded that the Gumbel Copula distributions can well describe the dependence structures of different precipitation combinations and provide the bases for optimizing the design combinations of urban stormwater and drainage systems.
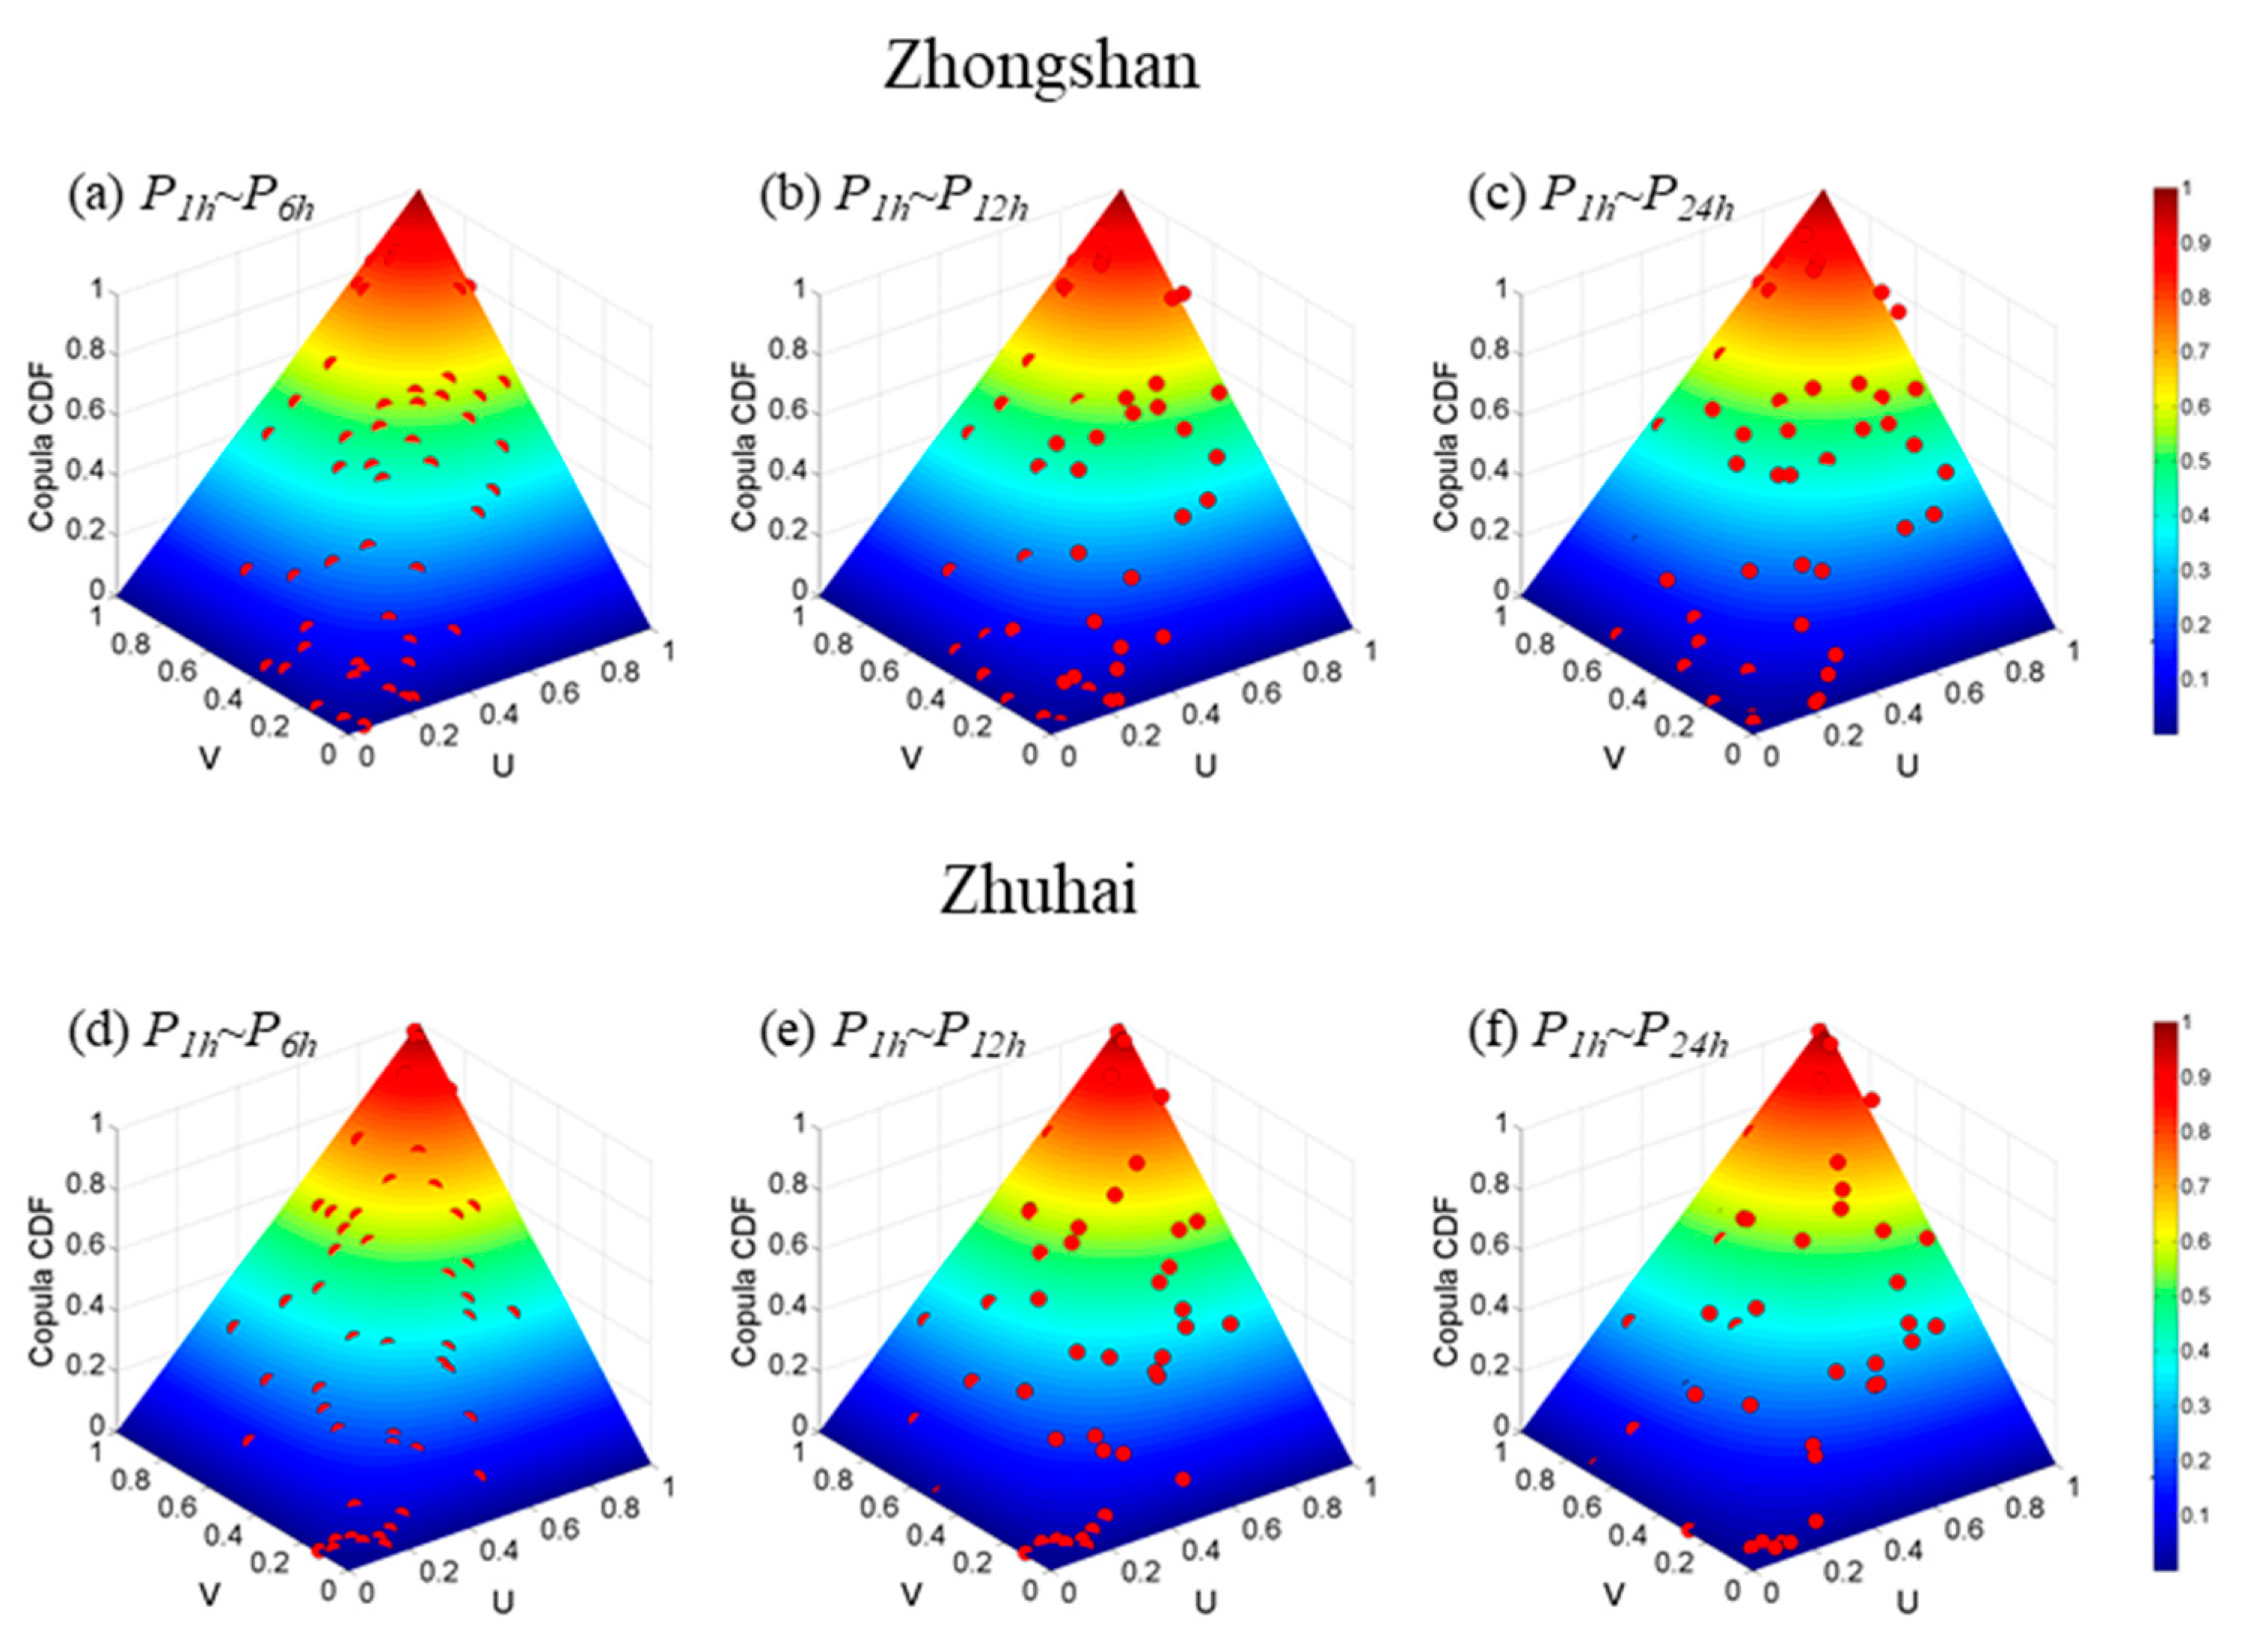
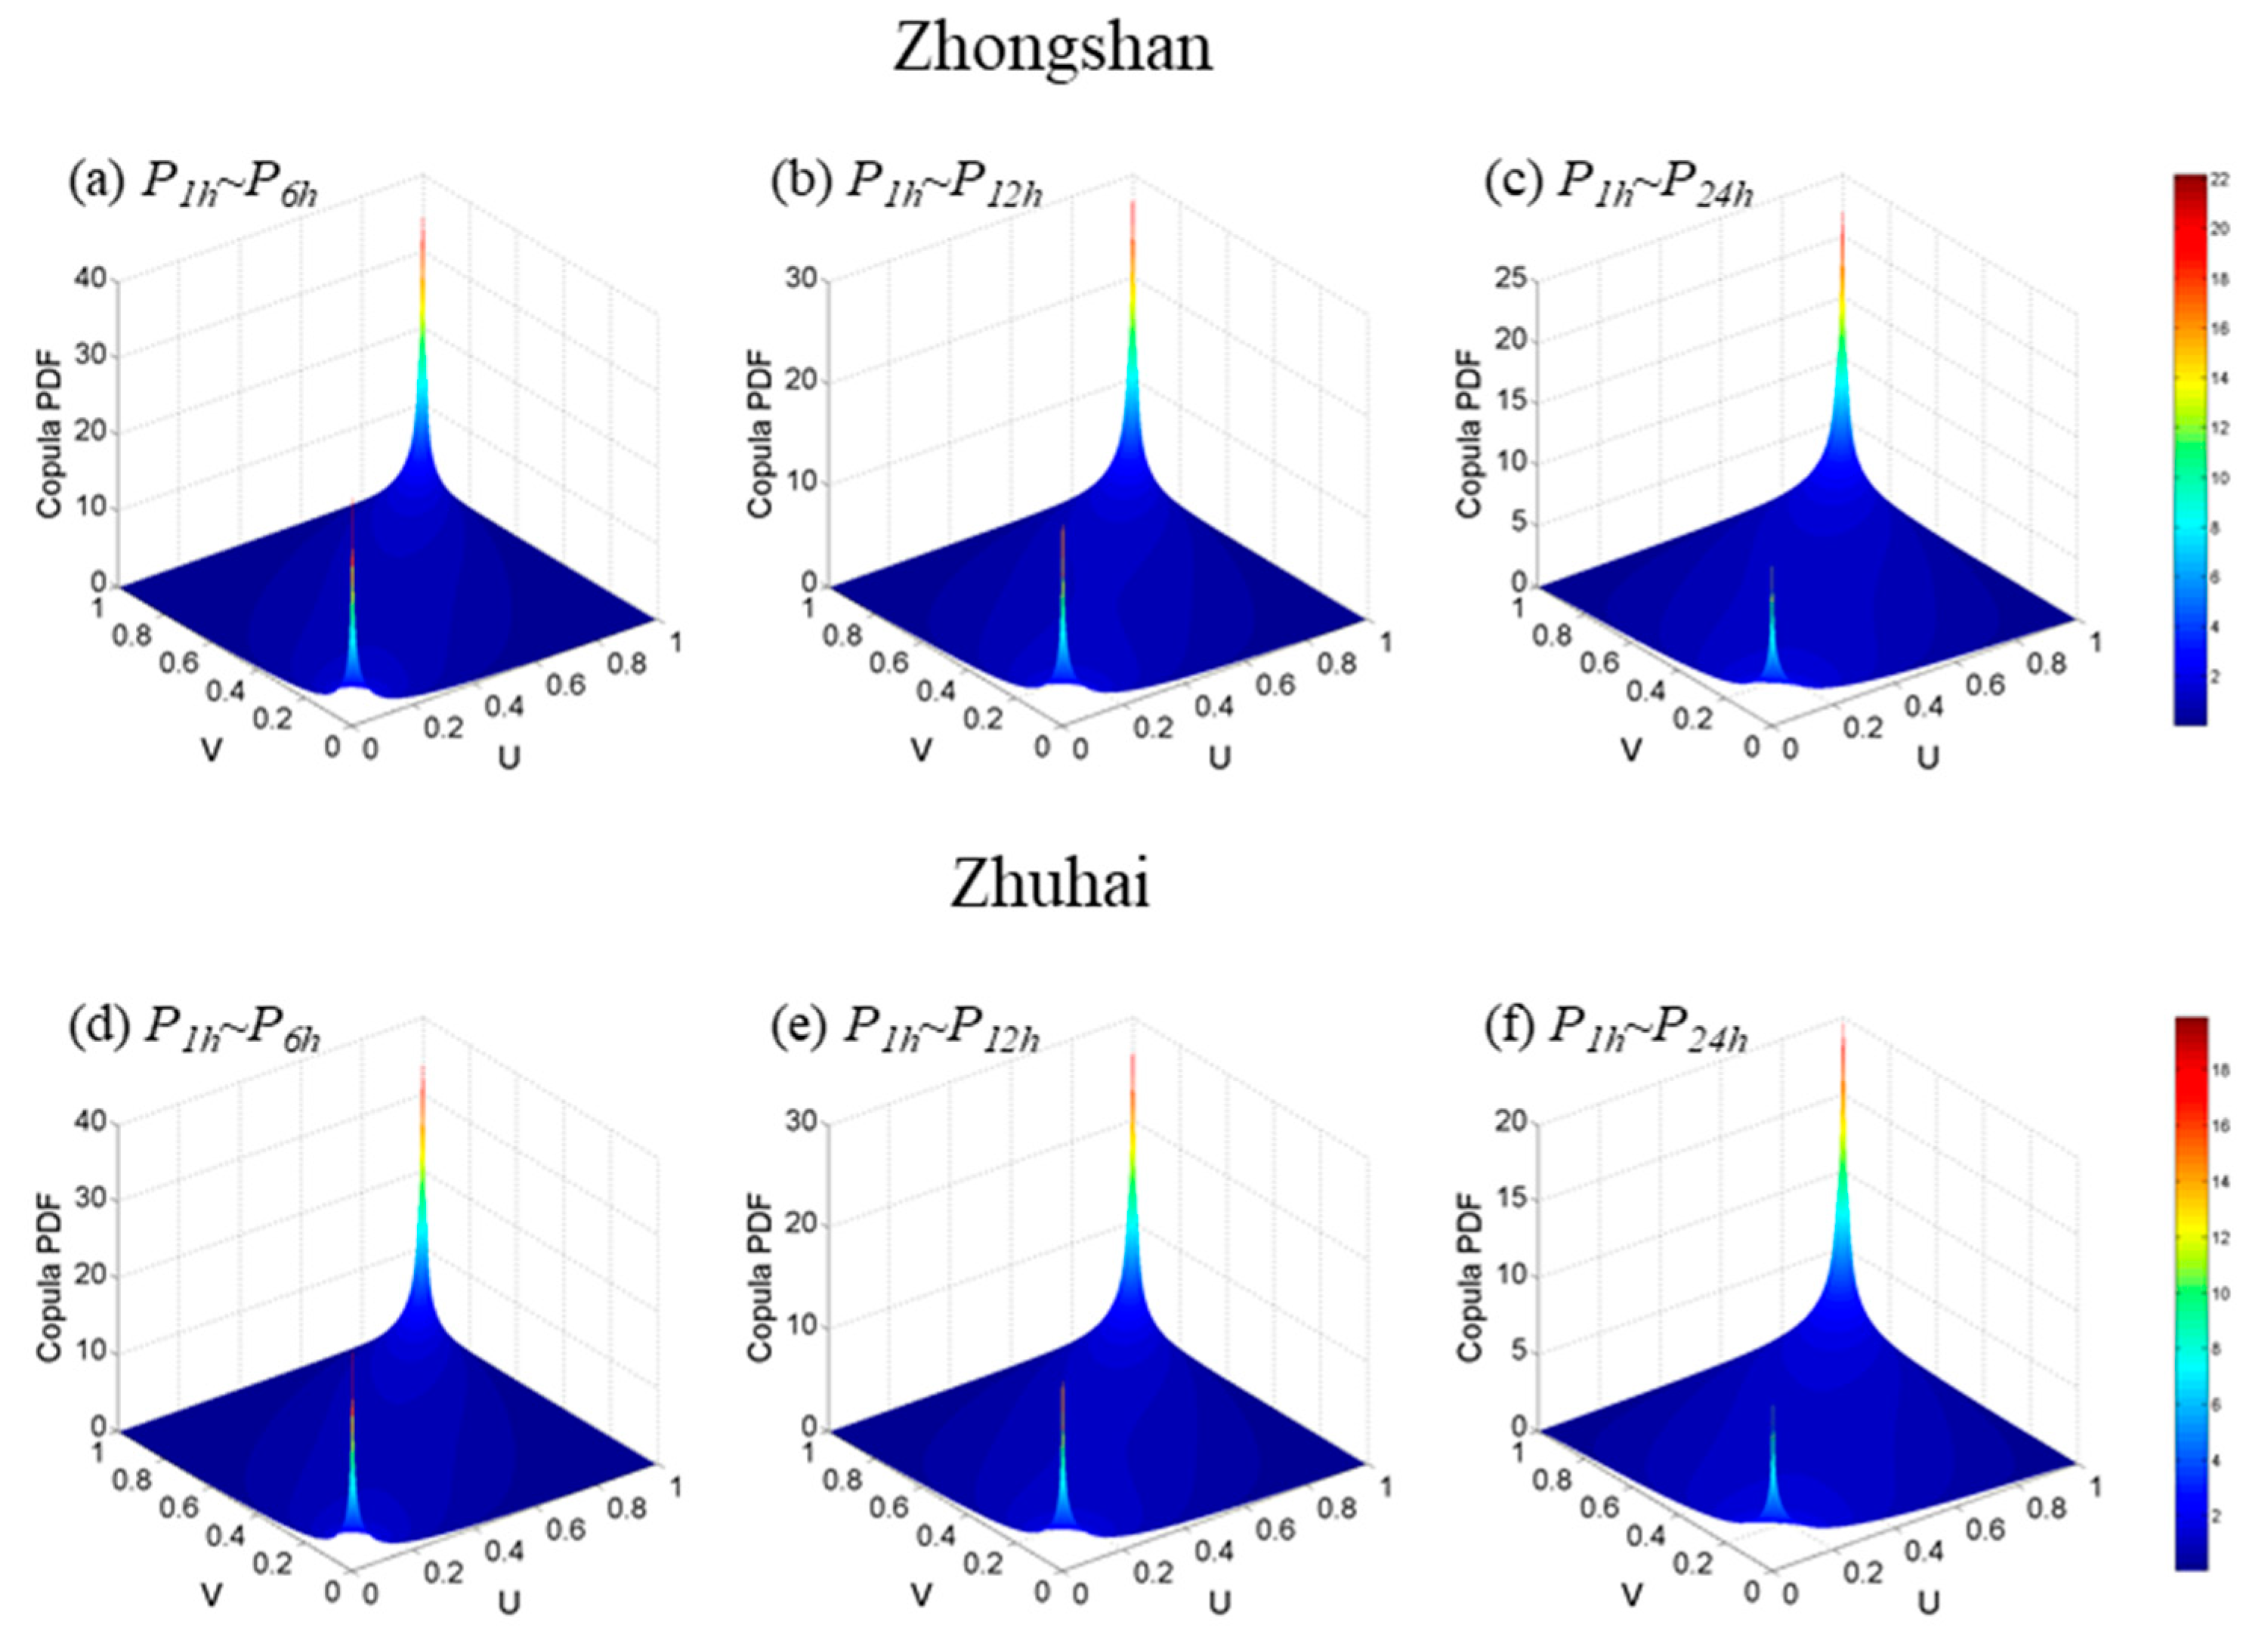
The bivariate Copula CDF and PDF plots are displayed in Figure 7 and Figure 8, respectively. It can be seen from Figure 7 that most of the samples fall on the Copula CDF surfaces, indicating satisfactory fitting performances. Figure 8 shows that strong tail dependencies exist, with sharp peaks at the tails of the Gumbel Copula PDF plots, which gives further proof that the Gumbel Copula is suitable for stormwater and drainage system design purposes. It is also observed from Figure 8 that a stronger correlation exists in high-value parts than in low-value parts, which can better serve the purpose of system design where extreme storms are a concern.
4.3. Design Combinations Optimized Using Copula-Based Method
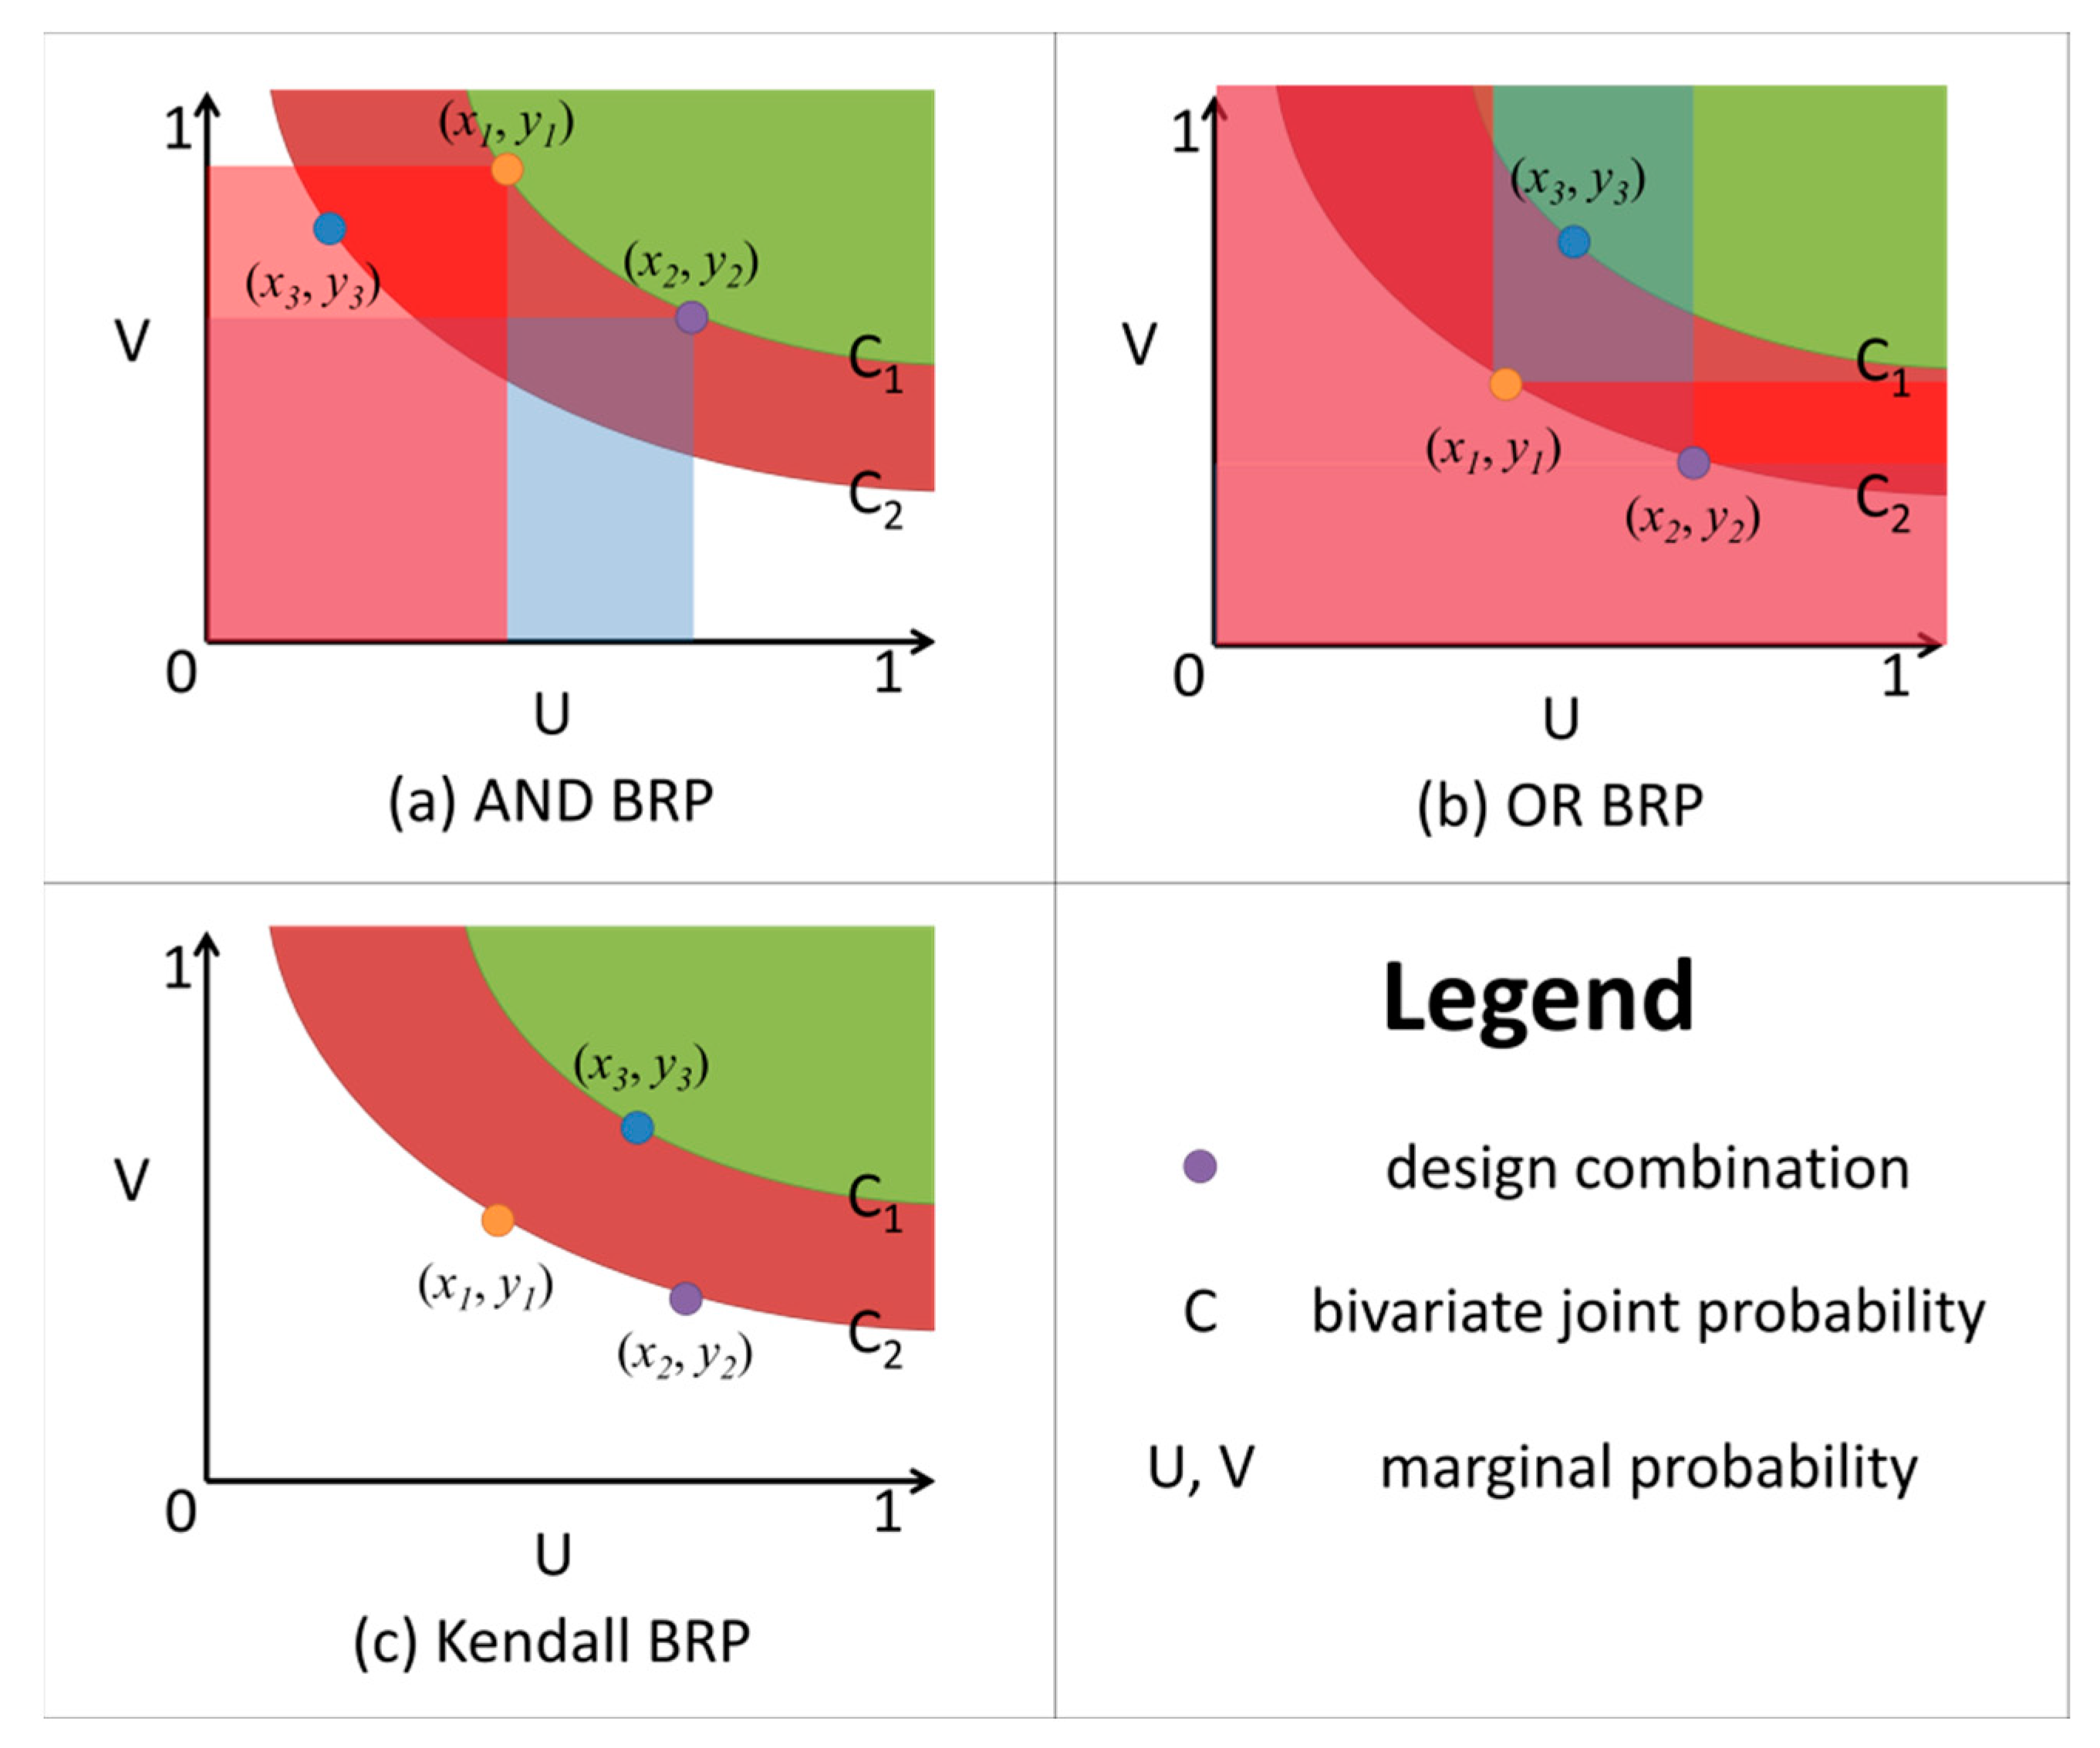
BRP is used to describe the security capability of waterlogging prevention, i.e., the overall capability of the stormwater and drainage systems, which directly affects the design combination optimization results. Therefore, the three BRPs, including BRPAND, BRPOR and BRPK, are discussed, with the results shown in Table 6. It can be seen from Table 6 that when stormwater and drainage systems have the same design RPs, the three BRPs are different from each other. Furthermore, it is observed that BRPAND is usually the largest, while BRPOR is the smallest, which can be explained by their definitions in Equations (10) and (11). This phenomenon underlines the importance of choosing suitable a BRP type for system design. According to Xu et al. [58], the BRPAND (BRPOR) will lead to the enlargement (reduction) of safety domains, which limits the application range. Figure 9 shows the safety domains generated by different BRPs. Taking BRPAND as an example (Figure 9a), the two design combinations (x1, y1) and (x2, y2) have the same joint probability C1. However, it can be observed from Figure 9 that the two different combinations contribute to different safety domains. That is, design combinations with the same BRPAND or BRPOR values will have different safety domains. Moreover, though the rainfall event (x3, y3) has smaller joint probability C2 than (x1, y1) and (x2, y2), it is located outside the safe domain of the design combination (x2, y2). On the contrary, once the Kendall BRP is given, all the possible design combinations will generate the same safety domain. This is an important feature for bivariate system design, since stakeholders are concerned with the uncertainty in practice and engineers also require clear definition for management purposes. Therefore, the Kendall BRP is recommended for describing the security capability of waterlogging prevention and the design combination optimization of stormwater and drainage systems.
Optimized design precipitations of stormwater and drainage systems given different BRPK values for Zhongshan and Zhuhai are listed in Table 7 using optimization Scheme One. The corresponding marginal RPs of stormwater and drainage systems are shown in Table 8. It can be seen from Table 8 that the optimized design RPs of both stormwater and drainage systems are smaller than the corresponding BRPK. This is due to the relatively strong correlations between precipitation series with different durations, as shown in Table 4. When the BRPK is set to be 100 a and P24 h is used for drainage system design, the optimized design RPs are 50 a and 66.67 a for the stormwater system and drainage system of Zhongshan, respectively. Table 8 shows that the optimized RP of the drainage system is generally larger than that of the stormwater system for both Zhongshan and Zhuhai, indicating more attention should be paid to drainage systems since longer-duration precipitation tends to have a larger RP than a shorter-duration one during the same storm event.
In another case, the design RP of either the stormwater or drainage system is given, and the design RP of the other is derived using optimization Scheme Two. Table 9 shows the results of design precipitation and the RPs of drainage systems for Zhongshan and Zhuhai, given certain design RPs of stormwater systems. It can be observed from Table 9 that the optimized design P1 h for the stormwater system has smaller RPs than that of the drainage system, which is inconsistent with the results of Scheme One. For both Zhongshan and Zhuhai, the stormwater system has the largest (smallest) design RPs, conditioned on given RPs of P6 h (P24 h). This can be explained from the correlation coefficients in Table 4, where P1 h and P6 h have the largest correlation coefficients. When the RP of P1 h is confirmed, P6 h has greater probability to have a closer RP to P1 h than the others during the same storm event. Based on the results in Table 9, the design combination of stormwater and drainage systems can be determined. For example, if the drainage system of Zhongshan is designed to withstand once-in-100 a P12 h, the optimized RP of the stormwater system should be 68.28 a, and the corresponding design P1 h is 103.68 mm, which can provide quantitative references for bivariate stormwater and drainage system design.
4.4. Rationality Analysis of Design Combinations in Sponge City Plans
In previous sponge city plans of Zhongshan and Zhuhai, the design RPs of the stormwater system and drainage system were calculated independently (Table 10). The stormwater system was designed by the municipal department and used AMS sampling. The drainage system was designed by the water conservancy department and used AM sampling. With the help of BRPK, the security capabilities of waterlogging prevention were calculated, e.g., the BRPK with once-in-5 a P1 h and once-in-30 a P12 h is 19.7 a for downtown area of Zhongshan. The BRPK makes it possible to compare the waterlogging prevention capability among different regions. It was found that Zhuhai has higher waterlogging prevention standards than Zhongshan in both the downtown area and other areas.
Furthermore, the optimized design RPs of stormwater systems conditioned on planned RPs of drainage systems in Zhongshan and Zhuhai were derived. The results were used to validate the rationality of design combinations in the Sponge City plans, which are listed in Table 11. The results revealed that the planned RPs of stormwater systems in the two cities were underestimated, e.g., the optimized RPs (AMS) of the stormwater system in the downtown area of Zhongshan should be 8.84 a, 8.49 a and 8.04 a for P1 h conditioned on the once-in-30 a P6 h, P12 h and P24 h of drainage system, respectively, which are larger than the planned 5 a (AMS) RP in its sponge city plan. According to the results in Table 11, the design RPs of stormwater and drainage systems were not coordinated, and it is recommended that the planned RPs of stormwater systems in the downtown and other areas of Zhongshan (Zhuhai) should be adjusted to 9 a (7 a) and 7 a (6 a), respectively, to make full use of the construction scales of drainage systems.
5. Conclusions
Under the background of fast urbanization, economic growth and climate change, waterlogging prevention is a growing concern for city governors, which highlights the importance of stormwater and drainage systems. Due to the management fragmentation of urban stormwater and drainage systems, their design return periods (RPs) are usually derived independently, obeying different design codes, which ignores the correlation between precipitation series with different durations used for system design and results in incoordination between the two systems. In this study, a copula-based optimization method for the bivariate design of stormwater and drainage systems is proposed and validated in Zhongshan and Zhuhai, which can help stakeholders make decisions on construction standards for stormwater and drainage systems. The main conclusions of this research are as follows.
- (1)
- The dependencies between precipitations with different durations must be considered, which can be sufficiently described by Copula functions. The Gumbel Copula distributions for P1 h~P6 h, P1 h~P12 h and P1 h~P24 h of Zhongshan and Zhuhai stations have good performance on RMSE, AIC, k-s test and Q-Q plot, indicating the Copula CDFs are approximate to the empirical CDFs.
- (2)
- The Kendall BRP (BRPK) is recommended for describing the overall security capability of urban stormwater and drainage systems instead of the conventional BRPAND or BRPOR, due to its advantage of precisely defining the safety domain. By using the Kendall BRP, the waterlogging prevention capability among different regions or designs can be accurately compared.
- (3)
- The optimization method proposed in this research can provide a sufficient approach for the bivariate design of stormwater and drainage systems. Optimized design combinations of the systems can be derived by both schemes from the perspective of risk control. Stakeholders can either pay more attention to the overall security capability of the whole system or the security capability of either the stormwater or drainage system.
- (4)
- Based on the optimized design combinations of stormwater and drainage systems, rationality analysis was conducted on the Sponge City plans of Zhongshan and Zhuhai. Results show that the design RPs of stormwater systems are generally underestimated for both cities and thus should be adjusted to make full use of the construction scales of drainage systems. The optimization method for the bivariate design of stormwater and drainage systems can help balance the conflicts between economic efficiency and drainage safety.
Author Contributions
Conceptualization, Y.Z. and Y.L.; Data curation, L.W.; Formal analysis, X.L.; Funding acquisition, L.Y. and D.W.; Investigation, Y.Z. and L.W.; Methodology, Y.Z. and Y.L.; Project administration, L.Y.; Resources, X.L.; Software, X.L.; Supervision, L.Y. and D.W.; Visualization, Y.Z. and D.W.; Writing—original draft, Y.Z.; Writing—review & editing, Y.Z., L.Y., D.W. and Y.L. All authors have read and agreed to the published version of the manuscript.
Funding
This research was funded by Research Plan of China Water Resources Pearl River Planning, Surveying & Designing Co., Ltd. (Grant No. ZSZJ-KY-201902), National Key R&D Program of China (Grant No. 2018YFC1508200) and National Natural Science Foundation of China (Grant No. 52079151). The APC was funded by Research Plan of China Water Resources Pearl River Planning, Surveying & Designing Co., Ltd. (Grant No. ZSZJ-KY-201902).
Acknowledgments
The authors thank the three anonymous reviewers for their constructive suggestions and precious time spent on this manuscript, which greatly contribute to the improvement of this research. Thanks are also given to the editors for their professional works on this manuscript.
Conflicts of Interest
The authors declare no conflict of interest.
References
- National Bureau of Statistics of PRC. China Statistical Yearbook 2021; China Statistics Press: Beijing, China, 2022.
- The State Council of PRC. Investigation Report on “7.20” Extreme Storm Disaster in Zhengzhou, Henan. 2022. Available online: https://www.mem.gov.cn/xw/bndt/202201/t20220121_407106.shtml (accessed on 28 March 2022).
- Marsalek, J.; Watt, W.E. Design storms for urban drainage design. Can. J. Civ. Eng. 1984, 11, 574–584. [Google Scholar] [CrossRef]
- Fu, G.T.; Butler, D. Copula-based frequency analysis of overflow and flooding in urban drainage systems. J. Hydrol. 2014, 510, 49–58. [Google Scholar] [CrossRef] [Green Version]
- Guo, J.; Wang, W.L.; Li, J.Q. Cascading Flow System for Urban Drainage Design. J. Hydrol.Eng. 2020, 25, 04020030. [Google Scholar] [CrossRef]
- Huang, K.D.; Ye, L.; Chen, L.; Wang, Q.; Dai, L.; Zhou, J.; Singh, V.P.; Huang, M.; Zhang, J. Risk analysis of flood control reservoir operation considering multiple uncertainties. J. Hydrol. 2018, 565, 672–684. [Google Scholar] [CrossRef]
- Ministry of Housing and Urban-Rural Development of PRC. Code for Design of Outdoor Wastewater Engineering (GB50014-2021); Standards Press of China: Beijing, China, 2021.
- Ministry of Housing and Urban-Rural Development of PRC. Code for Design of Urban Flood Control Project (GB/T 50805-2012); Standards Press of China: Beijing, China, 2012.
- Ministry of Water Resources of PRC. Standard for Waterlogging Control (SL 723-2016); Water & Power Press: Beijing, China, 2016.
- Zhang, J.Y.; Wang, Y.T.; Liu, C.S. Discussion on the standards of urban flood and waterlogging prevention in China. J. Hydroelectr. Eng. 2017, 36, 1–6. [Google Scholar]
- Deng, P.D. Review on probability and application of two sampling methods for urban storm. Water Wastewater Eng. 2006, 32, 39–42. [Google Scholar]
- Liu, J.; Yu, F.Q.; Zhang, J.T.; Xiao, H. Study on Relationship between Design Standards of Pipe and River Drainage. China Water Wastewater 2007, 23, 43–45. [Google Scholar]
- Zhang, M.; Zeng, J.; Huang, G.R.; Liu, H. Analysis of cohesive relationship for return period of design rainstorm between municipal sewerage and waterlogging drainage. J. Water Resour. Water Eng. 2015, 26, 131–135. [Google Scholar]
- Huang, G.R.; Zeng, J.J.; Zhang, M.Z. Study on Convergence of Rainstorm Return Periods and Different Sampling Methods. J. Water Resour. Archit. Eng. 2015, 13, 30–35. [Google Scholar]
- Li, W.D.; Xu, X.Y. Research on the Relationship between the Design of Pipes and River Drainage at Different Damage Rates. China Rural. Water Hydropower 2015, 11, 182–184. [Google Scholar]
- Chen, X.; Deng, H.P.; Ma, X.X. Research on relationship between urban drainage and waterlogging design return periods based on SWMM. Water Wastewater Eng. 2009, 35, 114–117. [Google Scholar]
- Yang, X.; Li, C.F.; Liu, Z.L. Risk probability analysis of design storm combination of urban pipe drainage and river drainage. Eng. J. Wuhan Univ. 2012, 45, 171–176. [Google Scholar]
- Chen, Z.S.; Gao, S.Y.; Li, H.H. Design storm for mixed level-1 and level-2 urban drainage standards based on the secondary return period. Adv. Water Sci. 2017, 3, 382–389. [Google Scholar]
- Zhong, Y.X.; Guo, S.L.; Liu, Z.J.; Wang, Y.; Yin, J. Quantifying differences between reservoir inflows and dam site floods using frequency and risk analysis methods. Stoch. Environ. Res. Risk Assess. 2018, 32, 419–433. [Google Scholar] [CrossRef]
- Ganguli, P.; Reddy, M.J. Probabilistic assessment of flood risks using trivariate copulas. Theor. Appl. Climatol. 2013, 111, 341–360. [Google Scholar] [CrossRef]
- Chen, L.; Singh, V.P.; Guo, S.; Zhou, J.; Zhang, J. Copula-based method for multisite monthly and daily streamflow simulation. J. Hydrol. 2015, 528, 369–384. [Google Scholar] [CrossRef]
- Chang, J.X.; Li, Y.Y.; Wang, Y.M.; Yuan, M. Copula-based drought risk assessment combined with an integrated index in the Wei River Basin, China. J. Hydrol. 2016, 540, 824–834. [Google Scholar] [CrossRef]
- Zhang, J.; Lin, X.; Guo, B. Multivariate Copula-Based Joint Probability Distribution of Water Supply and Demand in Irrigation District. Water Resour. Manag. 2016, 30, 2361–2375. [Google Scholar] [CrossRef]
- Abdollahi, S.; Akhoond-Ali, A.M.; Mirabbasi, R.; Adamowski, J.F. Probabilistic Event Based Rainfall-Runoff Modeling Using Copula Functions. Water Resour. Manag. 2019, 33, 3799–3814. [Google Scholar] [CrossRef]
- Sahoo, B.B.; Jha, R.; Singh, A.; Kumar, D. Bivariate low flow return period analysis in the Mahanadi River basin, India using copula. Int. J. River Basin Manag. 2020, 18, 107–116. [Google Scholar] [CrossRef]
- Dixit, S.; Jayakumar, K.V. A study on copula-based bivariate and trivariate drought assessment in Godavari River basin and the teleconnection of drought with large-scale climate indices. Theor. Appl. Climatol. 2021, 146, 1335–1353. [Google Scholar] [CrossRef]
- Qin, F.L.; Ao, T.Q.; Chen, T. Bivariate Frequency of Meteorological Drought in the Upper Minjiang River Based on Copula Function. Water 2021, 13, 2056. [Google Scholar] [CrossRef]
- Requena, A.I.; Flores, I.; Mediero, L.; Garrote, L. Extension of observed flood series by combining a distributed hydro-meteorological model and a copula-based model. Stoch. Environ. Res. Risk Assess. 2016, 30, 1363–1378. [Google Scholar] [CrossRef] [Green Version]
- Zhong, Y.; Guo, S.; Xiong, F.; Liu, D.; Ba, H.; Wu, X. Probabilistic forecasting based on ensemble forecasts and EMOS method for TGR inflow. Front. Earth Sci. 2020, 14, 188–200. [Google Scholar] [CrossRef]
- Nelson, R.B. An Introduction to Copulas; Springer: New York, NY, USA, 2006. [Google Scholar]
- Ministry of Water Resources of PRC. Regulation for Calculating Design Flood of Water Resources and Hydropower Projects (SL 44-2006); Water & Power Press: Beijing, China, 2006.
- Mangaraj, A.K.; Sahoo, L.N. A study on the probability distribution of daily rainfall amounts in western Orissa. Int. J. Agric. Stat. Sci. 2010, 6, 53–60. [Google Scholar]
- Yue, S.; Hashim, M. Probability distribution of annual, seasonal and monthly precipitation in Japan. Hydrol. Sci. J. 2010, 52, 863–877. [Google Scholar] [CrossRef]
- Chen, Z.S.; Lu, J.F.; Liu, Z.M. Comparative Analysis on Three-parameter Probability Distribution Models for Extreme Precipitation in Guangdong Province. Acta Sci. Nat. Univ. Sunyatseni 2012, 51, 102–106. [Google Scholar]
- Ye, L.; Hanson, L.S.; Ding, P.; Wang, D.; Vogel, R.M. The probability distribution of daily precipitation at the point and catchment scales in the United States. Hydrol. Earth Syst. Sci. 2018, 22, 6519–6531. [Google Scholar] [CrossRef] [Green Version]
- Zhang, L.; Singh, V.P. Bivariate Flood Frequency Analysis Using the Copula Method. J. Hydrol. Eng. 2006, 11, 150–164. [Google Scholar] [CrossRef]
- Salvadori, G.; De Michele, C. On the use of copulas in hydrology: Theory and practice. J. Hydrol. Eng. 2007, 12, 369–380. [Google Scholar] [CrossRef]
- Timonina, A.; Hochrainer-Stigler, S.; Pflug, G.; Jongman, B.; Rojas, R. Structured coupling of probability loss distributions: Assessing joint flood risk in multiple river basins. Risk Anal. 2015, 35, 2102–2119. [Google Scholar] [CrossRef] [PubMed]
- Huang, Y.; Li, Y.; Liu, M.; Xiao, L.; Gan, F.; Jiao, J. Uncertainty analysis of flood control design under multiple floods. Water Resour. Manag. 2020, 36, 1175–1189. [Google Scholar] [CrossRef]
- Wang, L.; Hu, Q.; Wang, Y.; Zhu, Z.; Li, L.; Liu, Y.; Cui, T. Using Copulas to Evaluate Rationality of Rainfall Spatial Distribution in a Design Storm. Water 2018, 10, 758. [Google Scholar] [CrossRef] [Green Version]
- Duan, Q.; Ajami, N.; Gao, X.; Sorooshian, S. Multi-model ensemble hydrologic prediction using Bayesian model averaging. Adv. Water Resour. 2007, 30, 1371–1386. [Google Scholar] [CrossRef] [Green Version]
- Yevjevich, V. Probability and Statistic in Hydrology; Water Resources Publications: Fort Collins, CO, USA, 1972. [Google Scholar]
- Akaike, H. Springer Series in Statistics. Ann. Inst. Stat. Math. 1974, 26, 363–387. [Google Scholar] [CrossRef]
- Liu, Z.; Guo, S.; Xiong, L.; Xu, C.Y. Hydrological uncertainty processor based on a copula function. Hydrol. Sci. J. 2018, 63, 74–86. [Google Scholar] [CrossRef]
- Huang, Z.W.; Liu, X.; Xu, H.R. Concept of matching municipal drainage and urban waterlogging drainage standard and application case analysis. China Water Wastewater 2018, 34, 16–21. [Google Scholar]
- Xiong, F.; Guo, S.; Liu, P.; Xu, C.Y.; Zhong, Y.; Yin, J.; He, S. A general framework of design flood estimation for cascade reservoirs in operation period. J. Hydrol. 2019, 577, 124003. [Google Scholar] [CrossRef]
- Salvadori, G.; Michele, C.D.; Durante, F. On the return period and design in a multivariate framework. Hydrol. Earth Syst. Sci. Discuss. 2011, 15, 3293–3305. [Google Scholar] [CrossRef] [Green Version]
- Brunner, M.I.; Favre, A.C.; Seibert, J. Bivariate return periods and their importance for flood peak and volume estimation. Wiley Interdiscip. Rev. Water 2016, 3, 819–833. [Google Scholar] [CrossRef] [Green Version]
- Luca, D.D.; Biondi, D. Bivariate Return Period for Design Hyetograph and Relationship with T-Year Design Flood Peak. Water 2017, 9, 673. [Google Scholar] [CrossRef] [Green Version]
- Salvadori, G.; Michele, C.D. Multivariate multiparameter extreme value models and return periods: A Copula approach. Water Resour. Res. 2010, 46, 219–233. [Google Scholar] [CrossRef]
- Chebana, F.; Ouarda, T. Multivariate quantiles in hydrological frequency analysis. Environmetrics 2011, 22, 63–78. [Google Scholar] [CrossRef] [Green Version]
- Graler, B.; Berg, V.D.; Vandenberghe, S.; Petroselli, A.; Grimaldi, S.; De Baets, B.; Verhoest, N.E.C. Multivariate return periods in hydrology: A critical and practical review focusing on synthetic design hydrograph estimation. Hydrol. Earth Syst. Sci. 2013, 17, 1281–1296. [Google Scholar] [CrossRef] [Green Version]
- Chinese Communist Party Central Committee, The State Council of PRC. Outline Development Plan for the Guangdong-Hongkong-Macao Greater Bay Area; People’s Publishing House: Beijing, China, 2019.
- Castro-Fresno, D.; Andrés-Valeri, V.C.; Sañudo-Fontaneda, L.A.; Rodriguez-Hernandez, J. Sustainable Drainage Practices in Spain, Specially Focused on Pervious Pavements. Water 2013, 5, 67–93. [Google Scholar] [CrossRef]
- Cotterill, S.; Bracken, L.J. Assessing the Effectiveness of Sustainable Drainage Systems (SuDS): Interventions, Impacts and Challenges. Water 2020, 12, 3160. [Google Scholar] [CrossRef]
- Bouarafa, S.; Lassabatere, L.; Lipeme-Kouyi, G.; Angulo-Jaramillo, R. Hydrodynamic Characterization of Sustainable Urban Drainage Systems (SuDS) by Using Beerkan Infiltration Experiments. Water 2019, 11, 660. [Google Scholar] [CrossRef] [Green Version]
- Nguyen, D.D.; Jayakumar, K.V. Assessing the copula selection for bivariate frequency analysis based on the tail dependence test. J. Earth Syst. Sci. 2018, 127, 92. [Google Scholar] [CrossRef] [Green Version]
- Xu, H.; Xu, K.; Lian, J.; Ma, C. Compound effects of rainfall and storm tides on coastal flooding risk. Stoch. Environ. Res. Risk Assess. 2019, 33, 1249–1261. [Google Scholar] [CrossRef]
Figure 1.
Diagram of urban stormwater system and drainage system.

Figure 2.
Flowchart of design combination optimization for urban stormwater and drainage systems.

Figure 3.
Geographical location of study areas.

Figure 4.
Temporal distributions of AM precipitation samples.

Figure 5.
Q-Q plots of different marginal distributions and empirical distributions. (a–d) Zhongshan; (e–h) Zhuhai.
Figure 5.
Q-Q plots of different marginal distributions and empirical distributions. (a–d) Zhongshan; (e–h) Zhuhai.

Figure 6.
Q-Q plots of empirical frequency and theoretical cdf values of Gumbel copula. (a–c) Zhongshan; (d–f) Zhuhai.
Figure 6.
Q-Q plots of empirical frequency and theoretical cdf values of Gumbel copula. (a–c) Zhongshan; (d–f) Zhuhai.

Figure 7.
Gumbel Copula CDF plots for different precipitation combinations. (a–c) for Zhongshan; (d–f) for Zhuhai.
Figure 7.
Gumbel Copula CDF plots for different precipitation combinations. (a–c) for Zhongshan; (d–f) for Zhuhai.

Figure 8.
Gumbel Copula PDF plots for different precipitation combinations. (a–c) for Zhongshan; (d–f) for Zhuhai.
Figure 8.
Gumbel Copula PDF plots for different precipitation combinations. (a–c) for Zhongshan; (d–f) for Zhuhai.

Figure 9.
Safety domains derived from different BRPs.


Table 1.
Brief information on probabilistic distributions for precipitation records.
| Distribution | CDF | Parameters |
|---|---|---|
| LN | ||
| P3 | ||
| GEV |
Table 2.
Different Copula functions from Archimedean family.
| Copula | Generator | CDF * | Parameter Range | Parameter Estimation | |
|---|---|---|---|---|---|
| Gumbel | |||||
| Clayton | 0 | ||||
| Frank | 0 |
* u and v denote the marginal CDF of X and Y, respectively. # is the upper tail dependence coefficient of the Copula function.
Table 3.
Marginal distribution goodness-of-fit evaluation results.
| City | Variable | Distribution | Estimated Parameters | RMSE | KS Test | AIC | ||
|---|---|---|---|---|---|---|---|---|
| D49 | D49,10% | Accept or Not | ||||||
| Zhongshan | P1 h | P3 | 0.0298 | 0.056 | (n = 49) | √ | −349 | |
| GEV | 0.0269 | 0.054 | √ | −360 | ||||
| LN | 0.0274 | 0.062 | √ | −357 | ||||
| P6 h | P3 | 0.0522 | 0.116 | √ | −292 | |||
| GEV | 0.0327 | 0.075 | √ | −340 | ||||
| LN | 0.0623 | 0.143 | √ | −277 | ||||
| P12 h | P3 | 0.0458 | 0.103 | √ | −305 | |||
| GEV | 0.0307 | 0.067 | √ | −346 | ||||
| LN | 0.0558 | 0.124 | √ | −288 | ||||
| P24 h | P3 | 0.0573 | 0.118 | √ | −283 | |||
| GEV | 0.0223 | 0.055 | √ | −379 | ||||
| LN | 0.0596 | 0.121 | √ | −282 | ||||
| Zhuhai | P1 h | P3 | 0.0258 | 0.060 | √ | −349 | ||
| GEV | 0.0227 | 0.051 | √ | −362 | ||||
| LN | 0.0224 | 0.050 | √ | −364 | ||||
| P6 h | P3 | 0.0423 | 0.096 | √ | −301 | |||
| GEV | 0.0325 | 0.074 | √ | −327 | ||||
| LN | 0.0255 | 0.067 | √ | −354 | ||||
| P12 h | P3 | 0.0512 | 0.140 | √ | −282 | |||
| GEV | 0.0298 | 0.076 | √ | −335 | ||||
| LN | 0.0266 | 0.065 | √ | −349 | ||||
| P24 h | P3 | 0.0426 | 0.120 | √ | −300 | |||
| GEV | 0.0350 | 0.074 | √ | −319 | ||||
| LN | 0.0320 | 0.073 | √ | −331 | ||||
Table 4.
Correlation coefficients between precipitation series with different durations.
| City | Linear Correlation Coefficient, ρ | Kendall’s Rank Correlation Coefficient, τ | ||||
|---|---|---|---|---|---|---|
| P1 h~P6 h | P1 h~P12 h | P1 h~P24 h | P1 h~P6 h | P1 h~P12 h | P1 h~P24 h | |
| Zhongshan | 0.51 | 0.45 | 0.35 | 0.49 | 0.42 | 0.36 |
| Zhuhai | 0.73 | 0.61 | 0.55 | 0.48 | 0.41 | 0.32 |
Table 5.
Fitting results of different marginal distributions.
| City | Variable Combinations | Copula Function | Parameter Estimation | RMSE | KS Test | AIC | ||
|---|---|---|---|---|---|---|---|---|
| Dn | Dn,10% | Accept or Not | ||||||
| Zhongshan(GEV) | P1 h~P6 h | Frank | 5.465 | 0.0256 | 0.067 | (n = 49) | √ | −371 |
| Gumbel | 1.962 | 0.0332 | 0.065 | √ | −358 | |||
| Clayton | 1.081 | 0.0306 | 0.053 | √ | −353 | |||
| P1 h~P12 h | Frank | 4.361 | 0.0332 | 0.089 | √ | −344 | ||
| Gumbel | 1.731 | 0.0359 | 0.078 | √ | −338 | |||
| Clayton | 0.872 | 0.0322 | 0.060 | √ | −347 | |||
| P1 h~P24 h | Frank | 3.476 | 0.0238 | 0.068 | √ | −378 | ||
| Gumbel | 1.551 | 0.0294 | 0.088 | √ | −366 | |||
| Clayton | 0.687 | 0.0267 | 0.061 | √ | −366 | |||
| Zhuhai(LN) | P1 h~P6 h | Frank | 5.325 | 0.0276 | 0.079 | √ | −349 | |
| Gumbel | 1.936 | 0.0295 | 0.061 | √ | −348 | |||
| Clayton | 0.989 | 0.0301 | 0.077 | √ | −340 | |||
| P1 h~P12 h | Frank | 4.213 | 0.0277 | 0.085 | √ | −342 | ||
| Gumbel | 1.698 | 0.0294 | 0.065 | √ | −343 | |||
| Clayton | 0.831 | 0.0334 | 0.081 | √ | −339 | |||
| P1 h~P24 h | Frank | 3.376 | 0.0302 | 0.074 | √ | −340 | ||
| Gumbel | 1.482 | 0.0291 | 0.078 | √ | −330 | |||
| Clayton | 0.612 | 0.0323 | 0.088 | √ | −333 | |||
Table 6.
Different BRP results of design combinations of stormwater and drainage systems with given marginal RPs.
Table 6.
Different BRP results of design combinations of stormwater and drainage systems with given marginal RPs.
| City | BRP Type | Precipitation Combination | Marginal RP of Stormwater System and Drainage System | ||||||
|---|---|---|---|---|---|---|---|---|---|
| 2 a | 3 a | 5 a | 10 a | 20 a | 50 a | 100 a | |||
| Zhongshan | BRPAND | P1 h~P6 h | 2.88 | 4.86 | 8.95 | 19.36 | 40.31 | 103.31 | 208.35 |
| P1 h~P12 h | 2.98 | 5.15 | 9.67 | 21.30 | 44.81 | 115.59 | 233.64 | ||
| P1 h~P24 h | 3.14 | 5.60 | 10.91 | 24.85 | 53.33 | 139.38 | 283.02 | ||
| BRPK | P1 h~P6 h | 2.33 | 3.87 | 7.08 | 15.33 | 32.00 | 82.16 | 165.82 | |
| P1 h~P12 h | 2.36 | 3.99 | 7.46 | 16.49 | 34.85 | 90.20 | 182.58 | ||
| P1 h~P24 h | 2.39 | 4.17 | 8.09 | 18.58 | 40.22 | 105.87 | 215.56 | ||
| BRPOR | P1 h~P6 h | 1.53 | 2.17 | 3.47 | 6.74 | 13.30 | 32.98 | 65.79 | |
| P1 h~P12 h | 1.50 | 2.12 | 3.37 | 6.53 | 12.87 | 31.90 | 63.61 | ||
| P1 h~P24 h | 1.47 | 2.05 | 3.24 | 6.26 | 12.31 | 30.46 | 60.73 | ||
| Zhuhai | BRPAND | P1 h~P6 h | 2.72 | 4.47 | 8.03 | 16.99 | 34.95 | 88.89 | 178.81 |
| P1 h~P12 h | 2.91 | 4.95 | 9.16 | 19.92 | 41.61 | 106.82 | 215.57 | ||
| P1 h~P24 h | 3.06 | 5.38 | 10.28 | 23.01 | 48.87 | 126.84 | 256.94 | ||
| BRPK | P1 h~P6 h | 2.29 | 3.70 | 6.59 | 13.91 | 28.63 | 72.82 | 146.49 | |
| P1 h~P12 h | 2.34 | 3.91 | 7.20 | 15.67 | 32.82 | 84.46 | 170.59 | ||
| P1 h~P24 h | 2.38 | 4.08 | 7.77 | 17.50 | 37.41 | 97.61 | 198.10 | ||
| BRPOR | P1 h~P6 h | 1.58 | 2.26 | 3.63 | 7.09 | 14.01 | 34.78 | 69.41 | |
| P1 h~P12 h | 1.52 | 2.15 | 3.44 | 6.68 | 13.16 | 32.64 | 65.10 | ||
| P1 h~P24 h | 1.48 | 2.08 | 3.30 | 6.39 | 12.57 | 31.14 | 62.08 | ||
Table 7.
Design combinations of stormwater and drainage systems with certain BRPs.
| City | BRPK/a | P1 h~P6 h | P1 h~P12 h | P1 h~P24 h | |||
|---|---|---|---|---|---|---|---|
| P1 h/mm | P6 h/mm | P1 h/mm | P12 h/mm | P1 h/mm | P24 h/mm | ||
| Zhongshan | 2 | 45.26 | 65.52 | 44.93 | 70.19 | 45.14 | 79.00 |
| 3 | 50.53 | 77.98 | 49.90 | 84.43 | 49.97 | 95.57 | |
| 5 | 55.91 | 97.06 | 55.55 | 104.22 | 55.32 | 119.09 | |
| 10 | 62.94 | 127.61 | 62.79 | 136.84 | 61.65 | 162.62 | |
| 20 | 69.90 | 164.67 | 69.37 | 182.88 | 67.45 | 227.89 | |
| 50 | 77.62 | 243.53 | 77.62 | 270.71 | 75.78 | 340.31 | |
| 100 | 82.39 | 364.66 | 82.39 | 398.05 | 81.48 | 477.11 | |
| Zhuhai | 2 | 57.45 | 107.57 | 57.45 | 118.97 | 56.94 | 140.39 |
| 3 | 63.81 | 129.39 | 62.99 | 149.11 | 63.03 | 168.16 | |
| 5 | 70.72 | 155.50 | 70.06 | 180.33 | 69.22 | 204.63 | |
| 10 | 78.57 | 193.95 | 77.87 | 229.80 | 76.97 | 255.11 | |
| 20 | 86.31 | 231.43 | 85.55 | 280.51 | 83.26 | 319.42 | |
| 50 | 96.46 | 280.03 | 95.41 | 351.52 | 92.74 | 399.87 | |
| 100 | 102.06 | 334.80 | 102.69 | 408.23 | 98.91 | 479.55 | |
Table 8.
Marginal RP of the optimal stormwater and drainage combination for BRPK.
| City | BRPK | P1 h~P6 h | P1 h~P12 h | P1 h~P24 h | ||||||
|---|---|---|---|---|---|---|---|---|---|---|
| P1 h/a | P6 h/a | P1 h/a | P12 h/a | P1 h/a | P24 h/a | |||||
| RP(AMS) | RP(AM) | RP(AM) | RP(AMS) | RP(AM) | RP(AM) | RP(AMS) | RP(AM) | RP(AM) | ||
| Zhongshan | 2 a | 1.07 | 1.78 | 1.82 | 1.03 | 1.75 | 1.82 | 1.06 | 1.77 | 1.77 |
| 3 a | 1.78 | 2.51 | 2.55 | 1.68 | 2.40 | 2.54 | 1.69 | 2.41 | 2.42 | |
| 5 a | 2.77 | 3.80 | 4.13 | 2.69 | 3.69 | 3.89 | 2.64 | 3.62 | 3.62 | |
| 10 a | 4.52 | 7.09 | 7.94 | 4.48 | 6.99 | 6.99 | 4.16 | 6.29 | 6.76 | |
| 20 a | 6.83 | 14.08 | 14.93 | 6.63 | 13.34 | 13.33 | 5.95 | 10.98 | 13.70 | |
| 50 a | 10.13 | 32.25 | 40.00 | 10.13 | 32.25 | 32.26 | 9.27 | 26.31 | 32.26 | |
| 100 a | 12.59 | 55.58 | 111.11 | 12.59 | 55.58 | 76.92 | 12.10 | 50.00 | 66.67 | |
| Zhuhai | 2 a | 1.17 | 1.77 | 1.82 | 1.17 | 1.77 | 1.79 | 1.13 | 1.73 | 1.81 |
| 3 a | 1.76 | 2.50 | 2.54 | 1.68 | 2.38 | 2.54 | 1.68 | 2.39 | 2.39 | |
| 5 a | 2.56 | 3.94 | 3.94 | 2.48 | 3.76 | 3.76 | 2.37 | 3.55 | 3.56 | |
| 10 a | 3.69 | 7.14 | 7.75 | 3.58 | 6.75 | 7.09 | 3.44 | 6.29 | 6.29 | |
| 20 a | 5.03 | 13.70 | 15.15 | 4.89 | 12.82 | 13.51 | 4.47 | 10.53 | 12.99 | |
| 50 a | 7.13 | 34.48 | 35.72 | 6.90 | 31.25 | 32.26 | 6.32 | 24.40 | 31.25 | |
| 100 a | 8.47 | 58.82 | 90.91 | 8.63 | 62.51 | 62.50 | 7.70 | 43.48 | 71.43 | |
Table 9.
Design RPs and precipitation for stormwater systems using MLE.
| City | P6 h | P1 h | P12 h | P1 h | P24 h | P1 h | ||||||
|---|---|---|---|---|---|---|---|---|---|---|---|---|
| RP/a | P/mm | RP/a | P/mm | RP/a | P/mm | RP/a | P/mm | RP/a | P/mm | RP /a | P/mm | |
| Zhongshan | 2 | 69.00 | 1.89 | 46.31 | 2 | 74.11 | 1.86 | 46.03 | 2 | 85.43 | 1.81 | 45.62 |
| 3 | 84.15 | 2.65 | 51.33 | 3 | 91.81 | 2.52 | 50.64 | 3 | 107.77 | 2.38 | 49.81 | |
| 5 | 105.32 | 4.17 | 57.06 | 5 | 117.30 | 3.89 | 56.21 | 5 | 140.25 | 3.53 | 55.02 | |
| 10 | 140.19 | 8.07 | 64.32 | 10 | 160.81 | 7.40 | 63.42 | 10 | 196.33 | 6.55 | 62.17 | |
| 20 | 185.04 | 15.78 | 71.04 | 20 | 219.00 | 14.53 | 70.28 | 20 | 272.22 | 12.84 | 69.06 | |
| 50 | 265.99 | 39.40 | 79.45 | 50 | 328.76 | 35.99 | 78.64 | 50 | 417.35 | 32.18 | 77.61 | |
| 100 | 349.78 | 78.42 | 85.32 | 100 | 447.29 | 72.13 | 84.62 | 100 | 576.15 | 64.06 | 83.69 | |
| Zhuhai | 2 | 113.86 | 1.90 | 58.93 | 2 | 128.86 | 1.86 | 58.51 | 2 | 150.79 | 1.82 | 58.01 |
| 3 | 139.46 | 2.66 | 64.82 | 3 | 162.44 | 2.53 | 64.03 | 3 | 189.18 | 2.34 | 62.72 | |
| 5 | 169.23 | 4.16 | 71.58 | 5 | 202.61 | 3.88 | 70.57 | 5 | 234.87 | 3.40 | 68.67 | |
| 10 | 208.19 | 7.96 | 79.97 | 10 | 256.68 | 7.28 | 78.87 | 10 | 296.10 | 6.16 | 76.75 | |
| 20 | 247.04 | 15.62 | 87.85 | 20 | 312.06 | 14.05 | 86.64 | 20 | 358.52 | 11.91 | 84.73 | |
| 50 | 299.49 | 38.40 | 97.60 | 50 | 388.80 | 34.61 | 96.53 | 50 | 444.65 | 29.25 | 94.79 | |
| 100 | 340.52 | 76.00 | 104.72 | 100 | 450.19 | 68.28 | 103.68 | 100 | 513.28 | 57.91 | 101.96 | |
Table 10.
Planned RP and BRPK of stormwater and drainage systems of Zhongshan and Zhuhai.
| City | Region | Planned RP in Sponge City Plan/a | BRPK/a | ||
|---|---|---|---|---|---|
| Stormwater System (AMS) | Drainage System (AM) | ||||
| Zhongshan | Downtown Area | 5 | 30 | P1 h~P6 h | 18.0 |
| P1 h~P12 h | 19.7 | ||||
| P1 h~P24 h | 22.9 | ||||
| Other Areas | 2 | 20 | P1 h~P6 h | 5.3 | |
| P1 h~P12 h | 5.6 | ||||
| P1 h~P24 h | 6.3 | ||||
| Zhuhai | Downtown Area | 5 | 50 | P1 h~P6 h | 26.5 |
| P1 h~P12 h | 31.5 | ||||
| P1 h~P24 h | 36.7 | ||||
| Other Areas | 3 | 30 | P1 h~P6 h | 9.4 | |
| P1 h~P12 h | 10.9 | ||||
| P1 h~P24 h | 12.4 | ||||
Table 11.
Optimized design RPs for stormwater system conditioned on given RP of drainage system.
| City | P6 h | P1 h | P12 h | P1 h | P24 h | P1 h | |||||||||
|---|---|---|---|---|---|---|---|---|---|---|---|---|---|---|---|
| RP/a | P/mm | RP/a (AM) | RP/a (AMS) | P/mm | RP/a | P/mm | RP/a (AM) | RP/a (AMS) | P/mm | RP/a | P/mm | RP/a AM) | RP/a (AMS) | P/mm | |
| Zhongshan | 2 | 69.00 | 1.89 | 1.19 | 46.31 | 2 | 74.11 | 1.86 | 1.16 | 46.03 | 2 | 85.43 | 1.81 | 1.11 | 45.62 |
| 3 | 84.15 | 2.65 | 1.90 | 51.33 | 3 | 91.81 | 2.52 | 1.79 | 50.64 | 3 | 107.77 | 2.38 | 1.66 | 49.81 | |
| 5 | 105.32 | 4.17 | 3.02 | 57.06 | 5 | 117.30 | 3.89 | 2.83 | 56.21 | 5 | 140.25 | 3.53 | 2.58 | 55.02 | |
| 10 | 140.19 | 8.07 | 4.93 | 64.32 | 10 | 160.81 | 7.40 | 4.66 | 63.42 | 10 | 196.33 | 6.55 | 4.30 | 62.17 | |
| 20 | 185.04 | 15.78 | 7.27 | 71.04 | 20 | 219.00 | 14.53 | 6.98 | 70.28 | 20 | 272.22 | 12.84 | 6.52 | 69.06 | |
| 30 | 217.33 | 23.65 | 8.84 | 74.81 | 30 | 262.14 | 21.69 | 8.49 | 74.02 | 30 | 328.98 | 19.28 | 8.04 | 72.94 | |
| 50 | 265.99 | 39.40 | 11.04 | 79.45 | 50 | 328.76 | 35.99 | 10.63 | 78.64 | 50 | 417.35 | 32.18 | 10.13 | 77.61 | |
| 100 | 349.78 | 78.42 | 14.27 | 85.32 | 100 | 447.29 | 72.13 | 13.86 | 84.62 | 100 | 576.15 | 64.06 | 13.32 | 83.69 | |
| Zhuhai | 2 | 113.86 | 1.90 | 1.30 | 58.93 | 2 | 128.86 | 1.86 | 1.26 | 58.51 | 2 | 150.79 | 1.82 | 1.22 | 58.01 |
| 3 | 139.46 | 2.66 | 1.87 | 64.82 | 3 | 162.44 | 2.53 | 1.78 | 64.03 | 3 | 189.18 | 2.34 | 1.65 | 62.72 | |
| 5 | 169.23 | 4.16 | 2.67 | 71.58 | 5 | 202.61 | 3.88 | 2.54 | 70.57 | 5 | 234.87 | 3.40 | 2.31 | 68.67 | |
| 10 | 208.19 | 7.96 | 3.91 | 79.97 | 10 | 256.68 | 7.28 | 3.74 | 78.87 | 10 | 296.10 | 6.16 | 3.41 | 76.75 | |
| 20 | 247.04 | 15.62 | 5.32 | 87.85 | 20 | 312.06 | 14.05 | 5.09 | 86.64 | 20 | 358.52 | 11.91 | 4.74 | 84.73 | |
| 30 | 270.04 | 23.22 | 6.20 | 92.19 | 30 | 345.46 | 21.00 | 5.98 | 91.13 | 30 | 396.04 | 17.69 | 5.59 | 89.22 | |
| 50 | 299.49 | 38.40 | 7.40 | 97.60 | 50 | 388.80 | 34.61 | 7.15 | 96.53 | 50 | 444.65 | 29.25 | 6.76 | 94.79 | |
| 100 | 340.52 | 76.00 | 9.15 | 104.72 | 100 | 450.19 | 68.28 | 8.88 | 103.68 | 100 | 513.28 | 57.91 | 8.45 | 101.96 | |
Publisher’s Note: MDPI stays neutral with regard to jurisdictional claims in published maps and institutional affiliations. |
© 2022 by the authors. Licensee MDPI, Basel, Switzerland. This article is an open access article distributed under the terms and conditions of the Creative Commons Attribution (CC BY) license (https://creativecommons.org/licenses/by/4.0/).
Share and Cite
MDPI and ACS Style
Zhong, Y.; Liao, X.; Yi, L.; Wang, D.; Wu, L.; Li, Y. Design Combination Optimized Approach for Urban Stormwater and Drainage Systems Using Copula-Based Method. Water 2022, 14, 1717. https://doi.org/10.3390/w14111717
AMA Style
Zhong Y, Liao X, Yi L, Wang D, Wu L, Li Y. Design Combination Optimized Approach for Urban Stormwater and Drainage Systems Using Copula-Based Method. Water. 2022; 14(11):1717. https://doi.org/10.3390/w14111717
Chicago/Turabian StyleZhong, Yixuan, Xiaolong Liao, Ling Yi, Dagang Wang, Leping Wu, and Yuanyuan Li. 2022. "Design Combination Optimized Approach for Urban Stormwater and Drainage Systems Using Copula-Based Method" Water 14, no. 11: 1717. https://doi.org/10.3390/w14111717
Note that from the first issue of 2016, this journal uses article numbers instead of page numbers. See further details here.