
Ecohydraulic Characteristics of a Differential Weir-Orifice Structure and Its Application to the Transition Reach of a Fishway


1
School of Water Conservancy, North China University of Water Resources and Electric Power, Zhengzhou 450046, China
2
St. Anthony Falls Laboratory, Department of Civil, Environmental and Geo-Engineering, College of Science and Engineering, University of Minnesota, Minneapolis, MN 55414, USA
*
Authors to whom correspondence should be addressed.
Water 2022, 14(11), 1711; https://doi.org/10.3390/w14111711
Submission received: 15 December 2021
/
Revised: 19 May 2022
/
Accepted: 23 May 2022
/
Published: 26 May 2022
Abstract
:A transition reach is usually necessary to connect two channels with different cross-sections to facilitate a gradual variation of the water depth and a mean flow velocity profile. A modified weir–orifice structure named differential weir-orifice (abbreviated DWO) is proposed here and applied to the transition reach of a fishway. Considering the preferred flow velocity and body shape of specific migrating fish, the design guidelines of a DWO plate are firstly discussed in terms of basic hydraulics. Then, by means of hydrodynamic numerical simulation and scale model tests, the design of a non-prismatic transition reach in a proposed large fishway is studied and optimized with a DWO. The simulation results indicate that the velocity profile in conventional weirs varies in the range of 2.5 to 3.2 m/s, and the head drop of each stage is up to 0.4 m, which is not suitable for fish migration. However, the flow could be improved by adopting the DWO: the split ratio of each weir gradually increases from 13% to 40%, with weir height decreasing along the reach, which allows the water drop of each stage to decrease by 35% to 50%. This causes the velocity over the weir to reduce in the range of 1.2 to 2.1 m/s, while the velocity in the orifice flow remains limited to 0.8 to 1.3 m/s. The flow velocity profile in the DWO also presents a bimodal distribution, with different flow layers increasing the suitability for fish migration. Moreover, the DWO also performs well in decreasing the vertical turbulent intensity together with the turbulent kinetic energy, reduced by about 33% at the weir crest. The energy at the bottom orifice is only about 28% of that at the weir crest. This indicates that the turbulent kinetic energy profile could be adjusted by the DWO, part of which is transferred from the weir crest to the bottom orifice. The model test results also show that the water surface experienced only gradual variation along the DWO. The adjusting functionality of the DWO can enable the fishway to be more effective, promoting an ecohydraulic design solution for fishway structures.
1. Introduction
As the water resource crises worsen, the design and construction of sluices, dams, and other water-retaining structures have been expanding on rivers worldwide. Drainage infrastructure for large water conservancy projects was usually designed as overflow weirs with a bottom hole to meet the demands of both surface and bottom discharge [1]. Considerable research has been conducted on the related hydraulic properties, and the submerged influence correction has been explained in detail [2,3]. However, the hydraulic characteristics of weirs with a bottom orifice in small-scale open-channel flows, as in the case of fishways, show distinct features as compared to conventional weir structures. In particular, the relationship between the stage-discharge and the split ratio (weir flow to orifice flow) used to characterize similar structures in open channels [4,5,6] can be extended to the case of fishways.
As the only transport channel for freshwater fish and other hydrobionts, rivers are critical in maintaining the integrity of natural ecosystems. However, most rivers worldwide have been dammed [7,8,9,10], which not only brings social and economic benefits but also causes the fragmentation of river ecological environments and induces changes in the habitat of fish, which has been observed in the Nakdong River in Korea, the Yangtze River in China, the Tocantins River in Brazil, et al. [11,12,13,14]. Building a fishway is one way to restore river connectivity and provide conduits for the passage of fish and other hydrobionts [15], in some cases bidirectionally [16]. Fishways are defined as structures deliberately created to facilitate safe and timely fish movement past an obstacle [8,10,17]. Therefore, the objective of an ideal fishway is to make the dammed reach transparent to the movement of native species and to provide suitable migration routes, allowing unfettered access to free-flowing reaches above and below the obstacle.
Therefore, for the purpose of supplying a comfortable migration route for fish, the hydraulics, fish swimming capacity, physiological limits, and ecological, environmental conditions in the rest pools, inlets, and outlets of fishways are all key elements of fishway design [8,18]. In order to adapt to fish migration in various river hydraulic conditions, many types of fishways with various designs were built and classified as technical structures (pool-type, vertical slot, and Denil fishways, surface collector bypasses, pool and weir fishways, weir and orifice fishways, lateral-system fish ladders, mixed-system fish ladder, nature-like structures (nature-like bypass channels and fish ramps), and special-purpose structures (eel ladders, fish locks, and fish lifts) [10,18,19,20,21,22]. However, because local boundary conditions and hydraulics are complex, some fishway designs fail to provide an effective passage for a broad range of fish migration [23]. Among various emerging problematic issues, we list local large-flow velocity, intense turbulent vortices, sharp water-level drops [24,25], and ignoring the different migrating habits of fish at different life stages [26,27]. For example, there is only weir overflow in the conventional pools and weir fishways, which is detrimental to the movement of benthic fishes [28]. All of these problems indicate that fishways can be characterized by different levels of eco-friendliness to fish.
Pool and weir fishways, lot fishways, overflow weir fishways, submerged orifice fishways, and vertical slot fishways can provide safe environments for fish to both travel backward and rest [14,29,30], which is one of the reasons they are widely used. The design criteria for pool and weir fishways design are mostly based on salmonid swimming and behavioral characteristics and should be adapted to different local species for optimal performance, see, e.g., Mallen-Cooper, M. and Brand, D.A., 2007 [31]. The overflow weir fishway is equipped with multiple weirs, and the flow evolves in multiple water drops to reduce its stage, which contributes to maintaining a continuous water surface and adapting to the migration of fish with strong swimming ability. The submerged orifice fishway is suitable for fish migration in the middle and lower layers of channels; however, these fishes must pass through multiple orifices to reach the upper reach of the fishway [32,33,34]. In addition to structural fishways, new methods for piping fish upstream over dams were also proposed, as they are inferred to be able to offer a much higher lift than conventional fishways [35].
In order to adjust to the flow, there have also been some types of multistage weir plates with orifices used in fishways [29,36,37]. Typically, these have been one of three types of weir–orifice fishways with rectangular cross-sections: (1) No overflow at the weir crest, and only one orifice flow located at one side at the top. All the weirs are equally high, such as the UHE Sao Domingos. (2) Overflow occurs at the weir crest. One orifice is located at the bottom of the weir, and the other orifice is on the other side of the weir top. The heights of all the weir plates are the same, such as at Peixe Angical Dam and the weir and orifice ladder of the Canoas II UHE. (3) No overflow at the weir top. There are six orifices in the weir plate, which are divided into two rows and three columns. The heights of all the weir plates are the same; see the Engenheiro Sérgio Motta UHE as an example [29,36,37].
Fish ladders with weir and orifice structures (abbreviated WOs) were researched and described from sites worldwide [29]. The hydraulic characteristics of pool-type fishways were investigated by numerical simulation. Both the streamline characteristics and Reynolds stress distribution were presented [36]. Pebbles with various densities were laid at the bottom to adjust to the characteristics of the flow field [37]. However, the heights of the weirs in conventional weir structures or WOs are almost identical along the fish ladder, which results in a lack of flexibility and fails to adjust to complex boundary conditions, such as the transition reach connecting two contrasting cross-sectional channels of the fishway. As opposed to the case of general fishways, the transition reach is usually designed as a non-prismatic channel. Thus, the heights of the multistage weir plates and the sizes and numbers of the bottom orifices need to be designed to as varying step by step along the way, based on a reasonable split ratio, to meet the specific requirements of fish migration [38,39]. To support further research on these topics and overcome the current design challenges, it is necessary to explore the improved WO to ensure smooth transition sections and to satisfy the migration needs of the fish.
In this study, we focused on a new modified weir–orifice structure. Different from conventional WOs with constant height and shape, the new modified weir and orifice structure provides a sequence of stage weir plates with bottom orifices that vary step by step along the channel. It is named the differential weir and orifice structure (abbreviated DWO). The DWO was also designed to ensure the smooth variation of the water surface and the connected bottom orifice flow, satisfying the needs of fish migration. The hydraulic behavior of the modified WO structure (i.e., DWO) and the eco-friendliness to migrating fish need to be assessed reliably. Therefore, it is crucial to focus on its ecohydraulic characteristics and conduct validation experiments and field monitoring [40,41,42,43]. The design method and the hydraulic elements of the DWO structure are explored in this paper, aiming to provide velocity distribution, turbulence characteristics, and the recirculating flow structure that are designed to favor fish passage, using both numerical simulations and scale-model laboratory tests based on a large fishway project in China.
2. Material and Motivation
2.1. Hydraulic Properties of the Multistage Weirs and Multistage Orifices in Fishways
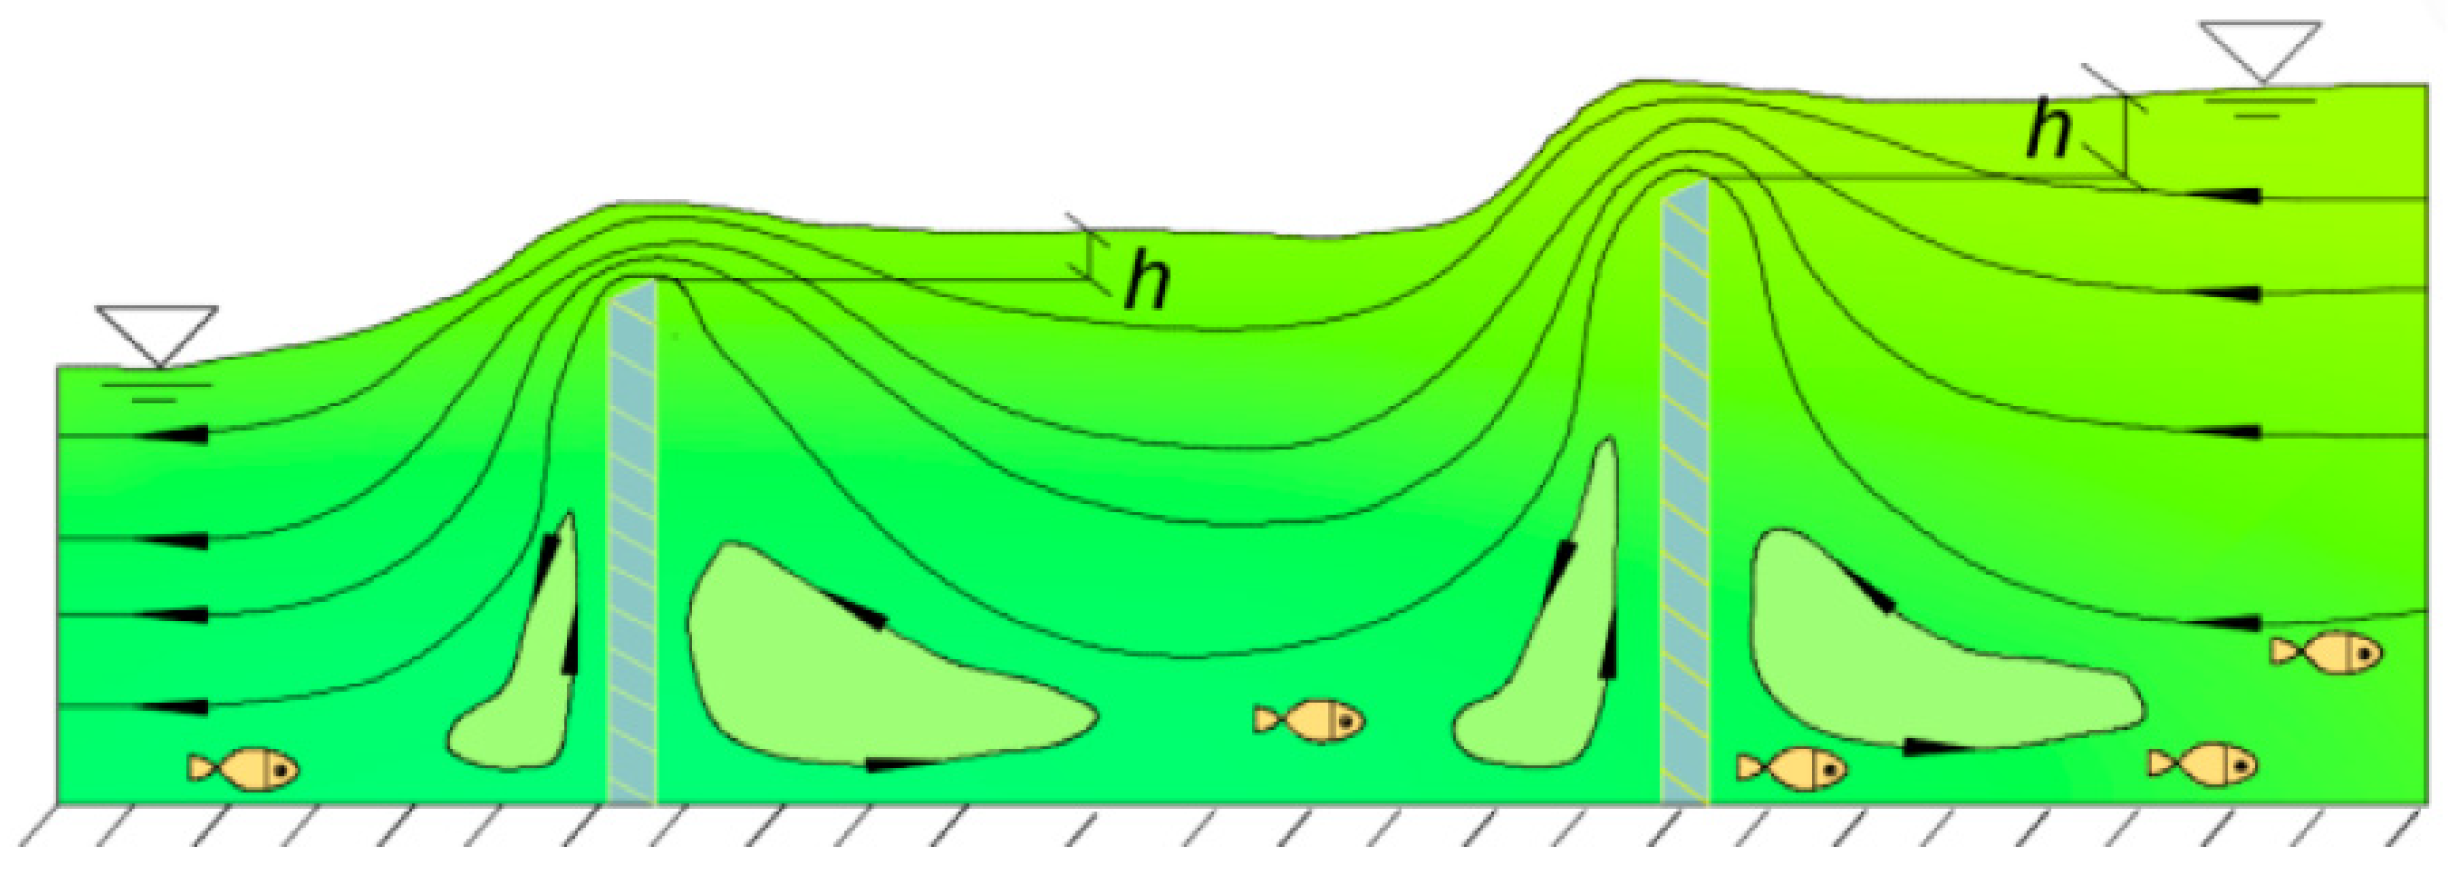
An overflow weir is a structure that discharges flow over the top of the weir. Figure 1 shows the typical overflow pattern of the weir, which is composed of two-stage sharp-crested weirs. When there is a high water head drop in the local reach of a river caused by a dam, multistage weirs are usually adopted in fishways to connect the high water head drop by means of multistage overflow. Close to the weir, the flow velocity decreases while the water level upstream increases at the same time. From the vertical view, in approaching the top of the weir, the velocity increases rapidly because the cross-sectional area of the flow gradually shrinks. The flow over the top of the weir has a continuous head drop that is transferred partly into kinetic energy as the potential energy decreases and partly into turbulence kinetic energy or energy loss [30,31]. The lower part of the weir is a quasi-static area that fills with a transverse spiral flow, which is beneficial to fish rest and other benthic hydrobionts, i.e., forming a natural ecological environment. Normally, the intervals of multistage weirs are small, and multistage waterfalls would be formed as a transition of local water head drops. The velocity at the top of the weir and the water-level difference over the weir are the critical factors for migrating fish to pass through.
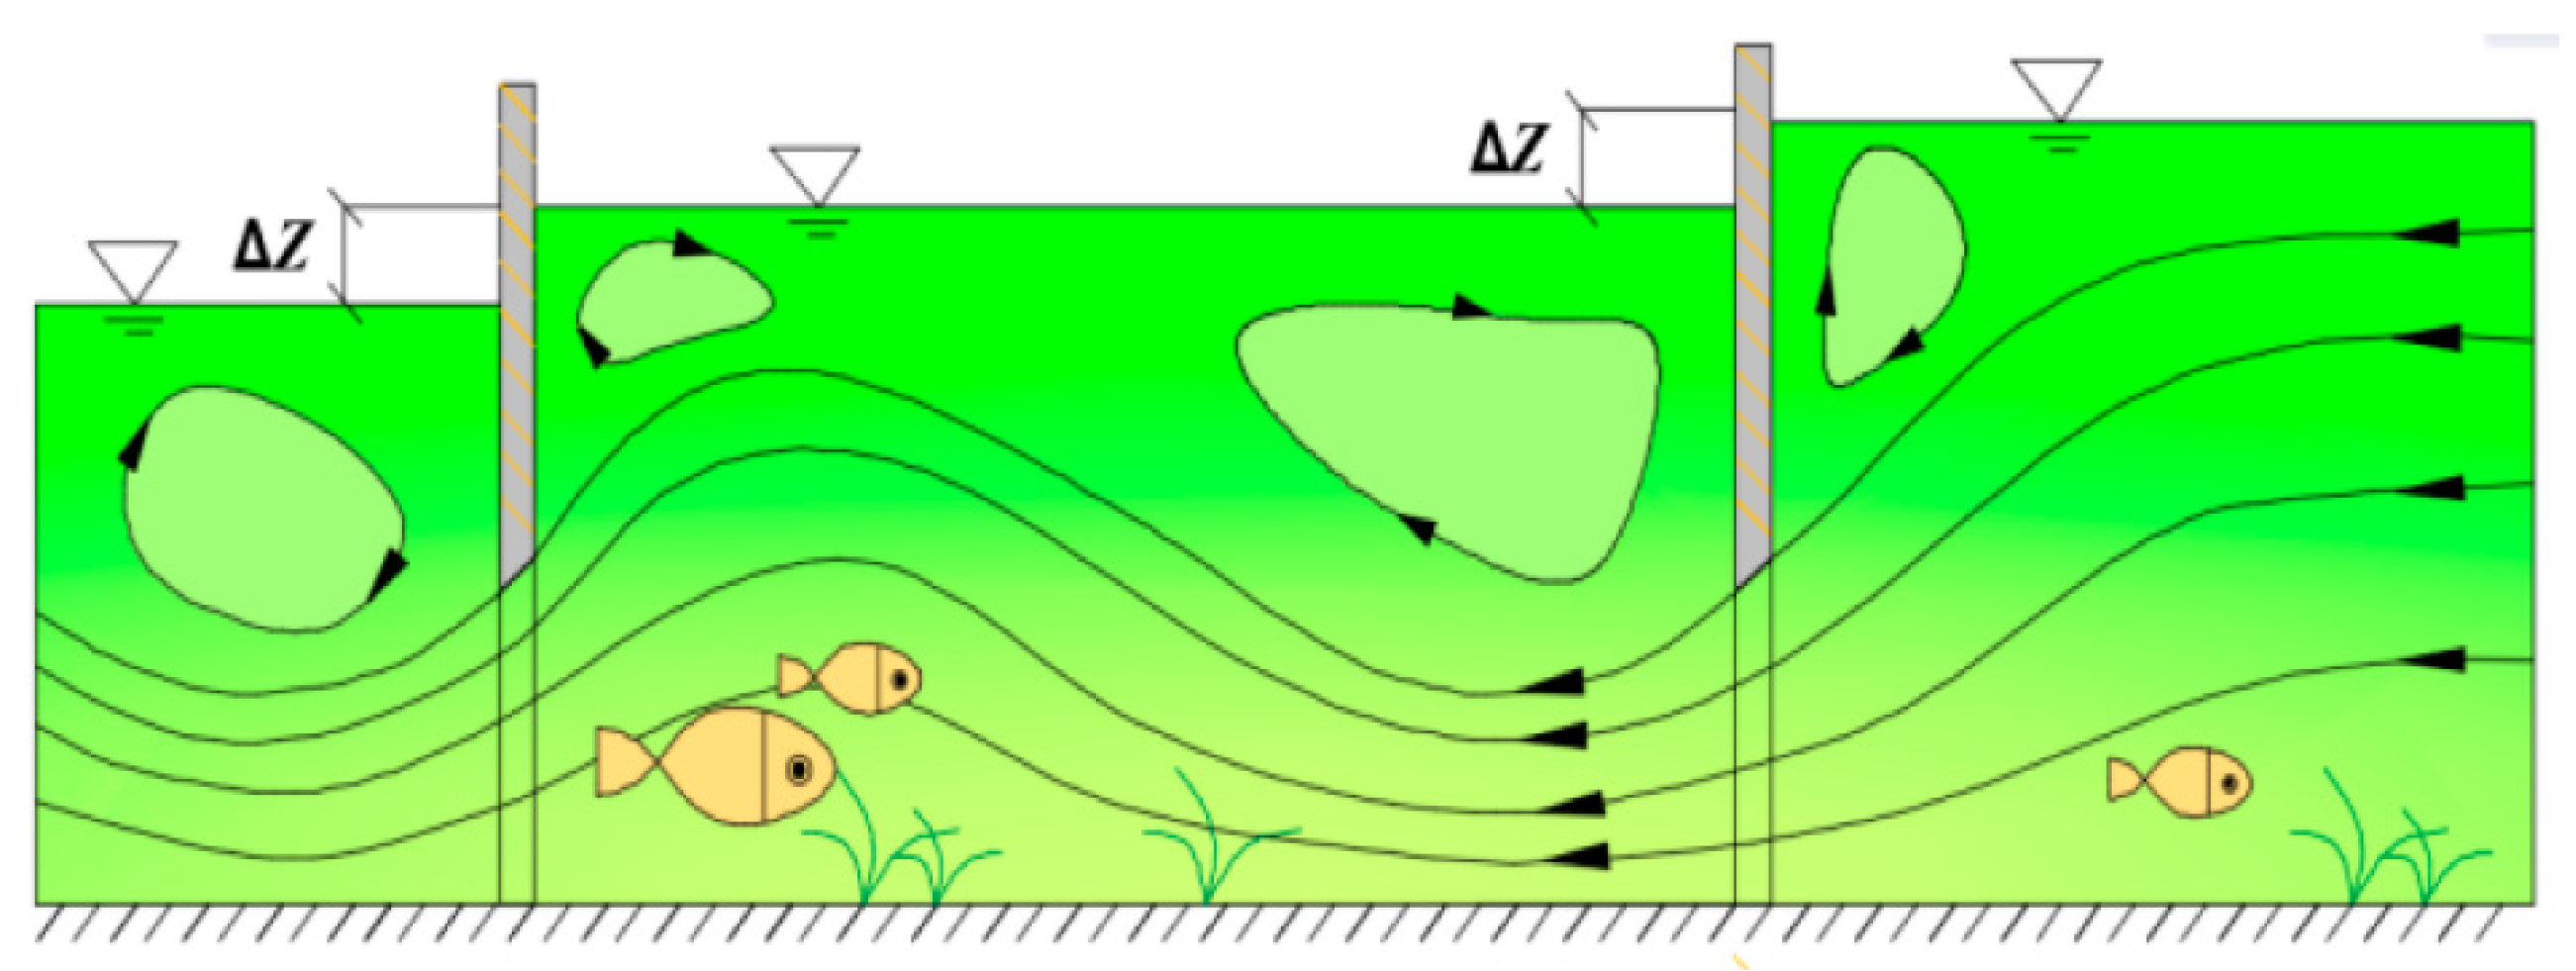
The orifice outflow is the bottom flow, and the typical orifice flow patterns of the two stages are shown in Figure 2. Multistage orifices are also usually adopted in channels or fishways to connect the water head drop caused by a dam. Under submerged outflow conditions, the streamline distribution in front of the orifice contracts, and the flow velocity increases gradually. The water head in front of the orifice is attributed to the size and position of the orifice. Downstream of the orifice, affected by inertia, a contraction section forms at about 0.5D to 1.0D away from the orifice, where D denotes the bore diameter. Then, the distribution of the streamlines begins to expand again, and the velocity of the orifice decreases gradually downstream. There is continuous bottom flow formed in the multistage orifice outflow, in which the streamline distribution contracts, expands, and contracts again, alternately. Downstream, away from the orifice outflow reach, the water depth increases, and the velocity decreases gradually, which supplies a suitable environment for fish habitation and the growth of aquatic organisms. As the orifice velocity is attributed to the water depth in front of the weir, the water depth of the fishway should not be so high that it prevents fish from passing because of the high orifice velocity. Therefore, the size and velocity of the orifice are critical parameters that affect fish migration [44,45,46,47,48].
2.2. Modified Weir–Orifice Structure (DWO) and Its Features
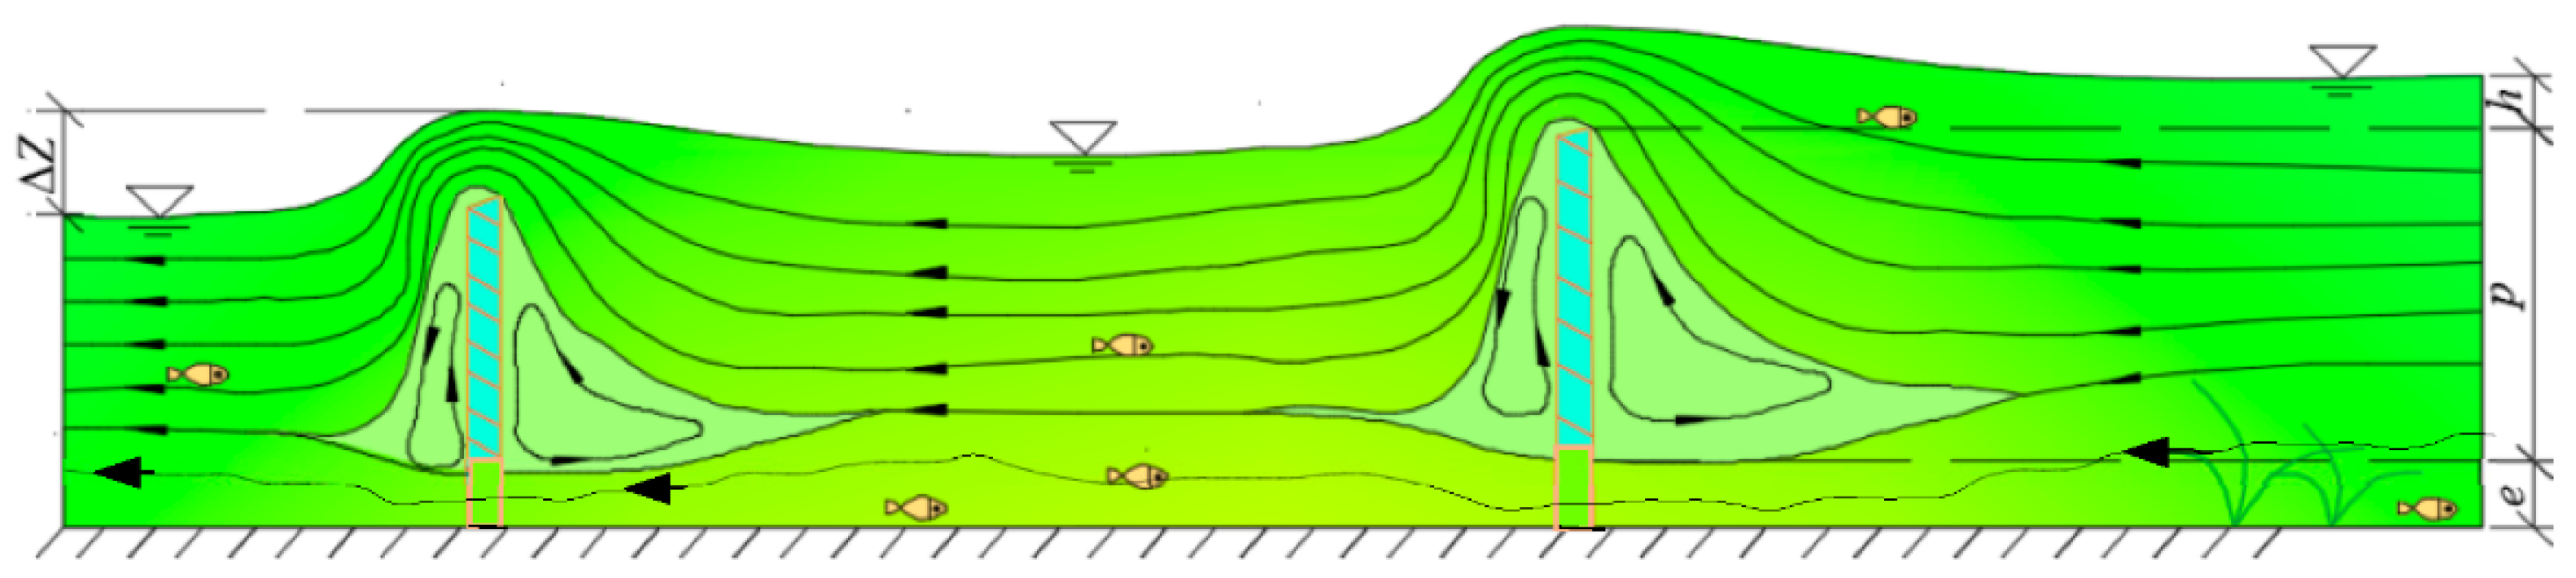
The DWO is a modified WO structure composed of a differential weir and orifice that adapts well to the transition reach with varying cross-sections and water depths along the channel. The flow pattern of the DWO combines the advantages of the two current typical outflows, i.e., weir outflow and orifice outflow, which can smooth the flow transitions by forming a continuous water surface and connecting the bottom outflow. The form and size of the weir–orifice plate at each stage are different, as shown in Figure 3. The different boundaries around the weir and orifice cause them to form two different flow patterns with different characteristics and discharging capacities. Additionally, there are still some common properties between the weir overflow and orifice outflow, and the outflow capacities of both depend on the upstream water level. Moreover, from an energy point of view, both present progress in that potential energy is converted into kinetic energy gradually in the discharging flow, which means that the outflow progress of the DWO structure can cause a series of local head losses.
2.3. Focus Issues
To obtain the tranquil flow and suitable velocity for fish migration, we had to solve three focus issues. Initially, the number of stages and the weir heights of a multistage DWO needed to be calculated to smoothly connect the downstream and upstream water levels of a certain difference and cause the fish to migrate step by step. In addition, the proper split ratio of the weir overflow discharge to the orifice outflow needed to be calculated according to the purpose of the vertical symmetry of the flow field. Finally, the shape, amount, and size of the orifice needed to be designed to supply the suitable velocity for migrating fish to pass through.
For the purpose of these three critical issues, it was necessary to conduct theoretical analysis and simulation research according to the needs of both hydraulics and ecology. The following two steps were performed:
- 1.
- We analyzed the diversion relationship (between the weir and orifice) of the DWO and investigated the calculation method based on hydraulic theory. Then, the design principle of the DWO structure applied to a fishway was obtained, and the hydraulic design methodology considering the habits and biological demands of migrating fishes could be proposed.
- 2.
- We used a proposed fishway project as an example and designed a DWO structure to connect the two reaches upstream and downstream with a high head drop. Then, the hydraulic properties of the DWO and their potential effects on fish migration were studied by means of 3D hydrodynamical numerical simulation and a hydraulic physical-scale model experiment. A series of experiments were conducted, including two cases: Case S1 for the conventional multistage weir scheme and Case S2 for the modified multistage DWO scheme. In addition, the hydraulic characteristics of the two cases, such as the longitudinal water-level (surface) profile, velocity field, flow regime, and turbulence energy distribution, among others, were studied, assessed, and compared. Finally, the optimization technology parameter of the DWO structure fishway could be given.
3. Basic Principle and Design Methodology
3.1. Hydraulic Principle of DWO Structure Design
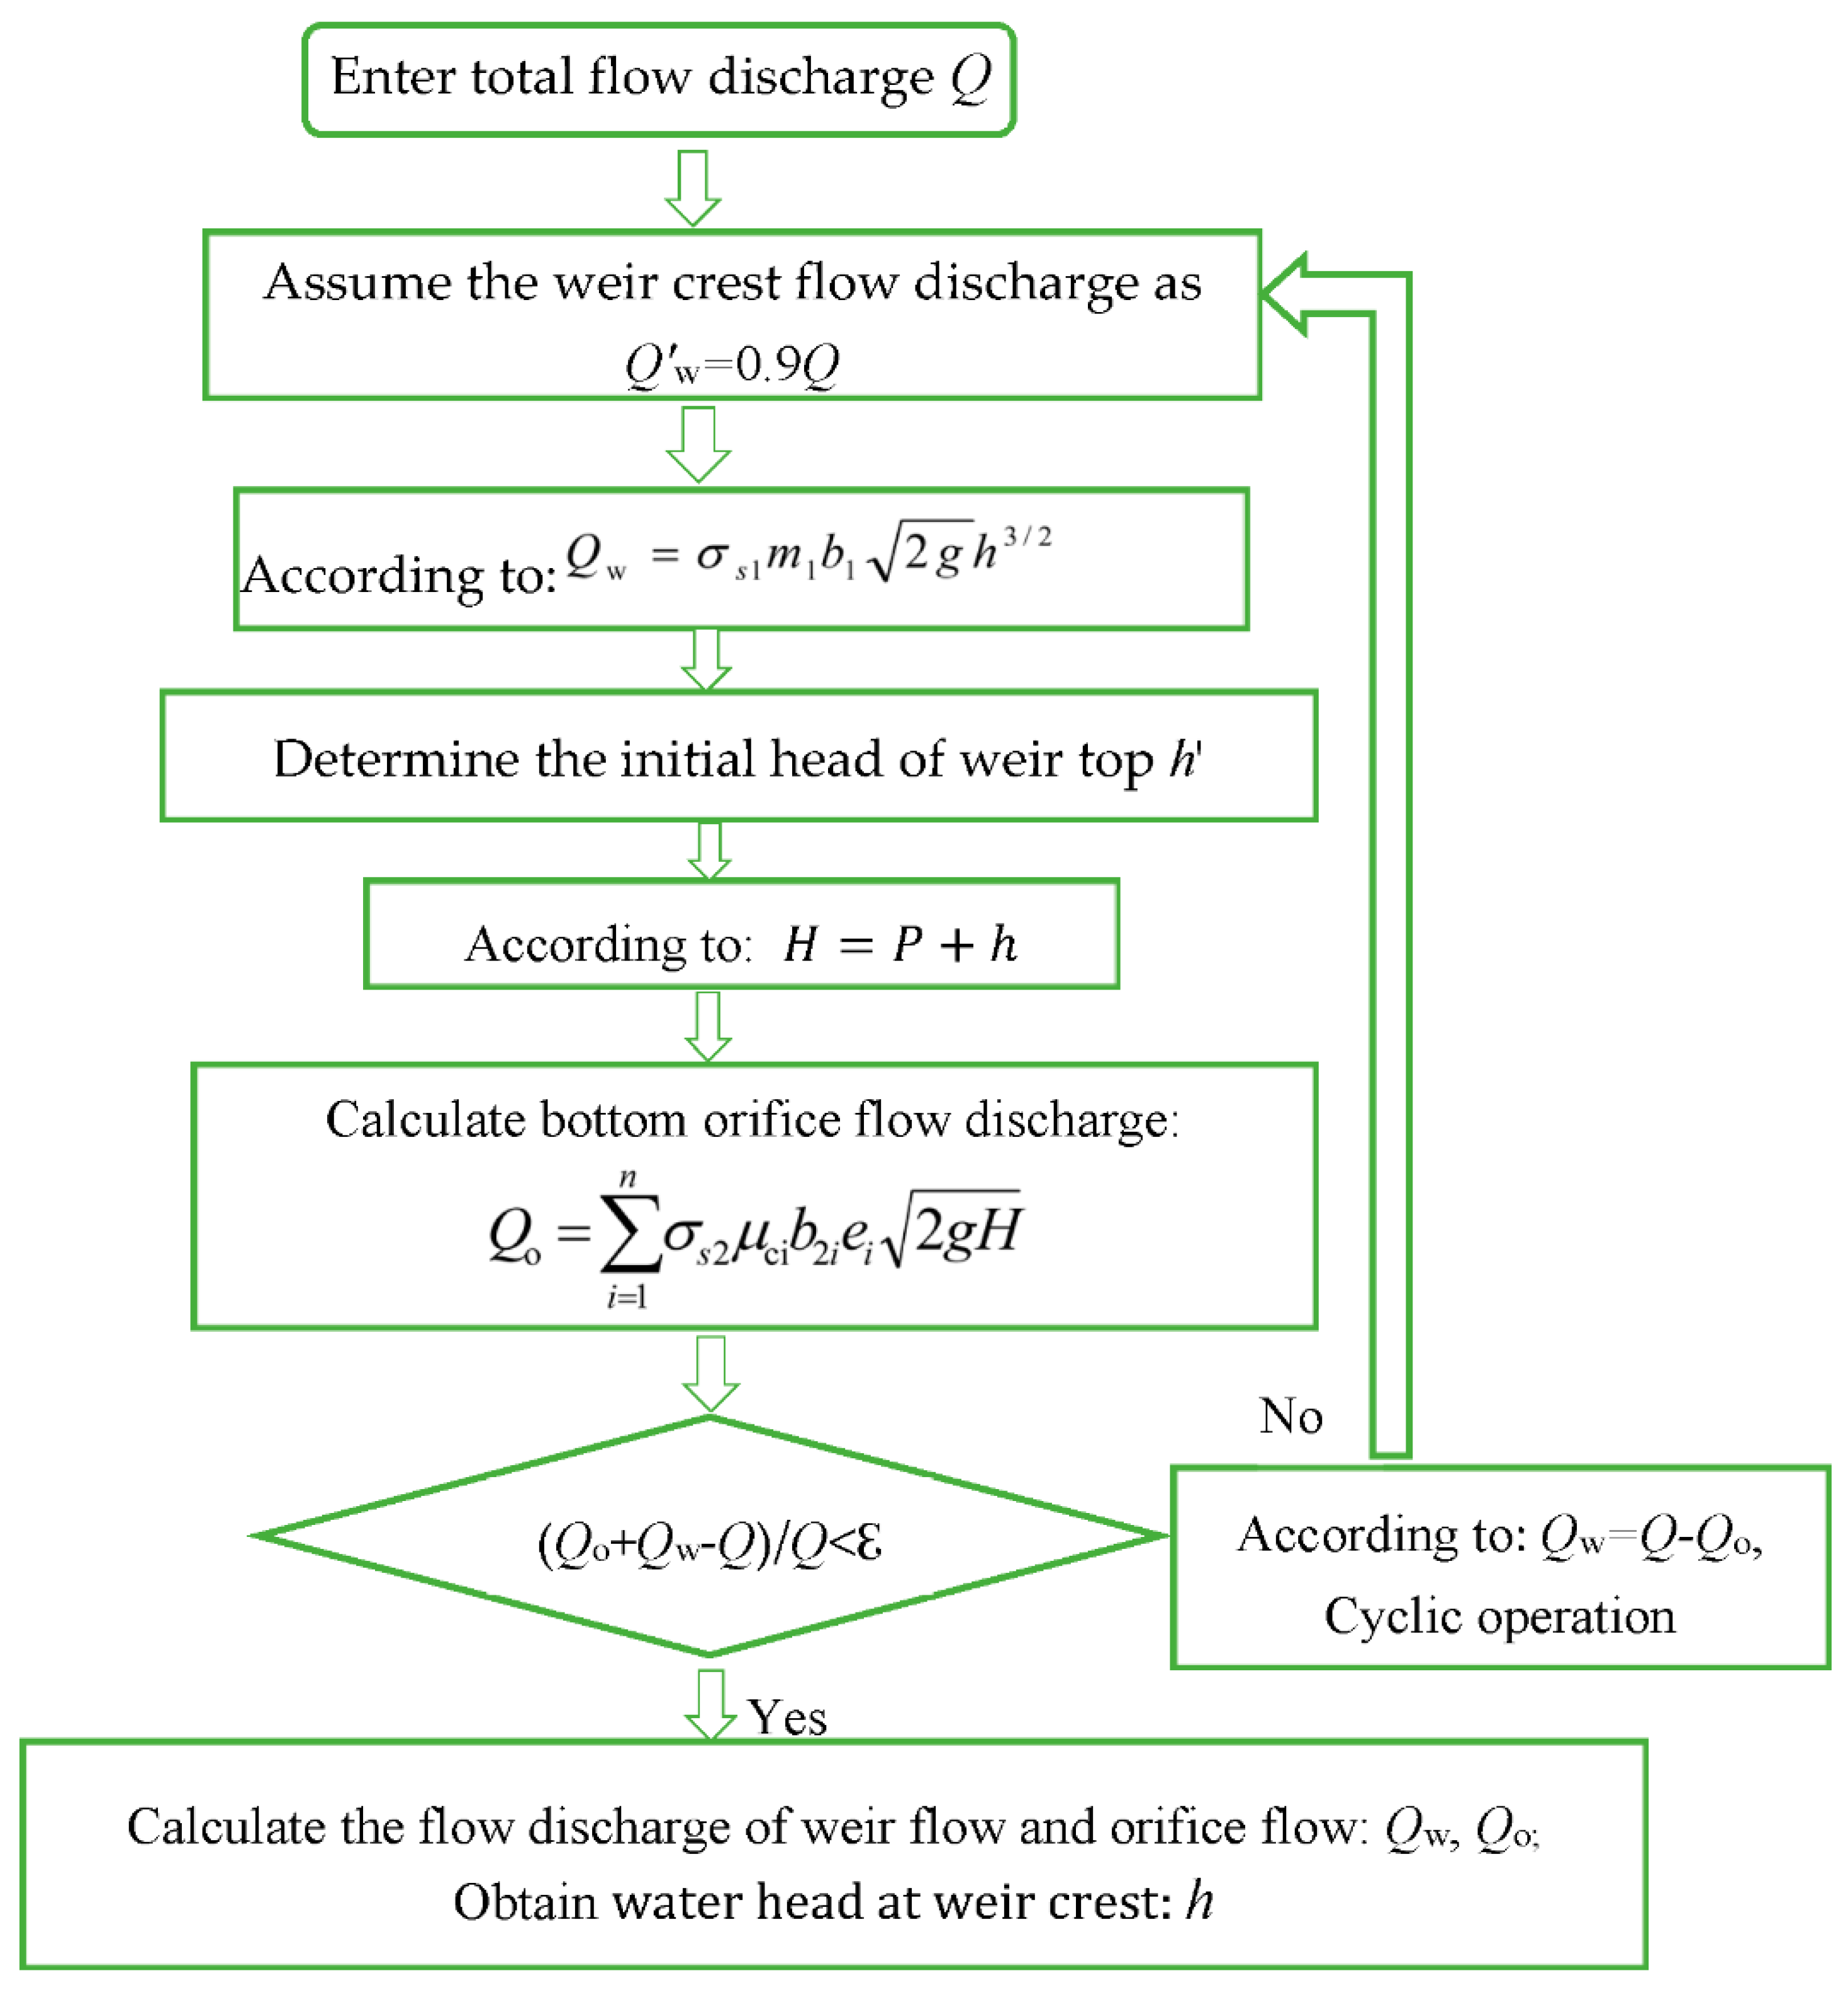
For the purpose of investigating the hydraulic characteristics of the DWO outflow, a hydraulic physical-scale model was designed and built to simulate the outflow of the DWO in the laboratory, based on basic hydraulic principles and similar conditions. The outflow of the DWO should not only follow the movement laws for both weir flow and orifice flow but also be restricted by the common boundary and flow conditions. The calculation process is shown in Figure 4 and described as follows.
- 1.
- The calculation of the weir overflow: the discharge capacity of the submerged weir flow can be derived using the following energy equation:
h = H − P
- 2.
- The calculation of the orifice outflow: the discharge capacity formula of the orifice submerged outflow can also be obtained by using the following energy equation:
- 3.
- The calculation of the DWO outflow: by combining the characteristics of two discharging structures, i.e., a weir and bottom orifice, the DWO discharges flow by both the weir overflow and the bottom orifice outflow synchronously at each different stage. According to the principle of mass conservation, the flow discharge should satisfy the following formula:
By using the gate outlet discharge formula, Qo (the DWO plate) can also be expressed as follows:
where denotes the submerged coefficient of the bottom outflow, which reflects the submergence degree of the orifice outflow; b2i and ei denote the width and height of the bottom hole, respectively; and H denotes the local water head, which depends on the sequencing number of its stage plate.
- 4.
- The association between the weir overflow and orifice outflow in the DWO structure: the commonality between the weir flow and orifice flow is that their flow capacities are both attributed to the water depth H before the DWO plate and the water head difference ∆z between upstream and downstream of the plate. In addition, their flow capacities are affected by each other as the boundary condition of each stage plate changes. ∆z depends on the water level downstream and is usually attributed to the total water head drop of the reach and the number of multistage weirs.
Taking the split modulus β as the index indicates the split ratio of the weir flow discharge to the orifice flow discharge. According to Equations (1) and (5), the formula for determining β can be obtained as follows:
where the meaning of the parameters in Equation (6) is the same as in the preceding formulae.
Based on theoretical analysis and the formulae above, the split hypothesis of the weir flow and orifice flow was obtained. The weir flow, dominated by gravity, controls the surface flow movement and accounts for a large portion of the flow discharge of the DWO, where Q varies with H3/2. However, the orifice flow depends on the pressure of the outflow, i.e., the control of the bottom flow, and its discharging capacity is less than the weir flow, where Q is proportional to H1/2. On the basis of the weir flow, setting an appropriate orifice flow is helpful for reducing the water head difference and velocity at the weir top, and the velocity of orifice flow can also be controlled in the limited range. Considering the flow discharge and the fish passage conditions, the minimum difference between the velocity passing through the DWO and the velocity the fish prefer was taken as the key parameter, and the proper split modulus β was controlled as 0.18 and 0.34. The results above are based on the experimental data and theoretical analysis [49] and can meet the basic requirements of both the preferred velocity and space. The theoretical derivation and analysis of the optimal split ratio of the DWO fishway are referred to in other papers.
- 5.
- The routine of calculating the split ratio of the weir flow to orifice flow: when the flow discharge Q, height of the weir P, and width b and height e of the orifice were given, the split ratio of the upper and bottom flow in the DWO had to be determined by trial calculations. The whole routine was as follows:
- (i)
- We assumed that the weir overflow Q′w accounted for 90% of the total flow Q, and then the initial weir crest head h′ was calculated according to the weir flow Equation (3);
- (ii)
- According to the relationships among the weir height P, the weir crest water head h, and the water depth in front of the orifice H, the water depth H′1 in front of the weir was determined;
- (iii)
- Using H′1 and Equation (5), the bottom orifice flow discharge Q′o was calculated;
- (iv)
- We checked whether the sum of Q′w and Q′o followed the mass conservation principle, i.e., Equation (4). If the error was less than the error limit ε, which usually takes the value of 0.001, then the Q′w and Q′o were obtained. Otherwise, if the error was larger than ε, we set the weir flow discharge as Q″w=Q − Q′o, and repeated Steps (ii), (iii), and (iv) until the error met the requirement. The calculation process is shown in Figure 4.
By using the MATLAB platform and after putting the relative parameters into the program, the flow discharges of the weir flow Qw and orifice flow Qo could be obtained given the discharge Q and the water head drop ∆z between two stages. Once the split modulus β met the requirement in Step (iv), the hydraulic design of the weir overflow and bottom orifice flow could be achieved.
3.2. Hydraulic Design Methodology of DWO Structure in the Fishway
By setting up a differential multistage weir–orifice (DWO) in a fishway, the split ratio of the top to bottom outflow in each stage could be easily adjusted by means of the weir height and orifice size. Therefore, the flow velocity and water depth could meet the requirements of fish passage in different vertical layers of the flow field [50].
3.2.1. Design Essentials in Transition Reach of Fishway
Firstly, it was necessary to reasonably allocate the water head difference in each stage. According to the total head difference in the transition reach, the stage number of the DWO component should be set reasonably to avoid an excessive drop between the two stages, which causes a velocity that is difficult to meet the requirement, but an extremely small difference will also cause complex boundaries and unnecessary construction.
Secondly, the water head difference should meet the conditions of migrating fish passage. The weir height and water head drop between the stages would affect the velocity and depth at the weir top, which should be set reasonably to meet the preferred conditions that fish would prefer to pass through. The size of the orifice is associated with the fish size or fish fullness, while the velocity of orifice outflow should be controlled at the preferred velocity of the fish and less than the burst ability of fish swimming. According to the main requirements for the passage of fish that should be met, specifically, the diameter of the orifice should be greater than 1.5 times the median fish width, and the velocity of the orifice flow should be less than 2.4 m/s [51]. The number and layout of orifices also affect the split ratio and the characteristics of the flow field near the bottom, so it must be arranged reasonably to satisfy the preferred conditions of the fish passage and rest.
3.2.2. Hydraulic Design Method
- According to the head drop of the entire fishway, the grade head difference and weir heights of all the levels of thin-walled weirs could be designed preliminarily; therefore, the water head of the weir top and the split ratio at all of the levels of the DWO were further determined.
- Based on this, the bottom orifice size of the thin-walled weir was designed preliminarily, and the orifice velocity was adjusted at the same time according to the requirements for fish crossing.
- The holes were designed as follows. Firstly, according to the habit of fishes that prefer to swim along the sidewall at the channel bottom, there are holes set in both the left and right sides at the bottom of the submerged weir for fish passage. Then, the size and position of the other holes were designed according to the needs of flow splitting.
- According to Figure 4 and Equations (1)–(5), the hydraulic design of the DWO was carried out, and the related indexes, such as the weir height and orifice size and position, could also be adjusted according to the demand of fish passage. Moreover, increasing the roughness of the fishway bottom could also be one of the methods to control the water depth and velocity near the bed.
4. Case Study and Result
4.1. Project Description and Research Method
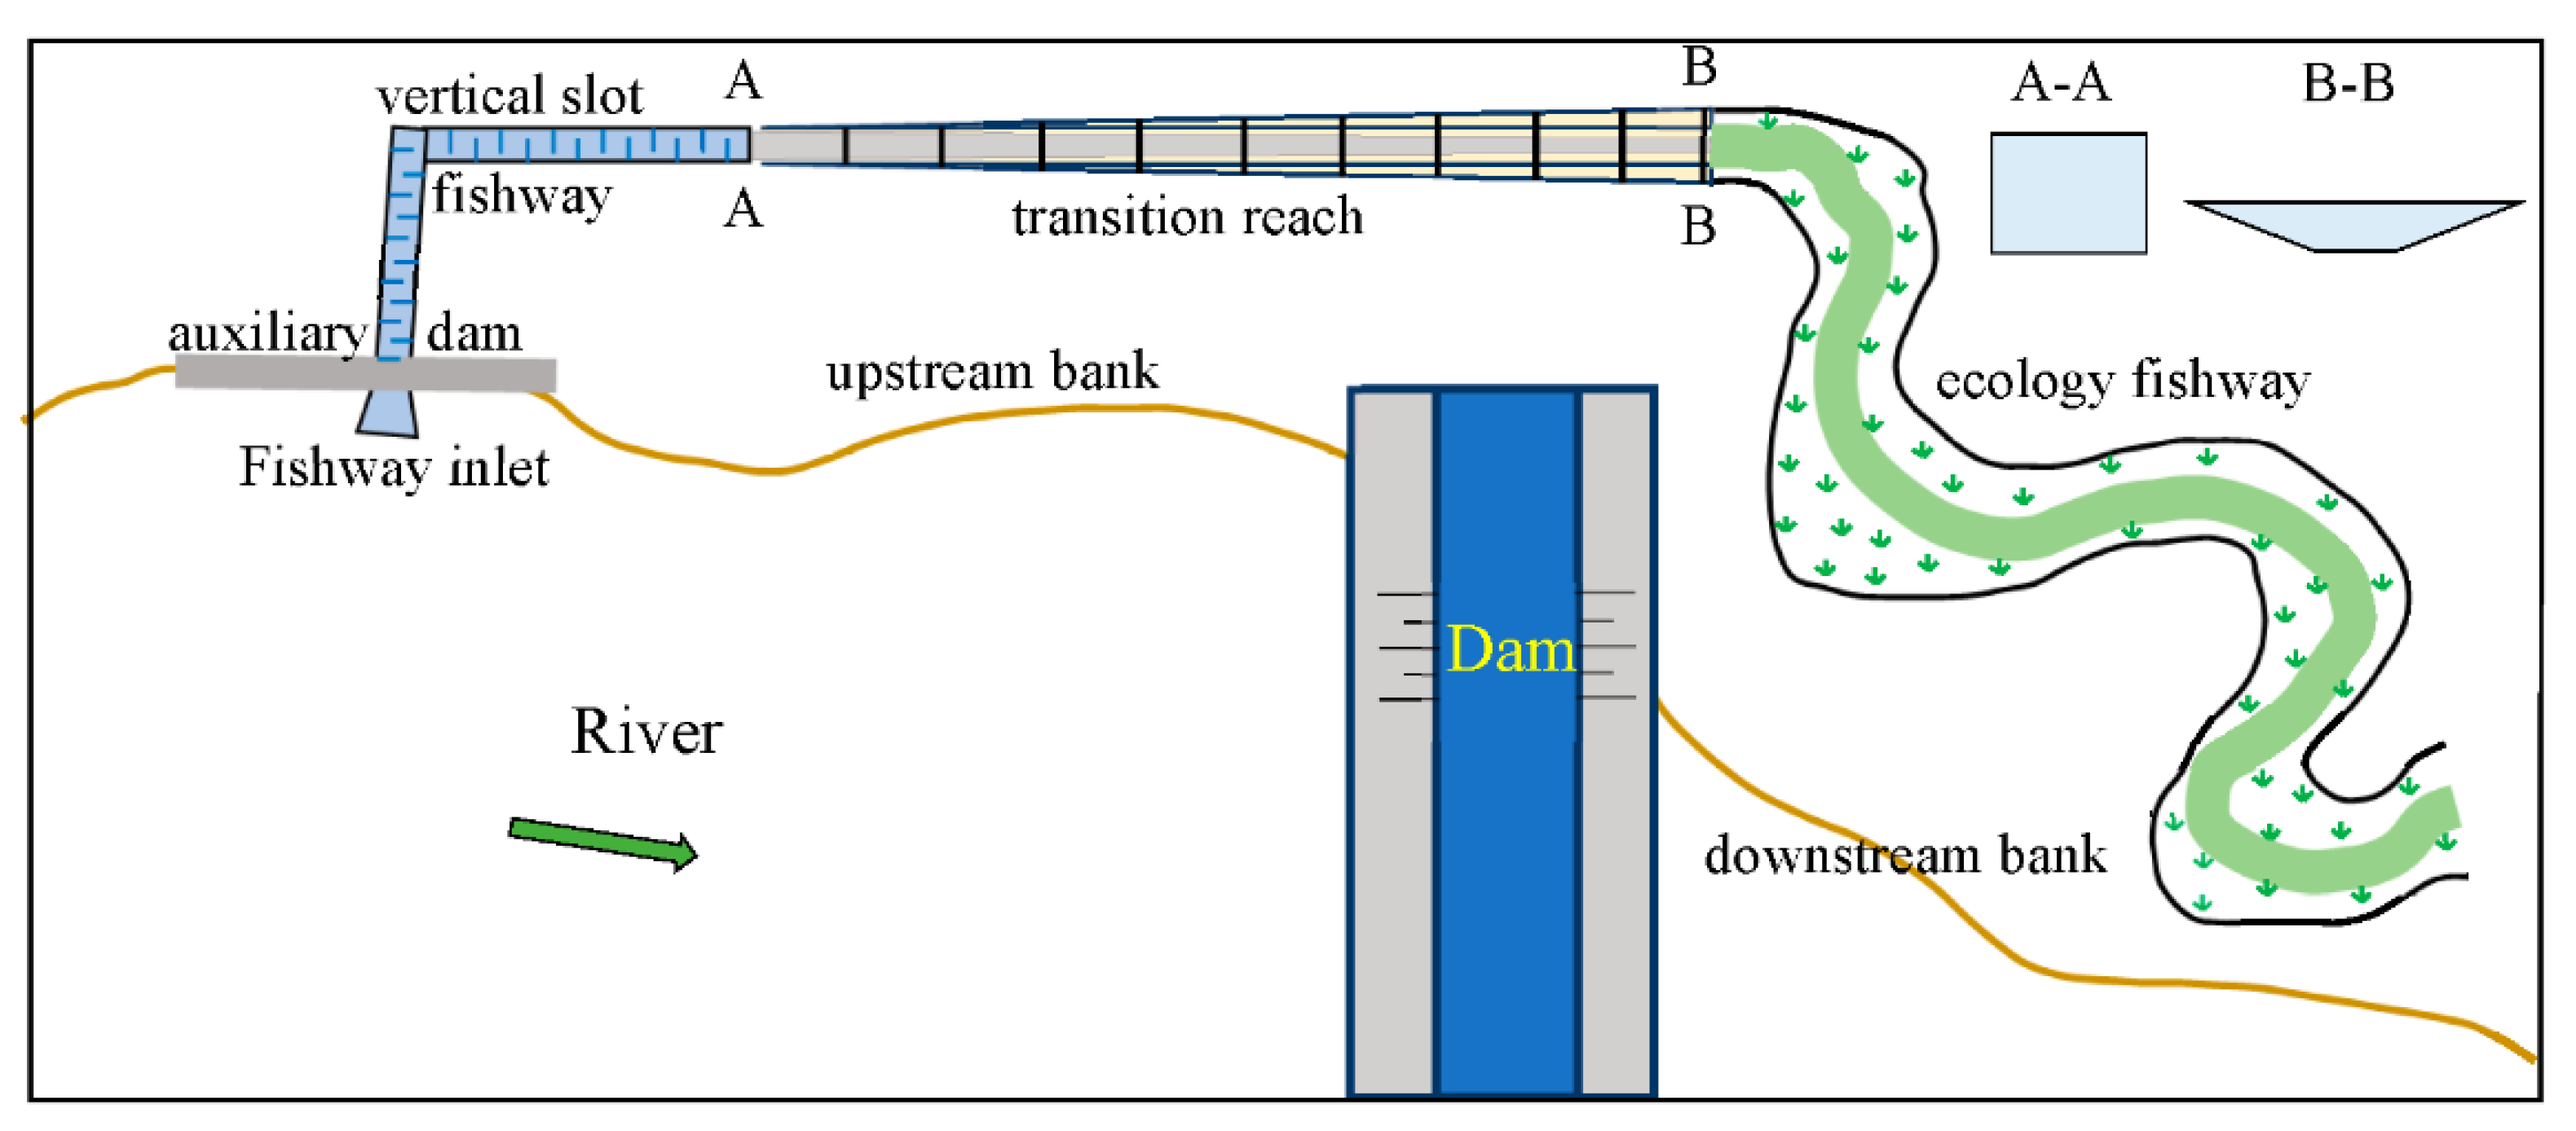
Based on the theoretical analysis and calculations above, the hydraulic characteristics of the DWO structure in the transition reach of the fishway were researched by means of a numerical simulation and model experiment. Taking a large proposed fishway project as a case, the layout of the fishway is shown in Figure 5.
To supply a passageway for fish migration in the river that is cutoff by a dam, the fishway project would be built on the left bank of the river. To adapt to various water-level conditions of the river, two fishways with two inlets in different locations were designed in the project, only one of which was considered in this study, as shown in Figure 5. The fishway consists of three reaches. The first reach is the vertical slot fishway with a rectangular cross-section of 5 m (width) × 3.5 m (depth) that starts from the dam upstream. The third reach is the ecological fishway downstream of the dam, with a meandering channel of over 1300 m long, which was designed to imitate a natural river.
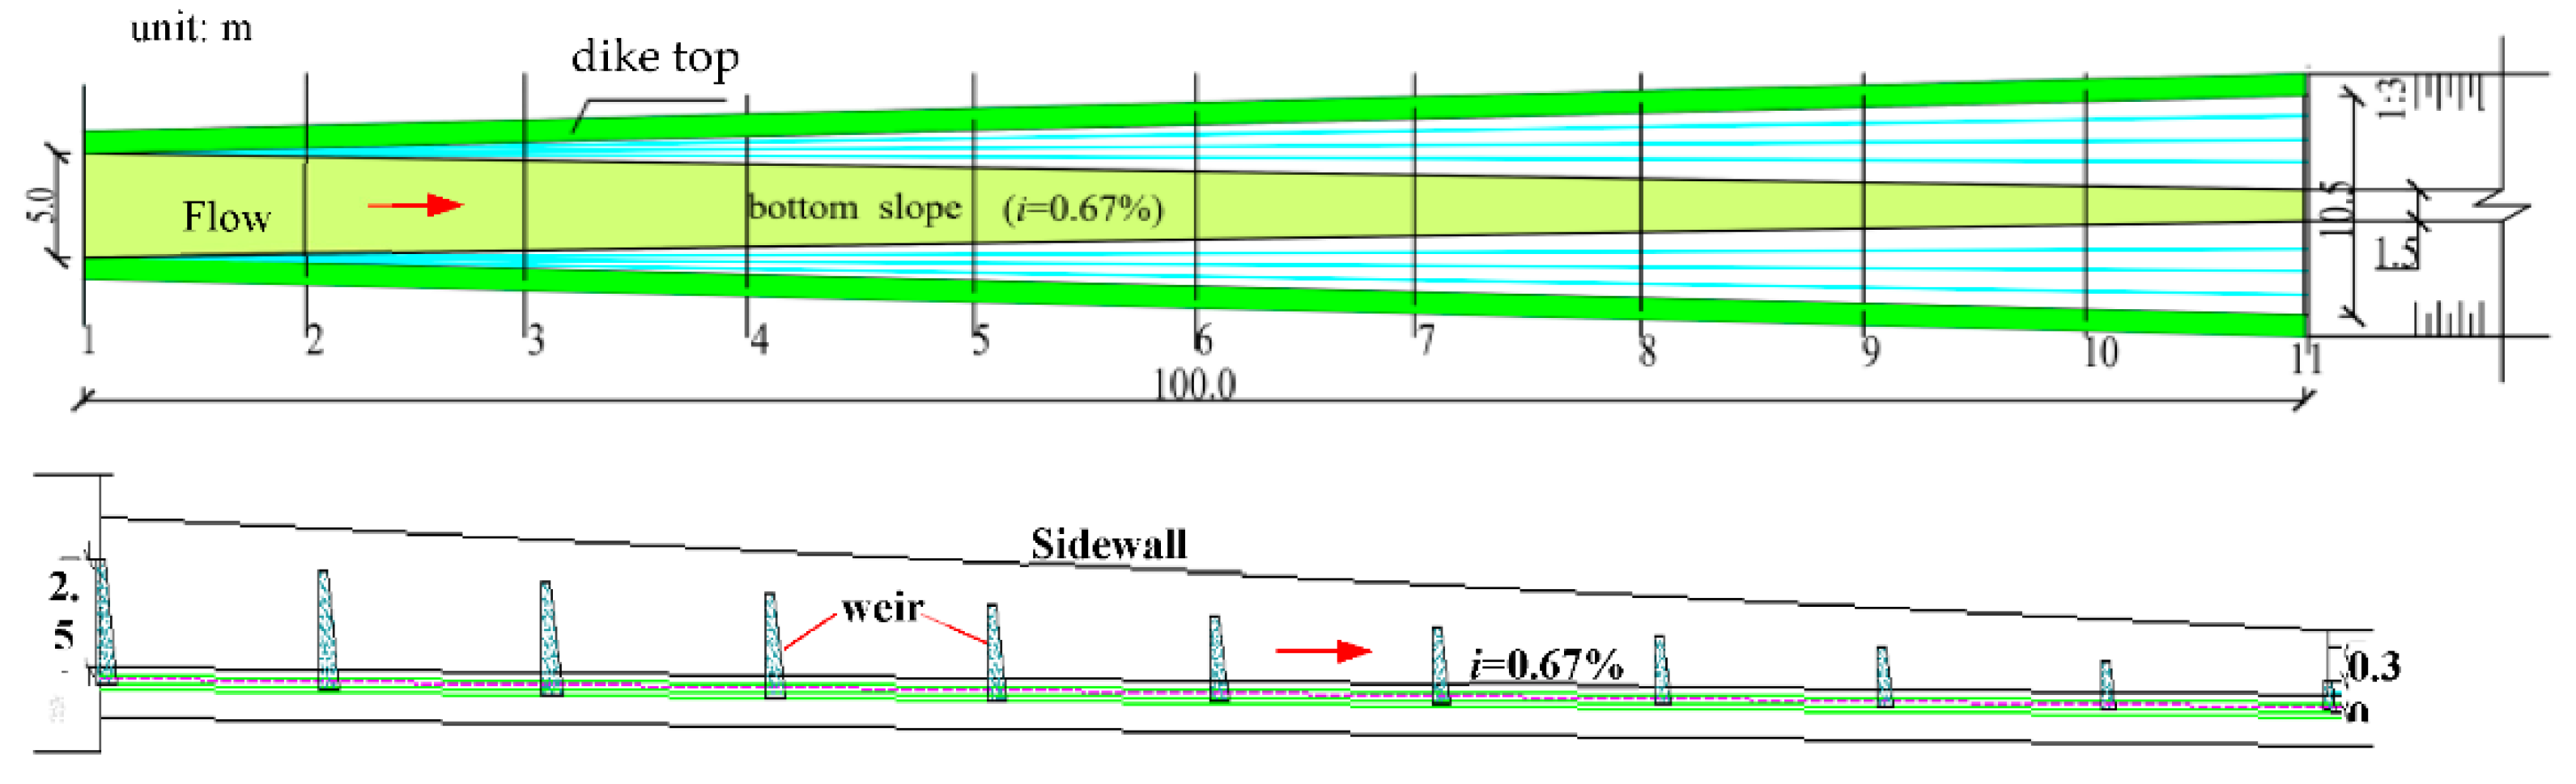
The middle reach that connects the vertical slot fishway and ecological fishway is the transition reach. It was designed as a non-prismatic channel, the inlet of which has a rectangular section similar to the vertical slot fishway, while the outlet has a trapezoid cross-section similar to the ecological fishway. Therefore, the sidewall of the channel was designed as a twisted surface, and the bottom slope is 6.7‰ in the transition reach. In the channel, the depth and the bottom width decrease along the channel, while the sidewall slope and top width of the channel both increase correspondingly. In the outlet, the depth of the channel is only 1.5 m, and the bottom width decreases from 5.0 to 1.5 m, while the side slope is up to 1/3. The total water head drop of the transition reach was designed to be 2.5 m so as to connect the two types of fishway, i.e., the vertical slot fishway and the ecological fishway. In order to eliminate the steep hydraulic slope, 11 stages of submerged weir plates at equal distances were designed in the transition reach, where the heights of the weir plates decreased from 2.5 to 0.3 m. The multistage weir plates play a role in reducing the local head drop of each weir significantly, i.e., the water depth difference before and after the weir decreases significantly, making the flow more tranquil according to the design. The transition reach is 100 m long, and the layout is shown in Figure 6.
Most of the freshwater fishes living in the river in which the project is located are migratory fish stocks, including Squaliobarbus curriculus, Elopichthys bambusa, Ctenopharyngodon idella, Aristichthys nobilis, Megalobrama terminalis, and Cirrhinus molitorella, among others. According to related research, the burst swimming speed of these fishes is about 1.3 to 2.7 m/s, and the ideal velocity (preferred velocity) for migration is about 0.6 to 1.5 m/s [49]. Therefore, the maximum flow velocity in the fishway should be limited to the burst swimming speed of the migrating fish.
Based on the project conditions, the following research was conducted. Firstly, according to the research results of the DWO described above, the optimized structure of the DWO was designed based on the concerning problems and focus issues. Then, a 3D hydrodynamic mathematical model and a hydraulic scale model of the fishway were established. Moreover, through numerical simulation and model test research, the two different structures were compared and evaluated. The feasibility of the application of the DWO structure in a non-prismatic channel was also verified.
4.2. Focus Issues in the Transition Reach of the Fishway
In the hydraulic model experiments of Case S1, i.e., the multistage conventional weir scheme in the transition reach, it was found that the hydraulic slope in the transition reach was too steep and up to 2.5%, where the water depth changes from 3.2 m (upstream) to 0.7 m (downstream). The local hydraulic slope between the two weir plates was up to 4%. The head drop before and after each weir plate was generally around 0.4 m, and the local drop could even be as much as 0.5 m. It was also shown that the flow regime downstream of each weir was mostly turbulent and disordered. The main reason for this might be that the vertical velocity profile distribution was extremely uneven. The velocity near the weir crest was up to 2.5 to 3.2 m/s, while the velocity was very low in the middle and bottom layers, where backflow even occurred. Compared to the swimming ability of the migrating fish listed above, obviously, the velocity of the weir crest was too high, which might be one of the largest obstacles to migrating fish. Therefore, it was necessary to try to adjust the flow structure so as to improve the ecohydraulic efficiency of the fishway.
4.3. Optimized DWO Scheme Based on the Case
To solve the transition problems caused by the large water head drop of about 2.5 m within a short distance of about 100 m, a modified differential weir–orifice (DWO) scheme was proposed. Based on the boundary characteristics of the transition reaches, the hydraulic design was conducted according to the method described in Section 3, and the modified scheme (DWO) was obtained by means of hydraulic simulation and hydraulic model test verification. In designing the structure of the DWO, there were several steps to complete, including reducing the water head drop of each stage weir by means of adjusting the split ratio of the weir flow discharge to the orifice flow, reducing the overflow velocity of the weir crest, and placing rough boulders in the bottom and improving the flow regime of the pool. The detailed adjustment scheme of the DWO is shown in Figure 7 and described as follows.
- Weir plate: a new weir plate was inserted between every two original weirs, with the same interval of 5.0 m, for a total of 21 weir plates. The water head drop of each weir was designed as 0.1 m, and the water depth on the weir crests ranged from 0.35 to 0.45 m. In addition, orifices were set in each weir bottom, with split ratios (weir to orifice) ranging from 0.65 to 0.82.
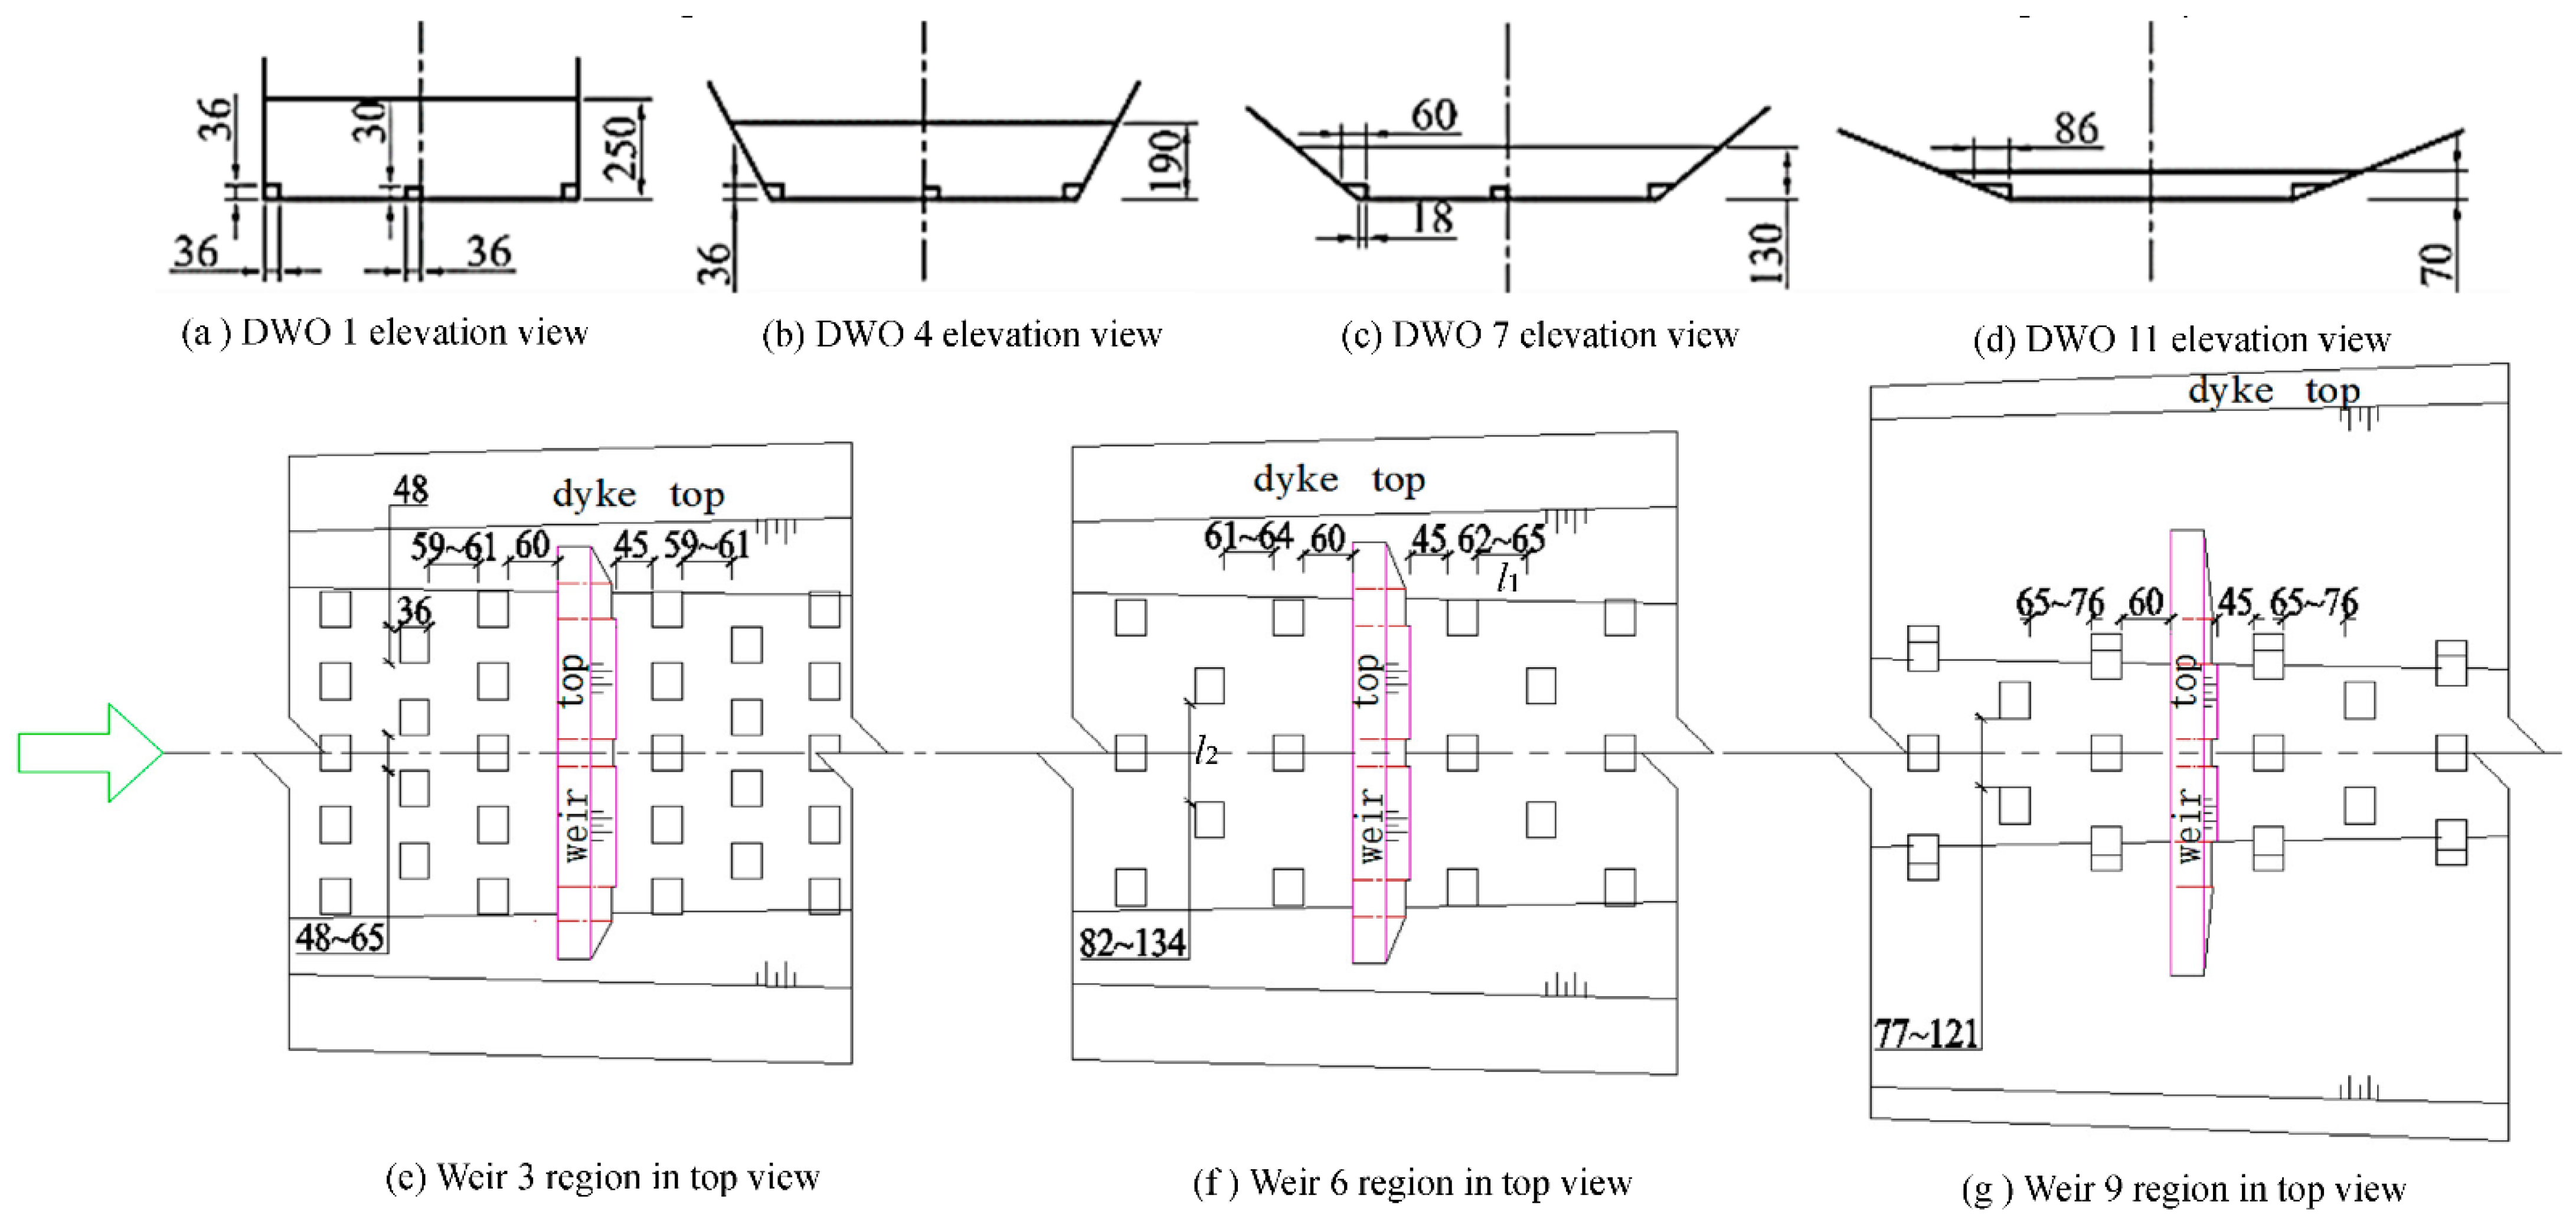
- Orifice arrangement: at the bottom of each submerged weir, there were three orifices set up for fish passage, among which two side holes (left and right) were designed close to the foot of the sidewall. The middle orifice was staggered along the central axis of the channel, as shown in Figure 7a–c. The width and the height of the bottom orifice were both about 0.36 m according to the split ratio and the size of the fish body, which is over 1.6 times the normal width of the migrating fish. As the bottom width decreases along the transition reach, there are only two orifices on the left and right sides of the weir, which should be behind weir 10 (see Figure 6). The layout of the submerged weirs and bottom orifices is shown in Figure 7a–d. The proportion of the orifice flow out of the total flow is about 18% to 35%.
- Roughening boulder: roughening boulders were added to the bottom of the channel in the transition reaches so as to reduce the flow velocity by increasing the resistance, the general diameters δ of which were about 0.35 to 0.45 m. In building the physical model, the shape of the roughening boulder was simplified to a cube. Boulders can not only increase the drag force and decrease the flow velocity but could also be used as a rest shelter for migrating fish, which is meaningful from the ecology point of view. The roughening boulders were arranged symmetrically according to the central axis of the channel. Meanwhile, they were also arranged symmetrically in front of and behind the orifice of DWO. The layout of the roughening boulders between the weir plates at different stages is shown in Figure 7e–g. Based on the relevant research and the former findings of several authors [37,49,52], some key indexes of the boulder arrangement for the channel were obtained according to the experimental test and simulation results. Respectively, the relative roughness δ/H should range from 0.11 to 0.26, the relative longitudinal spacing l1/B from 0.10 to 0.16, and the relative lateral spacing l2/B from 0.10 to 0.27, where H and B denote the water depth and bottom width of the entrance in the transition reach, respectively, and l1 and l2 denote the longitudinal spacing and lateral spacing between the boulders, respectively, as shown as Figure 7e–g.
4.4. Numerical Simulation Research on Hydrodynamic Characteristics of the DWO Fishway
4.4.1. Three-Dimensional Hydrodynamic Mathematical Model
- Model principle: in order to investigate the hydrodynamic characteristics of the combined DWO components in the fishway, a three-dimensional turbulent flow simulation was used. The hydrodynamic mathematical model of the transition reach was established by CFD calculation utilizing the k-ε equation (RNG k-ε turbulence model), which is reasonably accurate and stable. The volume of fluid (VOF) method was used to capture the free surface of the flow. The flow governing equations were solved by discrete iteration in the computational domain. The model was mainly used to simulate the flow field in the transition reach for the fishway, the velocity distribution, as well as the flow regime characteristics of the area, which are affected by the DWO. The baffle mode was added to monitor the fluid flow rate so as to obtain the split ratio of the weir overflow discharge to the bottom orifice flow discharge.
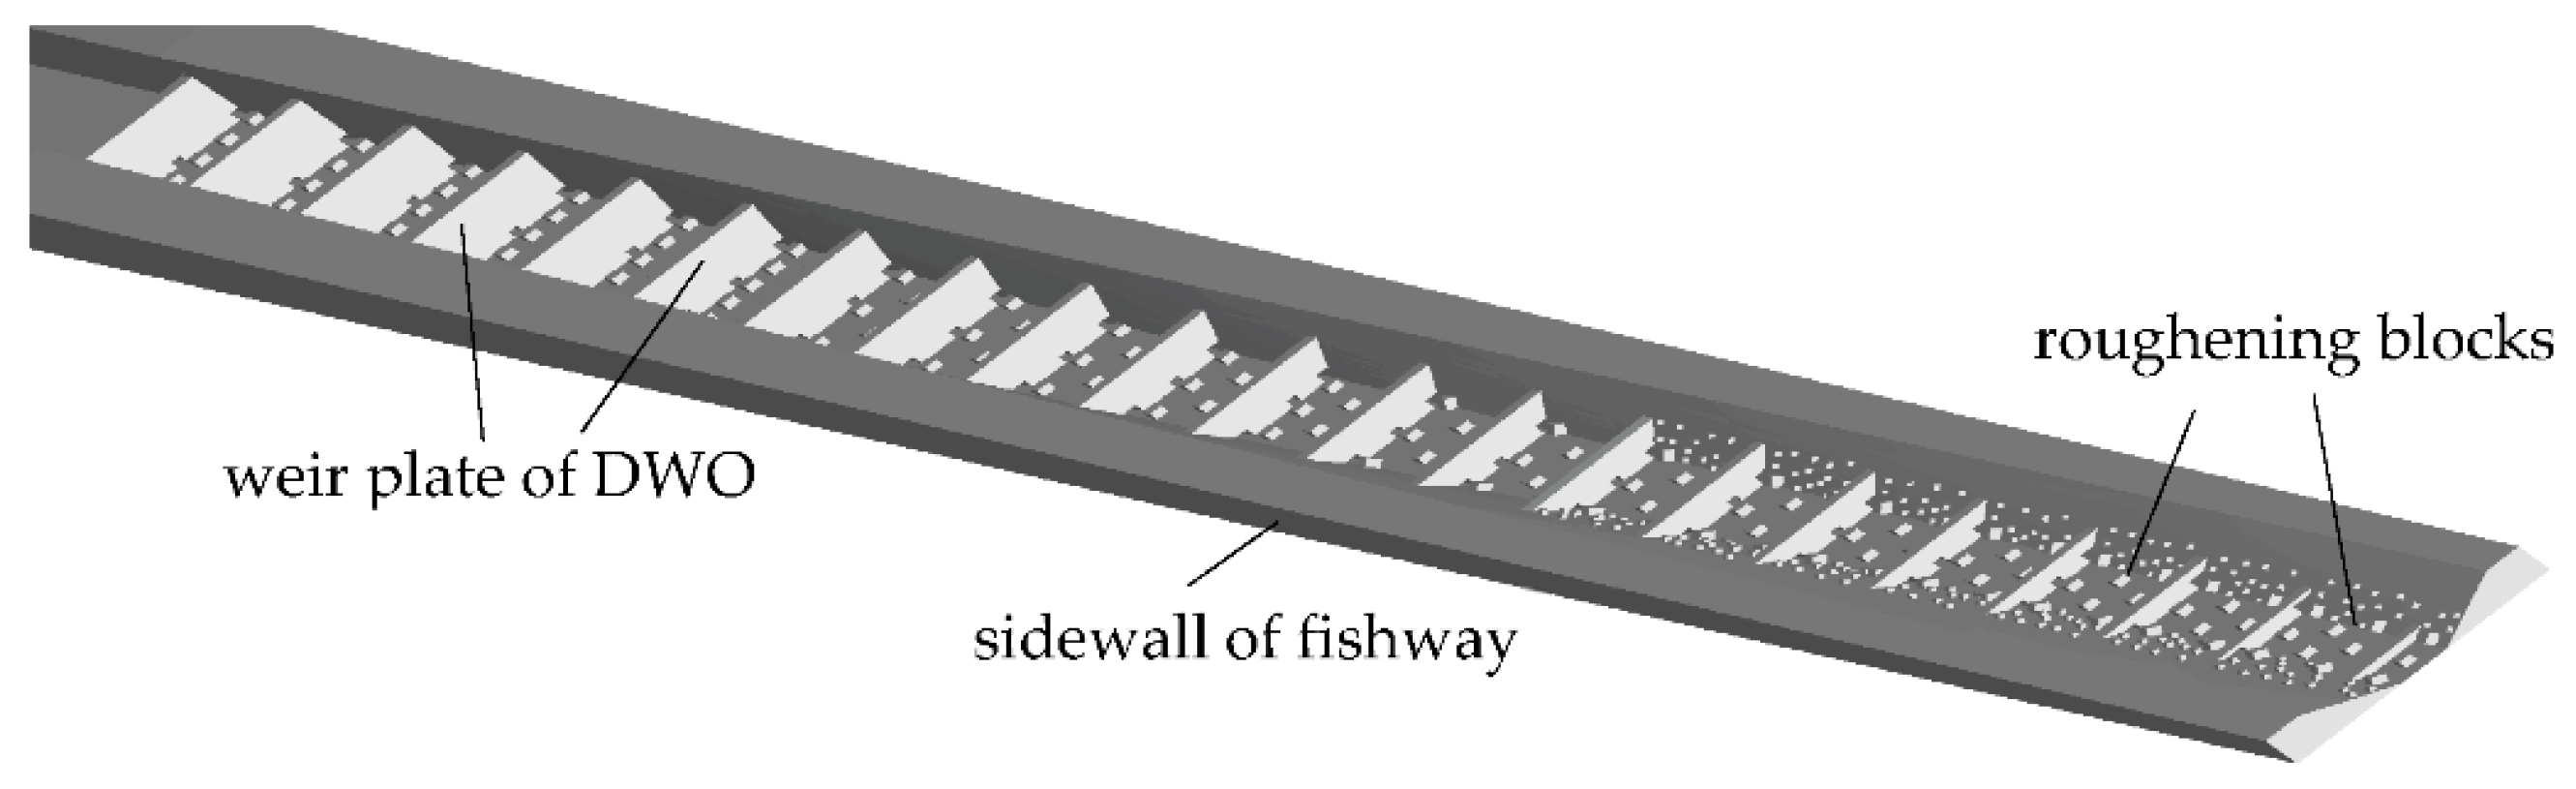
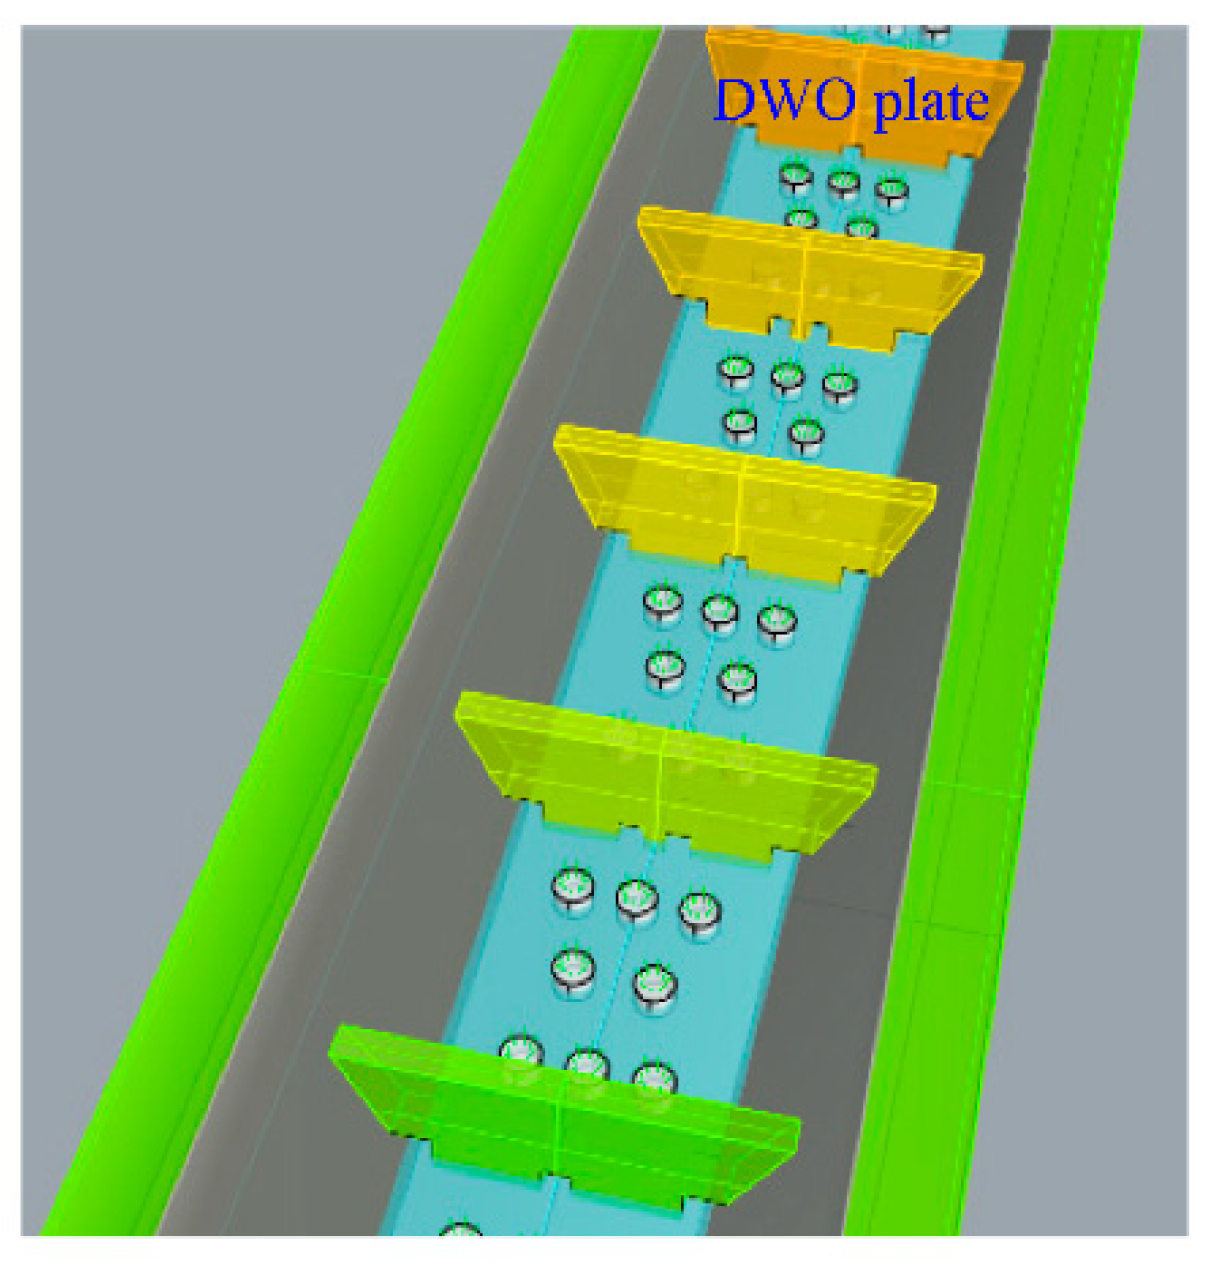
- Numerical simulation range and boundary conditions: the simulation range includes a short end reach of the vertical slot fishway (rectangular cross-section) of about 10 m, the whole transition reach (non-prismatic body) of about 100 m, and part of the ecological fishway (trapezoidal cross-section) of about 10 m as the outlet of the model. There were two boundary conditions (schemes) to simulate, Case S1 and Case S2. The S1 condition had multistage weirs (11 stages) without orifices, and the flow field was compared to that of Case S2. Case S2 had a multistage DWO (21 stages). The 3D shapes of the simulated channel boundaries and the DWO are shown in Figure 8 and Figure 9. The upstream open boundary conditions of the model were the water depth and flow rate. Here, the chosen flow condition not only had high intensity in practice but also met the boundary conditions of the upstream fishway, i.e., the discharge was about 3.6 m3/s, and the inlet water depth was 3.0 m, accordingly. The open boundary of the downstream fishway adopted a water depth of the outlet of about 0.75 m, determined by the inlet water depth of the ecological fishway with the broad and shallow channels. The wall boundary also fits the condition of no slip.
Figure 8.
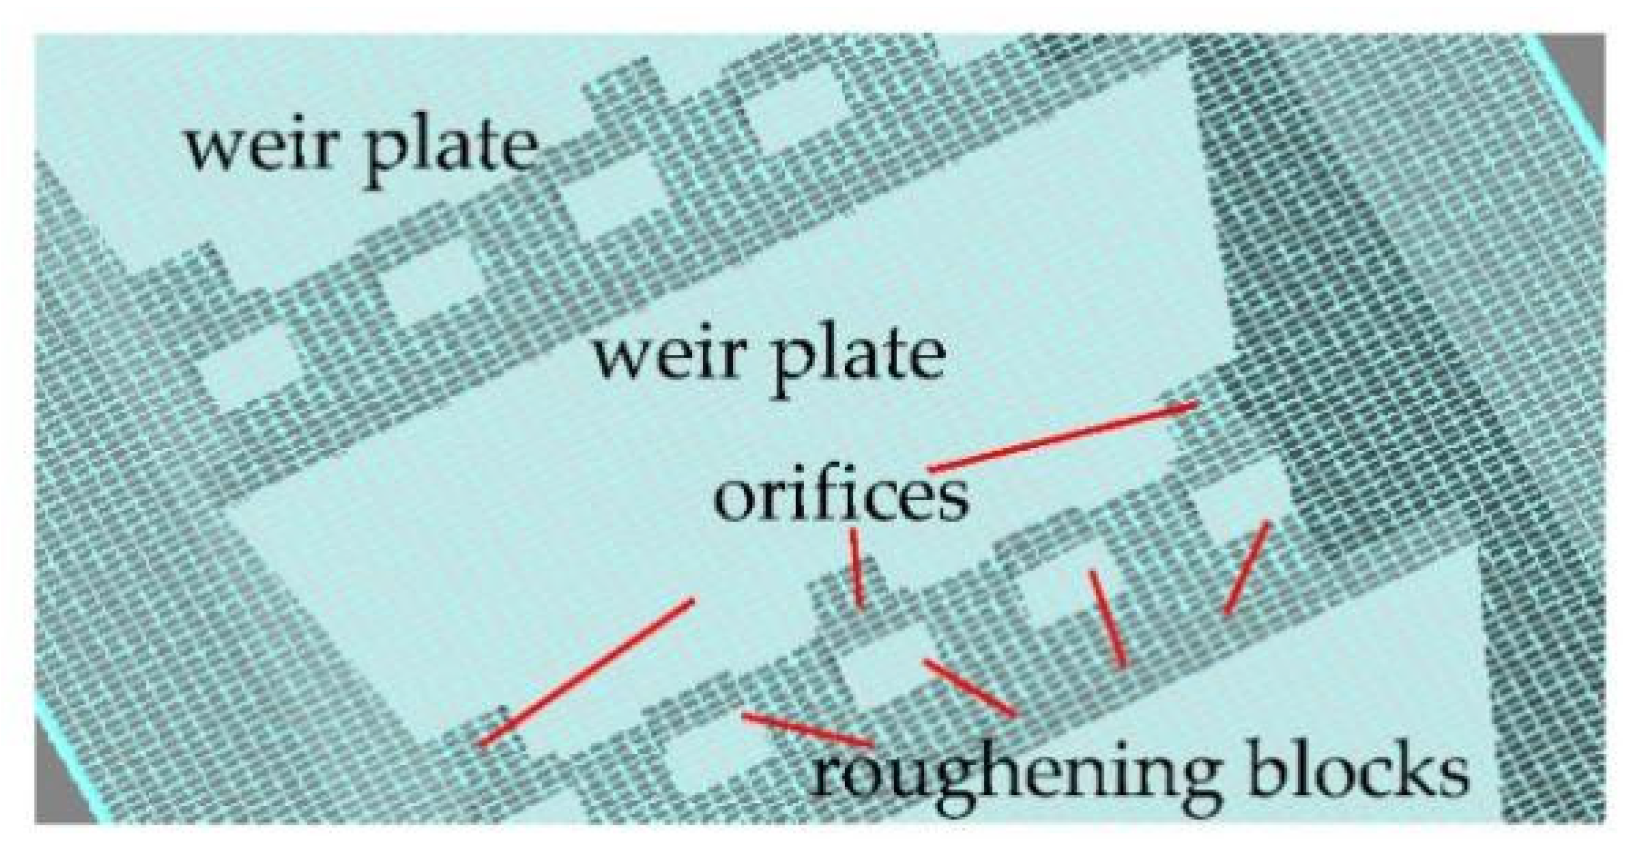
Three-dimensional numerical simulation model of the transition reach with the DWO. There are 21 multistage weirs and 61 orifices to maintain the flow discharge smoothly with double passages, and many bottom roughening blocks are set up to add roughness to the boundary so as to reduce the flow velocity, which is beneficial for resting fish.
Figure 8.
Three-dimensional numerical simulation model of the transition reach with the DWO. There are 21 multistage weirs and 61 orifices to maintain the flow discharge smoothly with double passages, and many bottom roughening blocks are set up to add roughness to the boundary so as to reduce the flow velocity, which is beneficial for resting fish.

Figure 9.
Local grid of the DWO. The white parts are DWO plates and roughening blocks, and the size of a single grid cell is 0.1 m × 0.1 m × 0.1 m.
Figure 9.
Local grid of the DWO. The white parts are DWO plates and roughening blocks, and the size of a single grid cell is 0.1 m × 0.1 m × 0.1 m.

- 3.
- Mesh generation and validation: the computational domain grid was established using a uniform cubic mesh, and a local mesh was also processed finely by means of the Favor technology according to the boundary characteristics [45,46], as shown in Figure 9. The size of a single grid cell was about 0.1 m × 0.1 m × 0.1 m. There was a total of 3,136,000 elements.
- 4.
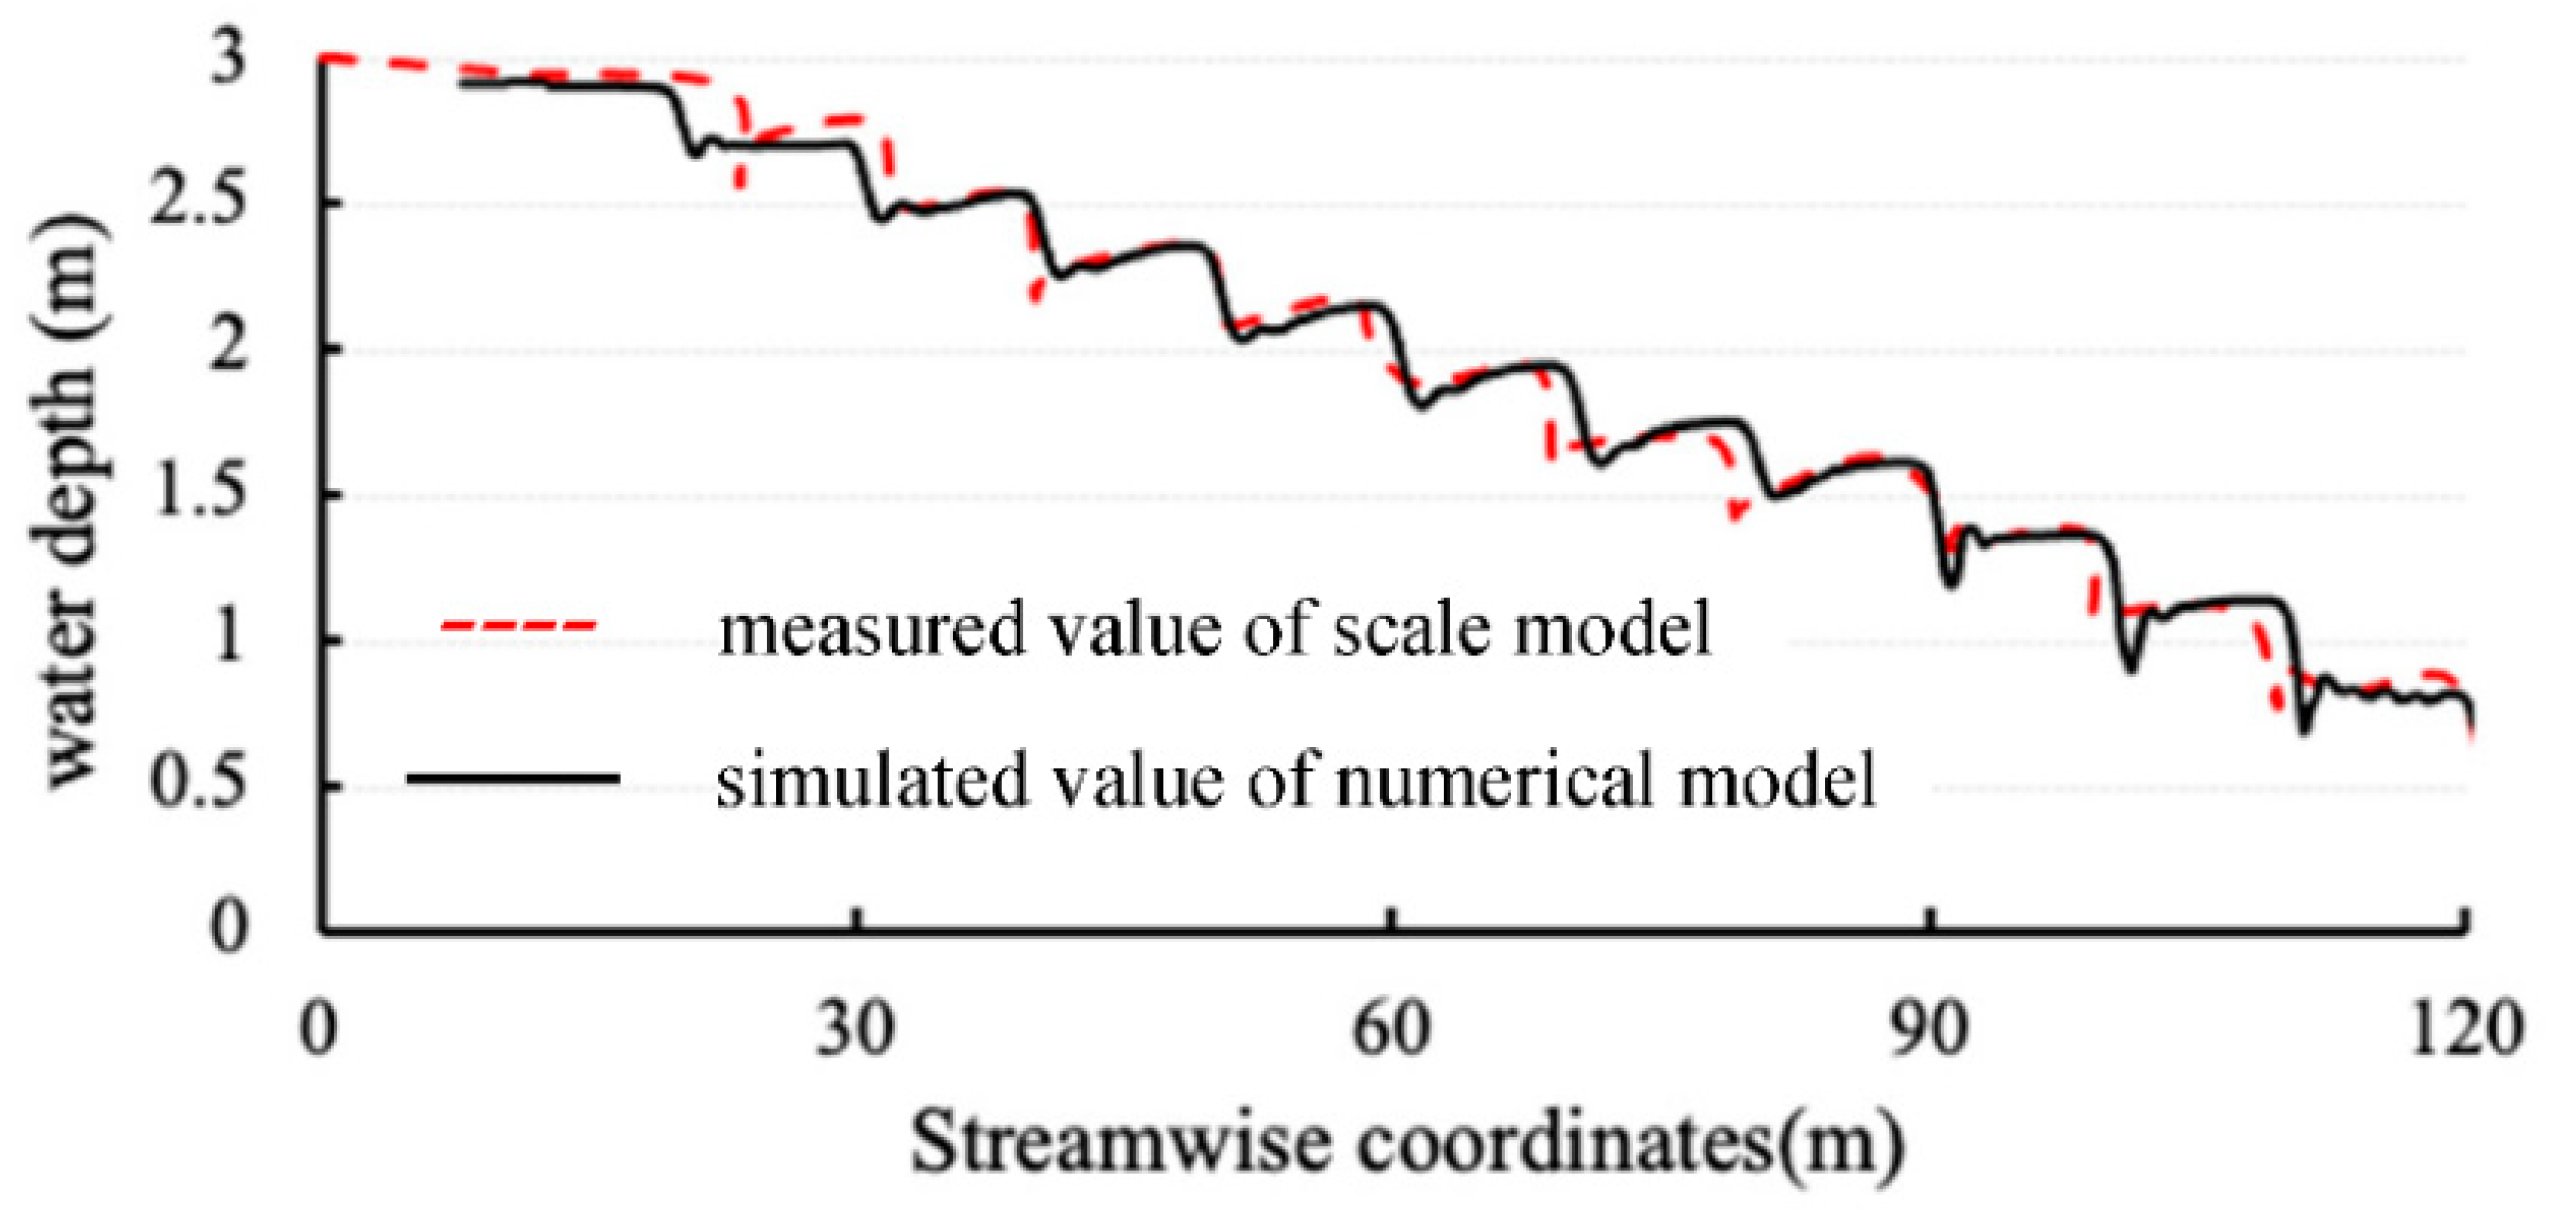
- Verification of the modeling: in order to ensure the accuracy of the numerical simulation, the numerical model of the fishway was validated based on the data of Case S1. The simulation results of the water surface line were compared with the test results of Case S1 obtained from the hydraulic scale model built before numerical simulation, as shown in Figure 10. It is indicated that the general trend of the water surface line of the simulated data was consistent with that of the experimental data to a large extent; both maintained almost the same drop at each stage (of about 0.4 m), and they had the same energy slope. The proper roughness of the channel was selected by adjusting the resistance parameter, i.e., improving the bottom boundary conditions by establishing roughness boulders (Figure 8 and Figure 9). Finally, the value of the Manning roughness was about 0.03.
4.4.2. Hydrodynamics Characteristics of DWO
- Characteristics of Flow Field and Velocity Profile
According to the data of the 3D numerical simulation, it was found that the hydrodynamic characteristics of the flow fields in Case S1 and Case S2 differed. To reflect the velocity profile distribution of the two schemes, three typical cross-sections were chosen in the upper, middle, and lower positions of the transition reach. The velocity profile contours of these typical cross-sections are given in Figure 11, Figure 12 and Figure 13.
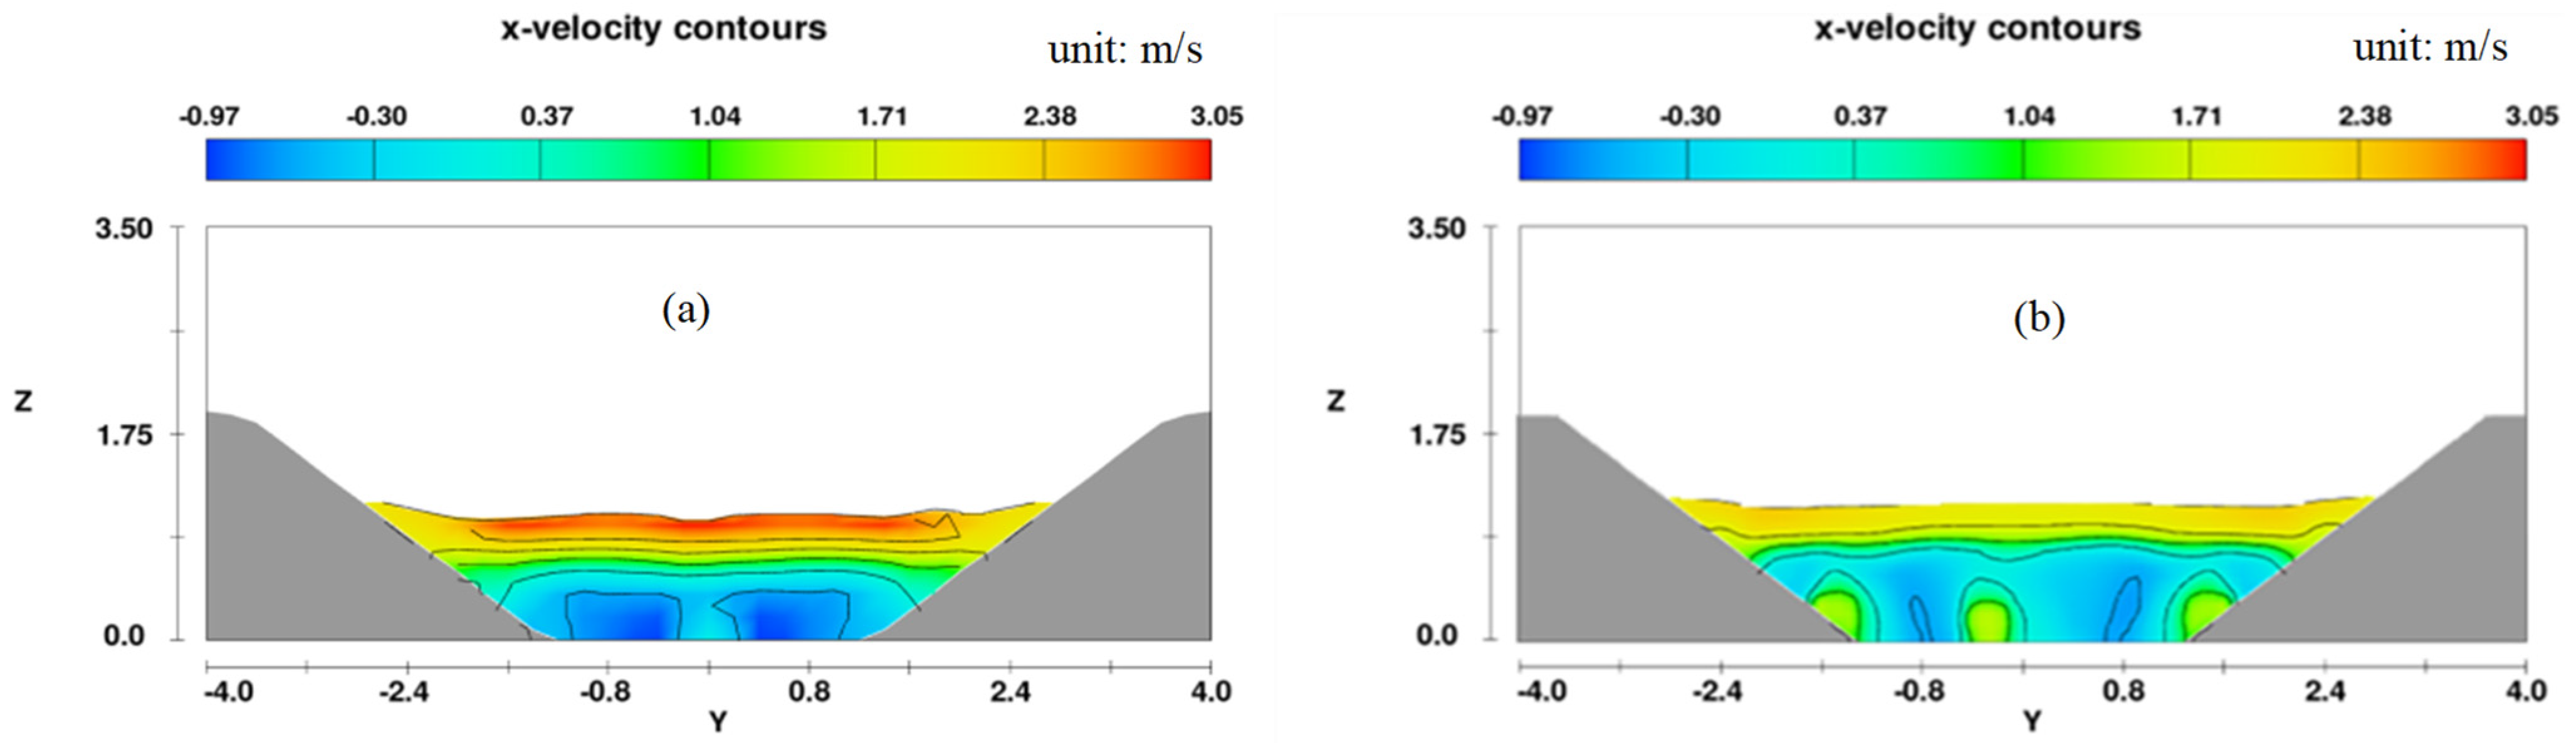
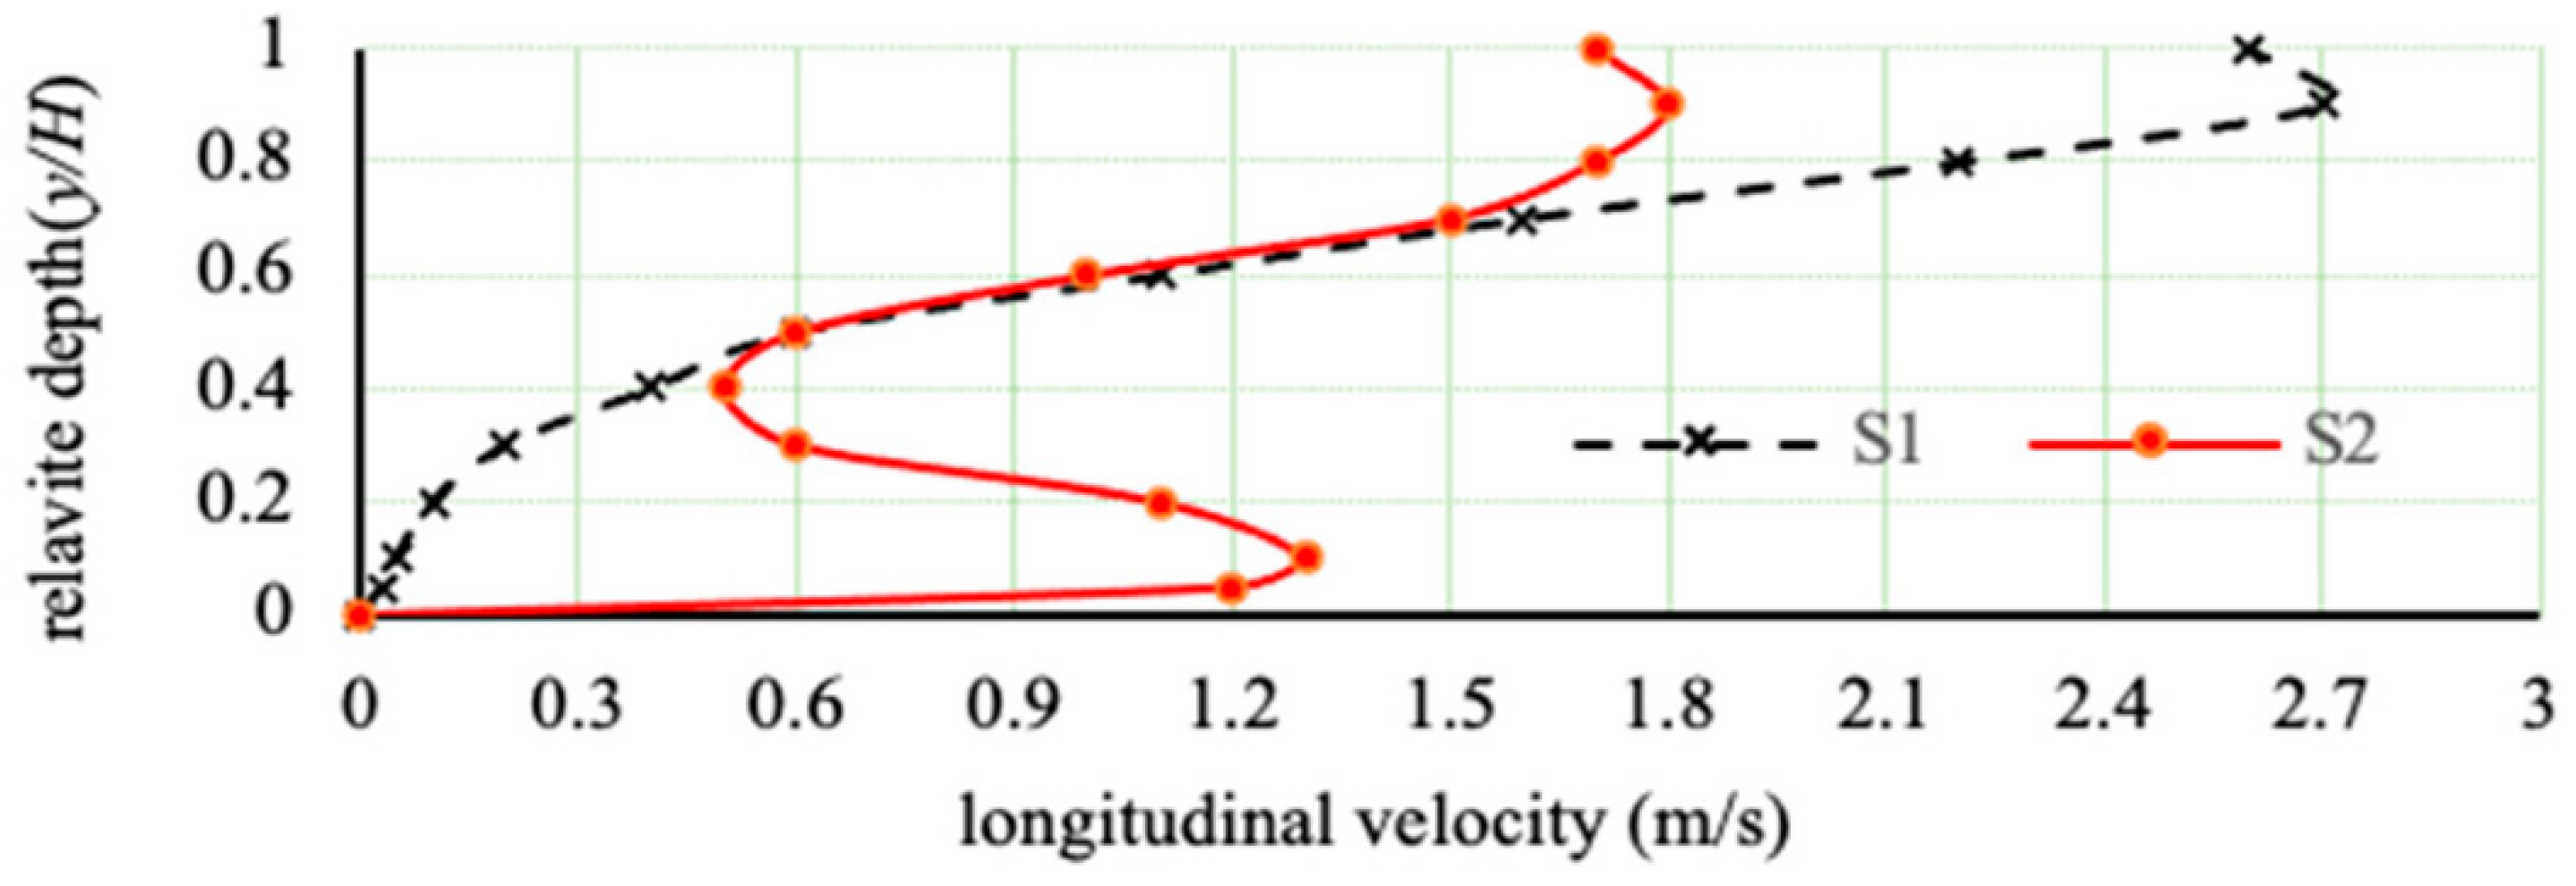
A comparison of these figures shows that when the flow passes through the multistage weirs in Case S1 and Case S2, the spatial distributions of velocity both changed and adjusted rapidly. The form difference in the weir plates of the two schemes contributed to the different flow structures. In Case S1, with conventional weirs, there was only overflow at the top in the vertical profile, and the overflow velocity of the weir crest ranged from 2.5 to 3.2 m/s generally, as shown in Figure 11a, Figure 12a and Figure 13a. However, the velocities of the middle and bottom layers were minor, and there was even a static water region near the bottom. The difference between the vertical velocity profile distributions of the two schemes was significant; Case S1 presented a single peak with a strong deviation in the velocity profile, as shown in Figure 14. The location and size of cross-Section 3 are shown in Figure 6 and Figure 7.
In the modified differential weir-orifice (DWO) scheme of S2, the double passage for the discharging flow contributes to adjusting the flow structure, and the vertical profile of the flow velocity presents a more equal distribution, with two peaks in the top and bottom, respectively, as shown in Figure 11b, Figure 12b and Figure 13b and Figure 14. The velocity of the orifice flow is generally at 0.8 to 1.3 m/s, and the velocity of the weir crest overflow is also significantly reduced by the split flow of the bottom orifice, which is generally at 1.2 to 2.3 m/s and reduced by 23% to 40%. As a result, the flow velocities in the top and bottom passages both meet the requirements for fish passage (as mentioned above). In the middle layer of the vertical flow field, there is a low-intensity frictional circumfluence, and the absolute value of the velocity there ranges from 0.3 to 0.5 m/s, which is suitable for fish to rest. In addition, in the flow field, there are several local low-speed areas intermittently distributed at the bottom, which are the wake vortexes caused by the roughening blocks (Figure 11, Figure 12 and Figure 13). Therefore, from the ecological point of view, these blocks can also imitate a natural shelter for the fish when they need to rest after swimming, providing comfort.
- 2.
- Vertical distribution characteristics of the turbulent kinetic energy
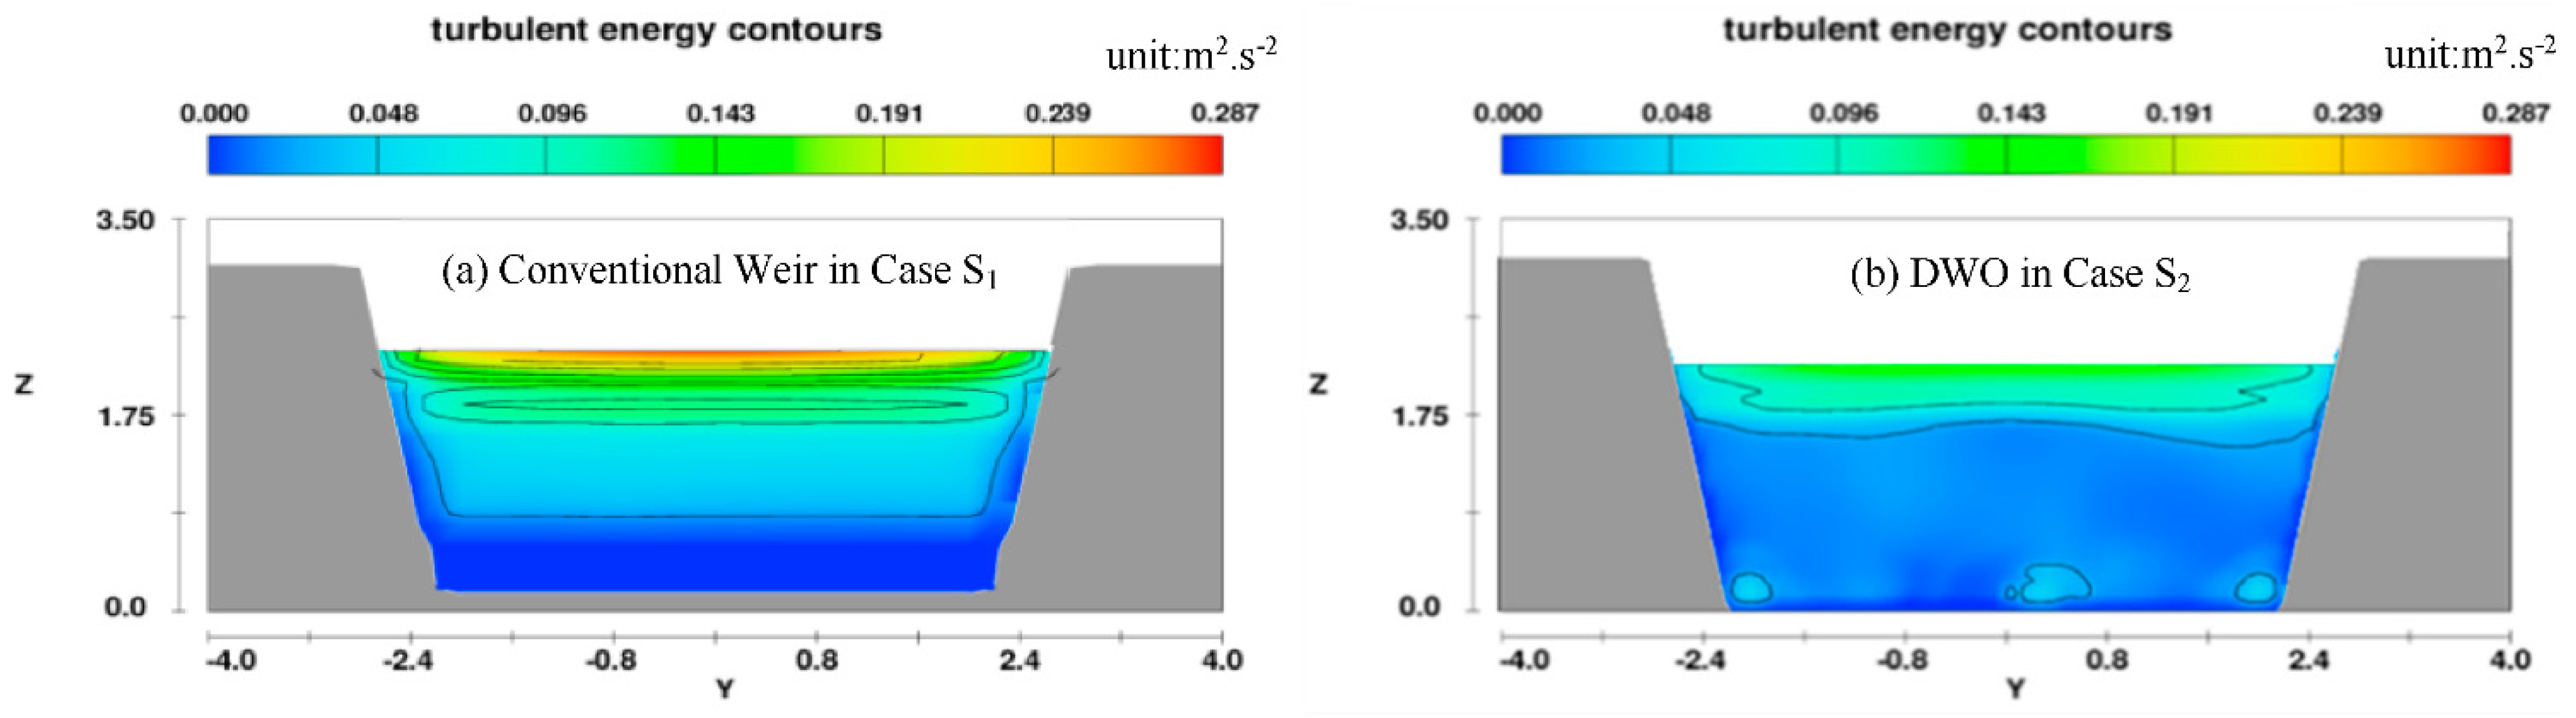
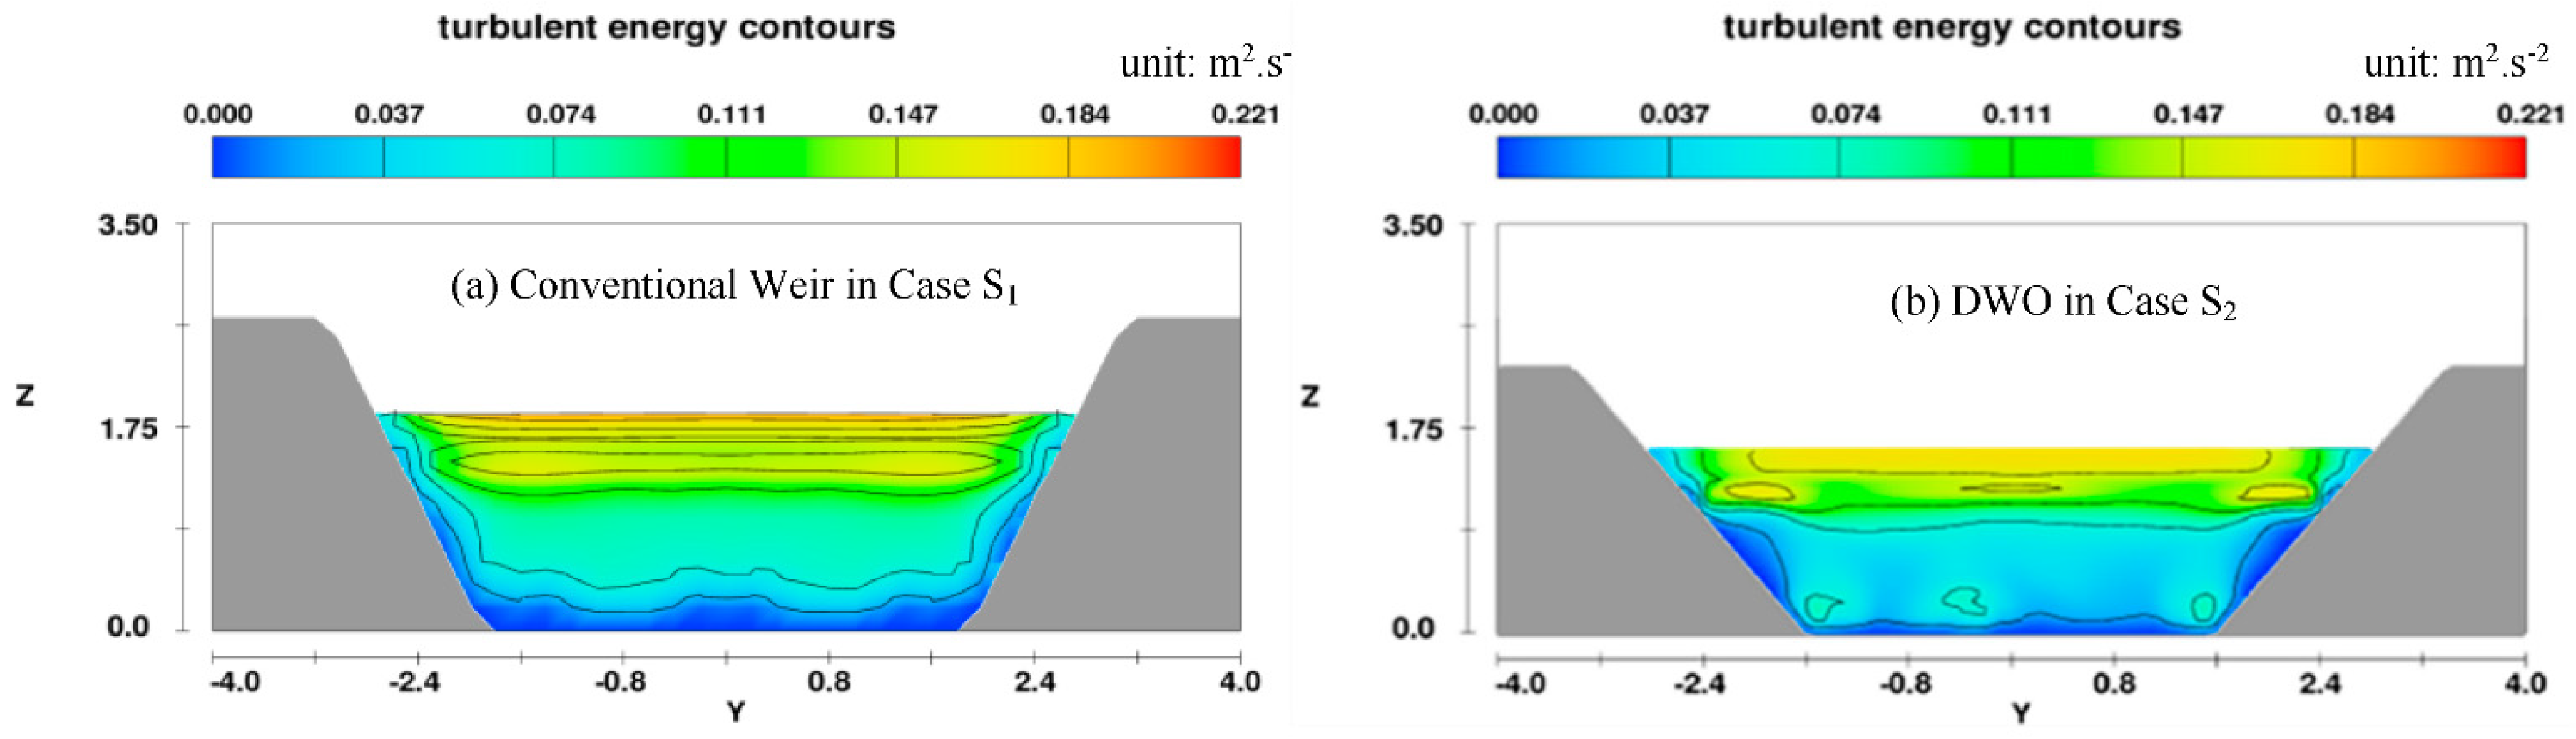
Turbulent kinetic energy is one of the important indexes reflecting the turbulent characteristics of the flow field. Using numerical simulation data, the vertical distribution contours of the turbulent kinetic energy of the selected typical section in Cases S1 and S2 are shown in Figure 15 and Figure 16. It was found that the turbulence characteristics are obviously different in the flow fields between S1 and S2. The turbulent kinetic energy of the weir top in the DWO scheme is reduced by about 41% to 23% compared to that in Case S1. The reason the spatial distribution of the turbulent kinetic energy of S1 and S2 significantly differ is whether or not there is bottom flow, which is attributed to the two different flow structures. The flow in the S1 scheme, with conventional weirs, concentrates on the top overflow, and the turbulence intensity of the upper flow field is high, which causes the turbulence energy consumption also to be concentrated. In the Case S2 scheme, with the DWO, the turbulent kinetic energy is transferred to the bottom layer because of two discharging flow passages in the top and bottom. Although the turbulent kinetic energy at the orifice is slightly higher than the nearby area, it is only 26% to 28% of that in the top layer. The orifice flow is relatively gentle and more suitable for fish passage. This shows that the turbulent kinetic energy profile can be adjusted by the DWO.
4.4.3. Adjustment to the Water Level and Flow Regime
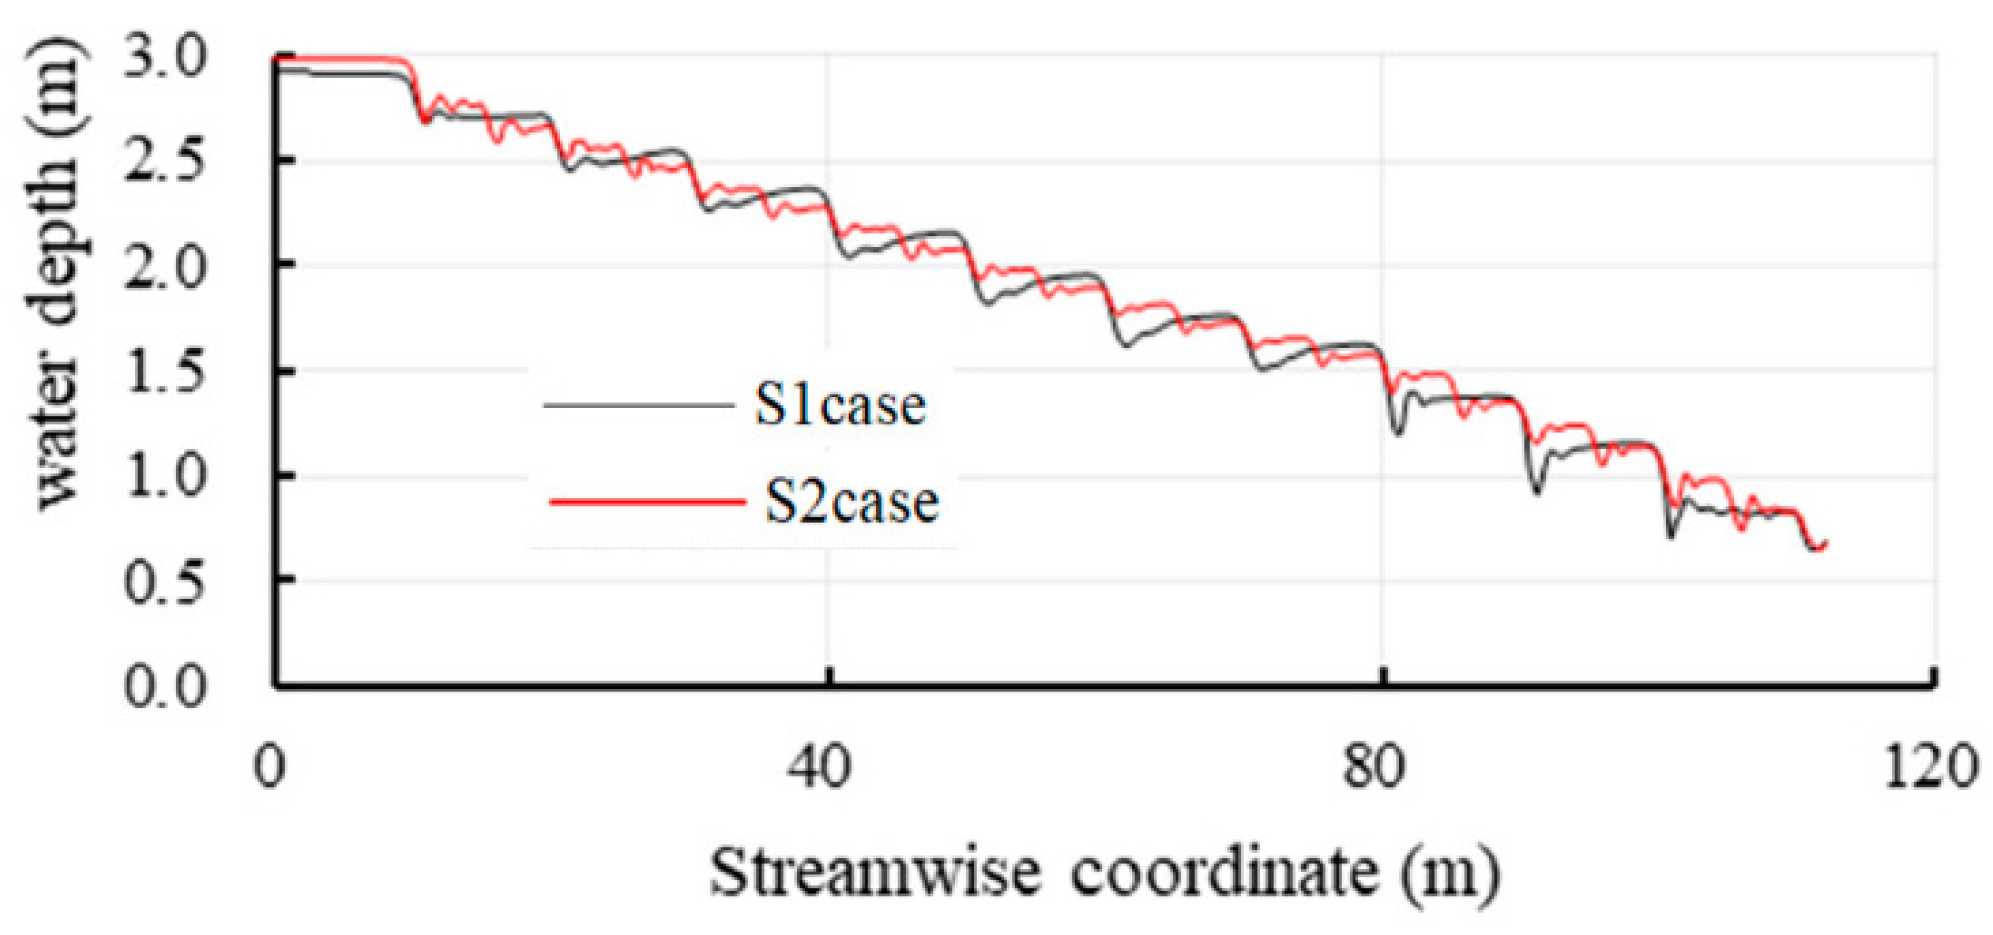
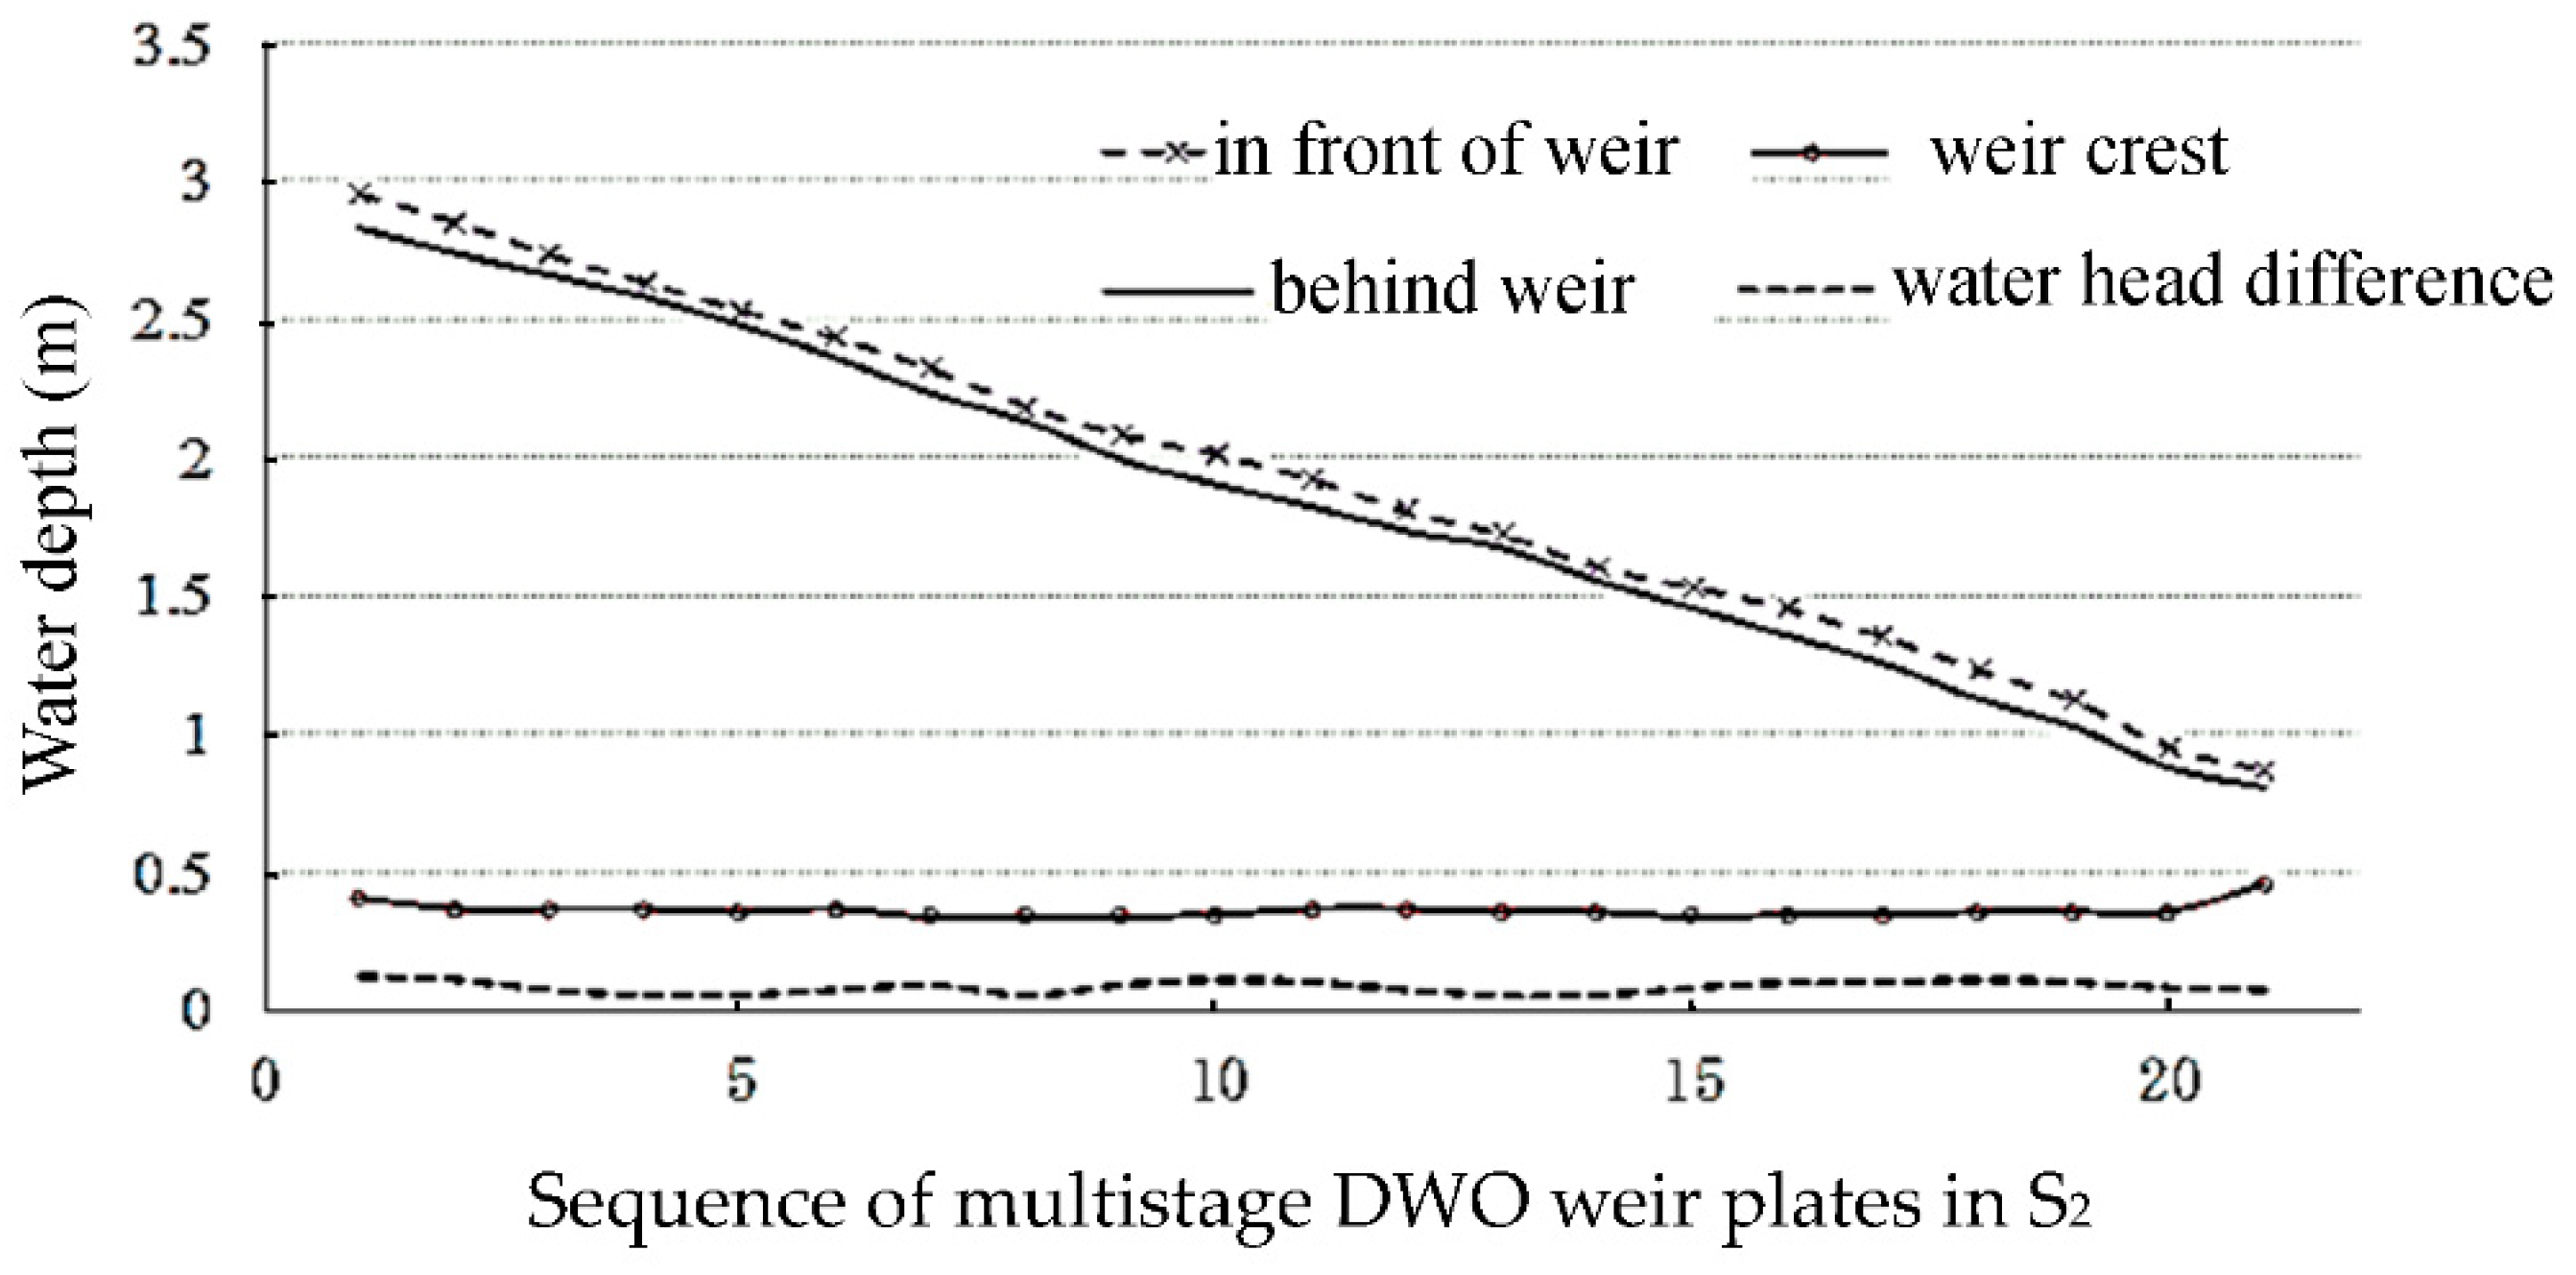
Comparing the water surface lines of the two schemes in Figure 17, it was found that the flow drop at all levels of the Case S1 scheme (black line) was significant and formed a multistage water head drop, where the water level decreased stepwise, obviously, and the mean value of the head drop in each stage was as much as 0.35 m. However, in the Case S2 scheme of the DWO, the water surface presented a smooth continuous curve with minor fluctuation (red line shown in Figure 17). The mean value of the head drop in each stage was about 0.13 m, which was reduced by 55–65% on average. The water head drops at all stages were relatively gentle in the DWO scheme, and the fluctuation intensity under the weir was sharply weakened. The turbulent intensity in the flow field was also decreased, and the transverse circulation region was compressed, which means that the flow regime in the DWO scheme was relatively more tranquil and stable.
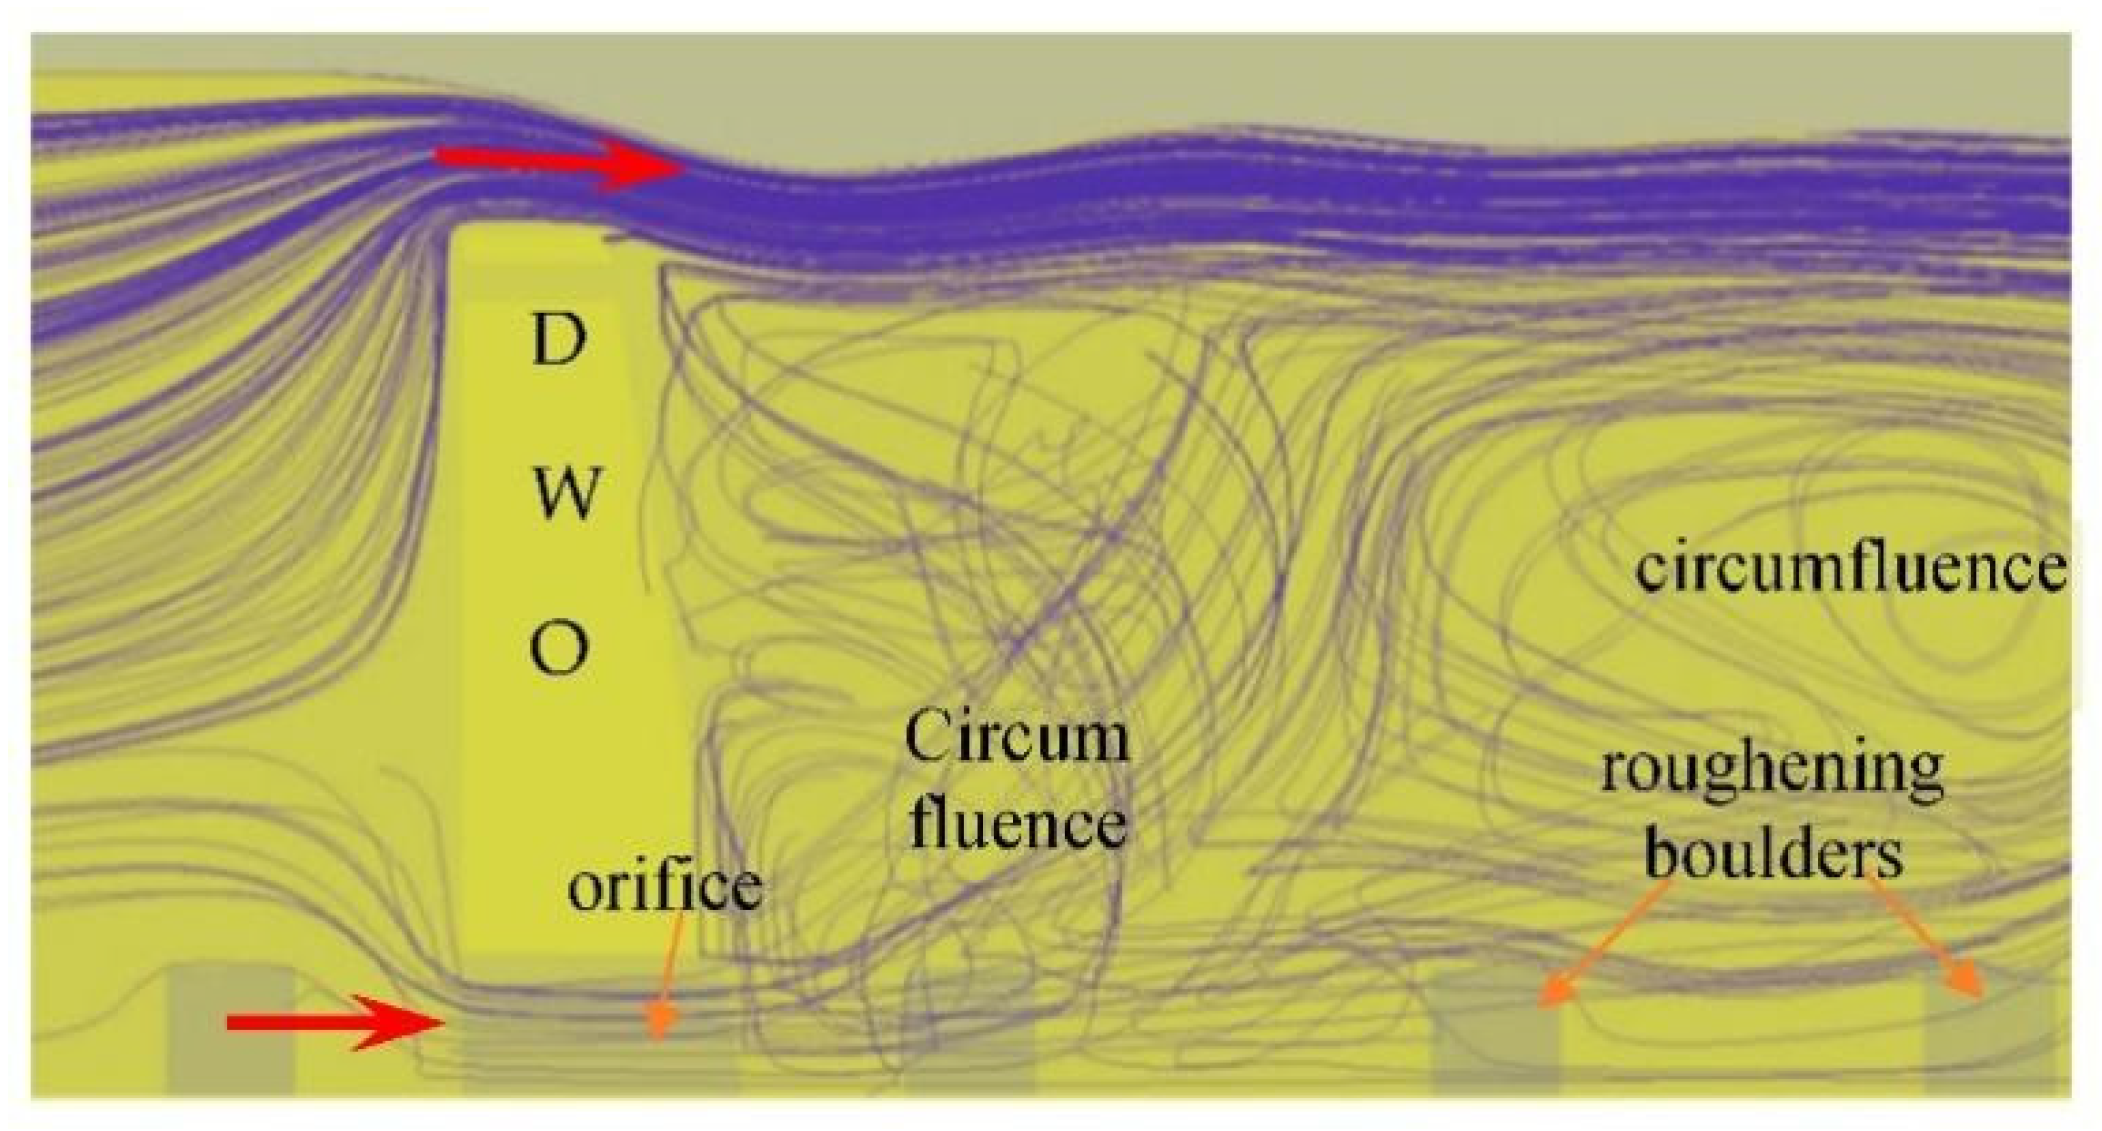
By analyzing the changes in the local streamlines in front of and behind the DWO plate in Figure 18, it can be seen that the streamlines were relatively concentrated in the upper and lower flow layers in the flow field. The weir crest overflow leading to the streamline distribution near the weir crest presented a trend that contracted upward firstly in front of the weir and then expanded gently behind the weir. The orifice flow caused the streamline distribution near the bottom to contract downward firstly in front of the orifice and then expand upward after passing the orifice. There was a large region of frictional transverse circumfluence in the weir pool. As the velocity of the circumfluence region is less, the flow structure is suitable for fish to rest. The stable and tranquil flow in the DWO means a lot to the security of both the building and the migrating fish. Moreover, the continuous complete water surface without exposure to any artificial buildings provides a better imitation of the natural ecological environment for the migrating fish.
4.5. Results of the Scale Model Test and Its Comparison with the Numerical Simulation
4.5.1. Brief Introduction of the Scale Model
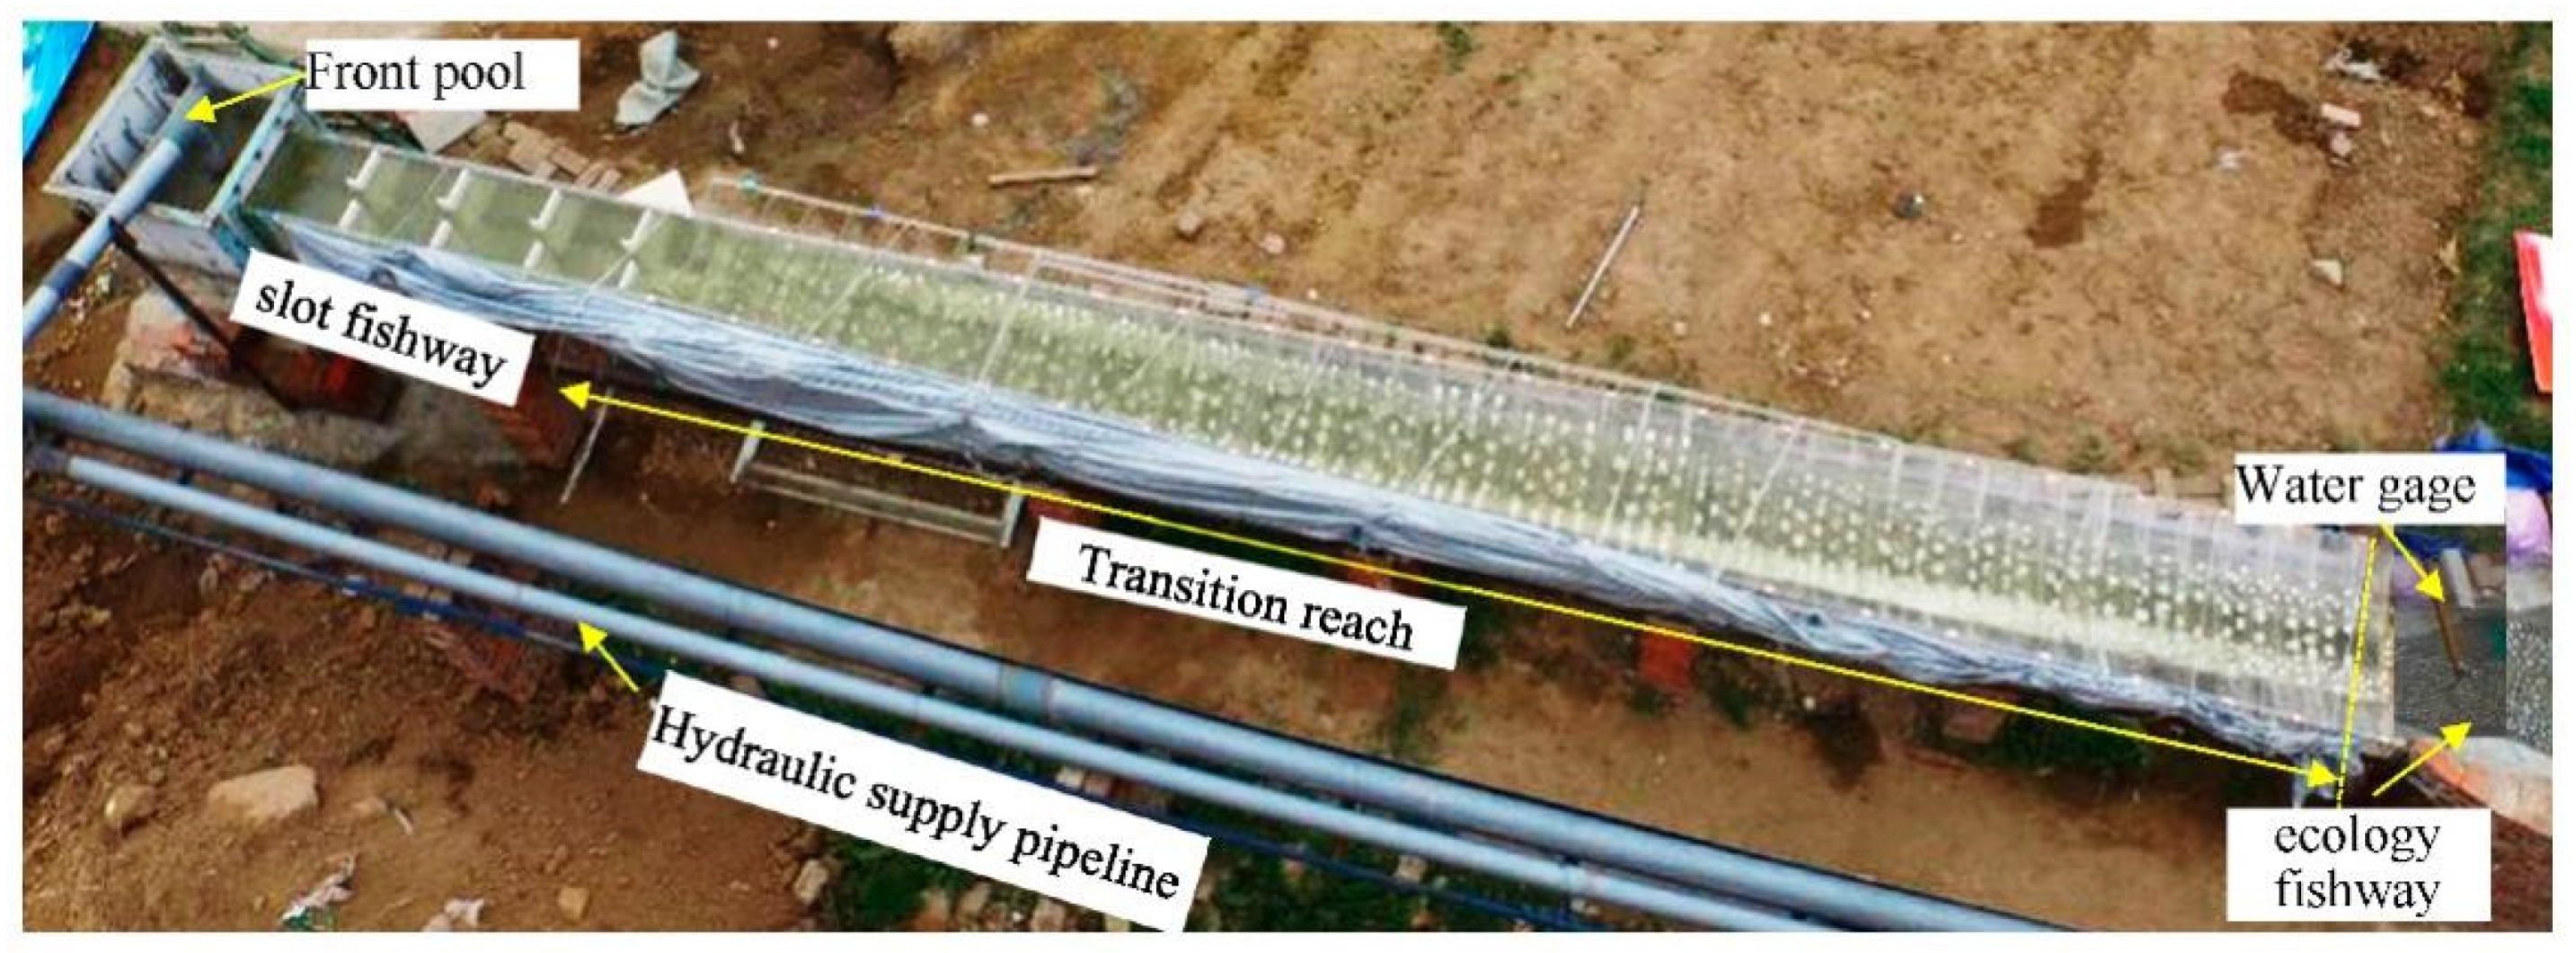
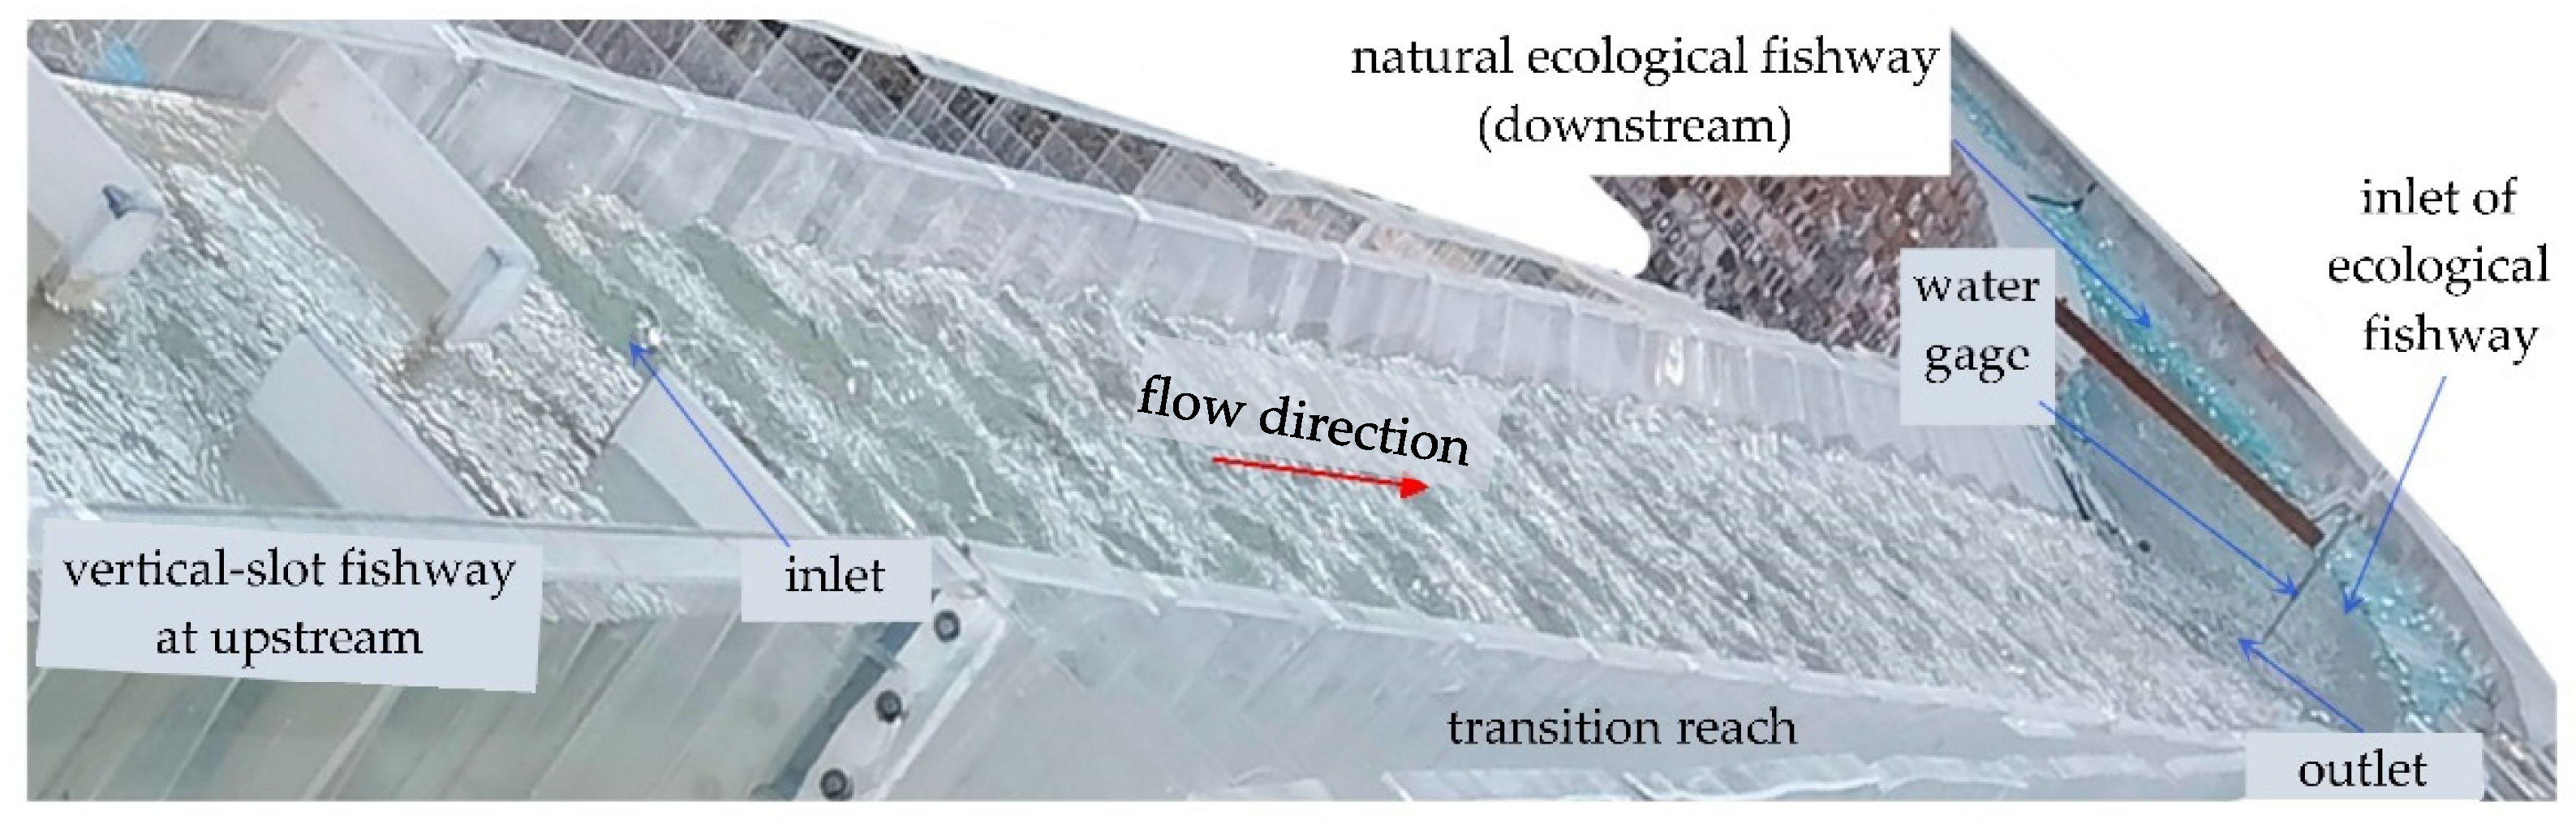
According to the criterion of the gravity similarity and turbulent resistance similarity, a scale model of the fishway with the DWO was designed and built. The transition reach model was made of transparent material so as to observe the flow regime. The finished model of the transition reach is shown in Figure 19, and the local layout is shown in Figure 20. The modeling range was the same as the numerical simulation range. Limited by space, the geometric scale of the model was selected as 10, and the velocity scale and Manning roughness scale were about 3.16 and 1.47, respectively. The flow discharge in the experiment was controlled by an E-mag electromagnetic flow meter, and the flow velocity was measured by a Doppler velocity meter (ADV). In order to investigate the hydraulic and ecological characteristics of the transition reach, the experiments were conducted under the same conditions as the numerical simulation, and the boundary conditions mainly included the two schemes of Case S1 and Case S2. The resistance similarity of the model has been validated.
4.5.2. Performance in Regulating the Water Surface
Under the boundary condition of the S1 scheme, there are 11 stages of conventional weirs, and the height difference of the weir plates is about 0.23 m. The experimental results indicate that the water surface in the reach of the 11 stage weirs presents multistage water head drops and eddies stepwise, and the average value of the head drop of each stage is about 0.30 m. Affected by the circumfluence in front of the weir and the hydraulic drop crossing the weir, the head drop ratio, which denotes the ratio of the actual water head drop to the height difference between two weir plates, is about 1.4 to 1.6, which is very close to the results of the numerical simulation.
By adopting the differential weir–orifice structure (DWO), the bottom orifice flow caused the water head drop between every two weirs to be greatly reduced by 60% to 70% and evenly to only about 0.11 m, as shown in Figure 21.
4.5.3. Velocity Profile of Double Passage Discharging
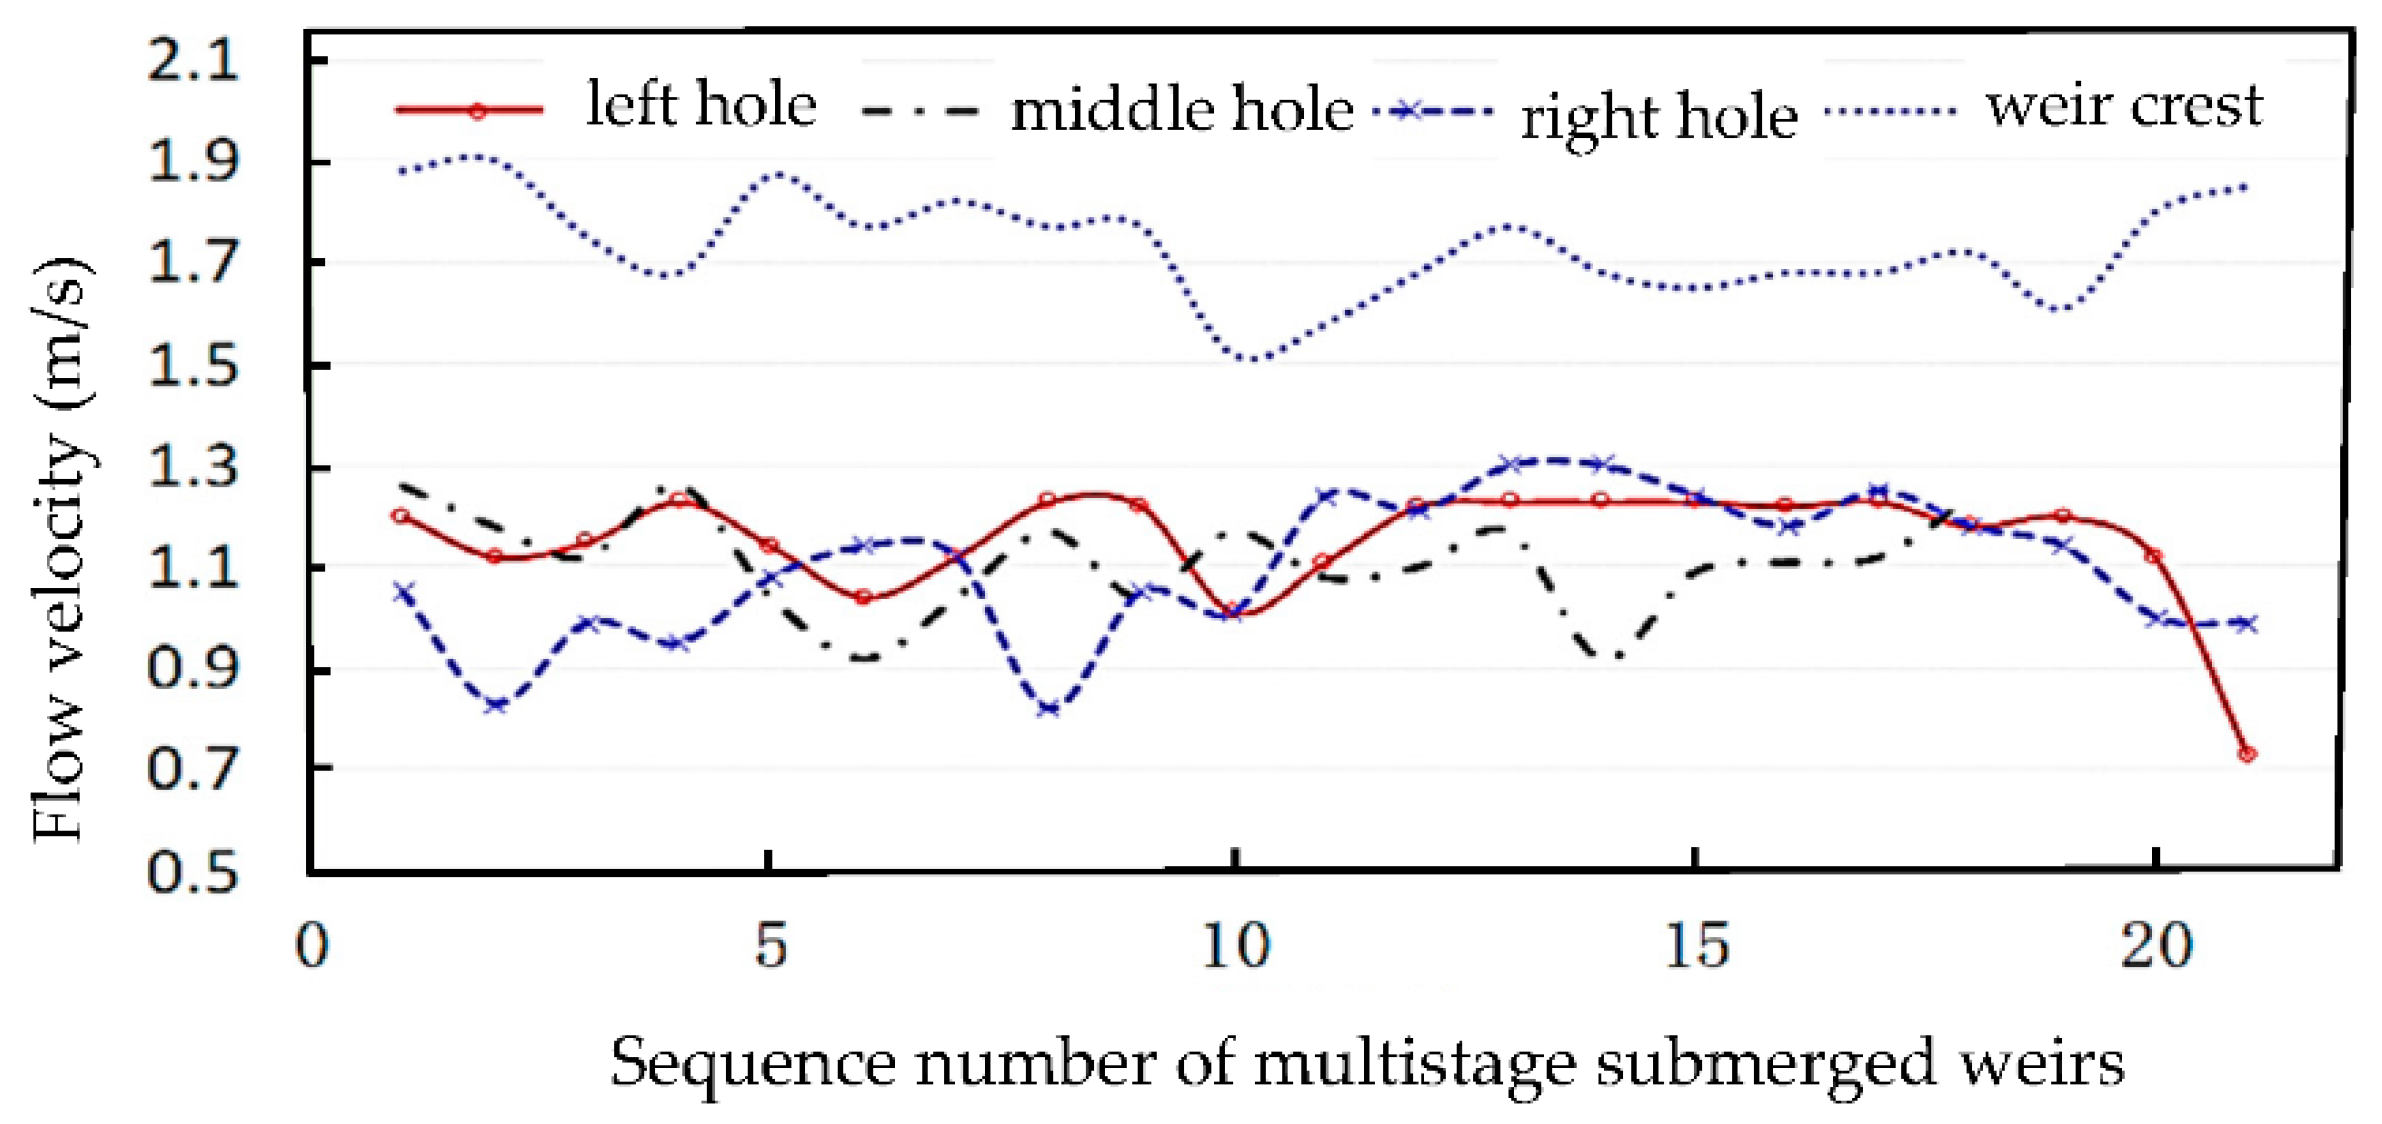
Under the boundary conditions of Case S1 with 11 conventional weirs, the measured velocity of the weir crest was generally at 1.74 to 2.85 m/s. However, as the DWO was adopted in Case S2, the maximum velocity of the weir crest in Case S2 was decreased by 31%, ranging from 1.5 to 1.85 m/s. The average velocity of the orifice flow in the bottom also could be controlled from 0.7 to 1.3 m/s, as shown in Figure 22. The reason for this is that the double-layer discharging flow, i.e., the overflow of the weir crest and the bottom flow pass through the orifice, increasing the kinetic energy dissipation and reducing the total flow intensity. The magnitude and the vertical profile distribution of the velocity from the experimental data are almost consistent with the numerical simulation results. The adjusted flow structure in the S2 scheme ensures that both the upper and lower flow layers in the DWO could behave better in meeting the requirements of migration.
4.5.4. Flow Regime and Ecohydraulic Regulation of DWO
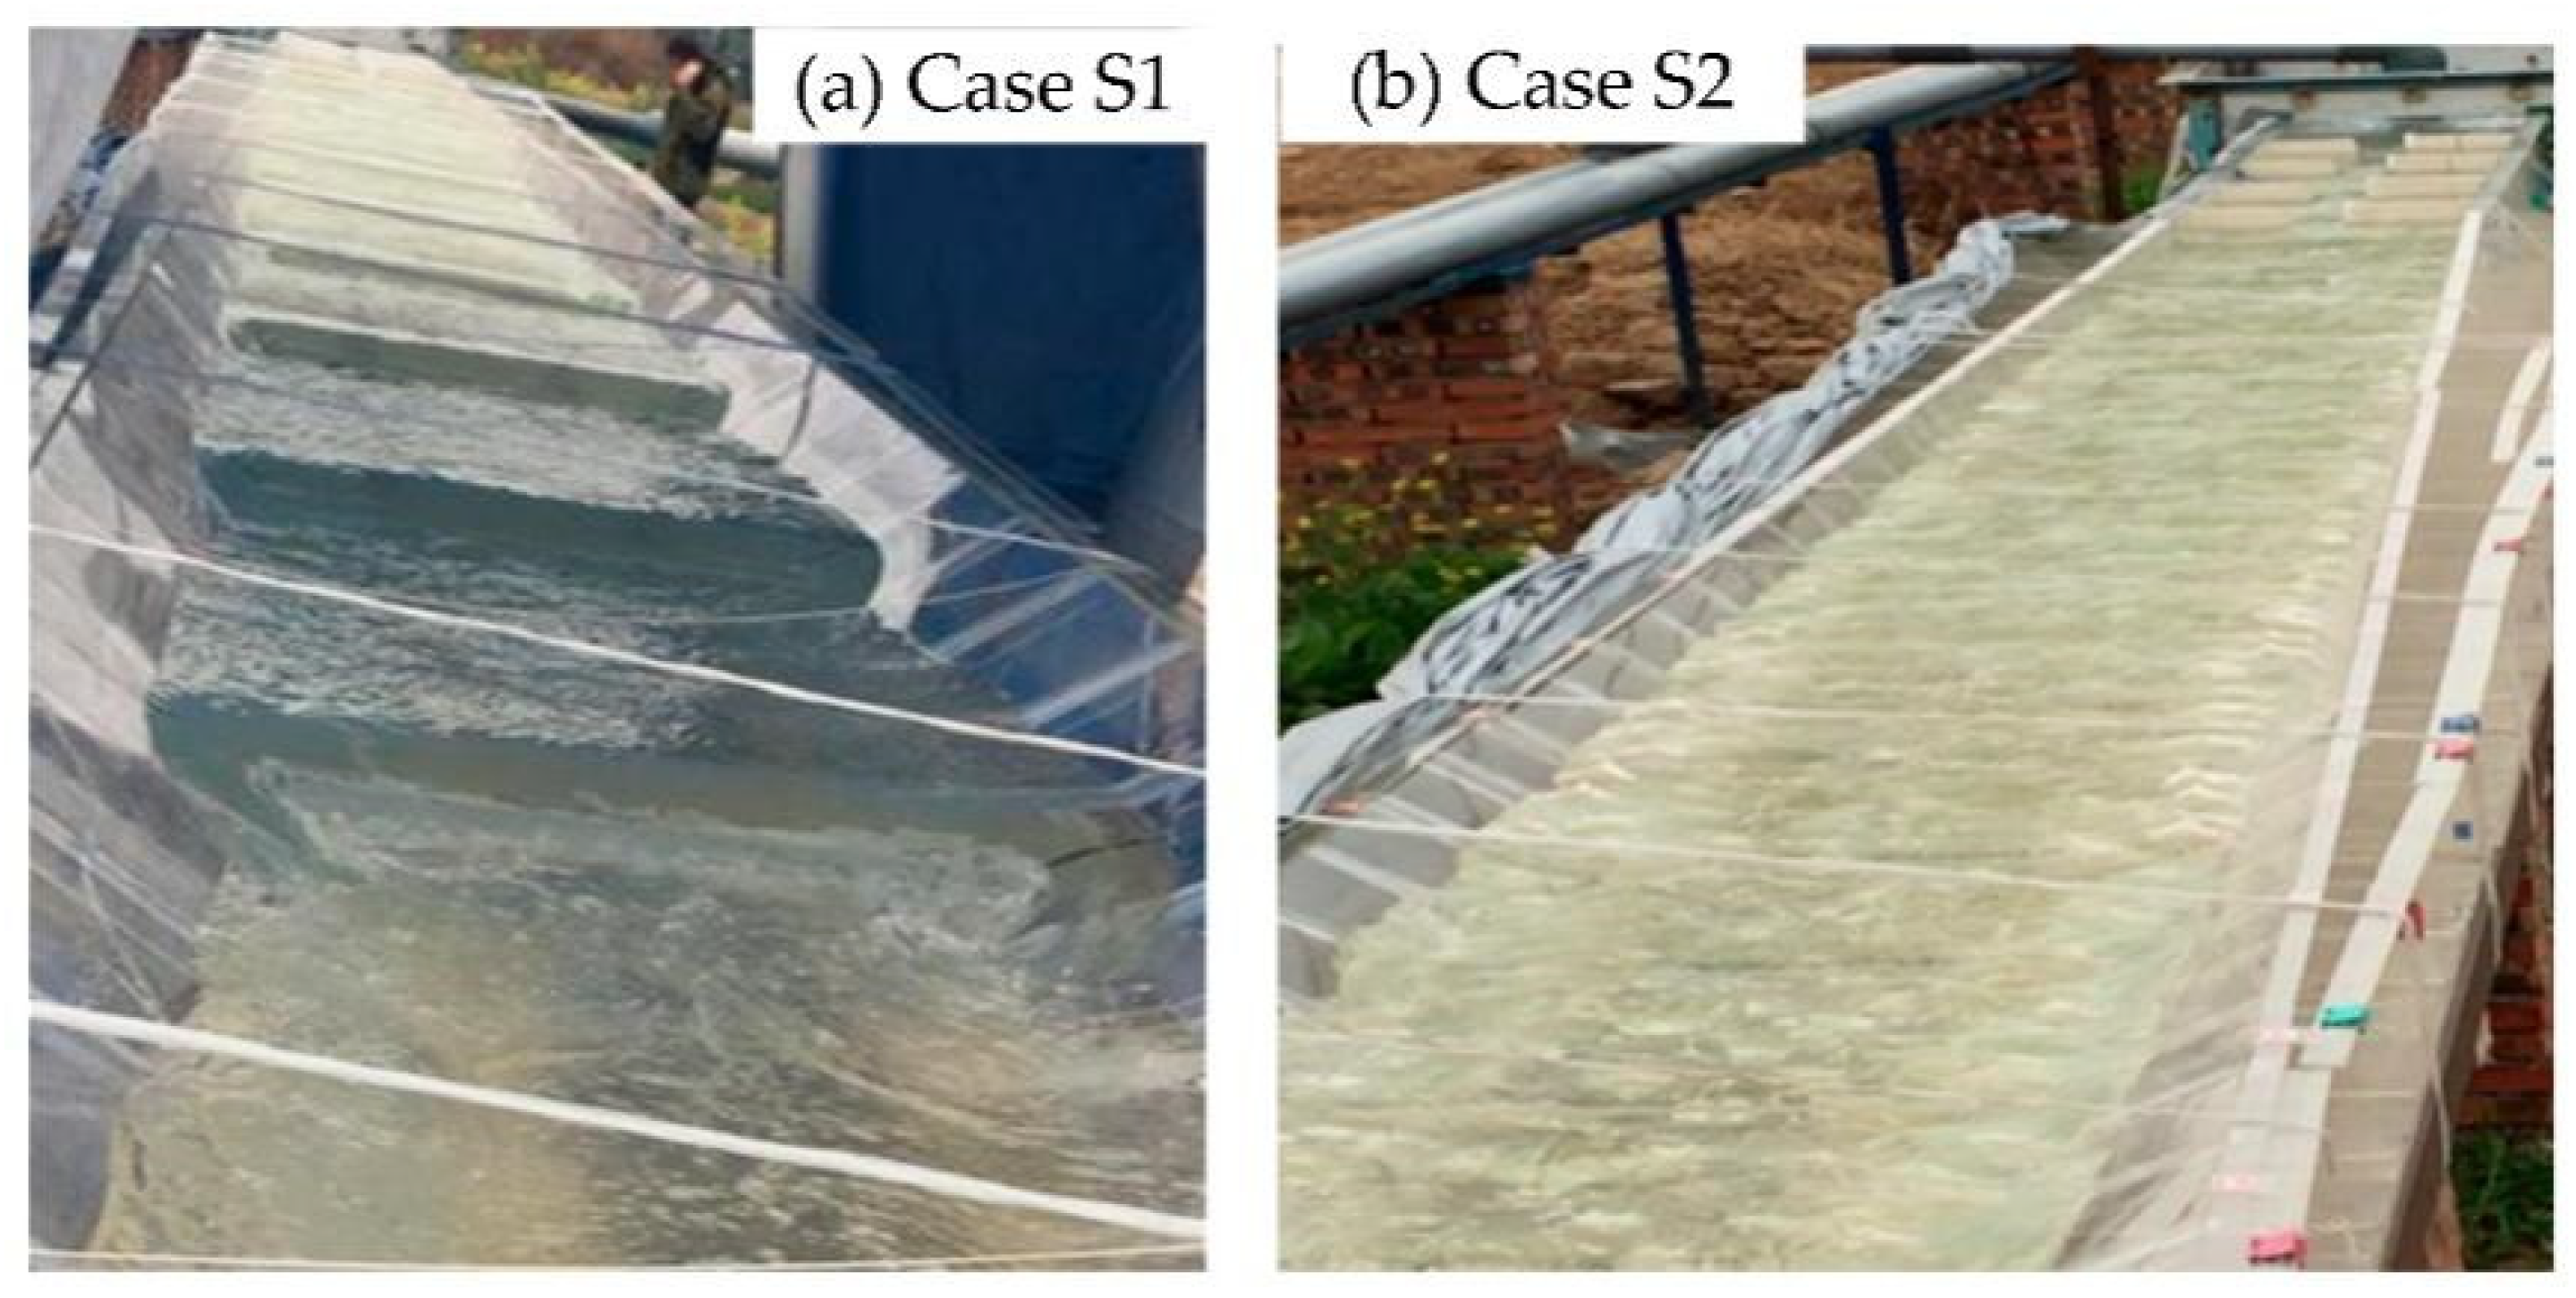
In Case S1, the overflow of the conventional multistage conventional weir failed to maintain the continuity of the water surface in the channel smoothly, and there were multistage water head drops with significant magnitudes, as shown in Figure 17 and Figure 23a.
However, by adopting the DWO in the fishway, the overflow regime, with a steep difference in the water level from that which occurred in Case S1, was entirely improved. This caused the significant multistage head drops of the water surface to become obviously gentler and form a continuous water surface such as that of a natural river, which contributed to maintaining the natural ecological effect of the fishway. As a result, the water head drop of flow over the weir was decreased, and the intensity of the bottom vortex under the DWO weir plate was also weakened, as shown in Figure 23b and Figure 24. As the water depth decreased along the fishway, the split ratio of each DWO plate also increased gradually from 13% to 40%, causing the flow structure (with rectangular sections) to gradually adjust to the form of a natural river (with trapezoidal section), as shown in Figure 24. The whole transition reach presented a smooth water surface curve with multistage minor drops and fluctuations. The flow connection between the weir plates became smoother, which indicates the significant function of the hydraulic regulation of the DWO.
The bottom orifice flow contributed by not only adding an effective flowing area and compressing the horizontal circumfluence but also by reducing the amplitude of the vortex under the weir by more than 50% (from 0.2 to 0.1 m), which is more suitable for the fish living in the middle and upper layers to pass through the weir. In addition, adopting a staggered arrangement of the roughening boulders or ecological caisson formed the staggered local static water region at the bottom, which can provide shelter for fish to rest or feed. These results indicate that adopting the DWO scheme in the non-prismatic transition reach can allow the fishway to be more suitable for migration and more ecologically friendly to migrating fish.
5. Conclusions
A modified weir-orifice structure (DWO) is presented and discussed, providing some structural guidelines and design suggestions.
The modified structure weir-orifice (DWO) was designed as a double passage of flow discharge over the top and at the bottom of the weir, following methods derived from theoretical hydraulics to treat non-prismatic transition reaches. We concluded that the split modulus β of the DWO weir plates must be controlled in the range of 0.18 to 0.33 to ensure that the fishways meet the hydraulic conditions required for the passages of various migrating fish.
Taking a large proposed fishway project as an example, the hydraulic characteristics of the DWO were investigated by means of a hydrodynamic numerical simulation and hydraulic scale model test. Both the experimental and numerical results show that the flow structure of the fishway can be reasonably and effectively adjusted by the DWO. The vertical distribution of the velocity upstream of the weir could be changed from the single-peak skewness profile (Case S1) to the double-peak profile (Case S2 with the DWO), which is more suitable for fish migration. The velocity of the bottom orifice flow was generally in the range of 0.8 to 1.3 m/s, while the overflow velocity of the weir top in Case S2 was between 1.2 and 2.1 m/s, which is significantly reduced by 23% to 40%, as compared to Case S1. The adjusted flow field ensures the optimal ecohydraulic conditions for fish migration. In addition, deploying roughening boulders or ecological caissons could induce staggered local low-velocity regions at the bottom of the flow field, which provides migrating fish with a temporary resting region and an eco-friendly benthonic environment.
Moreover, our research indicates that adjusting the DWO flow by adding a bottom discharging ability controls the vertical turbulent kinetic energy distribution from the crest weir to the bottom layer effectively. The split ratio of the DWO weir plates, representing the weir flow discharge to the orifice flow discharge, was set to increase gradually from 13% to 40% along the transition reach. Such an increase in the orifice flow discharge causes the overflow velocity at the weir crest to decrease accordingly, while the local head drop over the weir crest is reduced from 1.5 to 1.0, and the maximum of each water head drop was reduced from 0.4 to 0.15 m. Compared to S1, the turbulence kinetic energy caused by the reduced head drops is weakened significantly, decreasing by about 41% to 23% at the weir top, and is partially transferred to the bottom layer (still, the turbulent kinetic energy near the orifice is only about 26% to 28% of that of the weir top). These research results show that the deployment of the DWO structure in fishways has significant potential to modulate the hydraulic characteristics of the flow and to provide suitable flow conditions and an ecologically friendly environment for upstream fish migration.
Author Contributions
Conceptualization, M.L. and D.S.; methodology, M.L.; software, Z.L.; validation, M.X., and Z.L.; investigation, M.L. and M.X.; data curation, M.X. and Z.L.; writing—original draft preparation, M.L. and D.S.; writing—review and editing, M.L.and M.G. supervision, D.S. and M.G.; funding acquisition, M.L. and D.S. All authors have read and agreed to the published version of the manuscript.
Funding
This research was funded by [National Natural Science Foundation of China] grant number [51909093; 52079032; 41930643] and [Key Scientific Research Projects in Colleges and Universities of Henan Province] grant number [21A570002].
Institutional Review Board Statement
Not applicable.
Informed Consent Statement
Not applicable.
Data Availability Statement
Not applicable.
Acknowledgments
The financial supports of the National Natural Science Foundation of China (Grant No. 51909093; No. 52079032; No. 41930643), and Key Scientific Research Projects in Colleges and Universities of Henan Province (Grant No. 21A570002) are gratefully acknowledged.
Conflicts of Interest
The authors declare no conflict of interest.
References
- Kiyoumars, R.; Mahdi, M.A.; Saman, S. Hydraulic performance of pk weirs based on experimental study and kernel-based modeling. Water Resour. Manag. 2021, 35, 3571–3592. [Google Scholar]
- Wang, L.; Melville, B.W.; Whittaker, C.N.; Guan, D. Scour estimation downstream of submerged weirs. J. Hydraul. Eng. 2019, 145, 06019016. [Google Scholar] [CrossRef]
- Chen, Q.W. Size and capacity of overflow weir. Water Conserv. Sci. Technol. 2008, 4, 46–48. [Google Scholar]
- Vatankhah, A.R.; Khalili, S. Stage-discharge relationship for weir-orifice structure located at the end of circular open channels. J. Irrig. Drain. Eng. 2020, 146, 06020006. [Google Scholar] [CrossRef]
- Guan, D.W.; Melville, B.; Friedrich, H. Flow patterns and turbulence structures in a scour hole downstream of a submerged weir. J. Hydraul. Eng. 2014, 140, 68–76. [Google Scholar] [CrossRef]
- Guiny, E.; Armstrong, J.D.; Ervine, D.A. Preferences of mature male brown trout and atlantic salmon parr for orifice and weir fish pass entrances matched for peak velocities and turbulence. Ecol. Freshw. Fish 2003, 12, 190–195. [Google Scholar] [CrossRef]
- Nilsson, C.; Reidy, C.A.; Dynesius, M.; Revenga, C. Fragmentation and flow regulation of the world’s large river systems. Science 2005, 308, 405–408. [Google Scholar] [CrossRef] [Green Version]
- Castro-Santos, T.; Cotel, A.; Webb, P.W. Fishway Evaluations for Better Bioengineering–An Integrative Approach; Bethesda, M.D., Ed.; American Fisheries Society: Bethesda, MD, USA, 2009; Volume 69, pp. 557–575. [Google Scholar]
- Zarfl, C.; Lumsdon, A.E.; Berlekamp, J.; Tydecks, L.; Tockner, K. A global boom in hydropower dam construction. Aquat. Sci. 2014, 77, 161–170. [Google Scholar] [CrossRef]
- Silva, A.T.; Lucas, M.C.; Castro-Santos, T.; Katopodis, C.; Baumgartner, L.J.; Thiem, J.D.; Aarestrup, K.; Pompeu, P.S.; O’Brien, G.C.; Braun, D.C.; et al. The future of fish passage science, engineering and practice. Fish Fish. 2018, 19, 340–362. [Google Scholar] [CrossRef] [Green Version]
- Kim, J.H.; Yoon, J.D.; Baek, S.H.; Park, S.-H.; Lee, J.-W.; Lee, J.-A.; Jang, M.-H. An Efficiency Analysis of a Nature-Like Fishway for Freshwater Fish Ascending a Large Korean River. Water 2016, 8, 3. [Google Scholar] [CrossRef] [Green Version]
- Pelicice, F.M.; Agostinho, C.S. Deficient downstream passage through fish ladders: The case of Peixe Angical Dam, Tocantins River, Brazil. Neotrop. Ichthyol. 2012, 10, 705–713. [Google Scholar] [CrossRef] [Green Version]
- Wang, X.Z.; Gan, X.N.; Li, J.B.; Chen, Y.; He, S. Cyprininae phylogeny revealed independent origins of the tibetan plateau endemic polyploid cyprinids and their diversifications related to the neogene uplift of the plateau. Sci. China Life Sci. 2016, 59, 1149–1165. [Google Scholar] [CrossRef] [PubMed] [Green Version]
- Baek, K.O.; Ku, Y.H.; Kim, Y.D. Attraction efficiency in natural-like fishways according to weir operation and bed change in nakdong river. Ecol. Eng. 2015, 84, 569–578. [Google Scholar] [CrossRef]
- Castro-Santos, T.; Shi, X.; Haro, A. Migratory behavior of adult sea lamprey and cumulative passage performance through four fishways. Can. J. Fish. Aquat. Sci. 2016, 74, 790–800. [Google Scholar] [CrossRef]
- Celestino, L.F.; Sanz-Ronda, F.J.; Miranda, L.E.; Makrakis, M.C.; Dias, J.H.P.; Makrakis, S. Bidirectional connectivity via fish ladders in a large Neotropical river. River Res. Appl. 2019, 35, 236–246. [Google Scholar] [CrossRef]
- Larinier, M.; Marmulla, G. Fish passages, Types, principles and geographical distribution–an overview. In Proceedings of the second international symposium on the management of large rivers for fisheries, Phnom Penh, Cambodia, 11–14 February 2003; Welcomme, R.L., Petr, T., Eds.; RAP Publication: Bangkok, Thailand, 2004; Volume 17, pp. 183–206. [Google Scholar]
- DVWK. Fish Passages-Design Dimension and Monitoring; FAO-Food and Agriculture Organization of theUnited Nations: Rome, Italy, 2002; ISBN 92-5-104894-0. [Google Scholar]
- Poff, N.L.; Hart, D.D. How dams vary and why it matters for the emerging science of dam removal. BioScience 2002, 52, 659–668. [Google Scholar] [CrossRef] [Green Version]
- Castro-Santos, T.; Haro, A. Fish Guidance and Passage at Barriers; Science Publishers: Enfield, NH, USA, 2010; pp. 62–89. [Google Scholar]
- Gough, P.; Philipsen, P.; Schollema, P.P.; Wanningen, H. From Sea to Source: International Guidance for the Restoration of Fish Migration Highways; Regional Water Authority Hunze en Aa’s: Veendam, The Netherlands, 2012. [Google Scholar]
- Tummers, J.S.; Hudson, S.; Lucas, M.C. Evaluating the effectiveness of restoring longitudinal connectivity for stream fish communities: Towards a more holistic approach. Sci. Total Environ. 2016, 569–570, 850–860. [Google Scholar] [CrossRef] [PubMed] [Green Version]
- Meyer, J.L.; Strayer, D.L.; Wallace, J.B.; Eggert, S.L.; Helfman, G.S.; Leonard, N.E. The contribution of headwater streams to biodiversity in river networks. J. Am. Water Resour. Assoc. 2007, 43, 86–103. [Google Scholar] [CrossRef] [Green Version]
- Cooke, S.J.; Hinch, S.G. Improving the reliability of fishway attraction and passage efficiency estimates to inform fishway engineering, science, and practice. Ecol. Eng. 2013, 58, 123–132. [Google Scholar] [CrossRef]
- Bido, A.F.; Urbinati, E.C.; Makrakis, M.C.; Celestino, L.F.; Serra, M.; Makrakis, S. Stress indicators for Prochilodus lineatus (Characiformes: Prochilodontidae) breeders during passage through a fish ladder. Mar. Freshw. Res. 2018, 69, 1814. [Google Scholar] [CrossRef]
- Radinger, J.; Wolter, C. Patterns and predictors of fish dispersal in rivers. Fish Fish. 2014, 15, 456–473. [Google Scholar] [CrossRef]
- Moraes, P.; Deverat, F. An Introduction to Fish Migration; Moraes, P., Deverat, F., Eds.; Taylor & Francis Group: London, UK, 2016; ISBN 978-1-4987-1874-5. [Google Scholar]
- Makrakis, S.; Bertao, P.S.; Jhony, F.M.S.; Makrakis, M.C.; Sanz-Ronda, F.J.; Celestino, L.F. Hydropower Development and Fishways: A Need for Connectivity in Rivers of the Upper Paraná Basin. Sustainability 2019, 11, 3749. [Google Scholar] [CrossRef] [Green Version]
- An, R.D.; Li, J.; Liang, R.F.; Tuo, Y. Three-dimensional simulation and experimental study for optimising a vertical slot fishways. J. Hydro-Environ. Res. 2016, 12, 119–129. [Google Scholar] [CrossRef]
- An, R.D.; Li, J.; Yi, W.M.; Xi, M. Hydraulics and swimming behavior of schizothorax prenanti in vertical slot fishways. J. Hydrodyn. 2019, 31, 169–176. [Google Scholar] [CrossRef]
- Cooper, M.M.; Brand, D.A. Non-salmonids in a salmonid fishway: What do 50 years of data tell us about past and future fish passage? Fish. Manag. Ecol. 2007, 14, 319–332. [Google Scholar] [CrossRef]
- Andersson, A.G.; Lindberg, D.-E.; Lindmark, E.M.; Leonardsson, K.; Andreasson, P.; Lundqvist, H.; Lundström, T.S. A study of the location of the entrance of a fishway in a regulated river with CFD and ADCP. Model. Simul. Eng. 2012, 2012, 2. [Google Scholar] [CrossRef]
- Cao, P.; Mu, X.P.; Baiyin, B.L.; Wang, X.Y.; Chen, Y.F. study on swimming behavior of juvenile grass carp for the fish channel hydraulic design. J. Water Conserv. 2017, 48, 1456–1291464. [Google Scholar]
- Cao, P. Fishway Hydraulics Study Based on Fish Swimming Behavior; China Institute of Water Resources and Hydropower Research: Beijing, China, 2018. [Google Scholar]
- Peirson, W.; Harris, J.; Kingsford, R.; Mao, X.; Felder, S. Piping Fish over Dams. J. Hydro-Environ. Res. 2021, 39, 71–80. [Google Scholar]
- Quaresma, A.L.; Pinheiro, A.N. Modelling of pool-type fishways flows: Efficiency and scale effects assessment. Water 2021, 13, 851. [Google Scholar] [CrossRef]
- Santos, J.M.; Branco, P.; Katopodis, C.; Ferreira, T.; Pinheiro, A. Retrofitting pool and weir fishways to improve passage performance of benthic fishes Effect of boulder density and fishway discharge. Ecol. Eng. 2014, 73, 335–344. [Google Scholar] [CrossRef]
- Poulet, N. Impact of weirs on fish communities in a piedmont stream. River Res. Appl. 2007, 23, 1038–1047. [Google Scholar] [CrossRef]
- Dong, Z.Y.; Huang, Z.; Yu, J.P. Experimental study of turbulent structures of slot-orifice-weir combined fishway with staggered layout. J. Hydroelectr. Eng. 2020, 39, 78–87. [Google Scholar]
- Fuentes-Pérez, J.F.; Sanz-Ronda, F.J.; Paredes, A.M.D.A.; García-Vega, A. Modeling water-depth distribution in vertical-slot fishways under uniform and nonuniform scenarios. J. Hydraul. Eng. 2014, 140, 06014016. [Google Scholar] [CrossRef] [Green Version]
- Mu, X.P.; Zhen, W.Y.; Li, X.; Cao, P.; Gong, L.; Xu, F. A study of the impact of different flow velocities and light colors at the entrance of a fish collection system on the upstream swimming behavior of juvenile grass carp. Water 2019, 11, 322. [Google Scholar] [CrossRef] [Green Version]
- Wassvik, E. Attraction Channel as Entrance to Fishways; Lule University of Technology: Luleå, Sweden, 2006. [Google Scholar]
- Kemp, P.S.; O’hanley, J.R. Procedures for Evaluating and Prioritising the Removal of Fish Passage Barriers: A Synthesis. Fish. Manag. Ecol. 2010, 17, 297–322. [Google Scholar] [CrossRef]
- Katopodis, C.; Kells, J.A.; Acharya, M. Nature-like and conventional fishways: Alternative concepts. Can. Water Re-Sources J. 2001, 26, 211–232. [Google Scholar] [CrossRef] [Green Version]
- Acharya, M.; Kells, J.A.; Katopodis, C. Some hydraulic design aspects of nature-like fishways. Water Resour. 2020, 5, 39–43. [Google Scholar]
- Yagci, O. Ydraulic aspects of pool-weir fishways asecologically friendly water structure. Ecol. Eng. 2010, 36, 36–46. [Google Scholar] [CrossRef]
- Bryan, A.M.; Abul, B.M.B.; David, Z.; Steven, J.C.; Christos, K. The hydraulics of a vertical slot fishway: A case study on the multi-species vianney-legendre fishway in Quebec, Canada. Ecol. Eng. 2016, 90, 190–202. [Google Scholar]
- Tudorache, C.; Viaene, P.; Blust, R.; Vereecken, H.; De Boeck, G. A comparison of swimming capacity and energy use in seven european freshwater fish species. Ecol. Freshw. Fish 2008, 17, 284. [Google Scholar] [CrossRef]
- Liu, M.X.; Liu, Z.; Fan, C.Z. Hydraulic modeling and shape optimization of a new pattern fishway in transition section. Eng. J. Wuhan Univ. 2021, 54, 991–998. [Google Scholar]
- Sun, D.P.; He, S.N.; Wang, P.T. Hydraulic characteristics of flow in intake area of open channel fishway and its improving measures. Water Resour. Hydropower Eng. 2016, 47, 58–62. [Google Scholar]
- Zhao, Z.L.; Liang, R.F.; Wang, Y.M.; Yuan, Q.; Zhang, Z.; Li, K. Study on the swimming ability of endemic fish in the lower reaches of the Yangtze River: A case study. Glob. Ecol. Conserv. 2020, 22, e01014. [Google Scholar] [CrossRef]
- Santos, J.M.; Branco, P.J.; Silva, A.T.; Katopodis, C.; Pinheiro, A.; Viseu, T.; Ferreira, T. Effect of two flow regimes on the upstream movements of the Iberian barbel (Luciobarbus bocagei) in an experimental pool-type fishway. Appl. Ichthyol. 2013, 29, 425–430. [Google Scholar] [CrossRef]
Figure 1.
Sketch of conventional multistage weir outflow. The flow velocity close to the weirs decreases while the upstream water level increases. Supplying a continuous free surface is one of the advantages of multistage weirs.
Figure 1.
Sketch of conventional multistage weir outflow. The flow velocity close to the weirs decreases while the upstream water level increases. Supplying a continuous free surface is one of the advantages of multistage weirs.

Figure 2.
Sketch of multistage orifice outflow. Submerged outflow through the orifices leads to the contraction of the streamline distribution upstream and increase in the flow velocity gradually near the orifice. Discontinuous water surface and lack of eco-friendliness are the disadvantages of this structure.

Figure 3.
Flow state of the differential weir–orifice (DWO). The DWO structure forms two different flow patterns, i.e., weir flow at the top and orifice flow near the bottom, and two circular currents upstream and downstream from the weir plate. The discharge of the weir overflow and bottom orifice flow are both affected by the orifice diameter e and weir height P. The streamline is smoother than that of the two structures shown in Figure 1 and Figure 2.

Figure 4.
Hydraulic computing process of the DWO. The program shows a method to calculate the respective discharge of the weir flow and orifice flow considering the needs of fish migration.
Figure 4.
Hydraulic computing process of the DWO. The program shows a method to calculate the respective discharge of the weir flow and orifice flow considering the needs of fish migration.

Figure 5.
Layout sketch of the river and of a proposed fishway project in southern China. Only part of the fishway in the right bank is shown in the figure. There is an auxiliary dam built at the inlet of a natural flood diversion ditch upstream from the main dam. The fishway, designed as vertical slot structure, passes through the auxiliary dam and is connected to a meandering ecological fishway by a non-prismatic channel (transition reach). The beach and channel comprise the meandering ecological fishway.

Figure 6.
Layout of the transition reach and multistage weirs (1–11). The transition reach is a non-prismatic channel in which the bottom width was designed as decreasing along the longitudinal direction while the side slope increases accordingly. The cross-section of the entrance is a rectangle, while that of the export is a trapezoid. There are eleven weirs, and their heights decrease along the flow direction, which causes water depth to diminish correspondingly.

Figure 7.
Sketch of DWO and roughness boulders (unit: cm). The elevation view of the DWO 1, 4, 7 and 11 are shown in panels (a–d), which includes three orifices in each weir plate. The DWO structure can be divided into three typical regions (including three weirs), as shown in (e–g). The roughening blocks are arranged symmetrically with the central axis of the channel, and the blocks upstream and downstream from the orifice are also arranged symmetrically. The roughening boulders were sampled as cubic blocks in the hydraulic model, as shown in the figure.

Figure 10.
Water depth of Case S1 obtained by two methods. The model experimental data and numerical simulation data both show an apparently fluctuating and discontinuous water surface line. They are in a good agreement due to similar resistance.
Figure 10.
Water depth of Case S1 obtained by two methods. The model experimental data and numerical simulation data both show an apparently fluctuating and discontinuous water surface line. They are in a good agreement due to similar resistance.

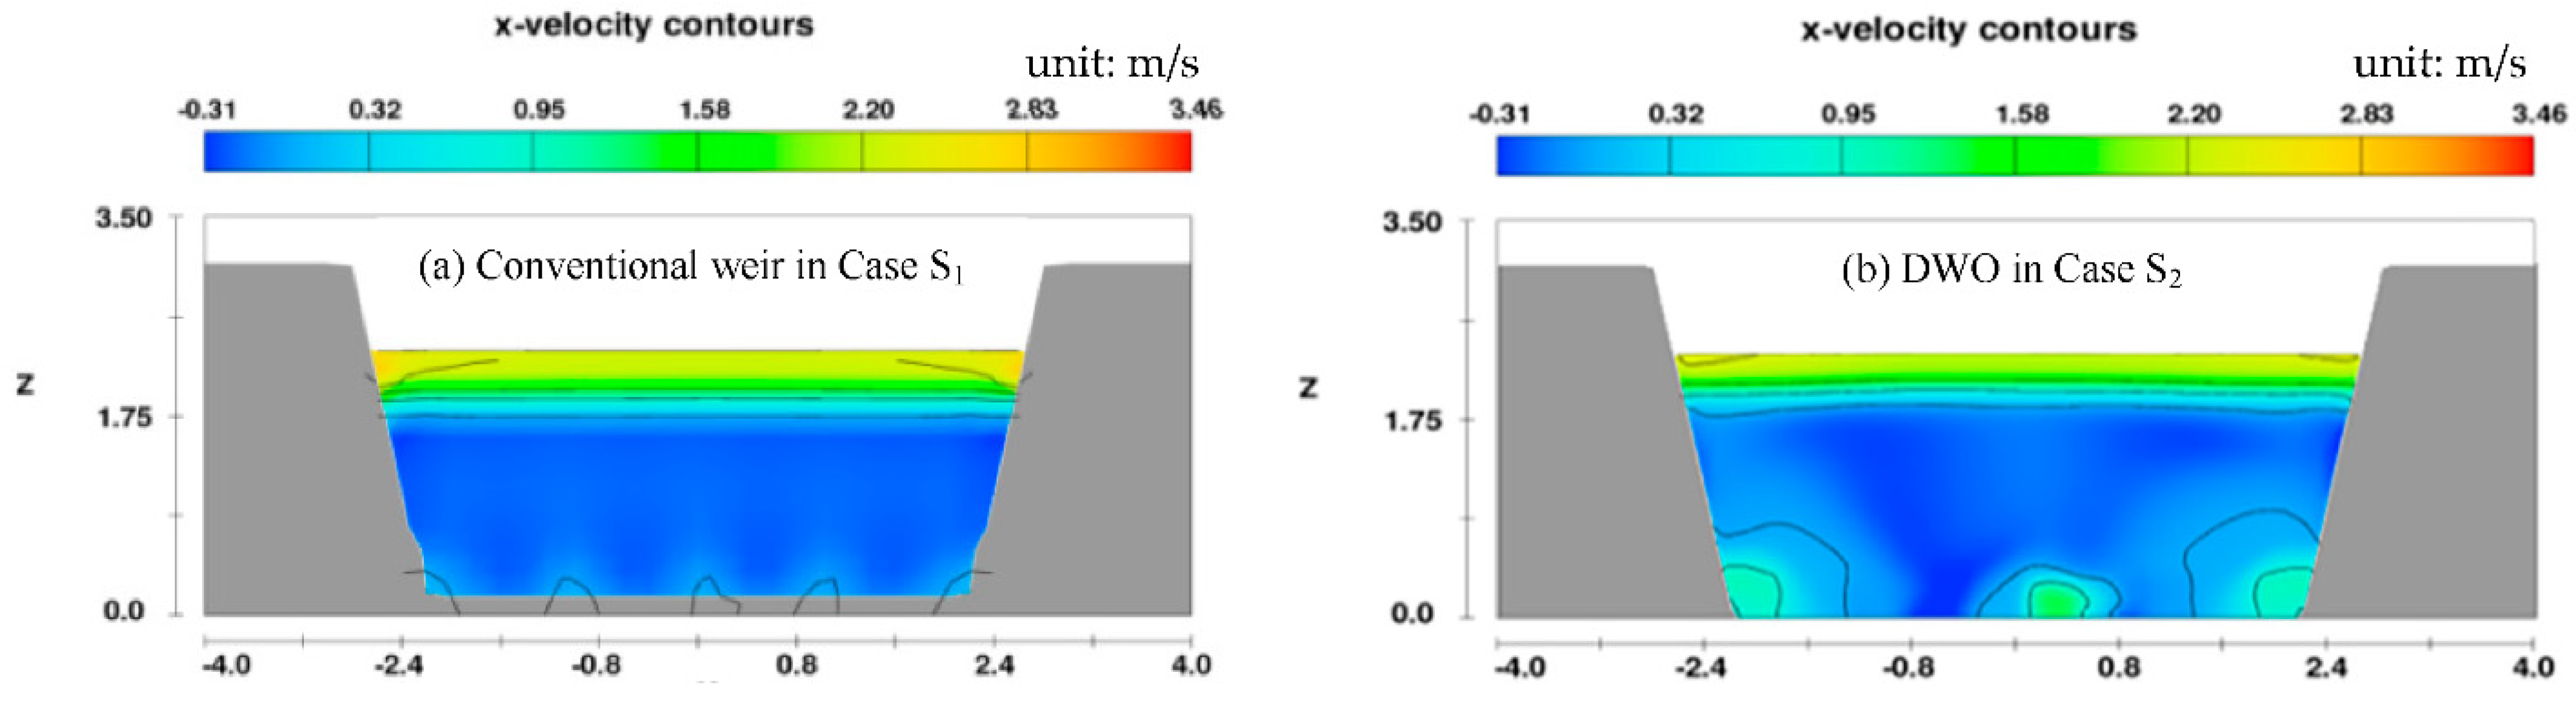
Figure 11.
Velocity contours of the cross−section (X/L = 0.21, upstream). L is the length of the transition reach, and X is the distance of cross−section selected away from the inlet. (a) There is mainly upper overflow of the weir crest without bottom flow in S1, and the velocity is about 2.2 to 2.8 m/s. The bottom circumfluence could be affected by roughening blocks. (b) The bottom flow velocities passing through three orifices are all about 0.6 to 1.0 m/s, and the upper overflow velocity is reduced to 1.2 to 2.3 m/s. The velocities of the weir flow and orifice flow are both suitable for fish migration in S2. In the figure, x, y, and z denote the longitude, transverse, and vertical coordinates (unit: m). The x− velocity is the longitudinal flow velocity (unit: m/s).

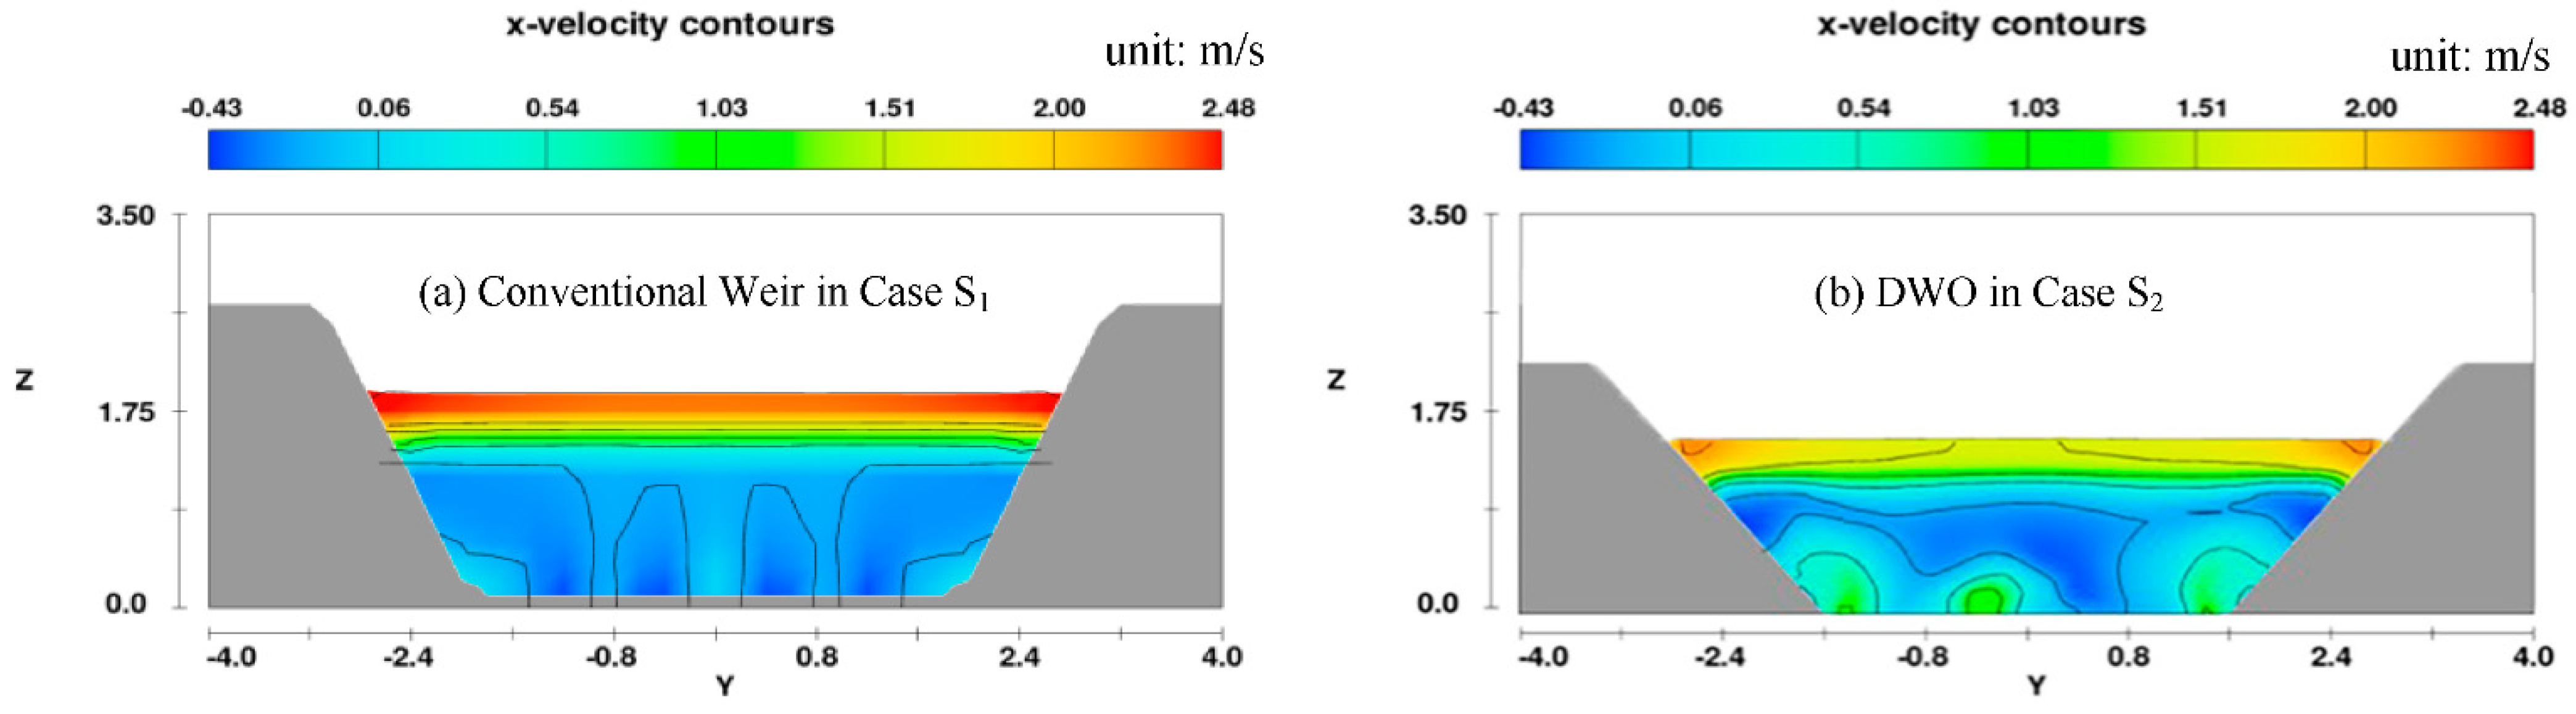
Figure 12.
Velocity contours of the cross-section (X/L = 0.41, middle stream) for the conventional weir of Case S1 and the DWO of Case S2 in panel (a,b). The velocity is larger, up to 2.5 m/s, because the circumfluence is concentrated at the weir top in S1, but the velocity at the weir top in S2 is only about 1.2 to 1.5 m/s. The velocity profile in the cross-section is more uniform than that in S1 and also more suitable for fish migration. The meanings of all the variables and symbols in the figure are the same as above.

Figure 13.
Velocity contours of the cross-section (X/L = 0.75, downstream) for the conventional weir of Case S1 and the DWO of Case S2 in panel (a,b). As the height of the downstream weir is very small, the depth is also largely decreased, which causes the turbulence intensity of the flow to increase. However, the water surface fluctuation and the velocity of the overflow at the weir top in S2 are both less than those in S1. The meanings of all the variables and symbols in the figure are the same as above.

Figure 14.
Velocity profiles of cross-Section 3 under the two case boundary conditions. The curve of the flow velocity profile was obtained according to the numerical simulation data in Section 3, as shown in Figure 6. It is seen that because part of the flow discharging at the weir crest is transferred to the bottom, the velocity distribution in the vertical is relatively uniform (red line) and more suitable for fish migration in Case S2. However, the overflow velocity of the weir crest is too large (black line) for fish migration in Case S1.

Figure 15.
Turbulent energy contours of the cross−section (X/L = 0.21, upstream) for the conventional weir of Case S1 and the DWO of Case S2 in panel (a,b). The water depth upstream is higher, the flow turbulence in the upper layer has less influence on the lower layer in Case S1, and the vertical gradient of the turbulent energy is significant, seen in the left figure. However, the spatial distribution difference of the turbulent energy decreases in Case S2, and therefore, the vertical gradient is lower, as shown in the right figure. The meanings of all the variables and symbols in the figure are same as above. The unit of turbulent energy is m2/s2.

Figure 16.
Turbulent energy contours of the cross-section (X/L = 0.41, middle stream) for the conventional weir of Case S1 and the DWO of Case S2 in panel (a,b). It can be seen that as the water depth is lower than upstream, the flow turbulence in the upper layer starts to affect the lower layer. The upper turbulent strength in Case S1 is larger than that in Case S2, and the bottom turbulent energy in the DWO (Case S2) is larger than that in the conventional weir (Case S1). The turbulent conditions in both the upper and bottom layers in S2 are more suitable for fish migration than those in S1. The meanings of all the variables and symbols in the figure are the same as above.

Figure 17.
Comparison of water surface profiles between the two schemes. The water head drop in Case S1 ranges from 0.3 to 0.4 m, which is difficult for migrating fish. However, the flow drops in Case S2 have been reduced to 0.10 to 0.16 m, forming a minor undulating water surface, which is more suitable for fish migration.

Figure 18.
Streamlines through the DWO plate. The change in the streamline distributions around the roughening blocks at the bottom reflects their retardation effect and the adjustment to the bottom flow field. The streamlines show that there is still circumfluence between the two weirs.
Figure 18.
Streamlines through the DWO plate. The change in the streamline distributions around the roughening blocks at the bottom reflects their retardation effect and the adjustment to the bottom flow field. The streamlines show that there is still circumfluence between the two weirs.

Figure 19.
Aerial view of the fishway model with the DWO and experimental system. The geometric scale of the model was 10. The model is 16 m long and made up of polymethyl methacrylate, which can satisfy the resistance similarity and is transparent in all directions. The pipeline is used to supply the circulating hydrodynamics, and the discharge is controlled by an E-mag flow meter. The water level of the outlet is measured by a water gauge, while the velocity is measured by an ADV and propeller current meter in shallow water.

Figure 20.
Local 3D simulation model. The interval between the DWO plates is 5 m. The bottom roughening boulders are staggered to increase the roughness as well as reduce the velocity, making it easier for migrating fish.
Figure 20.
Local 3D simulation model. The interval between the DWO plates is 5 m. The bottom roughening boulders are staggered to increase the roughness as well as reduce the velocity, making it easier for migrating fish.

Figure 21.
Change process of the water level along the transition reach. The water depth of the weir crest was reduced to 0.35 to 0.45 m and was quite uniform along the reach, almost presenting a horizontal line in the figure, which improved the fishway landscape. The water head drop of each stage was basically reduced to about 0.1 m, which contributed to fish migration in the upper layer.

Figure 22.
Change process of the flow velocity along the transition reach in Case S2. The velocities of the weir flow at the upper layer and the bottom orifice flow both fluctuated along the reach in the range of 0.4 to 0.6 m/s. The upper velocity in Case S2 was decreased by 0.25 to 0.85 m/s compared to that in Case S1. Therefore, the layer conditions of the flow structures and their flow intensities are both suitable for migrating fish and also contribute to living aquatic plants, reoxygenation, and improved water ecology.

Figure 23.
Water surface of the transition reach in Cases S1 and S2 in the hydraulic model. The waves on the water surface and the water drops are very obvious, where the local head drop around each weir plate is high, and the turbulent intensity is very strong (a). In Case S2, the gradient of the water surface became mild (b). It can be seen that the flow regime in the channel adopting the DWO became more gentle, without a strong vortex, which supplies the suitable mild dynamics of a migration environment.

Figure 24.
Water surface of the transition reach with the DWO in the hydraulic model. The waves on the water surface decreased, obviously, and the turbulent intensity was reduced evenly by one-third. After the local head drop around each weir plate greatly decreased, the gradient of the water surface became mild. Another important point: the water surface was continuous and complete, and the entire artificial building could be hidden in the water, which caused the fishway to appear similar to a natural river. It can be seen that the flow regime in the channel adopting the DWO became more gentle, without a strong vortex, which supplies the suitable mild dynamics of a migration environment.

Publisher’s Note: MDPI stays neutral with regard to jurisdictional claims in published maps and institutional affiliations. |
© 2022 by the authors. Licensee MDPI, Basel, Switzerland. This article is an open access article distributed under the terms and conditions of the Creative Commons Attribution (CC BY) license (https://creativecommons.org/licenses/by/4.0/).
Share and Cite
MDPI and ACS Style
Liu, M.; Xu, M.; Liu, Z.; Sun, D.; Guala, M. Ecohydraulic Characteristics of a Differential Weir-Orifice Structure and Its Application to the Transition Reach of a Fishway. Water 2022, 14, 1711. https://doi.org/10.3390/w14111711
AMA Style
Liu M, Xu M, Liu Z, Sun D, Guala M. Ecohydraulic Characteristics of a Differential Weir-Orifice Structure and Its Application to the Transition Reach of a Fishway. Water. 2022; 14(11):1711. https://doi.org/10.3390/w14111711
Chicago/Turabian StyleLiu, Mingxiao, Mengxin Xu, Zhen Liu, Dongpo Sun, and Michele Guala. 2022. "Ecohydraulic Characteristics of a Differential Weir-Orifice Structure and Its Application to the Transition Reach of a Fishway" Water 14, no. 11: 1711. https://doi.org/10.3390/w14111711
Note that from the first issue of 2016, this journal uses article numbers instead of page numbers. See further details here.