
Textural Characteristics of the Holocene Sandy Ridges in the Eastern Venetian Coastal Plain (North Adriatic Sea, Italy)


Institute of Marine Sciences, National Research Council, Arsenale-Tesa 104, Castello 2737/F, 30122 Venice, Italy
Water 2022, 14(11), 1710; https://doi.org/10.3390/w14111710
Submission received: 1 April 2022
/
Revised: 21 May 2022
/
Accepted: 24 May 2022
/
Published: 26 May 2022
(This article belongs to the Special Issue Advances in Geological and Geomorphological Studies in Coastal Areas)
Abstract
:In the lower Piave river coastal plain (northeast of the Venice Lagoon, Italy), evidences of ancient sandy ridges testify to both the local coastline progradation and retrogradation that occurred during the Holocene. Their arrangement is recognizable in aerial photographs as they appear as groups of parallel sandy strips. The orientation of each group of ridges differs from the orientation of the others. Even if the ridges have not preserved their original relief and morphology, weak undulations are still locally present. Through the joint interpretation of textural parameters and geomorphological observations and measurements, an attempt has been made to define the depositional processes responsible for the formation of these sandy ridges. The results from grain-size analyses have given evidence of the foreshore and the backshore environments. They have confirmed the presence of both aeolian deposits in most of the sampled sandy ridges and fine-grained filling sediments containing organic matter in the old inter-ridge depressions. The investigations have also confirmed the existence of a well-preserved abandoned Piave river delta and four subsequent main stages of coastal progradation interrupted by episodes of coastal retreat. Therefore, this research has provided new insights into the evolution of the Holocene Venetian coastal plain by adding new information on the different coastal depositional environments and transporting agents.
1. Introduction
The lower Piave river coastal plain is located northeast of the Venice Lagoon (north-western Adriatic Sea, Italy). The present setting of this territory is the result of natural avulsions that occurred during the Holocene and human interventions (also responsible for river diversions) carried out since the 13th century [1,2] to move away the Piave river mouth from the Lagoon of Venice, thus preventing the progressive sedimentary infilling of the lagoon produced by fluvial sediments.
In the study area, several land reclamation activities were also carried out from the 16th century to the second half of the 20th century to drain the extensive swamps that characterized this territory historically. Dikes, canals, and sluices were created to prevent river floods. Consequently, the present coastal plain is crossed by a dense network of canals and ditches. Pumping stations keep this area dry.
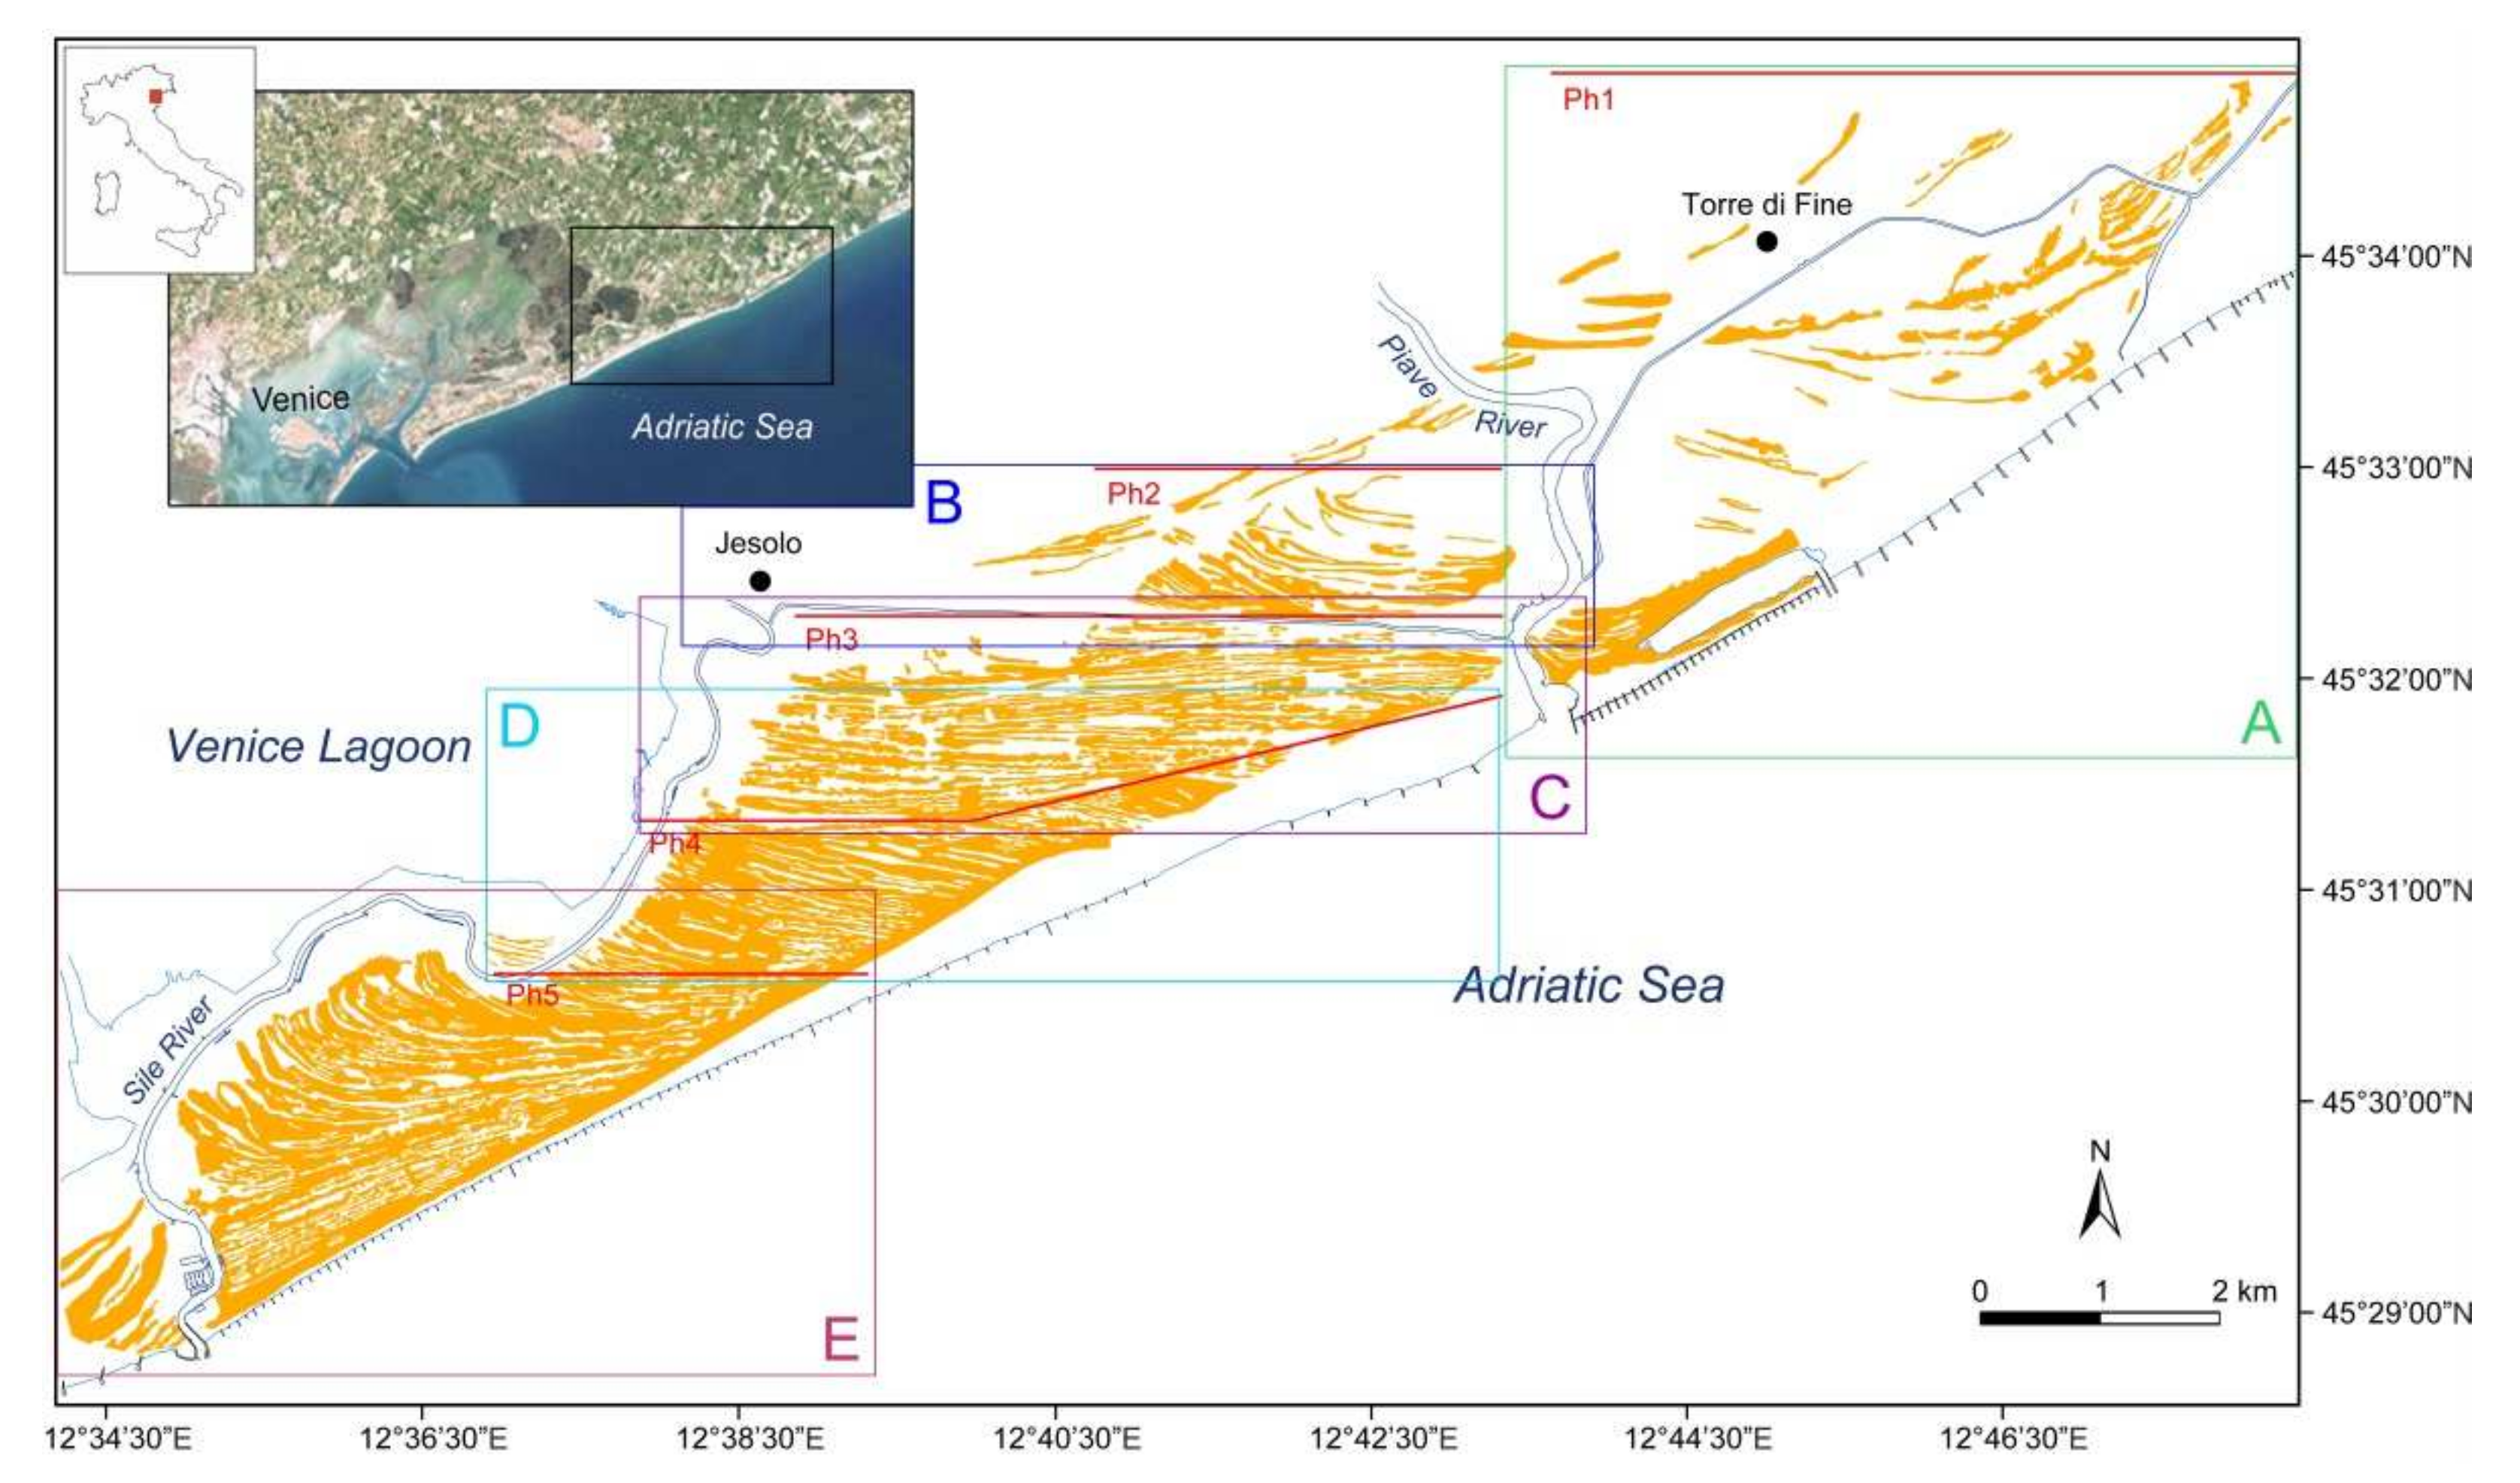
Notwithstanding these extensive reclamation works, in the investigated area, abundant traces of ancient sandy ridges [3], which appear as groups of parallel sandy strips, can be clearly recognized [3,4,5] (Figure 1). Sandy ridges formed during periods of sea levels higher than at present, so their presence testifies to the coastline progradation that occurred during the Holocene [6,7,8,9]. However, these ridges have not preserved their original relief and morphology owing to human interventions. Ground elevation usually ranges from −1 to +1 m a.s.l.; lower values (mainly down to 2 m b.s.l.) occur in reclaimed areas, whereas higher elevation (generally up to 3 m a.s.l.) is measured on both the river banks and the present-day beach ridges.
The arrangement of the ancient sandy ridges recognizable in aerial photographs also makes it possible to distinguish a well-preserved cuspate paleo-delta east of the Piave River (i.e., SE of Torre di Fine) [3,4,5].
The inner coastline position is located about 3 km inland of the current shoreline. At present, it is testified by the presence of sand strips aligned along the direction Jesolo—Torre di Fine, which have the same orientation as the present coast (i.e., SW-NE) (Figure 1). This ancient coastline, possibly dating back to 6500 yr BP [10], could be connected to the one recognized in the north-eastern Venice Lagoon and located just north of the alignment Lio Maggiore—Lio Piccolo, featuring relatively well-preserved old beach ridges.
After the Holocene transgression in the analyzed coastal area, sedimentation was mainly controlled by the fluvial discharge of the Piave river courses. It was also favored by the longshore transport from NE, as still occurs. The sequence representative of the highstand system tract is characterized by the prograding deposits formed when sediment supply exceeds the rate of relative sea-level rise [11]. The related clinoformal wedge formed along the Italian Adriatic coast over the past 5500–6000 yr [12,13,14]. The onshore distribution of relict shoreline traces reflects a subsequent alternation of phases of progradation due to a positive coastal sediment budget and coastal erosion that occurred prior to the formation of a new group of ridges.
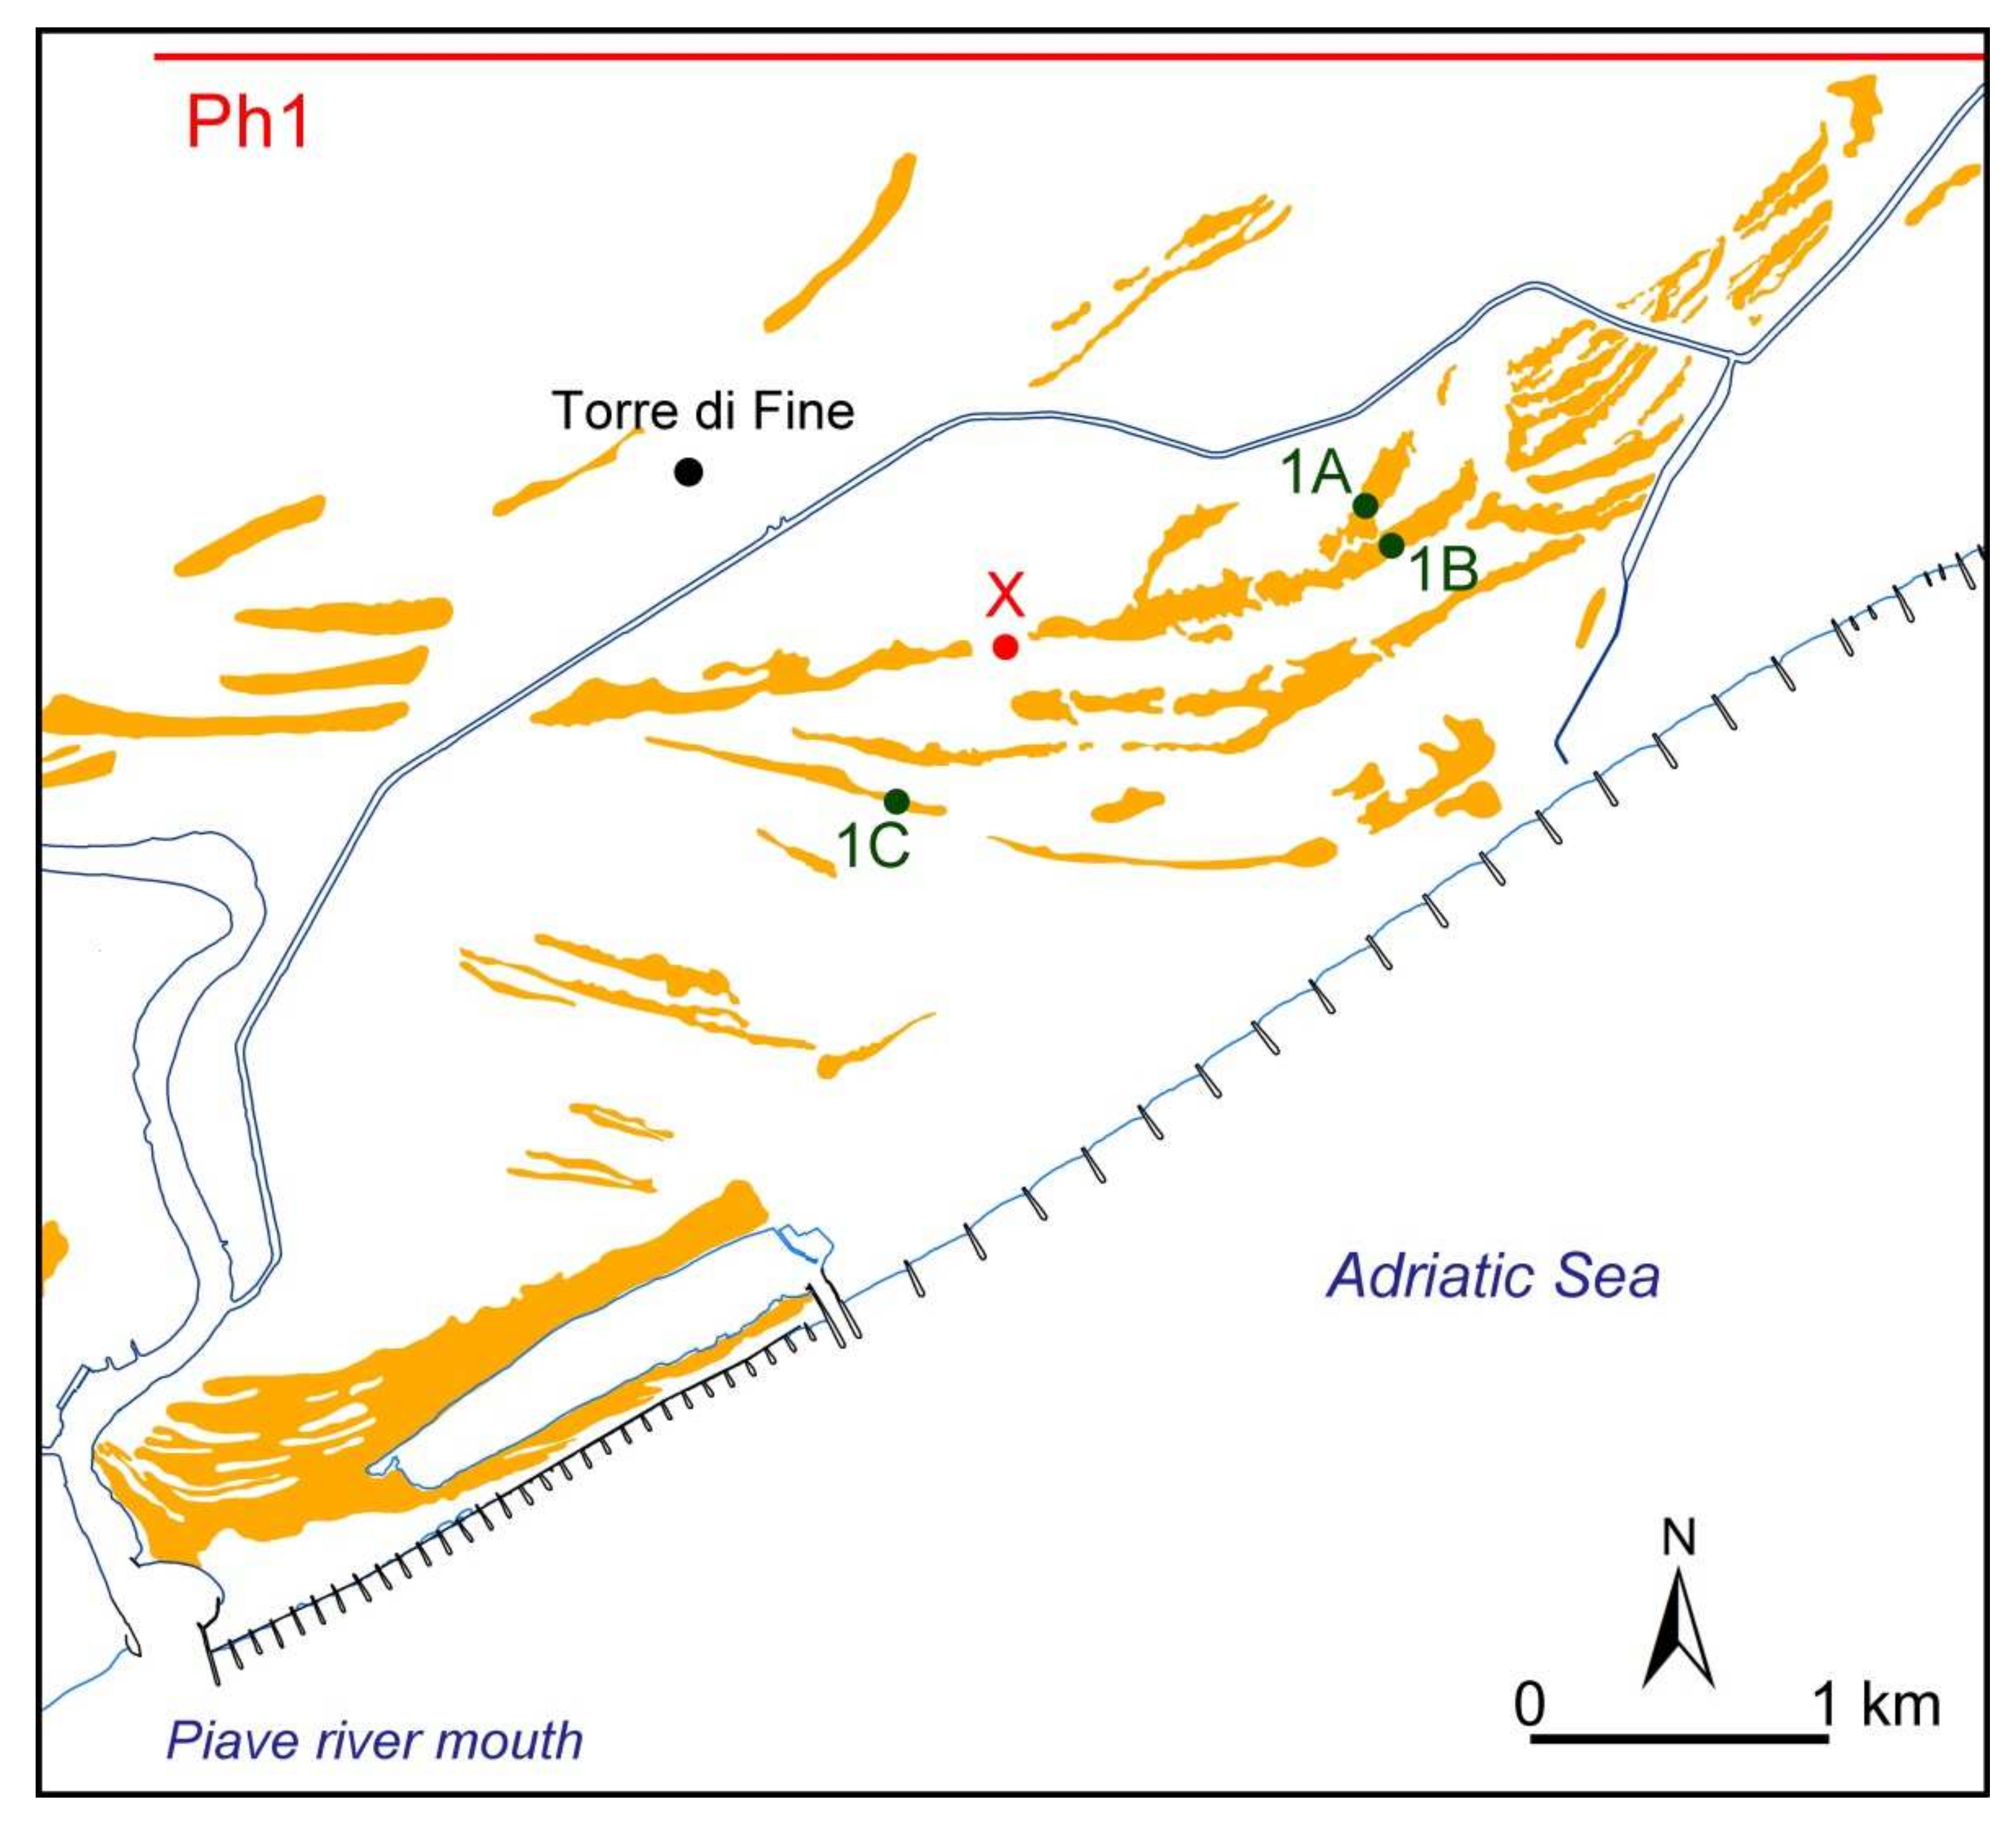
Regarding the study area, the inner alignment corresponds to the position reached by the coast when the paleo-delta recognized SE of Torre di Fine started its progradation. A sample collected from a depth of 1.83–1.95 m from ground level, close to one of the northernmost sandy ridges that form the paleo-delta, dated back to 5460 ± 60 yr BP [4,15], in agreement with the age of the clinoformal wedge (sample X in Figure 2). Mineralogical analyses of sandy samples collected from the paleo-delta deposits seem to prove it originated by an ancient watercourse belonging to the Piave river system [4,15]. Similar results have been obtained by analyzing the mineralogical composition of the sediments taken from the old sandy ridges recognized west of the Piave River, thus confirming that they were formed by ancient courses of this fluvial system, too.
Previous studies [3,4,5,15] have made it possible to identify the geomorphological features of the study area and its main stratigraphic characteristics. Nevertheless, hitherto sufficiently thorough sedimentological investigations aimed at identifying the prevailing Holocene depositional environments were not carried out. Therefore, new studies, mostly based on the analysis and interpretation of the textural characteristics of the sandy paleo-ridges and related inter-ridge areas, have been performed to achieve this goal.
The diagnostic significance of grain-size properties calculated using graphic methods [16] or moment measures [17] to provide environmental interpretations is still uncertain. Many scientists have stated that these parameters are useful to distinguish different environments, whereas others have argued that no significant relations exist (e.g., [18,19] (references therein)). However, there is a common agreement that grain-size parameters are fundamental properties that provide important information on the dynamic conditions of transport and depositional processes [20,21,22,23,24,25,26,27,28,29,30]. According to this assertion and aware of the skepticism expressed in recent times, an attempt has been made to define the sedimentary environments of the Holocene sand deposits identified in the study area through the joint interpretation of their textural parameters and geomorphological and stratigraphic observations, thus providing new insights into the evolution of the Venetian coastal plain.
2. Materials and Methods
The present study has been carried out using geomorphological investigations and grain-size analyses of the samples collected during field surveys.
First, a detailed reconstruction of the shape and distribution of the ancient sandy ridges identified on the lower Piave river coastal plain was obtained through the analysis of a number of both black and white and color aerial photographs. Indeed, in the images, these ridges appear as narrow strips that are lighter than the surrounding areas. Only the available photos showing these alignments in a more clear and well-defined way were selected for this purpose. So, images taken in 1978, 1983, 1987, 1999, 2003, 2005, and 2015 were analyzed. All the photographs were georeferenced based on known coordinates available on digital topographic maps at the 1:5000 scale (Italian National System Gauss-Boaga, Zone 2-East). During photo-interpretation, the alignments were manually digitized using a Geographic Information System mapping software (ArcGIS 10.3), thus producing the map of the sandy ridge arrangement (Figure 1).
During the subsequent field surveys, geomorphological observations and core collections were performed. Sampling sites were selected on the map showing the sandy ridge position (Figure 1, Figure 2, Figure 3, Figure 4, Figure 5 and Figure 6); they were mainly located on well-defined sandy ridges representative of the different progradation phases and were mostly aligned perpendicularly to the ridges. Moreover, some samples were collected in the inter-ridge areas to detect possible different sedimentological characteristics. For this purpose, a hand auger and soil sampling equipment for manual drilling and sampling were used. Nineteen drillings (from 1.40 m to 2.30 m deep, depending on the thickness of the sand deposits to be analyzed and on the depth of the groundwater table) were done.
A total of 72 samples were taken and analyzed (Tables S1–S5). Sediments were collected from sandy deposits lacking evidence of anthropogenic reworking. Therefore, the top deposits (mainly down to 60 cm from the ground surface, but in some cases, deeper) weree not analyzed. Moreover, two samples (S1 and S2) were collected from different sites close to the shoreline to compare ancient and present grain-size distributions (Figure 5 and Figure 6, respectively).
Before performing grain-size analysis, samples were dried and sieved to separate plant and shell fragments (mesh size: 710 μm). The quarter method was used to select about 60 g of sediments. Owing to the scarce content of organic matter, samples were not pre-treated with hydrogen peroxide. Grain-size distribution was determined by using a mechanical sieve shaker. Eight sieves (mesh sizes spaced at ½ phi interval) were used.
Then, sediments retained on each sieve were weighed, and the results were used to calculate the main mode (i.e., the most frequently occurring grain size), to detect the possible presence of secondary modes, and to draw cumulative grain-size frequency curves by plotting particle diameter against cumulative percentages on probability paper [31,32].
Grain-size parameters and graphic representations were expressed in phi (Ø) unit, i.e., a logarithmic transformation of the geometric Udden-Wentworth grain-size scale [33].
In particular, the graphical statistical parameters of Folk and Ward [16] were calculated for each sample (i.e., mean, sorting, skewness, and kurtosis) to possibly identify different ancient depositional conditions. Even if other methods of calculation exist (e.g., the moment method [17,34]), this technique was applied because it is easier to use on sediments containing up to 5% of fines [18]. The precision of the diagrams guaranteed the accuracy of the results.
3. Results
3.1. Results from Geomorphological Investigations
East of the Piave River, the paleo-delta located close to Torre di Fine has been better defined (Ph1) (Figure 2). It is characterized by evident sandy alignments, which are wider and more spaced on the western side than on the eastern one.
Thanks to the orientation of the alignments recognizable between the lower courses of the Sile and Piave rivers, four major phases of coastal progradation (Ph2 to Ph5) have been detected. Indeed, the sandy ridges representative of each phase have the same orientation, which differs from the orientations of the alignments indicative of the others. These four phases occurred after the formation of the paleo-delta near Torre di Fine.
The parallel alignments forming each group appear truncated.
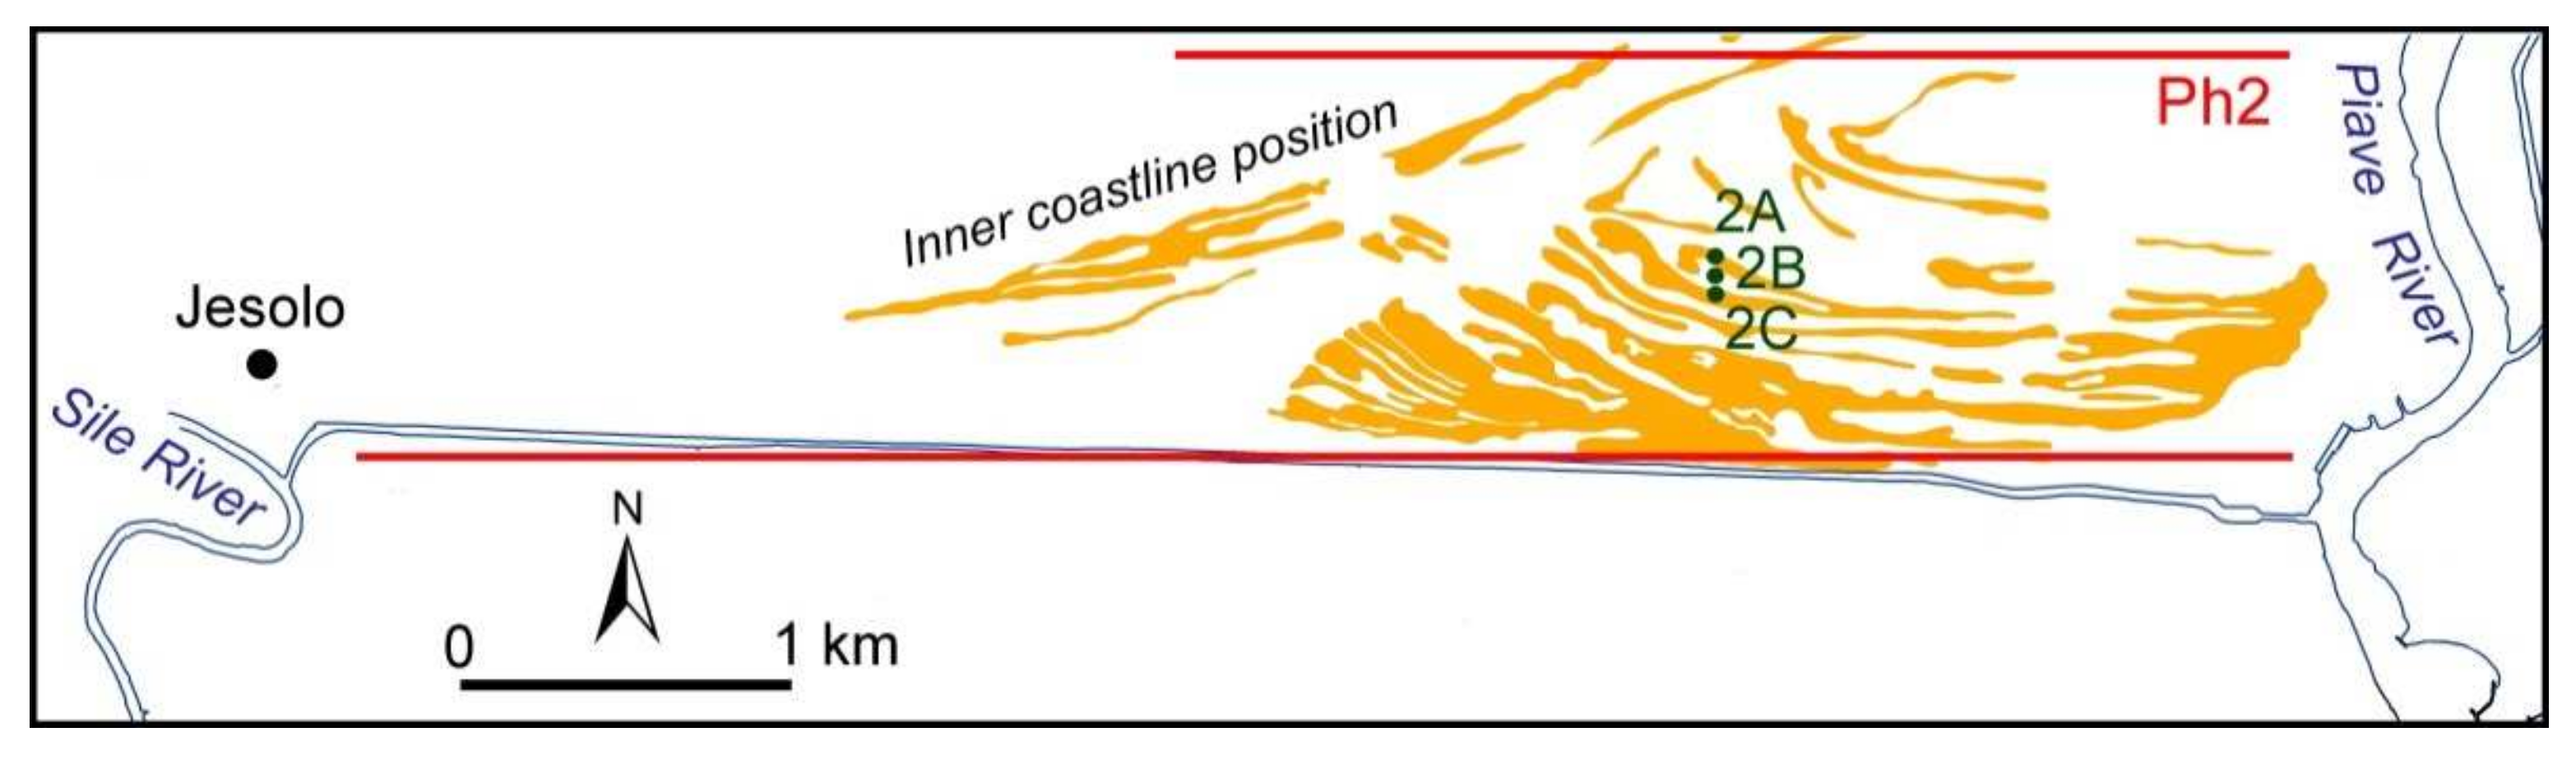
Ph2 represents the western part of a partially preserved paleo-delta, which developed SW of the previous one (Figure 3). The orientation of the ridges changes from NW–SE to W–E approaching the present Piave river course.
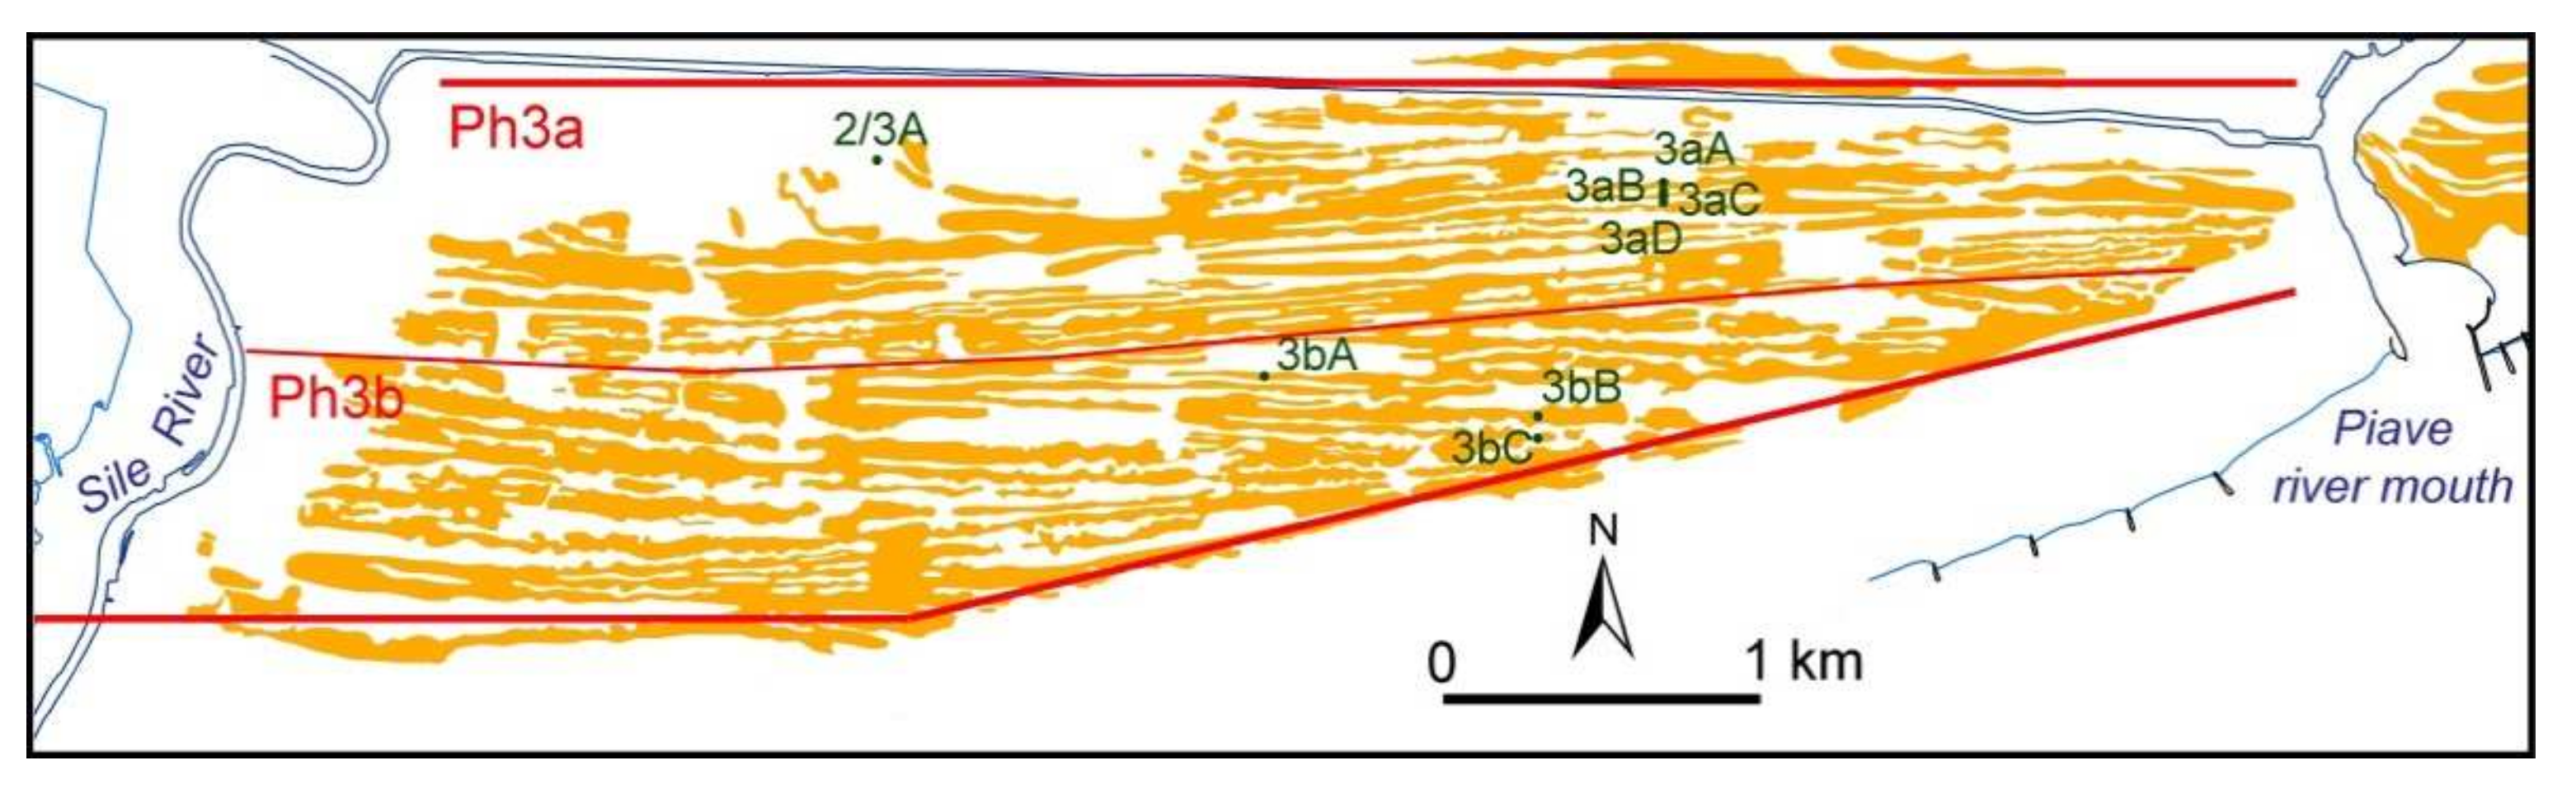
The alignments representative of Ph3 can be divided into two subgroups as their orientations are slightly different (Figure 4). In fact, in the northern sector (Ph3a), the ridges are characterized by a prevalent WSW–ENE trend, which becomes W–E approaching both the Sile and the Piave rivers, whereas southward (Ph3b) they are mainly W–E oriented and weakly rotate close to the Sile River where they display a WNW–ESE orientation.
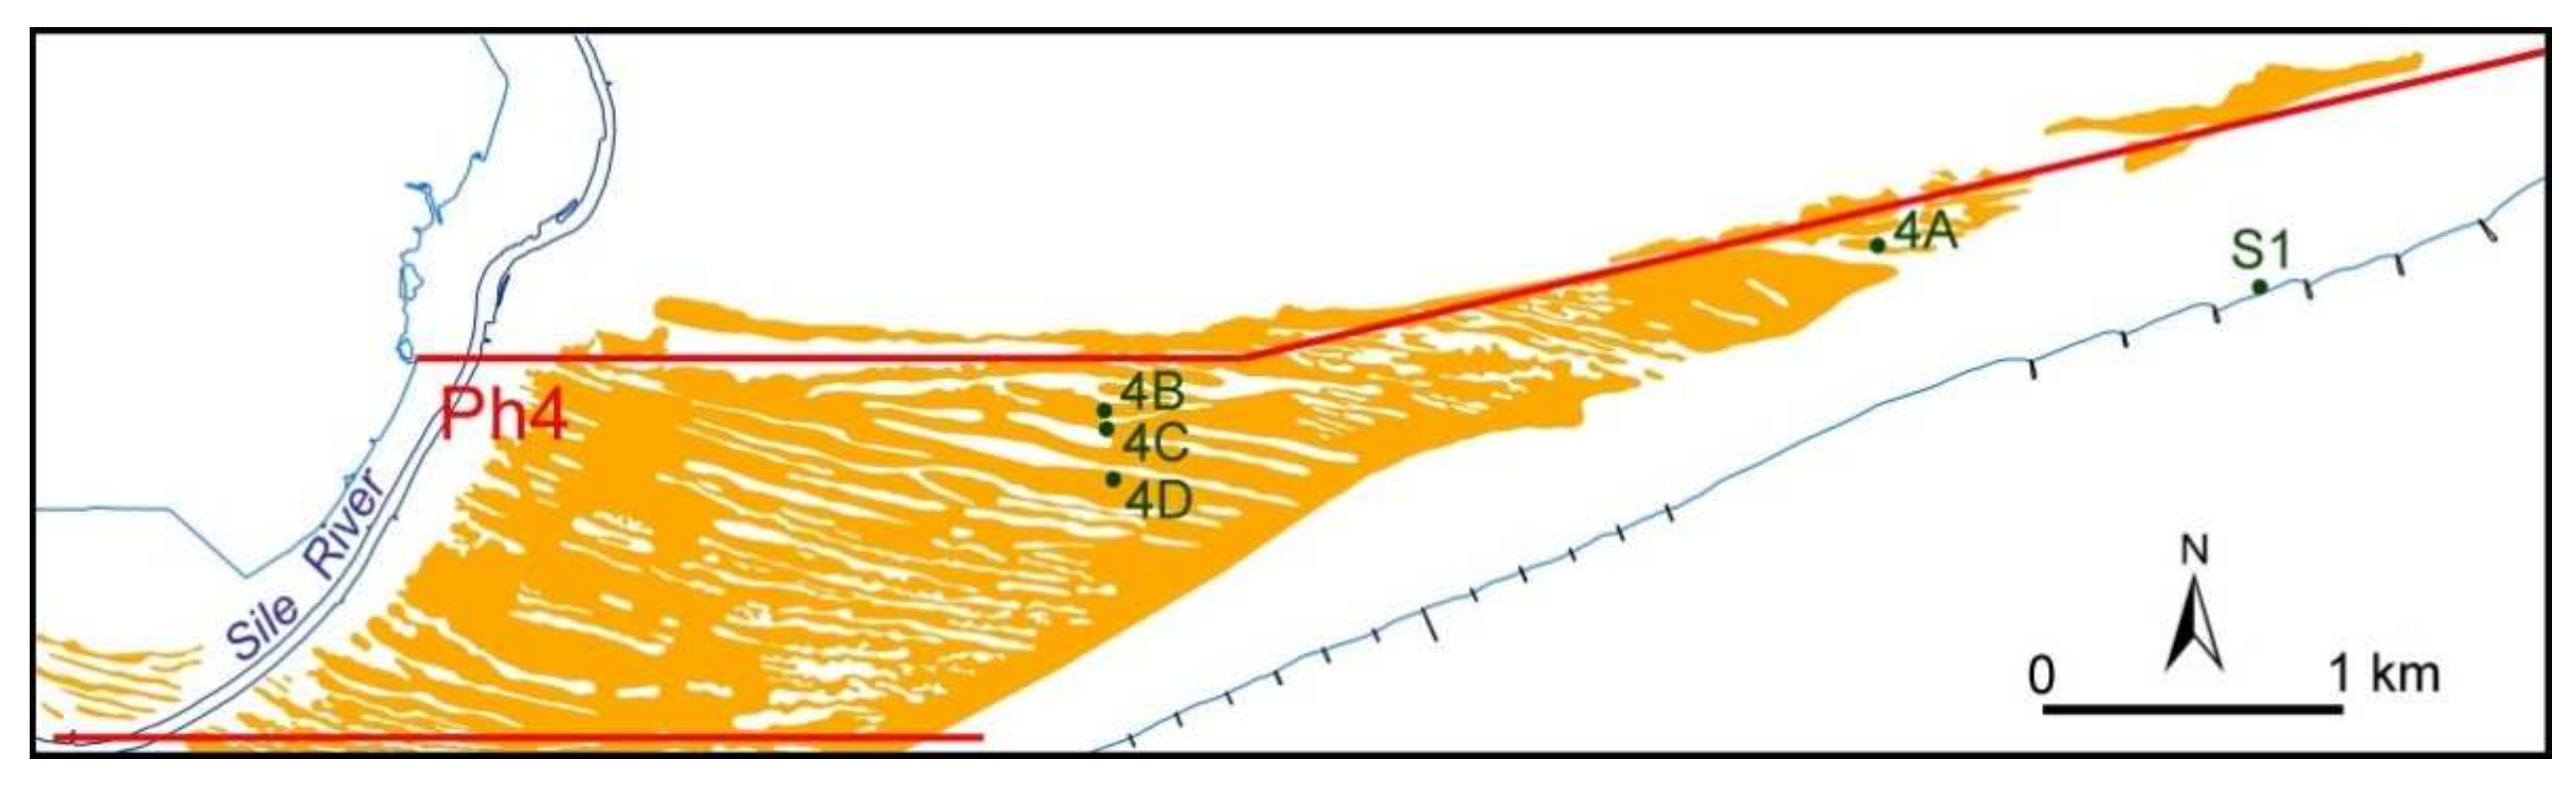
Ph4 is distinguishable from the previous one as the orientation of the related alignments is mostly NW–SE (Figure 5).
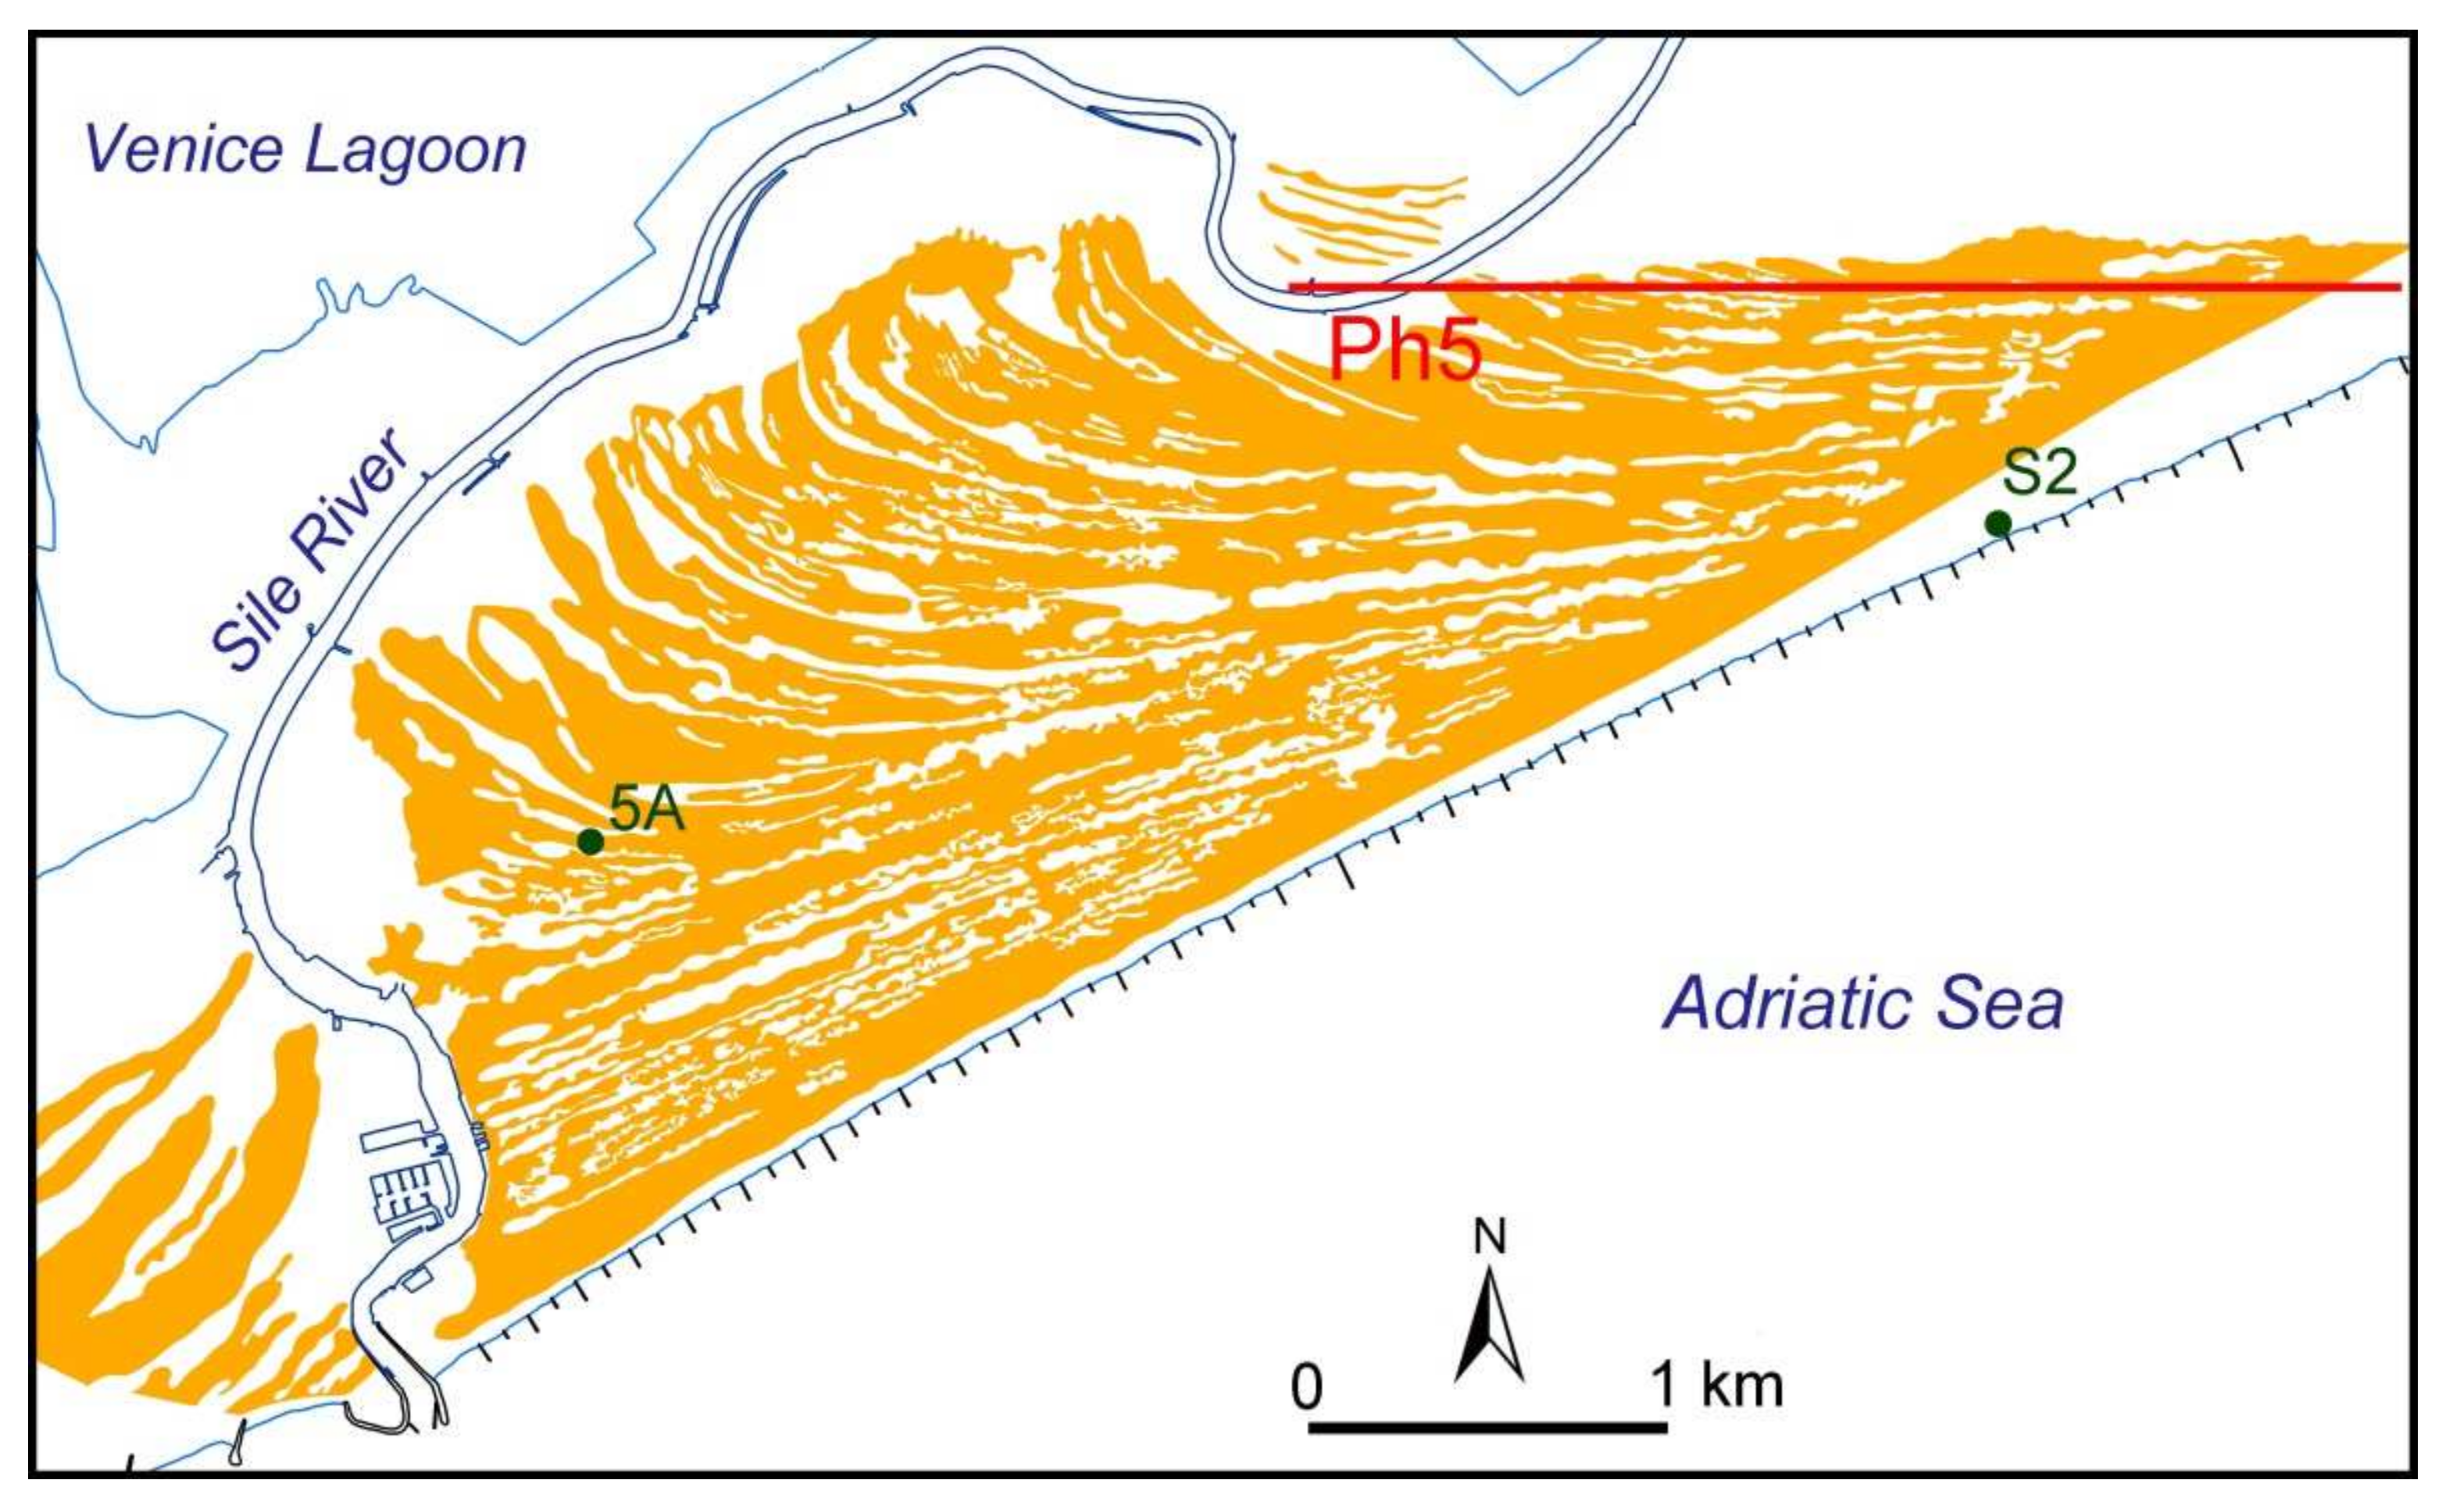
Ph5 is represented by a sequence of partially curved sandy ridges located close to the Sile river mouth (Figure 6). From NE to SW, their orientation rotates counter-clockwise until they arrange parallel to the present coastline, which is oriented SW–NE and sharply truncates the alignments that define Ph3 and Ph4. Ph5 developed while the ridges indicative of the previous progradation phases were eroding.
In aerial photographs, most of the ancient sandy ridges appear white speckled. These features can be recognized in all the available images, but their shape generally is more evident and defined in the oldest photographs. The mottles may be single- or closely-arranged crescent-shaped features or joined to form sinuous chains. In other cases, their shape is indistinct.
The presence of the old sandy ridges was also detected during field surveys carried out in winter. Indeed, when the land is not cultivated, they appear as parallel stripes characterized by alternating clear and dark tones. Very weak and wide undulations can be locally observed, too; the rising forms corresponding to the clearer tones of the land surface.
Samples collected from the relict ridges were mainly composed of fine sands and silty sands. Fragments of shells (bivalves and gastropods) of the coastal environment are frequent. Plant remains (i.e., mainly fragments of thin leaves) are locally present; however, they are generally not abundant. Coarser bioclasts or shells (more than 1 cm) are less common; in particular, fragments of Cardiidae and Veneridae were recognized.
In the inter-ridge areas, silty and clayey sediments, sometimes including organic material and bioclasts, have been detected. Sediments of a brackish environment have also been found in the coastal plain extending between the inner SW-NE paleo-coastline and the first alignment that defines the beginning of the progradation phases, both west and east of the present lower Piave river course.
As regards the oldest paleo-delta, sands collected from cores 1A and 1C contain rare fragments of shells having very small sizes (Table S1). Only in sample 1C-3 no bioclasts were found. In core 1B, bioclasts are absent down to 1.80 m, whereas from −1.80 to −1.90 m they are frequent and quite coarse; bivalve shells have also been recognized.
In the paleo-ridges representative of Ph2, fragments of shells are not always present (Table S2). In core 2A, they are absent down to 1.75 m, while some bioclasts have been found from −1.75 m to −2.00 m. In core 2B, fine sands have been recognized down to 0.85 m and from −1.5 to −2.10 m. In contrast, clayey silt and silty clay, locally containing very small fragments of shells (size ≤ 1 mm) and organic matter, have been collected from −0.85 to −1.5 m; regarding the sandy deposits, fragments of shells are present only below −1.85 m. In core 2C, sandy sediments have been detected down to 0.80 m, lying over a silty clayey layer from −0.80 m to 1.05 m deep; very scarce fragments of shells have been found only from −1.60 m to −1.70 m and from −2.20 m to −2.30 m.
The transition from system 2 (Ph2) to system 3 (Ph3) is represented by the core 2/3A, which has shown the presence of clay down to −0.85 m and sand from −0.85 m to −2.00 m. Fragments of shells are always present (Table S2); their size increases with depth, from less than 1 mm (upper layers) to about 1 cm (1.80–2.00 m below ground surface).
In all, four cores 1.80 m deep have been selected to analyze the characteristics of Ph3a (Table S3). In cores 3aA and 3aC, characterized by sands, bioclasts are absent. In core 3aB, sands are present only from the ground surface to −0.50 m and from −0.80 m to −1.80 m, whereas clayey silt and peat were detected from −0.50 m to −0.65 m and from −0.65 m to −0.80 m, respectively. Sands do not contain bioclasts, while fragments of gastropods are common in the silty and organic layers. In core 3aD, sandy silt and organic clay characterized by very small bioclasts have been observed from the ground surface to −0.80 m; on the contrary, samples collected from −0.80 m to −1.80 m are composed of sands that locally contain few fragments of shells.
Sediments taken from the cores representative of Ph3b (3bA, 3bB, and 3bC) are all characterized by sands, but their shell content is different (Table S3). In particular, in 3bA, bioclasts are scarce down to −0.60 m and from −1.20 m to −1.80 m (their size increases with depth) and absent from −0.60 m to −1.20 m. In 3bB, no fragments of shells were detected, whereas, in 3bC, they are present only from about −0.60 m to the bottom of the core: they are very scarce and small down to −1.10 m, more frequent and coarser from −1.10 m to −1.20 m (up to 1 cm in size), and very abundant, but characterized by smaller size (about 1 mm), from −1.20 m to −1.40 m.
Sandy sediments were also collected from all the cores representative of Ph4 (Table S4). In 4A, bioclasts are present from −1.30 m to −1.90 m; in particular, they are more abundant and coarse from −1.70 m to −1.90 m. In 4B, they are quite frequent from −0.60 m to the bottom of the core, whereas in 4C they have been detected from −0.90 m to −1.70 m, their abundance increasing with depth. In 4D, fragments of shells are present below 0.80 m from the ground surface; they are not abundant and have variable sizes, generally between 0.5 and 3 mm.
Core 5A, selected to investigate the characteristics of Ph5, is composed of sands containing rare millimeter-sized fragments of shells from −1.00 m to the bottom of the core (Table S5).
The samples collected from the present beach face consist of sands in which some bioclasts having a size of less than 3 mm are present.
3.2. Results from Grain-Size Analysis
3.2.1. Grain Size
The mean of the collected sediments mainly ranges from 2.24 Ø (1B-4) and 2.82 Ø (2A-1) (Tables S6–S10), so they are classified as fine sands. These values are fully compatible with the grain size of the present foreshore sediments (2.54 Ø in S1 and 2.67 Ø in S2). Only 2B-1 is composed of very fine sands (3.89 Ø). Most of the samples are unimodal (primary mode in the 2.0–2.5 Ø or 2.5–3.0 Ø interval, except for 2B-1, which has its primary mode in the 3.5–4.0 Ø interval), whereas the others are bimodal (secondary mode in the 4.0–4.5 Ø interval).
Small variations in grain size occur both with increasing depth and by comparing samples collected from different ridges. They are more evident in sediments collected from the older paleo-delta (Ph1) and system 2 (Ph2).
As regards system 1 (Ph1), sands from the 1C site, located on a more recent paleo-ridge, are finer; grain size generally decreases with increasing depth, contrary to sediments from 1B. In 1A, grain size fluctuates down to 1.30 m and increases in the lower layers.
Concerning system 2 (Ph2), in 2A and 2B, grain size increases with increasing depth, whereas in 2C the opposite trend has been observed.
The grain size of the sediments collected from the core 2/3A increases with depth.
Very small variations in grain size have been detected in the samples belonging to system 3a (Ph3a). Moreover, sediments collected from core 3aD have the same grain size.
In system 3b (Ph3b), grain size ranges from 2.49 Ø to 2.74 Ø. It decreases with depth in 3bA sands, whereas it tends to increase in the sediments of the other two cores of the same system.
In system 4 (Ph4), grain-size variations are very small.
In core 5A, representative of system 5 (Ph5), grain size does not significantly vary with depth except for the upper sample, which is coarser than the others.
3.2.2. Sorting
The distribution of grain size ranges from moderately sorted (the highest value is 0.75 in 2A-1) to very well sorted (the lowest value is 0.26 in 3aC-3) (Tables S6–S10). Variations have been observed by comparing the results obtained from the analysis of samples collected from different depths at various sites.
The best-sorted sands have been detected in Ph3a, whereas the sorting of sediments from the other systems is quite variable, particularly those from Ph3b and Ph4. In system 5, sorting decreases with increasing depth, whereas samples from the other systems often display a generally increasing trend. Sorting does not vary in samples collected from cores 2C (well sorted), 3aC (very well sorted), and 4C (moderately well sorted), whereas small fluctuations occur in Ph1 sediments (moderately well sorted/well sorted).
S1 and S2 are well sorted.
3.2.3. Skewness
Skewness significantly varies. In the samples collected from the sandy ridges, it ranges from −0.16 in 4A-6 (negative skewed) to 0.46 in 4D-1 (very positive skewed) (Tables S6–S10). However, positive values are prevailing.
Negatively skewed sediments are mainly deep and have been found at the bottom of the core.
In system 1, increasing and decreasing trends alternate. Most of the samples are very positively skewed. The only negative value was detected at the bottom of core 1B.
In system 2, the three cores display different trends that vary with depth: indeed, skewness decreases in 2A, increases in 2B, and fluctuates from positive to negative values in 2C. Negative values approaching zero characterize the sediments collected from the 2/3A site.
In all the cores representative of system 3a, skewness always decreases with depth and ranges from very positive skewed to negative skewed.
Variability characterizes sediments from system 3b. In core 3bA, skewness fluctuates from positive to near symmetrical without defining a particular trend; in 3bC, it decreases with depth (from positive skewed to near symmetrical), whereas 3bB sediments are fine-skewed except for the upper sample that is near symmetrical.
Skewness also varies in cores belonging to system 4 (from very positive skewed in sample 4D–1 to negatively skewed in 4A–6). Moreover, it decreases with increasing depth in 4D, and from about −1.00 m to the bottom in core 4A.
In system 5, skewness is always very positive.
S1 and S2 samples are negatively skewed.
3.2.4. Kurtosis
Sandy sediments from the old ridges display kurtosis values that range from 0.92 (mesokurtic) in sample 2B-1 to 4.31 (extremely leptokurtic) in 1A-2 (Tables S6–S10).
Most of the samples from system 1 are very leptokurtic except for 1A-2 and 1A-3 sediments, which are extremely leptokurtic, and 1B-4 mesokurtic sands. On the whole, some fluctuations were observed.
In system 2, alternating leptokurtic to very leptokurtic values frequently occur. Only 2B-1 sediments are mesokurtic.
In core 2/3A, kurtosis decreases with depth, from highly leptokurtic to leptokurtic.
In the samples collected from system 3a, kurtosis varies. The higher value was measured in 3aA-2, whereas the lower ones were calculated in sample 3aA-4, and in most of the core 3aC (only the shallowest sediments are very leptokurtic).
In system 3b, different trends were observed: 3bA sediments are leptokurtic (except for the upper sample that is very leptokurtic), 3bB sands are very leptokurtic, whereas, in 3bC, kurtosis decreases with depth from very leptokurtic to mesokurtic.
In system 4, kurtosis ranges from leptokurtic to extremely leptokurtic; however, most of the samples are very leptokurtic.
In system 5, sediments are very leptokurtic.
Finally, sediments S1 and S2 are platykurtic.
4. Discussion
New investigations have made it possible to better define the textural and paleoenvironmental characteristics of the sandy ridges that testify to the Holocene progradation and retrogradation of the lower Piave river coastal plain. Each stage of coastal progradation is documented by a group of parallel alignments that appear truncated, thus indicating that the coast experienced erosion before the occurrence of a new progradation step.
The white mottles frequently observed on the ancient ridges during photographic interpretation have been interpreted as possible evidence of aeolian deposits as they have the same characteristics as those identified in the alluvial plain of the Adige River (Italy) and previously described by Rizzetto et al. [35] and Rizzetto [4].
4.1. The First Progradation Phase (Ph1)
The most ancient paleo-delta, representative of the first recognized progradation phase (Ph1), underwent periods of more rapid growth during its later stages of development, as testified by the arrangement of the sandy ridges in which older sandy barriers are wider and less spaced than the southern ones (Figure 2). Moreover, cores 1A and 1B are characterized by slightly coarser sediments than those taken from a more recent narrow ridge (1C), possibly because they were collected closer to the ancient river mouth.
Sediments from all the three cores are composed of fine sands and are mainly moderately well sorted to well-sorted, positive skewed to very positive skewed, and very leptokurtic to extremely leptokurtic; in general, these conditions tend to be closely related to high-energy environments (such as foreshore), with a high degree of textural maturity and reworking [36,37,38]. In samples 1B-1, 1B-2, 1B-3, and 1C-3, the absence of bioclasts coarser than grain size could represent evidence of aeolian deposits [39]. Only sample 1B-4 (1.80–1.90 m below ground surface) differs from the others because it is negatively skewed and mesokurtic; moreover, its sediments are a little coarser and contain evident bioclasts and bivalve shells (up to 1 cm). Based on its grain-size parameters and as it is at the bottom of the core, it possibly represents the older beach deposits lying at the base of the ridge, such as those characterizing intertidal environments [37] that can also be observed in the present-day foreshore area.
4.2. The Second Progradation Phase (Ph2)
The west side of the partially preserved paleo-delta representing phase Ph2 is characterized by relatively wide and closely spaced ridges, except for the northern alignments that are narrow and more spaced (Figure 3).
Grain-size parameters of sediments collected from core 2A indicate variations in depositional conditions. In particular, grain size decreases, and skewness increases (from near symmetrical to very positive skewed) with decreasing depth. Only the deeper sample contains fragments of shells up to 5 mm in size. These variations could be the evidence of a transition from beach to dune deposits. In particular, more selective processes could have been responsible for the good sorting observed in samples 2A-3 and 2A-2 with respect to the sediments detected at the bottom of the core (sample 2A-4), whereas the increase in skewness (from near symmetrical to very positive skewed) and the decrease in mean grain size, sorting (from well-sorted to moderately sorted), and kurtosis (from very leptokurtic to leptokurtic) observed by comparing the grain-size distribution of samples 2A-2 and 2A-1 could be the result of aeolian transport and deposition of finer sediments.
Fine sands characterize 2C except for the presence of a silty clayey layer, 0.25 m thick, collected from a depth of about 0.80 m, which could be related to the position of the core, located on the subsequent alignment close to its northern margin. Consequently, these sediments could belong to the fine-grained filling deposit of the ancient inter-ridge depression located immediately north. Samples 2C-1 to 2C-4 are representative of the underlying deposits. They are characterized by well-sorted sediments having leptokurtic and unimodal distributions. Samples 2C-4 and 2C-3 are near symmetrical (negative and positive numbers, respectively), whereas 2C-2 is negatively skewed. In addition, deposits characterized by negative parameters contain small fragments of shells. These conditions could be related to quite energetic environments affected by waves [37], responsible for small variations in the proportion of different grain-size populations [40] due to winnowing action that operates intermittently [36]. Unlike the previous ones, the upper sample (2C-1) is positively skewed and not fossiliferous, thus reflecting a higher degree of textural maturity and possibly representing aeolian sediments.
On the other hand, core 2B, which was sampled in the trough between the two previously-analyzed sandy ridges, displays a partially different stratigraphic sequence, including a clayey, silty deposit about 0.65 m thick, detected from a depth of 0.85 m and containing organic matter. This layer likely represents a temporary fine-grained filling deposit of the inter-ridge swale. The two sandy samples collected from the underlying sediments exhibit different features. The deeper one (2B-2) is moderately well-sorted, very positive skewed, and very leptokurtic, and contains some fragments of shells up to 4 mm in size. These characteristics predominate in the shoreface/foreshore environments [37]. On the other hand, 2B-1 is composed of very fine sands, which are moderately sorted, near symmetrical, and mesokurtic; coarser bioclasts have not been detected. According to Reineck and Singh [41], the accumulation of the finer sands in the inter-ridge areas could result from the selective displacement action of the wind from the ridges toward the more depressed zone.
In core 2/3A, located in a relatively wide space between two ridges at the transition from system 2 to system 3, fine sands containing fragments of shells have been detected below a clayey surface layer about 0.85 m thick. According to Parrado Román and Achab [37], as the size of both grains and bioclasts, as well as sorting, decreases with decreasing depth and sediments are leptokurtic and near symmetrical, this distribution could represent a transition zone from sandy to muddy-sandy facies.
4.3. The Third Progradation Phase (Ph3)
The textural characteristics of the subsequent progradation phase (Ph3) were investigated by analyzing groups of cores having different locations: 3aA to 3aD representative of Ph3a and 3bA to 3bC representative of Ph3b (Figure 4). All the alignments are quite narrow; even if they are closely spaced, they are clearly distinguishable. Concerning Ph3a, the cores display different features, and also because 3aA and 3aC were collected from two ridges, while 3aB and 3aD are from the inter-ridge areas.
As regards core 3aA, the analyzed samples are composed of fine sands characterized by variable grain-size distribution. Bioclasts coarser than particle size are absent. Samples 3aA-5 to 3aA-3 are well to very well sorted, near-symmetrical (3aA-5, characterized by very low negative values) to negative skewed (−0.1 in 3aA-4 and 3aA-3), and leptokurtic (3aA-5 and 3aA-3) or mesokurtic (3aA-4). Moreover, 3aA-5 and 3aA-4 have a secondary mode in the 4.0–4.5 Ø interval. Based on these characteristics and Greenwood’s [42] observations, they likely represent aeolian deposits. On the other hand, the upper sediments (3aA-2 and 3aA-1) are positively skewed and display a decrease in sorting (from well to moderately well sorted) and kurtosis (from extremely to very leptokurtic) with decreasing depth; moreover, in sample 3aA–1, a secondary mode (4.0–4.5 Ø) is present. These conditions could represent the grain-size distribution of the aeolian sediments resulting from selective deposition of fines [43]; variations detected from the bottom to the top of the core could indicate modifications in the aeolian transport and accumulation processes. However, deposits might also have partially inherited their changing characteristics from the original source [18,44].
In core 3aC, the fine sands, which compose samples 3aC-4, 3aC-3, and 3aC-2, lack fragments of shells and are very well sorted and mesokurtic; 3aC-4 is negatively skewed (Sk1 equal to −0.1), whereas 3aC-3 and 3aC-2 have symmetrical size frequency curves with low negative skewness. A similar distribution has been detected by Greenwood [42] in the aeolian deposits from Barnstaple Bay (England) formed by the wind that has eroded the beach and caused fine sands to drift landward.
In core 3aB, grain-size parameters of sandy deposits underlying the clayey and peaty layers seem to indicate modifications in energy conditions, possibly related to wind action. Indeed, they are characterized by the absence of coarse bioclasts and display a slight decrease in sorting (even if it is always good) and an increase in both skewness (significant variations, from negative to positive values) and kurtosis (slighter, from leptokurtic to very leptokurtic) with decreasing depth. This trend is similar to samples 3aA-4 to 3aA-2, collected from the sandy ridge located immediately north (same depth concerning sea level). Therefore, the considerations made for 3aA deposits regarding the aeolian origin of these deposits may also be applied to these sediments.
In core 3aD, samples collected below the silty and organic clayey layers are composed of very well sorted (3aD-3 and 3aD-2) to well-sorted (3aD-1) fine sands. Their graphic mean does not vary; it is a little coarser than that measured in most of the deposits sampled during the present investigation. Moreover, some layers contain coarse fragments of shells. These characteristics, together with the increase in skewness (from symmetrical to positive sediments) and kurtosis (from leptokurtic to very leptokurtic), seem to indicate a foreshore environment where the particles were continually moved by the swash and backwash of breaking waves [42]. The local presence of bioclasts, mainly in the less deep deposits, could reflect modifications in the competency of the transporting agent.
The fine-grained organic layers detected in both cores 3aB and 3aD, containing fragments of reeds, are indicative of old marshes developed in the inter-ridge troughs.
As regards phase Ph3b, all the samples have been collected from sandy ridges. The grain-size characteristics of 3bA-6, 3bA-5, and 3bA-4 indicate energetic coastal environments affected by waves as they are symmetrical to positive skewed and leptokurtic and have unimodal distributions, with moderately- to well-sorted sediments [37,40]. Fragments of shells are generally present, but their frequency varies, and their size decreases with decreasing depth. The upper deposits are similar to those of the underlying sediments; however, they lack bioclasts coarser than grain size. Therefore, these sands could have been removed by the wind from the wave zone and then carried inland, thus preserving the main features of the original sediment distribution. On the other hand, sample 3bA-1 differs from the others because it is a little coarser, bimodal (secondary finer mode), moderately well sorted, and very leptokurtic. The presence of scarce fragments of shells up to 1.5 mm in size could indicate an increase in wind speed.
3bB sediments are a little finer than those collected from the other cores, do not contain bioclasts, are positively skewed (except for the top sample that is near symmetrical), from very well sorted (3bB-4) to moderately well sorted (3bB-3 to 3bB-1), bimodal (displaying a secondary finer mode except for the bottom sample that is unimodal), and very leptokurtic. Based on their grain-size parameters, they have been interpreted as aeolian deposits. However, changes in distribution pattern seem to reflect small variations in the competence of the wind responsible for a decrease in sorting and an increase in fines, which also leads to a near symmetrical distribution with decreasing depth.
Sediments collected from core 3bC are composed of unimodal, very well sorted to well-sorted fine sands containing scarce submillimetre bioclasts. Skewness and kurtosis increase with decreasing depth. In particular, as regards the deeper sample (3bC-3), which is a little coarser (unimodal fine sand), near symmetrical and mesokurtic, could be indicative of aeolian sediments carried inland from the beach (e.g., [42,45]) by moderately strong winds as proved by the slightly coarser grain size of the deposit and the presence of very few small fragments of shells. Unlike 3bC-3, cores 3bC-2 and 3bC-1 are positively skewed and leptokurtic to very leptokurtic, thus displaying grain-size characteristics that are more frequent in aeolian environments than the previous ones. In particular, a similar distribution due to wind-blown nourishment coming from the beach has been observed by Van der Wal [46] in the foredune sands located on the North Sea side of the Wadden island of Ameland (Netherlands). On the other hand, the presence of coarse and locally abundant fragments of shells that were detected below −1.10 m from the ground surface could indicate a beach environment. Therefore, the whole sequence of core 3bC could represent the transition from foreshore to dune deposits.
4.4. The Fourth Progradation Phase (Ph4)
The sandy ridges that define the fourth progradation phase are more closely spaced than those identified in Ph3 (Figure 5). Consequently, many of them cannot be distinguished from one another, and they appear as if they merged westward. This occurrence has been amplified by agricultural activities responsible for a reworking of the surface deposits. Therefore, to analyze the grain-size distribution of the ridges representative of the progradation phase Ph4, samples have been collected from cores located on well-defined alignments.
The northern core is 4A, placed close to the boundary between Ph3 and Ph4, defined by the presence of a sandy ridge having an east-west orientation. 4A samples are composed of leptokurtic to very leptokurtic fine sands that display quite different characteristics concerning sorting, skewness, and mode (4A-4 to 4A-1 are bimodal with a finer secondary mode, whereas the others are unimodal). The lower samples (4A-6 to 4A-4) include bioclasts whose abundance and size generally decrease with decreasing depth; their sorting is good, but skewness progressively varies from negative (4A-6) to positive values (4A-5 is near symmetrical and 4A-4 is positively skewed). In samples 4A-3 to 4A-1, fragments of shells coarser than sand size have not been detected. Skewness increases in 4A-3 (positive skewed) and decreases again with decreasing depth, thus becoming symmetrical in 4A-1. The grain-size trend identified in core 4A indicates the transition from the foreshore to the backshore environments. The characteristics of samples 4A–3 to 4A-1, together with the absence of bioclasts, could be evidence of selective aeolian processes responsible for an increase in sorting and a decrease in fine particle content with decreasing depth, also resulting in less positive skewness values.
Cores 4B and 4C display the same grain-size distribution, and their sediments have very similar characteristics, frequently observed in the foreshore environment (e.g., [36,37,38]). Indeed, they are composed of moderately well-sorted fine sands, which contain coarse fragments of shells and are positively skewed, very leptokurtic, and bimodal (finer secondary mode). The more recent deposits lying on these sands have not been sampled because of some evidence of anthropogenic sediment reworking that could have modified their original features. Consequently, no data on possible subsequent wind activity are available.
Similar to the other cores, 4D is composed of fine sands. Sorting progressively decreases (from very well sorted to moderately well sorted), and skewness increases (from near symmetrical, with negative values, to very positive skewed) with decreasing depth. In addition, 4D-3 and 4D-2 are unimodal, very leptokurtic, and contain bioclasts, which are coarser in the lower sample (4D-3). On the contrary, the top sample (4D-1) is bimodal (finer secondary mode) and extremely leptokurtic; fragments of shells are not present. Therefore, this grain-size distribution seems to be indicative of a transition from shoreface (4D-3) to backshore (4D-1). In particular, the top sample characterized by different fractions (i.e., a dominant coarse population and a subpopulation of fines) could represent a deposit that originated far from the action of waves [16,47,48]. Owing to the complete lack of coarser bioclasts and based on grain-size distribution, a possible wind action on depositional processes is not excluded. The presence of a significant amount of fines could be due to the infiltration of silt, as suggested by Mason and Folk [47].
4.5. The Fifth Progradation Phase (Ph5)
Ph5 represents the most recent progradation phase (Figure 6). Sandy ridges are wide and curved in the western sector of the study area according to the development of the Sile river meander.
Grain-size distribution has been investigated by analyzing core 5A on a ridge located east of the Sile river mouth. Three samples have been collected from this core; they are composed of fine sands that are very positively skewed and very leptokurtic. The deeper sediments (5A-3 and 5A-2) are less sorted and bimodal (finer secondary mode equal to 4.0–4.5 Ø) and contain rare millimeter-sized fragments of shells, whereas the upper sample (5A-1) is well sorted and unimodal, and lacks bioclasts. The characteristics observed in the latter are common in deposits accumulated by the wind [17,19,46,47,49] (references therein); however, to some extent, they could have also been inherited from the original source, i.e., the close wave-influenced zone that can have a very similar distribution.
5. Conclusions
In the coastal plain north-east of the Venice Lagoon, the arrangement of several ancient sandy ridges testifies to the coastal progradation that occurred over the last 6000 years and the shift of the Piave river delta caused by the migration of its course.
The remnants of the old sandy alignments have been preliminarily identified on aerial photographs and then analyzed through geomorphological and granulometric investigations. The results obtained from grain-size analyses have made it possible to detect evidence of the foreshore environment and the transition from the foreshore to the backshore in some locations (e.g., 3bC, 4A, 4D) to confirm the presence of aeolian deposits in the most of the sampled ridges, and to identify organic fine-grained filling deposits in the old inter-ridge depressions.
Sands collected from the different sites, including those taken from the present shoreline, display very similar grain sizes, thus confirming that during the Holocene sedimentary conditions have not significantly changed, except for local variations mainly depending on the different beach zones in which they accumulated, on the transporting agent, and energy conditions.
As aeolian deposits frequently developed on the upper part of the sandy ridges, at present most of them no longer exist because they have been destroyed or reworked by anthropogenic activities. Nevertheless, some of them have been recognized. Sediments that could indicate aeolian accumulation lack coarser fragments of shells but do not display the same grain-size distribution. Most are composed of well-sorted, positively skewed, and leptokurtic sands. However, some samples characterized by near-symmetrical or negative skewness and low kurtosis could have had the same origin but still reflect the original features of the source material or variations in wind energy. Moreover, in the inter-ridge areas, the deposition of finer sands without bioclasts could have resulted from the selective displacement action of the wind from the ridges toward the more depressed zone.
Therefore, the present investigation has provided new insights into the evolution of the Holocene Venetian coastal plain. New information on the different coastal depositional environments and transporting agents has been obtained through the joint interpretation of textural parameters of deposits and stratigraphic and geomorphological observations.
Supplementary Materials
The following supporting information can be downloaded at: https://www.mdpi.com/article/10.3390/w14111710/s1, Table S1: samples collected from the sandy ridges of the paleo-delta identified SE of Torre di Fine (first progradation phase, Ph1). The presence of bioclasts coarser than grain size is also indicated. Table S2: samples collected from the sandy ridges of the second progradation phase (Ph2). The presence of bioclasts coarser than grain size is also indicated. Table S3: samples collected from the sandy ridges of the third progradation phase (Ph3). The presence of bioclasts coarser than grain size is also indicated. Table S4: samples collected from the sandy ridges of the fourth progradation phase (Ph4). The presence of bioclasts coarser than grain size is also indicated. Table S5: samples collected from the sandy ridges of the fifth progradation phase (Ph5). The presence of bioclasts coarser than grain size is also indicated. Table S6: samples collected from the sandy ridges of the paleo-delta identified SE of Torre di Fine (first progradation phase, Ph1). The grain-size parameters (i.e., mean (MZ, Ø units), sorting, skewness, and kurtosis) and their classification are also indicated. Sorting (σ1): WS = well-sorted, MWS = moderately well sorted. Skewness (Sk1): VPS = very positive skewed, PS = positive skewed, NS = negative skewed. Kurtosis (Kg): EL = extremely leptokurtic, VL = very leptokurtic, M = mesokurtic. Table S7: samples collected from the sandy ridges of the second progradation phase (Ph2). The grain-size parameters (i.e., mean (MZ, Ø units), sorting, skewness, and kurtosis) and their classification are also indicated. Sorting (σ1): WS = well-sorted, MWS = moderately well sorted, MS = moderately sorted. Skewness (Sk1): VPS = very positive skewed, PS = positive skewed, nS = near-symmetrical, NS = negative skewed. Kurtosis (Kg): VL = very leptokurtic, L = leptokurtic, M = mesokurtic. Table S8: samples collected from the sandy ridges of the third progradation phase (Ph3). The grain-size parameters (i.e., mean (MZ, Ø units), sorting, skewness, and kurtosis) and their classification are also indicated. Sorting (σ1): VWS = very well sorted, WS = well-sorted, MWS = moderately well sorted. Skewness (Sk1): VPS = very positive skewed, PS = positive skewed, nS = near-symmetrical, NS = negative skewed. Kurtosis (Kg): EL = extremely leptokurtic, VL = very leptokurtic, L = leptokurtic, M = mesokurtic. Table S9: samples collected from the sandy ridges of the fourth progradation phase (Ph4). The grain-size parameters (i.e., mean (MZ, Ø units), sorting, skewness, and kurtosis) and their classification are also indicated. Sorting (σ1): VWS = very well sorted, WS = well-sorted, MWS = moderately well sorted. Skewness (Sk1): VPS = very positive skewed, PS = positive skewed, nS = near-symmetrical, NS = negative skewed. Kurtosis (Kg): EL = extremely leptokurtic, VL = very leptokurtic, L = leptokurtic. Table S10: samples collected from the sandy ridges of the fifth progradation phase (Ph5). The grain-size parameters (i.e., mean (MZ, Ø units), sorting, skewness, and kurtosis) and their classification are also indicated. Sorting (σ1): WS = well-sorted, MWS = moderately well sorted. Skewness (Sk1): VPS = very positive skewed. Kurtosis (Kg): VL = very leptokurtic.
Funding
This research was partially funded by the Flagship Project RITMARE—The Italian Research for the Sea—coordinated by the Italian National Research Council and funded by the Italian Ministry of Education, University, and Research within the National Research Program 2011–2013. The study has been subsequently deepened in the frame of the CNR Activity “Analysis of aerial photographs and satellite images for investigating the morphological evolution of river deltas”.
Data Availability Statement
Some aerial photographs used to identify the ancient sandy ridges are courtesy of the Aerofototeca del GeoPortale della Regione Veneto (https://idt2.regione.veneto.it/portfolio/aereofototeca/) (Regione del Veneto—L.R. n. 28/76—Formazione della Carta Tecnica Regionale) (last access: 29 March 2021).
Conflicts of Interest
The author declares no conflict of interest. The funders had no role in the design of the study; in the collection, analyses, or interpretation of data; in the writing of the manuscript; or in the decision to publish the results.
References
- Bondesan, A.; Furlanetto, P. Artificial fluvial diversions in the mainland of the Lagoon of Venice during the 16th and 17th centuries inferred by historical cartography analysis. Géomorphologie Relief Processus Environ. 2012, 2, 175–200. [Google Scholar] [CrossRef] [Green Version]
- Furlanetto, P.; Bondesan, A. Geomorphological evolution of the plain between the Livenza and Piave Rivers in the sixteenth and seventeenth centuries inferred by historical maps analysis (Mainland of Venice, Northeastern Italy). J. Maps 2015, 11, 261–266. [Google Scholar] [CrossRef] [Green Version]
- Castiglioni, G.B.; Favero, V. Linee di Costa Antiche ai Margini Orientali della Laguna di Venezia e ai lati della Foce Attuale del Piave. Ist. Ven. SS. LL. AA. Rapporti Studi 1987, 10, 17–30. [Google Scholar]
- Rizzetto, F. Gli Antichi Cordoni Litoranei e le Paleodune del Veneto Nord-Orientale. Ph.D. Thesis, University of Padua, Padua, Italy, 2000. Unpublished. [Google Scholar]
- Bondesan, A.; Meneghel, M. (Eds.) Geomorfologia Della Provincia di Venezia. Note Illustrative Della Carta Geomorfologica Della Provincia di Venezia; Esedra Editrice: Padua, Italy, 2004; pp. 1–516. [Google Scholar]
- Correggiari, A.; Roveri, M.; Trincardi, F. Late Pleistocene and Holocene evolution of the north Adriatic Sea. Il Quat. 1996, 9, 697–704. [Google Scholar]
- Canali, G.; Capraro, L.; Donnici, S.; Rizzetto, F.; Serandrei-Barbero, R.; Tosi, L. Vegetational and environmental changes in the eastern Venetian coastal plain (Northern Italy) over the past 80,000 years. Palaeogeogr. Palaeoclimatol. Palaeoecol. 2007, 253, 300–316. [Google Scholar] [CrossRef]
- Tosi, L.; Rizzetto, F.; Bonardi, M.; Donnici, S.; Serandrei Barbero, R.; Toffoletto, F. Note Illustrative Della Carta Geologica d’Italia Alla Scala 1:50.000; 128—Venezia; APAT—Dipartimento Difesa del Suolo—Servizio Geologico d’Italia, Casa Editrice SystemCart: Roma, Italy, 2007; pp. 1–164. [Google Scholar]
- Antonioli, F.; Ferranti, L.; Fontana, A.; Amorosi, A.; Bondesan, A.; Braitenberg, C.; Dutton, A.; Fontolan, G.; Furlani, S.; Lambeck, K.; et al. Holocene relative sea-level changes and vertical movements along the Italian and Istrian coastlines. Quat. Int. 2009, 206, 102–133. [Google Scholar] [CrossRef]
- Favero, V.; Serandrei Barbero, R. Oscillazioni del livello del mare ed evoluzione paleoambientale della laguna di Venezia nell’area compresa tra Torcello ed il margine lagunare. Lav. Soc. Veneziana Sci. Nat. 1983, 8, 83–102. [Google Scholar]
- Zecchin, M.; Baradello, L.; Brancolini, G.; Donda, F.; Rizzetto, F.; Tosi, L. Sequence stratigraphy based on high-resolution seismic profiles in the late Pleistocene and Holocene deposits of the Venice area. Mar. Geol. 2008, 253, 185–198. [Google Scholar] [CrossRef]
- Cattaneo, A.; Correggiari, A.; Langone, L.; Trincardi, F. The late-Holocene Gargano subaqueous delta, Adriatic shelf: Sediment pathways and supply fluctuations. Mar. Geol. 2003, 193, 61–91. [Google Scholar] [CrossRef]
- Cattaneo, A.; Trincardi, F.; Langone, L.; Asioli, A.; Puig, P. Clinoform generation on Mediterranean margins. Oceanography 2004, 17, 105–117. [Google Scholar] [CrossRef]
- Niedoroda, A.W.; Reed, C.W.; Das, H.; Fagherazzi, S.; Donoghue, J.F.; Cattaneo, A. Analyses of a large-scale depositional clinoformal wedge along the Italian Adriatic coast. Mar. Geol. 2005, 222–223, 179–192. [Google Scholar] [CrossRef]
- Bondesan, A.; Calderoni, G.; Rizzetto, F. Geomorphologic evolution of the lower Piave River coastal plain during the Holocene. In Proceedings of the Risposta dei Processi Geomorfologici alle Variazioni Ambientali, MURST, Bologna, Italy, 10–11 February 2000; Biancotti, A., Motta, M., Eds.; Glauco Brigati: Genova, Italy, 2003; pp. 125–133. [Google Scholar]
- Folk, R.L.; Ward, W.C. Brazos river bar: A study in the significance of grain size parameters. J. Sediment. Petrol. 1957, 27, 3–26. [Google Scholar] [CrossRef]
- Friedman, G.M. Distinction between dune, beach, and river sands from their textural characteristics. J. Sediment. Petrol. 1961, 31, 514–529. [Google Scholar]
- Pye, K. Negatively skewed aeolian sands from a humid tropical coastal dunefield, northern Australia. Sediment. Geol. 1982, 31, 249–266. [Google Scholar] [CrossRef]
- Martins, L.R. Recent Sediments and Grain-Size Analysis. Gravel 2003, 1, 90–105. [Google Scholar]
- McManus, J. Grain size determination and interpretation. In Techniques in Sedimentology; Tucker, M., Ed.; Blackwell Scientific Publications: Oxford, UK, 1988; pp. 63–85. [Google Scholar]
- McCave, I.N.; Syvitski, J.P.M. Principles and methods of particle size analysis. In Principles, Methods, and Applications of Particle Size Analysis; Syvitski, J.P.M., Ed.; Cambridge University Press: New York, NY, USA, 1991; pp. 3–21. [Google Scholar]
- Rajganapathi, V.C.; Jitheshkumar, N.; Sundararajan, M.; Bhat, K.H.; Velusamy, S. Grain size analysis and characterization of sedimentary environment along Thiruchendur coast, Tamilnadu, India. Arab. J. Geosci. 2013, 6, 4717–4728. [Google Scholar] [CrossRef]
- Baiyegunhi, C.; Liu, K.; Gwavava, O. Grain size statistics and depositional pattern of the Ecca Group sandstones, Karoo Supergroup in the Eastern Cape Province, South Africa. Open Geosci. 2017, 9, 554–576. [Google Scholar] [CrossRef]
- Deepthi, K.; Natesan, U.; Muthulakshmi, A.L.; Ferrer, V.A.; Narasimhan, S.V.; Venugopalan, V.P. Grain Size Analysis for Elucidation of Depositional Environment of Kalpakkam, India. Environ. Process. 2018, 5, 183–199. [Google Scholar] [CrossRef]
- Baiyegunhi, T.L.; Liu, K.; Gwavava, O.; Baiyegunhi, C. Textural characteristics, mode of transportation and depositional environment of the Cretaceous sandstone in the Bredasdorp Basin, off the south coast of South Africa: Evidence from grain size analysis. Open Geosci. 2020, 12, 1512–1532. [Google Scholar] [CrossRef]
- Liang, J.; Liu, J.; Xu, G.; Chen, B. Grain-size characteristics and net transport patterns of surficial sediments in the Zhejiang nearshore area, East China Sea. Oceanologia 2020, 62, 12–22. [Google Scholar] [CrossRef]
- Wang, C.; Chen, M.; Qi, H.; Intasen, W.; Kanchanapant, A. Grain-Size Distribution of Surface Sediments in the Chanthaburi Coast, Thailand and Implications for the Sedimentary Dynamic Environment. J. Mar. Sci. Eng. 2020, 8, 242. [Google Scholar] [CrossRef] [Green Version]
- Shetty, A.; Jayappa, K.S. Proxies for sediment transport patterns and environmental characteristics: A case study of Karnataka coast, India. J. Sediment. Environ. 2021, 6, 107–120. [Google Scholar] [CrossRef]
- Wided, S.; Jalila, S.; Kamel, R. Grain size analysis and characterization of sedimentary environment along the Bizerte Coast, N-E of Tunisia. J. Afr. Earth Sci. 2021, 184, 104353. [Google Scholar] [CrossRef]
- Wang, S.; Pan, C.; Xie, D.; Xu, M.; Yan, Y.; Li, X. Grain size characteristics of surface sediment and its response to the dynamic sedimentary environment in Qiantang Estuary, China. Int. J. Sediment. Res. 2022, 37, 457–468. [Google Scholar] [CrossRef]
- Folk, R.L. A review of grain-size parameters. Sedimentology 1966, 6, 73–93. [Google Scholar] [CrossRef]
- Krumbein, W.C.; Pettijohn, F.J. Manual of Sediment. Petrography; Appleton Century Crofts: New York, NY, USA, 1938; pp. 1–549. [Google Scholar]
- Krumbein, W.C. Size frequency distributions of sediments. J. Sediment. Petrol. 1934, 4, 65–77. [Google Scholar] [CrossRef]
- Friedman, G.M. Comparison of moment measures for sieving and thin-section data in sedimentary petrological studies. J. Sediment. Petrol. 1962, 32, 15–25. [Google Scholar]
- Rizzetto, F.; Mycielska-Dowgiallo, E.; Castiglioni, G.B. Some aeolian features in the Po Plain near Este (North Italy). Geogr. Fis. Dinam. Quat. 1998, 21, 245–253. [Google Scholar]
- Duane, D. Significance of skewness in recent sediments, Western Pamlico Sound, North Carolina. J. Sediment. Petrol. 1964, 34, 864–874. [Google Scholar]
- Parrado Román, J.M.; Achab, M. Grain-size trends associated with sediment transport patterns in Cadiz Bay (southwest Iberian Peninsula). Bol. Inst. Esp. Oceanogr. 1999, 15, 269–282. [Google Scholar]
- Ubeid, K.F. Sand Characteristics and Beach Profiles of the Coast of Gaza Strip, Palestine. Ser. Correlación Geológica Temas Correlación Geológica II 2011, 27, 125–136. [Google Scholar]
- Brambati, A. Il ripascimento artificiale di spiagge in erosione nell’Adriatico settentrionale. Rass. Tec. Friuli Venezia Giulia 1971, 1, 3–14. [Google Scholar]
- Martins, L.R.; Barboza, E.G. Sand-Gravel Marine Deposits and Grain-Size Properties. Gravel 2005, 3, 59–70. [Google Scholar]
- Reineck, H.E.; Singh, I.B. Depositional Sedimentary Environments; Springer: Berlin, Germany, 1973; pp. 1–440. [Google Scholar]
- Greenwood, B. Sediment parameters and environment discrimination: An application of multivariate statistics. Can. J. Earth Sci. 1969, 6, 1347–1358. [Google Scholar] [CrossRef]
- McLaren, P. An interpretation of trends in grain size measures. J. Sediment. Petrol. 1981, 51, 611–624. [Google Scholar]
- Andrews, P.B.; van der Lingen, G.J. Environmentally significant sedimentologic characteristics of beach sands. N. Z. J. Geol. Geophys. 1969, 12, 119–137. [Google Scholar] [CrossRef]
- Hellemaa, P. The development of coastal dunes and their vegetation in Finland. Fennia-Int. J. Geog. 1998, 176, 111–221. [Google Scholar]
- Van der Wal, D. Grain-Size-Selective Aeolian Sand Transport on a Nourished Beach. J. Coast. Res. 2000, 16, 896–908. [Google Scholar]
- Mason, C.C.; Folk, R.L. Differentiation of beach, dune, and aeolian flat environment by size analysis, Mustang Island, Texas. J. Sediment. Petrol. 1958, 28, 211–226. [Google Scholar]
- Elsherif, E.A.; Badawi, A.; Abdelkader, T. Grain size distribution and environmental implications of Rosetta beach, Mediterranean Sea coast, Egypt. Egypt. J. Aquat. Biol. Fish. 2020, 24, 349–370. [Google Scholar] [CrossRef] [Green Version]
- Hails, J.R. Significance of textural parameters for distinguishing sedimentary environments in New South Wales. J. Sediment. Petrol. 1967, 37, 1059–1069. [Google Scholar]
Figure 1.
Location of the study area and arrangement of the ancient sandy ridges (orange strips) recognized in aerial photographs. The main progradation phases (Ph1 to Ph5) are separated by red lines. Rectangles A, B, C, D, and E indicate the locations of Figure 2, Figure 3, Figure 4, Figure 5 and Figure 6.

Figure 2.
Evidence of the paleo-delta recognized SE of Torre di Fine (rectangle A in Figure 1) (first progradation phase, Ph1). The green dots indicate core locations, whereas the red dot shows the position of the radiocarbon dating (5460 ± 60 yr BP).
Figure 2.
Evidence of the paleo-delta recognized SE of Torre di Fine (rectangle A in Figure 1) (first progradation phase, Ph1). The green dots indicate core locations, whereas the red dot shows the position of the radiocarbon dating (5460 ± 60 yr BP).

Figure 3.
Arrangement of the ancient sandy ridges that define the second progradation phase (Ph2) (rectangle B in Figure 1). The green dots indicate core locations.
Figure 3.
Arrangement of the ancient sandy ridges that define the second progradation phase (Ph2) (rectangle B in Figure 1). The green dots indicate core locations.

Figure 4.
Arrangement of the ancient sandy ridges that define the third progradation phase (Ph3) (rectangle C in Figure 1). Ph3a and Ph3b are two subgroups of Ph3. The green dots indicate core locations.
Figure 4.
Arrangement of the ancient sandy ridges that define the third progradation phase (Ph3) (rectangle C in Figure 1). Ph3a and Ph3b are two subgroups of Ph3. The green dots indicate core locations.

Figure 5.
Arrangement of the ancient sandy ridges that define the fourth progradation phase (Ph4) (rectangle D in Figure 1). The green dots indicate core locations. S1 is a sample collected close to the shoreline.
Figure 5.
Arrangement of the ancient sandy ridges that define the fourth progradation phase (Ph4) (rectangle D in Figure 1). The green dots indicate core locations. S1 is a sample collected close to the shoreline.

Figure 6.
Arrangement of the ancient sandy ridges that define the fifth progradation phase (Ph5) (rectangle E in Figure 1). The green dots indicate core locations. S2 is a sample collected close to the shoreline.
Figure 6.
Arrangement of the ancient sandy ridges that define the fifth progradation phase (Ph5) (rectangle E in Figure 1). The green dots indicate core locations. S2 is a sample collected close to the shoreline.

Publisher’s Note: MDPI stays neutral with regard to jurisdictional claims in published maps and institutional affiliations. |
© 2022 by the author. Licensee MDPI, Basel, Switzerland. This article is an open access article distributed under the terms and conditions of the Creative Commons Attribution (CC BY) license (https://creativecommons.org/licenses/by/4.0/).
Share and Cite
MDPI and ACS Style
Rizzetto, F. Textural Characteristics of the Holocene Sandy Ridges in the Eastern Venetian Coastal Plain (North Adriatic Sea, Italy). Water 2022, 14, 1710. https://doi.org/10.3390/w14111710
AMA Style
Rizzetto F. Textural Characteristics of the Holocene Sandy Ridges in the Eastern Venetian Coastal Plain (North Adriatic Sea, Italy). Water. 2022; 14(11):1710. https://doi.org/10.3390/w14111710
Chicago/Turabian StyleRizzetto, Federica. 2022. "Textural Characteristics of the Holocene Sandy Ridges in the Eastern Venetian Coastal Plain (North Adriatic Sea, Italy)" Water 14, no. 11: 1710. https://doi.org/10.3390/w14111710
Note that from the first issue of 2016, this journal uses article numbers instead of page numbers. See further details here.