Article

Assessment of Total Petroleum Hydrocarbon Contamination of the Red Sea with Endemic Fish from Jeddah (Saudi Arabia) as Bioindicator of Aquatic Environmental Pollution

Department of Environmental Sciences, Faculty of Meteorology, Environment and Arid Land Agriculture, King Abdulaziz University, Jeddah 21589, Saudi Arabia
*
Authors to whom correspondence should be addressed.
Water 2022, 14(11), 1706; https://doi.org/10.3390/w14111706
Submission received: 15 April 2022 / Revised: 13 May 2022 / Accepted: 24 May 2022 / Published: 26 May 2022
(This article belongs to the Section Biodiversity and Functionality of Aquatic Ecosystems)

Abstract

:
The aim of this study was to determine whether endemic coral fish commonly consumed by Jeddah residents could serve as bioindicators of oil contamination. In addition, we planned to investigate the relationship between amino acid changes and hydrocarbon concentrations in fish tissue. The composition of amino acids was analyzed using high-pressure liquid chromatography with precolumn derivatization. An analytical study of the polycyclic aromatic hydrocarbons and total petroleum hydrocarbons was conducted by combining gas chromatography with gas chromatography/mass spectrometry. Multivariate statistical analysis was applied using Statgraphics software to determine the impact of the polycyclic aromatic hydrocarbons and total petroleum hydrocarbons on the amino acid profile of three species of fish. In addition, the bioconcentration factor was estimated in the studied species and was used to validate the results obtained from the multivariate analysis. Based on the results of the study, the sum of polycyclic aromatic hydrocarbons with two cycles, and with five to six cycles, is in reverse order in Plectropomus pessuliferus with respect to Epinephelus tauvina and Cephalopholis argus. The factor analysis showed high factor scores for aspartic acid, glutamic acid, tyrosine, chrysene, and total petroleum hydrocarbons, and for lipids and benzo(g,h,i)perylene, which could be explained by bioaccumulation. It was concluded that the high proportions of glutamic acid (8.32–11.10%) and aspartic acid (6.06–8.27%) in the muscles of the studied species are a sign of contamination with petroleum hydrocarbons. The incremental lifetime cancer risk values for the three endemic fish exceeded the limit value (>10−5), indicating a high potential cancer risk for the Saudi population.

1. Introduction

The Red Sea’s underwater ecosystem provides a habitat for more than 300 coral species and 1200 fish species, including 120 exclusive species. Nonetheless, it was found that the Gulf of Mexico accounted for 4.7% of the total oil pollution reported worldwide [1]. This is mainly due to the presence of refineries and the important industrial development and urbanization in the region, which resulted in increasing pollution of the marine environment. Jeddah is one of the most industrialized cities on the west coast of Saudi Arabia and is under increasing impacts of human activities [2]. The European Food Safety Authority considers eight PAHs, including benzo[a]pyrene (B[a]P) and dibenzo[a,h]anthracene, as carcinogenic when present in foodstuffs [3]. Moreover, according to the International Agency for Research on Cancer (IARC), 15 polycyclic aromatic hydrocarbons (PAHs) are classified as probable or possibly carcinogenic substances [4]. B[a]P is classified as a group 1 carcinogen (i.e., carcinogenic to humans). B[a]P is also classified as category 1B due to its reproductive toxicity by the European Union [5].
Marine organisms, in particular fish and crustaceans, are significantly affected by oil pollution. Hydrocarbons originating from petroleum, particularly highly toxic polycyclic aromatic hydrocarbons (PAHs), accumulated by marine animals may interact with sub-cells and tissues to produce various lesions and give rise to localized inflammatory responses [6]. In addition, PAHs can have significant negative effects on the coral reef ecosystem and even human health through trophic transfer via the food chain [7]. The damage caused by petroleum hydrocarbons at the sub-cellular and molecular levels in marine animals can provide early warning of pollution and quick access to reliable water quality data [8]. Attention should be paid to the potential consequences of the accumulation of petroleum hydrocarbons in the lipoid compartments [9] and their biotransformation in marine organisms, particularly in countries where fishes are consumed in large quantities [10,11]. Viarengo et al. [12] stated that exposure to hydrocarbons enhances the instability of lysosomal membranes, which leads to protein catabolism, with an attendant increase in proteinogenic amino acids.
According to a survey carried out on the fish species consumed by Saudis and expatriates living in the Jeddah region, Burger et al. [13] showed that locals preferred “Hamour” fish (grouper), including Epinephelus and Cephalopholis, followed by Plectropomus pessuliferus, which were eaten by 72.1% and 58.2% of the region’s residents, respectively.
To evaluate the pollution level in the Jeddah marine environment, three coral reef fish species were selected: Epinephelus tauvina, Cephalopholis argus, and Plectropomus pessuliferus, which are known for their sensitivity to the bioaccumulation of pollutants, as shown by Li et al. [14]. Due to their differential sensitivity to pollution, these species have been used as biological indicators of oil pollution.
It is possible to estimate the amount of pollution that accumulates in aquatic organisms using the bioaccumulation concentration factor (BCF). BCFs are calculated by comparing the concentrations of xenobiotics in organisms and in their environment [15,16]. In organisms with higher lipid contents, hydrophobic hydrocarbons have a higher BCF, which increases their cytotoxicity [15].
In this study, we estimated the level of TPHs, PAHs, and amino acids (AA) in three chosen endemic species of fish commonly consumed by Jeddah residents. In this work, we also studied the relationship between TPHs concentrations and amino acids and lipid changes in fish tissues. Moreover, the bioconcentration factors (BCFs) estimated in the studied species were used to validate the results obtained from the multivariate analysis of the interactions between PAHs, lipids, amino acids, and TPHs. Toxic equivalency factors (TEFs) and USEPA equations were used to calculate the incremental lifetime cancer risk (ILCR) from the consumption of endemic fish contaminated with PAHs by the Saudi population.

2. Materials and Methods
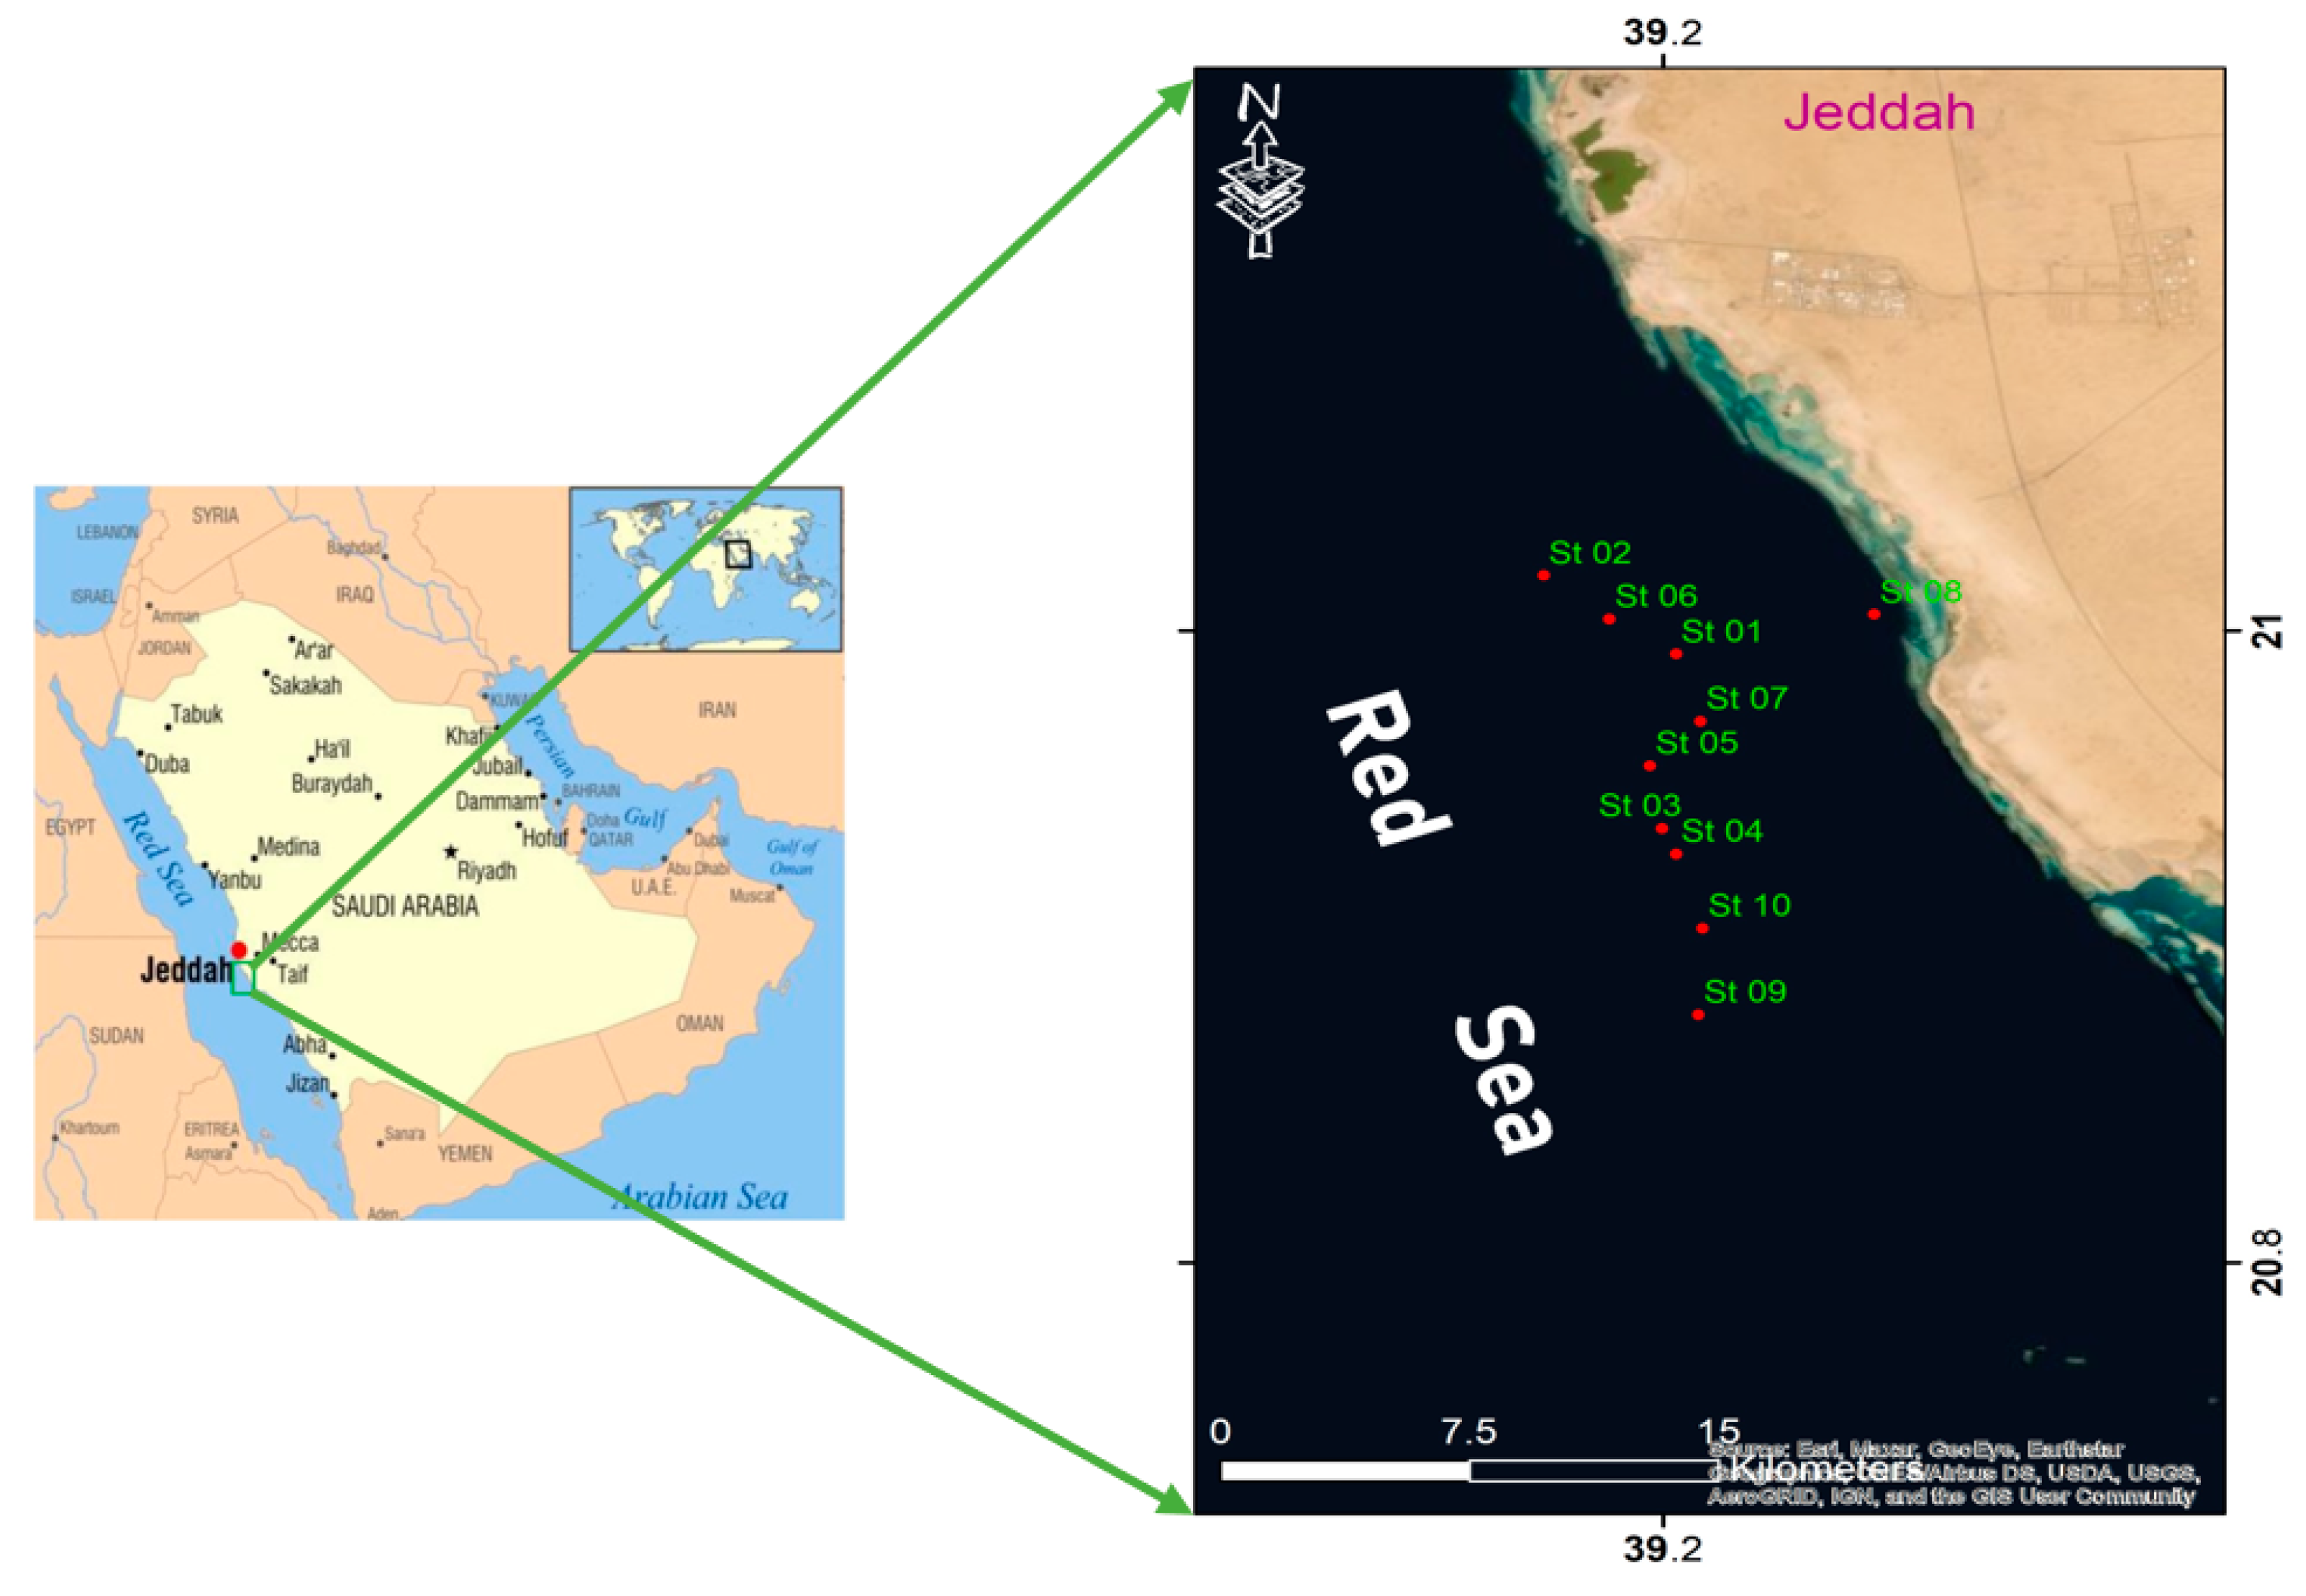
2.1. Study Area

Fish species were captured at selected stations at different distances from the Jeddah coast (Figure 1) from September 2020 to December 2021. The study area extended between latitudes of approximately 20.75°–21.05° N and longitudes 39.10°–39.35° E.

2.2. Sample Collection

A total of 35 biota samples (Epinephelus tauvina, Cephalopholis argus, and Plectroponus pessuliferus) (Table 1) and water were sampled from coral reef areas in Jeddah, Saudi Arabia. Thirty-five (35) fish of three grouper species were collected and classified according to Heemstra and Randall [17] (Epinephelus tauvina, Figure 419, p. 241; Cephalopholis argus, Figure 71, p. 34; Plectroponus pessuliferus, Figure 509, p. 296). Local Jeddah fisherman assisted in collecting all the fish samples on site. These fish species belong to the Serranida family and were selected because they are consumed often and are sensitive to the bioaccumulation of pollutants. Therefore, the concentration of pollutants in these species can provide authorities with information on the level of pollution in the coral reef ecosystem. Once the ship reached the port, the fish samples were frozen at −20 °C and transported to the laboratory. The samples were cleaned and descaled using deionized water. Then, the specimens’ body length and weight were measured (Table 1). Upon dissection of the fish, the dorsal muscles were vacuum freeze-dried, ground to a fine powder, and stored in a deep freezer at −20 °C until analysis.

2.3. Chemicals

All solvents, US EPA PAH MIX 25, and amino acid standards were purchased from Sigma-Aldrich (Darmstadt, Germany).

2.4. Extraction and Separation

Saturated aliphatic and aromatic hydrocarbons were extracted using the method described by Kanzari et al. [18] with slight modification. Briefly, the extraction was performed in a Soxtec™ 2055 extraction system. A mixture of the dried fish sample powder (5 g) and 15 g of sodium anhydrous sulfate was placed in a cellulose extraction thimble. The mixture of analytes was extracted with 50 mL of n-hexane after a boiling time of 2 h and a rinsing time of 1 h after the addition of internal standards. The extracts were thereafter evaporated to approximately 1 mL. For improved purification, the extracts were passed through a multilayered column preconditioned with n-hexane (40 mL). The hexane fraction was concentrated by vacuum distillation in a rotary evaporator (Büchi, Flawil, Switzerland) to approximately 10 mL at 40 °C, and concentrated in Reacti-Therm evaporating units in a current of nitrogen gas to a volume of 1 mL. A glass 45 × 2 cm (LxID) chromatography column was packed from bottom to top with layers of silica gel (8 g), followed by 8 g of alumina (8 g) and sodium sulfate (1 g). After loading the concentrated extract (1 mL), the aliphatic fraction (F1) was consecutively rinsed with 30 mL of n-heptane and 20 mL of n-heptane/DCM (90:10). The aromatic fraction (F2) was eluted with 50 mL of n-heptane/DCM (80:20). To remove the sulfur interference, the extract was shaken with hydrochloric acid washed copper powder. The two fractions were then evaporated under a slight stream of nitrogen. Finally, the residues of F1 and F2 were reconstituted by the addition of 0.5 mL of n-hexane. The method employed for the determination of amino acids was in accordance with the Agilent method described by several authors [19,20,21,22,23,24,25,26], except for the dry block heater used for the derivatization experiments. Under vacuum and 150 °C for 6 h, dried fish powder (5 g) was hydrolyzed with 6 mol/L HCl solutions containing 0.1% phenol. Following hydrolysis, the samples were evaporated to dryness at 70 °C under a stream of nitrogen and filtered. High-performance liquid chromatography (HPLC) was used to analyze the derivatives after filtering the filtrate with cellulose membrane syringe filters. The fat content was quantitatively determined in petroleum spirit using Soxtec 2055 (FOSS Tecator, Foss, Hillerod, Denmark) in duplicates. The dry matter was determined gravimetrically according to ISO 1443:1973 (AOAC960. 39, AOAC INTERNATIONAL, Rockville, MD, USA) by drying the sample to a constant weight at +103 ± 2 °C.
Finally, the total protein content was determined using the analyzer Kjeltec 2300 (FOSS, Höganäs, Sweden), according to the ISO 937:1978 standard.

2.5. Chromatographic Analysis

Aliphatic fraction (F1) (n-C13-n-C34) analysis using programmable temperature vaporization (PTV) and large volume injection (LVI) mode was carried out using an Agilent A6890N gas chromatograph system equipped with an FID and an HT-5 thin film capillary column, 12 m × 0.22 mm ID × 0.1μm film thickness (SGE part number 054631). The chromatographic conditions were as follows: The oven temperature was kept at 26 °C for 1.5 min after injection, increased at a rate of 15 °C/min to 320 °C, and then kept for 3.83 min min at this temperature. The detector temperature was set at 320 °C. The carrier gas flow rate was set at 2.0 mL/min. The aromatic hydrocarbons fractions (F2) were analyzed by gas chromatography coupled to mass spectrometry (Agilent HP-6890 GC GC with 5973 MSD, Conquer Scientific, Poway, CA, USA). The samples were injected in the splitless mode onto a 30 m × 0.25 mm × 0.32 μm DB-5 fused silica capillary column. The oven temperature was initially set at 60 °C, then immediately raised to 300 °C with an increasing rate of 15 °C/min, and finally kept at the final temperature for 10 min. The carrier gas (helium) was allowed to flow at a constant flow rate of 1 mL·min−1. The ionizing energy of the mass spectrometer was set at 70 eV. The quantification of PAHs was made using chrysene-d12 and phenanthrene-d10 as the internal standards. Analytes identification was based on the retention indices and a series of confirmation ions (SIM) as described in a previous paper [27]. The GC/MS was calibrated by the injection of standards at five concentrations.
The amino acids composition of the three fish species was determined using an HPLC (Agilent Technologies, 1200 Series, Santa Clara, CA, USA) method, with pre-column derivatization using 9-fluorenylmethyl chloroformate (FMOC) and o-phthaldialdehyde (OPA) and with DAD detection at λ1 = 338 nm and λ2 = 262 nm, based on the Agilent methods cited above. Samples were analyzed using a Zorbax Eclipse Plus column C18—150 mm length, inner diameter—4.6 mm, and sorbent grain diameter of 5 µm (Hypersil ODS). A gradient regime (Table 2) of 2 mobile phases was used at a constant flow rate of 1.5 mL: Mobile phase A—10 mmol Na2HPO4, 10 mM Na2B4O7 and 5 mM NaN3, pH 7.8; and mobile phase B—CH3CN: CH3OH: H2O (45:45:10, v/v/v). The column oven was set at 40 °C. All data are presented as mean ± standard deviation.

2.6. Bioconcentration Factor (BCF) and Bioaccumulation

Bioconcentration is a process by which a chemical is directly absorbed into an organism only after being dissolved in water. The bioconcentration of a chemical is evaluated through the bioconcentration factor (BCF), which is expressed as the ratio of the concentration of a chemical in an organism to the concentration of the chemical in the surrounding environment. In this case, BCF is the ratio between the concentration of polycyclic aromatic hydrocarbons in the studied endemic fish species (CB) (mass of chemical per kilogram of organism/dry weight) and its freely dissolved concentration in the surrounding water (CW) (mass of chemical/liter) (Equation (1)) [28]:
BCF = CB/CW,

2.7. Assessment of Cancer Risk of Saudis Exposed to PAHs in Endemic Fish

For assessment of the potential carcinogenic risks of PAH compounds in fish consumed by the Saudi population, the toxic equivalency factors (TEFs), determination of carcinogenic PAHs (CPAHs), and incremental lifetime cancer risk (ILCR) were used.

2.7.1. Carcinogenic Potency of PAHs (BaPequi) in Fish

The carcinogenic potency of PAH compounds measured in endemic fish consumed by the Saudi population was calculated by the equivalency of benzo(a)pyrene (B[a]Pequi) according to the TEFs proposed by Nisbet and Lagoy [29]. A reference chemical, B[a]P, was selected as the most toxic PAH compound, and it was given a value of one [30,31]. BaPequi for each species was calculated using the following equation (Equation (2)):
B [ a ] P equi   ( ng / g ) = i = 1 n C i xTEF i ,
As defined by Nisbet and Lagoy [29], Ci is the concentration of each PAH compound in the species of fish studied; TEF is the corresponding individual equivalence factor for each toxicity equivalency factor and congener of PAHs, respectively. The total cancer potency of all PAH compounds in fish was calculated by summing the estimated cancer potency relative to BaP.

2.7.2. Cancer Risk Estimates Based on PAH Exposure to Fish

A health risk assessment of the Saudi population exposed to PAHs in endemic fish was carried out in the present study using environmental protection agency (EPA) risk assessment models developed in the United States.
According to Equation (3), the incremental lifetime cancer risk (ILCR) associated with dietary exposure to PAHs in the Saudi population is as follows [32]:
Carcinogenic   risk = ILCR ingestion = C s   × { CSF ingestion   × BW 70 3 } × IR ing . × EF   × ED × CF BW × AT ,
where ILCR is the incremental lifetime cancer risk (dimensionless); Ci is the sum of converted PAHs concentration (mg B[a]Pequi/kg) in the species of fish studied; IRi is the amount of fish consumed per day (g d−1) by a specific species based on the B[a]P equivalent concentration of PAHs (ng·g−1) [33]; CSFingestion is the carcinogenic oral slope factors (mg/kg/day) for ingestion with a geometric mean of 7.3 (mg kg−1 day−1)−1 [34,35,36,37]; IRi is the fish ingestion rate; BW is the body weight of an adult (70 kg); TEFi is the corresponding individual equivalence factor for each toxicity equivalency factor and congener of PAHs, respectively; EF is the exposure frequency (365 days year−1) [38,39]; ED is the exposure duration for each life segment [40]; and AT is the average life span (years) [41,42,43,44].
Table 3 provides detailed information on the exposure factors used in the above models (Equations (2) and (3)).

2.8. Statistical Methods

For the evaluation of the fish species and analytical results, multivariate statistical methods, including Pearson product-moment correlation analysis, factor analysis (FA), principal component analysis (PCA), cluster analysis (CA), and normality tests, were applied. The data matrix of the fish species and analytical results was analyzed using the software Statgraphics for Windows, Version 1.8.

3. Results and Discussion

3.1. Profile of the Amino Acid Content in the Three Fish Species

In the present study, a total of 14 amino acids were detected: 7 essential, 4 non-essential, and 3 conditional essential amino acids. The amino acid concentrations in fish muscles (g/100 g of crude protein) are presented in Table 4. The results show that glutamic acid is the major amino acid (8.32–11.10%), followed by aspartic acid (6.06–8.27%).
In the case of essential amino acids (EAAs), Plectropomus pessuliferus was found to have the highest values of essential amino acids (EAAs) while the other two species Epinephelus tauvina and Cephalopholis argus had similar EAA values. The results obtained for the major amino acids, such as lysine (5.36–11.27%), leucine (4.83–10.33%), and valine (3.37–4.51%), are consistent with previous results found in 27 food fishes [45].
Non-essential or conditional amino acids such as arginine, alanine, and glycine were found to range from 2.69% to 4.06% in Epinephelus tauvina, 3.75% to 5.33% in Cephalopholis argus, and 7.17% to 10.70% in Plectropomus pessuliferus. Moreover, Plectropomus pessuliferus samples had the lowest serine concentrations (1.97%) while Cephalopholis argus samples had the highest recorded serine mean value of 2.87%. It is well established that the physiological state of organisms is deeply related to the information provided by conditional amino acids [46]. Under specific circumstances or conditions, it may be considered as a suitable indicator of stress. Pollution may influence the concentration of the major conditional amino acids [46,47,48]. Moreover, an alteration in the enzymes involved in amino acids metabolism has also been reported [49].
Four conditional essential amino acids were detected in the studied fish samples: arginine, glycine, and tyrosine. Comparing Plectropomus pessuliferus to the two other fish species, the total arginine percentage was significantly higher. In contrast, no significant variations were observed in the total percentage of arginine and glycine in both Epinephelus tauvina and Cephalopholis argus fish samples (Table 1). The highest percentages of arginine, glycine, and proline were found in Plectropomus pessuliferus fish samples, whereas small variability in the tyrosine concentration was found between the three species. The mean tyrosine concentrations were 0.64, 1.83, and 2.73 g/100 g, respectively, in the Epinephelus tauvina, Cephalopholis argus, and Plectropomus pessuliferus samples. Indicators of stress have been derived from the ratio of certain conditional amino acids, such as taurine:glycine, the sum of serine and threonine, or alanine [50,51,52]. Other behavioral stress indicators using free amino acids, such as the burying capacity of Macoma balthica, have been reported by Duquesne et al. [53].
According to Viarengo et al. [12], exposure to hydrocarbons leads to the destabilization of lysosomal membranes and therefore, a concomitant increase in protein amino acids. According to Moore et al., long-term exposure to anthracene and phenanthrene can cause lysosomal enlargement, which may be associated with chemical-induced lipidosis [8,54,55,56,57,58] and a general impairment of the lysosome’s ability to degrade its components. In general, the conditional amino acids composition in coral reef fish can be considered as a molecular approach to assess the state of pollution of marine biota.
It is important to investigate other hydrocarbon substances that may have negative effects on coral fish metabolism, such as polycyclic aromatic hydrocarbons, specifically to determine a possible link between amino acids and oil hydrocarbon intake.

3.2. TPHs and PAHs Levels in the Coral Reef Fish Samples

The Kingdom of Saudi Arabia is one of the main crude oil producers in the world. Jeddah is the largest city located on the eastern shore of the Red Sea and the economic capital of Saudi Arabia. Since the 1970s, the city has grown rapidly and developed a large number of industries, including refineries and petrochemical complexes. In addition, there are several ports where maritime traffic and accidental oil spills may constitute potential pollution sources [59]. Consequently, contamination by oil pollutants has become one of the main concerns for the authorities in the region [60]. As the coral reef area is a shallow water ecosystem, the contamination risk of hydrocarbons for different fish species is highly probable. Petroleum pollutants tend to accumulate more in living organisms than the environment. Therefore, fishes may be used as bio-indicators for the evaluation of contamination levels in an aquatic environment [61,62].
Groupers were chosen as representatives of reef predators because they are relatively sedentary and do not display long-distance movement [63,64,65]. Several research studies have revealed the presence of TPHs and PAHs at various concentrations in different fish species and in several other marine vertebrates around the world [1,62,66,67,68,69].

3.3. Total Petroleum Hydrocarbon Concentrations in Tissues

P. pessuliferus fishes had higher TPHs concentrations in muscle tissue (7.4 ± 3.2 µg g−1) followed by C. argus (6.8 ± 3.6 µg g−1) and E. tauvina (4.2 ± 2.3 µg g−1) (Table 5).
Several possible causes might have been at the origin of the TPHs concentration variations, including the differences in the marine habitat, the dietary habits, and the different depths at which the fishes live in the marine environment, and the body and lipid masses [1,70]. Although other studies reported a relationship between TPHs concentrations and the lipid content in different fish species [71], no significant relationship was observed in our study. The convergent results observed in the current study can be explained by the fact that all the studied fish species were located in the same area of the coral reefs, and because they belong to the same subfamily of Epinephelinae, part of the Serranidae family.
The fish muscle TPHs concentrations reported in samples from the marine biota of Saudi Arabia and other sites with similar properties are presented in Table 6. The TPHs levels in fish species reported herein were significantly lower than those found by Afifi et al. [72] (10–156 μg g−1 dw) in marine fish samples obtained from the same locality, and lower than the results reported in fish samples from Shatt Al-Arab River (5.12–21.52 μg g−1 dw) [73]. However, lower TPHs concentrations were reported in Grouper tissue samples from the Northern Persian Gulf (Table 6). Therefore, the concentrations of TPHs in marine biota are indicative of the degree of contamination in marine coastal ecosystems.

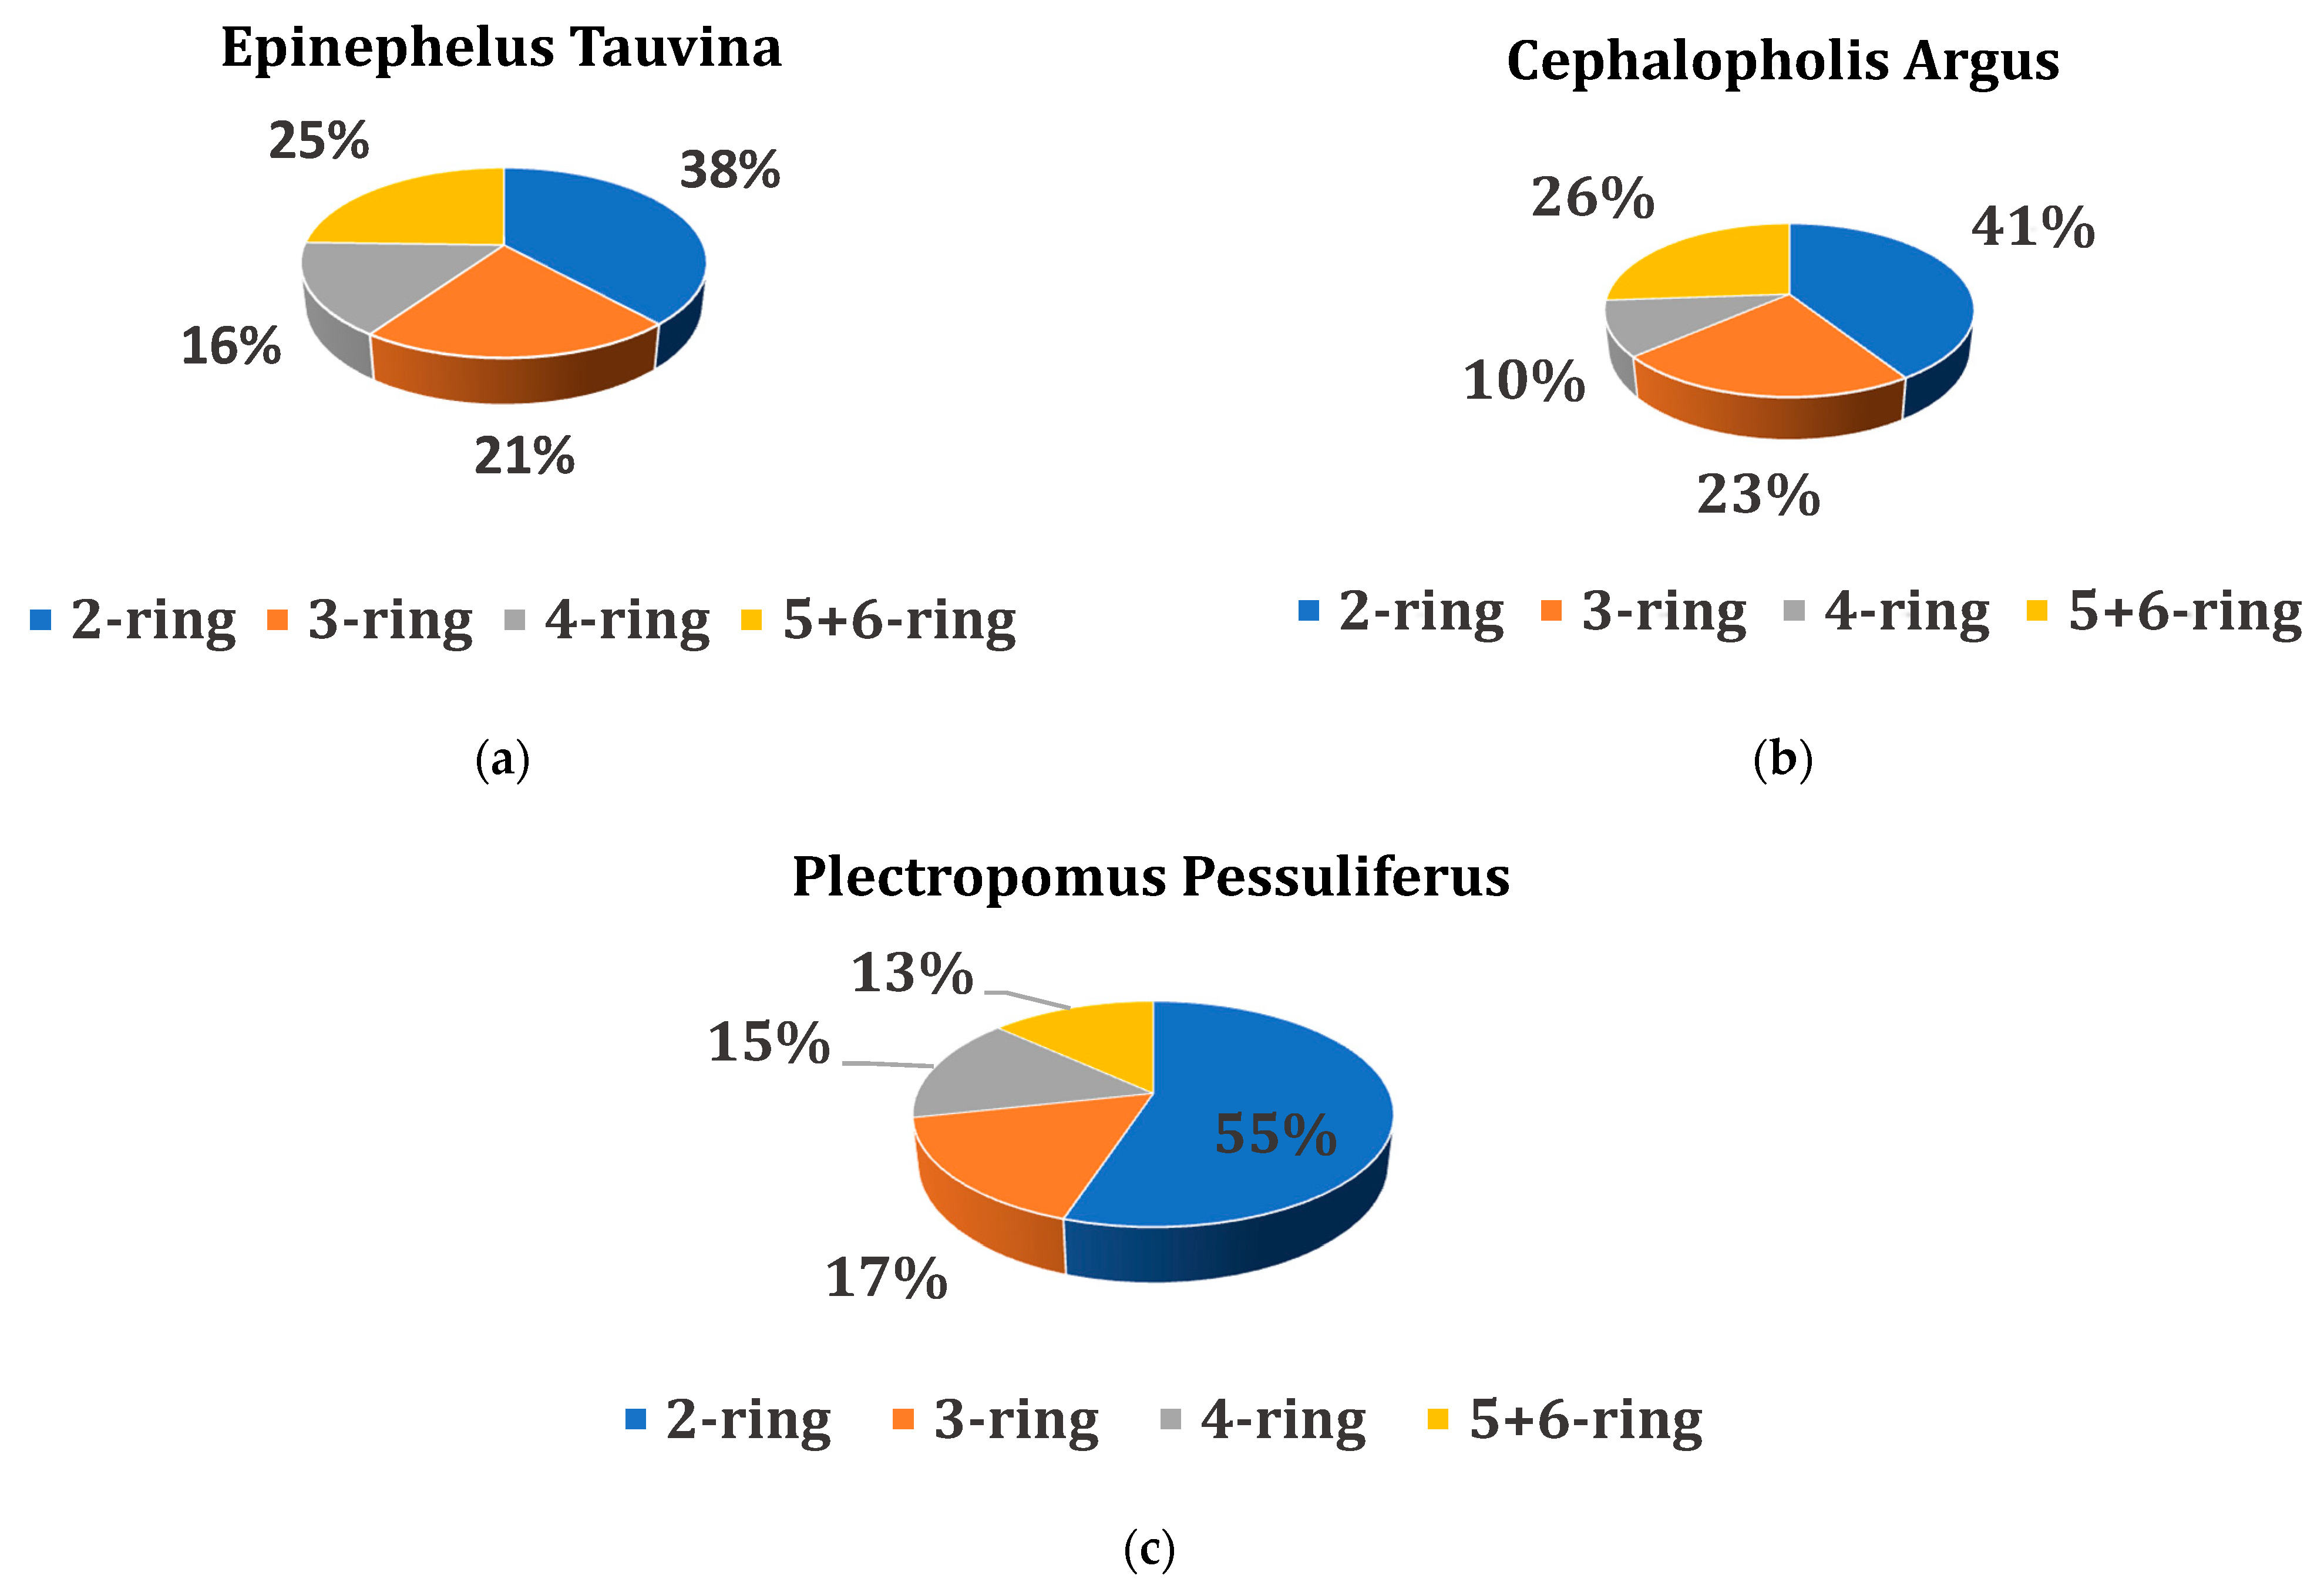
3.4. Polycyclic Aromatic Hydrocarbon Levels in Fish Species

Al-Mur et al. [2] studied the polycyclic aromatic hydrocarbons in 18 samples of bottom sediments from marine coastal water in Jeddah, Saudi Arabia. The authors reported that the coastal zone was polluted by ∑16 PAHs, with a total concentration ranging from 1169.8–3003.4 ng·g−1 dry wt.
Several studies revealed that PAHs from the aquatic environment may accumulate and intoxicate fishes and invertebrates [78,79,80]. The accumulation of low-molecular-weight PAHs was shown to be higher than that of high-molecular-weight PAHs in both fish and invertebrates. This phenomenon could be due to the higher water solubility of low-molecular-weight PAHs, making them more available, and other probable biological factors.
Very little information is available on the origin of aromatic hydrocarbon contamination in fish to distinguish between combustion and petroleum sources. Most researchers have been more interested in studying total hydrocarbons than their sources or individual compounds. To determine the sources of the aromatic compounds found in the studied species, we used the concentration ratios proposed by other researchers [81,82,83,84] to determine whether the contamination was from a petrogenic or pyrogenic source. Some indicators proposed by certain authors to determine the sources of aromatic compounds are presented in Table 7.
The total PAHs concentrations in the three fish species ranged from 21.78 ng·g−1 dw in Plectropomus pessuliferus to 59.44 ng·g−1 dw in Cephalopholis argus and reached 36.61 ng·g−1 dw in Epinephelus tauvina (Table 8).
Naphthalene (NAP) followed by acenaphthene (ACE) and fluorene (FLU) were the most frequently detected dominant PAHs in the current study. These results are in agreement with several other works [86,87,88,89]. Among the explanations for the predominance of low-molecular-weight (LMW) compounds in the tissues of fish species, such as naphthalene and three-ring PAHs, is their lipophilic character [86,87,88,89]. Although several authors reported positive correlations between the lipid content and total PAHs concentrations in marine fish [87,90], other studies found an extremely weak positive correlation or no correlation between the lipid content and PAHs concentrations in fish tissues [91,92,93], in accordance with our results.
In light of these results, the lipid content cannot be the sole explanation of the fate of pollutants in fish species. Indeno[1,2,3-cd]pyrene (InP) and certain PAHs could not be detected in any fish species while other PAHs were detected in low concentrations. This may be due to their rapid biotransformation or depuration. The elimination or accumulation of PAHs in fish depends on different factors such as the lipid content in the fish tissue, duration of exposure, and interspecies differences. The most abundant PAHs in the muscle of Epinephelus tauvina were naphthalene (NAP), acenaphthene (ACE), fluorene (FLU), pyrene (PYR), and benzo(b)fluoranthene (BbF) (Table 8). For Cephalopholis argus, the most abundant PAHs were naphthalene (NAP), acenaphthene (ACE), fluorene (FLU), phenanthrene (PHE), pyrene (PYR), benzo(b)fluoranthene (BbF), benzo(g,h,i)perylene (BPY), dibenzo(a,h)anthracene (DahA), and benzo(a)pyrene (BaP) (Table 8). Finally, naphthalene (NAP), acenaphthene (ACE), pyrene (PYR), and chrysene (CHY) were found to be the most abundant PAHs in Plectropomus pessuliferus (Table 8). Certain ratios have been calculated to identify the sources of the aromatic compounds. In the current study, all (FLU/PYR) ratios were below one (<1) (Table 8), suggesting that the major PAHs’ source could be petrogenic. In addition, all HMW/LMW ratios were >1, indicating that petroleum is the main source of PAHs.
The total PAHs concentration found in Cephalopholis argus samples in the present study appears to be lower than the concentration reported by Li et al. [7] (409.28 ng·g−1, dry weight) in Yongle Atoll (South China Sea). However, the PAHs concentration detected in Epinephelus tauvina in the present study is higher than the levels reported by Al-Saleh and Al-Doush [93] (6.273 ng·g−1, dry weight) in samples from Dammam and Sharq Dareen (Arabian Gulf waters of the Eastern province), and lower than the levels in Yongle Atoll—South China Sea (57.37 ng·g−1, dry weight) [7]. Fish species have different abilities to accumulate PAHs from the surrounding environment. Among all fish species presented in Table 9, it seems that Cephalopholis argus has a high ability to accumulate most PAH compounds.
All the analytes, regardless of the spiking level, were recovered at 73.6–95.6%, with the exception of BaA, the recovery of which did not exceed 67.6%, and BaP, which had a lower recovery at the three levels (52.3–58.5%, 51.2–48.7%). The lower BaP recoveries may be due to the degradation of analytes in samples kept at –20 °C.
As shown in Figure 2, two-ring PAHs were the predominant PAHs in all fish species. In addition, Li et al. [14] reported similar findings for coral reef fish in the South China Sea. Relatively large proportions of three-ring PAHs were also found in Cephalopholis argus (23%) and Plectropomus pessuliferus (21%). However, it should be noted that the percentages of compounds with three cycles (21%), and with four to five cycles (25%) are in reverse order in Epinephelus tauvina with regard to the two other studied species.

3.5. Health Risks from Endemic Fish Consumption

3.5.1. Carcinogenic Potential of PAHs (BaPequi)

A number of studies have suggested that BaP is a potentially carcinogenic compound and is one of the most significant PAH compounds [96,97,98].
Table 9 shows the carcinogenic potential risks due to direct oral ingestion exposure to PAH-contaminated endemic fish, which were calculated as the benzo(a)pyrene equivalent (B[a]Pequi). To calculate the BaPequi concentrations for PAH compounds, the TEF values of individual compounds were multiplied by their corresponding B[a]Pequi concentrations. Based on the calculated B[a]Pequi concentration value for each individual PAH compound, the cancer potency was evaluated.
In the present study, BaPeq concentrations ranged from 0.001 ng B[a]Pequi/g for FLUE to 2.650 ng B[a]Pequi/g for DahA in E. tauvina; from 0.002 ng B[a]Pequi/g for PHE, FLUE, and BaA to 3.250 B[a]Pequi/g for DahA in C. argus; and from 0.001 ng B[a]Pequi/g for PYR to 0.240 B[a]Pequi/g for DahA in P. pessuliferus (Table 9). In addition, the total carcinogenic activities (TCA) of the total PAHs in endemic fishes were 4.894, 7.035, and 0.633 ng B[a]Pequi/g for E. tauvina, C. argus, and P. pessuliferus, respectively. In terms of the relative contribution of individual carcinogenic activities for BaA, BbF, BkF, BaP, DahA, and CHY to the TCA (Table 9), BaP and DahA were the most dominant compounds; they accounted for 54.148% and 35.554% (E. tauvina), 46.201% and 42.931% (C. argus), and 37.915% and 33.175% for the CHY compounds based on the TCA, respectively. In addition, the total carcinogenic activities (TCAs) of the total PAHs in endemic fishes were 4.894, 7.035, and 0.633 ng B[a]Pequi/g for E. tauvina, C. argus, and P. pessuliferus, respectively. Despite the extent to which DahA and BaP act as surrogate compounds for PAHs in endemic fishes, other compounds, such as BbF, BkF, BaA, and CHY, also contribute to the TCA.

3.5.2. Carcinogenic PAH Estimation

Fish-bound PAH compounds (CHY + BbF + BkF + BaP + DahA + BPY) were 10.79 ng/g in E. tauvina, 17.97 ng/g in C. argus, and 4.31 ng/g in P. pessuliferus. As a result, these concentrations accounted for 29.47%, 30.23%, and 19.78% of the total PAH concentrations for E. tauvina, C. argus, and P. pessuliferus, respectively. The relative contributions of individual carcinogenic PAH compounds to the total carcinogenic PAH concentrations were 16.68%, 8.74%, and 32.94% for CHY; 32.07%, 23.54%, and 15.08% for BbF; 10.57%, 13.64%, and 16.24% for BkF; 16.13%, 16.81%, 14.40%, and 4.87% for BaP; 24.56%, 18.09%, and 5.57% for DahA; and 0.00%, 19.20%, and 25.29% for BPY in E. tauvina, C. argus, and P. pessuliferus, respectively. Generally, BbF was the dominant carcinogen for both E. tauvina and C. argus species, whereas for P. pessuliferus, CHY and BPY compounds were the predominant carcinogenic compounds.

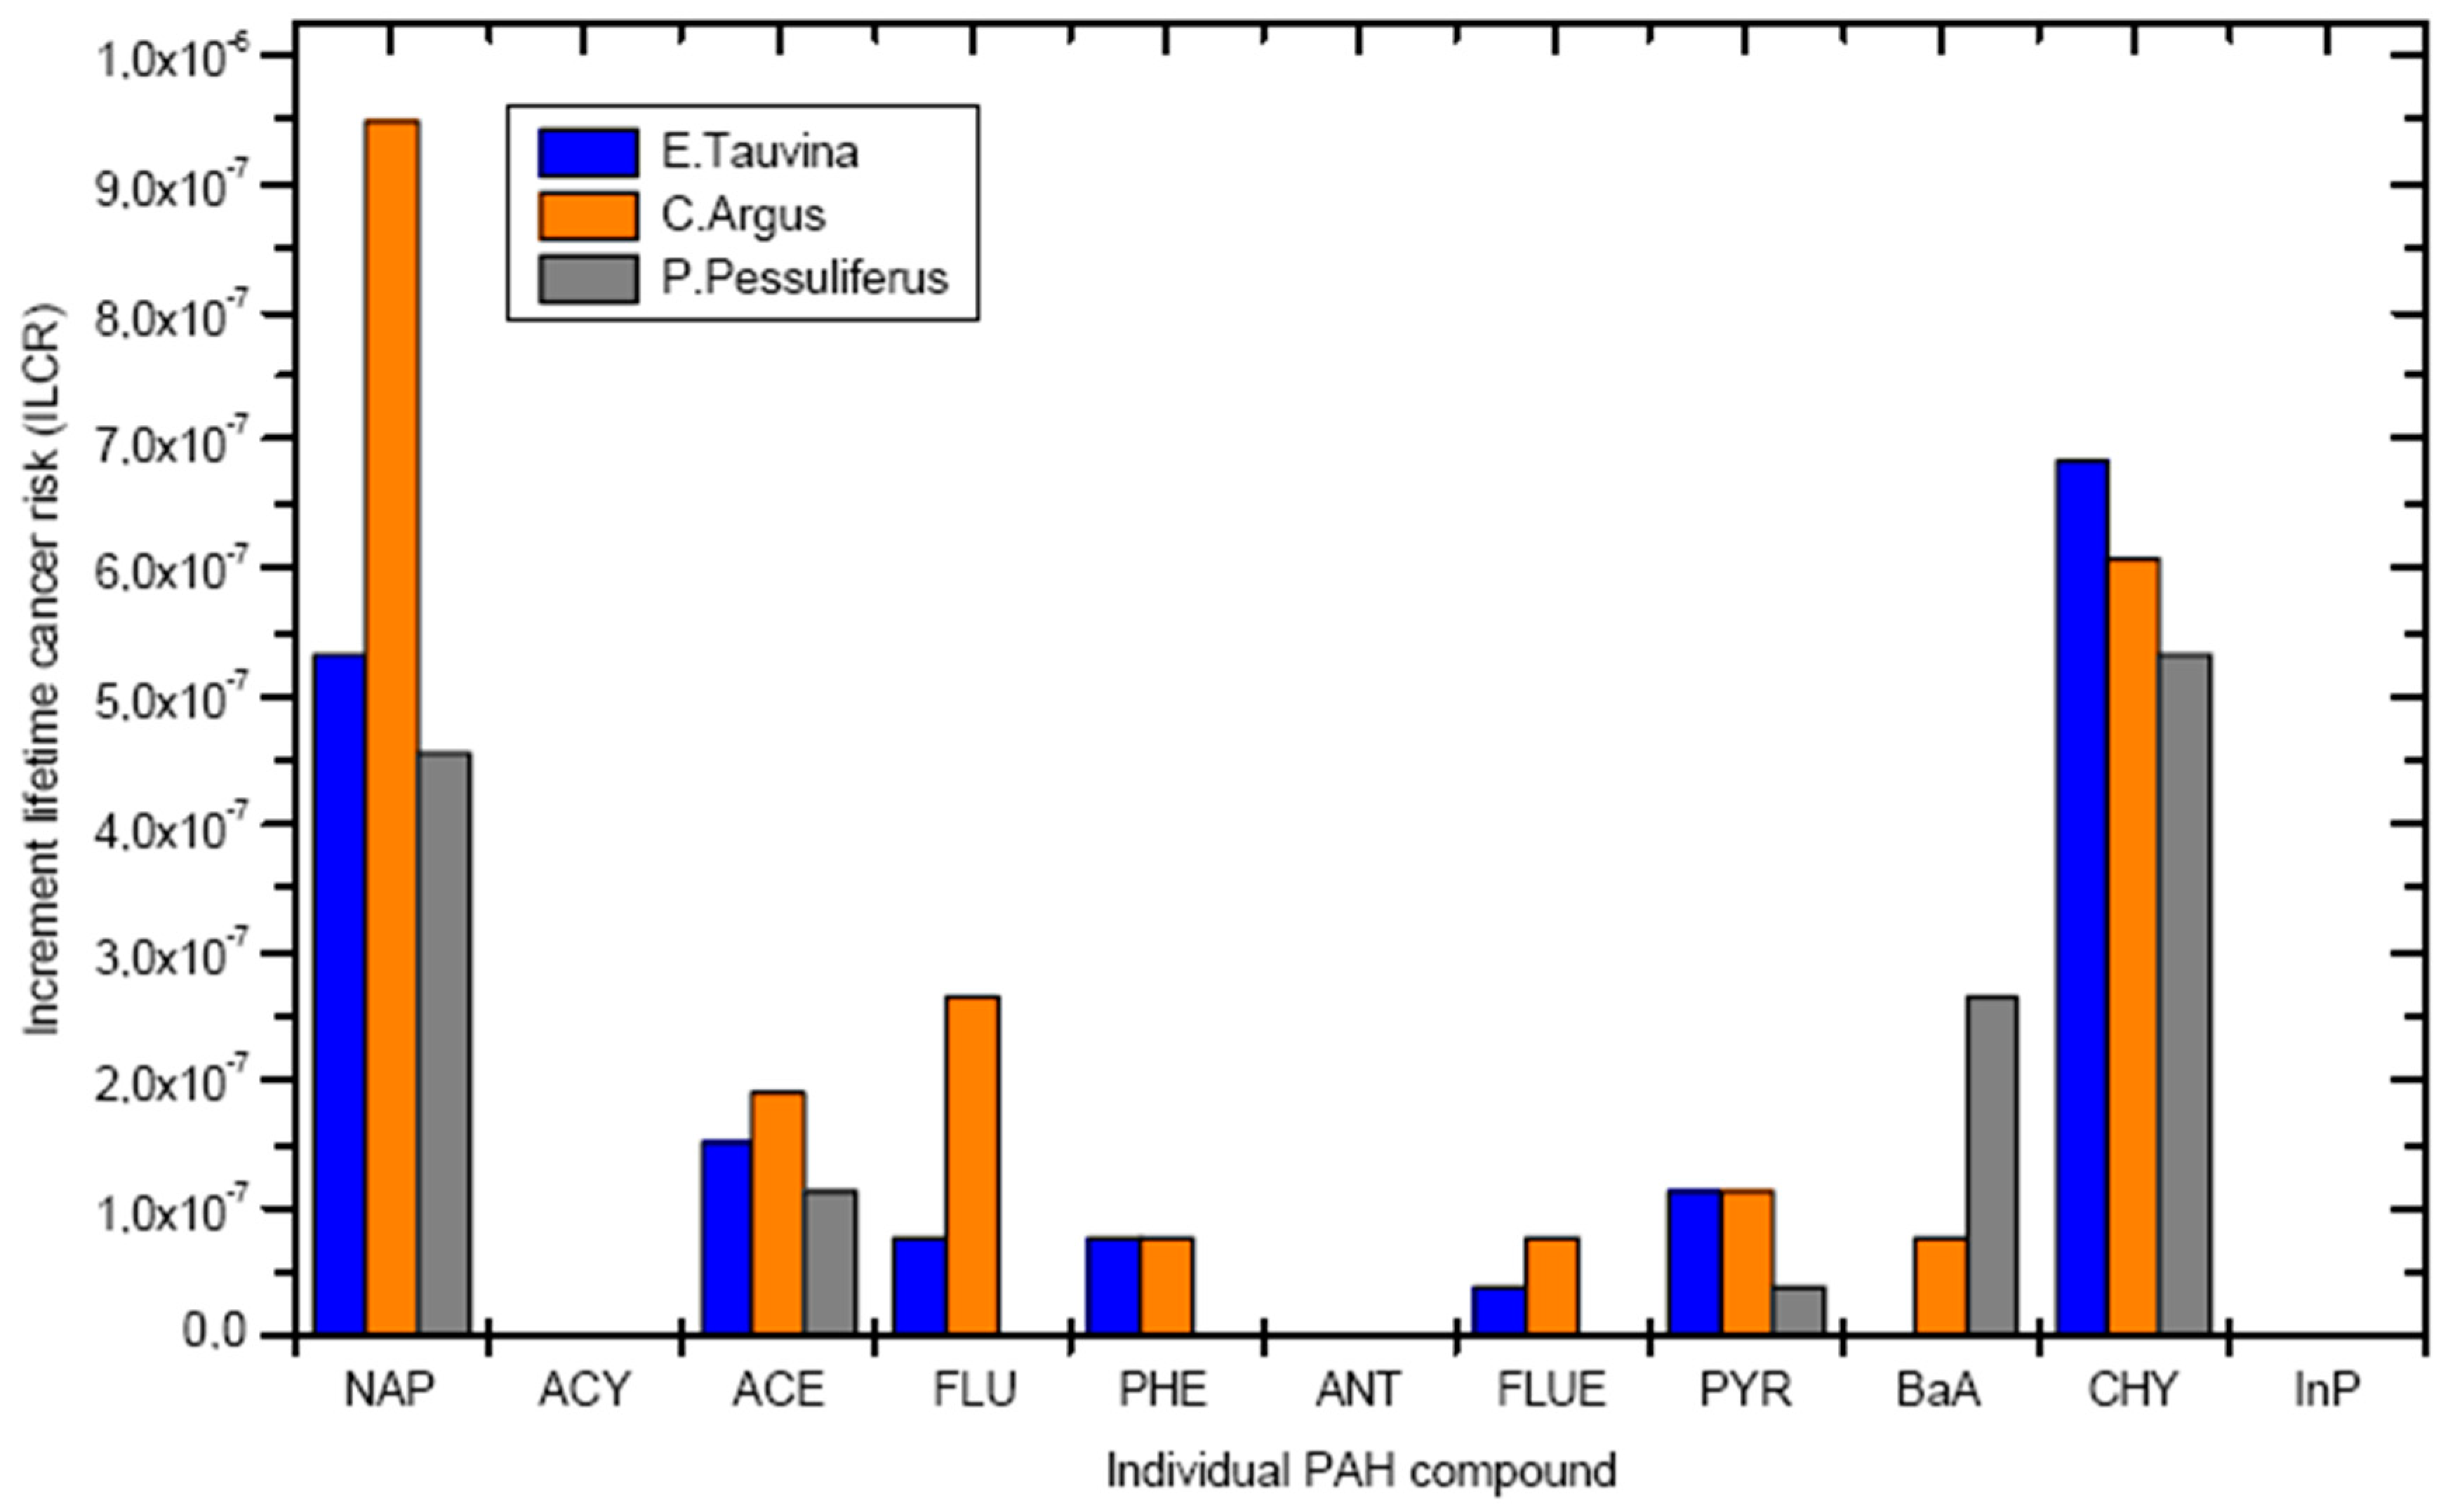
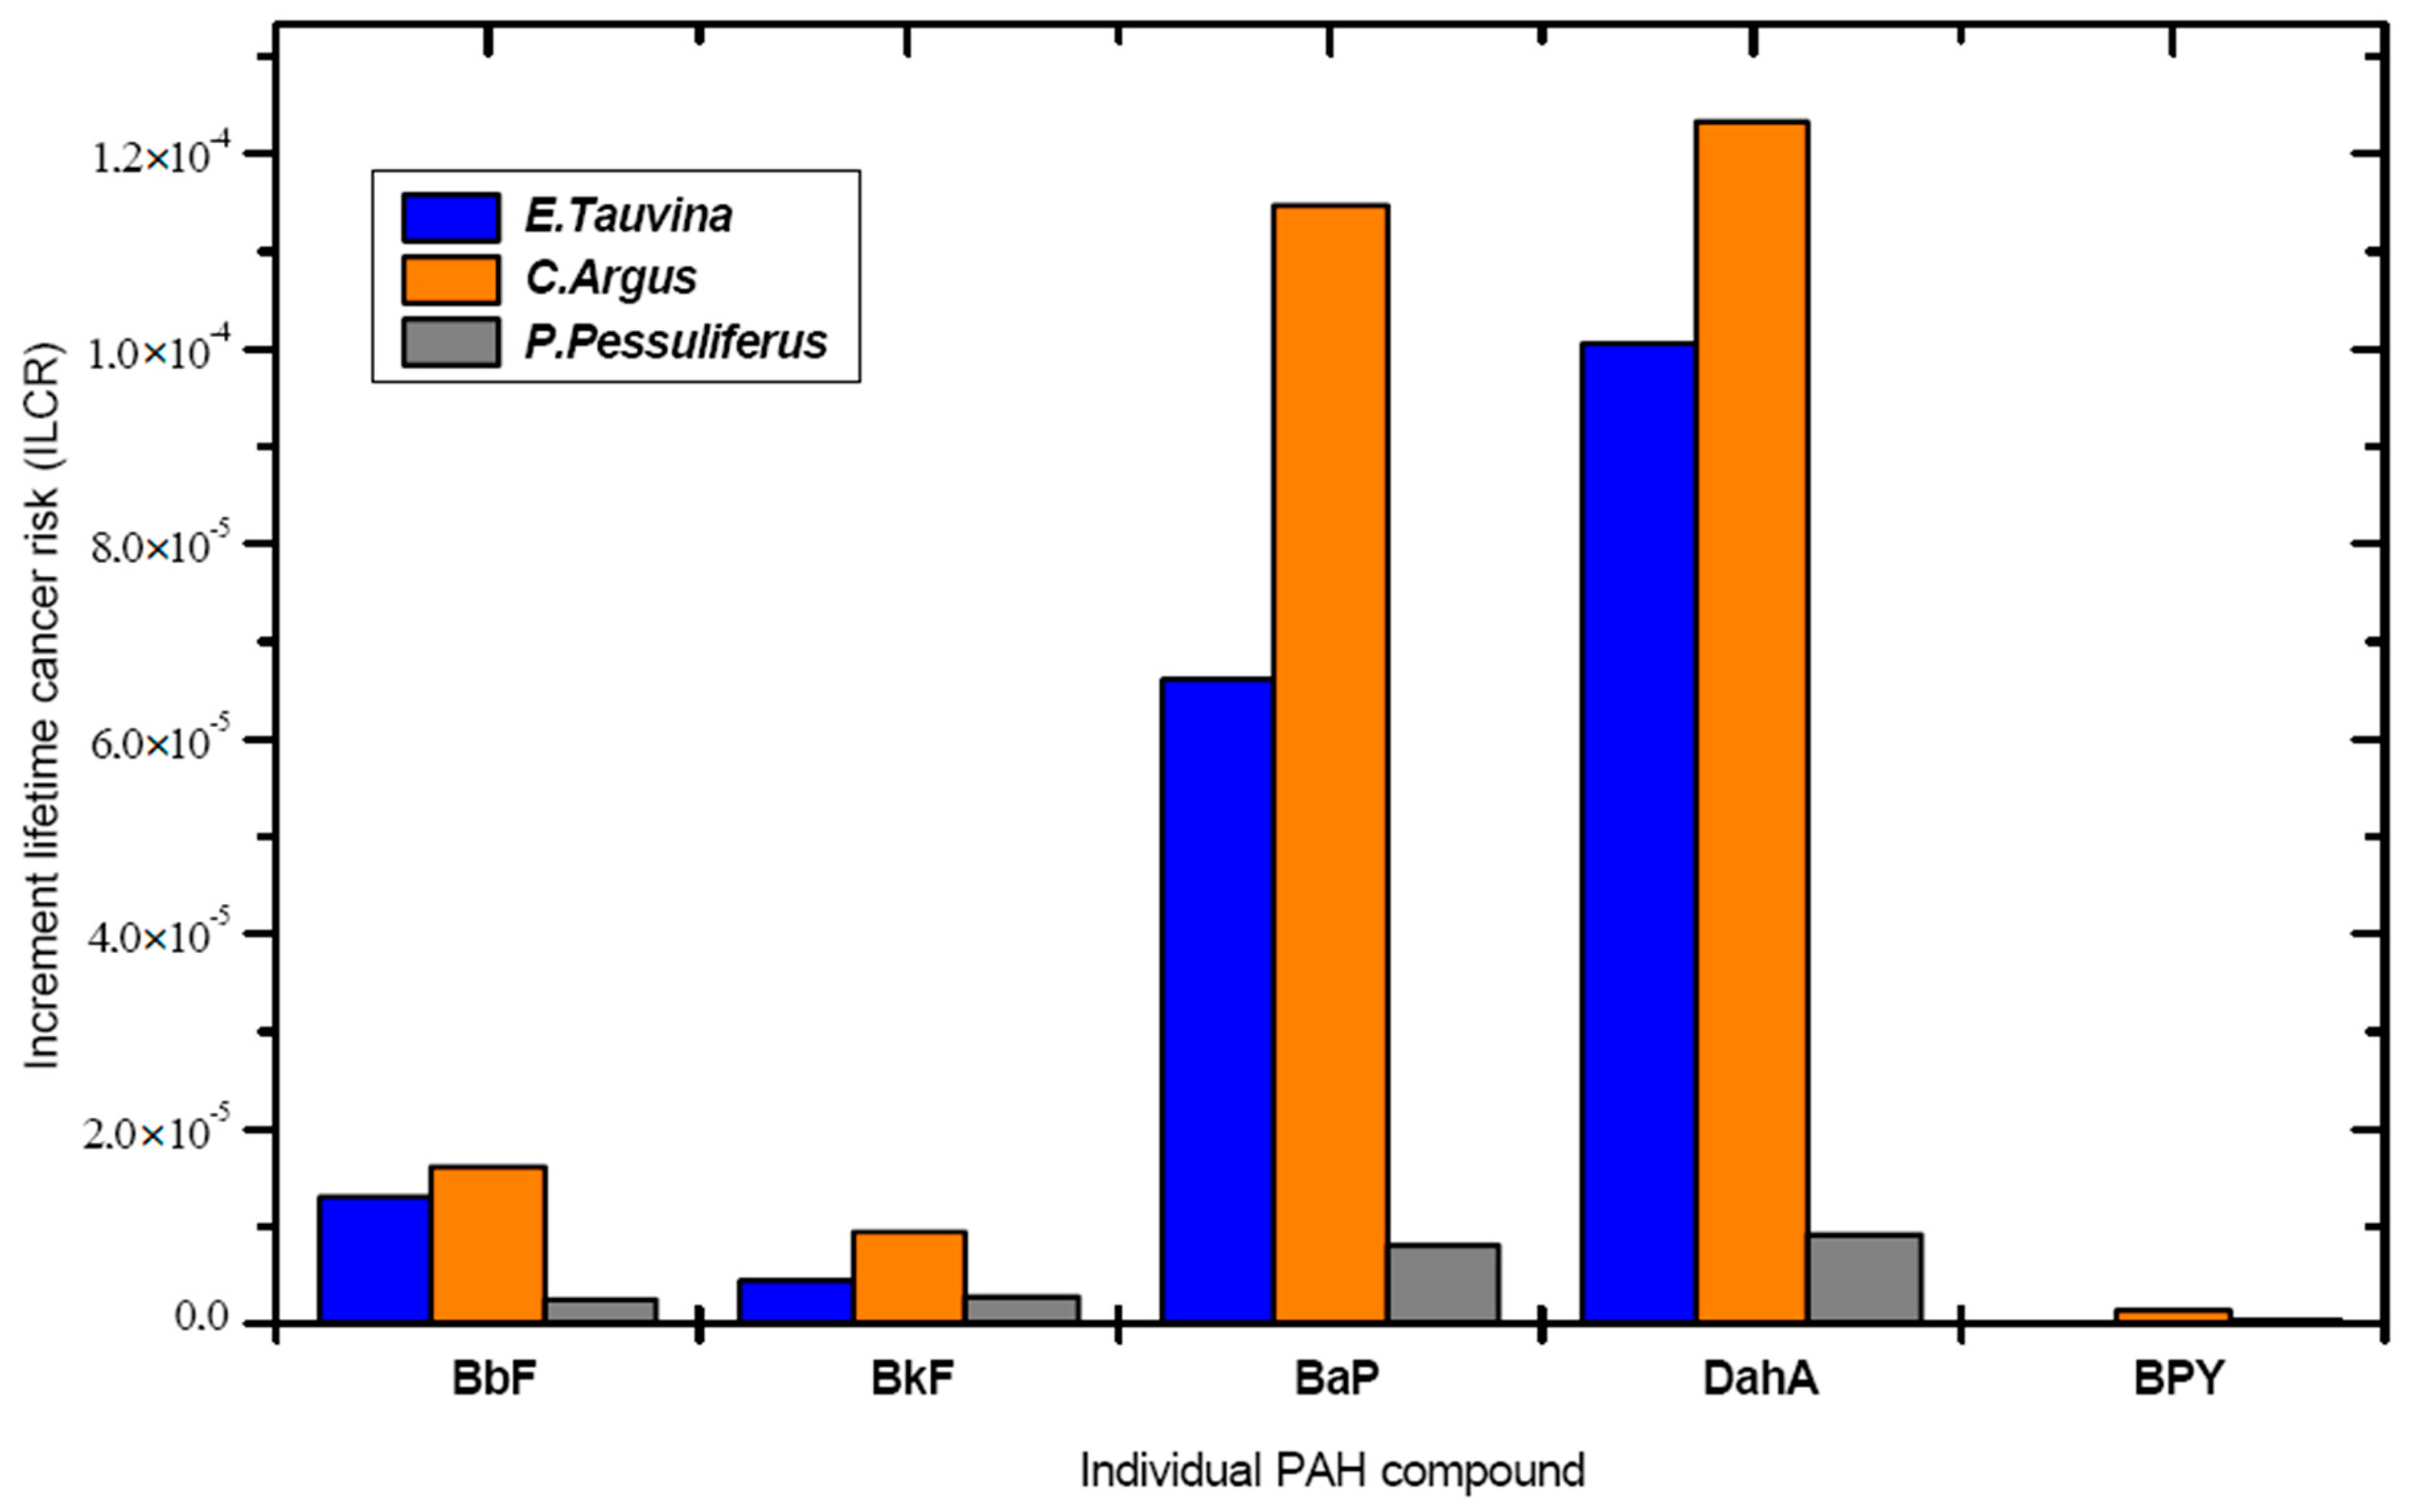
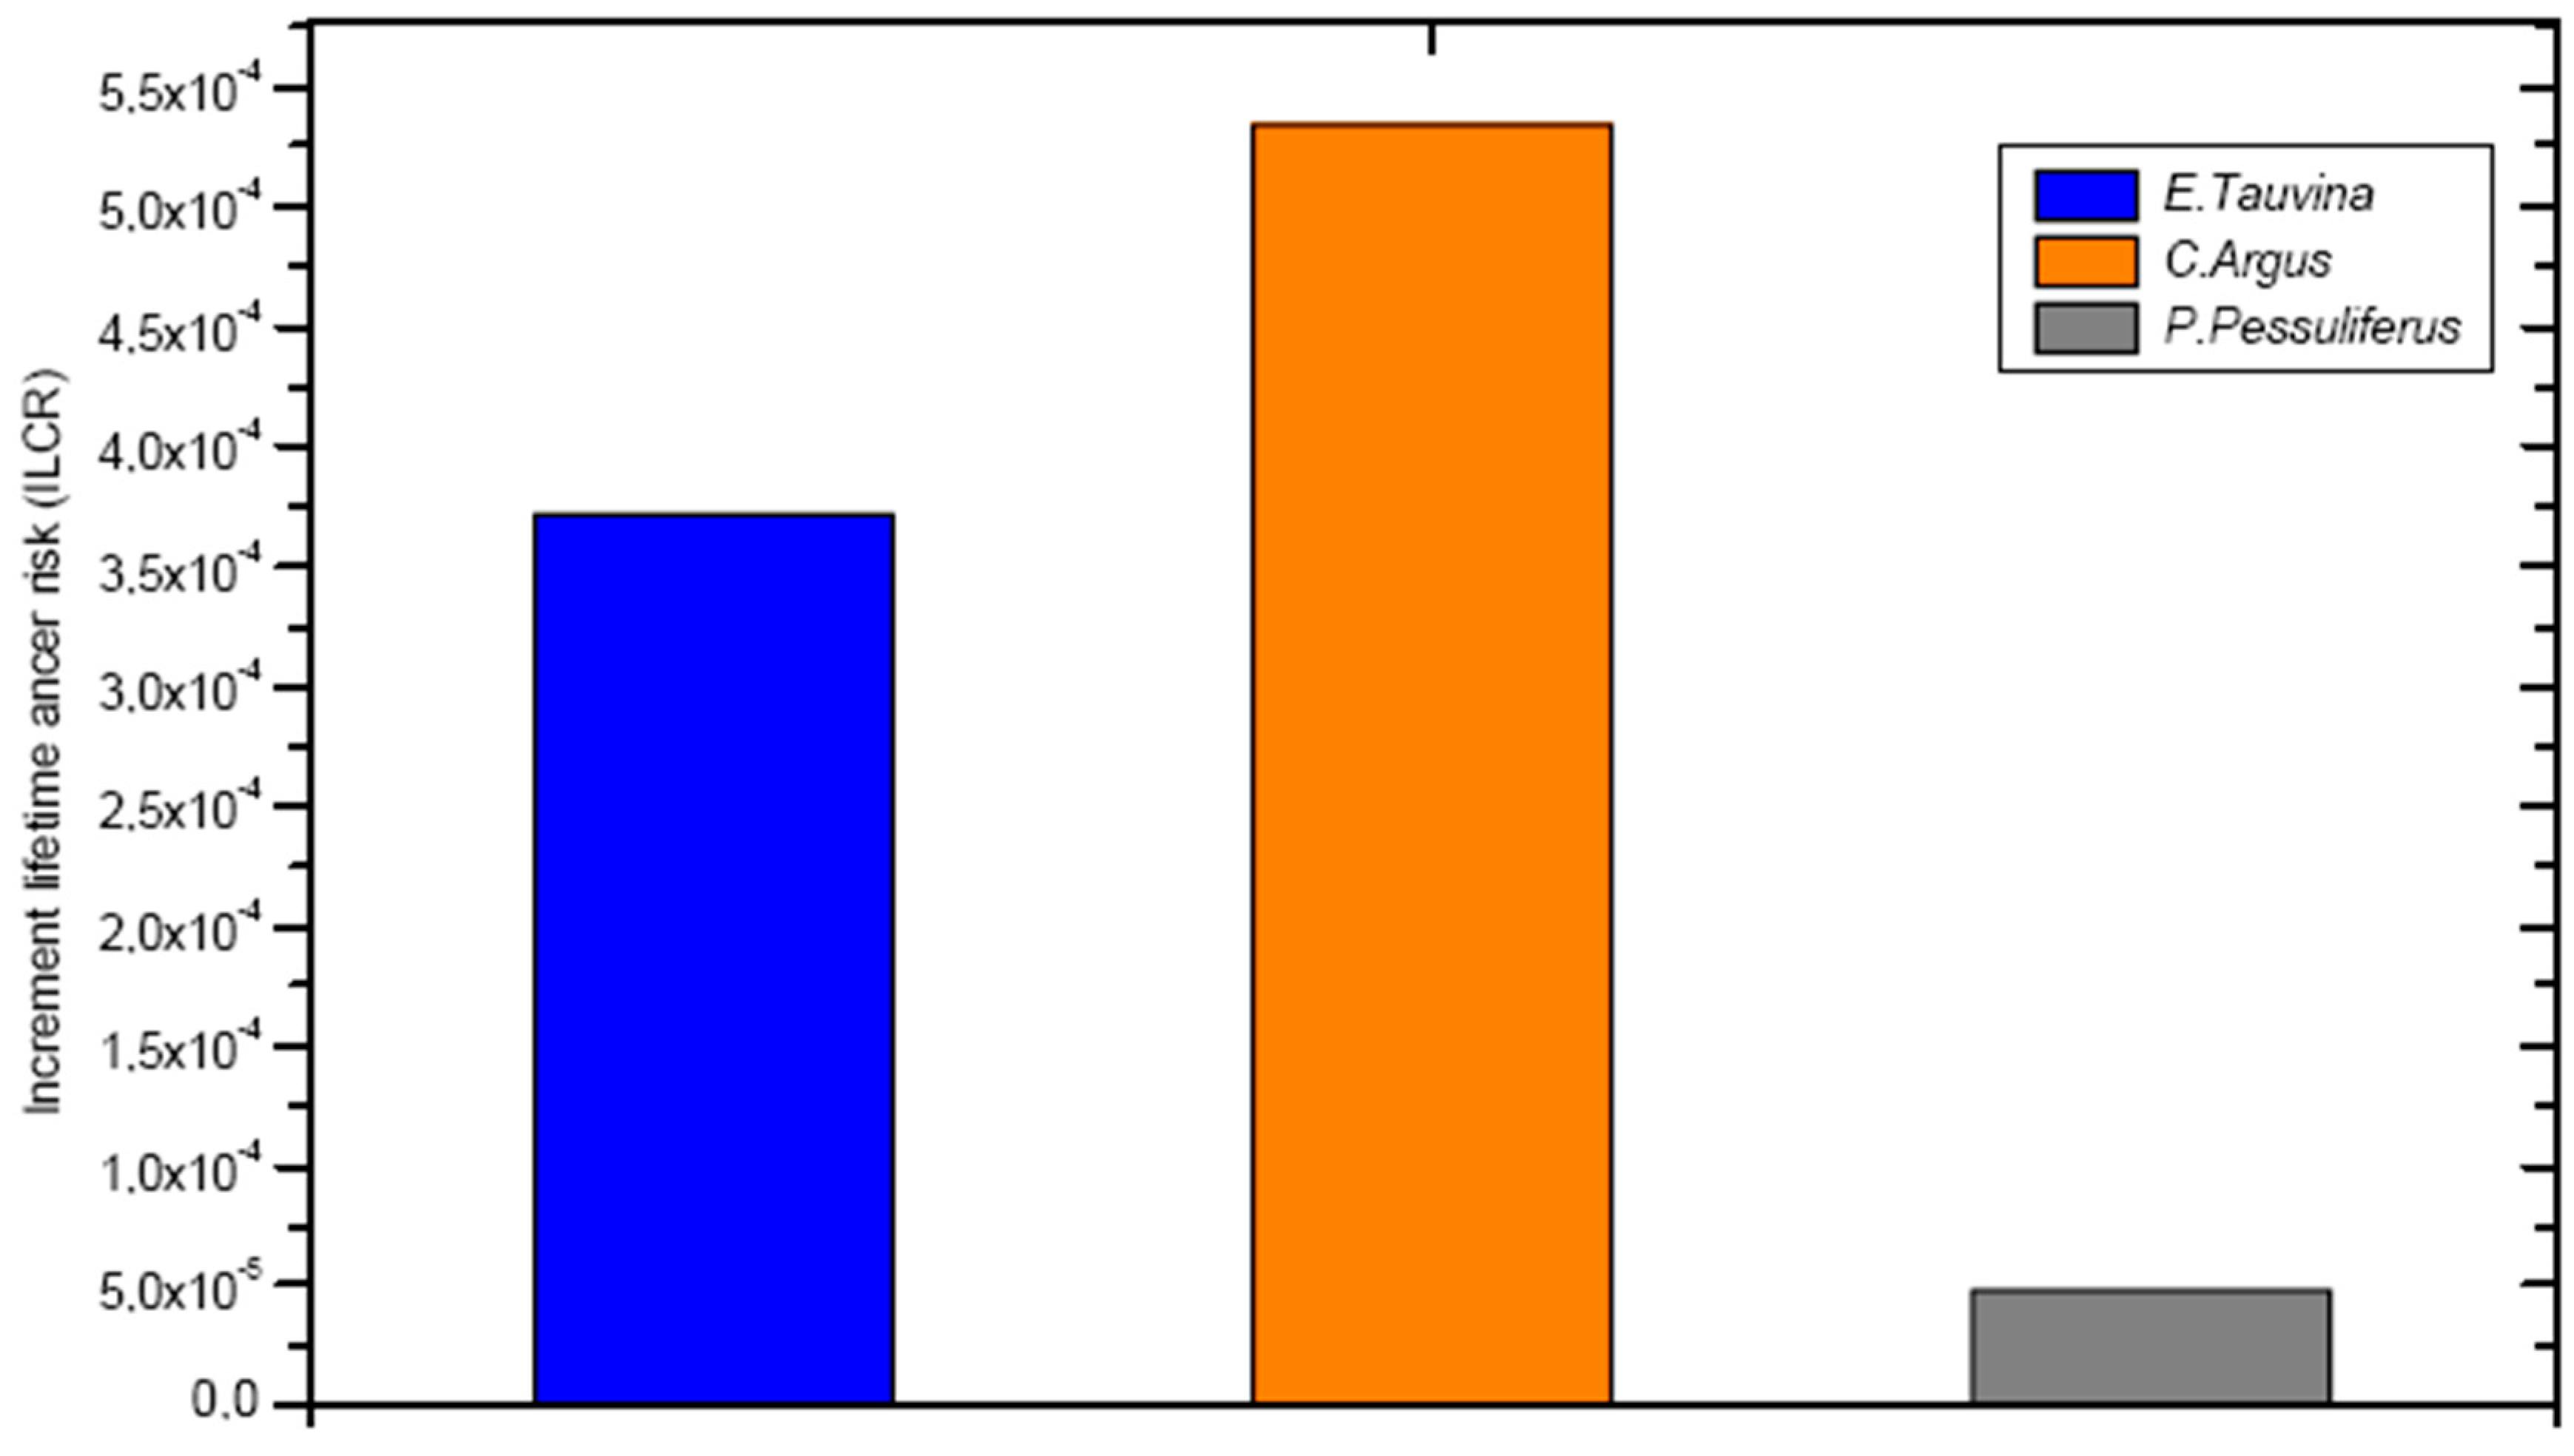
3.5.3. Incremental Lifetime Cancer Risk (ILCR)

To assess the potential cancer risks to Saudi adults exposed to endemic fish-bound PAHs over a life expectancy of 70 years, the ILCR of the individual PAH compound concentrations in the three endemic fishes through ingestion (ILCingesion) was estimated (Figure 3 and Figure 4), based on the toxic equivalent of BaP (TEF) and cancer slope factor (CSF). An ILCR value of 10−6 indicates virtual safety, a value of 10−6 to 10−4 suggests potential risk, and a value of more than 10−4 suggests a potential high risk [99,100].
BbF, BkF, BaP, DahA, and BPY showed high ILCR values compared to the other PAH compounds in the three endemic fish species based on the ILCR values calculated from individual exposure. In addition, the values of ILC of the individual and total PAHs were between 10−6 and 10−4, indicating potential carcinogenic risk (Figure 3 and Figure 4).
As shown in Figure 4, the values of ILCR for the three species were estimated to be 2.40 × 10⁻⁵, 1.86 × 10⁻⁴, and 2.67 × 10⁻⁴, respectively, for P. pessuliferus, E. tauvina, and C. argus. The ILCR values were higher than 10−5, indicating a potential cancer risk in the Saudi population living in Jeddah from exposure to lifetime consumption of the investigated endemic fishes (Figure 3).

3.6. Multivariate Analysis

Statistical analyses, including Pearson product-moment correlation analysis, factor analysis and principal component analysis, and normality tests, were performed on the average results obtained for petroleum hydrocarbons, lipids, amino acid, and PAHs in the three fish species to determine the relationship between the parameters and the possible sources of contamination or alteration in the amino acids composition.

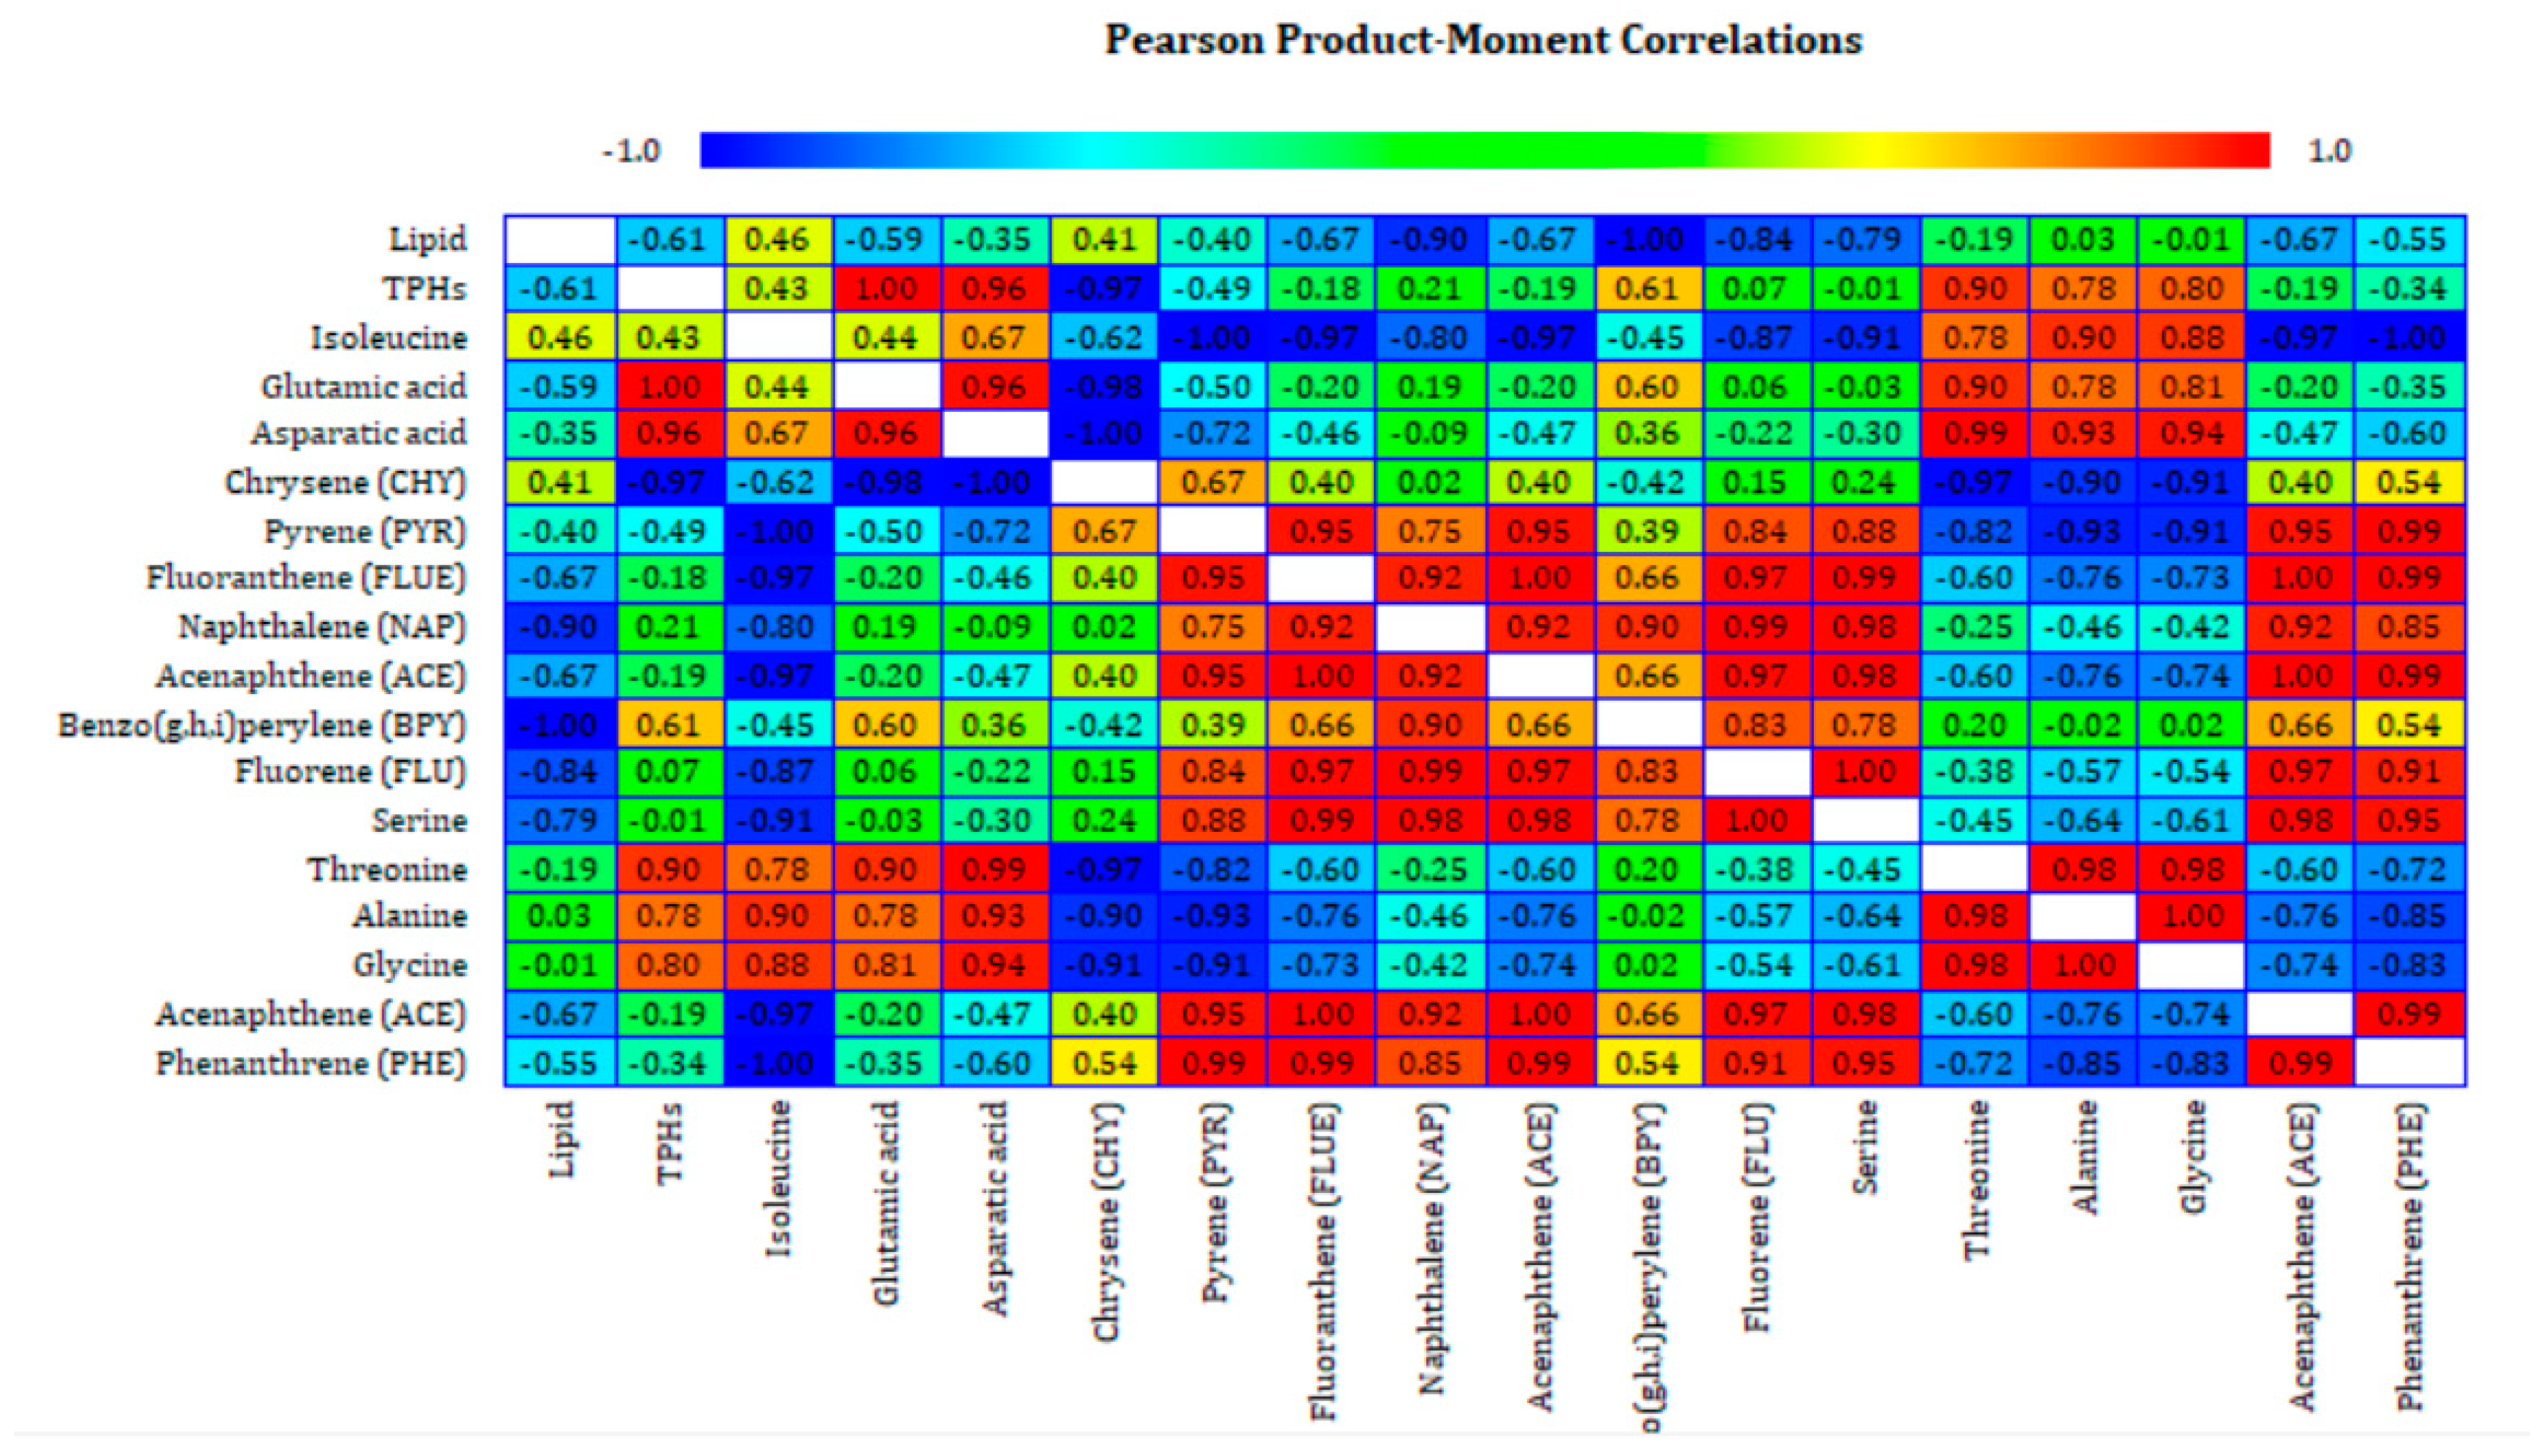
3.6.1. Pearson and Spearman Correlation Analysis

The Pearson correlation describes both the forcefulness and the direction of the relationship that subsists between two variables measured on at least an interval scale.
A high negative correlation was found between lipids and benzo(g,h,i)perylene (−1.00), naphthalene (−0.90), and fluorene (−0.84) (Figure 5), indicating that these compounds have a high ability to accumulate in the three fish species. The results are consistent with those obtained by Jafarabadi et al. [87] and Yu et al. [90]. The Spearman coefficients between each pair of variables, including lipids, TPHs, and the most significant PAHs compound, are given in Table 10. The only pair of variables with p-values below 0.05, indicating significant non-zero correlation at the 95.0% confidence level, is the pair (lipid, benzo(g,h,i)perylene).
On the other hand, chrysene showed a high negative correlation with aspartic acid (−1.0), glutamic acid (−0.98), and tyrosine (−1.0) (Figure 5). Among the three pairs of variables, (aspartic acid, chrysene (CHY)) and (tyrosine and chrysene (CHY)) had p-values below 0.05 (Table S1).
The information provided by the table in Figure 5, based on the correlations between pairs of variables, including amino acids, TPHs, and PAHs, can be used to assess the physiological condition of organisms living in polluted areas. As shown in Figure 5, isoleucine presented a high correlation with pyrene, benzo(b)fluoranthene (BbF), and dibenzo(a,h)anthracene (DahA) at the 95.0% confidence level. Although the pairs of variables involving serine, threonine, alanine, and glycine showed high correlation coefficients with some PAHs (>0.9), such as phenanthrene, chrysene, fluorene, and acenaphthene, all p-values were higher than 0.05. To avoid these discrepancies, Sokolowski et al. [50] chose to use the ratio of amino acids as indicators of stress.

3.6.2. Factor Analysis

We performed factor analysis on 10 variables that may provide information about the marine biota selected from Table S1 (Supplementary Material) to trim down the number of variables and determine the potential relationships between them. This method is similar to the principal components, except that the factor weights were scaled. In this case, two weight factors were extracted with a percentage variance of 66.369% and 33.631%, respectively, covering a cumulative percentage of 100% (Table 11).
Factor 1 showed a high factor score for aspartic acid, glutamic acid, tyrosine, chrysene (CHY), and TPHs, which can be used to infer destabilization of lysosomal membranes. Factor 2 showed a high factor score for lipid and benzo(g,h,i)perylene (BPY) (Table 12 and Table 13), which could be attributed to bioaccumulation (Figure 5).

3.6.3. Principal Component Analysis

Principal component analysis (PCA) was applied to reduce dimensionality and select the most important parameters of fish species (Table 11). The principal components extracted explained 66.4% and 33.6% of the total sample variance, respectively.
The first and second principal components have the following equations, respectively:
PC1 = −0.294805 ∗ Pyrene (PYR) − 0.295941 ∗ Dibenzo(a,h)anthracene (DahA) − 0.291803 ∗ Benzo(b)fluoranthene (BbF) − 0.384881 ∗ Chrysene (CHY) − 0.11316 ∗ Lipid + 0.116533 ∗ Benzo(g,h,i)perylene (BPY) + 0.363887 ∗ TPHs + 0.387495 ∗ Aspartic acid + 0.365784 ∗ Glutamic acid + 0.386624 ∗ Tyrosine
PC2 = 0.354727 ∗ Pyrene (PYR) + 0.352857 ∗ Dibenzo(a,h)anthracene (DahA) + 0.359594 ∗ Benzo(b)fluoranthene (BbF) − 0.070807 ∗ Chrysene (CHY) − 0.521604 ∗ Lipid + 0.520136 ∗ Benzo(g,h,i)perylene (BPY) + 0.189828 ∗ TPHs + 0.032078 ∗ Aspartic acid + 0.182492 ∗ Glutamic acid + 0.0485785 ∗ Tyrosine
Variables such as TPHs, aspartic acid, glutamic acid, and tyrosine have the highest correlations in PC1, which accounts for about 66.4% of the total variance. On the other hand, pyrene (PYR), dibenzo(a,h)anthracene (DahA), and benzo(b)fluoranthene (BbF) have the highest correlations values in PC2, and represents 33.6% of the variance (Figure 5). In Plectropomus pessuliferus, non-essential amino acids are preponderant.
They are believed to be the result of destabilization of the lysosomal membranes due to its exposure to polycyclic aromatic hydrocarbons unlike the two other species, including Cephalopholis argus and Epinephelus tauvina.

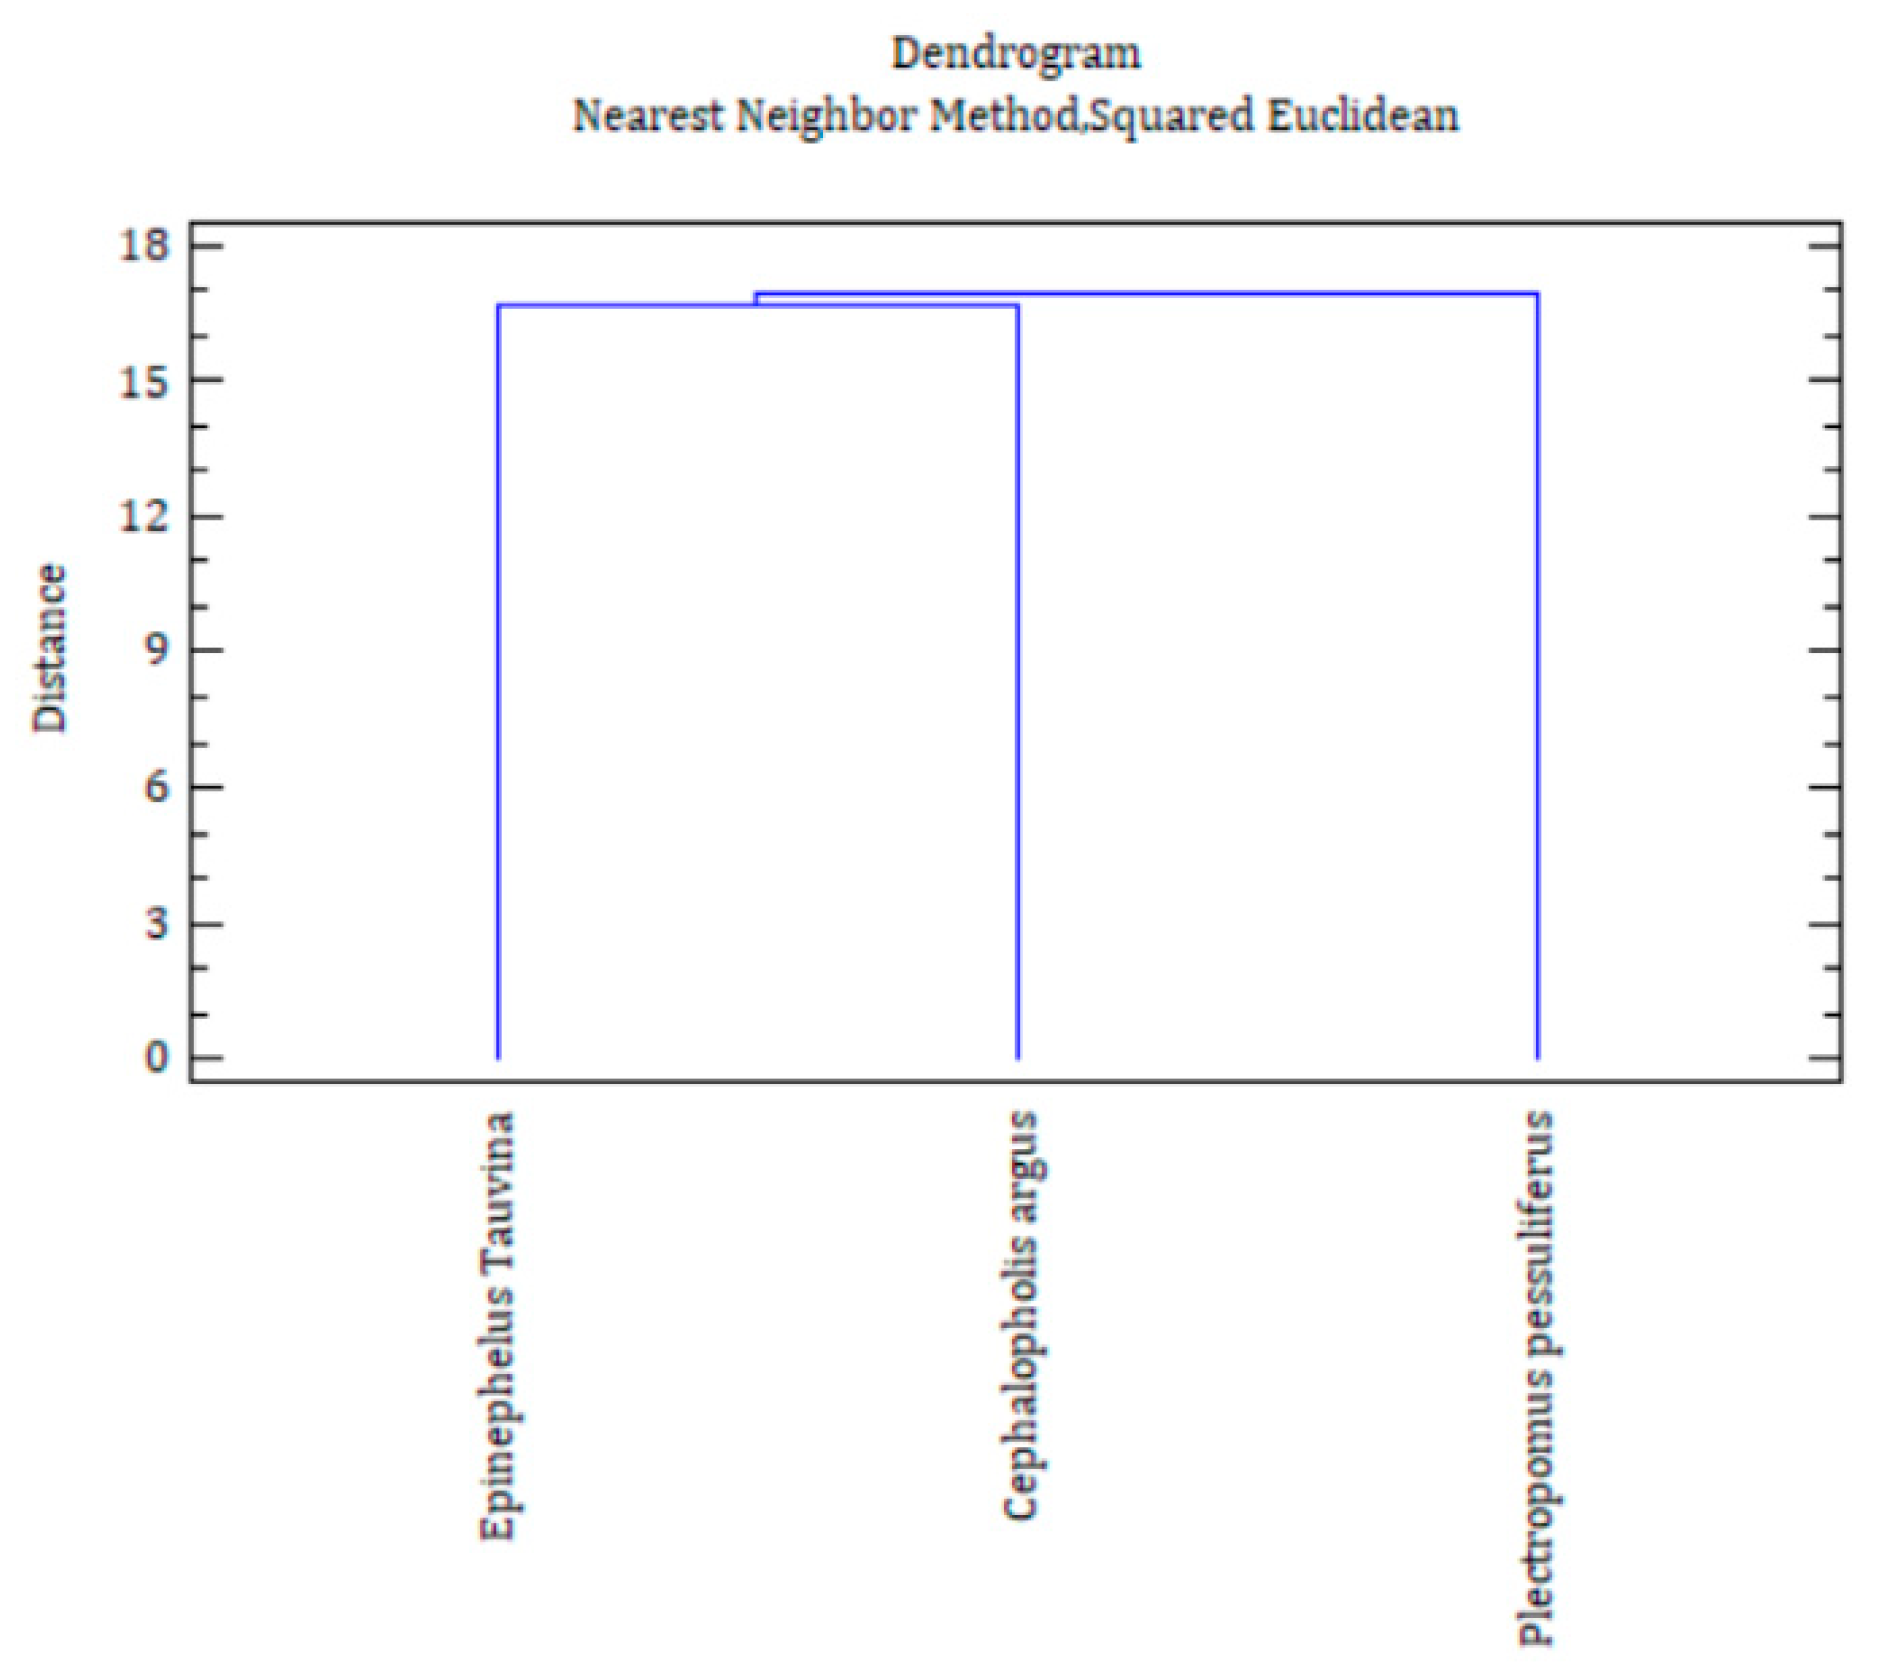
3.6.4. Cluster Analysis

By combining the clustering results with information from the analysis of PAHs interacting with lipids and amino acids, we identified fish species that resulted in the formation of these clusters.
Figure 6 shows a dendrogram (two charts). From these charts, it is possible to see that Plectropomus pessuferus would form an independent cluster and Epinephelus tauvina and Cephalopholus argus would form one cluster.
The assignments of the clusters with the parameters according to their possible pollution sources are given in Table 14.

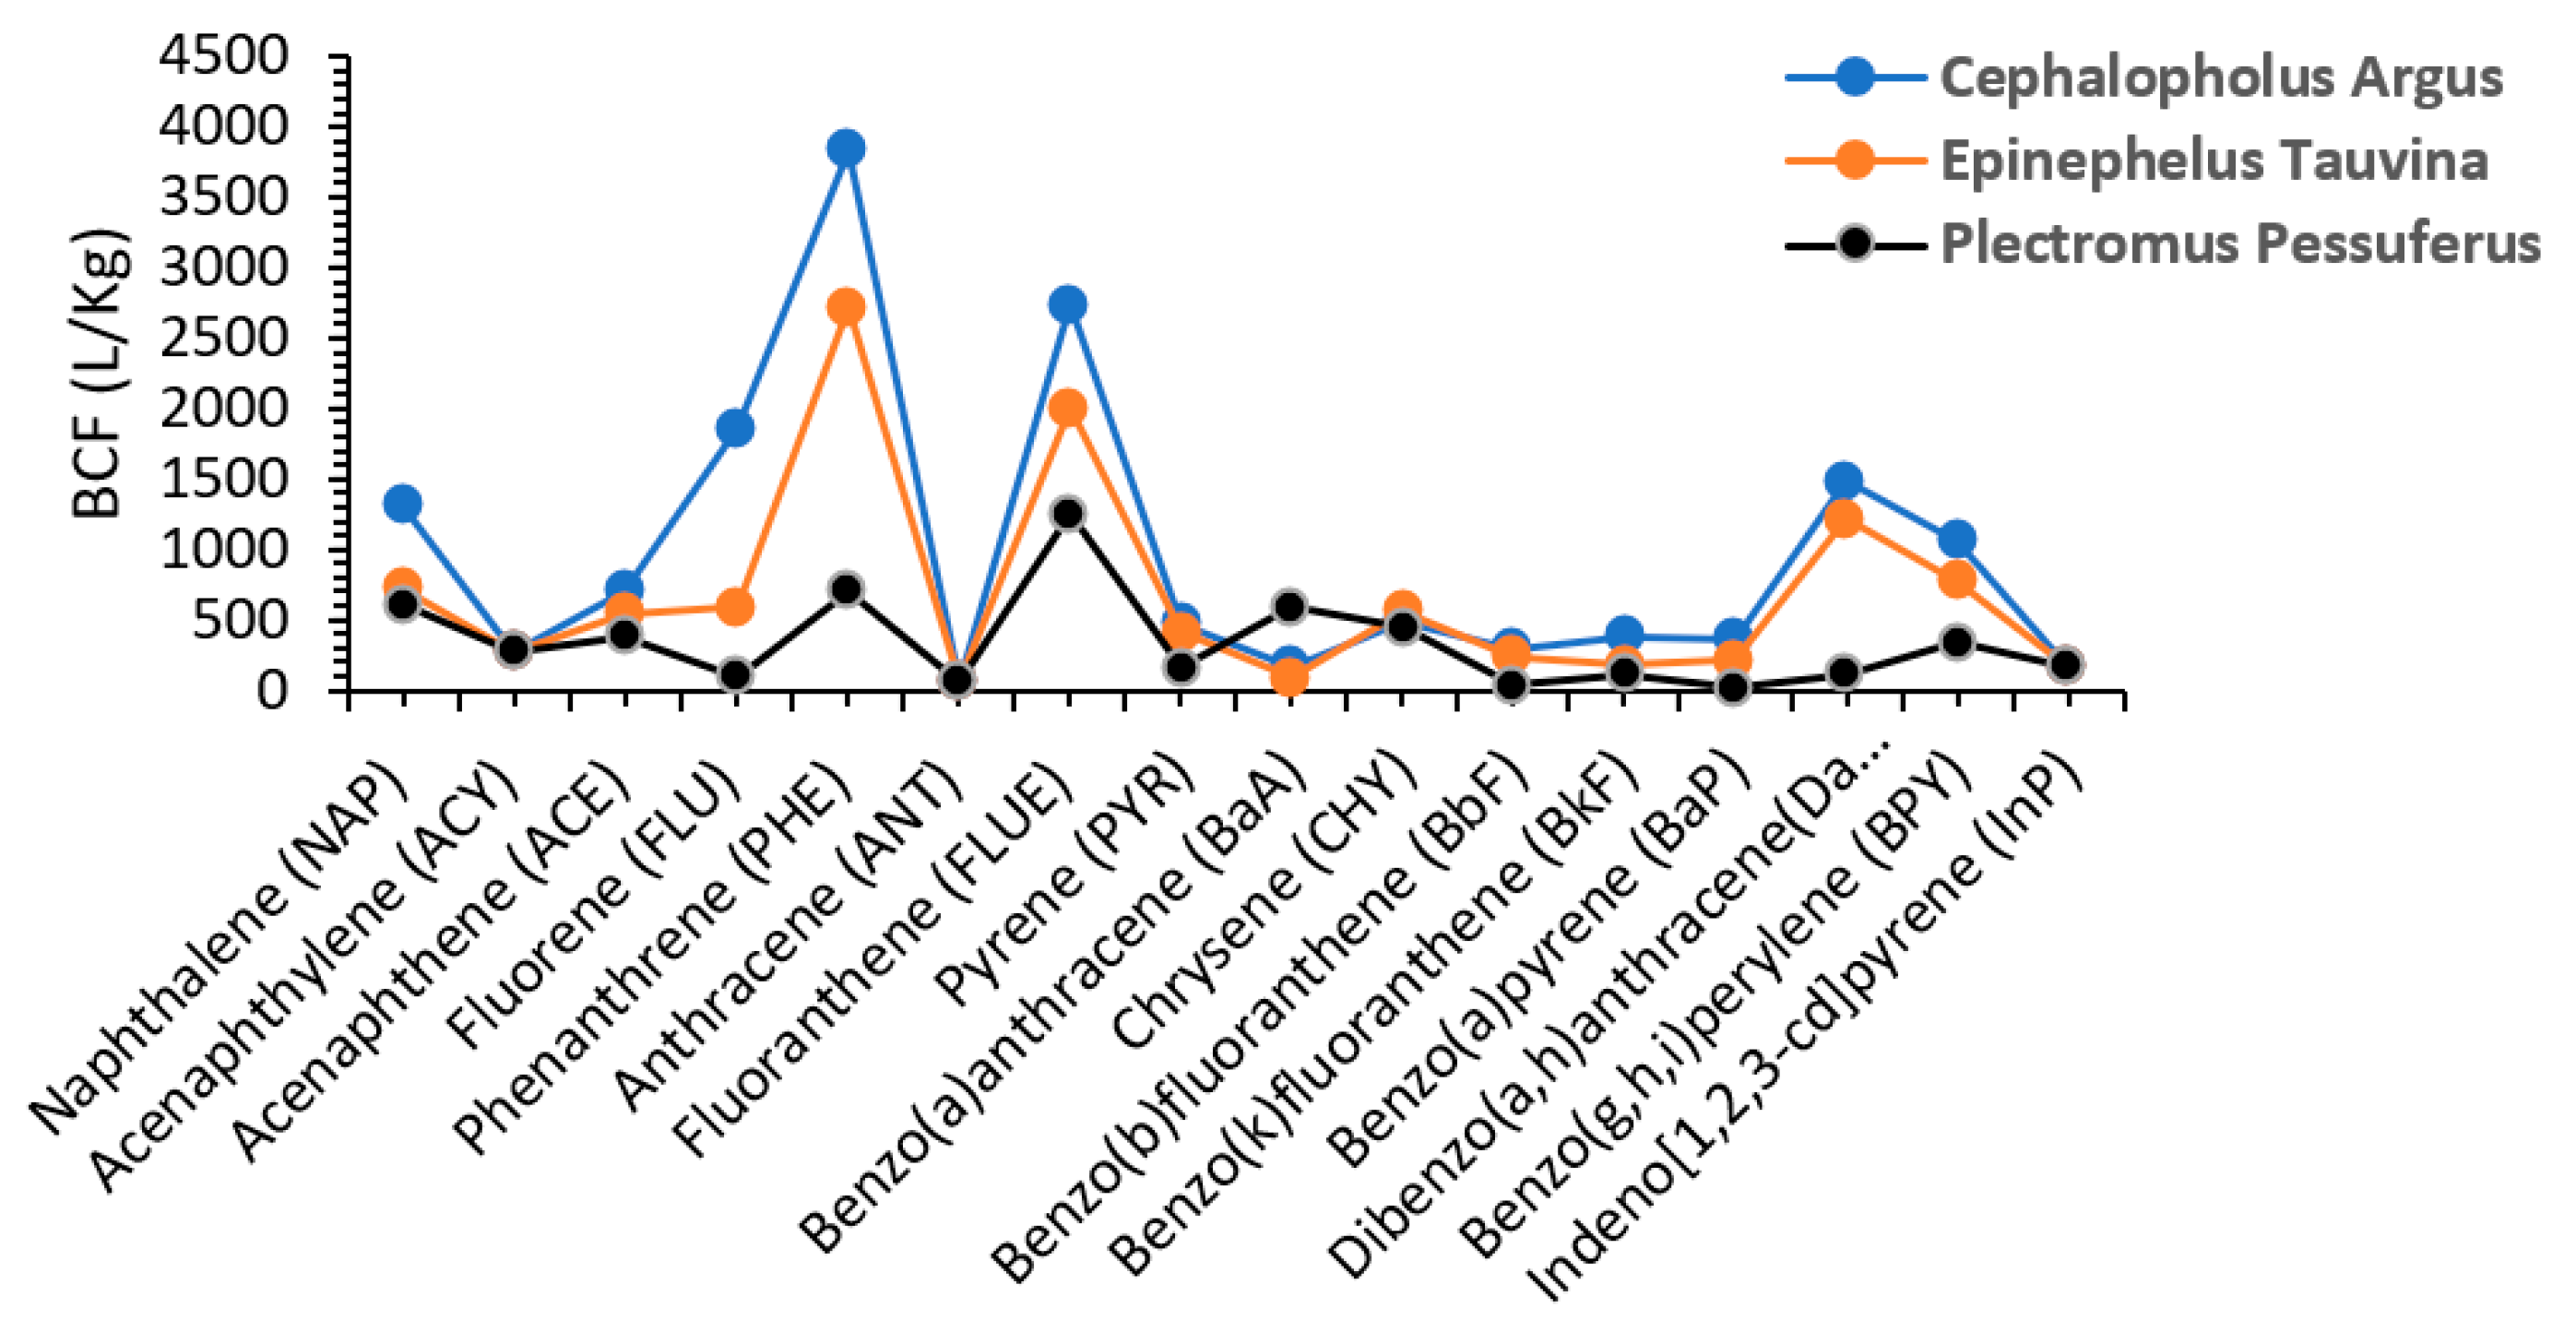
3.7. Bioconcentration Factor (BCF) and Bioaccumulation

According to Regulations (EC) N0 1272/2013 (starting 27 December 2015) (REACH) and the Toxic Substances Control Act (TSCA), polycyclic aromatic hydrocarbons are classified as ‘bioaccumulative’ if their BCF ranges between 1000 and 5000 and ‘very bioaccumulative’ if their BCF exceeds 5000 (Table 15).
According to the regulatory acts, phenanthrene and fluoranthene are ‘bioaccumulative’ (BCF ≥ 2000) in Cephalopholus argus and Epinephelus tauvina but not in Plectropomus pessuferus, whose BCF value is 1250. Fluoranthene is considered bioaccumulative according to TSCA but not phenanthrene, which has a BCF value below 1000 (Table 15 and Figure 7). These results corroborate the cluster analysis, which showed that the two species Epinephelus tauvina and Cephalopholus argus form a single group independent of that of Plectropomus pessuferus. As shown in Figure 7, the BCF values for naphthalene, acenaphthene, acenaphthylene, and fluorene in the three species are lower than 2000, most likely because these compounds are metabolized and excreted. Benzo(a)anthracene, benzo[a]pyrene, benzo[b]fluoranthene, chrysene, and benzo[k]fluoranthene, with BCFs < 500, are all likely to undergo biotransformation in the three studied species. This may explain the non-accumulation of these compounds in these fishes.
In accordance with the US Environmental Protection Agency’s Toxic Substances Control Act (TSCA) regulations, dibenzo(a,h)anthracene is considered bioaccumulative in Cephalopholus argus and Epinephelus tauvina (BCF > 1000). The BCF values for benzo(g,h,i)perylene were less than the lower values allowed by the classification (Table 15 and Figure 7) for the two species Epinephelus tauvina and Plectromus pessuferus (BCF < 700) but higher than 1000 for Cephalopholus argus.
In risk assessment, the degree of bioaccumulation of a compound is an important criterion. Bioaccumulation of trace organic contaminants such as PAHs is largely governed by simple physicochemical processes, which are largely dependent on the partitioning of contaminants between aqueous and nonaqueous phases. A correlation between an organic contaminant’s water-soluble content and its uptake by aquatic organisms illustrates this relationship. Generally, the BCF increases with increasing chemical hydrophobicity because of the increased tendency of the chemical to partition into the animal’s lipids rather than remaining dissolved in the aqueous solution [101,102]. PAHs with an increased molecular weight tend to decrease water solubilization and increase lipophilicity [103].
As a general rule, a high log Kow (n-octanol/water partition coefficient) indicates low water affinity and high hydrophobicity. The bioaccumulation rate is higher in compounds with log Kow > 4.5. Amongst the studied PAHs, four compounds (phenanthrene, fluoranthene, dibenzoa,h,i anthracene, and benzoacetone) had log Kow values greater than 4.5 [104]. PAHs can reach aquatic ecosystems and aquatic organisms through the effects of bioconcentration, bioaccumulation, and the food chain, which may endanger human health.

4. Conclusions

In this work, we investigated whether the endemic coral fish commonly consumed by Jeddah residents can serve as a bioindicator for petroleum hydrocarbons contamination. According to a multivariate analysis approach, the results allowed us to demonstrate that the concentrations of TPHs, PAHs, and metabolites were related to the species of coral fishes. Moreover, this study suggests that Jeddah seawater could be an important source of persistent organic pollutants (POPs) bioaccumulation in endemic fish, such as pyrene (PYR), chrysene (CHY), and benzo(g,h,i)perylene (BPY). This study showed that the distribution percentages of compounds with three cycles and four to five cycles are in reverse order in the species Epinephelus tauvina compared to the two other studied species. The cluster study highlights the importance of the identification of pollutants or expressed metabolites in the muscle of each species chosen as a bioindicator to trace pollution in the region. Furthermore, the bioconcentration factor (BCF) estimated in the studied species was used to validate the results obtained from the multivariate analysis of the interactions between PAHs, lipids, amino acids, and THPs. The high sensitivity of endemic fishes to some aromatic compounds through alterations in the amino acids composition can be used as a pollution tracer. Based on the benzo[a]pyrene equivalent (B[a]Pequi) calculations, the total carcinogenic activity (TCA) for total PAHs represents 29.47% (E. tauvina), 30.23%, (C. argus), and 19.78% (P. pessuliferus) of the total PAH concentrations. BaP and DahA were the most dominant compounds contributing to the TCA, suggesting the importance of BaP and DahA as surrogate compounds for PAHs in endemic fishes. The incremental lifetime cancer risk (ILCR) values for the three endemic fishes exceeded the limit (>10−5), indicating a high potential cancer risk in the Saudi population. Therefore, Epinephelus tauvina, Cephalopholis argus, and Plectropomus pessuferus can be adopted as bioindicators of various hydrocarbons even at trace levels and respond to the growing demands of environmental monitoring.

Supplementary Materials

The following supporting information can be downloaded at: https://www.mdpi.com/article/10.3390/w14111706/s1, Table S1: Spearman Rank Correlations (n = 3) between amino acids, TPHs and the most significant PAH compounds.

Author Contributions

Conceptualization, B.J. and R.C.; methodology, B.J. and R.C.; validation, B.J.; formal analysis, B.A.-M.; investigation, data analysis, interpretation of experimental results, and original draft writing were carried out according to their specialties by B.J., R.C. and B.A.-M.; writing—review and editing, B.J. and R.C.; supervision and project administration, B.J.; funding acquisition, B.J. All authors have read and agreed to the published version of the manuscript.

Funding

This research was funded by the DEANSHIP OF SCIENTIFIC RESEARCH (DSR), KING ABDULAZIZ UNIVERSITY, JEDDAH, grant number D-158-155-1441.

Data Availability Statement

Not applicable.

Acknowledgments

This project was funded by the Deanship of Scientific Research (DSR), King Abdulaziz University, Jeddah, under the grant No. (D-158-155-1441). The authors gratefully acknowledge Deanship of Scientific Research (DSR), King Abdulaziz University, for technical and financial support.

Conflicts of Interest

The authors declare no conflict of interest.

References

  1. Ashraf, W.; Mian, A. Total Petroleum Hydrocarbon Burden in Fish Tissues from the Arabian Gulf. Toxicol. Environ. Chem. 2010, 92, 61–66. [Google Scholar] [CrossRef]
  2. Al-Mur, B.A. Assessing the Ecological Risks from Hydrocarbons in the Marine Coastal Sediments of Jeddah, Red Sea. Environ. Monit. Assess. 2019, 191, 180. [Google Scholar] [CrossRef]
  3. European Food Safety Authority (EFSA). Polycyclic Aromatic Hydrocarbons in Food-Scientific Opinion of the Panel on Contaminants in the Food Chain. EFSA J. 2008, 6, 724. [Google Scholar] [CrossRef]
  4. Polycyclic, S.N. Some Non-Heterocyclic Polycyclic Aromatic Hydrocarbons and Some Related Exposures. IARC Monogr. Eval. Carcinog. Risks Hum. 2010, 92, 853. [Google Scholar]
  5. European Chemicals Agency. Member State Committee Support Document for Identification of Benzo[def]chrysene (benzo[a]pyrene) as a Substance of very High Concern Because of its Carcinogenic (Article 57 A), Mutagenic (Article 57 b), Toxic for Reproduction (Article 57 c), Persistent, Bioaccumulative, and Toxic (PBT) (Article 57 d) and Very Persistent and Very Bioaccumulative (Article 57 E) Properties. Adopted on 27 May 2016. Available online: http://echa.europa.eu/documents/10162/985e117f-38e2-4d45-9d0c-94413dd0462e (accessed on 23 May 2022).
  6. Roubal, W.T.; Collier, T.K. Spin-Labeling Techniques for Studying Mode of Action of Petroleum Hydrocarbons on Marine Organisms. Fish. Bull. 1975, 73, 2. [Google Scholar]
  7. Li, Y.; Zou, X.; Zou, S.; Li, P.; Yang, Y.; Wang, J. Pollution status and trophic transfer of polycyclic aromatic hydrocarbons in coral reef ecosystems of the South China Sea. ICES J. Mar. Sci. 2021, 78, 2053–2064. [Google Scholar] [CrossRef]
  8. Moore, M.N.; Livingstone, D.R.; Widdows, J.; Lowe, D.M.; Pipe, R.K. Molecular, cellular and physiological effects of oil-derived hydrocarbons on molluscs and their use in impact assessment. Philos. Trans. R. Soc. B Biol. Sci. 1987, 316, 603–623. [Google Scholar]
  9. Neff, J.M. Polycyclic Aromatic Hydrocarbons in the Aquatic Environment. Biol. Conserv. 1980, 18, 212–233. [Google Scholar]
  10. Vandermeulen, J.H.; Foda, A.; Stuttard, C. Toxicity vs. Mutagenicity of Some Crude Oils, Distillates and Their Water Soluble Fractions. Water Res. 1985, 19, 1283–1289. [Google Scholar] [CrossRef]
  11. Varanasi, U.; Malins, D.C. Metabolism of Petroleum Hydrocarbons: Accumulation and Biotransformation in Marine Organisms. In Biological Effects; Elsevier: Amsterdam, The Netherlands, 1977; pp. 175–270. [Google Scholar]
  12. Viarengo, A.; Moore, M.N.; Pertica, M.; Mancinelli, G.; Accomando, R. A simple procedure for evaluating the protein degradation rate in mussel (Mytilus galloprovincialis L.) tissues and its application in a study of phenanthrene effects on protein catabolism. Comp. Biochem. Physiol. B Comp. Biochem. 1992, 103, 27–32. [Google Scholar] [CrossRef]
  13. Burger, J.; Gochfeld, M.; Batang, Z.; Alikunhi, N.; Al-Jahdali, R.; Al-Jebreen, D.; Aziz, M.A.M.; Al-Suwailem, A. Fish Consumption Behavior and Rates in Native and Non-Native People in Saudi Arabia. Environ. Res. 2014, 133, 141–148. [Google Scholar] [CrossRef] [Green Version]
  14. Li, Y.; Wang, C.; Zou, X.; Feng, Z.; Yao, Y.; Wang, T.; Zhang, C. Occurrence of Polycyclic Aromatic Hydrocarbons (PAHs) in Coral Reef Fish from the South China Sea. Mar. Pollut. Bull. 2019, 139, 339–345. [Google Scholar] [CrossRef]
  15. Fisher, S.W. Mechanisms of Bioaccumulation in Aquatic Systems. Rev. Environ. Contam. Toxicol. 1995, 4, 87–117. [Google Scholar] [CrossRef]
  16. Sheedy, B.R.; Mattson, V.R.; Cox, J.S.; Kosian, P.A.; Phipps, G.L.; Ankley, G.T. Bioconcentration of Polycyclic Aromatic Hydrocarbons by the Freshwater Oligochaete Lumbriculus Variegatus. Chemosphere 1998, 36, 3061–3070. [Google Scholar] [CrossRef]
  17. Groupers of the World (Family Serranidae, Subfamily Epinephelinae). FAO Species Catalogue. An Annotated and Illustrated Catalogue of the Grouper, Rockcod, Hind, Coral Grouper and Lyretail Species Known to Date. Volume 16. Available online: https://www.fao.org/documents/card/fr/c/9d54666b-08d2-522c-b593-229651cddc7f/ (accessed on 9 April 2022).
  18. Kanzari, F.; Syakti, A.D.; Asia, L.; Malleret, L.; Mille, G.; Jamoussi, B.; Abderrabba, M.; Doumenq, P. Aliphatic Hydrocarbons, Polycyclic Aromatic Hydrocarbons, Polychlorinated Biphenyls, Organochlorine, and Organophosphorous Pesticides in Surface Sediments from the Arc River and the Berre Lagoon, France. Environ. Sci. Pollut. Res. 2012, 19, 559–576. [Google Scholar] [CrossRef]
  19. Schuster, R.; Apfel, A. Hewlett-Packard App, Note, Pub. 1986; 5954–6257.
  20. Schuster, R. Determination of Amino Acids in Biological, Pharmaceutical, Plant and Food Samples by Automated Precolumn Derivatization and High-Performance Liquid Chromatography. J. Chromatogr. B Biomed. Sci. Appl. 1988, 431, 271–284. [Google Scholar] [CrossRef]
  21. Godel, H.; Seitz, P.; Verhoef, M. Automated Amino Acid Analysis Using Combined OPA and FMOC-Cl Precolumn Derivatization. LC-GC Int. 1992, 5, 44–49. [Google Scholar]
  22. Henderson, J.W.; Ricker, R.D.; Bidlingmeyer, B.A.; Woodward, C. Rapid, Accurate, Sensitive, and Reproducible HPLC Analysis of Amino Acids. Amino Acid Anal. Using Zorbax Eclipse-AAA Columns Agil. 2000, 1100, 1–10. [Google Scholar]
  23. Woodward, C.; Henderson, J.W., Jr.; Wielgos, T. High-Speed Amino Acid Analysis (AAA) on Sub-Two Micron Reversed-Phase (RP) Columns. Agil. Pub 2010. [Google Scholar]
  24. Gratzfeld-Huesgen, A. Sensitive and Reliable Amino Acid Analysis in Protein Hydrolysates Using the Agilent 1100 Series HPLC. Tech. Note Agil. Technol. 1999, 5958, 5968. Available online: https://gimitec.com/sites/default/files/59685658.pdf (accessed on 25 May 2022).
  25. Greene, J.; Henderson, J.W., Jr.; Wikswo, J.P. Rapid and Precise Determination of Cellular Amino Acid Flux Rates Using HPLC with Automated Derivatization with Absorbance Detection. Agil. Technol. 2009, 1–8. [Google Scholar]
  26. Liu, H. Measurement of Blood Plasma Amino Acids in Ultrafiltrates by High-Performance Liquid Chromatography with Automatic Precolumn O-Phthaldialdehyde Derivatization. In Amino Acid Analysis Protocols (Methods in Molecular BiologyTM); Cooper, C., Packer, N., Williams, K., Eds.; Humana Press: Totowa, NJ, USA, 2000; pp. 123–140. [Google Scholar] [CrossRef]
  27. Jamoussi, B.; Kanzari, F.; Hassine, B.B.; Abderrabba, A. Using Bezier Curves for the Calculation of Retention Indices of Polycyclic Aromatic Hydrocarbons in the So-Called Lee’s Scale in Temperature-Programmed Gas Chromatography with Mass Spectrometry Detection. J. Chromatogr. Sci. 2007, 45, 22–27. [Google Scholar] [CrossRef] [PubMed] [Green Version]
  28. Geyer, H.J.; Rimkus, G.G.; Scheunert, I.; Kaune, A.; Schramm, K.-W.; Kettrup, A.; Zeeman, M.; Muir, D.C.; Hansen, L.G.; Mackay, D. Bioaccumulation and Occurrence of Endocrine-Disrupting Chemicals (EDCs), Persistent Organic Pollutants (POPs), and Other Organic Compounds in Fish and Other Organisms Including Humans. In Bioaccumulation–New Aspects and Developments; Springer: Berlin/Heidelberg, Germany, 2000; pp. 1–166. [Google Scholar]
  29. Nisbet, I.C.; Lagoy, P.K. Toxic Equivalency Factors (TEFs) for Polycyclic Aromatic Hydrocarbons (PAHs). Regul. Toxicol. Pharmacol. 1992, 16, 290–300. [Google Scholar] [CrossRef]
  30. United States Environmental Protection Agency. Risk Assessment Guidance for Superfund: Volume I—Human Health Evaluation Manual (Part B, Development of Risk-Based Preliminary Remediation Goals); United States Environmental Protection Agency: Washington, DC, USA, 1991; EPA/540/R-92/003. [Google Scholar]
  31. Pufulete, M.; Battershill, J.; Boobis, A.; Fielder, R. Approaches to Carcinogenic Risk Assessment for Poly-cyclic Aromatic Hydrocarbons: A UK Perspective. Regul. Toxicol. Pharmacol. 2004, 40, 54–66. [Google Scholar] [CrossRef]
  32. Pongpiachan, S. Incremental Lifetime Cancer Risk of PM 2.5 Bound Polycyclic Aromatic Hydrocarbons (PAHs) before and after the Wildland Fire Episode. Aerosol Air Qual. Res. 2016, 16, 2907–2919. [Google Scholar] [CrossRef] [Green Version]
  33. Joint FAO/WHO Expert Committee on Food Additives; World Health Organization. Evaluation of Certain Food Contaminants: Sixty-Fourth Report of the Joint FAO/WHO Expert Committee on Food Additives; World Health Organization: Geneva, Switzerland, 2006; Volume 64. [Google Scholar]
  34. Wu, W.-J.; Qin, N.; He, W.; He, Q.-S.; Ouyang, H.-L.; Xu, F.-L. Levels, Distribution, and Health Risks of Polycyclic Aromatic Hydrocarbons in Four Freshwater Edible Fish Species from the Beijing Market. Sci. World J. 2012, 2012, 156378. [Google Scholar] [CrossRef] [Green Version]
  35. Chen, C.W.; Chu, M.M. Dose-Response Analysis of Ingested Benzo (a) Pyrene (CAS No. 50-32-8); Environmental Protection Agency: Washington, DC, USA, 1991. [Google Scholar]
  36. United States Environmental Protection Agency. Drinking Water Criteria Document for Polycyclic Aromatic Hydrocarbons (PAH) (Final Draft, 1985); U.S. Environmental Protection Agency: Washington, DC, USA, 1991; ECAO-CIN-D010 (NTIS PB86117801).
  37. Peng, C.; Chen, W.; Liao, X.; Wang, M.; Ouyang, Z.; Jiao, W.; Bai, Y. Polycyclic Aromatic Hydrocarbons in Urban Soils of Beijing: Status, Sources, Distribution and Potential Risk. Environ. Pollut. 2011, 159, 802–808. [Google Scholar] [CrossRef]
  38. Akoto, O.; Bismark, E.F.; Darko, G.; Adei, E. Concentrations and Health Risk Assessments of Heavy Metals in Fish from the Fosu Lagoon. Int. J. Environ. Res. 2014, 8, 403–410. [Google Scholar]
  39. Moslen, M.; Miebaka, C.A. Heavy Metal Contamination in Fish (Callinectis amnicola) from an Estuarine Creek in the Niger Delta, Nigeria and Health Risk Evaluation. Bull. Environ. Contam. Toxicol. 2017, 99, 506–510. [Google Scholar] [CrossRef]
  40. Qu, C.; Qi, S.; Yang, D.; Huang, H.; Zhang, J.; Chen, W.; Yohannes, H.K.; Sandy, E.H.; Yang, J.; Xing, X. Risk Assessment and Influence Factors of Organochlorine Pesticides (OCPs) in Agricultural Soils of the Hill Region: A Case Study from Ningde, Southeast China. J. Geochem. Explor. 2015, 149, 43–51. [Google Scholar] [CrossRef]
  41. United States Environmental Protection Agency. Exposure Factors Handbook (1997, Final Report); United States Environmental Protection Agency: Washington, DC, USA. Available online: https://cfpub.epa.gov/ncea/risk/recordisplay.cfm?deid=12464 (accessed on 14 April 2022).
  42. Li, G.; Wu, S.; Wang, L.; Akoh, C.C. Concentration, Dietary Exposure and Health Risk Estimation of Polycyclic Aromatic Hydrocarbons (PAHs) in Youtiao, a Chinese Traditional Fried Food. Food Control 2016, 59, 328–336. [Google Scholar] [CrossRef]
  43. United States Environmental Protection Agency. Exposure Factors Handbook 2011 Edition (Final Report); United States Environmental Protection Agency: Washington, DC, USA. Available online: https://cfpub.epa.gov/ncea/risk/recordisplay.cfm?deid=236252 (accessed on 14 April 2022).
  44. Huang, T.; Guo, Q.; Tian, H.; Mao, X.; Ding, Z.; Zhang, G.; Li, J.; Ma, J.; Gao, H. Assessing Spatial Distribution, Sources, and Human Health Risk of Organochlorine Pesticide Residues in the Soils of Arid and Semiarid Areas of Northwest China. Environ. Sci. Pollut. Res. 2014, 21, 6124–6135. [Google Scholar] [CrossRef] [PubMed]
  45. Mohanty, B.; Mahanty, A.; Ganguly, S.; Sankar, T.V.; Chakraborty, K.; Rangasamy, A.; Paul, B.; Sarma, D.; Mathew, S.; Asha, K.K.; et al. Amino Acid Compositions of 27 Food Fishes and Their Importance in Clinical Nutrition. J. Amino Acids 2014, 2014, 269797. [Google Scholar] [CrossRef] [PubMed]
  46. Livingstone, D.R. Biochemical Measurements. In The Effects of Stress and Pollution on Marine Animals; Bayne, B.L., Brown, D.A., Burns, K., Dixon, D.R., Ivanovici, A., Livingstone, D.R., Lowe, D.M., Moore, M.N., Stebbing, A.R.D., Widdows, J., Eds.; Praeger: New York, NY, USA, 1985; pp. 81–132. [Google Scholar]
  47. Scholz, N. Significance of the Taurine-Glycine Ratio as an Indicator of Stress. Bull. Environ. Contam. Toxicol. 1987, 38, 15–21. [Google Scholar] [CrossRef]
  48. Hummel, H.; Amiard-Triquet, C.; Bachelet, G.; Desprez, M.; Marchand, J.; Sylvand, B.; Amiard, J.C.; Rybarczyk, H.; Bogaards, R.H.; Sinke, J.; et al. Free Amino Acids as a Biochemical Indicator of Stress in the Estuarine Bivalve Macoma Balthica. Sci. Total Environ. 1996, 188, 233–241. [Google Scholar] [CrossRef]
  49. Narvia, M.; Rantamaki, P. Aminotransferases in the Bivalve Mollusc Mytilus edulis, L. and Short Term Effects of Crude Oil in Brackish Water. Biomarkers 1997, 2, 253–258. [Google Scholar] [CrossRef]
  50. Sokolowski, A.; Wolowicz, M.; Hummel, H. Free Amino Acids in the Clam Macoma Balthica L. (Bivalvia, Mollusca) from Brackish Waters of the Southern Baltic Sea. Comp. Biochem. Physiol. Part A Mol. Integr. Physiol. 2003, 134, 579–592. [Google Scholar] [CrossRef]
  51. Zurburg, W.; Hummel, H.; Bogaards, R.; de Wolf, L.; Ravestein, H. Free amino acid concentrations in Mytilus edulis L. from different locations in the Southwestern part of The Netherlands: Their possible significance as a biochemical stress indicator. Comp. Biochem. Physiol. Part A Physiol. 1989, 93, 413–417. [Google Scholar] [CrossRef]
  52. Pranal, V.; Fiala-Médioni, A.; Colomines, C.J. Amino Acid and Related Compound Composition in Two Symbiotic Mytilid Species from Hydrothermal Vents. Mar. Ecol. Prog. Ser. 1995, 119, 155–166. [Google Scholar] [CrossRef] [Green Version]
  53. Duquesne, S.; Liess, M.; Bird, D.J. Sub-Lethal Effects of Metal Exposure: Physiological and Behavioural Responses of the Estuarine Bivalve Macoma Balthica. Mar. Environ. Res. 2004, 58, 245–250. [Google Scholar] [CrossRef]
  54. Moore, M.N.; Lowe, D.M.; Fieth, P.E.M. Lysosomal Responses to Experimentally Injected Anthracene in the Digestive Cells of Mytilus edulis. Mar. Biol. 1978, 48, 297–302. [Google Scholar] [CrossRef]
  55. Moore, M.N.; Clarke, K.R. Use of Microstereology and Quantitative Cytochemistry to Determine the Effects of Crude Oil-Derived Aromatic Hydrocarbons on Lysosomal Structure and Function in a Marine Bivalve Mollusc, Mytilus edulis. Histochem. J. 1982, 14, 713–718. [Google Scholar] [CrossRef]
  56. Moore, M.N.; Widdows, J.; Cleary, J.J.; Pipe, R.K.; Salkeld, P.N.; Donkin, P.; Farrar, S.V.; Evans, S.V.; Thomson, P.E. Responses of the Mussel Mytilus edulis to Copper and Phenanthrene: Interactive Effects. Mar. Environ. Res. 1984, 14, 167–183. [Google Scholar] [CrossRef]
  57. Moore, M.N.; Mayernik, J.A.; Giam, C.S. Lysosomal Responses to a Polynuclear Aromatic Hydrocarbon in a Marine Snail: Effects of Exposure to Phenanthrene and Recovery. Mar. Environ. Res. 1985, 17, 230–233. [Google Scholar] [CrossRef]
  58. Moore, M.N.; Pipe, R.K.; Farrar, S.V.; Thomson, S.; Donkin, P. Lysosomal and Microsomal Responses to Oil-Derived Hydrocarbons in Littorina littorea. Mar. Pollut. Bull. 1987, 13, 10. [Google Scholar]
  59. Tolosa, I.; De Mora, S.J.; Fowler, S.W.; Villeneuve, J.P.; Bartocci, J.; Cattini, C. Aliphatic and aromatic hydrocarbons in marine biota and coastal sediments from the Gulf and the Gulf of Oman. Mar. Pollut. Bull. 2005, 50, 1619–1633. [Google Scholar] [CrossRef]
  60. Turki, A. Distribution and Sources of Aliphatic Hydrocarbons in Surface Sediments of Al-Arbaeen Lagoon, Jeddah, Saudi Arabia. J. Fish. Livest. Prod. 2016, 4, 2. [Google Scholar] [CrossRef] [Green Version]
  61. Copat, C.; Brundo, M.V.; Arena, G.; Grasso, A.; Conti, G.O.; Ledda, C.; Fallico, R.; Sciacca, S.; Ferrante, M. Seasonal Variation of Bioaccumulation in Engraulis encrasicolus (Linneaus, 1758) and Related Biomarkers of Exposure. Ecotoxicol. Environ. Saf. 2012, 86, 31–37. [Google Scholar] [CrossRef]
  62. Wang, Z.; Yang, C.; Parrott, J.L.; Frank, R.A.; Yang, Z.; Brown, C.E.; Hollebone, B.P.; Landriault, M.; Fieldhouse, B.; Liu, Y.; et al. Forensic Source Differentiation of Petrogenic, Pyrogenic, and Biogenic Hydrocarbons in Canadian Oil Sands Environmental Samples. J. Hazard. Mater. 2014, 271, 166–177. [Google Scholar] [CrossRef]
  63. Sluka, R.; Reichenbach, N. Grouper Density and Diversity at Two Sites in the Republic of Maldives. Fac. Publ. Present. 1995, 438, 1–16. [Google Scholar]
  64. Farmer, N.A.; Ault, J.S. Grouper and Snapper Movements and Habitat Use in Dry Tortugas, Florida. Mar. Ecol. Prog. Ser. 2011, 433, 169–184. [Google Scholar] [CrossRef] [Green Version]
  65. Green, A.L.; Maypa, A.P.; Almany, G.R.; Rhodes, K.L.; Weeks, R.; Abesamis, R.A.; Gleason, M.G.; Mumby, P.J.; White, A.T. Larval Dispersal and Movement Patterns of Coral Reef Fishes, and Implications for Marine Reserve Network Design. Biol. Rev. 2015, 90, 1215–1247. [Google Scholar] [CrossRef]
  66. Kannan, K.; Perrotta, E. Polycyclic Aromatic Hydrocarbons (PAHs) in Livers of California Sea Otters. Chemosphere 2008, 71, 649–655. [Google Scholar] [CrossRef]
  67. Frapiccini, E.; Annibaldi, A.; Betti, M.; Polidori, P.; Truzzi, C.; Marini, M. Polycyclic Aromatic Hydrocarbon (PAH) Accumulation in Different Common Sole (Solea Solea) Tissues from the North Adriatic Sea Peculiar Impacted Area. Mar. Pollut. Bull. 2018, 137, 61–68. [Google Scholar] [CrossRef]
  68. Cheung, K.C.; Leung, H.M.; Kong, K.Y.; Wong, M.H. Residual Levels of DDTs and PAHs in Freshwater and Marine Fish from Hong Kong Markets and Their Health Risk Assessment. Chemosphere 2007, 66, 460–468. [Google Scholar] [CrossRef]
  69. Net, S.; Henry, F.; Rabodonirina, S.; Diop, M.; Merhaby, D.; Mahfouz, C.; Amara, R.; Ouddane, B. Accumulation of PAHs, Me-PAHs, PCBs and Total Mercury in Sediments and Marine Species in Coastal Areas of Dakar, Senegal: Contamination Level and Impact. Int. J. Environ. Res. 2015, 9, 419–432. [Google Scholar]
  70. Pruell, R.J.; Lake, J.L.; Davis, W.R.; Quinn, J.G. Uptake and Depuration of Organic Contaminants by Blue Mussels (Mytilus edulis) Exposed to Environmentally Contaminated Sediment. Mar. Biol. 1986, 9, 497–507. [Google Scholar] [CrossRef]
  71. Sun, R.-X.; Lin, Q.; Ke, C.-L.; Du, F.-Y.; Gu, Y.-G.; Cao, K.; Luo, X.-J.; Mai, B.-X. Polycyclic Aromatic Hydrocarbons in Surface Sediments and Marine Organisms from the Daya Bay, South China. Mar. Pollut. Bull. 2016, 103, 325–332. [Google Scholar] [CrossRef]
  72. Afifi, M.; Alkaladi, A.; Abu Zinada, O.A.; Couderchet, M. Alteration in Antioxidant Genes Expression in Some Fish Caught from Jeddah and Yanbu Coast as a Bio-Indicator of Oil Hydrocarbons Pollution. Saudi J. Biol. Sci. 2017, 24, 1580–1587. [Google Scholar] [CrossRef] [Green Version]
  73. Al-Saad, H.T.; Al-Ali, B.S.; Al-Anber, L.J.; Al-Khion, D.D.; Hantoush, A.A.; Saleh, S.M.; Alaial, A.H. Total Petroleum Hydrocarbon in Selected Fish of Shatt Al-Arab River, Iraq. Int. J. Mar. Sci. 2017, 7, 1–7. [Google Scholar] [CrossRef]
  74. Al-Ali, B.S.; Al-Bidhani, M.F.; Al-Khion, D.D.; Al-Nagar, G.A.; Al-Saad, H.T.; Khwadem, A.A.; Zeidan, A.M.; Mahdi, S.; Hantoush, A.A. Environmental Assessment of Petroleum Hydrocarbons in Fish Species from North-West Arabian Gulf. J. Pharm. Chem. Biol. Sci. 2016, 4, 126–134. [Google Scholar]
  75. Afifi, M.; Ali, H.A.; Saber, T.M.; El-Murr, A. elhakeem. Lethrinas Nebulosus Fish as a Biomarker for Petroleum Hydrocarbons Pollution in Red Sea: Alterations in Antioxidants MRNA Expression. Jpn. J. Vet. Res. 2016, 64 (Suppl. S2), S123–S129. [Google Scholar]
  76. Enuneku, A.A.; Ainerua, M.; Erhunmwunse, N.O.; Osakue, O.E. Total Petroleum Hydrocarbons in Organs of Commercially Available Fish; Trachurus trecae (Cadenat, 1949) from Oliha Market, Benin City, Nigeria. Ife J. Sci. 2015, 17, 383–393. [Google Scholar]
  77. Nozar, S.L.M.; Pauzi, M.Z.; Salarpouri, A.; Daghooghi, B.; Salimizadeh, M. Total Petroleum Hydrocarbons in Edible Marine Biota from Northern Persian Gulf. Environ. Monit. Assess. 2015, 187, 214. [Google Scholar] [CrossRef]
  78. Thomann, R.V.; Komlos, J. Model of Biota-Sediment Accumulation Factor for Polycyclic Aromatic Hydrocarbons. Environ. Toxicol. Chem. 1999, 18, 1060–1068. [Google Scholar] [CrossRef]
  79. Incardona, J.P.; Collier, T.K.; Scholz, N.L. Defects in Cardiac Function Precede Morphological Abnormalities in Fish Embryos Exposed to Polycyclic Aromatic Hydrocarbons. Toxicol. Appl. Pharmacol. 2004, 196, 191–205. [Google Scholar] [CrossRef]
  80. Ikenaka, Y.; Ito, Y.; Eun, H.; Watanabe, E.; Miyabara, Y. Characteristics of Accumulation Patterns of Polycyclic Aromatic Hydrocarbons in the Organisms Inhabited in Lake Suwa. J. Environ. Chem. 2008, 18, 341–352. [Google Scholar] [CrossRef] [Green Version]
  81. Qiu, Y.-W.; Zhang, G.; Liu, G.-Q.; Guo, L.-L.; Li, X.-D.; Wai, O. Polycyclic Aromatic Hydrocarbons (PAHs) in the Water Column and Sediment Core of Deep Bay, South China. Estuar. Coast. Shelf Sci. 2009, 83, 60–66. [Google Scholar] [CrossRef]
  82. Zhu, L.; Chen, B.; Wang, J.; Shen, H. Pollution Survey of Polycyclic Aromatic Hydrocarbons in Surface Water of Hangzhou, China. Chemosphere 2004, 56, 1085–1095. [Google Scholar] [CrossRef]
  83. Vrana, B.; Paschke, A.; Popp, P. Polyaromatic Hydrocarbon Concentrations and Patterns in Sediments and Surface Water of the Mansfeld Region, Saxony-Anhalt, Germany. J. Environ. Monit. 2001, 3, 602–609. [Google Scholar] [CrossRef]
  84. Guo, W.; He, M.; Yang, Z.; Lin, C.; Quan, X.; Wang, H. Distribution of Polycyclic Aromatic Hydrocarbons in Water, Suspended Particulate Matter and Sediment from Daliao River Watershed, China. Chemosphere 2007, 68, 93–104. [Google Scholar] [CrossRef]
  85. Ke, H.; Chen, M.; Liu, M.; Chen, M.; Duan, M.; Huang, P.; Hong, J.; Lin, Y.; Cheng, S.; Wang, X.; et al. Fate of Polycyclic Aromatic Hydrocarbons from the North Pacific to the Arctic: Field Measurements and Fugacity Model Simulation. Chemosphere 2017, 184, 916–923. [Google Scholar] [CrossRef]
  86. Bandowe, B.A.M.; Bigalke, M.; Boamah, L.; Nyarko, E.; Saalia, F.K.; Wilcke, W. Polycyclic Aromatic Compounds (PAHs and Oxygenated PAHs) and Trace Metals in Fish Species from Ghana (West Africa): Bioaccumulation and Health Risk Assessment. Environ. Int. 2014, 65, 135–146. [Google Scholar] [CrossRef]
  87. Jafarabadi, A.R.; Bakhtiari, A.R.; Yaghoobi, Z.; Yap, C.K.; Maisano, M.; Cappello, T. Distributions and Compositional Patterns of Polycyclic Aromatic Hydrocarbons (PAHs) and Their Derivatives in Three Edible Fishes from Kharg Coral Island, Persian Gulf, Iran. Chemosphere 2019, 215, 835–845. [Google Scholar] [CrossRef]
  88. Oliva, A.L.; La Colla, N.S.; Arias, A.H.; Blasina, G.E.; Lopez Cazorla, A.; Marcovecchio, J.E. Distribution and Human Health Risk Assessment of PAHs in Four Fish Species from a SW Atlantic Estuary. Environ. Sci. Pollut. Res. 2017, 24, 18979–18990. [Google Scholar] [CrossRef]
  89. Mashroofeh, A.; Bakhtiari, A.R.; Pourkazemi, M. Distribution and Composition Pattern of Polycyclic Aromatic Hydrocarbons in Different Tissues of Sturgeons Collected from Iranian Coastline of the Caspian Sea. Chemosphere 2015, 120, 575–583. [Google Scholar] [CrossRef]
  90. Yu, Z.; Lin, Q.; Gu, Y.; Du, F.; Wang, X.; Shi, F.; Ke, C.; Xiang, M.; Yu, Y. Bioaccumulation of Polycyclic Aromatic Hydrocarbons (PAHs) in Wild Marine Fish from the Coastal Waters of the Northern South China Sea: Risk Assessment for Human Health. Ecotoxicol. Environ. Saf. 2019, 180, 742–748. [Google Scholar] [CrossRef]
  91. Soltani, N.; Moore, F.; Keshavarzi, B.; Sorooshian, A.; Javid, R. Potentially Toxic Elements (PTEs) and Polycyclic Aromatic Hydrocarbons (PAHs) in Fish and Prawn in the Persian Gulf, Iran. Ecotoxicol. Environ. Saf. 2019, 173, 251–265. [Google Scholar] [CrossRef]
  92. Zhao, Z.; Zhang, L.; Cai, Y.; Chen, Y. Distribution of Polycyclic Aromatic Hydrocarbon (PAH) Residues in Several Tissues of Edible Fishes from the Largest Freshwater Lake in China, Poyang Lake, and Associated Human Health Risk Assessment. Ecotoxicol. Environ. Saf. 2014, 104, 323–331. [Google Scholar] [CrossRef]
  93. Al-Saleh, I.; Al-Doush, I. Gas Chromatography-Mass Spectrometric Determination of Polycyclic Aromatic Hydrocarbons in Five Species of Fish from Three Sites in the Arabian Gulf. Int. J. Environ. Health Res. 2002, 12, 193–200. [Google Scholar] [CrossRef]
  94. DouAbul, A.A.-Z.; Heba, H.M.A.; Fareed, K.H. Polynuclear Aromatic Hydrocarbons (PAHs) in Fish from the Red Sea Coast of Yemen. In Proceedings of the Asia-Pacific Conference on Science and Management of Coastal Environment (Developments in Hydrobiology), Hong Kong, China, 25–28 June 1996; Wong, Y.-S., Tam, N.F.-Y., Eds.; Springer: Dordrecht, The Netherlands, 1997; pp. 251–262. [Google Scholar] [CrossRef]
  95. Dhananjayan, V.; Muralidharan, S. Polycyclic Aromatic Hydrocarbons in Various Species of Fishes from Mumbai Harbour, India, and Their Dietary Intake Concentration to Human. Int. J. Oceanogr. 2012, 2012, 6. [Google Scholar] [CrossRef]
  96. Baan, R.; Grosse, Y.; Straif, K.; Secretan, B.; El Ghissassi, F.; Bouvard, V.; Benbrahim-Tallaa, L.; Guha, N.; Freeman, C.; Galichet, L.; et al. A Review of Human Carcinogens—Part F: Chemical Agents and Related Occupations. Lancet Oncol. 2009, 10, 1143–1144. [Google Scholar] [CrossRef]
  97. Wang, X.L.; Tao, S.; Dawson, R.W.; Xu, F.L. Characterizing and Comparing Risks of Polycyclic Aromatic Hydrocarbons in a Tianjin Wastewater-Irrigated Area. Environ. Res. 2002, 90, 201–206. [Google Scholar] [CrossRef]
  98. World Health Organization. Regional Office for Europe. In Air Quality Guidelines for Europe; WHO Regional Office for Europe: Copenhagen, Denmark, 1987; pp. 105–117. [Google Scholar]
  99. Jiang, Y.; Hu, X.; Yves, U.J.; Zhan, H.; Wu, Y. Status, Source and Health Risk Assessment of Polycyclic Aromatic Hydrocarbons in Street Dust of an Industrial City, NW China. Ecotoxicol. Environ. Saf. 2014, 106, 11–18. [Google Scholar] [CrossRef]
  100. Chen, S.-C.; Liao, C.-M. Health Risk Assessment on Human Exposed to Environmental Polycyclic Aromatic Hydrocarbons Pollution Sources. Sci. Total Environ. 2006, 366, 112–123. [Google Scholar] [CrossRef] [PubMed]
  101. Bruner, K.A.; Fisher, S.W.; Landrum, P.F. The Role of the Zebra Mussel, Dreissena Polymorpha, in Contaminant Cycling: II. Zebra Mussel Contaminant Accumulation from Algae and Suspended Particles, and Transfer to the Benthic Invertebrate, Gammarus Fasciatus. J. Great Lakes Res. 1994, 20, 735–750. [Google Scholar] [CrossRef]
  102. de Mora, S.; Fowler, S.W.; Wyse, E.; Azemard, S. Distribution of Heavy Metals in Marine Bivalves, Fish and Coastal Sediments in the Gulf and Gulf of Oman. Mar. Pollut. Bull. 2004, 49, 410–424. [Google Scholar] [CrossRef] [PubMed]
  103. Okere, U.; Semple, K. Biodegradation of PAHs in ‘Pristine’ Soils from Different Climatic Regions. J. Bioremed. Biodegrad. 2012, 1, 6. [Google Scholar] [CrossRef] [Green Version]
  104. Sahu, S.K.; Pandit, G.G. Estimation of Octanol-Water Partition Coefficients for Polycylic Aromatic Hydrocarbons Using Reverse-Phase HPLC. J. Liq. Chromatogr. Relat. Technol. 2003, 26, 135–146. [Google Scholar] [CrossRef]
Figure 1. Samples collecting sites (St).
Water 14 01706 g001
Figure 2. Composition patterns of PAHs regarding the ring size in: (a) Epinephelus tauvina; (b) Cephalopholis argus; and (c) Plectropomus pessuliferus.
Water 14 01706 g002
Figure 3. Incremental lifetime cancer risk (ILCR) of the individual PAH compound concentrations for three endemic fish of Jeddah.
Water 14 01706 g003aWater 14 01706 g003b
Figure 4. Incremental lifetime cancer risk and cancer risk (ILCR) of the ∑PAHs concentrations for three endemic fish in Jeddah.
Water 14 01706 g004
Figure 5. Pearson product-moment correlation coefficients between the different variables.
Water 14 01706 g005
Figure 6. Dendrogram showing the clusters formed by the studied fish species.
Water 14 01706 g006
Figure 7. Bioconcentration factor (BCF) of the studied fish species.
Water 14 01706 g007
Table 1. Sample Characteristics.
Scientific NameLocal NameSamples (n)Length 1 (cm)Weight 1 (g)
Epinephelus tauvinaTauvina1447 ± 81226 ± 602
Cephalopholis argusHamour1235 ± 4634 ± 68
Plectropomus pessuliferusNajil948 ± 241765 ± 1390
1 Results are expressed as mean ± standard error.
Table 2. Gradient separation regime.
Total Time (min)A%B%
0.18515
4.08515
5.58020
7.56535
11.564.534.5
131000
188515
Table 3. Parameters used for estimating the exposure assessment through endemic fish consumption.
Exposure FactorsSymbolUnitReference
B[a]Pequi concentration for PAH compoundsCsng B[a]Pequi/g Present study
Ingestion rateIRg/day850[33,34]
Exposure frequencyEFdays year−1365[36,37]
Exposure duration for each life segmentEDyears30[39]
Carcinogenic oral slope factorsCSF(mg kg−1 day−1)−17.3[37]
Average life span(years)
(70 years × 365 days/year)
ATdays25,550[40]
conversion factorCFmg·ng−110−6
bodyweightBWkg70[38]
Table 4. Amino acid concentrations in fish samples (g/100 g).
Essential Amino Acids
Amino AcidEpinephelus tauvina *Cephalopholis
argus *
Plectropomus pessuliferus *
1Histidine-1.90 ± 0.042.40 ± 0.10
2Isoleucine3.08 ± 0.162.04 ± 1.585.93 ± 0.32
3Leucine4.83 ± 0.185.69 ± 0.1310.33 ± 0.49
4Lysine5.36 ± 0.186.28 ± 0.1711.27 ± 0.46
5Methionine2.13 ± 0.122.64 ± 0.074.10 ± 0.26
6Phenylalanine2.71 ± 0.133.40 ± 0.104.83 ± 0.06
7Threonine2.93 ± 0.133.52 ± 0.084.40 ± 0.17
Non-essential Amino Acids
1Alanine4.02 ± 0.335.33 ± 0.1310.70 ± 0.61
2Aspartic acid6.06 ± 0.207.26 ± 0.208.27 ± 1.02
3Glutamic acid8.32 ± 0.3310.54 ± 0.1811.10 ± 1.39
4Serine2.29 ± 0.132.87 ± 0.021.97 ± 0.06
Conditional Amino Acids
1Arginine4.06 ± 0.194.95 ± 0.099.80 ± 0.10
2Glycine2.69 ± 0.153.75 ± 0.127.17 ± 0.67
3Tyrosine0.64 ± 0.081.83 ± 0.082.73 ± 0.32
* Mean values ± standard error (n = 3).
Table 5. TPHs concentration and lipid content in fish species.
Scientific NameLocal NameSamples (n)Lipid (%) *TPHs (μg g−1) *
Epinephelus tauvinaTauvina141.2 ± 0.64.2 ± 2.3
Cephalopholis argusHamour120.6 ± 0.36.8 ± 3.6
Plectropomus pessuliferusNajil91.0 ± 0.87.4 ± 3.2
* Mean values ± standard error.
Table 6. Comparison of fish muscle TPHs concentrations in marine biota from Saudi Arabia with other locations in the world.
SpeciesSampling LocationRegionSampling YearTPHs
(μg g−1, Dry Weight)
Reference
Epinephelus coioidesBasrah
(Irak)
North-West Arabian Gulf2014–20154.36–5.23[74]
Epinephelus morioJeddah
(KSA)
Eastern shore of the Red Sea201410–156[72]
Epinephelus tauvinaJeddah
(KSA)
Eastern shore of the Red Sea20214.2 ± 2.3This study
Cephalopholis argusJeddah
(KSA)
Eastern shore of the Red Sea20216.8 ± 3.6This study
Plectropomus pessuliferusJeddah
(KSA)
Eastern shore of the Red Sea20217.4 ± 3.2This study
Epinephelus morioYanbu (KSA)Eastern shore of the Red Sea20146–84[72]
Lethrinas nebulosusJeddah (KSA)Eastern shore of the Red Sea20146–94[75]
Lethrinas nebulosusYanbu (KSA)Eastern shore of the Red Sea20143.6–50[75]
Trachurus trecaeBenin
(Nigeria)
Benin201421–30[76]
Leuciscus voraxBasrah (Irak)Shatt Al-Arab River Iraq20155.12–21.52[73]
Silver pomfretHormozgan
(Iran)
Northern Persian Gulf20110.67–3.36[77]
GrouperHormozgan
(Iran)
Northern Persian Gulf20110.25–1.20[77]
Table 7. Contamination source indicators.
RatioPetrogenic SourcePyrogenic SourceReferences
Fluoranthene (FLUE)/Pyrene (PYR)<1>1[81]
Phenanthrene (PHE)/Anthracene (ANT)<1-[82]
1 LMW/HMW 2>1<1[83]
ANT/(ANT + PHE)<0.1>0.1[84]
benzo(a)anthracene/(benzo(a)anthracene+chrysene)<0.2>0.35[84,85]
1 Low Molecular Weight = Naphthalene + Acenaphthylene + Acenaphthene + Fluorene. 2 High Molecular Weight = Fluorananthene + Pyrene + BaA+ Chrysene + Bbf+ BKf + BaP + DBA + B(ghi)perylene + indenol pyrene.
Table 8. PAHs concentrations (mean ± SD) and ratios in fish tissue.
Compound NameEpinephelus tauvinaCephalopholis argusPlectropomus pessuliferus
Naphthalene (NAP)14.04 ± 6.2325.7 ± 7.3312.03 ± 5.64
Acenaphthylene (ACY)<DL 1<DL 1<DL 1
Acenaphthene (ACE)4.05 ± 3.235.2 ± 3.242.86 ± 1.22
Fluorene (FLU)2.1 ± 1.726.7 ± 4.560.33 ± 0.43
Phenanthrene (PHE)1.63 ± 1.452.3 ± 1.430.42 ± 0.56
Anthracene (ANT)<DL 1<DL 1<DL 1
Fluoranthene (FLUE)1.20 ± 1.321.64 ± 0.930.75 ± 0.47
Pyrene (PYR)2.8 ± 1.253.24 ± 2.171.08 ± 0.92
Benzo(a)anthracene (BaA)<DL 10.02 ± 0.090.07 ± 0.04
Chrysene (CHY)1.8 ± 0.921.57 ± 0.871.42 ± 0.91
Benzo(b)fluoranthene (BbF)3.46 ± 2.094.23 ± 2.400.65 ± 0.43
Benzo(k)fluoranthene (BkF)1.14 ± 0.932.45 ± 1.690.7 ± 0.54
Benzo(a)pyrene (BaP)1.74 ± 0.673.02 ± 1.850.21 ± 0.32
Dibenzo(a,h)anthracene (DahA)2.65 ± 1.723.25 ± 2.330.24 ± 0.41
Benzo(g,h,i)perylene (BPY)<DL 13.45 ± 2.451.09 ± 0.87
Indeno[1,2,3-cd]pyrene (InP)<DL 1<DL 1<DL 1
ΣPAHs36.6159.4421.78
FLU/PYR0.690.500.69
2 Low Molecular Weight/High Molecular Weight 318.2630.8723.29
BaA/BaA + CHY0.040.010.04
1 DL: Detection limit (DLi(ACY) = 0.22 ng/g; DLi(ANT) = 0.17 ng/g; DLi(BaA) = 0.19 ng/g; DLi(BPY) = 2.8 ng/g). 2 Low Molecular Weight = Naphthalene + Acenaphthylene + Acenaphthene + Fluorene. 3 High Molecular Weight = Fluorananthene + Pyrene + BaA+ Chrysene + Bbf+ BKf + BaP + DBA + B(ghi)perylene + indenol pyrene.
Table 9. Comparison of PAH levels with results from other studies from Saudi Arabia and other countries.
SpeciesSampling LocationRegionSampling Year∑ PAHs
(ng·g−1, Dry Weight)
Reference
Epinephelus tauvinaDammam and Sharq DareenArabian Gulf waters of the Eastern province2001–20026.273[93]
Solea soleaYemen coastGulf of Aden1995–199648.0–50.3[94]
Coilia dussumieriMumbaiwestern coast of India2006–200870.44[95]
Cephalopholis argusXisha IslandsYongle Atoll (South China Sea)2017409.28[7]
Epinephelus quoyanusXisha IslandsYongle Atoll (South China Sea)201757.37[7]
Plectorhinchus chaetodonoidesXisha IslandsYongle Atoll (South China Sea)201724.75[7]
Epinephelus tauvinaEastern shore of the Red SeaEastern shore of the Red Sea202136.61This study
Cephalopholis argusEastern shore of the Red SeaEastern shore of the Red Sea202159.44This study
Plectropomus pessuliferusEastern shore of the Red SeaEastern shore of the Red Sea202121.78This study
Table 10. B[a]P equivalent concentrations for PAH compounds in three endemic fishes.
PAHsTEFE. tauvinaC. argusP. pessuliferus
ng/gng BaPequiv/gng/gBaPequiv/gng/gBaPequiv/g
NAP0.00114.040.01425.70.02512.030.012
ACY0.001------
ACE0.0014.050.0045.20.0052.860.003
FLU0.0012.10.0026.70.0070.33-
PHE0.0011.630.0022.30.0020.42-
ANT0.01------
FLUE0.0011.20.0011.640.0020.75-
PYR0.0012.80.0033.240.0031.080.001
BaA0.1--0.020.0020.070.007
CHY0.011.80.0181.570.0161.420.014
BbF0.13.460.3464.230.4230.650.065
BkF0.11.140.1142.450.2450.70.07
BaP11.741.743.023.020.210.21
DahA12.652.653.253.250.240.24
BPY0.01--3.450.03451.090.011
InP0.1------
Total carcinogenic activity (TCA)4.894 7.035 0.633
Contribution of BaA to the TCA (%)0.000 0.028 1.106
Contribution of BbF to the TCA (%)7.070 6.013 10.269
Contribution of BkF to the TCA (%)2.329 3.483 11.058
Contribution of BaP to the TCA (%)35.554 42.931 33.175
Contribution of DahA to the TCA (%)54.148 46.201 37.915
Contribution of CHY to the TCA (%)0.368 0.227 2.212
Table 11. Factor Analysis.
Factor NumberEigenvaluePercentage of VarianceCumulative Percentage
16.6368666.36966.369
23.3631433.631100.000
34.39234 × 10−160.000100.000
43.97859 × 10−160.000100.000
52.51672 × 10−160.000100.000
65.55669 × 10−170.000100.000
7−6.48359 × 10−170.000100.000
8−3.24332 × 10−160.000100.000
9−3.99903 × 10−160.000100.000
10−1.36544 × 10−150.000100.000
Table 12. Factor Analysis.
Factor 1Factor 2
Lipid−0.291525−0.956563
TPHs0.9374490.348123
Benzo(g,h,i)perylene (BPY)0.3002140.953872
Aspartic acid0.9982680.0588275
Glutamic acid0.9423350.33467
Chrysene (CHY)−0.991533−0.129852
Pyrene (PYR)−0.7594810.65053
Benzo(b)fluoranthene (BbF)−0.7517450.659454
Dibenzo(a,h)anthracene(DahA)−0.7624060.647099
Tyrosine0.9960240.0890876
Table 13. Factor scores.
SpecieFactor 1Factor 2
Epinephelus tauvina−6.787241.18294
Cephalopholis argus1.670753.50619
Plectropomus pessuliferus5.11649−4.68913
Table 14. Sensitivity of fish species to pollution sources.
ClusterLipidsTPHsIsoleucineAspartic AcidGlutamic AcidTyrosine
Epinephelus tauvina0.9166676.133333.686677.196679.986671.73333
ClusterChrysene (CHY)Pyrene (PYR)Benzo(g,h,i)perylene (BPY)
Cephalopholus argus1.596672.373331.51333
ClusterDibenzo(a,h)anthracene(DahA)
Plectromus pessuferus2.04667
Table 15. Bioconcentration factor (BCF) threshold values.
Regulatory ActThreshold Values
Regulation (EC) N0 1272/2013 (REACH)≥2000 = bioaccumulative
≥5000 = very bioaccumulative
US EPA Toxic Substances Control Act (TSCA)≥1000 = bioaccumulative
≥5000 = very bioaccumulative
Publisher’s Note: MDPI stays neutral with regard to jurisdictional claims in published maps and institutional affiliations.

