
Effect of Eutrophication Control Methods on the Generation of Greenhouse Carbon Gases in Sediment


1
Graduate Program in Engineering, National Autonomous University of Mexico, Ciudad de México 04510, Mexico
2
Mexican Institute of Water Technology (IMTA), Paseo Cuauhnáhuac 8532, Jiutepec 62550, Mexico
*
Author to whom correspondence should be addressed.
Water 2022, 14(11), 1705; https://doi.org/10.3390/w14111705
Submission received: 15 March 2022
/
Revised: 18 May 2022
/
Accepted: 23 May 2022
/
Published: 26 May 2022
(This article belongs to the Special Issue Lake Eutrophication: Causes, Monitoring and Restoration)
Abstract
:The accumulation of nutrients (eutrophication) in water bodies generally produces increased concentrations of organic matter that eventually are deposited in sediment, and partially mineralized, generating greenhouse carbon gases (GHCG). The application of eutrophication control methods includes the application of phosphate adsorbing materials such as Phoslock (PHOS), and hypolimnetic oxygenation systems (HOS). We evaluated the generation of GHCG in sediment subject to these eutrophication control methods. Combined water and sediment samples from the Valle de Bravo reservoir in Mexico, were incubated in reactors, where the following eutrophication control methods were applied: HOS, PHOS, HOS + PHOS, and compared to a reactor without treatment (CONTROL). Redox potential (Eh), pH, redox-sensitive ions, and GHCG emissions were monitored, observing the following rates: CONTROL (15.6 mmol m−2 d−1) > HOS (12.8) > HOS + PHOS (11.0) > PHOS (9.7 mmol m−2 d−1), with the CONTROL rate within values determined from published sediment core data. The GHCG emissions increased with time as Eh decreased, and sulfate reduction increased. Application of eutrophication control methods in the Valle de Bravo reservoir, would most probably result in lower GHCG generation and emission rates. This is due to the repression of sulfate-reduction in water-sediment systems where HOS and PHOS were applied both individually and combined.
1. Introduction
The contribution of pollutants from point and diffuse emission sources in hydrological basins causes an accumulation of nutrients and eutrophication of fresh water bodies [1]. Eutrophication causes changes in the ecological structure in water bodies due to the accelerated growth of photosynthetic organisms, which increases the contents of organic matter in water and sediment and the resulting oxygen demands, thereby affecting negatively water quality [2]. The increase in organic matter is due to the capture and transformation of CO2 to autochthonous organic carbon (C) [3] that, together with external or allochthonous C loads, build up in sediment, where heterotrophic organisms degrade and mineralize accumulated organic matter, generating greenhouse carbon gases (GHCG).
The generation of GHCG in freshwater bodies is the result of respiration processes, and is related to the concentrations of oxygen and oxidized nitrate, iron oxy-hydroxide, manganese dioxide, and sulfate, that participate in metabolic processes and mineralization reactions [4]. In the presence of dissolved oxygen, GHCG generation processes are aerobic, with O2(aq) acting as the electron acceptor, oxidizing organic C to CO2 [5]. Dissolved oxygen is the principal electron acceptor in the sequence of metabolic mineralization reactions that generate GHCG in water bodies. However, the availability of O2(aq) may vary both temporally and spatially in lakes and reservoirs. Dissolved oxygen usually decreases with water depth, and is often depleted at the water-sediment interface as microorganisms use oxygen to carry out respiration processes and obtain energy [6,7]. When O2(aq) is depleted, the other oxygen-containing compounds take over as electron acceptors in the following order: manganese dioxide, nitrate, iron oxy-hydroxide, and sulfate [8,9]. These acceptors are subsequently consumed to oxidize organic C under suboxic and anoxic conditions [10]. Redox potentials (Eh) depend on the amounts of these compounds that vary as a function of the microorganisms’ energy requirements [11]. Respiration reactions are named according to the corresponding electron acceptors (Table 1).
Fermentation of organic C is another respiration process, where microorganisms generate energy through the exchange of electrons amongst different C atoms in organic matter. Fermentation occurs parallel to other organic C degradation processes, forming less complex organic compounds, which can be mineralized by iron- and sulfate-reducing microorganisms, and by methanogenic bacteria [13,14,15]. When electron acceptors are depleted, methanogenesis becomes the predominant biodegradation process that generates CO2 and CH4 in equimolar amounts [16].
Different methods have been used to determine GHCG emission rates, such as in situ static chambers that capture ebullient gases at the water surface [17], continuous sampling or monitoring of water samples, and separation of headspace gas [18]. Captured gases are then characterized, and GHCG generation and/or emission rates determined [19]. Laboratory incubation experiments are another method to determine GHCG generation rates. The convenience of such incubation experiments is that the effects of temperature, nutrient loadings, and gas supplies can be readily evaluated [20,21]. Finally, a third method to determine GHCG generation rates in water bodies is through mathematical modeling based on experimental results, and simulating the reactions where carbon is involved [22,23]. Laboratory incubation experiments and mathematical modelling may also allow evaluating the relative importance of each mineralization process involved in the generation of GHCG, whereas field sampling does not allow to distinguish such processes.
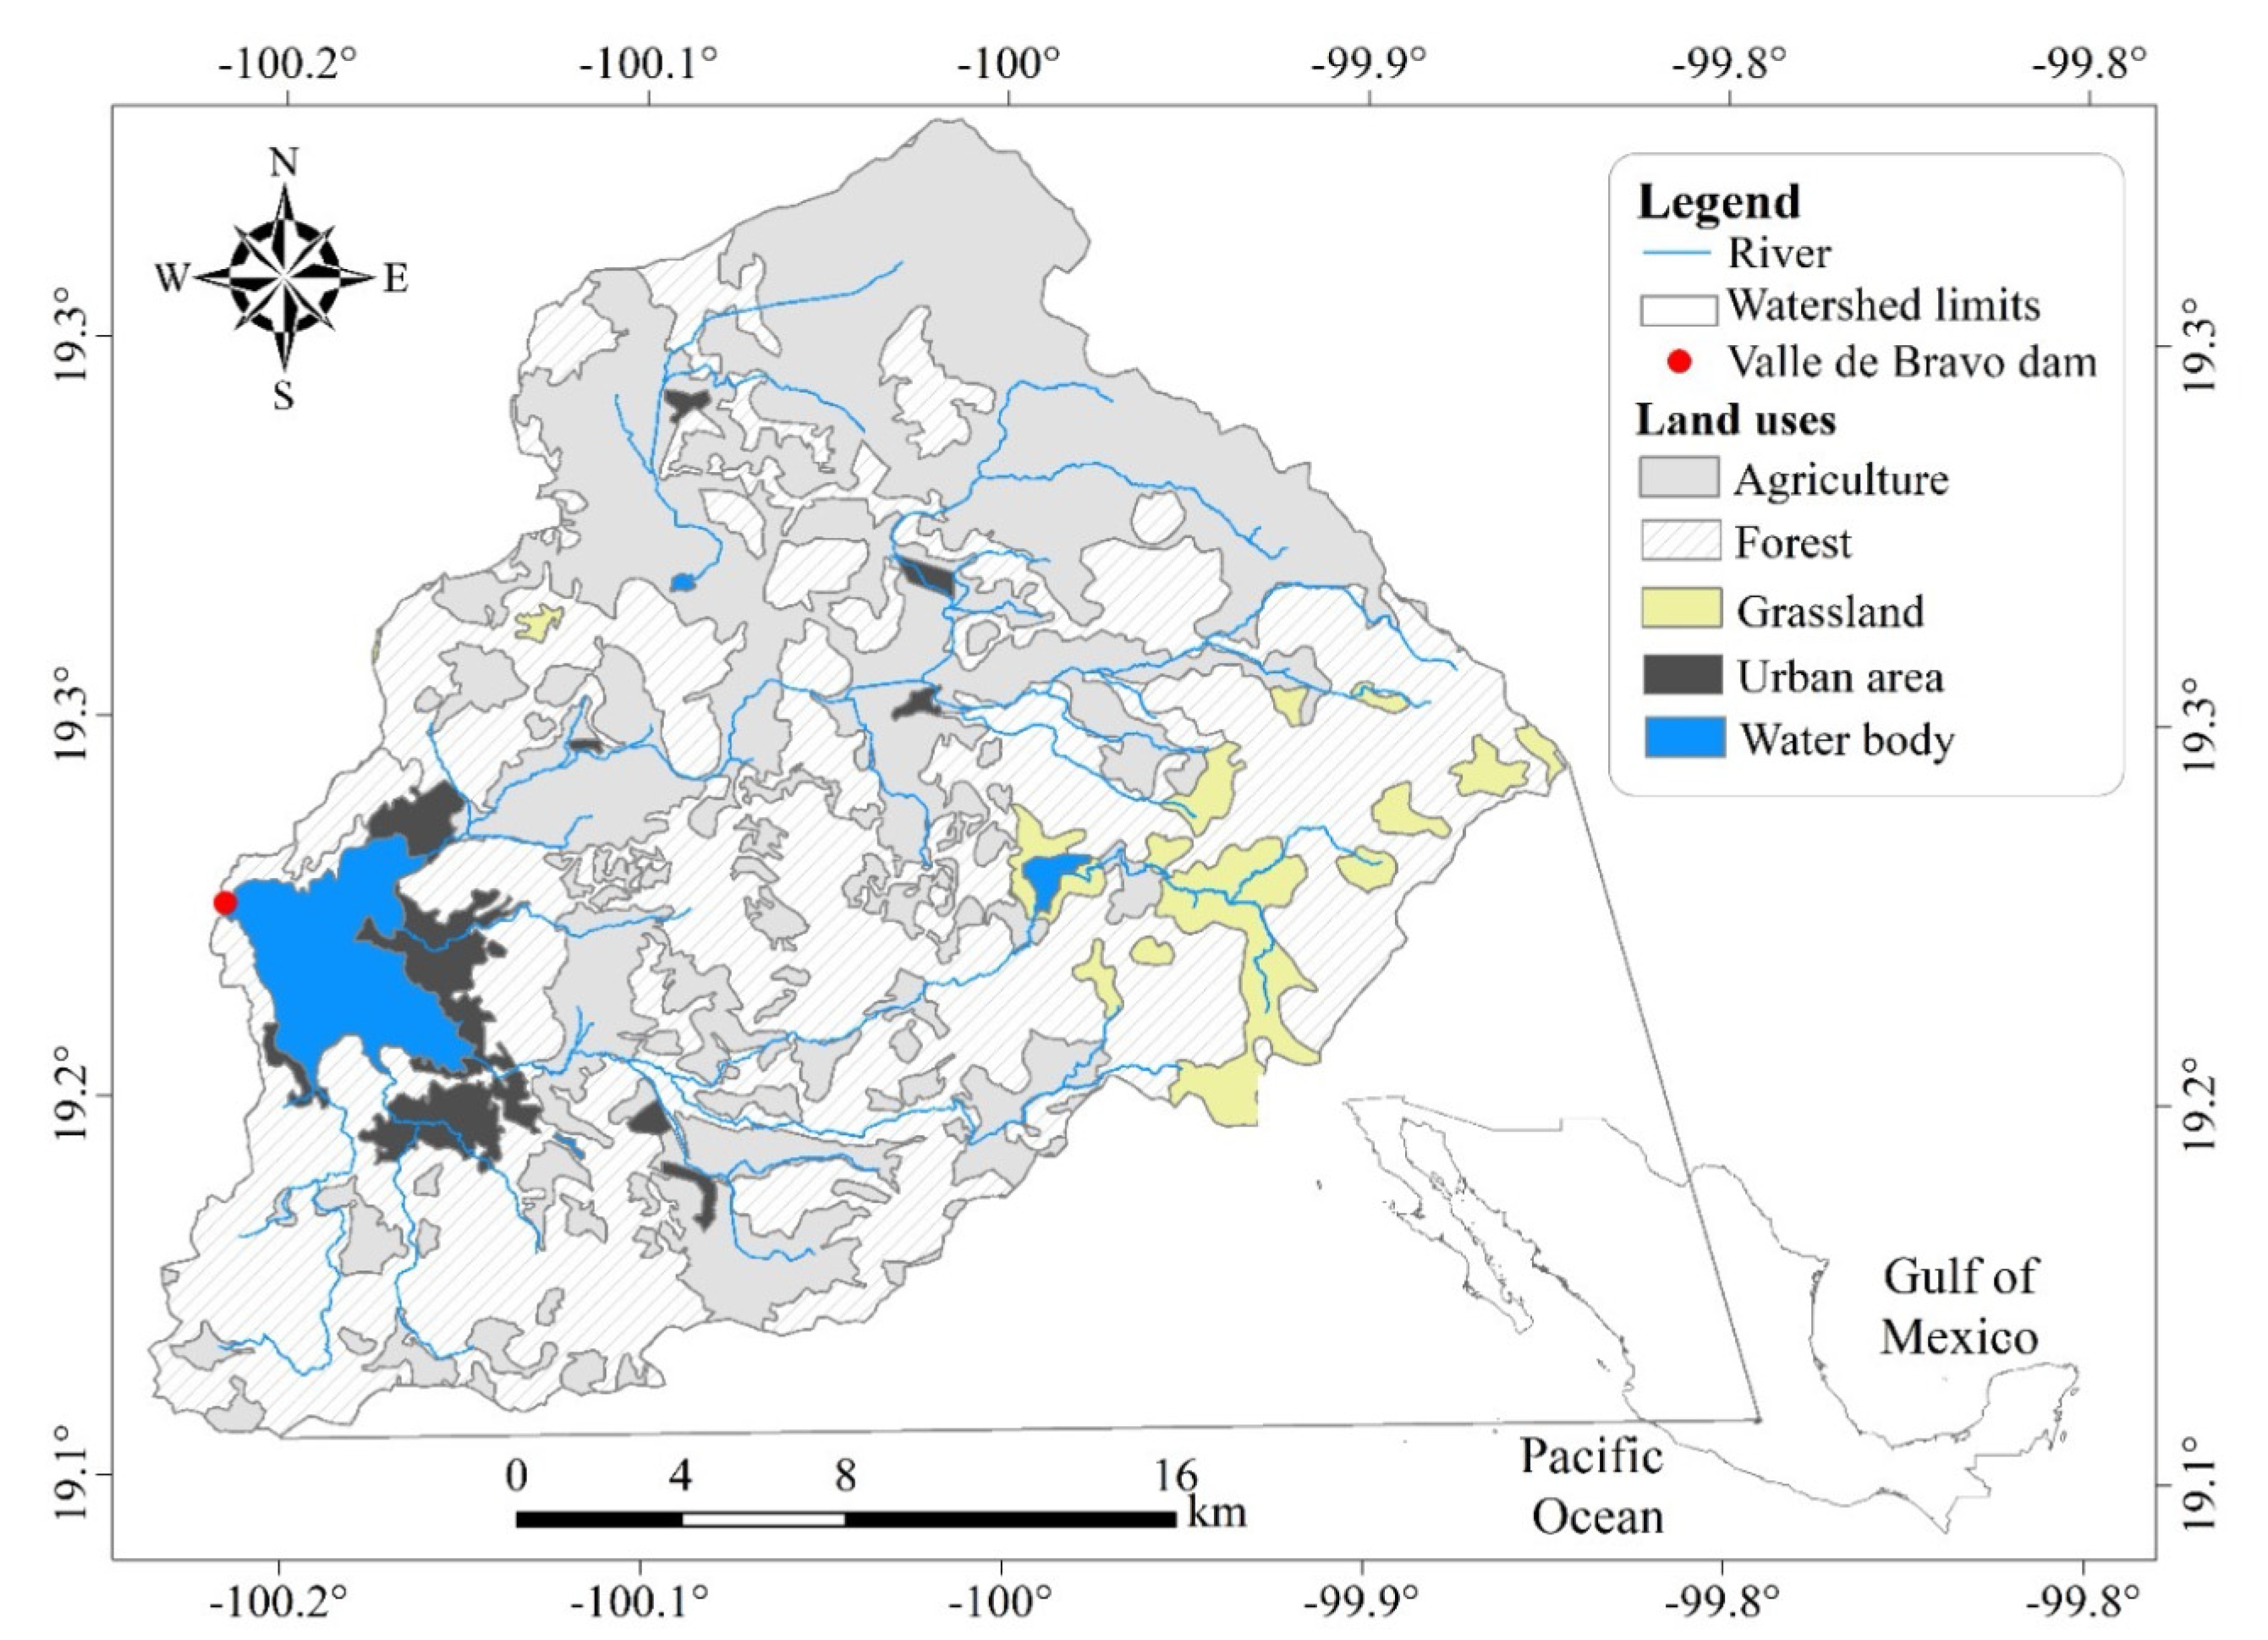
Sánchez-Carrillo et al. [24] evaluated the GHCG emissions from freshwater bodies in Mexico. Analyzing their, data it can deduced that lakes and reservoirs represent 97% of the greenhouse carbon effect of all the GHCG emitted from Mexican freshwater bodies. One of these water bodies is the Valle de Bravo reservoir, located in central Mexico (Figure 1), this lake is being used for tourism and is an important water supply for the Valley of Mexico Metropolitan Area (VMMA). It provides approximately 25% of the 60 m3 s−1 water supply to nearly 22 million inhabitants in the VMMA [25,26]. The Valle de Bravo reservoir is warm monomictic with eutrophic water and thermal stratification during winter [27]. Due to the eutrophic state of water in the reservoir and consequent deterioration of water quality, algae blooms and cyanobacteria growths are commonly observed [28]. There is an interest in improving water quality in this reservoir [29]; however, it is unknown how eutrophication control methods may affect the generation of GHCG in this water body.
The application of eutrophication control methods may improve water quality although the effects on the mineralization velocities of organic matter and generation of GHCG have not yet been established. The selection of treatments for this study was based on reported uses to control eutrophication in freshwater bodies around the World [31,32,33,34,35]. It is expected that oxygenation in the hypolimnion, would increase the generation of GHCG due to aerobic degradation of organic matter, while application of a selective PO43−-adsorbing material would cause decreased generation of GHCG due to limitation of available PO43− for growth of degrading organisms. To determine the effects of eutrophication control methods on the production of GHCG in sediment samples from a eutrophied reservoir, in this paper we evaluate the generation of GHCG and the corresponding respiration processes.
In freshwater bodies PO43− is often the limiting nutrient [36]; therefore, reducing the available PO43− concentrations may regulate the production of autochthonous organic matter. To reduce available PO43− concentrations in lakes and reservoirs, both external and internal contaminant loads must be taken into account [37], since internal loads may continue to cause eutrophication of lakes and reservoirs for several decades [38].
The reduction of available PO43− may be achieved by the application of PO43−-adsorbing materials or by oxygenation to produce adsorbing substrates of iron and manganese oxides. Methods used for PO43− removal in water bodies include (1) multi-charged iron and aluminum salts that coagulate PO43−-containing particles; (2) calcite and dolomite that react with dissolved PO43− precipitating this nutrient as phosphate-containing minerals; and (3) clay materials or other substrates that have been modified to obtain positive surface charges able to remove anionic PO43− by adsorption [31,39,40].
The former two methods are pH or redox-sensitive and therefore not suitable for application in natural waters. Phoslock is a bentonite-type clay where cations have been substituted with lanthanum (La3+) producing positive surface charges, which attract and selectively adsorb aqueous PO43− [41]. This material has been found to be highly efficient for controlling concentrations of PO43−, reducing algae blooms and cyanobacteria growths in freshwater bodies [32,42,43].
Hypolimnetic oxygenation allows controlling the effects of eutrophication in water bodies, supplying O2(aq) to deeper parts of lakes and reservoirs, where lower temperatures and higher hydrostatic pressures allow more efficient dissolution of the gas without affecting thermal stratification. Dissolved oxygen is very reactive, effectively decreasing oxygen demand, and, when applied in sufficient amounts, reversing anoxic conditions in water bodies. Dissolved oxygen also forms PO43−-adsorbing substrates of oxidized iron and manganese [34]. However, a Fe:P molar ratio of at least 2:1 is required and this relation may increase due to the competition of other anions in the adsorption of PO43− on these substrates. However, a sustained supply of oxygen is required to avoid reductive dissolution of oxidized iron and manganese at Eh lower than −100 mV, and consequent re-dissolution of PO43− [44].
2. Materials and Methods
Water and sediment samples were obtained from three stations located in the deeper parts of the Valle de Bravo reservoir where sediments richer in organic matter accumulate [45]. Water samples were obtained with high-density polyethylene flasks and sediment samples with an Ekman dredge. Water and sediment samples were combined in equal amounts and then characterized. Redox-sensitive compounds and mayor ions were analyzed in the combined water sample according to standard methods (Table 2). Carbonate (TIC) and organic matter (OM) were determined in the combined sediment sample by weight difference following acidification and calcination, according to Walthert et al. [46]. Contents of organic matter were converted to total organic carbon (COT) by stoichiometric calculation.
Respiration experiments were set up in four reactors (Table 3) with characterized water and sediment, not allowing gaseous headspace in order to assure that the emitted GHCG were released into the gas-trapping systems. Reactors were maintained in the dark with a blackout cover and water was slowly agitated with a mechanical paddle stirrer (RCF = 0.3 g) just above the water-sediment interface to allow mixing of the aqueous phase without resuspension of sediment. Four-hole stainless steel lids connected tubing for gas applications to porous rock diffusers located in the bottom of the reactors, allowing the release of gases trapped in sediments. Non-return valves allowed the GHCGs to be released from the gas-trapping systems. Half-hourly monitoring and automatic data storage of Eh and pH were carried out (Hanna model 1005 and 2001 sensors, Figure 2), and distributions of Eh and pH values were analyzed using the statistical software InfoStat [62], eliminating the outliers beyond ±2 standard deviations (σ), and determining the resulting median (μ), and σ.
Gases and nutrients were added to all reactors in amounts equivalent to two oxygenation systems [63] and gas applications proportional to external loads reported by Hansen and Márquez-Pacheco [64], and Phoslock was added in the relation Phoslock:P 100:1 [65] to the PHOS and HOS + PHOS reactors. Four gas- and nutrient application events were carried out (1) initially, (2) and (3) when at least one of the gas-trapping systems was full, and (4) at the end of the experiment:
Reactor lids were equipped with non-return valves to avoid alkaline solutions from subsequent traps to flow back into the reactors as gas supplies were paused. Between gas- and nutrient application events, non-return valves were connected to 100 mL graduated high-density polypropylene probes (Sarstedt), which were immersed upside-down in water. The volumes of emitted gases were recorded periodically by measuring the volume of displaced water in the probes. Gas samples were obtained through silicon septa in the probes, and characterized by gas chromatography (SRI 8610c CA, USA), according to EPA Method 25 GC [66], with 10 mL min−1 He(g) (Infra 99.997%) as the carrier, corresponding to a 10-min retention time in a carbon column (Restek ShinCarbon) that was coupled to a helium ionization detector (HID). Four-fold carrier gas applications were performed between analyses to assure that previous GHCG had been rejected. A mixture of 30% CO2 and 70% CH4 (Infra P-191613) was used as calibration standard.
The O2 (g) and N2 (g) application systems included previous alkaline traps (NaOH) to eliminate eventual impurities of CO2 before entering the reactors. The CO2 emitted from the reactors were stoichiometrically determined by modification of electrical conductivities of the Ba(OH)2 solutions in the subsequent alkaline traps according to van Afferden et al. [21].
During gas- and nutrient application events, the gases emitted from the subsequent alkaline traps were captured in 400-mL Tedlar bags (Sigma Aldrich, St. Louis, MO, USA) from which duplicate samples were obtained with 1-mL SampleLock syringes (Hamilton) for characterization by gas chromatography, as described above.
The amounts of generated GHCG for each gas and nutrient application event were determined by totaling the following:
- CO2 and CH4 collected in inverted probes
- CO2 captured in alkaline traps
- CH4 (and eventual traces of CO2) collected in Tedlar bags
Water samples obtained prior to each gas- and nutrient-application were characterization for PO43−, alkalinity, redox-sensitive ions as described above, and major ions only in the beginning of the experiment (Table 2). Stoichiometric variations in concentrations of redox-sensitive ions and emitted GHCG were analyzed to identify the mineralization reactions (Table 1). The decrease of ions with higher oxidation state (Fe(III), N(V), S(VI), and C(IV)), and increase in reduced ions (Mn(II), Fe(II), N(Ø), N(-IV), S(-II), and C(-IV)), were stoichiometrically evaluated and the magnitude of the different reactions, validated by comparing to amounts of emitted CO2. Surplus emitted CO2 was considered to be produced by oxic respiration.
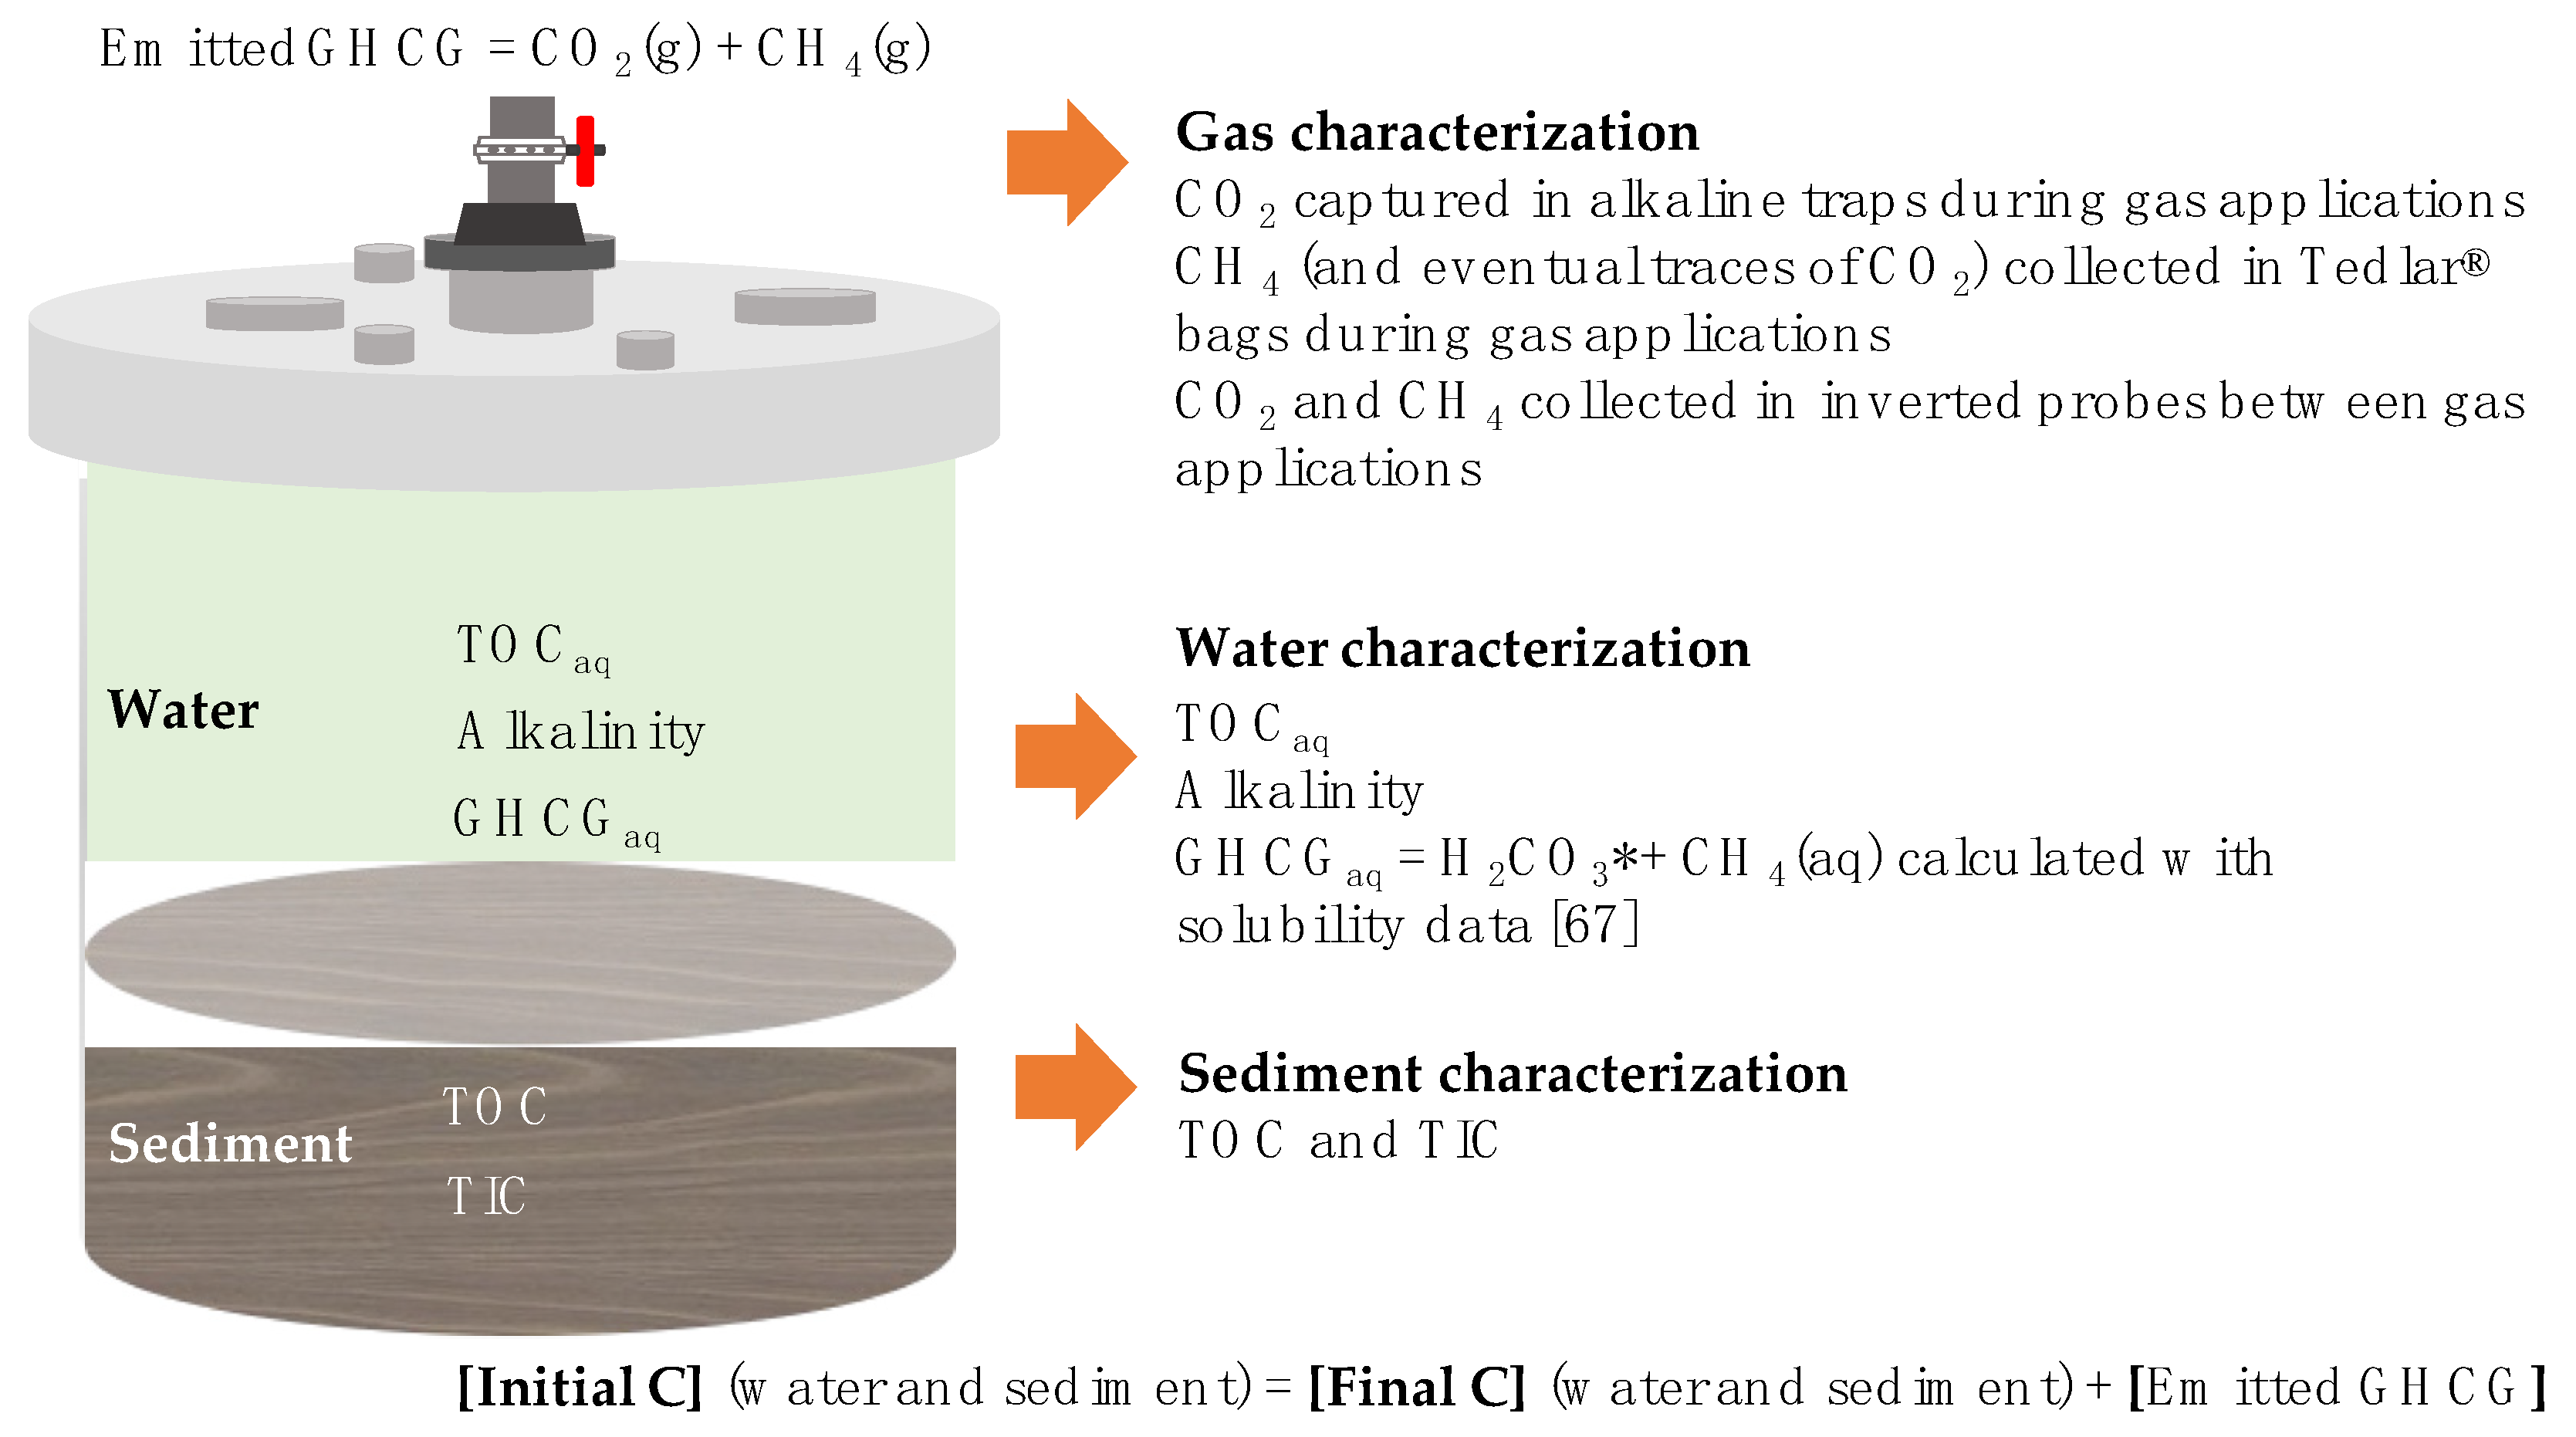
Carbon mass balances were determined with results from each reactor for quality control purposes and for experimental error estimation, by comparing final and initial masses in water, sediment, and emitted GHCG (Figure 3).
3. Results and Discussion
3.1. Carbon Mass-Balances
The carbon budgets in experimental reactors ((Table 4) show that organic carbon in the sediment was degraded as follows: CONTROL (15%) > HOS (13%) > HOS + PHOS (12%) > PHOS (11%). It was observed that over two thirds of degraded organic carbon was emitted as GHCG, while the rest was accumulated in the aqueous phase as alkalinity and TOCaq. Final carbon masses were 99.2 ± 0.2% of initial carbon, indicating that almost all carbon had been accounted for, and experimental errors varied between 55 and 117 mmol m−2 with an average error of 94 mmol m−2.
3.2. Variations in Eh and pH
Records of Eh and pH in experimental reactors (Figures S1 and S2 in supplementary material) allowed for an understanding of the conditions under which GHCG was generated. Positive Eh and lower pH values were observed in the beginning of the experiments, while Eh decreased and pH increased as the experiments advanced (Table 5). Oxic conditions were observed between application events 1 and 2, suboxic conditions between application events 2 and 3, and anoxic conditions were attained between application events 3 and 4 (Table 1). Reductions in Eh values as the experiments advanced were related to the sequence in which organic matter mineralization processes occurred. They can be explained by the electron acceptance processes in which the energetically most favorable electron acceptors are depleted, and then the next most-favorable process followed [68]. This sequence of electron exchange implies reduction of the system’s Eh.
Observed pH values varied between 4.7 and 6.3 and are not expected to limit respiration processes that oxidize organic matter to CO2, and pH values above 6 may limit the growth of methanogenic organisms [18]. However, pH values in sediments are most likely lower than values observed in aqueous phase [64] and such limitation is therefore not expected to occur. Time-dependent increases in pH are related to mineralization of organic matter, where microorganisms couple protons to form electrochemical differentials allowing movements of electrons between organic matter and acceptors like oxidized manganese, nitrogen, and iron [69].
3.3. Generation Velocities of GHCG
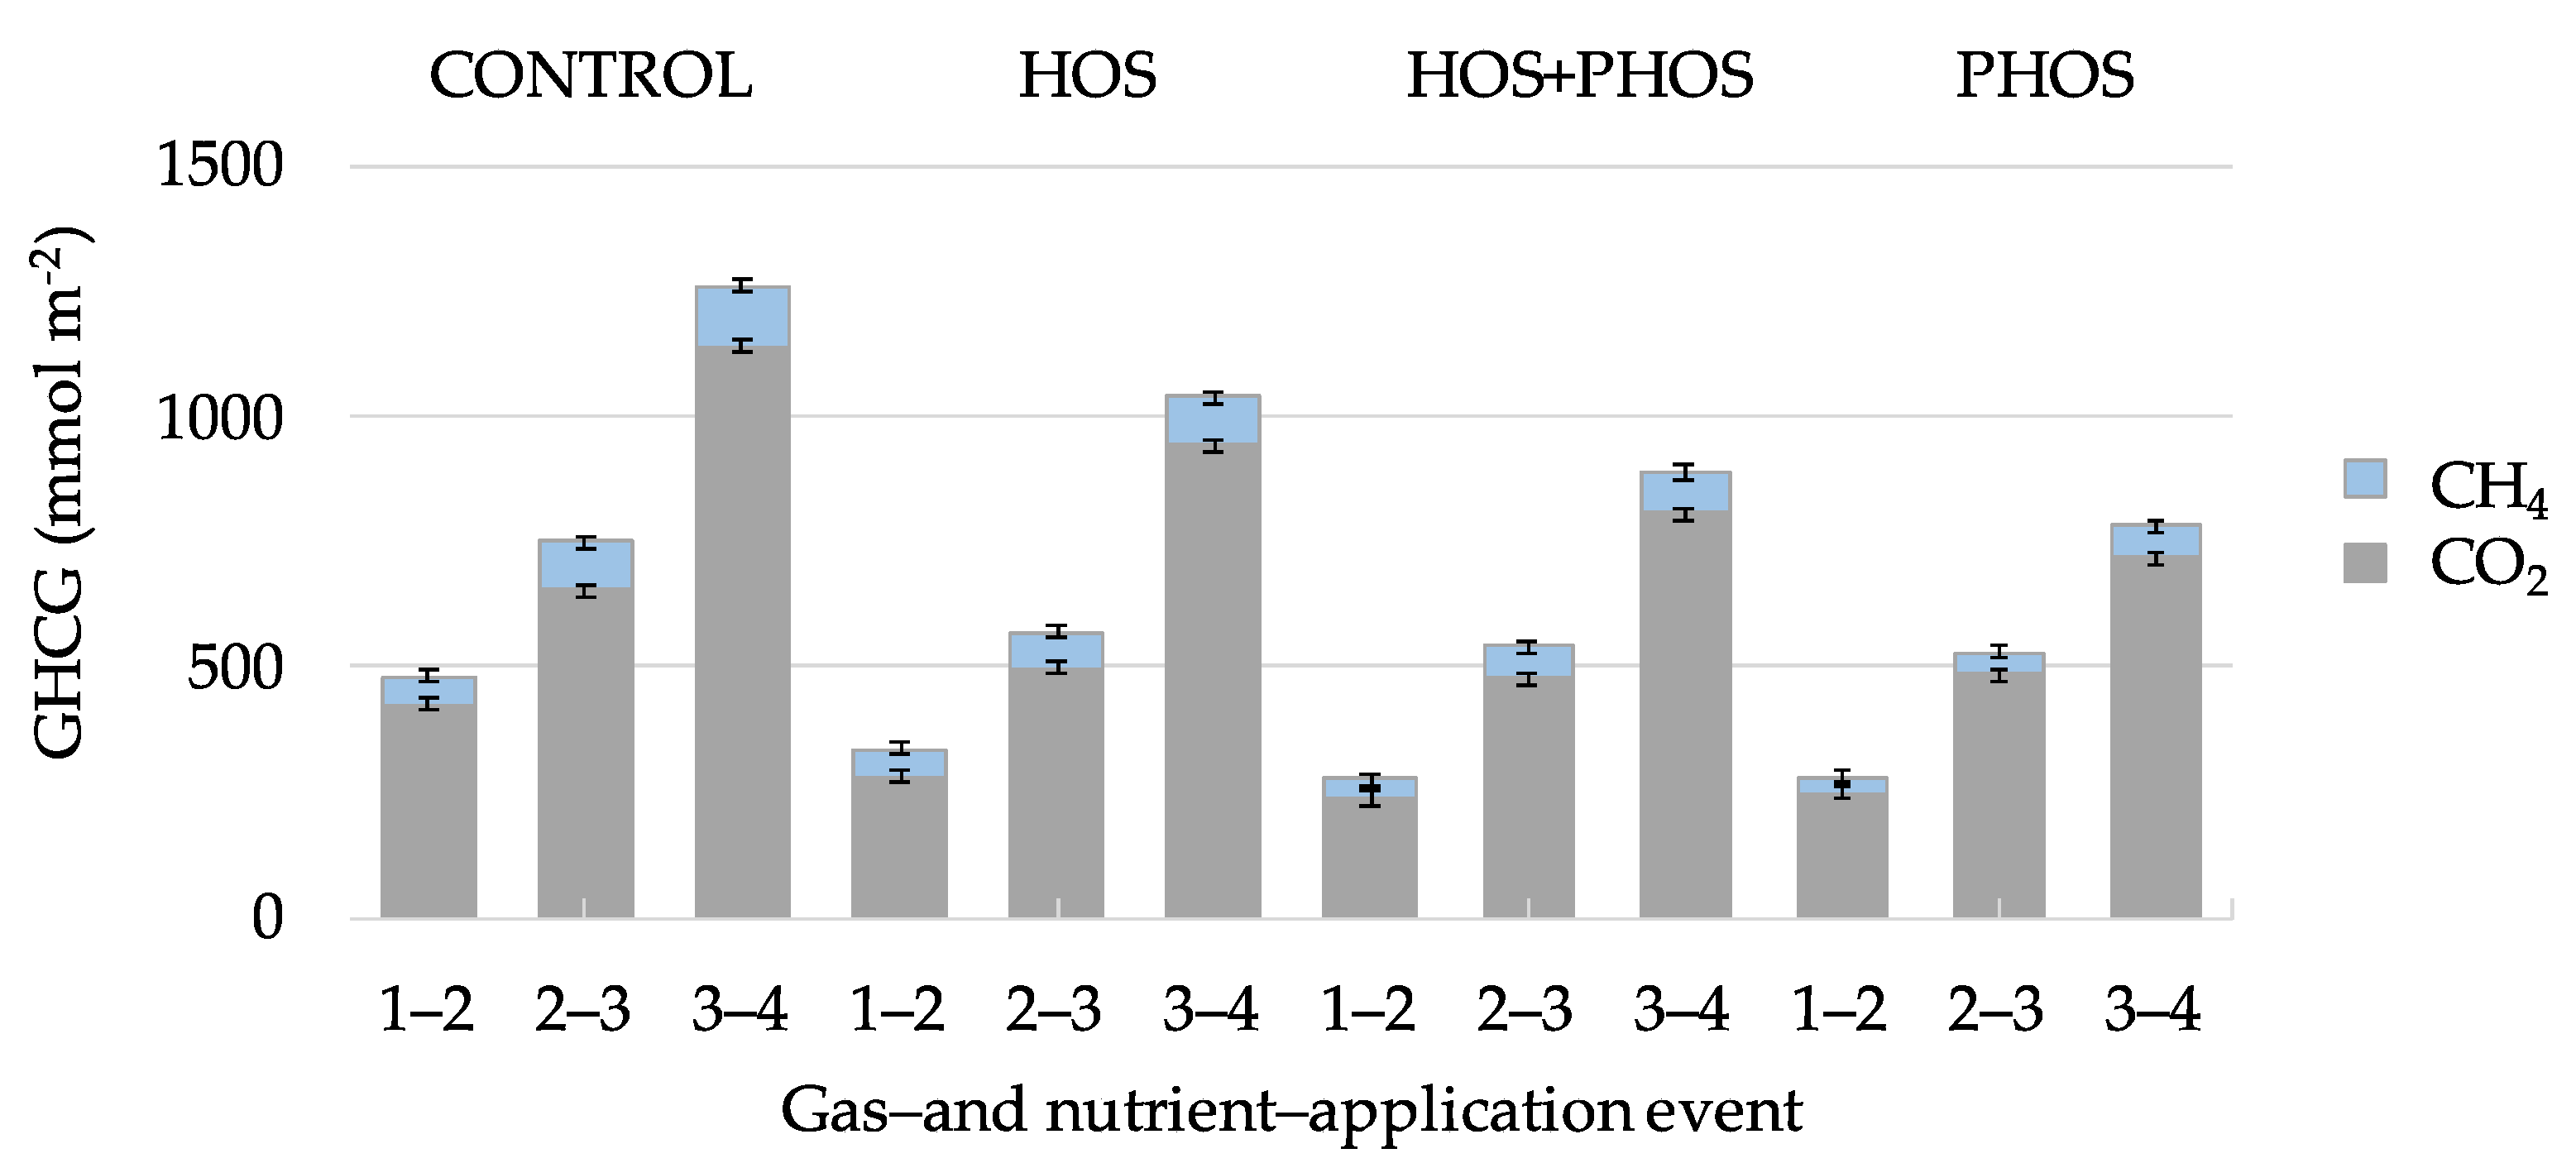
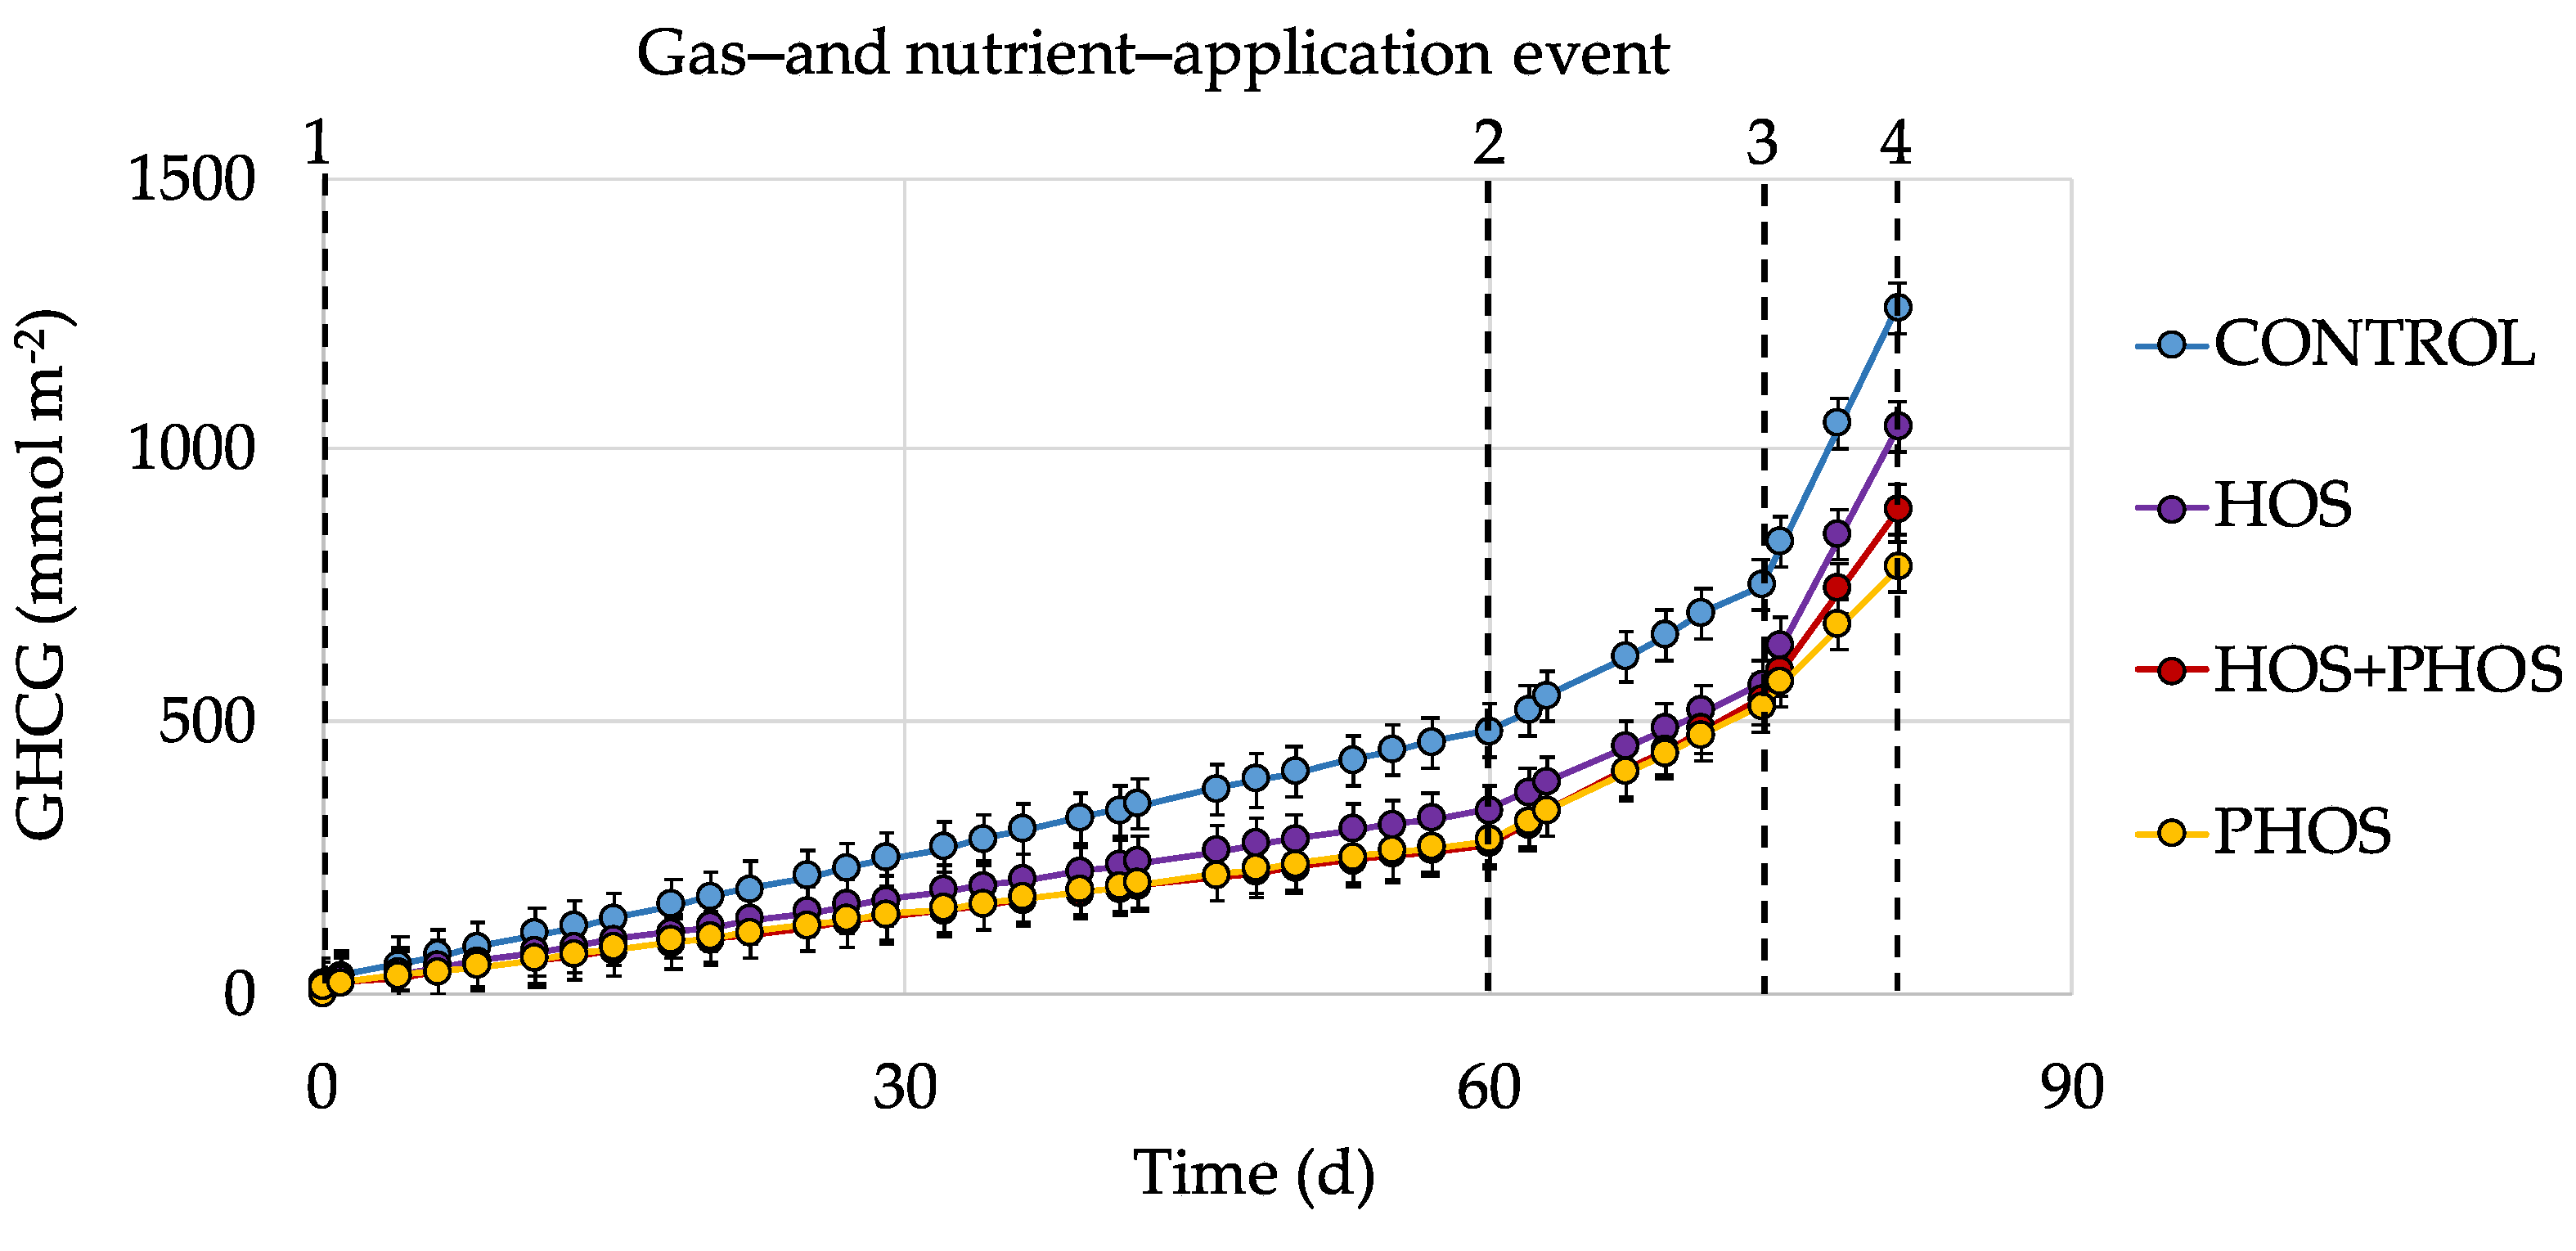
Generated GHCG may dissolve in aqueous phase where CO2 participates in the carbonate system, or be released as gases. Emitted GHCG varied between 782 ± 39 and 1262 ± 63 mmol m−2 during the experiments (Figure 4) and the following order was observed: CONTROL > HOS > HOS + PHOS > PHOS, with CO2 representing 90 ± 5%, and CH4, 10 ± 5% of emitted gasses. In all reactors with application of eutrophication control methods, released CO2 and CH4 were lower than the CONTROL reactor, in which no treatment was applied. Total GHCG emissions from one gas- and nutrient-application event to another (Figure 5) showed that as for the analysis of individual GHCG, the following order: was observed: CONTROL > HOS > HOS + PHOS > PHOS.
Average GHCG generation rates in the CONTROL reactor were 15.6 ± 0.2 mmol m−2 d−1 varying from 8.1 to 72.9 mmol m−2 d−1 between gas- and nutrient application events. Application of eutrophication control methods caused average GHCG generation rates of 12.8 mmol m−2 d−1 for HOS, 11.0 for HOS + PHOS, and 9.7 mmol m−2 d−1 for PHOS (Figure 5), an average standard deviation of ±1.2 mmol m−2 d−1.
These experimental results were validated with results from field observations reported by Carnero-Bravo et al. [70] from which an average organic C reduction rate of 19.5 mmol m−2 d−1 was calculated for a three-month period. This value is approximately 20% higher and therefore in good agreement with the average GHCG generation rate of 15.6 ± 0.2 mmol m−2 d−1 obtained for the CONTROL reactor that contained a 12 cm sediment layer with organic matter that had partly been mineralized. Also, our results are within the CHCG emission rates reported for eutrophic lakes with thermal stratification [24,71].
3.4. Organic Matter Mineralization Processes
Through the results on emitted CH4 and changes in aqueous components (Table 6), the magnitudes of the mineralization reactions (Table 1) were determined, and compared to measured emissions of CO2 from the mineralization reactions other than methanogenesis. This analysis allowed accounting for 90 ± 5% of the generated CO2 and the remaining 10% was attributed to mineralization by aerobic respiration (Figure 6).
Mineralization pathways that generated GHCG were mainly those where only CO2 was emitted and in which microorganisms reduce oxygen-containing compounds of nitrate, and sulfate. The availability of these compounds together with the supply of O2 and nutrients, controlled the metabolic sequence responsible for the generation of CO2, and limited methanogenesis, because oxygen-containing electron acceptors such as oxygen and nitrate, and sulfide as the end product of anoxic mineralization, compete or inhibit the formation of CH4 [72].
Dissolved TOC and alkalinity increased with time as redox potentials decreased with repeated gas and nutrient application events. Increased concentrations of the reduced forms of manganese, nitrogen, iron, and sulfur were also observed due to the mineralization of organic matter in the sediment, while concentrations of oxidized forms of these elements decreased. Amounts of phosphate increased in the HOS and CONTROL reactors as redox potential decreased from oxic to anoxic conditions, due to release from sediment as result of mineralization processes [38], and reductive dissolution of phosphate adsorbing substrates [27]. In the PHOS and HOS + PHOS reactors, released phosphate was bound by selective adsorbent added in each application event.
Regarding the mineralization processes, aerobic respiration, denitrification and methanogenesis were the dominating reactions in the beginning of the experiment in all reactors. After the second and third gas- and nutrient application event, sulfate reduction became the main mineralization reaction, while denitrification and methanogenesis continued contributing to the generation of GHCG, although less than sulfate reduction. Iron and manganese reduction reactions contributed very little to the generation of GHCG.
The application of eutrophication control methods reduced between 20 and 40% the generation of GHCG. In the HOS and HOS + PHOS reactors this reduction is a consequence of the decrease in microbial metabolism, where applications of O2 (g) reduced the assimilation of sulfate by microorganisms and thereby the sulfate reduction process [73]. Furthermore, in the PHOS and HOS + PHOS reactors phosphate was bound by the applied selective adsorbent, limiting the metabolism of heterotrophic microorganisms since these are unable to store phosphate, and resulting in lower respiration rates [36].
Despite the changes from oxic to suboxic and anoxic conditions in the experimental reactors, the ratio CO2:CH4 of 90:10 remained constant. This is probably due to mineralization by methanogenesis and release of generated GHCG from anoxic sediment even under oxic and suboxic conditions.
4. Conclusions
The hypothesis of the present work was that applications of eutrophication control methods that include oxygenation in the hypolimnion would increase the generation of GHCG due to the aerobic degradation of organic matter, while the application of selective PO43 -adsorbing material would cause a decreased generation of GHCG due to the limitations of available PO43− for growth of the degrading organisms. To determine the effects of these eutrophication control methods on the generation of GHCG in sediment samples from a eutrophied reservoir, in this paper we evaluated the generation of GHCG and the corresponding respiration processes. This evaluation was implemented in an innovative laboratory experimental system, where the C budgets in the experimental reactors allowed accounting for over 99% of total C.
Generations of GHCG were higher at lower redox potentials, mainly related to increased sulfate-reduction in sediments as other electron acceptors were depleted. Eutrophication control methods reduced between 20 and 40% the generation rates of GHCG, mainly due to lower sulfate reduction as a result of limited available PO43− when the selective PO43−-adsorbing material was added, and inhibited metabolism of sulfate-reducing bacteria, when oxygen was applied. Despite O2 (g) having been added to the reactors in amounts equivalent to two oxygenation systems (Hansen et al. [63]), redox potentials decreased more rapidly after gas and nutrient applications. This caused oxic conditions to be shorter and did not allow HOS to generate more GHCG as hypothesized for this eutrophication control method. The proportions of emitted CO2 and CH4 were constant throughout the experiments despite the redox conditions varying from oxic to anoxic, and methanogenesis occurred most likely within anoxic sediments even under oxic and suboxic conditions.
The good news is that the application of eutrophication control methods in the Valle de Bravo reservoir would most probably result in lower GHCG generation and emission rates. This is due to the repression of sulfate-reduction in water-sediment systems where HOS and PHOS were applied both individually and combined.
Supplementary Materials
The following supporting information can be downloaded at: https://www.mdpi.com/article/10.3390/w14111705/s1, Figure S1: Time-dependent variations of Eh in experimental reactors; Figure S2: Time-dependent variations of pH in experimental reactors.
Author Contributions
D.A.S.-C.: Investigation, Methodology, Data curation, Formal analysis, Visualization, Writing—original draft—review & editing. A.M.H.: Conceptualization, Funding acquisition, Methodology, Supervision, Validation, Reviewing and—review & editing. All authors have read and agreed to the published version of the manuscript.
Funding
Mexican Institute of Water Technology for financial support (Projects TH1913 and TH2012); the National Council of Science and Technology (CONACYT CVU 780094) and the Office of International Affairs and External Cooperation of the University of Costa Rica for scholarships to D.A.S.-C.
Institutional Review Board Statement
Not applicable.
Informed Consent Statement
Not applicable.
Data Availability Statement
Data is contained within the article.
Acknowledgments
The authors thank the Mexican Institute of Water Technology (Projects TH1913 and TH2012) for financial support; the National Council of Science and Technology (CONACYT CVU 780094) and the Office of International Affairs and External Cooperation of the University of Costa Rica for scholarships to D.A.S.-C.; Armando González Sánchez, Rodolfo Sosa Echeverría, and Edson Estrada Arriaga for their technical advice; Vanessa G. Moreno Ayala and Suhaila Díaz Valencia for their technical assistance.
Conflicts of Interest
The authors declare that they have no known competing financial interests or personal relationships that could have appeared to influence the work reported in this paper.
References
- Smith, V.H.; Joye, S.B.; Howarth, R.W. Eutrophication of Freshwater and Marine Ecosystems. Limnol. Oceanogr. 2006, 51, 351–355. [Google Scholar] [CrossRef] [Green Version]
- Smith, V.H.; Schindler, D.W. Eutrophication Science: Where Do We Go from Here? Trends Ecol. Evol. 2009, 24, 201–207. [Google Scholar] [CrossRef] [PubMed]
- Falkowski, P.G.; Raven, J.A. Aquatic Photosynthesis, 2nd ed.; Princeton University Press: Princeton, NJ, USA, 2007; ISBN 978-1-4008-4972-7. [Google Scholar]
- Burgin, A.J.; Hamilton, S.K. Have We Overemphasized the Role of Denitrification in Aquatic Ecosystems? A Review of Nitrate Removal Pathways. Front. Ecol. Environ. 2007, 5, 89–96. [Google Scholar] [CrossRef] [Green Version]
- Thorbergsdóttir, I.M.; Reynir Gíslason, S.; Ingvason, H.R.; Einarsson, Á. Benthic Oxygen Flux in the Highly Productive Subarctic Lake Myvatn, Iceland: In Situ Benthic Flux Chamber Study. Aquat. Ecol. 2004, 38, 177–189. [Google Scholar] [CrossRef]
- Müller, B.; Bryant, L.D.; Matzinger, A.; Wüest, A. Hypolimnetic Oxygen Depletion in Eutrophic Lakes. Environ. Sci. Technol. 2012, 46, 9964–9971. [Google Scholar] [CrossRef]
- Petsch, S.T. The Global Oxygen Cycle. In Treatise on Geochemistry; Elsevier: Amsterdam, The Netherlands, 2014; pp. 437–473. ISBN 978-0-08-098300-4. [Google Scholar]
- Luu, Y.-S. Review: Microbial Mechanisms of Accessing Insoluble Fe(III) as an Energy Source. World J. Microbiol. Biotechnol. 2003, 19, 215–225. [Google Scholar] [CrossRef]
- Jørgensen, B.B.; Findlay, A.J.; Pellerin, A. The Biogeochemical Sulfur Cycle of Marine Sediments. Front. Microbiol. 2019, 10, 849. [Google Scholar] [CrossRef]
- Ouddane, B.; Boust, D.; Martin, E.; Fischer, J.C.; Wartel, M. The Post-Depositional Reactivity of Iron and Manganese in the Sediments of a Macrotidal Estuarine System. Estuaries 2001, 24, 1015. [Google Scholar] [CrossRef]
- Himmelheber, D.W.; Taillefert, M.; Pennell, K.D.; Hughes, J.B. Spatial and Temporal Evolution of Biogeochemical Processes Following In Situ Capping of Contaminated Sediments. Environ. Sci. Technol. 2008, 42, 4113–4120. [Google Scholar] [CrossRef]
- Song, Y.; Müller, G. Sediment-Water Interactions in Anoxic Freshwater Sediments; Lecture Notes in Earth Sciences; Springer: Berlin/Heidelberg, Germany, 1999; Volume 81, ISBN 978-3-540-65022-5. [Google Scholar]
- Lovley, D.R. Organic Matter Mineralization with the Reduction of Ferric Iron: A Review. Geomicrobiol. J. 1987, 5, 375–399. [Google Scholar] [CrossRef]
- Holmer, M.; Storkholm, P. Sulphate Reduction and Sulphur Cycling in Lake Sediments: A Review: Sulphate Cycling in Lake Sediments. Freshw. Biol. 2001, 46, 431–451. [Google Scholar] [CrossRef]
- Borrel, G.; Jézéquel, D.; Biderre-Petit, C.; Morel-Desrosiers, N.; Morel, J.-P.; Peyret, P.; Fonty, G.; Lehours, A.-C. Production and Consumption of Methane in Freshwater Lake Ecosystems. Res. Microbiol. 2011, 162, 832–847. [Google Scholar] [CrossRef]
- Wilson, R.M.; Tfaily, M.M.; Rich, V.I.; Keller, J.K.; Bridgham, S.D.; Zalman, C.M.; Meredith, L.; Hanson, P.J.; Hines, M.; Pfeifer-Meister, L.; et al. Hydrogenation of Organic Matter as a Terminal Electron Sink Sustains High CO2:CH4 Production Ratios during Anaerobic Decomposition. Org. Geochem. 2017, 112, 22–32. [Google Scholar] [CrossRef] [Green Version]
- St. Louis, V.L.; Kelly, C.A.; Duchemin, É.; Rudd, J.W.M.; Rosenberg, D.M. Reservoir Surfaces as Sources of Greenhouse Gases to the Atmosphere: A Global Estimate. BioScience 2000, 50, 766. [Google Scholar] [CrossRef]
- Malyan, S.K.; Singh, O.; Kumar, A.; Anand, G.; Singh, R.; Singh, S.; Yu, Z.; Kumar, J.; Fagodiya, R.K.; Kumar, A. Greenhouse Gases Trade-Off from Ponds: An Overview of Emission Process and Their Driving Factors. Water 2022, 14, 970. [Google Scholar] [CrossRef]
- Rochette, P.; Eriksen-Hamel, N.S. Chamber Measurements of Soil Nitrous Oxide Flux: Are Absolute Values Reliable? Soil Sci. Soc. Am. J. 2008, 72, 331–342. [Google Scholar] [CrossRef]
- Hansen, J.; Thamdrup, B.; Jørgensen, B. Anoxic Incubation of Sediment in Gas-Tight Plastic Bags: A Method for Biogeochemical Process Studies. Mar. Ecol. Prog. Ser. 2000, 208, 273–282. [Google Scholar] [CrossRef]
- Van Afferden, M.; Hansen, A.M.; Kaiser, C.; Chapelain, N. Laboratory Test System to Measure Microbial Respiration Rate. Int. J. Environ. Pollut. 2006, 26, 220. [Google Scholar] [CrossRef]
- Chen, Z.; Ye, X.; Huang, P. Estimating Carbon Dioxide (CO2) Emissions from Reservoirs Using Artificial Neural Networks. Water 2018, 10, 26. [Google Scholar] [CrossRef] [Green Version]
- Seibert, S.L.; Greskowiak, J.; Prommer, H.; Böttcher, M.E.; Massmann, G. Modeling of Biogeochemical Processes in a Barrier Island Freshwater Lens (Spiekeroog, Germany). J. Hydrol. 2019, 575, 1133–1144. [Google Scholar] [CrossRef]
- Sánchez-Carrillo, S.; Alcocer, J.; Vargas-Sánchez, M.; Soria-Reinoso, I.; Rivera-Herrera, E.M.; Cortés-Guzmán, D.; Cuevas-Lara, D.; Guzmán-Arias, A.P.; Merino-Ibarra, M.; Oseguera, L.A. Greenhouse Gas Emissions from Mexican Inland Waters: First Estimation and Uncertainty Using an Upscaling Approach. Inland Waters 2022, 1–17. [Google Scholar] [CrossRef]
- SINA (Sistema Nacional de Información del Agua). Sistema Cutzamala. Available online: http://sina.conagua.gob.mx/sina/index.php (accessed on 11 August 2021).
- INEGI (Instituto Nacional de Estadística y Geografía). Resultados Generales del Censo de Población y Vivienda. 2020. Available online: https://www.inegi.org.mx/programas/ccpv/2020/ (accessed on 5 August 2021).
- Márquez-Pacheco, H.; Hansen, A.M.; Falcón-Rojas, A. Phosphorous Control in a Eutrophied Reservoir. Environ. Sci. Pollut. Res. 2013, 20, 8446–8456. [Google Scholar] [CrossRef] [PubMed]
- Nandini, S.; Sánchez-Zamora, C.; Sarma, S.S.S. Toxicity of Cyanobacterial Blooms from the Reservoir Valle de Bravo (Mexico): A Case Study on the Rotifer Brachionus Calyciflorus. Sci. Total Environ. 2019, 688, 1348–1358. [Google Scholar] [CrossRef] [PubMed]
- World Bank; CONAGUA (Comisión Nacional del Agua). Diagnóstico Para El Manejo Integral de Las Subcuencas Tuxpan, El Bosque, Ixtapan del Oro, Valle de Bravo, Colorines-Chilesdo y Villa Victoria Pertenecientes al Sistema Cutzamala. Available online: https://www.gob.mx/conagua/documentos/diagnostico-para-el-manejo-integral-de-las-subcuencas-tuxpan-el-bosque-ixtapan-del-oro-valle-de-bravo-colorines-chilesdo-y-villa-victoria-pertenecientes-al-sistema-cutzamala (accessed on 1 May 2022).
- INEGI (Instituto Nacional de Estadística y Geografía). Uso de Suelo y Vegetación, Serie V, Escala 1:250,000. Available online: https://www.inegi.org.mx/temas/usosuelo/ (accessed on 5 August 2021).
- Bishop, W.M.; Richardson, R.J. Influence of Phoslock® on Legacy Phosphorus, Nutrient Ratios, and Algal Assemblage Composition in Hypereutrophic Water Resources. Environ. Sci. Pollut. Res. 2018, 25, 4544–4557. [Google Scholar] [CrossRef] [PubMed]
- Lürling, M.; Faassen, E.J. Controlling Toxic Cyanobacteria: Effects of Dredging and Phosphorus-Binding Clay on Cyanobacteria and Microcystins. Water Res. 2012, 46, 1447–1459. [Google Scholar] [CrossRef]
- Gantzer, P.A.; Bryant, L.D.; Little, J.C. Effect of Hypolimnetic Oxygenation on Oxygen Depletion Rates in Two Water-Supply Reservoirs. Water Res. 2009, 43, 1700–1710. [Google Scholar] [CrossRef]
- Beutel, M.W.; Horne, A.J. A Review of the Effects of Hypolimnetic Oxygenation on Lake and Reservoir Water Quality. Lake Reserv. Manag. 1999, 15, 285–297. [Google Scholar] [CrossRef] [Green Version]
- Epe, T.S.; Finsterle, K.; Yasseri, S. Nine Years of Phosphorus Management with Lanthanum Modified Bentonite (Phoslock) in a Eutrophic, Shallow Swimming Lake in Germany. Lake Reserv. Manag. 2017, 33, 119–129. [Google Scholar] [CrossRef]
- Elser, J.; Kyle, M.; Learned, J.; McCrackin, M.; Peace, A.; Steger, L. Life on the Stoichiometric Knife-Edge: Effects of High and Low Food C:P Ratio on Growth, Feeding, and Respiration in Three Daphnia Species. Inland Waters 2016, 6, 136–146. [Google Scholar] [CrossRef]
- Zamparas, M.; Zacharias, I. Restoration of Eutrophic Freshwater by Managing Internal Nutrient Loads. A Review. Sci. Total Environ. 2014, 496, 551–562. [Google Scholar] [CrossRef]
- Søndergaard, M.; Jensen, J.P.; Jeppesen, E. Role of Sediment and Internal Loading of Phosphorus in Shallow Lakes. Hydrobiologia 2003, 506–509, 135–145. [Google Scholar] [CrossRef]
- Xu, R.; Lyu, T.; Zhang, M.; Cooper, M.; Pan, G. Molecular-Level Investigations of Effective Biogenic Phosphorus Adsorption by a Lanthanum/Aluminum-Hydroxide Composite. Sci. Total Environ. 2020, 725, 138424. [Google Scholar] [CrossRef] [PubMed]
- Xu, R.; Lyu, T.; Wang, L.; Yuan, Y.; Zhang, M.; Cooper, M.; Mortimer, R.J.G.; Yang, Q.; Pan, G. Utilization of Coal Fly Ash Waste for Effective Recapture of Phosphorus from Waters. Chemosphere 2022, 287, 132431. [Google Scholar] [CrossRef] [PubMed]
- Haghseresht, F.; Wang, S.; Do, D.D. A Novel Lanthanum-Modified Bentonite, Phoslock, for Phosphate Removal from Wastewaters. Appl. Clay Sci. 2009, 46, 369–375. [Google Scholar] [CrossRef]
- Yin, H.; Kong, M.; Han, M.; Fan, C. Influence of Sediment Resuspension on the Efficacy of Geoengineering Materials in the Control of Internal Phosphorous Loading from Shallow Eutrophic Lakes. Environ. Pollut. 2016, 219, 568–579. [Google Scholar] [CrossRef]
- Hansen, A.M.; Ruiz-Castro, A.A.; Diáz-Valencia, S.E.; Moreno-Ayala, V.G.; Diáz-Aldama, E.; Sandoval, D.A.; Santana-Vega, Z. Dimensionamiento Hidrogeoquímico Para La Rehabilitación de Cuerpos de Agua. Acta INAGEQ 2020, 26, 9–29. (In Spanish) [Google Scholar]
- Gächter, R.; Müller, B. Why the Phosphorus Retention of Lakes Does Not Necessarily Depend on the Oxygen Supply to Their Sediment Surface. Limnol. Oceanogr. 2003, 48, 929–933. [Google Scholar] [CrossRef]
- Hansen, A.M.; Márquez-Pacheco, H. Procedimiento Para Evaluar Cargas Internas de Nutrientes En Cuerpos de Agua. Rev. Mex. Cienc. Geológicas 2012, 29, 265–275. [Google Scholar]
- Walthert, L.; Graf, U.; Kammer, A.; Luster, J.; Pezzotta, D.; Zimmermann, S.; Hagedorn, F. Determination of Organic and Inorganic Carbon, δ 13 C, and Nitrogen in Soils Containing Carbonates after Acid Fumigation with HCl. J. Plant Nutr. Soil Sci. 2010, 173, 207–216. [Google Scholar] [CrossRef]
- ASTM (American Society for Testing and Materials) Standard Test Methods for Determining the Water (Moisture) Content, Ash Content, and Organic Material of Peat and Other Organic Soils. ASTM D 2974-07a Standard Test. Available online: https://www.astm.org/d2974-20e01.html (accessed on 11 March 2022).
- Merck Test Alkalinity 111109. Available online: https://www.merckmillipore.com/MX/es/product/Alkalinity-Test,MDA_CHEM-111109#documentation (accessed on 11 September 2021).
- EPA (Environmental Protection Agency). Method 365.3: Phosphorous, All Forms (Colorimetric, Ascorbic Acid, Two Reagent). Available online: https://www.epa.gov/sites/default/files/2015-08/documents/method_365-3_1978.pdf (accessed on 15 September 2021).
- ISO (International Organization for Standardization). ISO 11905-1: Water Quality—Determination of Nitrogen—Part 1: Method Using Oxidative Digestion with Peroxodisulfate. Available online: https://www.iso.org/cms/render/live/en/sites/isoorg/contents/data/standard/00/21/2155.html (accessed on 27 September 2021).
- DIN (Deutsches Institut für Normung). DIN 38405 German Standard Methods for Examination of Water, Waste Water and Sludge—Anions (Group D)—Part 9: Spectrometric Determination of Nitrate (D 9). Available online: https://www.din.de/en/getting-involved/standards-committees/textilnorm/publications/wdc-beuth:din21:144185708 (accessed on 27 September 2021).
- DIN (Deutsches Institut für Normung). DIN 38406-5 German Standard Methods for the Examination of Water, Waste Water and Sludge; Cations (Group E); Determination of Ammonia-Nitrogen (E 5). Available online: https://www.din.de/en/getting-involved/standards-committees/textilnorm/publications/wdc-beuth:din21:1061756 (accessed on 27 September 2021).
- EPA (Environmental Protection Agency). Method—375.4. Methods and Guidance for Analysis of Water: Sulfate (Turbidimetric). Available online: https://www.nemi.gov/methods/method_summary/5316/ (accessed on 15 September 2021).
- EPA (Environmental Protection Agency). Method—376.2. Methods and Guidance for Analysis of Water: Sulfide (Colorimetric, Methylene Blue). Available online: https://www.nemi.gov/methods/method_summary/5318/ (accessed on 15 September 2021).
- APHA (American Public Health Association). 3500-Fe Iron. In Standard Methods for the Examination of Water and Wastewater; American Public Health Association: Washington, DC, USA, 2018. [Google Scholar]
- Merck Test Manganese-114770. Available online: https://www.merckmillipore.com/MX/es/product/Manganese-Test,MDA_CHEM-114770 (accessed on 11 September 2021).
- Merck, Calcium Test 14815. Available online: https://www.merckmillipore.com/MX/es/product/SQ-Calcium-Test,MDA_CHEM-114815 (accessed on 29 April 2022).
- Merck, Magnesium Cell Test 100815. Available online: https://www.merckmillipore.com/MX/es/product/Magnesium-Cell-Test,MDA_CHEM-100815 (accessed on 28 April 2022).
- Merck Sodium Cell Test 100885. Available online: https://www.merckmillipore.com/MX/es/product/Sodium-Cell-Test-in-nutrient-solutions-for-fertilization,MDA_CHEM-100885 (accessed on 28 April 2022).
- Merck, Potassium Cell Test. Available online: https://www.merckmillipore.com/MX/es/product/Potassium-Cell-Test,MDA_CHEM-114562 (accessed on 29 April 2021).
- Merck, Chloride Test 14897. Available online: https://www.merckmillipore.com/MX/es/product/Chloride-Test,MDA_CHEM-114562 (accessed on 28 April 2022).
- Di Rienzo, J.; Casanoves, F.; Balzarini, M.; González, L. Infostat—Software Estadístico; Universidad Nacional de Córdoba: Córdoba, Argentina, 2020. [Google Scholar]
- Hansen, A.M.; Hernández-Martínez, C.; Falcón-Rojas, A. Evaluation of Eutrophication Control Through Hypolimnetic Oxygenation. Procedia Earth Planet. Sci. 2017, 17, 598–601. [Google Scholar] [CrossRef]
- Hansen, A.M.; Márquez-Pacheco, H. Internal Phosphorus Load in a Mexican Reservoir: Forecast and Validation: Internal Phosphorus Load in a Mexican Reservoir. Environ. Toxicol. Chem. 2015, 34, 2583–2589. [Google Scholar] [CrossRef] [PubMed]
- Phoslock Europe GmbH about Phoslock. Available online: https://www.phoslock.eu/es/sobre-phoslock (accessed on 21 May 2021).
- SRI Instrument. Method 25 Methane/Nonmethane GC. Available online: https://www.srigc.com/home/product_detail/method-25-methanenonmethane-gc (accessed on 12 August 2021).
- Haynes, W.M. (Ed.) CRC Handbook of Chemistry and Physics, 95th ed.; CRC Press: Boca Raton, FL, USA, 2014; ISBN 978-0-429-17019-5. [Google Scholar]
- Grundl, T.J.; Haderlein, S.; Nurmi, J.T.; Tratnyek, P.G. Introduction to Aquatic Redox Chemistry; ACS Symposium Series; Tratnyek, P.G., Grundl, T.J., Haderlein, S.B., Eds.; American Chemical Society: Washington, DC, USA, 2011; Volume 1071, pp. 1–14. ISBN 978-0-8412-2652-4. [Google Scholar]
- Burgin, A.J.; Yang, W.H.; Hamilton, S.K.; Silver, W.L. Beyond Carbon and Nitrogen: How the Microbial Energy Economy Couples Elemental Cycles in Diverse Ecosystems. Front. Ecol. Environ. 2011, 9, 44–52. [Google Scholar] [CrossRef] [Green Version]
- Carnero-Bravo, V.; Merino-Ibarra, M.; Ruiz-Fernández, A.C.; Sanchez-Cabeza, J.A.; Ghaleb, B. Sedimentary Record of Water Column Trophic Conditions and Sediment Carbon Fluxes in a Tropical Water Reservoir (Valle de Bravo, Mexico). Environ. Sci. Pollut. Res. 2015, 22, 4680–4694. [Google Scholar] [CrossRef] [PubMed]
- Adams, D.D. Diffuse Flux of Greenhouse Gases—Methane and Carbon Dioxide—At the Sediment-Water Interface of Some Lakes and Reservoirs of the World. In Greenhouse Gas Emissions—Fluxes and Processes; Tremblay, A., Varfalvy, L., Roehm, C., Garneau, M., Eds.; Environmental Science and Engineering; Springer: Berlin/Heidelberg, Germany, 2005; pp. 129–153. ISBN 978-3-540-23455-5. [Google Scholar]
- Bastviken, D. Methane. In Encyclopedia of Inland Waters; Elsevier: Amsterdam, The Netherlands, 2009; pp. 783–805. ISBN 978-0-12-370626-3. [Google Scholar]
- Stoeva, M.K.; Coates, J.D. Specific Inhibitors of Respiratory Sulfate Reduction: Towards a Mechanistic Understanding. Microbiology 2019, 165, 254–269. [Google Scholar] [CrossRef] [PubMed]
Figure 1.
Main tributaries and land use in the Valle de Bravo basin. Prepared with data (1:250,000) from [30].
Figure 1.
Main tributaries and land use in the Valle de Bravo basin. Prepared with data (1:250,000) from [30].

Figure 2.
Experimental respiration and gas-trapping system.

Figure 3.
Carbon mass-balance for the experimental reactors. GHCG(aq) = H2CO3* + CH4(aq) calculated with solubility data [67].
Figure 3.
Carbon mass-balance for the experimental reactors. GHCG(aq) = H2CO3* + CH4(aq) calculated with solubility data [67].

Figure 4.
Emissions of CO2 and CH4 from experimental reactors from one gas- and nutrient application event to another. [Sed] = 14.1 g (dw) L−1; [TOC] = 11,302 mmol m−2; I = 2.6 mmol L−1; T = 28.2 ± 1.5 °C; for Eh and pH values, see Table 5.
Figure 4.
Emissions of CO2 and CH4 from experimental reactors from one gas- and nutrient application event to another. [Sed] = 14.1 g (dw) L−1; [TOC] = 11,302 mmol m−2; I = 2.6 mmol L−1; T = 28.2 ± 1.5 °C; for Eh and pH values, see Table 5.

Figure 5.
Time-dependent emissions of GHCG in experimental reactors. [Sed] = 14.1 g (dw) L−1; [TOC] = 11,302 mmol m−2; I = 2.6 mmol L−1; T = 28.2 ± 1.5 °C; for Eh and pH values, see Table 5.
Figure 5.
Time-dependent emissions of GHCG in experimental reactors. [Sed] = 14.1 g (dw) L−1; [TOC] = 11,302 mmol m−2; I = 2.6 mmol L−1; T = 28.2 ± 1.5 °C; for Eh and pH values, see Table 5.

Figure 6.
Process-dependent emissions of GHCG in experimental reactors. [Sed] = 14.1 g (dw) L−1; [TOC] = 11,302 mmol m-2; I = 2.6 mmol L−1; T = 28.2 ± 1.5 °C; for Eh and pH values, see Table 5.
Figure 6.
Process-dependent emissions of GHCG in experimental reactors. [Sed] = 14.1 g (dw) L−1; [TOC] = 11,302 mmol m-2; I = 2.6 mmol L−1; T = 28.2 ± 1.5 °C; for Eh and pH values, see Table 5.


Table 1.
Organic matter mineralization reactions (modified from [12]).
Table 1.
Organic matter mineralization reactions (modified from [12]).
| Processes | Mineralization Reactions |
|---|---|
| O(Ø)/(-II) | (CH2O)106(NH3)16(PO43−) + 138O2 → 106CO2 + 16NO3− + PO43− + 122H2O |
| Mn(IV)/(II) | (CH2O)106(NH3)16(PO43−) + 236MnO2 + 472H+ → 236Mn2+ + 106CO2 + 8N2 + PO43− + 366H2O |
| N(V)/(Ø) | (CH2O)106(NH3)16(PO43−) + 94.4NO3− + 94.4H+ → 106CO2 + 55.2N2 + PO43− + 177.2H2O |
| Fe(III)/(II) | (CH2O)106(NH3)16(PO43−) + 424FeOOH + 848H+ → 424Fe2+ + 106CO2 + 16NH3 + PO43− + 742H2O |
| S(VI)/(-II) | (CH2O)106(NH3)16(PO43−) + 53SO42− → 106CO2 + 16NH3 + 53S2− + PO43− + 106H2O |
| C(Ø)/(±IV) | (CH2O)106(NH3)16(PO43−) → 53CO2 + 53CH4 + 16NH3 + PO43− |
Aerobic mineralization: O(Ø)/(-II), manganese reduction: Mn(IV)/(II), denitrification: N(V)/(Ø), iron reduction: Fe(III)/(II), sulfate reduction: S(VI)/(-II), and methanogenesis: C(Ø)/(±IV).
Table 2.
Analytical methods for characterization of the combined water sample.
| Parameter | Method | Reference |
|---|---|---|
| Total Organic Carbon (TOC) | ASTM D2974 | [47] |
| Alkalinity | MQuant 11109 | [48] |
| Phosphate (PO43−) | EPA 365.3 | [49] |
| Total Nitrogen (NT) | ISO 11905-1 | [50] |
| Nitrate (NO3−) | DIN 38405 | [51] |
| Ammonium (NH4+) | DIN 38406-5 | [52] |
| Sulfate (SO42−) | EPA 375.4 | [53] |
| Sulfide (S2−) | EPA 376.2 | [54] |
| Total iron (FeT), Fe (II and III) | APHA 3500-Fe | [55] |
| Manganese (II) | MQuant 14770 | [56] |
| Calcium | MQuant 14815 | [57] |
| Magnesium | MQuant 100815 | [58] |
| Sodium | MQuant 114562 | [59] |
| Potassium | MQuant 100885 | [60] |
| Chloride | MQuant 14897 | [61] |
Table 3.
Application of N2/O2 (g) and Phoslock in experimental reactors.
| Reactor | Method | Gas |
|---|---|---|
| CONTROL | No eutrophication control treatment | 20 mL/20 min N2 (Infra 99.9%) as carrier gas |
| HOS | Intermittent applications of O2 (g) | 20 mL/20 min O2 (Infra 99.7%) for oxygenation and as carrier gas |
| PHOS | Intermittent applications of Phoslock | 20 mL/20 min N2 (Infra 99.9%) as carrier gas |
| HOS + PHOS | Intermittent applications of O2 (g) and Phoslock | 20 mL/20 min O2 (Infra 99.7%) for oxygenation and as carrier gas |
Table 4.
Carbon mass balances for the experimental reactors (mmol m−2).
| Parameter | Initial | CONTROL | HOS | HOS + PHOS | PHOS |
|---|---|---|---|---|---|
| Emitted GHCG | 0 | 1262 | 1040 | 890 | 782 |
| GHCGaq | <1 | <1 | <1 | <1 | <1 |
| Alkalinity | 37 | 238 | 245 | 234 | 245 |
| TOCaq | 10 | 155 | 183 | 196 | 156 |
| TOCsed | 11,302 | 9591 | 9826 | 9912 | 10,067 |
| TICsed | <1 | <1 | <1 | <1 | <1 |
| Total | 11,349 | 11,246 | 11,294 | 11,232 | 11,250 |
Table 5.
Variations in Eh and pH values in experimental reactors.
| Reactor | Gas-and Nutrient Application Events | |||||
|---|---|---|---|---|---|---|
| 1–2 (0–60 d) | 2–3 (60–74 d) | 3–4 (74–81 d) | ||||
| Eh | pH | Eh | pH | Eh | pH | |
| CONTROL | 282 ± 203 | 4.7 ± 0.8 | −260 ± 175 | 6.0 ± 0.2 | −477 ± 34 | 6.2 ± 0.2 |
| HOS | 131 ± 240 | 4.7 ± 0.6 | −348 ± 73 | 6.1 ± 0.1 | −450 ± 4 | 6.3 ± 0.1 |
| HOS + PHOS | 24 ± 339 | 4.8 ± 1.1 | −42 ± 171 | 6.0 ± 0.2 | −253 ± 390 | 6.2 ± 0.1 |
| PHOS | 216 ± 40 | 5.5 ± 0.3 | −339 ± 100 | 6.3 ± 0.2 | −466 ± 14 | 6.3 ± 0.2 |
| Average | 161 ± 242 | 4.9 ± 0.8 | −212 ± 232 | 6.1 ± 0.2 | −409 ± 171 | 6.2 ± 0.1 |
Table 6.
Amounts of aqueous components per unit area in experimental reactors. Water volume = 4.8 L. Reactor area = 0.0269 m2.
Table 6.
Amounts of aqueous components per unit area in experimental reactors. Water volume = 4.8 L. Reactor area = 0.0269 m2.
| Reactor | Time | TOC | Alk | PO43− | NO3− | NH4+ | N2 | SO42− | S2− | Fe(T) | Fe(III) | Fe(II) | Mn(II) |
|---|---|---|---|---|---|---|---|---|---|---|---|---|---|
| (d) | mmol m−2 | ||||||||||||
| CONTROL | 0 | 10 | 108 | 0.07 | 15.4 | 14.1 | 0 | 123 | <0.06 | 7.049 | 0.065 | 6.984 | 1.78 |
| 60 | 75 | 152 | 0.23 | 0.51 | 11.2 | 73.2 | 637 | 0.06 | 1.072 | 0.520 | 0.552 | 0.71 | |
| 74 | 152 | 175 | 0.24 | 0.25 | 24.6 | 26.1 | 279 | 0.07 | 0.585 | 0.032 | 0.552 | 0.60 | |
| 81 | 155 | 234 | 1.18 | 0.25 | 19.5 | 6.3 | 0 | 0.65 | 4.467 | <0.001 | 4.467 | 0.45 | |
| HOS | 0 | 10 | 78 | 0.08 | 30.6 | 17.9 | 0 | 58 | <0.06 | 0.474 | 0.058 | 0.416 | 1.68 |
| 60 | 114 | 138 | 1.67 | 0.51 | 13.9 | 81.3 | 491 | 0.09 | 11.50 | <0.001 | 11.50 | 8.58 | |
| 74 | 179 | 204 | 0.11 | 0.25 | 21.1 | 13.9 | 299 | 0.11 | 0.780 | 0.065 | 0.715 | 0.66 | |
| 81 | 183 | 245 | 5.07 | 0.25 | 12.3 | 0 | 16 | 0.11 | 24.85 | <0.001 | 24.85 | 2.58 | |
| HOS + PHOS | 0 | 10 | 45 | 0.09 | 37.3 | 20.2 | 0 | 45 | <0.06 | 1.754 | 0.578 | 1.176 | 1.24 |
| 60 | 29 | 178 | 0.04 | 0.51 | 10.7 | 26.2 | 448 | 0.04 | 0.520 | 0.065 | 0.455 | 0.77 | |
| 74 | 165 | 197 | 0.08 | 2.55 | 18.1 | 32.4 | 309 | 0.20 | 31.25 | <0.001 | 31.25 | 2.82 | |
| 81 | 196 | 238 | 0.11 | 0.25 | 18.6 | 5.1 | 0.0 | 0.07 | 26.31 | <0.001 | 26.31 | 2.80 | |
| PHOS | 0 | 10 | 37 | 0.07 | 34.5 | 21.0 | 0 | 55 | <0.06 | 0.510 | 0.094 | 0.416 | 1.10 |
| 60 | 32 | 138 | 0.02 | 0.51 | 16.0 | 8.2 | 318 | 0.06 | 0.520 | 0.097 | 0.422 | 0.77 | |
| 74 | 121 | 230 | 0.02 | 6.37 | 24.1 | 10.2 | 263 | 0.01 | 6.205 | 0.162 | 6.042 | 1.09 | |
| 81 | 156 | 245 | 0.23 | 0.25 | 25.6 | 0 | 0.0 | 0.49 | 8.527 | <0.001 | 8.527 | 1.23 | |
Publisher’s Note: MDPI stays neutral with regard to jurisdictional claims in published maps and institutional affiliations. |
© 2022 by the authors. Licensee MDPI, Basel, Switzerland. This article is an open access article distributed under the terms and conditions of the Creative Commons Attribution (CC BY) license (https://creativecommons.org/licenses/by/4.0/).
Share and Cite
MDPI and ACS Style
Sandoval-Chacón, D.A.; Hansen, A.M. Effect of Eutrophication Control Methods on the Generation of Greenhouse Carbon Gases in Sediment. Water 2022, 14, 1705. https://doi.org/10.3390/w14111705
AMA Style
Sandoval-Chacón DA, Hansen AM. Effect of Eutrophication Control Methods on the Generation of Greenhouse Carbon Gases in Sediment. Water. 2022; 14(11):1705. https://doi.org/10.3390/w14111705
Chicago/Turabian StyleSandoval-Chacón, DAngelo A., and Anne M. Hansen. 2022. "Effect of Eutrophication Control Methods on the Generation of Greenhouse Carbon Gases in Sediment" Water 14, no. 11: 1705. https://doi.org/10.3390/w14111705
Note that from the first issue of 2016, this journal uses article numbers instead of page numbers. See further details here.