
Hydrologic and Thermal Performance of a Full-Scale Farmed Blue–Green Roof


Department of Civil Engineering, Toronto Metropolitan University, 350 Victoria St., Toronto, ON M5B2K3, Canada
*
Author to whom correspondence should be addressed.
Water 2022, 14(11), 1700; https://doi.org/10.3390/w14111700
Submission received: 5 May 2022
/
Revised: 19 May 2022
/
Accepted: 23 May 2022
/
Published: 25 May 2022
Abstract
:Conventional green roofs have been widely accepted as a climate change adaptation strategy. However, little is known about the potential of blue–green roofs and rooftop farms to control urban stormwater and improve microclimates. This study evaluates a farmed blue–green roof’s hydrologic and thermal performance over an entire growing season in Toronto, Ontario, Canada. The runoff discharge from three plots planted with various crops was monitored. The substrate and air temperatures at two elevations of different cultivated and self-sowing plant species were collected and compared to a control roof. Results indicate that planting and harvesting activities impacted the hydrologic performance. Mean values for retention ranged from 85–88%, peak attenuation ranged from 82–85%, and peak delay ranged from 7.7 to 8 h. At the lower elevation, the mean air temperature difference above okra, tobacco, and beet was 2.5 °C, whereas, above squash, potato, and milkweed, it was 1.4 °C. Maximum and moderate air-cooling effects were observed in the afternoon and evening, but a warming effect was observed in the early morning. Farmed blue–green roof evaluated in this study provides a runoff control and microclimate improvement comparable to or better than conventional green roofs, in addition to other benefits such as improving food security.
1. Introduction
Rapid urbanization and climate change are revealing infrastructures’ vulnerability to managing stormwater and maintaining comfort in urban microclimates. Urbanization results in replacing natural permeable surfaces with impermeable surfaces, leading to increased runoff volumes and rates and reduced response time, thereby causing floods and environmental problems [1]. In addition, recent studies indicate that climate change intensifies urban heat island (UHI), which has lately been manifested by enlarged heatwaves [2]. The loss of infiltration and evapotranspiration in cities resulting from reduced permeable surfaces and the introduction of grey (concrete) infrastructure that absorbs solar radiation are significant causes of UHI [3]. Green roofs have been proposed as an adaptation strategy. They consist of vegetation and soil medium (also known as substrate) situated over a waterproof membrane [4]. Green roof effectiveness has been extensively studied in the last decades, allowing for a better understanding of their design parameters and environmental benefits. For instance, studies have assessed the hydrologic benefits [5,6,7,8], the influence of size and properties of their substrates [8,9], and the cooling effect on both the outdoor and indoor climates [10,11,12,13,14]. Recent research has shifted focus to blue–green roofs to maximize multiple benefits. A blue–green roof is similar to a typical green roof in terms of layer design but has an expanded drainage layer to promote water storage and evapotranspiration, providing hydrologic and thermal benefits [4,15]. For example, one study that looked at the hydrologic performance of a blue–green roof revealed that it could reduce surface runoff and peak flows compared to a control roof [4]. The surface temperature of a blue–green roof was 4 °C cooler than a control roof in a study by Shafique et al. [16]. The expanded drainage layer in the blue–green roof increased evapotranspiration and consequently maximized cooling [15]. However, previous research has largely focused on the performance of green roofs, leaving unanswered questions about blue–green roofs [17].
Furthermore, researchers and urban planners have recently become interested in green roofs used for vegetable production in urban areas forming the so-called “urban rooftop farms”. Orsini et al. [18] assessed the food security benefits achieved by theoretically converting all flat roofs and terraces into rooftop gardens in Bologna, Italy. The study found that such a conversion could provide more than 12,000 tons/year of vegetables, satisfying the demand of Bologna’s population. Eksi et al. [19] proposed solutions to overcome challenging soil and weather conditions on rooftop farms by determining optimal percentages of compost in green roof substrates. Weight restrictions on the rooftop are another barrier that Walters and Midden [20] focused on and argued that extensive (<150 mm) substrates could achieve more sustained productivity than intensive (>150 mm) substrates on rooftop farms. However, the selection of crops on extensive and intensive green roofs appears to be influenced by the root type (i.e., shallow-rooted such as lettuce and deeply-rooted such as tomato).
The previously mentioned studies on rooftop farming have primarily focused on production potentials and barriers. Still, very little research has been done to quantify their potential in regulating ecosystem services, such as managing urban stormwater and improving rooftops’ microclimate. Whittinghill et al. [21] studied stormwater runoff of a full-scale rooftop farm, focusing only on nutrient loss, not hydrologic performance. Harada et al. [22] investigated the hydrologic response in only one catchment of a full-scale rooftop farm that received daily irrigation over the monitoring period. The study detected that cumulative discharge exceeded precipitation, and therefore the authors recommended increased soil water storage to prevent drainage loss of water.
There is limited research investigating blue–green roofs in contrast to green roofs, causing uncertainty in the role of the expanded drainage layer. Compared to unproductive green roofs, field studies on rooftop farming are limited, explaining the absence of design and operational guidelines for their implementation. Their environmental benefits, such as stormwater runoff control and microclimate improvement, should be quantified and distinguished from unproductive green roofs. This study addresses these two research gaps by adopting a primary objective to evaluate the hydrologic and thermal performance of a full-scale farmed blue–green roof with an intensive substrate. The evaluation is based on monitoring precipitation and runoff from three plots that make up the entire roof, and air and substrate temperatures of seven plant species over the growing season from April to November 2021.
2. Materials and Methods
2.1. Site Description
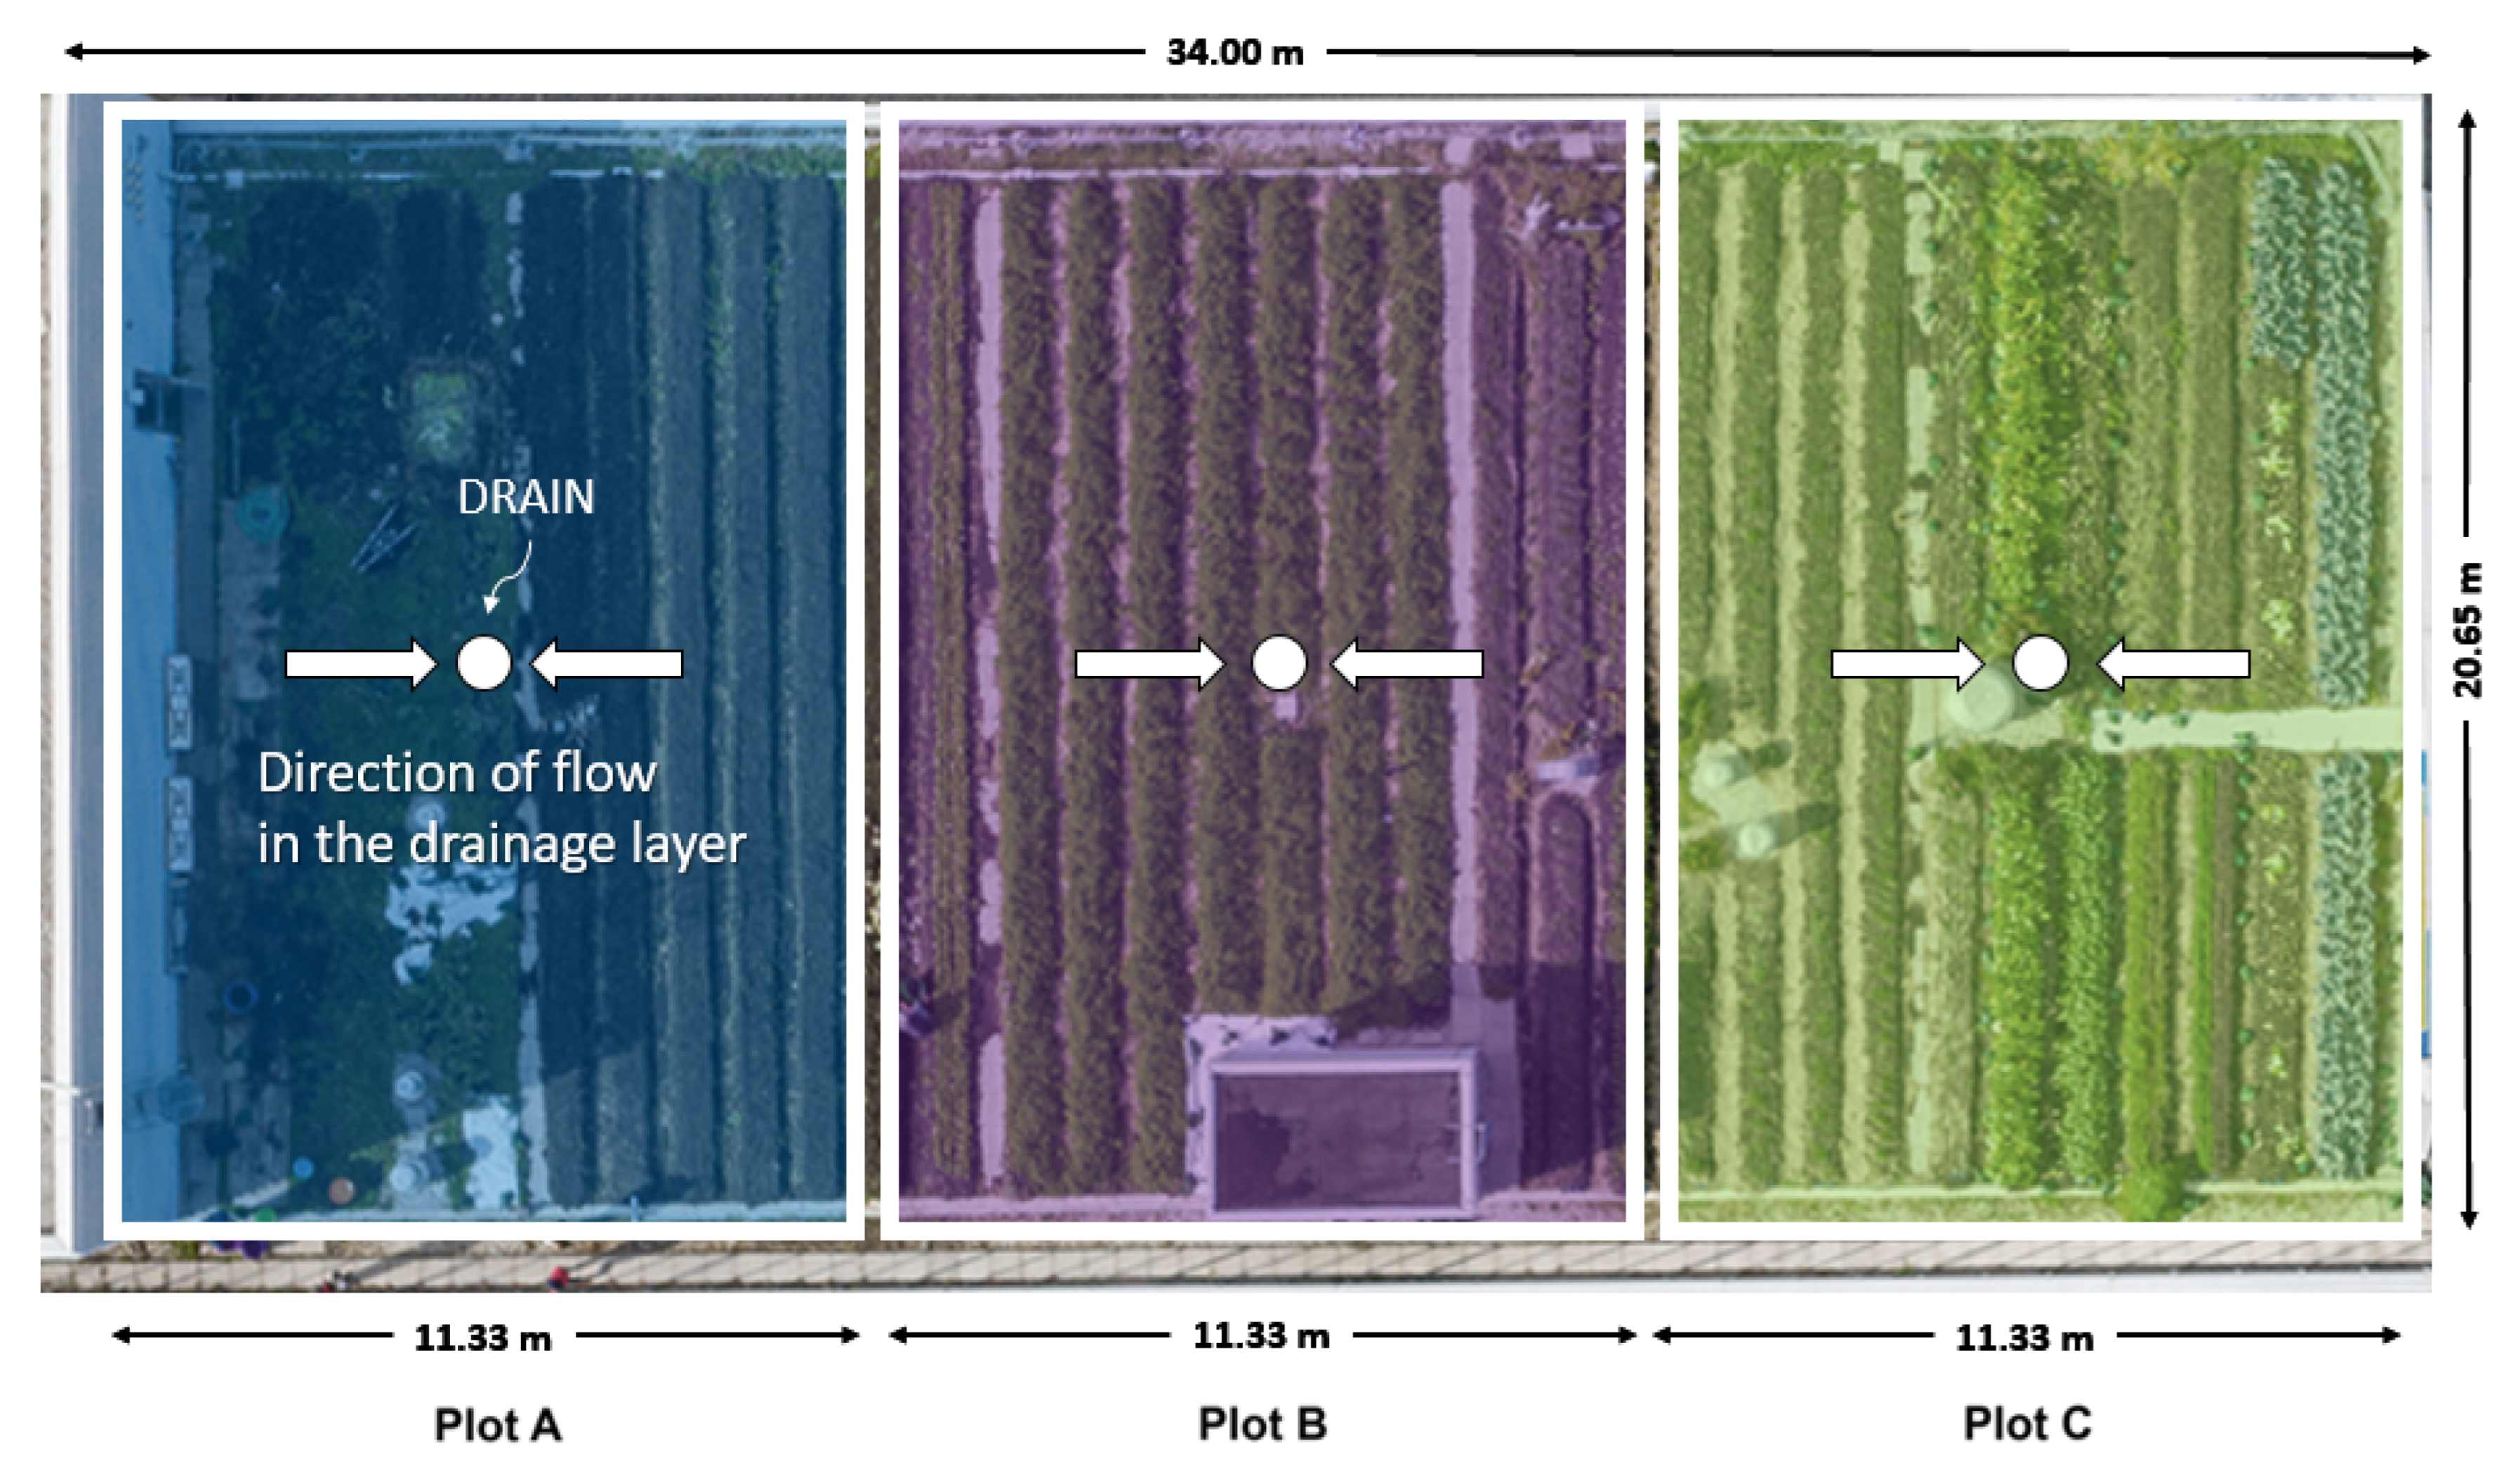
The case study presented is an urban farm located on the rooftop of George Vari Engineering and Computing Centre at the campus of Toronto Metropolitan University in Toronto, Ontario, Canada. The building was constructed in 2004, initially with a conventional extensive green roof, which was converted to an intensive blue–green roof farm in 2014. The farm consists of 28 raised beds separated by bare soil pathways. Each bed has an approximate size of 19 m (L) and 0.76 m (W), with 0.45 m wide paths. The main planting area is 86% pervious, containing the beds and pathways, and the remaining 14% is impervious, comprising a mechanical room and concrete walkways. The raised beds and bare-soil pathways make up 64% and 36% of the pervious area. The farm grows approximately 4000 kg of produce annually. There are three outlets to drain water driven by 1% slopes, creating three 234 m2 isolated drainage areas in plots A, B, and C (Figure 1).
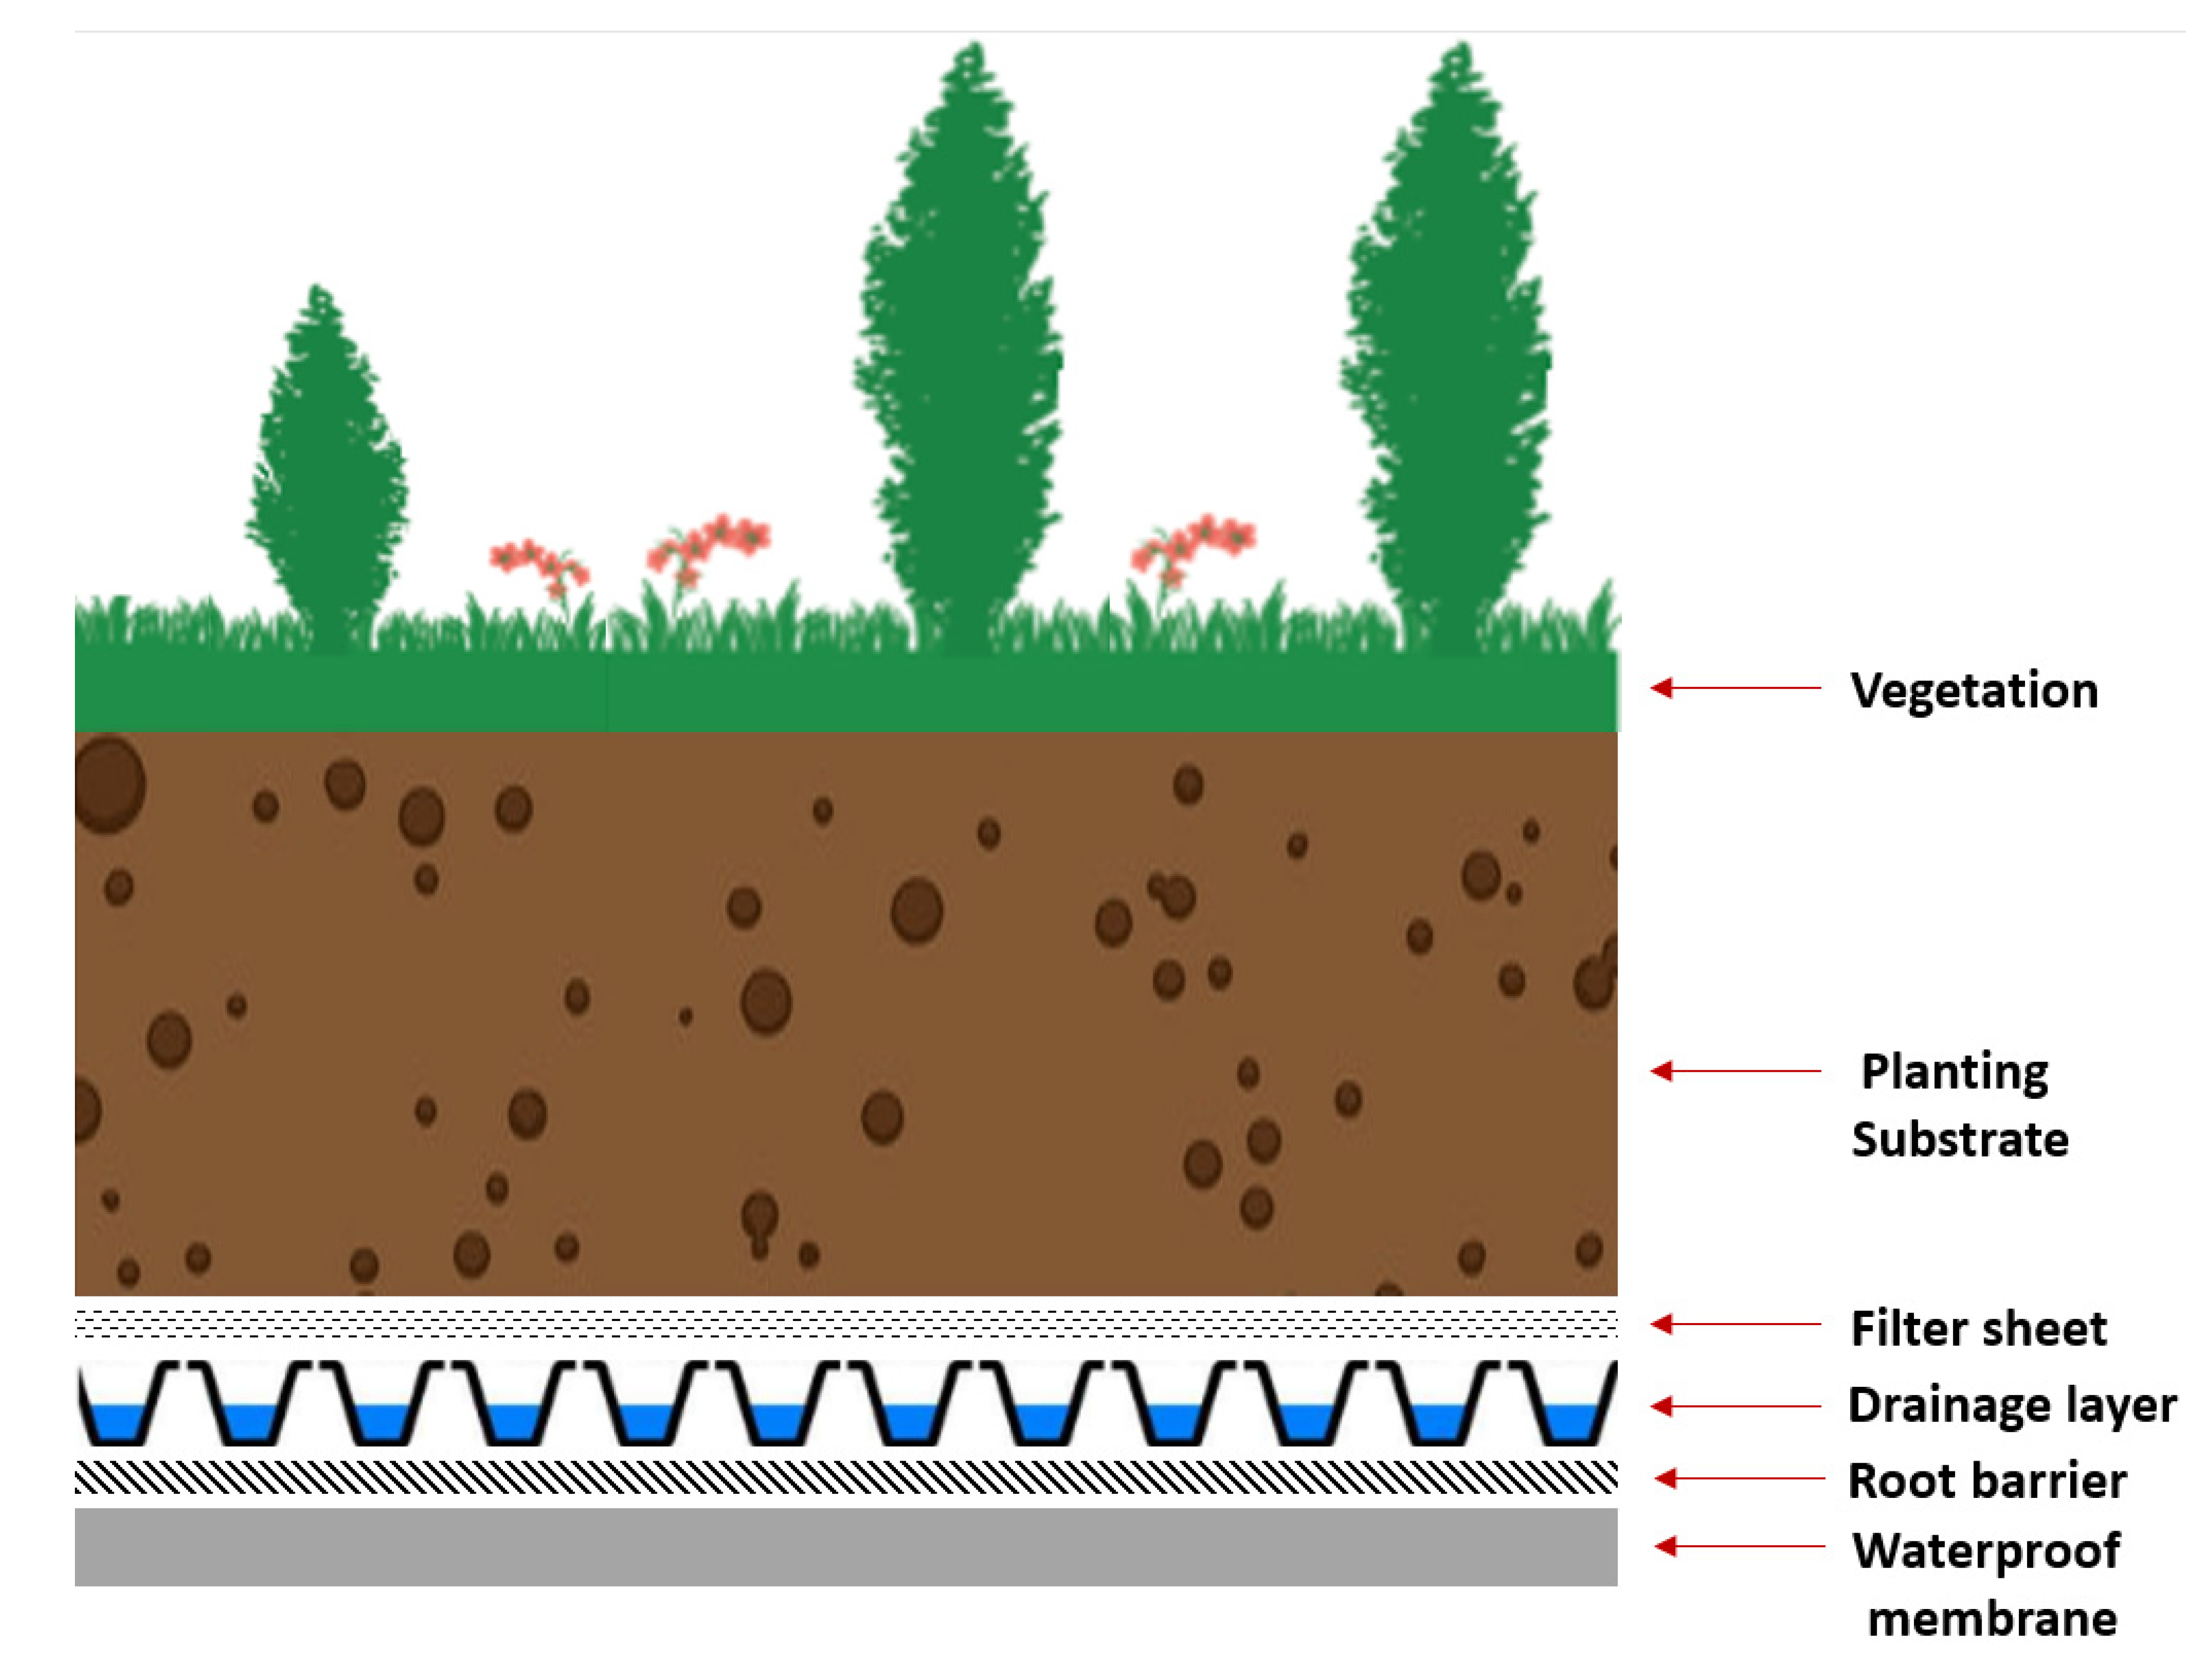
The substrate depth is 250 mm, but a compost layer of 50 mm is added at the beginning of each growing season. The plants consume the compost annually, so the substrate depth remains 250 to 300 mm. The soil is underlined by a ZinCo FD-60 system (ZinCo Canada Inc., Carlisle, ON, Canada) specifically manufactured for intensive green roofs and comprised of a filter sheet, a 60 mm drainage layer, a root barrier, and a waterproofing membrane (Figure 2). The filter sheet prevents small soil particles from filling the drainage layer, whereas the root barrier protects the waterproofing membrane from roots. The drainage layer is much larger than typical 10 mm drainage layers found in green roofs, making it a blue–green roof. The drains were equipped with runoff limiters, allowing retained water to be detained in the drainage layer to a depth of 50 mm, after which it overflows over custom-made v-notch weirs. The weirs were calibrated before the field installations in the laboratory, and their rating curves were determined.
The beds were planted with seeds of thirty different crops over the growing season of 2021 between April–November. Table 1 presents the scientific and common names of these cultivated crops and other self-sown plant species naturally growing on the farm. However, throughout this paper, all plants are addressed by their common names. The cultivated crops belonged to different families, including Alliums, Amaranthaceae, Asteraceae, Brassicaceae, Cucurbitaceae, Malvaceae, and Solanaceae. The crop selection was based on the experiences gained during past growing seasons, where particular crops produced successfully high yields and economic returns. Additionally, crops with shorter days to maturity were prioritized. The farm staff planted all the species except tobacco (Nicotiana tabacum), which usually self-sowed every season. Milkweed (Asclepias syriaca) was also left to voluntarily grow due to its benefits in attracting and supporting local pollinator populations. Other “quickweeds” such as crabgrass (Digitaria sp.), peruvian daisy (Galinsoga quadriradiata), and purslane (portulaca oleracea) were subjected to weed management by the farm staff, unless they grew in places where they competed less with the cultivated crops.
Crop planting started in May, and some of them were harvested in mid-season and replaced with other crops. The farm was covered entirely with cover crops by November when all crops were harvested and the growing season ended. Cover crops are used to prevent the breakdown of soil aggregates during the winter season and until the new growing season starts. In November, Plot A was covered with winter rye and plot C was covered with straw, whereas plot B was equally covered by both cover crops, creating three research treatment groups: “rye-only”, “straw-only”, and “rye-straw” for hydrologic performance investigation. Irrigation on the farm is performed using a drip system that was activated occasionally during dry periods, depending on preceding rainfall events, and not on a fixed schedule.
2.2. Laboratory Analysis of Farm Growing Media
The growing media used at the farm was biologically derived soil containing higher organic matter content than those recommended by the German Landscape Research, Development and Construction Society (FLL). Soil samples for laboratory analysis were collected in the summer during the growing season. The physical properties (Table 2) of the growing media were obtained through grain size distribution, standard compaction test, falling head test, and loss on ignition according to the procedure described in the ASTM standards ASTM D422-63; D698-78; D2434-68 and Test Methods for Examination of Composting and Compost (TMECC).
2.3. Monitoring Instrumentation
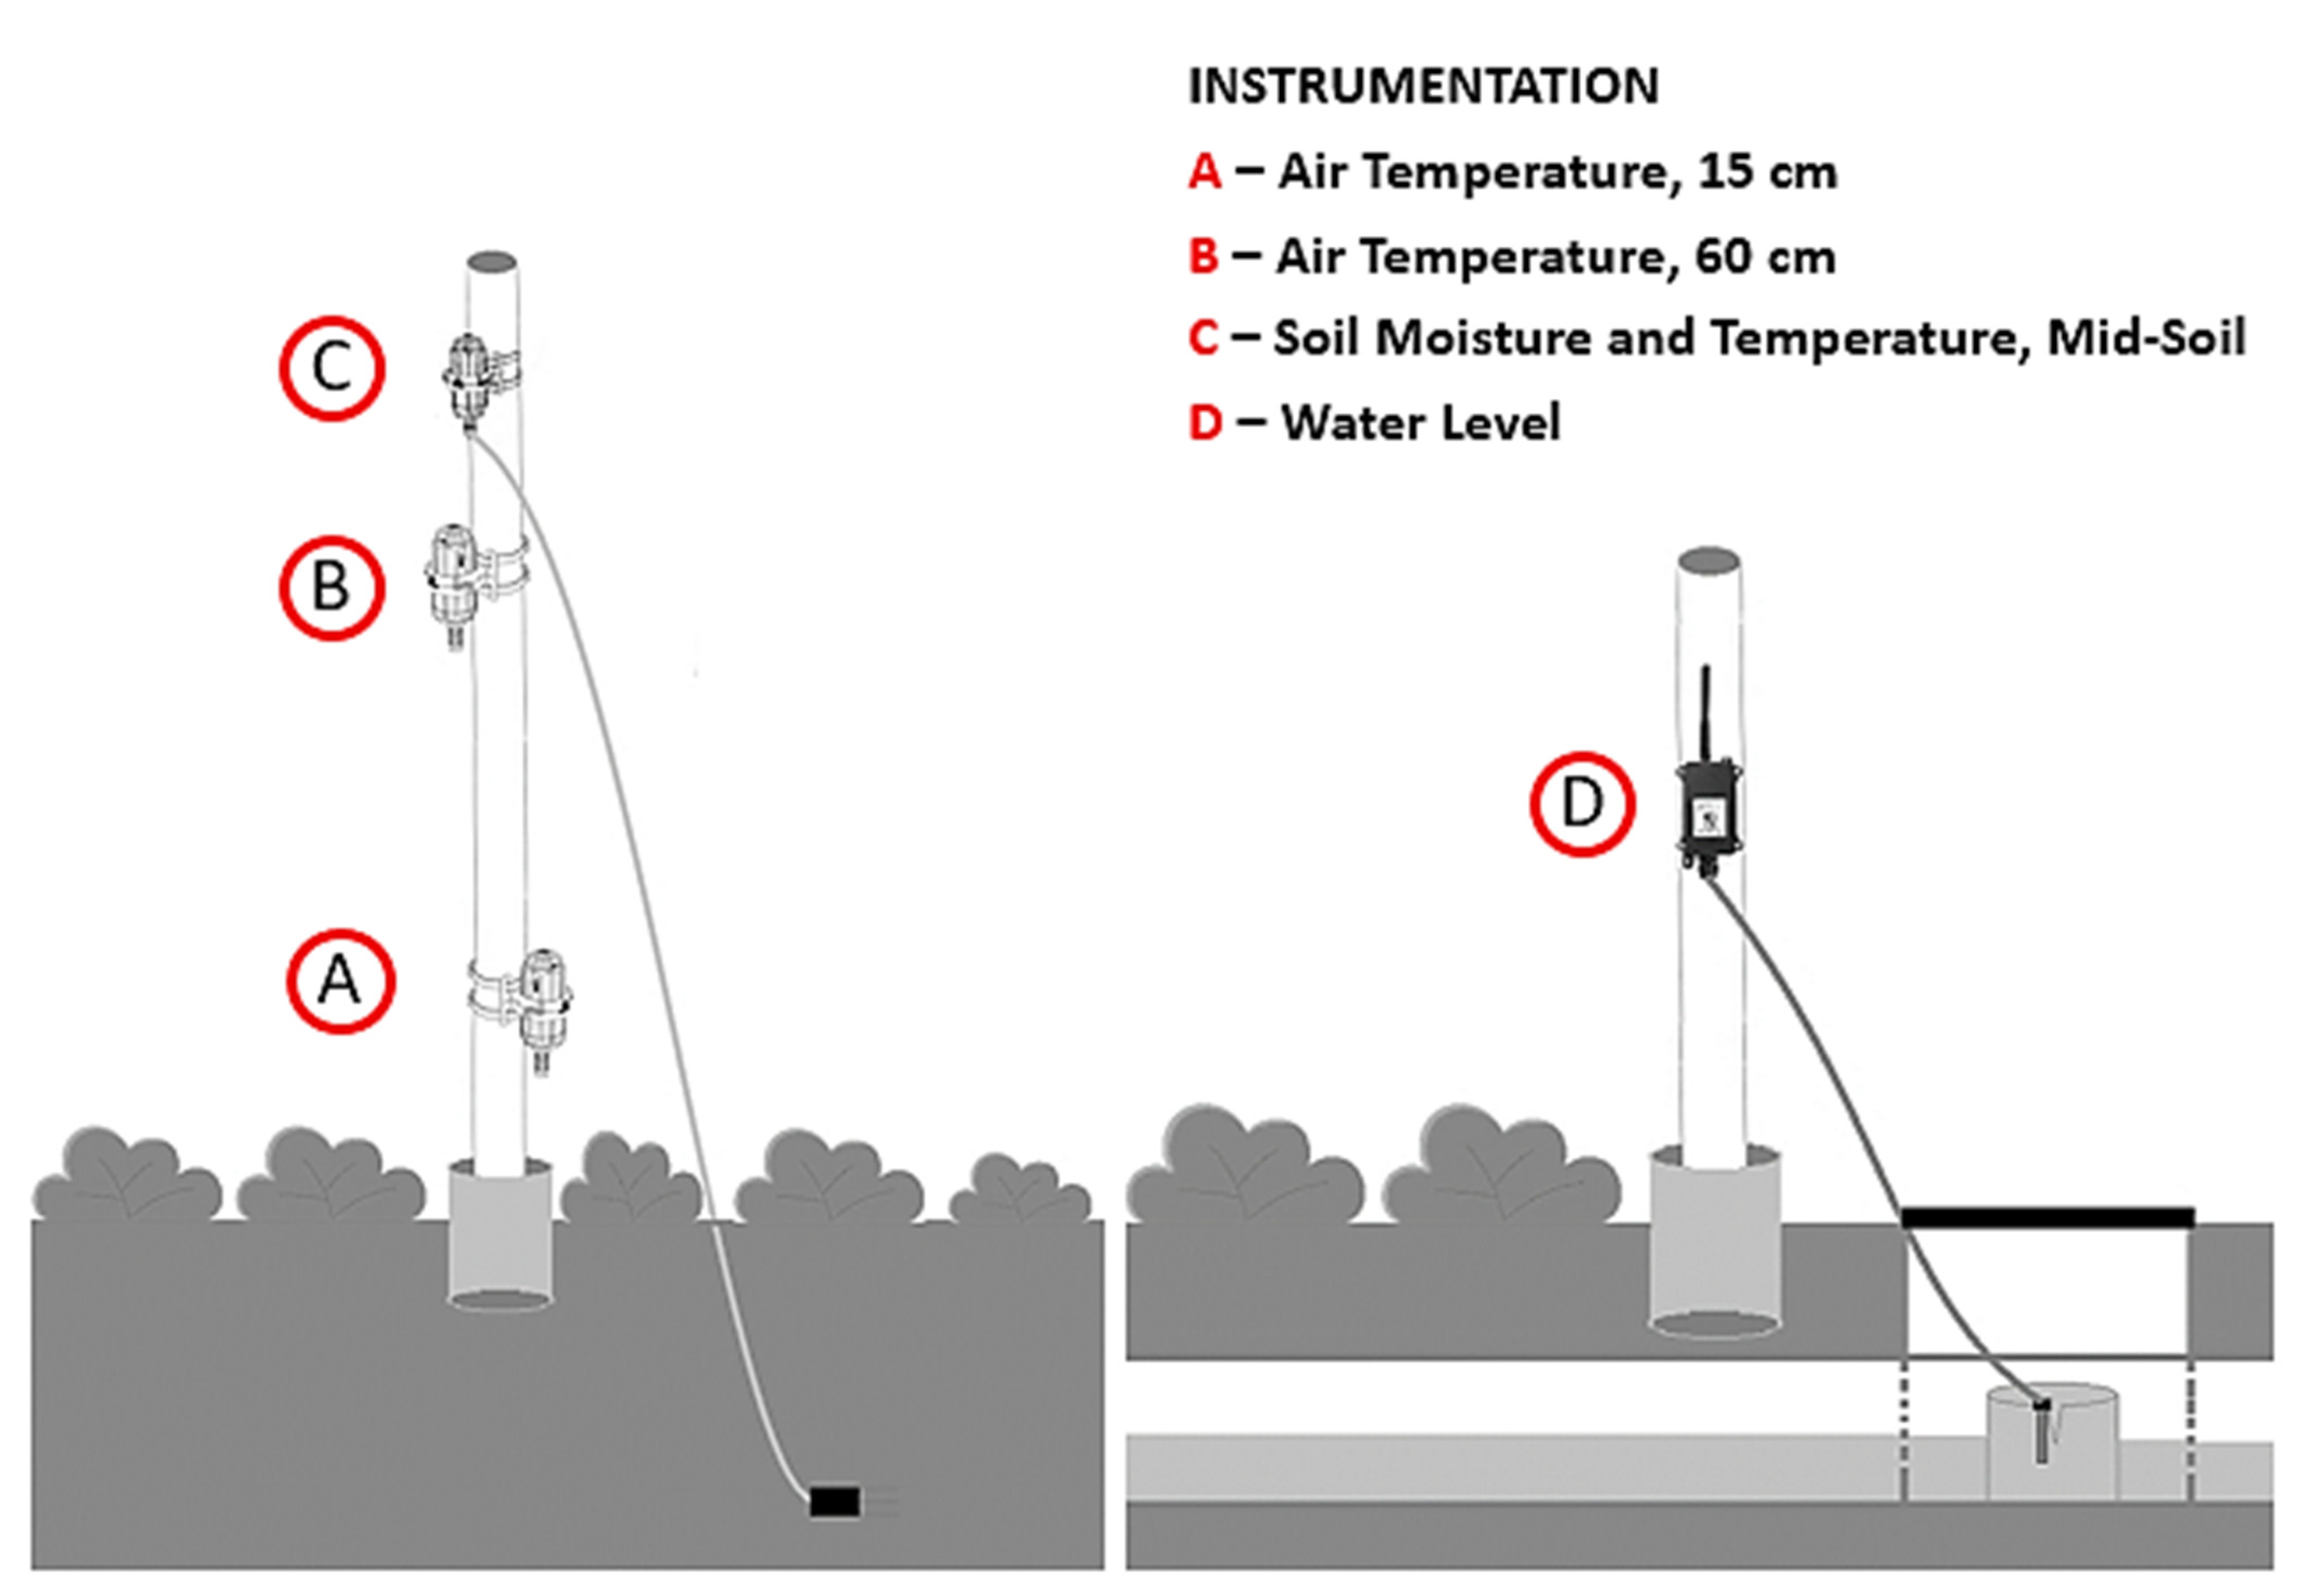
The field monitoring of the rooftop farm was mainly based on an online Wi-Fi and LoRaWAN wireless system where data is collected over 5-min intervals and uploaded to the cloud. Meteorological parameters, including ambient temperature, humidity, solar radiation, and wind speed and direction, were measured throughout the growing season using HOBO RX3000 remote monitoring station (Onset Computer Corporation, Bourne, MA, USA). Precipitation was measured by the HOBO RG3 tipping bucket (Onset Computer Corporation, Bourne, MA, USA). Custom-made poles were installed in beds where roof drains are located and in beds with the plant species selected for thermal monitoring. On each pole, two air temperature sensors (LoRa-S-915-TH-01 SenseCAP, Seeed Studio, Shenzhen, China) were mounted 15 cm and 60 cm above the top of the substrate. Another area of the roof covered with concrete pavers was selected as the control surface, and air temperature sensors were installed at the same heights above the surface.
Soil moisture and temperature sensors (LSE01, Dragino, Shenzhen, China; LoRa-S-868-Soil MT-01 SenseCAP, Seeed Studio, Shenzhen, China) were installed in the monitored beds, ensuring their ceramic cups are appropriately in contact at the mid-depth of each bed. Additionally, resistive water level sensors (eTape, Milone Technologies, Sewell, NJ, United States) were integrated with long-range wireless nodes (LSN50, Dragino, Shenzhen, China) and attached to the custom-made weirs of the roof drains. Air temperature and soil moisture and temperature sensors were used to quantify the thermal performance of the selected plant species. In contrast, water level sensors in the three plots were used to quantify the overall hydrologic performance of the farm. Figure 3 demonstrates a schematic view of the monitoring equipment. All sensors were tested and calibrated at the laboratory before installation.
2.4. Data Analysis
2.4.1. Runoff Data Processing and Event Analysis
Rainfall and discharge characteristics of the plots were determined and used to quantify the hydrologic performance of each plot. Based on exploratory data analysis, a rainfall event was considered any storm with a rainfall depth ≥1 mm of rainfall separated by a minimum of six hours without precipitation or runoff. The six hours interevent-time is commonly selected for green roof studies [23,24,25]. Retention performance was quantified through event-based retention percentages (RET) and monthly volumetric runoff coefficients (Cvol), as shown in Equations (1) and (2). Detention performance was quantified through peak attenuation (PA) and peak time delay (Tdelay), as shown in Equations (3) and (4).
where PD is the precipitation depth (mm) and RD is the runoff depth drained from the roof (mm), Prain is the highest 5-min peak rainfall intensity, Pdrainage is the highest 5-min discharge flowing over the weir, TPdrainage and TPrainfall are the time of the drainage peak and the time of rainfall peak. Further analysis of individual events included an assessment of the impact of the antecedent dry period (ADP), defined as the dry weather period between two independent rainfall or irrigation events. The collected data was hydrologically processed on a per-event basis and monthly to quantify the effects of rainfall characteristics, and planting and harvesting activities that were apparent per month. Correlation analyses were carried out using Spearman Rho correlation since most of the hydrologic data sets were not normally distributed, indicating the need for a non-parametric test.
2.4.2. Rooftop Microclimate Analysis
Due to logistical constraints in the quantity of the monitoring equipment that could be installed and given that the rooftop is a dynamic farm where staff continuously run operations, seven plant species were monitored for thermal performance, including cultivated crops (potato, squash, beet, and okra) and the self-sowing tobacco and milkweed. Quickweed species, including crabgrass, peruvian daisy, and purslane, were also monitored as a collection at a location excluded from weeding. Each cultivated crop belongs to a different family; potato to Solanaceae, squash to Cucurbitaceae, beet to Amaranthaceae, and okra to Malvaceae. Monitoring of the self-sown weeds was performed to examine how they affect rooftop microclimates despite their undesirable invasive habits. Understanding this matter would help establish more effective weed management techniques. Some plant species shared similar life spans and growing periods, while others did not. The thermal performance of the selected plant species and their impact on the rooftop microclimate was assessed by measuring each sensor’s mean daily air temperatures at two different elevations, 15 cm (T15) and 60 cm (T60) above the substrate, and were averaged across each week. The air-cooling effect of each plant was determined through the mean daily temperature difference between the air above the plant and the control roof at the two elevations (TR15 and TR60), and was averaged across their growing periods. To understand their diurnal thermal performance, the cooling effect of each plant was also quantified on an hourly basis using the daily data collected over their growing periods. Temperature fluctuations of the substrates were quantified through temperature amplitudes of the substrate (TAS) determined from the substrate temperature (TS) (maximum daily substrate temperature–minimum daily substrate temperature), averaged across their growing periods.
Plant physiological responses during drought and wet conditions were investigated through three single stomatal conductance measurements (gs) using a portable leaf porometer (Model SC-1, Decagon Devices, Pullman, WA, United States) after calibration as per the manufacturer’s instructions. Two measurements were performed on 4 August 2021, and 18 August 2021, when no rainfall occurred, and irrigation was withheld for a week before each measurement. The third measurement was performed on 23 August 2021, after the rooftop farm received 8 h of drip irrigation. The three days of measurements shared similar weather characteristics (i.e., partly cloudy, low wind speed, and average air temperature ranging from 26–30 °C) and were all performed during the peak hours 13:00–15:00. This time window was selected based on preliminary measurements to determine the time at which most plants produce the highest stomatal conductance.
The collected thermal data were normally distributed. Therefore, Pearson correlation (rp) was used as a parametric test to explore the strength of association between the weather conditions and air and substrate thermal indicators.
3. Results and Discussion
3.1. Hydrologic Performance
During the growing season, forty-three rainfall events were observed from June to November 2021, with the highest rainfall intensities recorded in the months of June and July. August was exceptionally dry, with monthly rainfall at 20% of the historical average. However, September and October were wet, with more than 50% of the historical average monthly rainfall. Monthly rainfall characteristics are presented in Table 3. The total depth of all the monitored events was 390.8 mm, with maximum and median rainfall depths of 46.6 mm and 5.8 mm. Irrigation was conducted only occasionally in June and August, quantified in magnitude and timing, and excluded from hydrologic data processing to restrict the analysis to rainfall only.
Descriptive statistics of event-based hydrologic responses are summarized in Table 4. The relationship between the median performance indicators (i.e., RET, PA, and Tdelay) across the plots and rainfall characteristics (i.e., rainfall depth, average and peak rainfall intensities, rainfall duration) were examined using Spearman Rho correlation and summarized in Table 5.
The mean event RET achieved was 87%, 85%, and 88% for plots A, B, and C. These retention values are comparable to those from previous studies on non-productive intensive green roofs [26,27]. In this study, stormwater was entirely retained in the substrate and the storage layers for storms smaller than 5 mm. The minimum retention ranged from 45 to 48%, observed for an 8-h storm with a rainfall depth of 39.4 mm and peak intensity of 12 mm/h. The data analysis showed that retention negatively correlates with rainfall depth (rs = −0.44) as well as the average and peak rainfall intensities (rs = −0.31; rs = −0.36), indicating that there is an inverse relationship between rainfall depth and intensity, and retention [28,29,30]. The median retention ranged from 78.2% to 87.8% for storms with a rainfall depth between 10–20 mm. However, it was reduced slightly from 73.3 to 77.4% for storms >20 mm. For storms with a rainfall intensity between 10–20 mm/h, the median retention ranged from 65.6 to 78.9%.
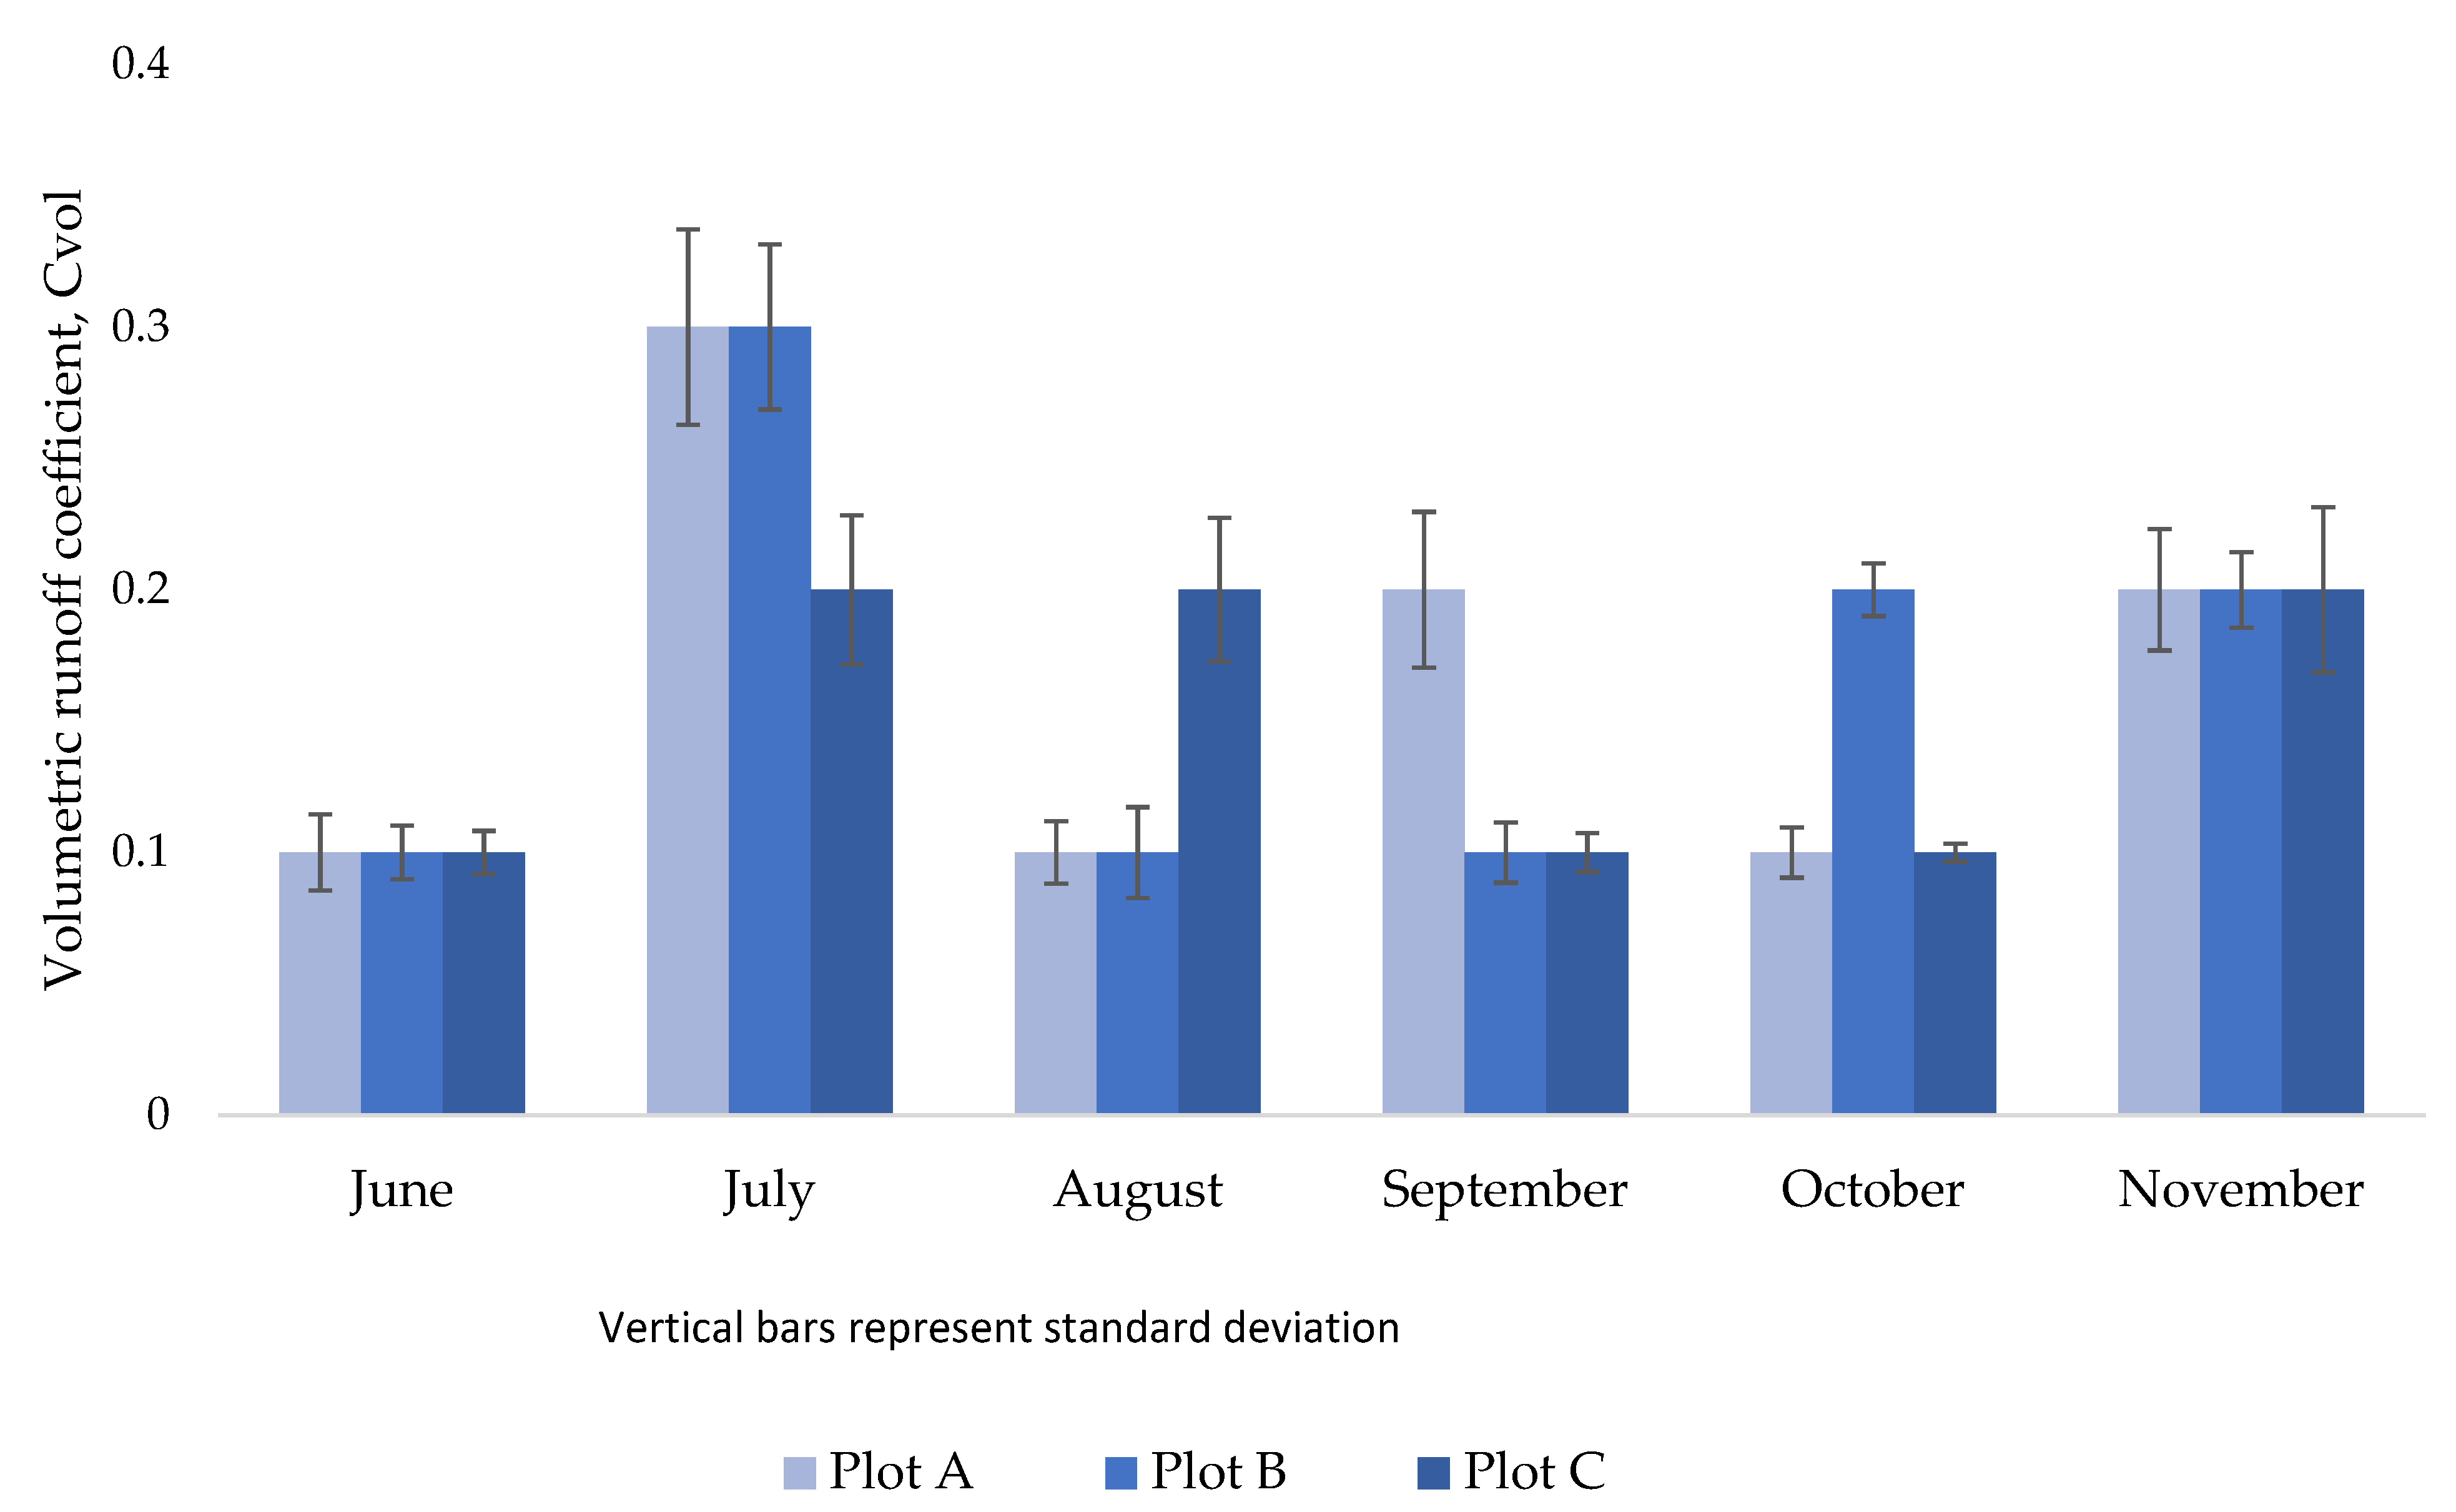
The mean monthly Cvol showed slight differences between the plots, as shown in Figure 4. These differences are attributed to the dynamic nature of the farm, where crops are continually planted and harvested. Average Cvol remained between 0.10–0.20 in all months except July, when plots A and B resulted in a Cvol of 0.30. July had extreme storms with a total rainfall depth of 80.2 mm and an average of 4.1 mm/h intensity. Furthermore, in July, several crops (pak choi, kohlrabi, cabbage, arugula, radish, turnip, garlic, onion, callaloo, and chard) were harvested from plots A and B, resulting in a larger area of bare soil and reducing the amount of rainfall intercepted by the crops. Although a few other crops were harvested from plot C in the same month, Cvol remained 0.20 but increased to 0.30 in August when additional crops were harvested.
Similarly, Cvol increased to 0.20 in plot A in September when okra, eggplant, tomato, pepper, potato, and tobacco were harvested. Beet and spinach were harvested at the end of the month, and weeding was performed in plot B, leading to an increase in Cvol during October. All crops were harvested by the end of October, and cover crops completely covered the farm. Analysis of the rainfall events in November demonstrated that the cover crop treatments (rye-only, rye-straw, and straw-only) have the same impact on retention as they all resulted in a Cvol of 0.20. In November, the cumulative rainfall was 28.2 mm, and the cumulative discharge was 4.71 mm, 4.78 mm, and 4.93 mm from the plots that had rye-only, rye-straw, and straw-only, respectively.
A local study on an extensive green roof with a 140 mm substrate reported a Cvol of 0.45–0.55 [5]. Another local study on 100–150 mm modular extensive green roofs found a Cvol of 0.40 for mineral-based substrates and 0.30 for biologically-derived substrates [7]. The farm in this study is situated over an intensive blue–green roof where the substrate is double of that reported in the previous studies. The large drainage layer under the substrate promotes water storage and evapotranspiration [15,31]. These observations demonstrate that retention in green roofs can be further increased by 28–78% with larger substrates and drainage layers.
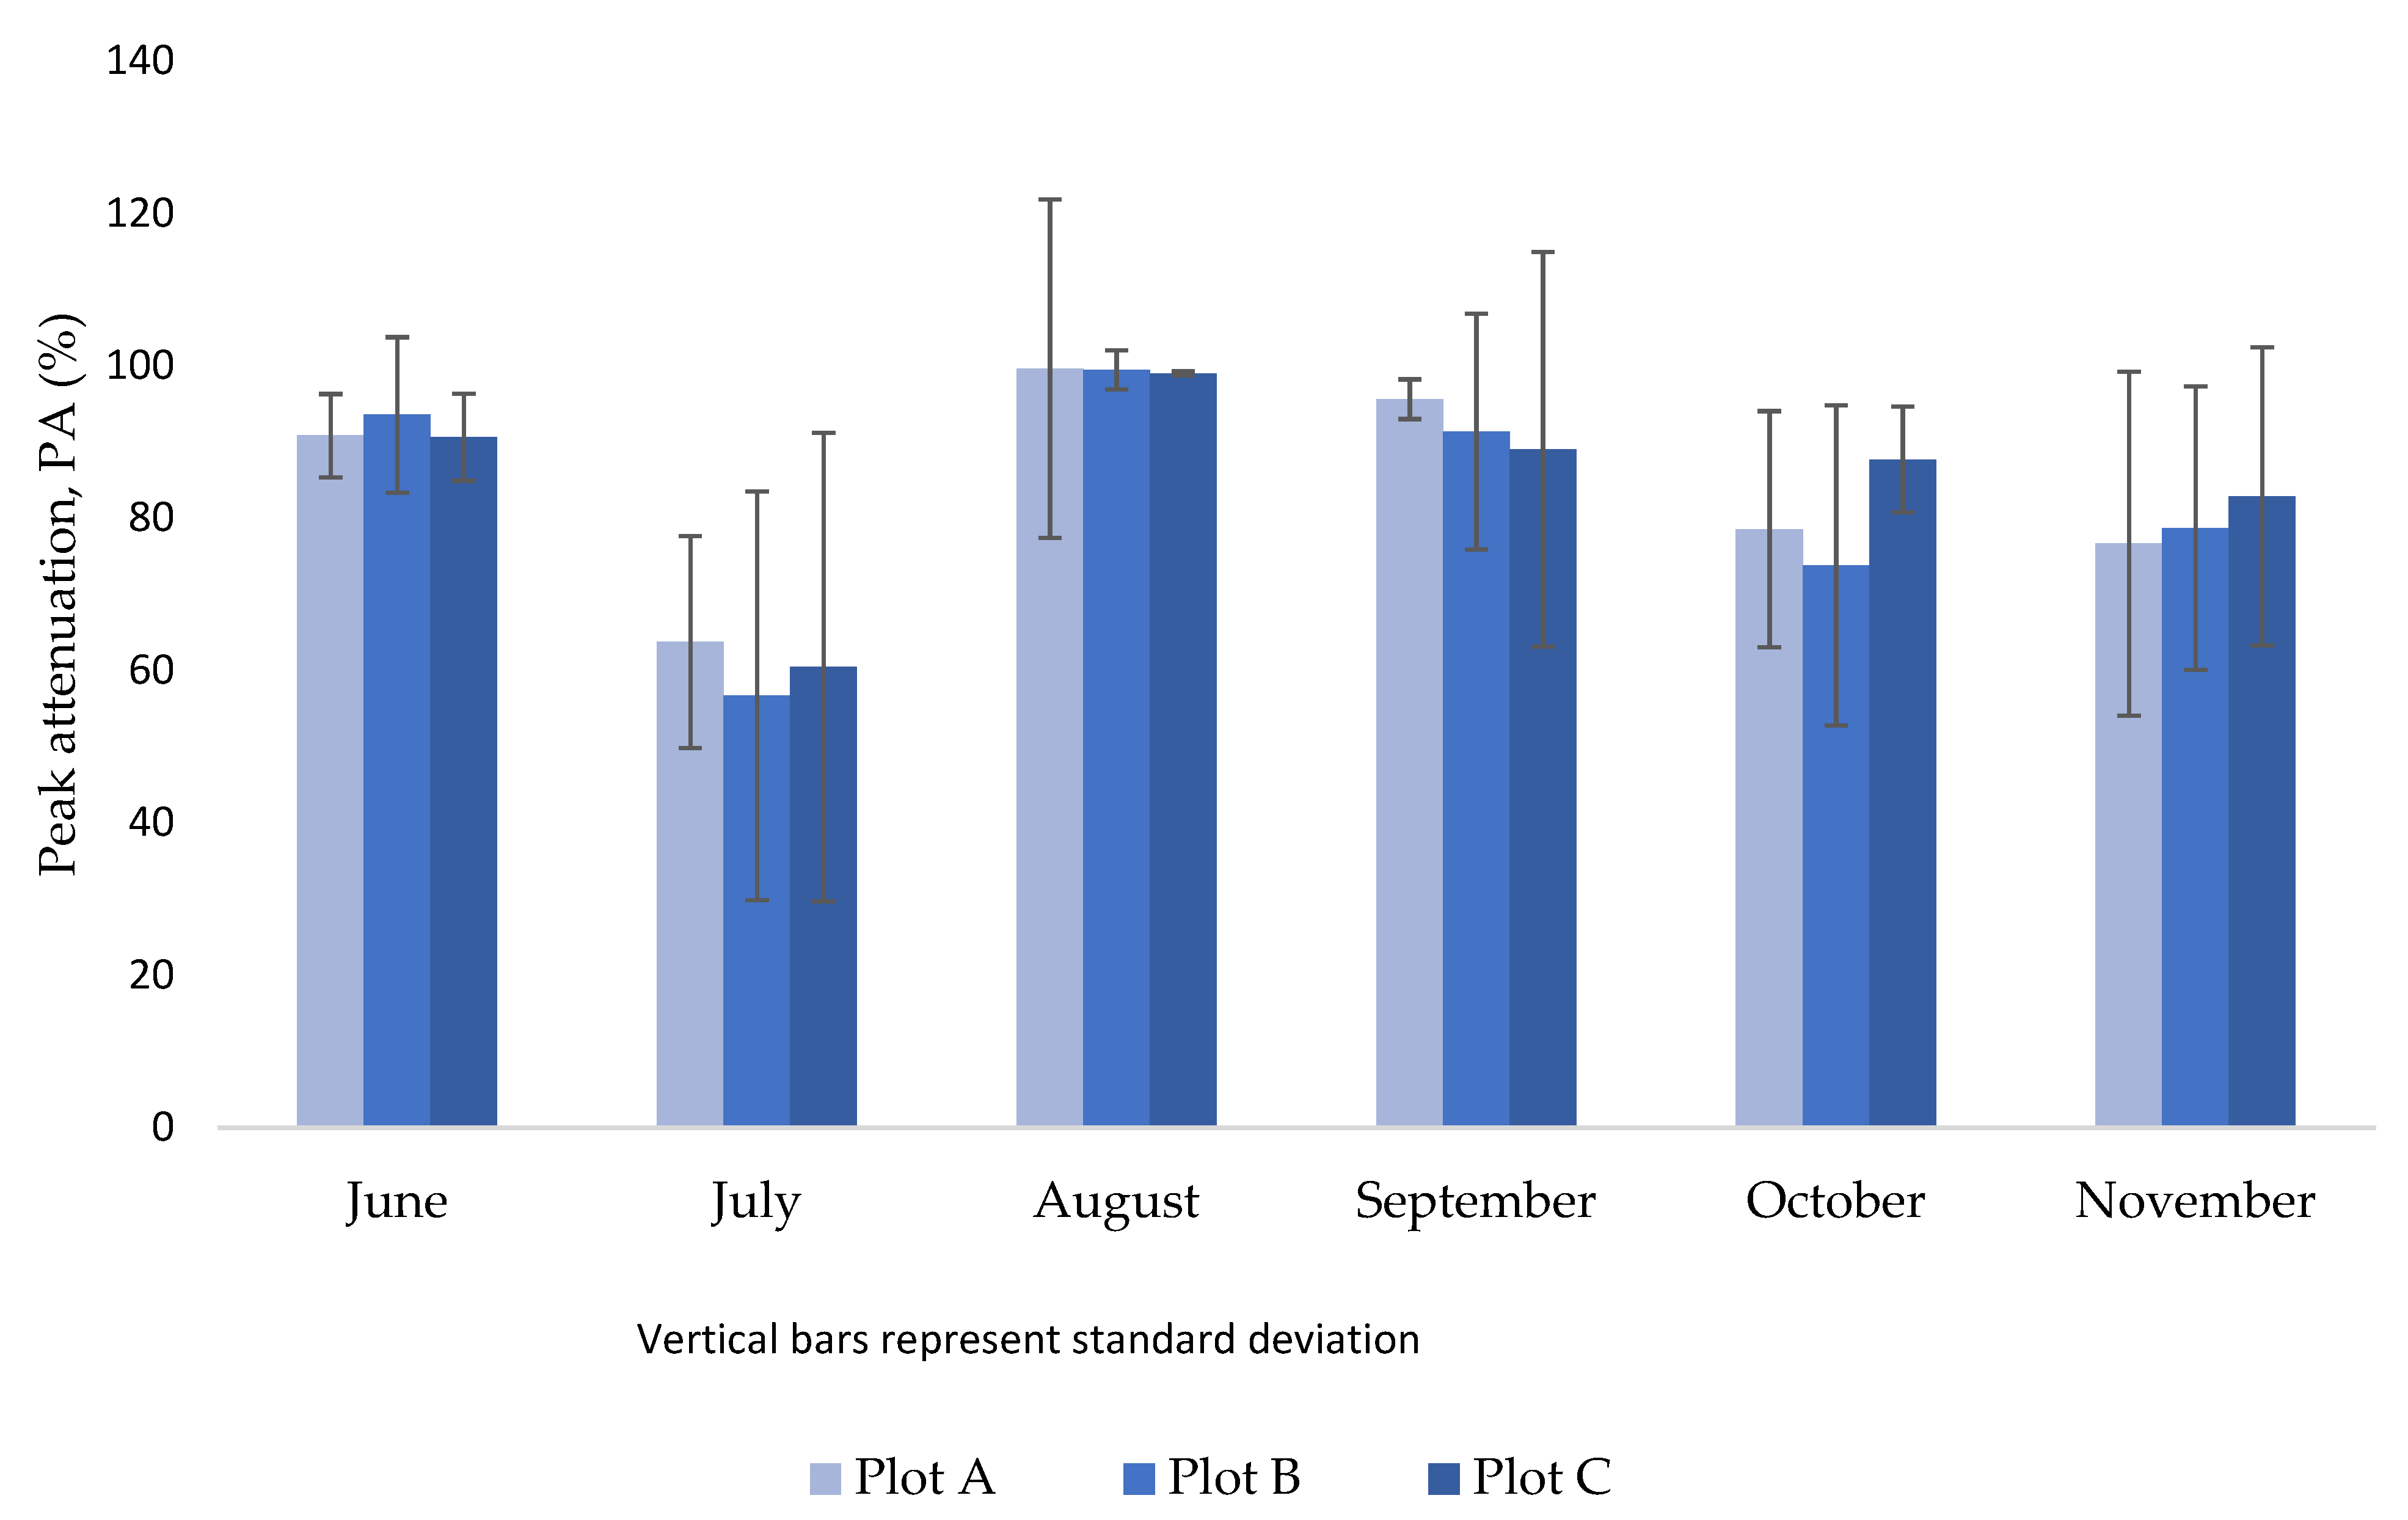
The mean PA achieved by plots A, B, and C were 84%, 82%, and 85%, respectively. Twenty events had a PA higher than 90%, corresponding to small rainfall events with less than 7 mm depth. Median PA was in a 74–77% range for events >10 mm and significantly reduced to 28–42% for events >20 mm. The least peak attenuation was 14–15% following an 8-h storm with a rainfall depth of 23.2 mm and peak intensity of 9.6 mm/h. In a past study in Toronto, Canada, peak discharge attenuated by green roofs with a 250 mm substrate was 58% for events >10 mm [32]. Soulis et al. [33] reported a 51–81% peak attenuation range, which varied based on substrate depths. Data analysis indicates that peak attenuation strongly inversely correlates with rainfall depth (rs = −0.75) and, to a lesser extent, with rainfall intensity (rs = −0.41). Voyde et al. [34] reported a high peak attenuation of 93% but found through event-based analysis that this attenuation primarily depends on rainfall characteristics, including rainfall depth and intensity. Interestingly, rainfall duration was found to have a statistically significant inverse relationship with peak attenuation (rs = −0.53). Longer rainfall events increase the chance for the substrate to reach its field capacity, after which the peak attenuation becomes severely diminished [35].
Monthly analysis shows that the mean peak attenuation achieved by the three plots mirrored each other (Figure 5). Given that peak attenuation depended on rainfall characteristics, July’s extreme storms have resulted in a markedly lower PA for all plots. When all crops were harvested in November, plot A, which had the rye-only treatment, had a mean PA of 76.7%, slightly lower than plot C, which had the straw-only treatment and a mean PA of 82.8%. Since discharge from green and blue–green roofs does not occur until field capacity is reached, the high PA values suggest that the expanded drainage layer provides additional storage to that available in the substrate. Therefore, the discharge drains from the substrate and flows into the drainage layer upon reaching the field capacity. It only leaves the roof at slower rates when the total storage capacity is reached, consequently reducing peak discharge. Improved peak attenuation in blue–green roofs provides a solution to the limitation of insufficient storage in conventional extensive green roofs, as pointed out by Martin and Kaye [36].
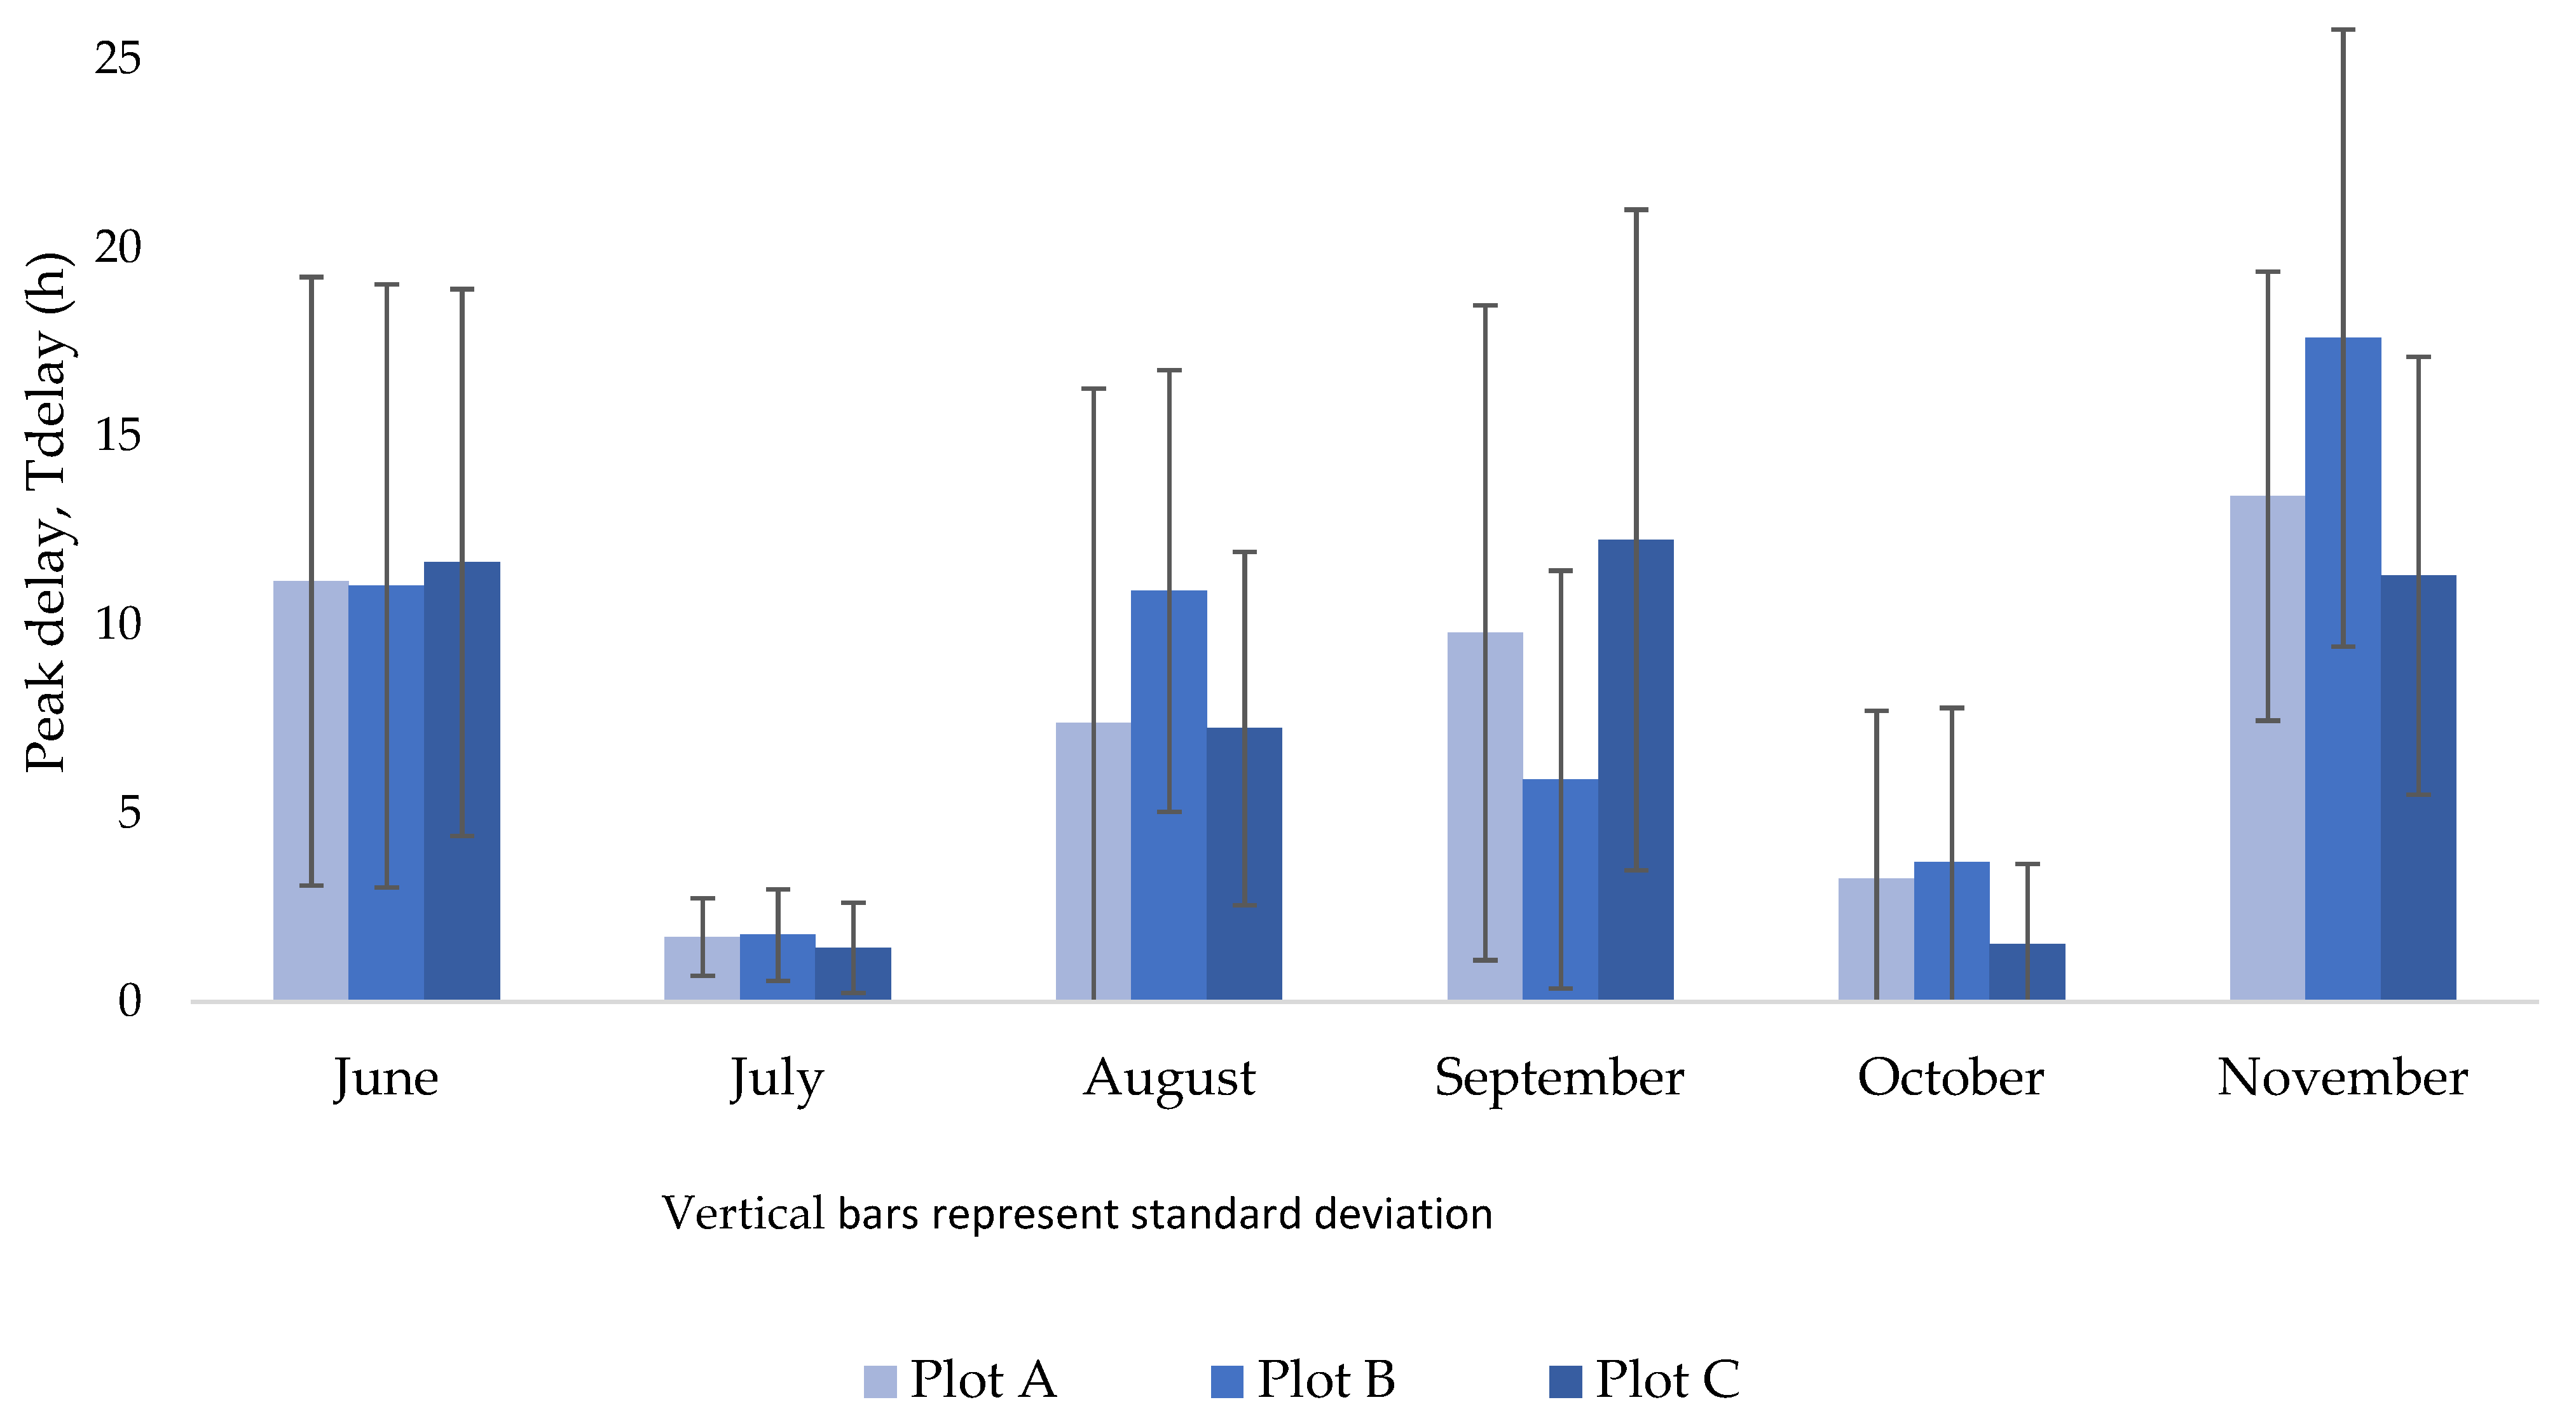
Peak discharge from all plots was significantly delayed relative to peak precipitation. The mean Tdelay was 8, 8.1, and 7.7 h for plots A, B, and C, respectively, over the growing season. These delays are substantially longer than the broad range of peak delays reported in the literature, which vary from 10 min to 2 h [28,37]. Soulis et al. [33] observed peak delays from 10–30 min over 80–100 mm green roof substrates and attributed these low values to the high hydraulic conductivity and short thickness of the substrates. In their study, the substrate hydraulic conductivity was 0.01 cm/s, but it is twice as high in this study, with a value of 0.02 cm/s. These observations suggest that a larger substrate and drainage layer could overcome the limitation of substrates’ high hydraulic conductivities by giving the water a longer path to move in the substrate and storage space to detain in the drainage layer, consequently extending runoff response and delay. In addition, the rooftop farm’s substrate has high organic matter content (>25%), which results in more stormwater retention, as reported in other studies [7]. Enhanced stormwater retention leads to a delayed response time. However, Tdelay varied between monitored events; the coefficient of variation ranged from 0.9 to 1.0, indicating a significant dispersion. Tdelay varied based on rainfall characteristics, and through correlation analysis, it was found that Tdelay had an inverse and equal correlation with rainfall depth (rs = −0.44) and intensity (rs = −0.44).
The mean monthly Tdelay showed differences between the plots during months of planting and harvesting activities (Figure 6). Generally, the smallest peak delay occurred in July and October, with a median delay of 1.7 h and 3.3 h, respectively. The most intense events occurred in July with a mean rainfall intensity of 4.1 mm/h, whereas the largest rainfall depth (103.4 mm) and the highest number of events were delivered in October. In October, the Tdelay in plot C was almost half of that achieved on plots A and B, which can be attributed to harvesting pak choi, kohlrabi, radish, and the deep-rooted summer squash. In June, the median Tdelay was 11 h and was consistent in all plots. Tdelay in August was 2 h longer in plot B than plots A and C, but became significantly shorter in September when numerous plants were harvested, including salad mix, beet, spinach, and the self-sowing milkweed and quickweed.
Interestingly, the use of cover crops seems to lead to extended peak delays. Tdelay in November was 13 h and 11 h for rye-only and straw-only plots. The mixed treatment “rye-straw” resulted in a higher Tdelay of 17.5 h. A possible reason for this difference in performance is that plot B was the last plot shielded with cover crops, and therefore the beds in this plot were the least compacted and still highly porous, promoting a rapid runoff response.
Several case studies found that vegetated green roofs improved detention performance compared to unvegetated substrates [38]. These observations suggest a significant association between peak delay and vegetated and unvegetated green roofs. However, some plant species may adversely impact detention and peak delay due to their roots’ creation of preferential flow paths [39]. Since the planting strategy on the rooftop farm used in this study is driven by economic and social returns rather than hydrologic goals, understanding the complex processes between individual plant species and hydrologic performance requires isolated treatments outside the scope of this study.
There were no significant correlations between ADP and all hydrologic performance indicators. In past case studies, ADP created an opportunity for plants to deplete soil moisture through evapotranspiration, thereby maximizing substrate storage for subsequent rainfall events shown through better hydrologic performance, including retention [39]. The absence of a relationship between ADP and the hydrologic indicators is attributed to persistent wet conditions in the substrate due to passive irrigation uptake from the drainage layer. Volumetric water content (VWC) on all plots remained between 0.4 to 0.6 m3/m3 and only occasionally dropped to 0.3 m3/m3 during long ADP. These findings present trade-offs between green roof substrates that restore their storage capacity during long ADP and blue–green roof substrates in which storage capacity is partially diminished, and the hydrologic performance is more driven by the drainage layer.
The slight differences in the retention and detention performance indicators following the harvesting activities between the three plots that were planted with different crops and species suggest that the plant selection on farmed blue–green roofs have a minimal impact on hydrologic performance, aligning with the results of past studies on conventional green roofs [7,40,41]. Plant selection in green roofs was found to impact hydrologic performance only when studied in isolation [42,43]. The findings prove that the substrate and drainage layer are more influential design parameters than plant selection on the hydrologic performance.
3.2. Thermal Performance
Over the monitoring period, the general weather conditions at the rooftop farm, summarized in Table 6, indicated that ambient temperature consistently increased from May to August, with the highest mean monthly temperature observed in August. Throughout the day, relative humidity was highest during night and lowest during midday except during rainfall events, when it used to exceed 90%. July and August were more humid than May and June. Average wind speeds were higher in May and June than in July and August. However, overall wind speeds on the rooftop were significantly lower than those recorded from nearby meteorological stations. One reason for the lower wind speeds on the rooftop is the blockage effect created by surrounding high-rise buildings, a problem that usually magnifies the UHI [3].
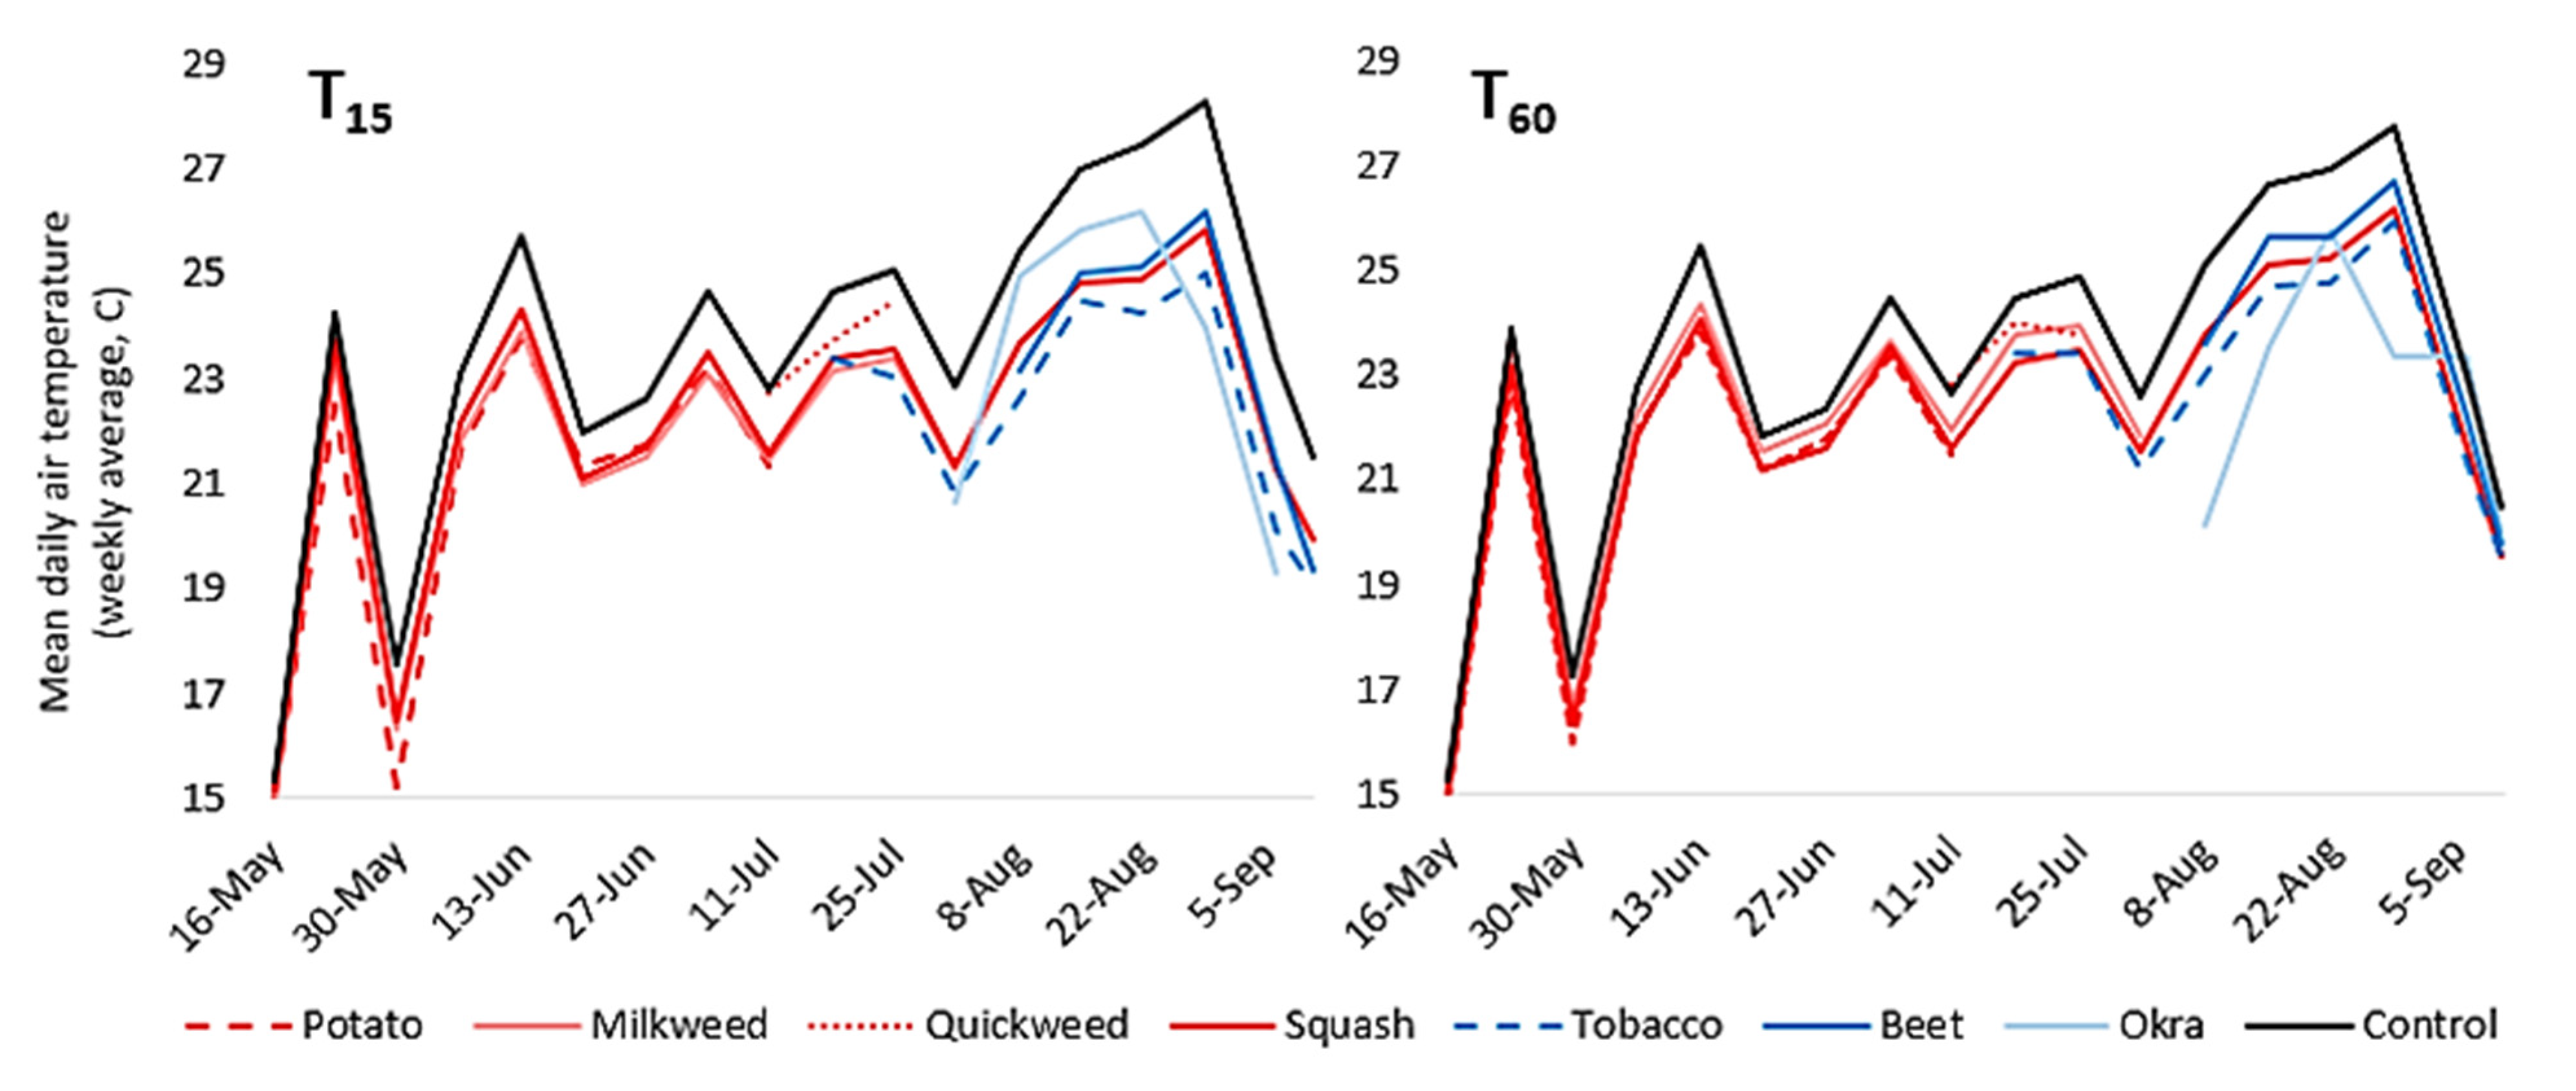
Figure 7 depicts the mean daily T15 above the plants and the control roof over the entire season. Air temperatures above the selected plant species at the rooftop farm were consistently lower than those observed above the control roof. However, there were significant differences in the magnitude and timing of cooling and variations across their vertical profiles. May was not a hot month compared to subsequent months, and the plants were in their initial growth stage; two factors explain why the air temperatures above the plants were not noticeably different from that above the control roof. Starting from June, the cooling was more evident and continued to increase until the end of August, despite differences in the temperature reductions achieved by the different plants. Analyzing T60 demonstrates that the plants and the control roof followed the same lower elevation pattern, but the overall cooling magnitudes were lower.
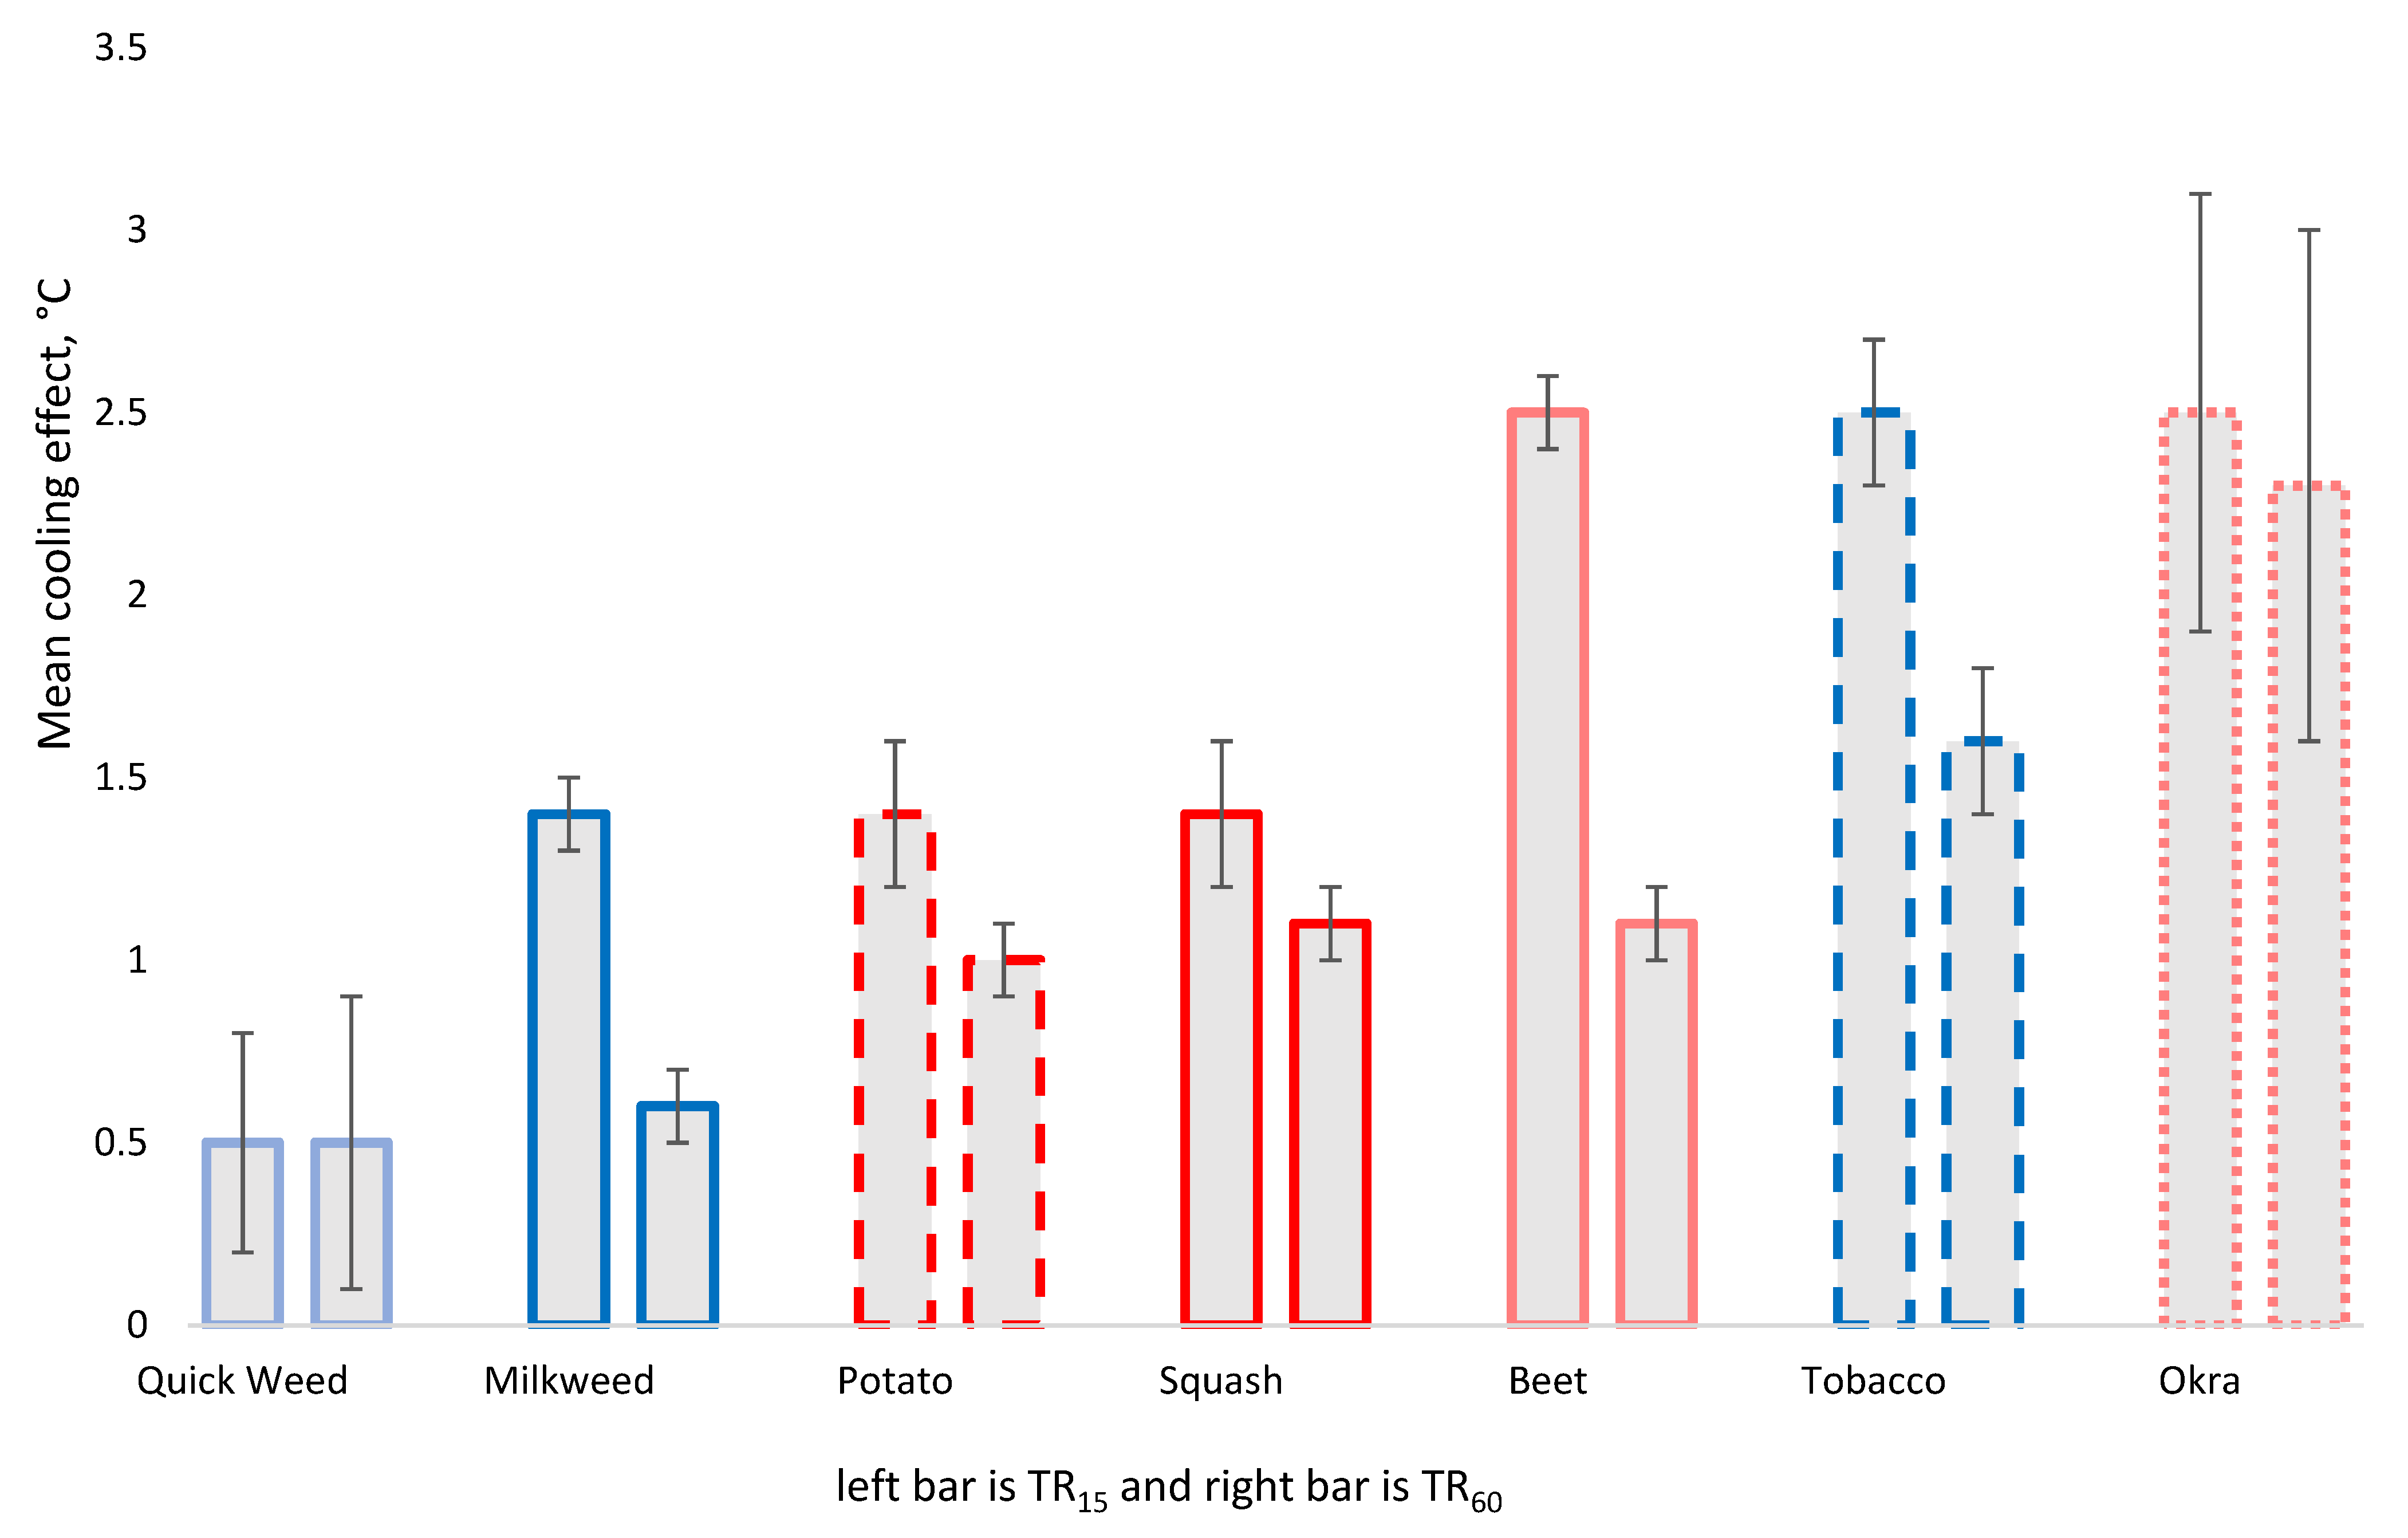
Each plant was individually assessed for its thermal effects over its growing period. Figure 8 shows the mean TR15 and TR60 achieved by the plants over their entire growing periods. At 15 cm elevation, the planting of okra, tobacco, and beet resulted in the same air-cooling of 2.5 °C. However, these magnitudes were lower at the 60 cm elevation, with the highest difference observed in beet, followed by tobacco and okra. Cooling of air temperatures above green roofs was restricted by distance in past studies [44,45,46]. Air-cooling variation across vertical profiles is attributed to vegetation shading and evapotranspiration [45,47]. Squash, potato, and milkweed generated mean air-cooling of 1.4 °C at the lower elevation, which was reduced to 1.1 °C, 1.0 °C, and 0.6 °C, respectively, at the higher elevation. The quickweed provided the slightest mean cooling with only 0.5 °C on both elevations, indicating that the cooling above this plant collection might have been more influenced by the bare soil evaporative cooling than its features.
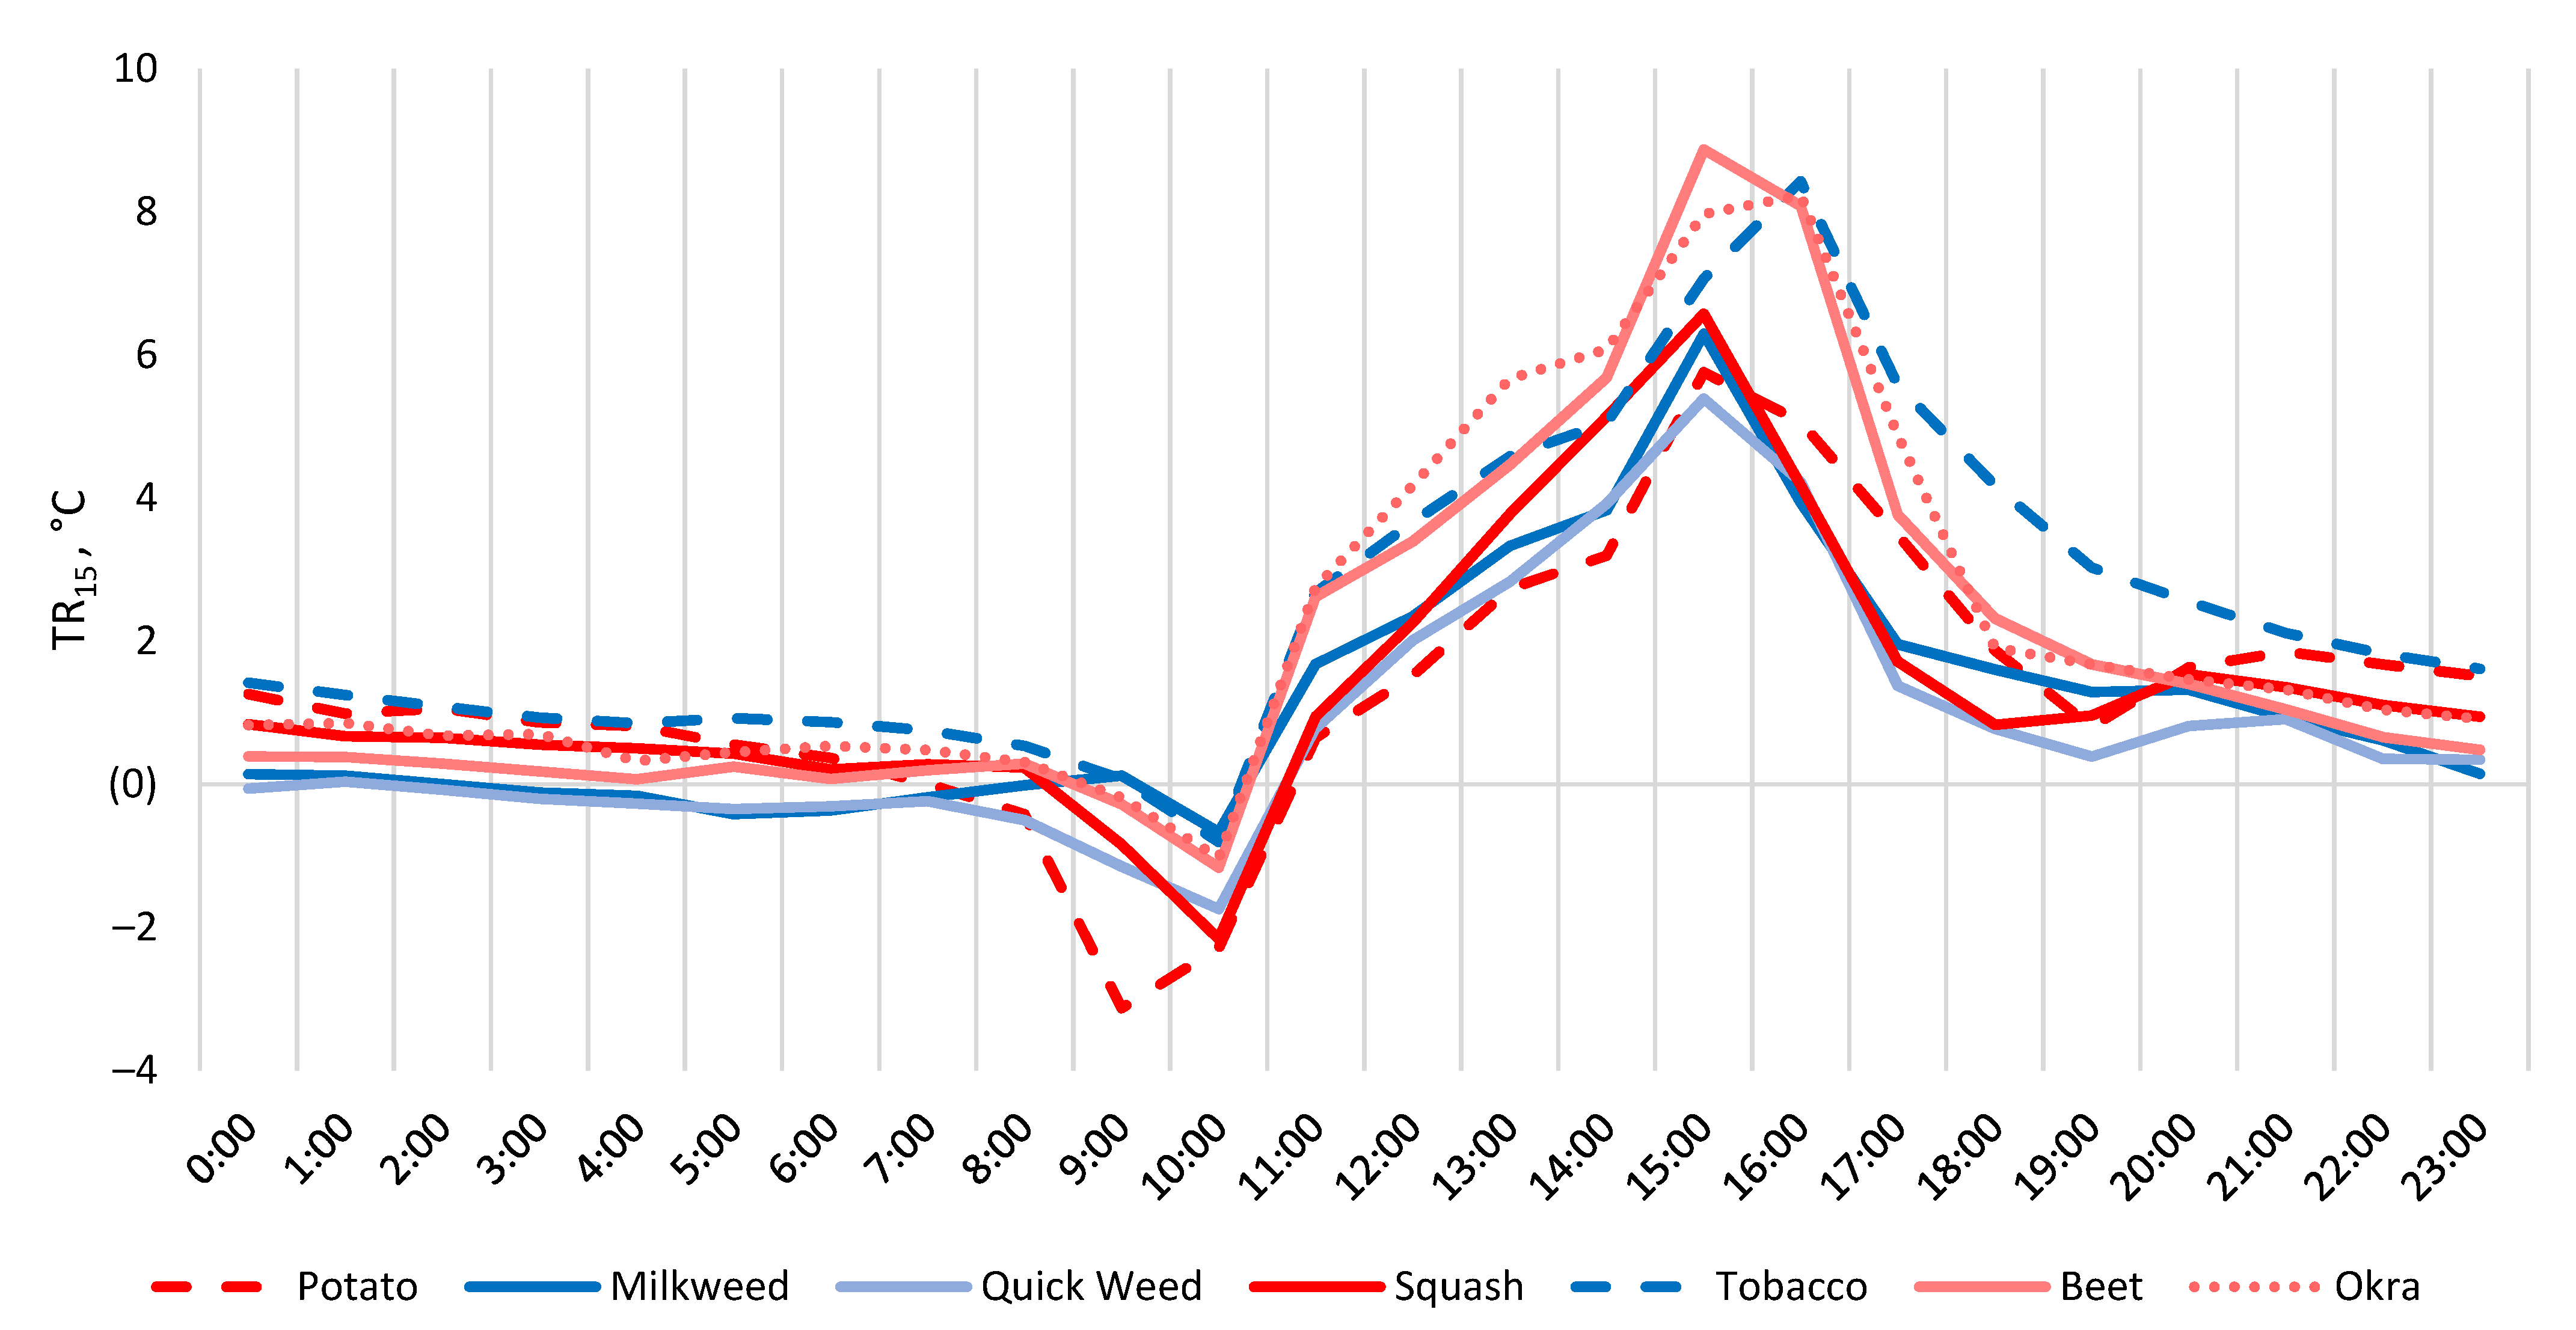
On an hourly basis, the thermal effects of the plants varied between the daytime and the nighttime. Figure 9 shows the diurnal pattern for TR15 determined by averaging hourly T15 over the entire growing period. All plants showed a cooling effect during the daytime; air temperature reductions started at 11:00 and continued rising until they peaked between 15:00 and 16:00. Following that, the air temperature reductions decline, creating a relatively bell-shaped diurnal pattern. Except for tobacco, beet, and okra, all plants produced a second but smaller cooling peak between 20:00 and 21:00. The thermal performance then followed a declining pattern until early morning, and the cooling remained between 0.4–1.2 °C. However, quickweed and milkweed generated an early-day warming effect (i.e., the air temperature above the plant is higher than the control roof) starting from 3:00. Potato showed a warming effect at 8:00, reaching a peak warming effect of 3.1 °C at 9:00. All other plants showed a delayed warming effect at 10:00, with squash and quickweed warming the air by 1.7–2.2 °C, whereas all other plants’ warming effect was <1 °C.
Several studies reported maximum cooling in the evening or nighttime [48], but others reported maximum cooling during the daytime [45,49]. At nighttime, it was found that higher spatial and vertical greenery coverage leads to a lower cooling effect [50]. The diurnal patterns in this study can be interpreted by understanding the driving factors of near-surface cooling performance. During the day, the control roof, made of a dark impermeable concrete surface, absorbs solar radiation, resulting in increased surface temperature and influencing the air temperature above [3,44]. When the solar radiation is highest in the afternoon, the control roof reaches its maximum temperature and does not dissipate heat due to the heat-sink effect [51]. On the contrary, vegetated green roofs provide a cooling effect due to leaf transpiration, soil evaporation, and shading [44]. Vegetation regulates the transpiration rate to avoid overheating damage, whereas the portion of solar radiation that penetrates the canopy reaches the soil surface, promoting evaporative cooling [52]. These observations rationalize the substantial peak of the near-surface air-cooling in the afternoon.
A possible reason for the decline in cooling after 15:00 could be the reduced transpiration rate, since stomata eventually close when they reach higher temperatures to prevent excessive and further water loss [53]. A similar pattern was found in Zhang et al. [54], who attributed the weaker cooling after peak hours to only vegetation shading or soil moisture evaporation, not plant transpiration.
The second and smaller peak cooling results from the long-wave radiation of thermal energy accumulated in the control roof and is primarily apparent in the evening rather than an increase in latent cooling on the rooftop farm surface, as explained by Meyn and Oke [55]. During the night, the bare concrete control roof continues giving up the heat stored during the day, and by early morning, the surface completes its thermal dissipation and becomes cooler [3]. In contrast, the trapped air under the canopy in the early morning increases air temperature near the soil surface [52], producing a warming effect between 8:00–10:00, just before the rooftop farm resumes its diurnal thermal cycle again.
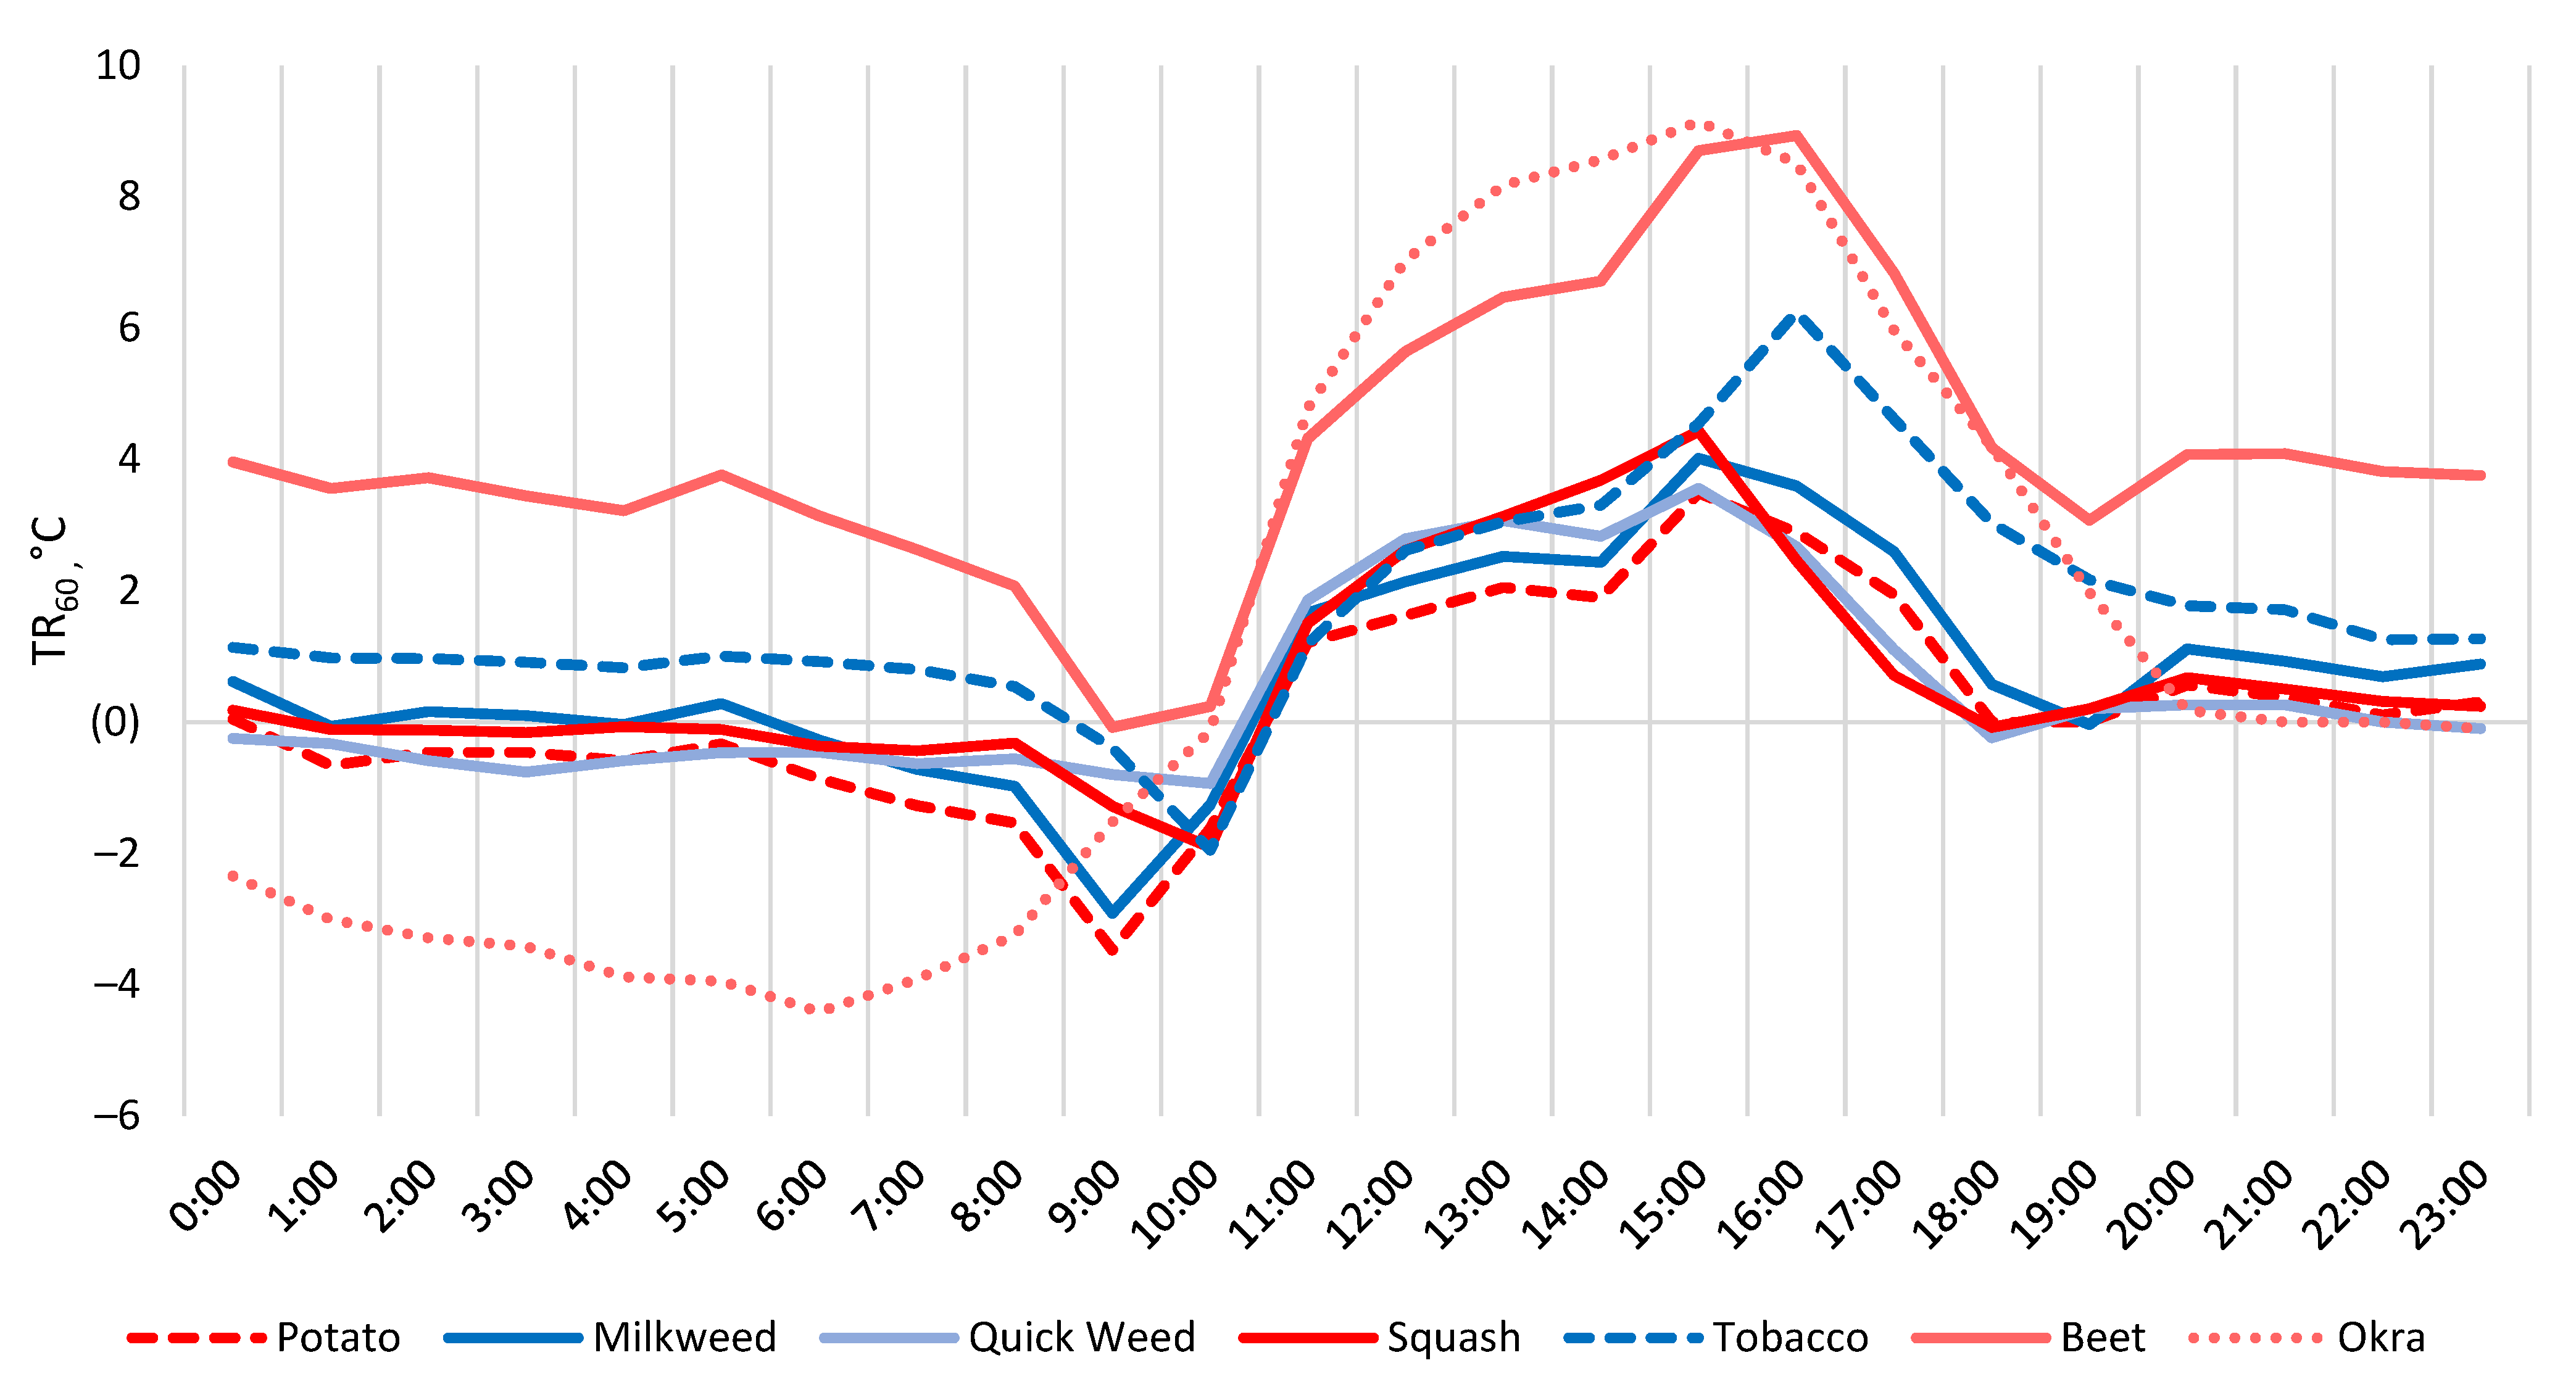
The hourly analysis of TR60 (Figure 10) shows that the diurnal cooling and warming patterns and the timing of the peaks were consistent with TR15, except that the magnitudes were different. At 60 cm elevation, okra was the only plant to show a higher peak air-cooling at the higher elevation with a magnitude of 9.1 °C. However, warming was dramatically increased and extended after midnight with a maximum warming effect of 4.4 °C. Maximum and minimum cooling and warming effects did not change for beet at the higher elevation. However, after midnight, the warming persisted from 3.2 to 4.0 °C and only steeply returned to zero at 8:00. Compared to the lower elevation, potato, milkweed, quickweed, and tobacco had a cooling reduction ranging from 39 to 26%, whereas squash had a more significant cooling reduction of 62% at the higher elevation.
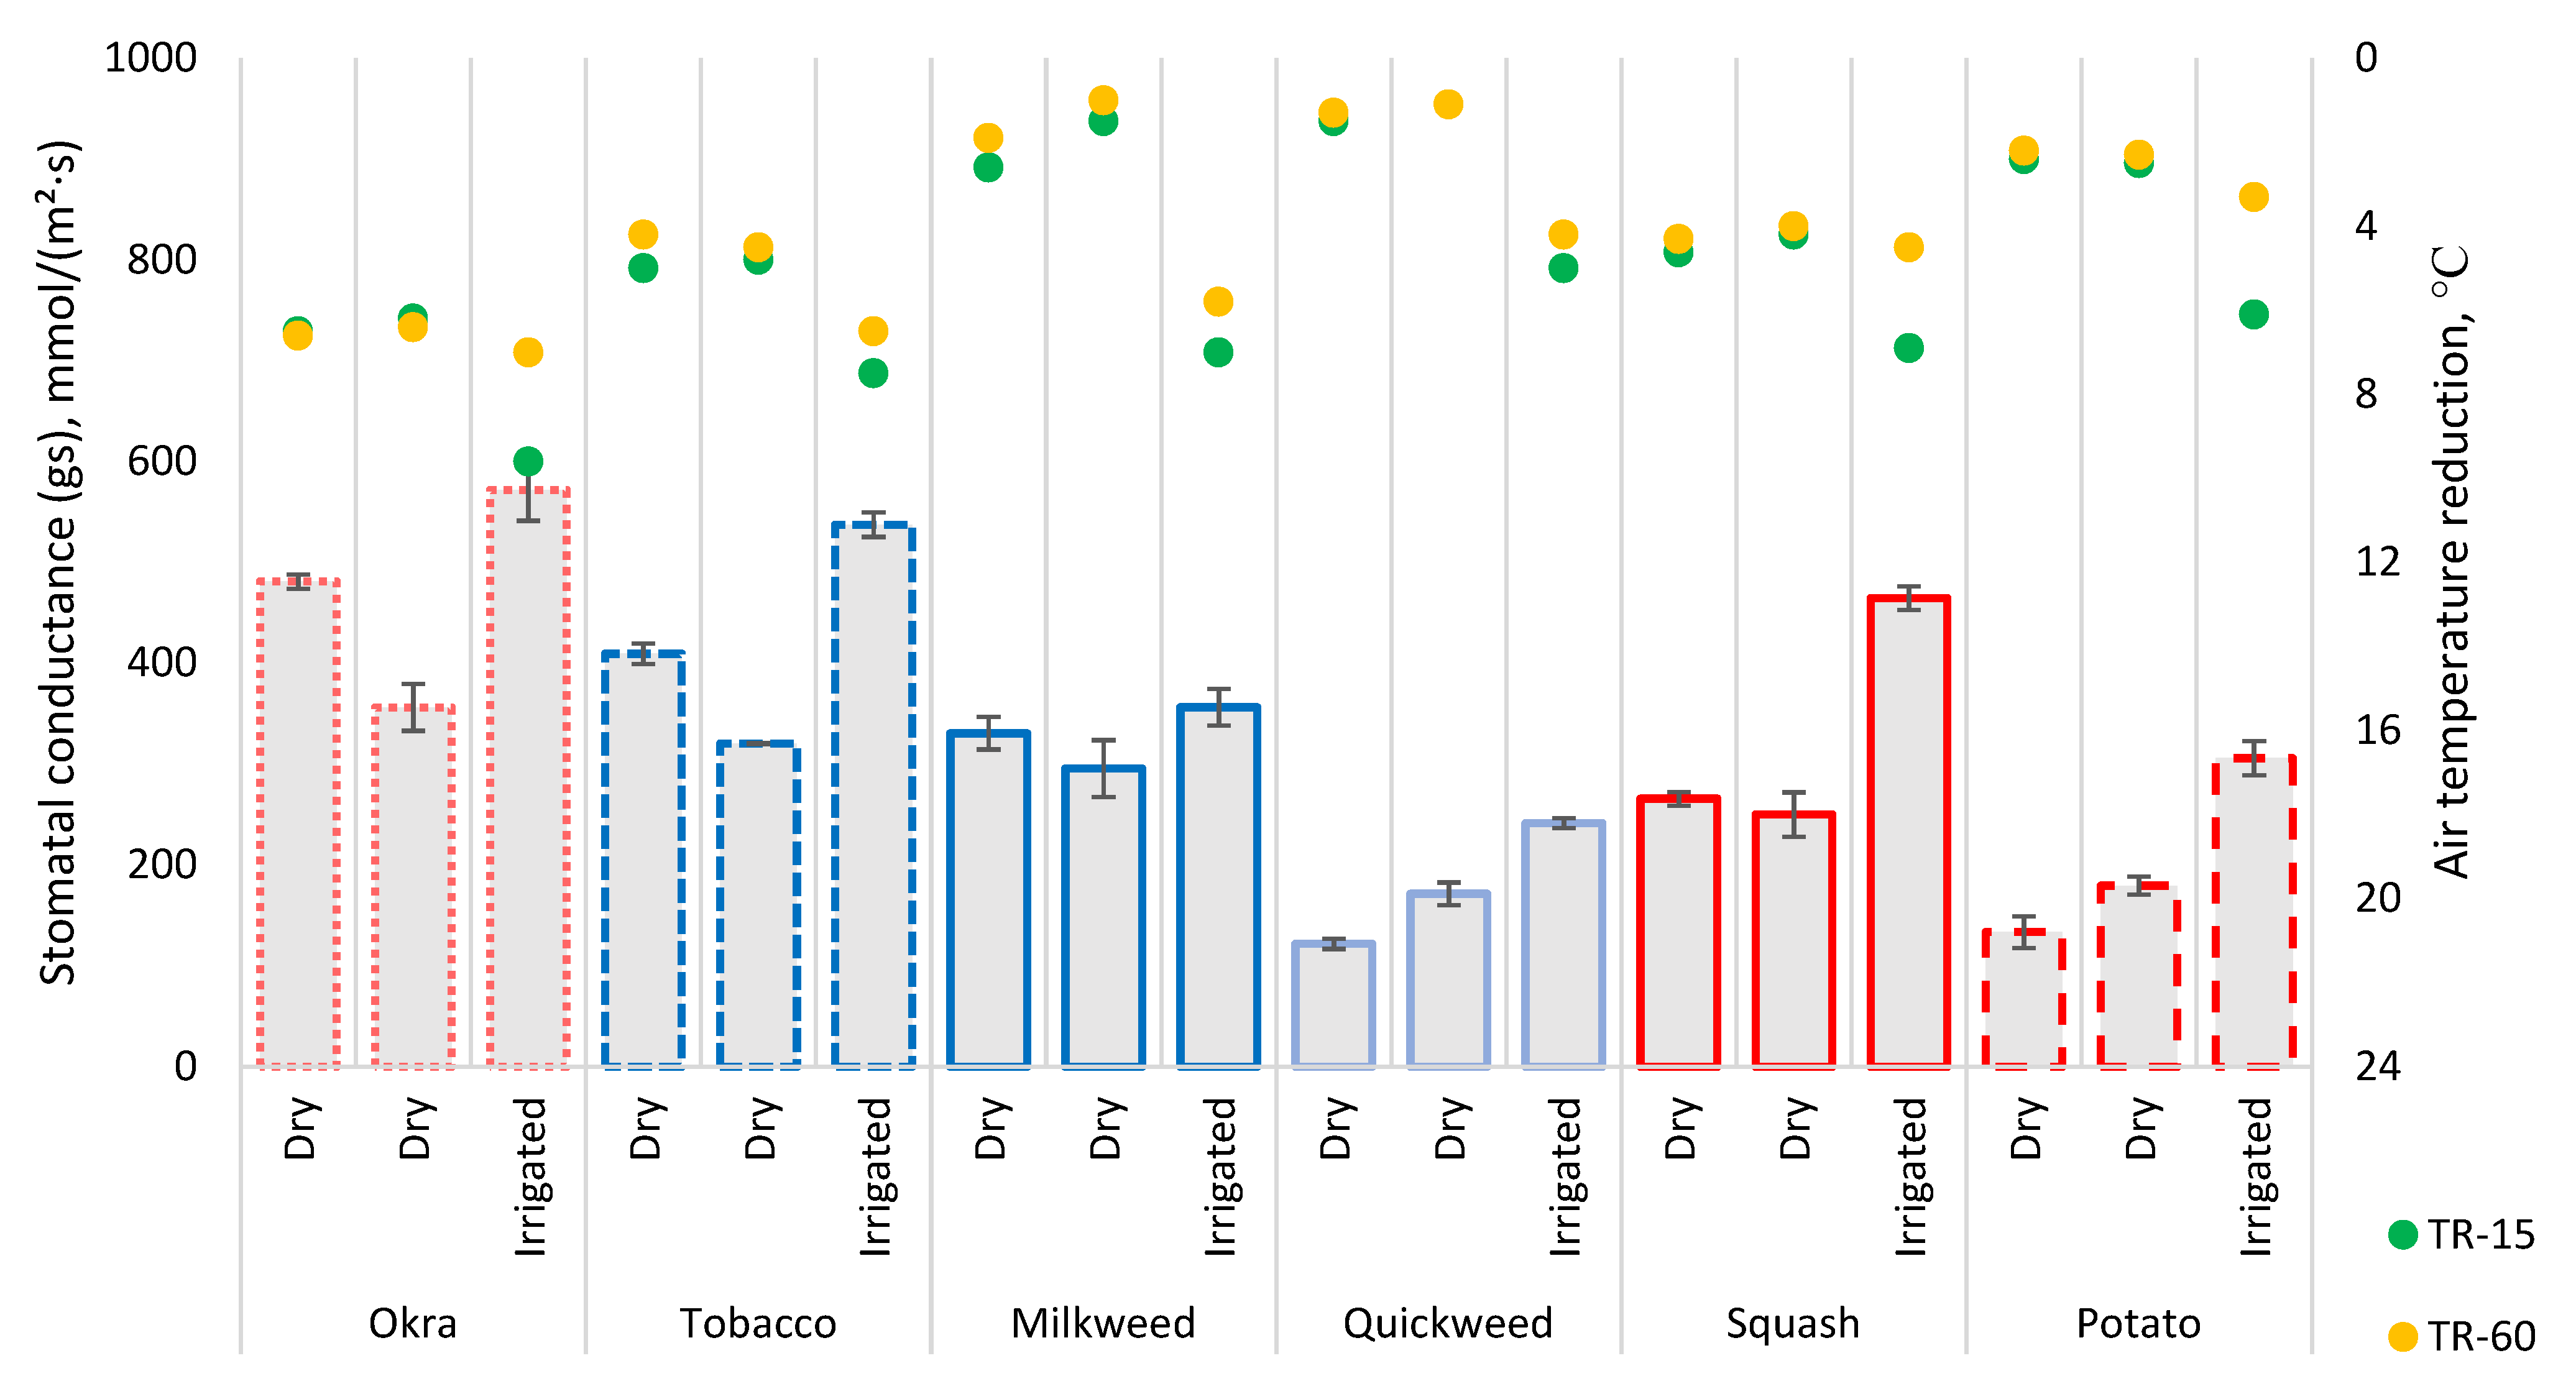
Shading and plant coverage over bare soil and their effect on temperature reduction has been reported [10,56,57]. The more significant diurnal cooling of okra can be attributed to shading, which reduces air temperatures under the canopy. In contrast, the cooling of the short-height beet is owed to plant coverage, since beet occupies a larger vegetation cover over the soil. Furthermore, it is crucial to note that transpiration driven by wet conditions and weather characteristics influences all plants’ previous seasonal and diurnal cooling patterns. The spot measurements of plant stomatal conductance in August, shown in Figure 11, revealed that stomatal conductance varies within the plant species and under drought and wet conditions. When irrigation was withheld for a week, and no rainfall occurred, the highest stomatal conductance observed was by okra, tobacco, and milkweed with a range of 295.5–481 mmol/(m2.s), whereas squash, potato, and quickweed had a lower range of 121.6–265.5 mmol/(m2.s). After receiving 8 h of drip irrigation, the measurements showed that plants with the least stomatal conductance during drought conditions experienced a tremendous increase in stomatal conditions, with potato, squash, and milkweed having an average percentage increase of 100%, 81%, and 70%, respectively. Okra and tobacco had a moderate increase of 38% and 49%, indicating their excellent transpiration efficiency during drought conditions and that irrigation is not as impactful on them as other species. The higher stomatal conductance led to a noticeably near-surface cooling presented in TR15 in all plants and, to a lesser extent, in TR60.
Stomatal conductance measures gases and transpiration, and, therefore, higher stomatal conductance indicates higher transpiration [58]. The three spot measurements were taken during the peak hours (13:00–15:00) when okra’s diurnal TR60 usually is higher than TR15. However, after receiving irrigation, okra has a TR15 of 9.6 °C, higher than the TR60 of 7 °C. A possible interpretation of this finding is that irrigation promotes soil cooling through evaporation, more significantly impacting near-surface cooling than distant points on the vertical profile, as found in MacIvor et al. [10] and Wong et al. [44]. Finally, although milkweed had the weakest response to irrigation with only a 14% increase in stomatal conductance, air temperatures were considerably reduced at both elevations after irrigation, probably due to substrate evaporative cooling and overall cooling of the farm.
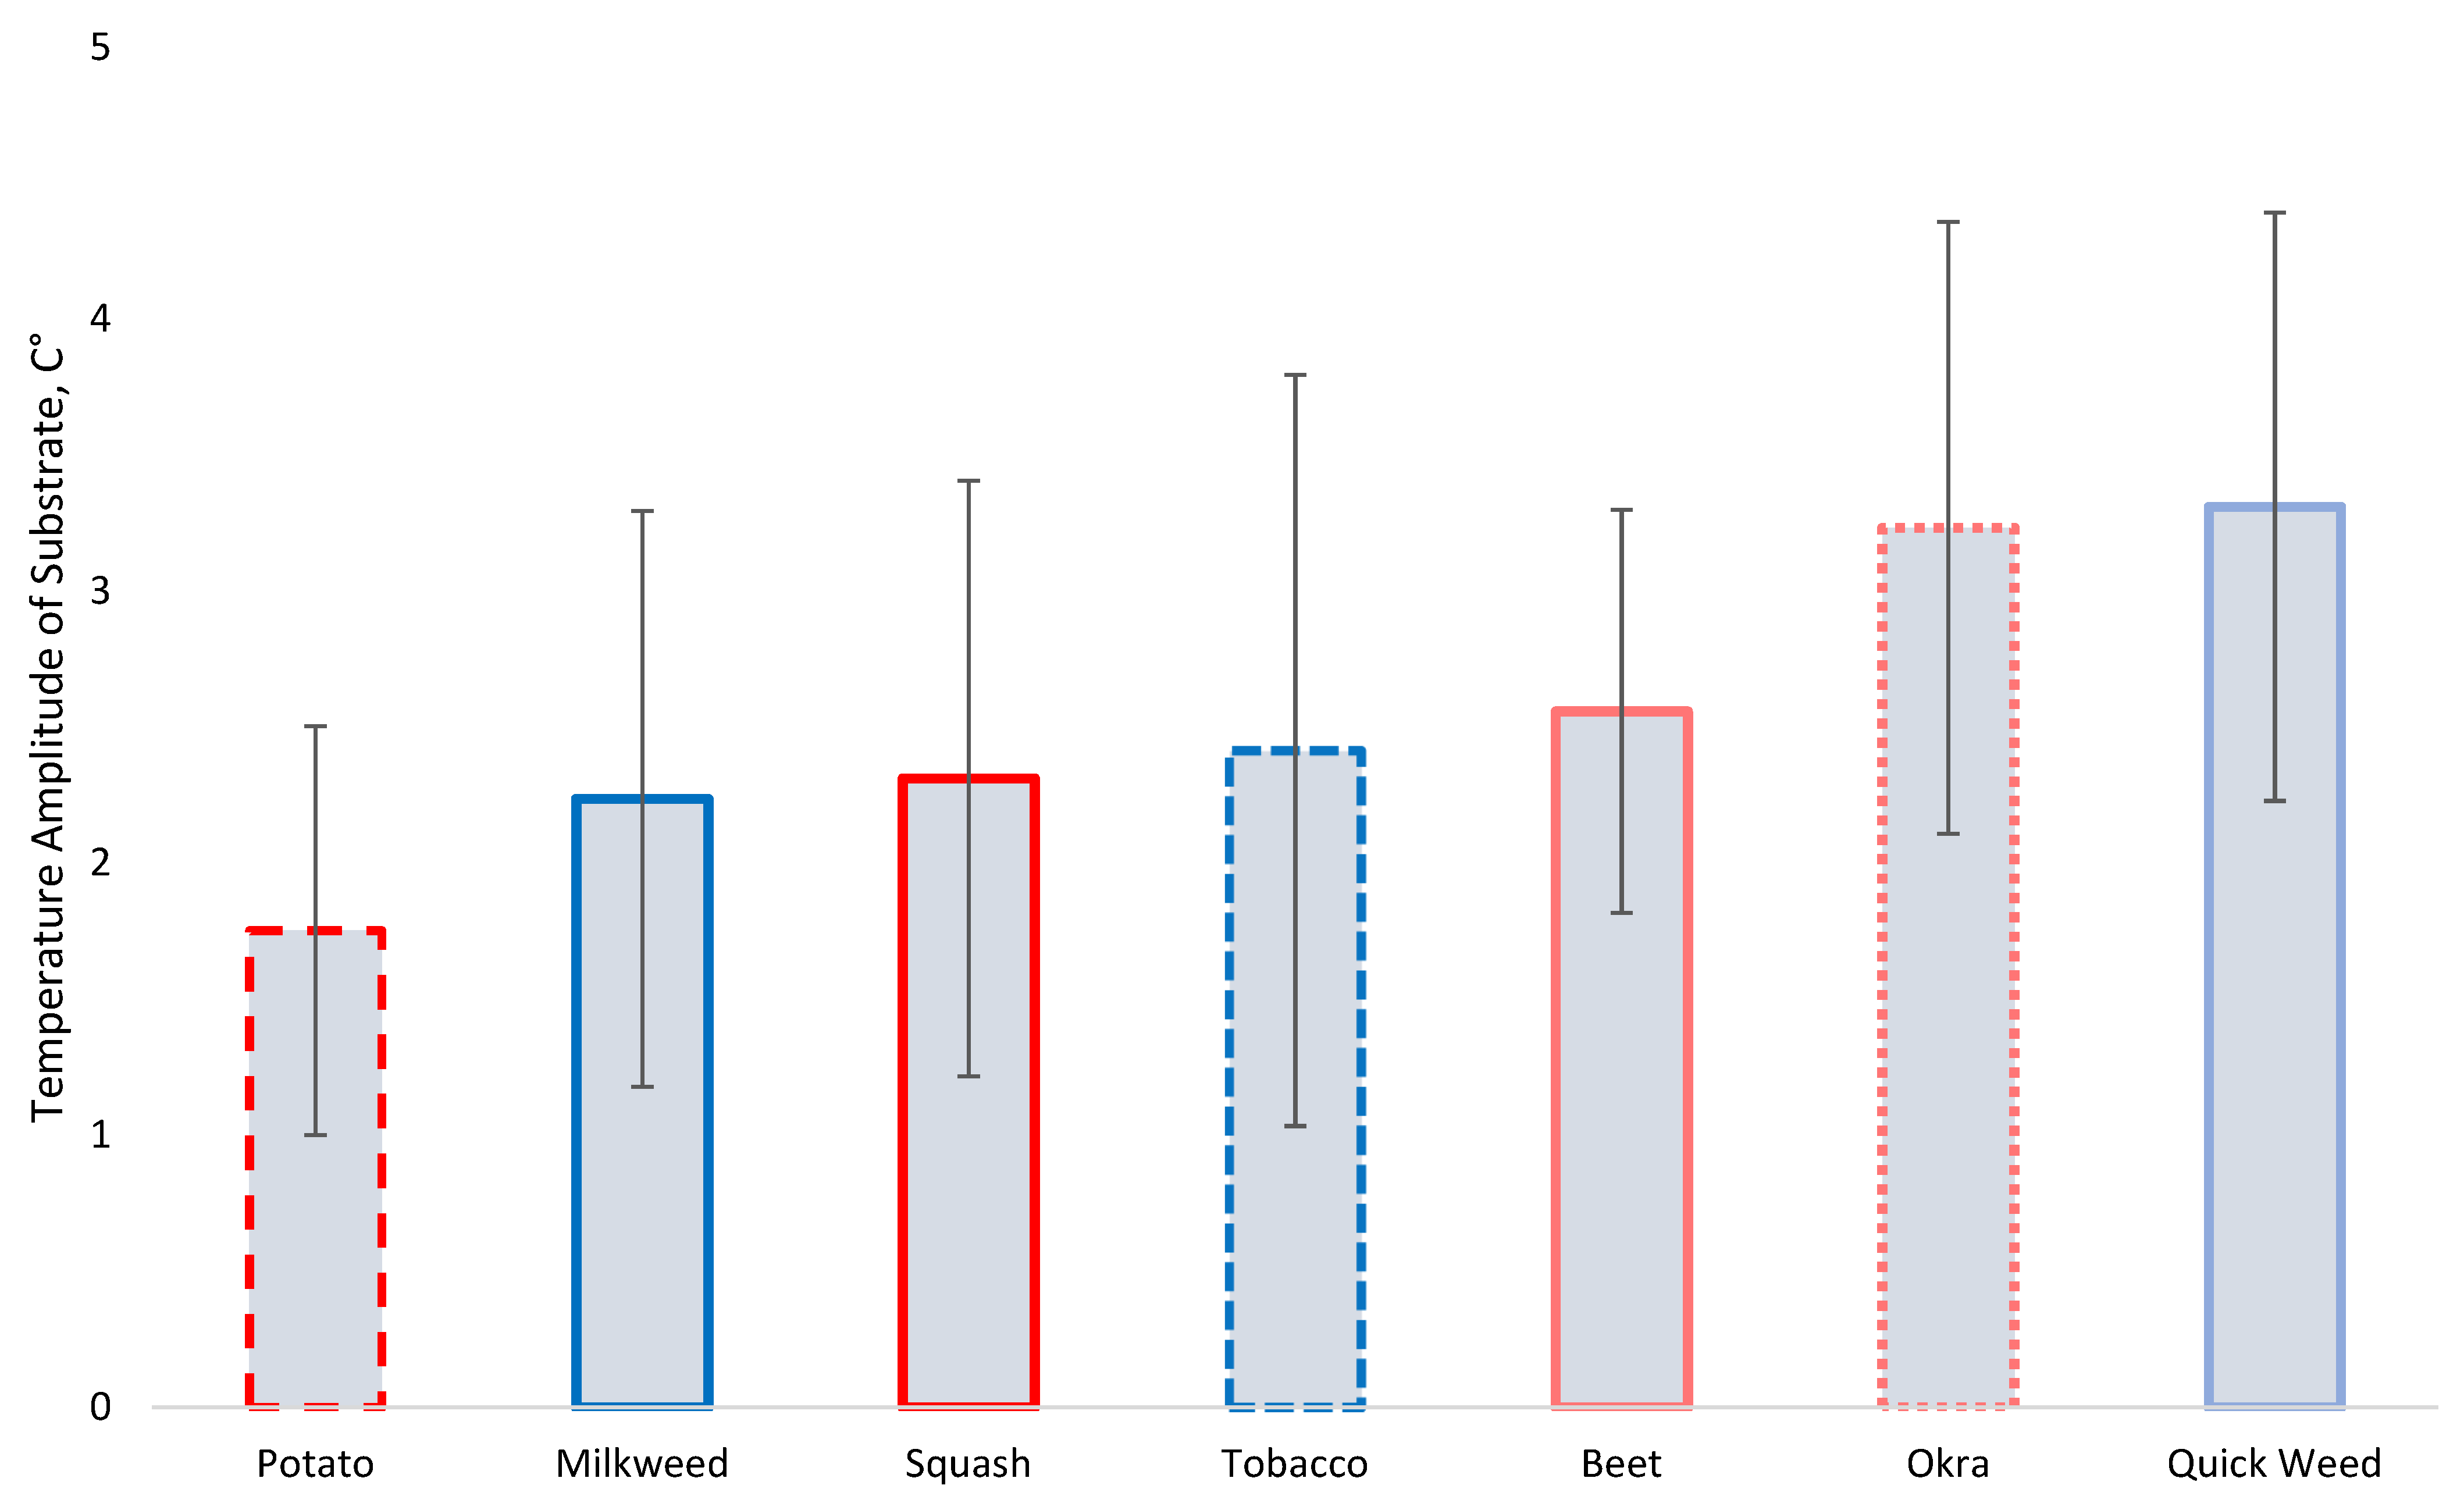
Analysis of soil temperature data clearly shows the impact of the individual plant on daily substrate fluctuations (Figure 12). The general picture emerging from the analysis is that plant species that contribute less to air temperature reduction have the slightest thermal fluctuations in their substrates. The least TAS was achieved by potato with only 1.8 °C. TAS for milkweed, squash, tobacco, and beet ranged from 2.2 to 2.6 °C. Despite its excellent air-cooling efficiency, okra achieved a TAS of 3.2 °C, providing evidence that the thermal response of plant species is complex, and their performance could be adequate in one indicator and limited in another. Quickweed achieved a TAS of 3.3 °C, the highest thermal fluctuation observed over the entire season.
Teemusk and Mander [59] found significant temperature fluctuations in a 100 mm substrate layer of a green roof compared with a bituminous roof surface. However, this study did not measure the temperature fluctuations within the surface of the control roof, which would probably be higher than the least-performing plants on the rooftop farm. Furthermore, the observed TAS values in this study are relatively lower than those reported in the literature. In Ottawa, Canada, the green roof reduced the membrane temperature fluctuations with a median amplitude of 5–7 °C [60]. Nevertheless, despite the advantages of the expanded drainage layer in the blue–green roof on the outdoor microclimate and substrate-level thermal regime, it is hypothesized that the persistent wet conditions may negatively impact indoor temperatures. The extra wet conditions in the substrate could increase the membrane surface temperature slightly due to higher thermal conductivity [58].
Weather characteristics also influence the thermal performance of green roofs, as past studies have shown [61]. Table 7 presents Pearson correlation coefficients between key weather parameters, including relative humidity, wind speed, solar radiation, and air and substrate thermal indicators. Soil moisture is also included in the analysis since it may influence the thermal regime of green roofs.
Overall, correlations between weather parameters and thermal indicators are noticeably low, despite being significant in many relationships. There were negative correlations between relative humidity and air temperature reductions aligning with the results of Jim and Peng [61]. As air temperature reduces, it can hold fewer water molecules, and subsequently, its relative humidity increases. Solar radiation positively and significantly correlated with air temperatures and reductions of both elevations above the substrate. Higher solar radiation leads to higher air temperature, but prolonged periods with solar radiation trigger evapotranspiration in plants and soil, which explains the positive correlation between solar radiation and TR15 and TR60. However, this relationship weakens at a higher elevation. Correlations between wind speed and thermal indicators were all statistically insignificant. Analysis of meteorological data shows that wind speeds were always low and vastly lower than nearby stations due to surrounding buildings, the mechanical room, and two penthouses on the northern and southern sides of the rooftop.
Soil moisture had a low but statistically significant correlation with T15 and TR15 but no relationship with T60 and TR60. Soil moisture is believed to be a critical factor in influencing thermal performance, but there have been some conflicting findings in the literature, as Lillian et al. [46] described. Increased soil moisture reduces near-surface air temperature influenced by surface temperature reduction due to evapotranspiration. However, the negative relationship between soil moisture and TR15 in this study is explained by the fact that the rooftop farm only received irrigation a few times in June and August. Most sudden soil moisture rises were caused by rainfall, resulting in a sudden decrease in the control roof’s concrete surface temperature [62]. The weak correlations are attributed to the unique feature of the blue–green roof, where the soil is wet most of the time due to passive irrigation from the expanded drainage layer. The opposite trend is observed in typical green roof studies because substrates become completely dry in a cyclic process, resulting in a more apparent relationship between soil moisture and thermal indicators upon receiving irrigation or rainfall.
4. Conclusions
The current lack of in-field tested studies on blue–green roofs and rooftop farms creates uncertainties about their performance and impedes their implementation. This study evaluated the hydrologic and thermal performance of a full-scale farmed blue–green roof in Toronto, Ontario, Canada, based on field monitoring carried out over an entire growing season. Based on the analysis of this study, the following conclusions can be drawn:
- Farmed blue–green roofs have the potential to provide adequate stormwater management through maximized retention and peak attenuation and extended peak delays. Overall, the rooftop farm had mean retention, peak attenuation, and peak delay ranges of 85–88%, 82–85%, and 7.7–8 h.
- The monthly analysis demonstrated that planting and harvesting activities could slightly impact hydrologic performance. Monthly volumetric runoff coefficients increased by 0.10 in plots subjected to major harvesting but generally remained between 0.10–0.20 except during intense storms, where they reached 0.30.
- Rainfall characteristics (depth, intensity, duration) correlated with all hydrologic performance indicators. Retention and peak delays were mainly influenced by both rainfall depth and intensity. However, peak attenuation was significantly governed by rainfall depth and lesser by duration and intensity.
- Each investigated plot was planted with different species belonging to different families. However, the hydrologic performance was similar in all plots, indicating the performance was primarily driven by the intensive organic substrate and the expanded drainage layer rather than the plant selection.
- Cover crops resulted in a hydrologic performance similar to the cultivated crops, providing stormwater management advantages in addition to their known benefit of protecting the soil.
- Overall, the air temperatures above all the plant species were lower than the control roof. At 15 cm elevation, the air temperature difference above okra, tobacco, and beet was 2.5 °C, whereas above squash, potato, and milkweed it was 1.4 °C. These magnitudes were lower at the higher elevation, indicating restriction of cooling by distance on the vertical profile.
- Maximum and moderate air-cooling effects were observed in the afternoon and evening. However, a warming effect was observed in the early morning. Differences in cooling effects are attributed to each plant’s features, including height, coverage, and shading.
- Irrigation influenced stomatal conductance and consequently transpiration, resulting in observable air-cooling compared to drought scenarios. However, the investigated plants differed in their physiological responses to irrigation.
- The slightest substrate temperature fluctuations were observed in potato (1.8 °C), followed by milkweed, squash, tobacco, and beet (2.2–2.6 °C). While the air temperature was the lowest above okra, its substrate temperature amplitude was higher than other plants, suggesting more thermal fluctuations.
- The mean air-cooling above quickweed was only 0.5 °C, and the temperature amplitudes of the substrates containing these plants were the highest, implying limited thermal benefits to the microclimate.
- Correlations between weather characteristics and thermal indicators were weaker than in past studies, probably due to the boundary conditions of the study site.
Taken altogether, the findings of this study demonstrate appreciable hydrologic and thermal benefits of farmed blue–green roofs. Therefore, the results provide encouragement for a broader implementation of these novel systems to control urban stormwater and improve microclimates. However, the expanded drainage layer in the blue–green roof and the farming activities will significantly increase loads on buildings, creating a potential structural challenge. While passive irrigation from the drainage layer in the blue–green roof can improve farming, future research will have to clarify whether this feature would still benefit shallow-rooted crops on intensive substrates. Furthermore, future research will need to examine the hydrologic and thermal performance of farmed blue–green roofs with extensive substrates since the latter is a more favorable option considering load restrictions on buildings.
Author Contributions
Conceptualization, T.A.; methodology, T.A.; field monitoring, T.A.; data analysis, T.A.; writing—original draft preparation, T.A.; writing—review and editing, T.A. and D.J.; project administration, D.J.; funding acquisition, D.J. All authors have read and agreed to the published version of the manuscript.
Funding
This research was funded by Natural Sciences and Engineering Research council of Canada (NSERC) Collaborative Research and Training Experience Program (CREATE). Andrew and Valerie Pringle provided funding for equipment purchases through the Urban Farm Living Lab.
Institutional Review Board Statement
Not applicable.
Informed Consent Statement
Not applicable.
Data Availability Statement
The data are available from the corresponding author upon reasonable request.
Acknowledgments
We would like to thank the Urban Farm Living Lab team for their collaboration over the monitoring period. Special thanks to Claire Oswald for the collaboration and equipment sharing.
Conflicts of Interest
The authors declare no conflict of interest.
References
- Miller, J.D.; Kim, H.; Kjeldsen, T.R.; Packman, J.; Grebby, S.; Dearden, R. Assessing the impact of urbanization on storm runoff in a peri-urban catchment using historical change in impervious cover. J. Hydrol. 2014, 515, 59–70. [Google Scholar] [CrossRef] [Green Version]
- Zschenderlein, P.; Fink, A.H.; Pfahl, S.; Wernli, H. Processes determining heat waves across different European climates. Q. J. R. Meteorol. Soc. 2019, 145, 2973–2989. [Google Scholar] [CrossRef] [Green Version]
- Gartland, L. Heat Islands: Understanding and Mitigating Heat in Urban Areas; Taylor & Francis: New York, NY, USA, 2008. [Google Scholar]
- Shafique, M.; Kim, R.; Lee, D. The potential of green-blue roof to manage storm water in urban areas. Nat. Environ. Pollut. Technol. 2016, 15, 715–718. [Google Scholar]
- Van Seters, T.; Rocha, L.; Smith, D.; Macmillan, G. Evaluation of Green Roofs for Runoff Retention, Runoff Quality, and Leachability. Water Qual. Res. J. 2009, 44, 33–47. [Google Scholar] [CrossRef]
- Sims, A.W.; Robinson, C.E.; Smart, C.C.; Voogt, J.; Hay, G.J.; Lundholm, J.T.; Powers, B.; O’Carroll, D.M. Retention performance of green roofs in three different climate regions. J. Hydrol. 2016, 542, 115–124. [Google Scholar] [CrossRef]
- Hill, J.; Drake, J.; Sleep, B.; Margolis, L. Influences of Four Extensive Green Roof Design Variables on Stormwater Hydrology. J. Hydrol. Eng. 2017, 22, 04017019. [Google Scholar] [CrossRef] [Green Version]
- Gong, Y.; Yin, D.; Li, J.; Zhang, X.; Wang, W.; Fang, X.; Shi, H.; Wang, Q. Performance assessment of extensive green roof runoff flow and quality control capacity based on pilot experiments. Sci. Total Environ. 2019, 687, 505–515. [Google Scholar] [CrossRef]
- Hill, J.; Drake, J.; Sleep, B. Comparisons of extensive green roof media in Southern Ontario. Ecol. Eng. 2016, 94, 418–426. [Google Scholar] [CrossRef]
- MacIvor, J.S.; Margolis, L.; Perotto, M.; Drake, J.A. Air temperature cooling by extensive green roofs in Toronto Canada. Ecol. Eng. 2016, 95, 36–42. [Google Scholar] [CrossRef]
- Dvorak, B.; Volder, A. Rooftop temperature reduction from unirrigated modular green roofs in south-central Texas. Urban For. Urban Green. 2013, 12, 28–35. [Google Scholar] [CrossRef]
- Solcerova, A.; van de Ven, F.; Wang, M.; Rijsdijk, M.; van de Giesen, N. Do green roofs cool the air? Build. Environ. 2017, 111, 249–255. [Google Scholar] [CrossRef] [Green Version]
- Ebrahimnejad, R.; Noori, O.; Deihimfard, R. Mitigation potential of green structures on local urban microclimate using ENVI-met model. Int. J. Urban Sustain. Dev. 2017, 9, 274–285. [Google Scholar] [CrossRef]
- Schindler, B.Y.; Blaustein, L.; Vasl, A.; Kadas, G.J.; Seifan, M. Cooling effect of Sedum sediforme and annual plants on green roofs in a Mediterranean climate. Urban For. Urban Green. 2019, 38, 392–396. [Google Scholar] [CrossRef]
- Cirkel, D.G.; Voortman, B.R.; van Veen, T.; Bartholomeus, R.P. Evaporation from (Blue-)Green Roofs: Assessing the Benefits of a Storage and Capillary Irrigation System Based on Measurements and Modeling. Water 2018, 10, 1253. [Google Scholar] [CrossRef] [Green Version]
- Shafique, M.; Kim, R. Application of green blue roof to mitigate heat island phenomena and resilient to climate change in urban areas: A case study from Seoul, Korea. J. Water Land Dev. 2017, 33, 165–170. [Google Scholar] [CrossRef] [Green Version]
- Almaaitah, T.; Appleby, M.; Rosenblat, H.; Drake, J.; Joksimovic, D. The potential of blue-Green infrastructure as a climate change adaptation strategy: A systematic literature review. Blue-Green Syst. 2021, 3, 223–248. [Google Scholar] [CrossRef]
- Orsini, F.; Gasperi, D.; Marchetti, L.; Piovene, C.; Draghetti, S.; Ramazzotti, S.; Bazzocchi, G.; Gianquinto, G. Exploring the production capacity of rooftop gardens (RTGs) in urban agriculture: The potential impact on food and nutrition security, biodiversity and other ecosystem services in the city of Bologna. Food Secur. 2014, 6, 781–792. [Google Scholar] [CrossRef]
- Eksi, M.; Rowe, D.B.; Fernández-Cañero, R.; Cregg, B.M. Effect of substrate compost percentage on green roof vegetable production. Urban For. Urban Green. 2015, 14, 315–322. [Google Scholar] [CrossRef]
- Walters, S.A.; Midden, K.S. Sustainability of Urban Agriculture: Vegetable Production on Green Roofs. Agriculture 2018, 8, 168. [Google Scholar] [CrossRef] [Green Version]
- Whittinghill, L.J.; Hsueh, D.; Culligan, P.; Plunz, R. Stormwater performance of a full scale rooftop farm: Runoff water quality. Ecol. Eng. 2016, 91, 195–206. [Google Scholar] [CrossRef] [Green Version]
- Harada, Y.; Whitlow, T.H.; Walter, M.T.; Bassuk, N.L.; Russell-Anelli, J.; Schindelbeck, R.R. Hydrology of the Brooklyn Grange, an urban rooftop farm. Urban Ecosyst. 2018, 21, 673–689. [Google Scholar] [CrossRef]
- Fassman-Beck, E.; Voyde, E.; Simcock, R.; Hong, Y.S. 4 Living roofs in 3 locations: Does configuration affect runoff mitigation? J. Hydrol. 2013, 490, 11–20. [Google Scholar] [CrossRef]
- Carson, T.; Keeley, M.; Marasco, D.E.; McGillis, W.; Culligan, P. Assessing methods for predicting green roof rainfall capture: A comparison between full-scale observations and four hydrologic models. Urban Water J. 2017, 14, 589–603. [Google Scholar] [CrossRef]
- Getter, K.L.; Rowe, D.B.; Andresen, J.A.; Wichman, I.S. Seasonal heat flux properties of an extensive green roof in a Midwestern U.S. climate. Energy Build. 2011, 43, 3548–3557. [Google Scholar] [CrossRef]
- Ferrans, P.; Rey, C.V.; Pérez, G.; Rodríguez, J.P.; Díaz-Granados, M. Effect of green roof configuration and hydrological variables on runoffwater quantity and quality. Water 2018, 10, 960. [Google Scholar] [CrossRef] [Green Version]
- Razzaghmanesh, M.; Borst, M. Investigation clogging dynamic of permeable pavement systems using embedded sensors. J. Hydrol. 2018, 557, 887–896. [Google Scholar] [CrossRef]
- Carter, T.L.; Rasmussen, T.C. Hydrologic behavior of vegetated roofs. J. Am. Water Resour. Assoc. 2006, 42, 1261–1274. [Google Scholar] [CrossRef]
- Simmons, M.T.; Gardiner, B.; Windhager, S.; Tinsley, J. Green roofs are not created equal: The hydrologic and thermal performance of six different extensive green roofs and reflective and non-reflective roofs in a sub-tropical climate. Urban Ecosyst. 2008, 11, 339–348. [Google Scholar] [CrossRef]
- Stovin, V.; Vesuviano, G.; Kasmin, H. The hydrological performance of a green roof test bed under UK climatic conditions. J. Hydrol. 2012, 414–415, 148–161. [Google Scholar] [CrossRef]
- Shafique, M.; Lee, D.; Kim, R. A field study to evaluate runoffquantity from blue roof and green blue roof in an urban area. Int. J. Control Autom. 2016, 9, 59–68. [Google Scholar]
- Jahanfar, A.; Drake, J.; Sleep, B.; Margolis, L. Evaluating the shading effect of photovoltaic panels on green roof discharge reduction and plant growth. J. Hydrol. 2019, 568, 919–928. [Google Scholar] [CrossRef]
- Soulis, K.X.; Valiantzas, J.D.; Ntoulas, N.; Kargas, G.; Nektarios, P.A. Simulation of green roof runoff under different substrate depths and vegetation covers by coupling a simple conceptual and a physically based hydrological model. J. Environ. Manag. 2017, 200, 434–445. [Google Scholar] [CrossRef] [PubMed]
- Voyde, E.; Fassman-Beck, E.; Simcock, R. Hydrology of an extensive living roof under sub-tropical climate conditions in Auckland, New Zealand. J. Hydrol. 2010, 394, 384–395. [Google Scholar] [CrossRef]
- Sims, A.W.; Robinson, C.E.; Smart, C.C.; O’Carroll, D.M. Mechanisms controlling green roof peak flow rate attenuation. J. Hydrol. 2019, 577, 123972. [Google Scholar] [CrossRef]
- Martin, W.D.; Kaye, N.B. A simple method for sizing modular green–blue roof systems for design storm peak discharge reduction. SN Appl. Sci. 2020, 2, 1874. [Google Scholar] [CrossRef]
- Denardo, J.C.; Jarrett, A.R.; Manbeck, H.B.; Beattie, D.J.; Berghage, R.D. Stormwater mitigation and surface temperature reduction by green roofs. Trans. ASAE 2005, 48, 1491–1496. [Google Scholar] [CrossRef]
- Blanusa, T.; Monteiro MM, V.; Fantozzi, F.; Vysini, E.; Li, Y.; Cameron, R.W. Alternatives to Sedum on green roofs: Can broad leaf perennial plants offer better “cooling service”? Build. Environ. 2013, 59, 99–106. [Google Scholar] [CrossRef] [Green Version]
- Zhang, Z.; Szota, C.; Fletcher, T.D.; Williams, N.S.; Werdin, J.; Farrell, C. Influence of plant composition and water use strategies on green roof stormwater retention. Sci. Total Environ. 2018, 625, 775–781. [Google Scholar] [CrossRef]
- Nardini, A.; Andri, S.; Crasso, M. Influence of substrate depth and vegetation type on temperature and water runoff mitigation by extensive green roofs: Shrubs versus herbaceous plants. Urban Ecosyst. 2011, 15, 697–708. [Google Scholar] [CrossRef]
- VanWoert, N.D.; Rowe, D.B.; Andresen, J.A.; Rugh, C.L.; Fernandez, R.T.; Xiao, L. Green Roof Stormwater Retention. J. Environ. Qual. 2005, 34, 1036–1044. [Google Scholar] [CrossRef]
- Lundholm, J.; MacIvor, J.S.; MacDougall, Z.; Ranalli, M. Plant Species and Functional Group Combinations Affect Green Roof Ecosystem Functions. PLoS ONE 2010, 5, e9677. [Google Scholar] [CrossRef] [PubMed] [Green Version]
- Bousselot, J.M.; Klett, J.E.; Koski, R.D. Moisture Content of Extensive Green Roof Substrate and Growth Response of 15 Temperate Plant Species during Dry Down. HortScience 2011, 46, 518–522. [Google Scholar] [CrossRef] [Green Version]
- Wong, N.H.; Chen, Y.; Ong, C.L.; Sia, A. Investigation of thermal benefits of rooftop garden in the tropical environment. Build. Environ. 2003, 38, 261–270. [Google Scholar] [CrossRef]
- Jim, C.Y. Effect of vegetation biomass structure on thermal performance of tropical green roof. Landsc. Ecol. Eng. 2012, 8, 173–187. [Google Scholar] [CrossRef] [Green Version]
- Peng, L.L.H.; Yang, X.; He, Y.; Hu, Z.; Xu, T.; Jiang, Z.; Yao, L. Thermal and energy performance of two distinct green roofs: Temporal pattern and underlying factors in a subtropical climate. Energy Build. 2019, 185, 247–258. [Google Scholar] [CrossRef]
- Kumar, R.; Kaushik, S.C. Performance evaluation of green roof and shading for thermal protection of buildings. Build. Environ. 2005, 40, 1505–1511. [Google Scholar] [CrossRef]
- Speak, A.F.; Rothwell, J.J.; Lindley, S.J.; Smith, C.L. Reduction of the urban cooling effects of an intensive green roof due to vegetation damage. Urban Clim. 2013, 3, 40–55. [Google Scholar] [CrossRef]
- TÜRKERİ, N.; ALTUN, M.C.; Göçer, C. Comparative Assessment of Thermal Performance of Existing Roof System and Retrofitted Green Roof System in Istanbul, Turkey. Megaron 2011, 6, 21. [Google Scholar]
- Morakinyo, T.E.; Kong, L.; Lau, K.K.-L.; Yuan, C.; Ng, E.Y.Y. A study on the impact of shadow-cast and tree species on in-canyon and neighborhood’s thermal comfort. Build. Environ. 2017, 115, 1–17. [Google Scholar] [CrossRef]
- Jim, C.Y. Assessing climate-adaptation effect of extensive tropical green roofs in cities. Landsc. Urban Plan. 2015, 138, 54–70. [Google Scholar] [CrossRef]
- Jim, C.Y.; Tsang, S.W. Modeling the heat diffusion process in the abiotic layers of green roofs. Energy Build. 2011, 43, 1341–1350. [Google Scholar] [CrossRef]
- Huang, Y.-Y.; Chen, C.-T.; Liu, W.-T. Thermal performance of extensive green roofs in a subtropical metropolitan area. Energy Build. 2018, 159, 39–53. [Google Scholar] [CrossRef]
- Zhang, G.; He, B.-J.; Dewancker, B.J. The maintenance of prefabricated green roofs for preserving cooling performance: A field measurement in the subtropical city of Hangzhou, China. Sustain. Cities Soc. 2020, 61, 102314. [Google Scholar] [CrossRef]
- Meyn, S.K.; Oke, T.R. Heat fluxes through roofs and their relevance to estimates of urban heat storage. Energy Build. 2009, 41, 745–752. [Google Scholar] [CrossRef] [Green Version]
- Ouldboukhitine, S.-E.; Belarbi, R.; Jaffal, I.; Trabelsi, A. Assessment of green roof thermal behavior: A coupled heat and mass transfer model. Build. Environ. 2011, 46, 2624–2631. [Google Scholar] [CrossRef]
- Jaffal, I.; Ouldboukhitine, S.-E.; Belarbi, R. A comprehensive study of the impact of green roofs on building energy performance. Renew. Energy 2012, 43, 157–164. [Google Scholar] [CrossRef]
- Tan, C.L.; Tan, P.Y.; Wong, N.H.; Takasuna, H.; Kudo, T.; Takemasa, Y.; Lim, C.V.J.; Chua, H.X.V. Impact of soil and water retention characteristics on green roof thermal performance. Energy Build. 2017, 152, 830–842. [Google Scholar] [CrossRef]
- Teemusk, A.; Mander, Ü. Greenroof potential to reduce temperature fluctuations of a roof membrane: A case study from Estonia. Build. Environ. 2009, 44, 643–650. [Google Scholar] [CrossRef]
- Liu, K.; Baskaran, B. Thermal performance of green roofs through field evaluation. In Proceedings of the First North American Green Roof Infrastructure Conference, Awards and Trade Show: Greening Rooftops for Sustainable Communities, Chicago, IL, USA, 29–30 May 2003; Volume 10. [Google Scholar]
- Jim, C.Y.; Peng, L.L.H. Weather effect on thermal and energy performance of an extensive tropical green roof. Urban For. Urban Green. 2012, 11, 73–85. [Google Scholar] [CrossRef]
- Jim, C.Y.; Peng, L.L.H. Substrate moisture effect on water balance and thermal regime of a tropical extensive green roof. Ecol. Eng. 2012, 47, 9–23. [Google Scholar] [CrossRef]
Figure 1.
An aerial view of the farm with the drainage areas highlighted.

Figure 2.
Schematic cross-section of the farmed blue–green roof.

Figure 3.
Position and height of the monitoring equipment installed on the roof.

Figure 4.
Monthly mean Cvol for the three plots at the rooftop farm.

Figure 5.
Monthly mean PA for the three plots at the rooftop farm.

Figure 6.
Monthly mean Tdelay for the three plots at the rooftop farm.

Figure 7.
Measured T15 (left) and T60 (right) for the plants and the control roof.

Figure 8.
Mean temperature reductions for all plants.

Figure 9.
Hourly TR15 for each plant during the day.

Figure 10.
Hourly TR60 for each plant during the day.

Figure 11.
Stomatal conductance measurements on 4, 18, and 23 August and air temperature reductions on both elevations.
Figure 11.
Stomatal conductance measurements on 4, 18, and 23 August and air temperature reductions on both elevations.

Figure 12.
Temperature amplitude of substrate with different plants.


Table 1.
The cultivated crops and self-sown plant species over the growing season.
| Plot | Common Name | Scientific Name | Family | Planted | Harvested |
|---|---|---|---|---|---|
| A | Lettuce | Lactuca sativa | Asteraceae | August | October |
| Salad mix | Lactuca sativa—Cichorium endivia | Asteraceae | August | October | |
| Pak choi | Brassica rapa | Brassicaceae | May | July | |
| Kohlrabi | Brassica oleracea Gongylodes | Brassicaceae | May | July | |
| Cabbage | B. oleracea var. capitata | Brassicaceae | May | July | |
| Arugula | Eruca vesicaria subsp. sativa | Brassicaceae | May | July | |
| Okra | Abelmoschus esculentus | Malvaceae | May | September | |
| Eggplant | Solanum melongena | Solanaceae | May | September | |
| Tomato | Solanum lycopersicum var. cerasiforme | Solanaceae | May | September | |
| Pepper | Capsicum annuum | Solanaceae | May | September | |
| Potato | Solanum tuberosum | Solanaceae | May | September | |
| Tobacco | Nicotiana tabacum | Solanaceae | May | September | |
| Rye ** | Secale cereale | Poaceae | November | End of season | |
| B | Salad mix | Lactuca sativa—Cichorium endivia | Asteraceae | May | September |
| Radish | Raphanus sativus | Brassicaceae | May | July | |
| Turnip | Brassica rapa subsp. rapa | Brassicaceae | May | July | |
| Garlic | Allium sativum | Alliums | May | July | |
| Onion | Allium cepa | Alliums | May | July | |
| Callaloo | Amaranthus viridis | Amaranthaceae | May | July | |
| Chard | Beta vulgaris subsp. vulgaris | Amaranthaceae | May | July | |
| Beet | Beta vulgaris var conditiva | Amaranthaceae | May | September | |
| Spinach | Spinacia oleracea | Amaranthaceae | May | September | |
| Purslane * | Portulaca oleracea | Portulacaceae | May | September | |
| Peruvian daisy * | Galinsoga quadriradiata | Asteraceae | May | September | |
| Crabgrass * | Digitaria crabgrass | Poaceae | May | September | |
| Milkweed * | Asclepias syriaca | Apocynaceae | May | September | |
| Rye ** | Secale cereale | Poaceae | November | End of season | |
| Straw ** | N/A | N/A | November | End of season | |
| C | Turnip | Brassica rapa subsp. rapa | Brassicaceae | May | July |
| Pak choi | Brassica rapa | Brassicaceae | August | October | |
| Kohlrabi | Brassica oleracea Gongylodes | Brassicaceae | August | October | |
| Radish | Raphanus sativus | Brassicaceae | August | October | |
| Carrot | Daucus carota | Apiaceae | May | July | |
| Chervil | Anthriscus cerefolium | Apiaceae | August | September | |
| Winter squash | Cucurbita maxima | Cucurbitaceae | May | October | |
| Summer squash | Cucurbita pepo | Cucurbitaceae | May | August | |
| Bitter melon | Momordica charantia | Cucurbitaceae | May | October | |
| Cucumber | Cucumis sativus | Cucurbitaceae | May | August | |
| Straw ** | N/A | N/A | November | End of season |
* Self-sown ** Cover crop.
Table 2.
Physical properties of the growing media.
| Grain Size Distribution | |||||
|---|---|---|---|---|---|
| % Gravel | 3.67 | D10 | 1.0 | Cu | 1.8 |
| % Sand | 96.31 | D30 | 1.2 | Cc | 0.8 |
| % Fines | 0.02 | D60 | 1.8 | ||
| Maximum water holding capacity | >90% | ||||
| Dry density | 0.52 g/cm3 | ||||
| Saturated density | 2.4 g/cm3 | ||||
| Saturated hydraulic conductivity | 0.02 cm/s | ||||
| Organic matter | 25.4% | ||||
Table 3.
Monthly distribution of the observed rainfall characteristics.
| Month | Number of Storms | Rainfall Depth (mm) | Mean Rainfall Intensity | Peak Rainfall Intensity | Mean Duration (h) |
|---|---|---|---|---|---|
| June | 7 | 55.6 | 2.9 | 19.2 | 10.3 |
| July | 7 | 80.2 | 4.1 | 12.0 | 5 |
| August | 5 | 7.4 | 2.5 | 2.9 | 0.7 |
| September | 8 | 116 | 2.8 | 6.0 | 3.3 |
| October | 11 | 103.4 | 2.6 | 4.1 | 7.0 |
| November | 5 | 28.2 | 2.4 | 2.4 | 7.2 |
Table 4.
Hydrologic performance statistics obtained from the event-based analysis.
| Statistic | RET (%) | PA (%) | Tdelay (h) | ||||||
|---|---|---|---|---|---|---|---|---|---|
| Plot A | Plot B | Plot C | Plot A | Plot B | Plot C | Plot A | Plot B | Plot C | |
| Minimum | 45 | 40 | 48 | 15 | 15 | 14 | 0 | 0 | 0 |
| Median | 92 | 87 | 91 | 100 | 100 | 100 | 5 | 4 | 4 |
| Maximum | 100 | 100 | 100 | 93 | 91 | 99 | 24 | 24 | 24 |
| Mean | 87 | 85 | 88 | 84 | 82 | 85 | 8 | 8.1 | 7.7 |
| STD | 14 | 14 | 13 | 18 | 22 | 22 | 8 | 8 | 8 |
| CV | 0.2 | 0.2 | 0.1 | 0.2 | 0.3 | 0.3 | 0.9 | 1.0 | 1.0 |
Table 5.
Spearman Rho correlation between performance indicators and rainfall characteristics, level of statistical significance indicated between the parentheses.
Table 5.
Spearman Rho correlation between performance indicators and rainfall characteristics, level of statistical significance indicated between the parentheses.
| RET (%) | PA (%) | Tdelay (h) | |
|---|---|---|---|
| Rainfall depth (mm) | −0.44 (p < 0.01) | −0.75 (p < 0.01) | −0.44 (p < 0.01) |
| Average rainfall intensity (mm/h) | −0.31 (p < 0.01) | −0.41 (p < 0.01) | −0.44 (p < 0.01) |
| Peak rainfall intensity (mm/h) | −0.36 (p < 0.01) | −0.26 (p < 0.01) | −0.36 (p < 0.01) |
| Rainfall duration (h) | −0.15 (p > 0.05) | −0.53 (p < 0.01) | −0.15 (p > 0.05) |
| ADP (h) | 0.17 (p > 0.05) | 0.23 (p > 0.05) | 0.21 (p > 0.05) |
Table 6.
Monthly climatic conditions at the rooftop farm.
| Parameter | Statistic | May | June | July | August |
|---|---|---|---|---|---|
| Ambient Temperature (°C) | Min | 2.8 | 13.2 | 14.8 | 16.0 |
| Mean | 16.1 | 22.3 | 22.3 | 24.6 | |
| Max | 31.7 | 33.9 | 33.7 | 32.4 | |
| Relative Humidity (%) | Min | 25.1 | 20.3 | 33.1 | 33.2 |
| Mean | 56.1 | 60.3 | 70.6 | 68.4 | |
| Max | 93.4 | 94.4 | 97.1 | 91.9 | |
| Wind Speed (km/h) | Min | 0.0 | 0.0 | 0.0 | 0.0 |
| Mean | 2.2 | 2.2 | 1.3 | 1.1 | |
| Max | 16.2 | 18.0 | 14.4 | 10.8 |
Table 7.
Pearson correlation coefficients between weather parameters and thermal indicators. Level of statistical significance is indicated between the parentheses.
Table 7.
Pearson correlation coefficients between weather parameters and thermal indicators. Level of statistical significance is indicated between the parentheses.
| Thermal Indicator | Weather Parameter | |||
|---|---|---|---|---|
| Relative Humidity | Wind Speed | Solar Radiation | Soil Moisture | |
| TR15 | −0.14 (p < 0.01) | 0.02 (p > 0.05) | 0.28 (p < 0.01) | −0.19 (p < 0.01) |
| T15 | −0.23 (p < 0.01) | −0.05 (p > 0.05) | 0.34 (p < 0.01) | −0.19 (p < 0.01) |
| TR60 | −0.15 (p < 0.01) | 0.01 (p > 0.05) | 0.18 (p < 0.01) | −0.01 (p > 0.05) |
| T60 | 0.01 (p > 0.05) | −0.03 (p > 0.05) | 0.21 (p < 0.01) | −0.05 (p > 0.05) |
Publisher’s Note: MDPI stays neutral with regard to jurisdictional claims in published maps and institutional affiliations. |
© 2022 by the authors. Licensee MDPI, Basel, Switzerland. This article is an open access article distributed under the terms and conditions of the Creative Commons Attribution (CC BY) license (https://creativecommons.org/licenses/by/4.0/).
Share and Cite
MDPI and ACS Style
Almaaitah, T.; Joksimovic, D. Hydrologic and Thermal Performance of a Full-Scale Farmed Blue–Green Roof. Water 2022, 14, 1700. https://doi.org/10.3390/w14111700
AMA Style
Almaaitah T, Joksimovic D. Hydrologic and Thermal Performance of a Full-Scale Farmed Blue–Green Roof. Water. 2022; 14(11):1700. https://doi.org/10.3390/w14111700
Chicago/Turabian StyleAlmaaitah, Tamer, and Darko Joksimovic. 2022. "Hydrologic and Thermal Performance of a Full-Scale Farmed Blue–Green Roof" Water 14, no. 11: 1700. https://doi.org/10.3390/w14111700
Note that from the first issue of 2016, this journal uses article numbers instead of page numbers. See further details here.