
Remote Sensing for Development of Rainfall Intensity–Duration–Frequency Curves at Ungauged Locations of Yangon, Myanmar


1
Department of Water and Environmental Engineering, School of Civil Engineering, Faculty of Engineering, Universiti Teknologi Malaysia (UTM), Skudai 81310, Malaysia
2
State Key Laboratory of Hydrology—Water Resources and Hydraulic Engineering, Nanjing Hydraulic Research Institute, Nanjing 210029, China
3
Research Center for Climate Change, Ministry of Water Resources, Nanjing 210029, China
*
Author to whom correspondence should be addressed.
Water 2022, 14(11), 1699; https://doi.org/10.3390/w14111699
Submission received: 27 April 2022
/
Revised: 23 May 2022
/
Accepted: 24 May 2022
/
Published: 25 May 2022
(This article belongs to the Section New Sensors, New Technologies and Machine Learning in Water Sciences)
Abstract
:This study aims to develop the intensity–duration–frequency (IDF) curves for Yangon, the economic center of Myanmar, using four satellite precipitation datasets, namely GPM IMERG, TRMM, GSMaP_NRT, and GSMaP_GC. Different probability distribution functions were used to fit the annual rainfall maximum series to determine the best-fit distribution. The estimated parameters of the best-fit distribution were used to fit the rainfall intensities of 2, 5, 10, 25, 50, and 100-year return periods for generating IDF curves using the Sherman equation. The IDF curves were bias-corrected based on the daily rainfall data available only at a location in Yangon. The bias correction factors were then used to estimate IDF curves from satellite rainfall at ungauged locations of Yangon. The results showed that the Generalized Extreme Value Distribution best fit the hourly rainfall distribution of satellite data. Integrated Multi-Satellite Retrievals for Global Precipitation Measurement (IMERG) is the most suitable for constructing Yangon’s IDF curves. The bias-corrected IDF curve generated at four locations of greater Yangon indicates higher rainfall intensity at the coastal stations than the inland stations. The methodology presented in this study can be used to derive IDF curves for any location in Myanmar.
1. Introduction
Urban flooding is a major problem in many cities across the globe [1]. Unsustainable urbanization without adequate drainage infrastructure is the major cause of frequent floods in large cities [2,3]. Increased rainfall extremes due to climate change have exacerbated the situation in recent decades [4]. A drastic increase in economic losses due to urban floods has been noticed in the last few decades [5]. The flood damages are more devastating for South and Southeast Asian coastal cities due to their geography, monsoon-dominated climate, and high population density [6]. The recently released Intergovernmental Panel for Climate Change annual report (AR6) indicates more devastating floods in monsoon-dominated Asian countries, including Myanmar, in the future [7]. This indicates that coastal cities like Yangon will be severely affected by floods in the near future.
Yangon is the largest city and the center of the national economy of Myanmar. The attraction of trade and industry caused a fast rise in the population of Yangon. Unsustainable urbanization to provide shelter for a rapidly increasing population caused several challenges, including water supply, sanitation, traffic congestion, and, most significantly, urban flooding [8]. Frequent urban floods often destroy public properties, causing economic losses and degradation of environmental quality, which significantly affects people’s livelihood and living standards in the city. Climate change has made rainfall more variable and erratic in Myanmar [9]. In recent years, a rise in extreme rainfall events has been more noticeable in Yangon [10,11]. This has made the city more prone to hydrological disasters. Horton et al. (2017) projected a possible large change in Myanmar’s climate in the near future [11]. This will certainly aggravate the situation of urban floods if appropriate measures are not taken.
The Framework for Economic and Social Reforms (FESR, 2013) of the Myanmar government emphasized the need for sustainable urbanization [12]. Therefore, the National Urban Policy of Myanmar has aimed to implement adequate urban infrastructure [13]. The National Comprehensive Development Plan 2011–2031 (NCDP) of Myanmar has provided related guidelines in this regard. The country also recognized environmental and climate change issues as the major priority action for sustainable urban development [14]. The development of climate-resilient hydraulic structures is essential for sustainable urban development. Understanding extreme rainfall characteristics or the relation of rainfall intensity–duration–frequency (IDF) is vital for this purpose [15,16]. Defining hydrologic design standards of urban drainage systems based on IDF can mitigate urban flooding due to rainfall extremes and help in sustainable urban development.
Despite vital necessity, studies related to rainfall characteristics for designing urban hydraulic structure is almost absent in the city. This is mainly due to high-resolution hourly rainfall data being unavailable to conduct such a study. In recent years, satellite precipitation data have been widely used for hydrological studies for the region lacking a dense rainfall monitoring network or where higher temporal resolution (hourly or sub-hourly) data are unavailable. However, the application of satellite precipitation data for the hydrological study is also very limited in Myanmar [2,17,18,19]. Yuan et al. [20] evaluated Tropical Rainfall Measuring Mission (TRMM) and Integrated Multi-Satellite Retrievals for Global Precipitation Measurement (IMERG) in streamflow simulation in the data-scarce region of Myanmar. They showed reasonable performance of those products in flood simulations in Myanmar [20,21]. Hirano evaluated the TRMM rainfall in determining the summer monsoon onset dates and reported its potential in assessing the rainfall climatology of Myanmar [18]. Mohsan evaluated the performance of IMERG and showed its efficiency in detecting rainfall occurrence but low reliability in estimating rainfall intensity [17]. However, the generation of reliable IDF curves needs hourly or sub-hourly satellite rainfall, which can reliably reproduce the intensity and duration of rainfall. This urges the need to evaluate available satellite rainfall products for estimation of IDF at the different locations of Yangon where in situ data are not available.
A limited number of studies have been conducted for IDF relationship development at an ungauged location using satellite rainfall data [22,23,24,25,26]. The major limitation of IDF curve generation using satellite data is underestimating extreme rainfall events by satellite products [26]. Therefore, bias correction in satellite rainfall data using in situ data is suggested before their use for IDF curve development [25]. For example, Noor et al. (2021) bias-corrected the satellite rainfall data with hourly rainfall data, available for different periods at gauged locations [16]. The bias correction factor was then used to correct the bias in the IDF curve at the ungauged location. However, the unavailability of hourly or sub-hourly rainfall records is another challenge for reliable estimation of the IDF curve in Yangon.
The present study proposed a method for estimation of IDF curve at ungauged locations of Yangon using satellite rainfall data through bias correction using short-term daily in situ rainfall records. Four satellite rainfall data products, previously found suitable in hourly rainfall simulations in different South and Southeast Asian countries, namely IMERG, TRMM, and the Global Satellite Mapping of Precipitation (GSMaP), Near Real-Time (GSMaP_NRT), and GSMaP gauge corrected (GSMaP_GC), were considered for developing IDF curves. The product that showed the least bias in reconstructing the daily IDF curve was finally selected for bias correction and development of the IDF curve at ungauged locations of Yangon.
2. Study Area and Datasets
2.1. Study Area
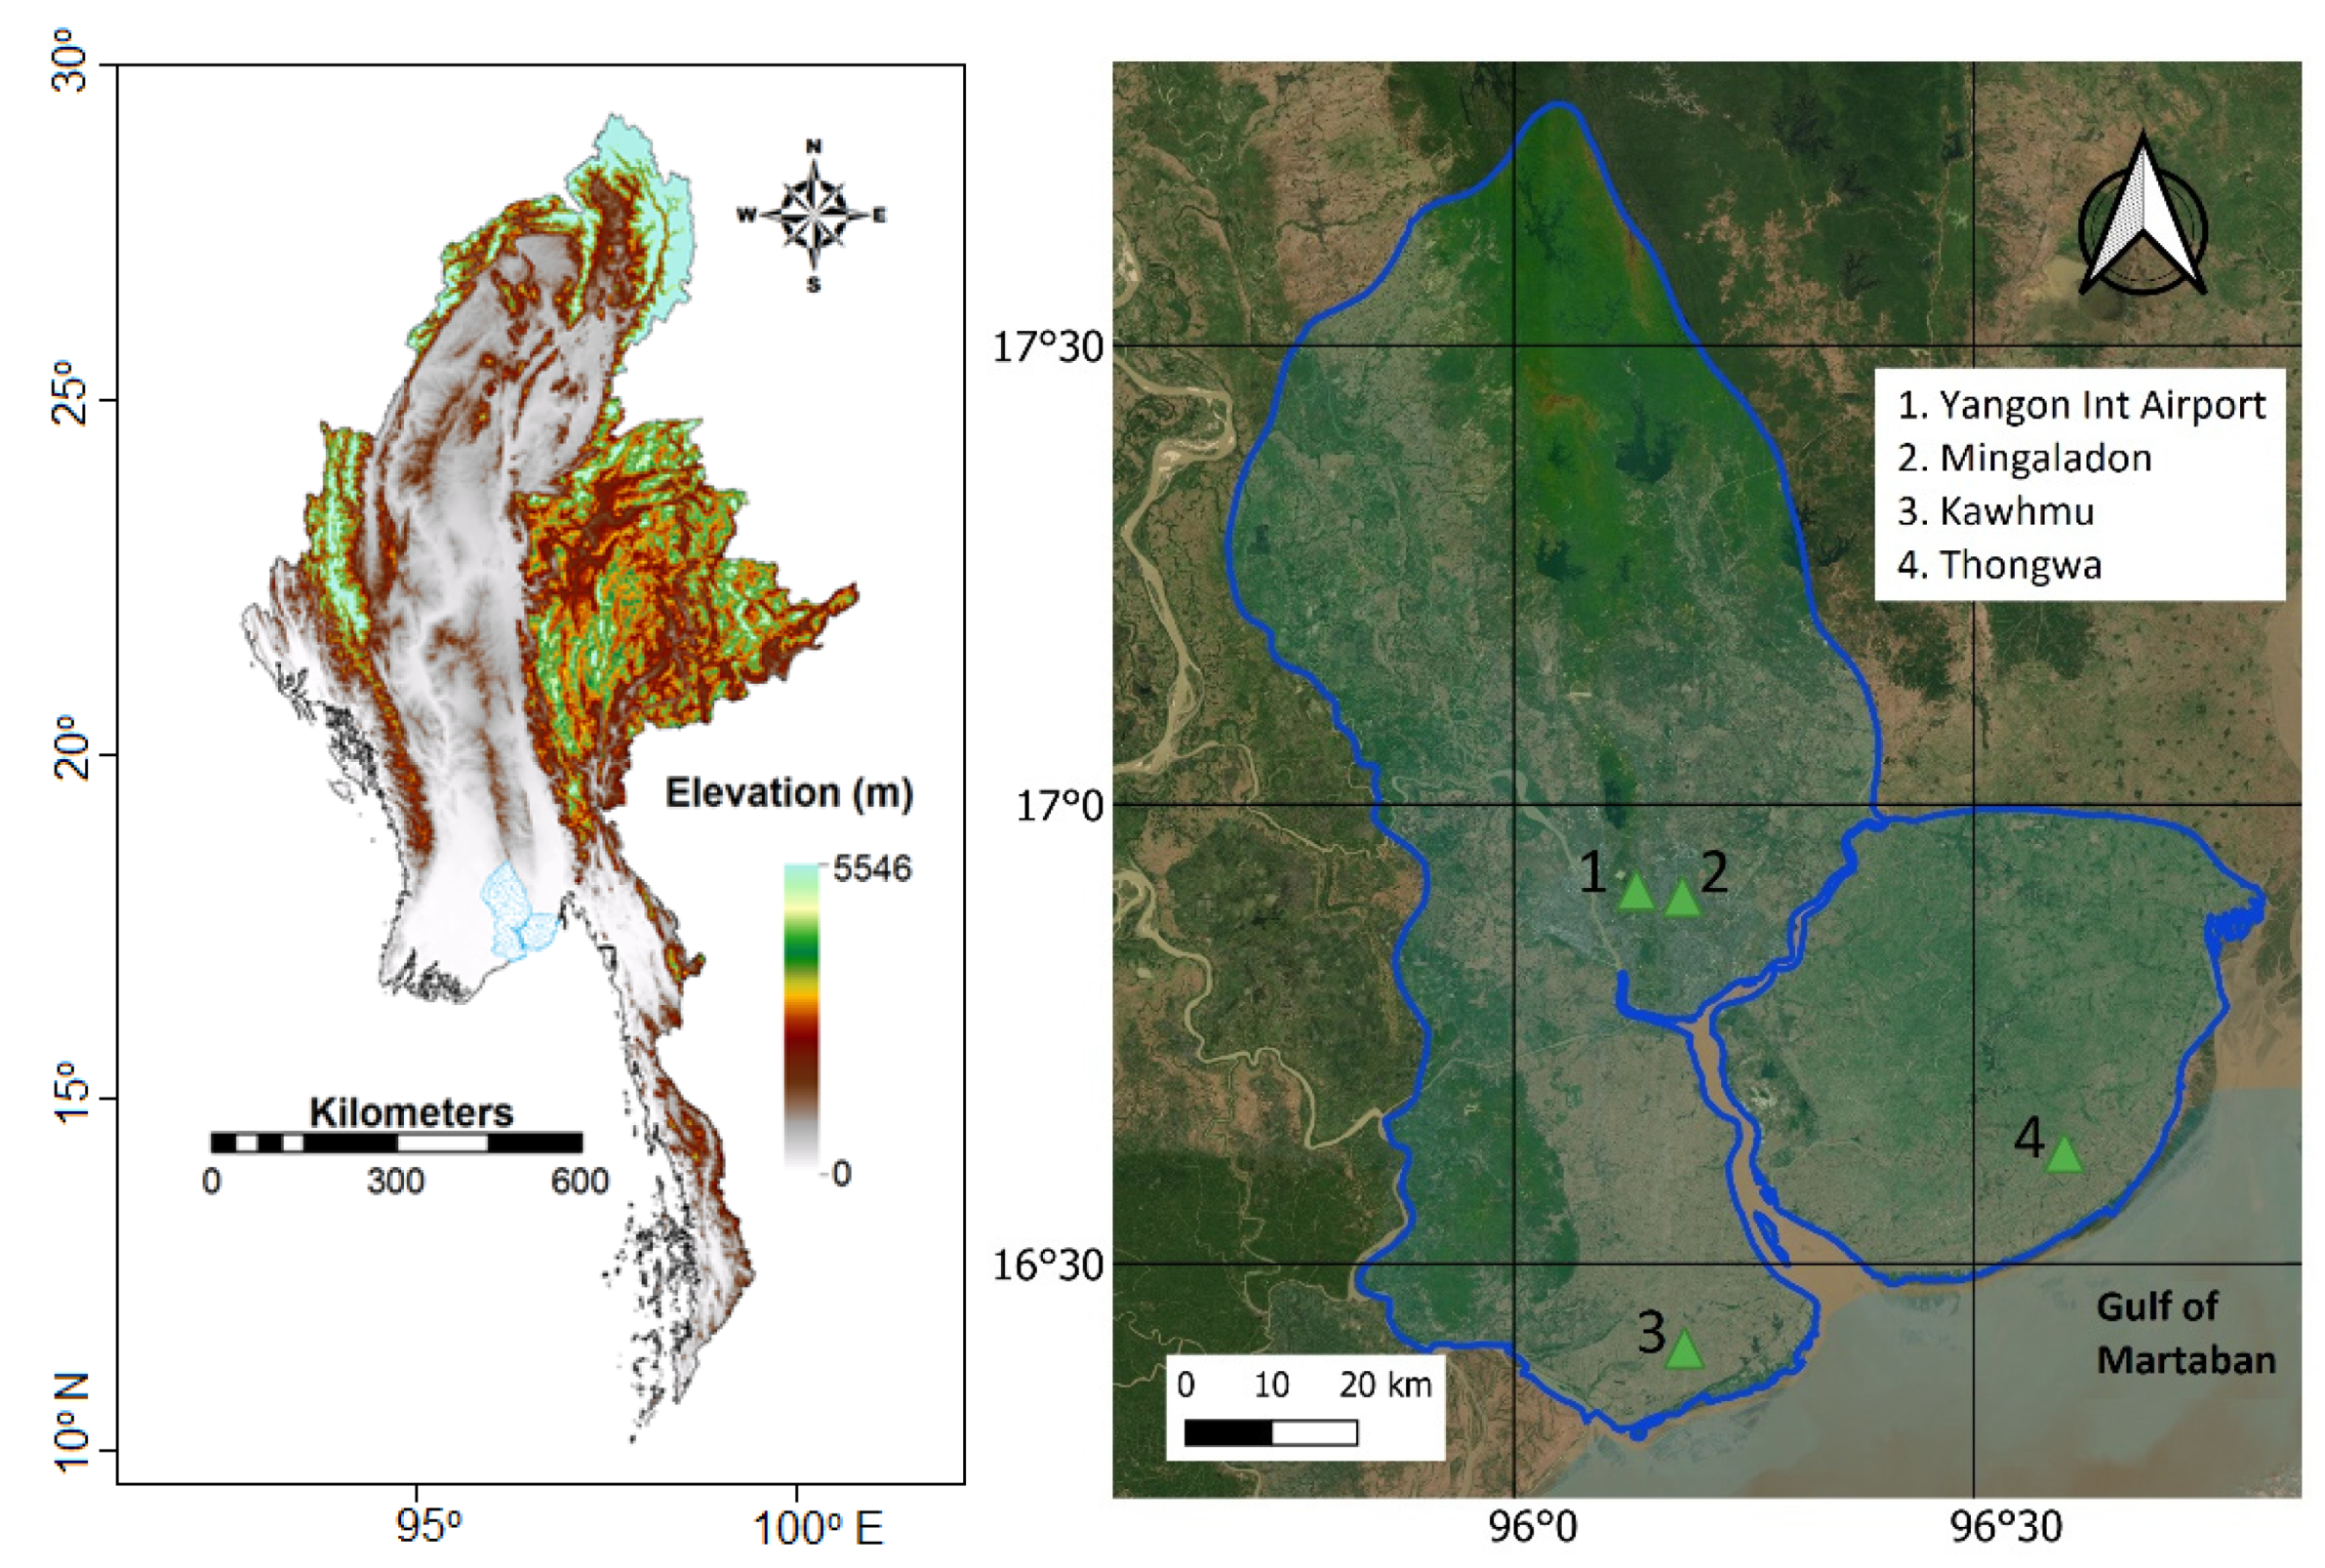
Yangon, the former capital of Myanmar, is located in the deltaic region of the southwest of the country, only 30 km away from the Gulf of Martaban (Figure 1). Geographically, it is bounded between longitude: 16.59–17.09° N and latitude: 95.99–96.37° E. The city’s elevation varies between 0 and 71 m, with an average of 27 m above the mean sea level. It covers an area of nearly 598.75 km2. Yangon has a population of 5.4 million, which is increasing annually at a rate of 1.69%. The population density of the city is 12,310 per km2.
Climatologically, Myanmar is located in the Southeast Asian monsoon-dominated region. Therefore, nearly 70% of its total rainfall is received in the monsoon season (June to September) [27]. There is a large spatial variability in rainfall. Satyanarayana et al. [28] assessed the spatial variability of Myanmar’s rainfall and showed higher rainfall in the southwest coastal region, including Yangon. Inter-annual variability of monsoon rainfall is also high [29]. The large spatiotemporal rainfall variability has made the country, particularly the southwest coastal region, including Yangon, highly vulnerable to rainfall-driven natural hazards. The country ranked third for climatic hazards based on the global climate risk index (2018). Myanmar has experienced a change in rainfall regions due to climate change in recent years. Greater Yangon, situated in the southwest high rainfall deltaic region, is most vulnerable to such changes [11].
2.2. Data and Sources
Four remotely sensed precipitation datasets were acquired and evaluated in the present study. The list of remotely sensed precipitation datasets used in this study is given in Table 1. Many studies attempt to evaluate the accuracy of satellite precipitation datasets globally or over a specific region [30]; however, none of the studies has evaluated their performance in Myanmar, except Mohsan et al. [17]. They only conducted a preliminary assessment of MERG data over Myanmar. In the present study, TRMM_3B42V7 with a temporal coverage of 3 h was used. TRMM is the joint data between JAXA and NASA [31]. IMERG combines the Global Precipitation Measurement (GPM) satellite precipitation information. IMERG provides three modes of precipitation; early, late, and final run (FR), and this mode shows better accuracy than other modes [32]. The Global Satellite Mapping of Precipitation, GSMaP_NRT, and GSMaP_GC data are collected and compiled by Core Research for Evolutional Science and Technology (CREST) of the Japan Science and Technology Agency (JSTA) in collaboration with the Japan Aerospace Exploration Agency (JAXA) Precipitation Measuring Mission (PMM) Science Team [33,34,35]. The former product was developed by integrating global precipitation rates extracted from passive microwave radiometers and cloud moving vectors derived from infrared images [36,37]. The latter is an adjusted product of GSMaP_NRT using the NOAA Climate Prediction Center (CPC) precipitation data [36]. The rainfall of different products was downloaded from Google Earth Engine, a cloud-based platform for planetary-scale geospatial analysis [38]. Moreover, daily rainfall data available at Yangon International Airport (YIA) station for the period 2015–2020 was downloaded from the following website:
https://www.ncei.noaa.gov/access/search/data-search/global-summary-of-the-day (accessed on 1 April 2022).
Daily rainfall data of YIA were used to bias correct the IDF curves, developed using satellite rainfall data. The bias correction factor was then used in other locations to generate IDF curves. In the present study, IDF curves were developed at four locations in Yangon. However, the procedure can be repeated in any other satellite rainfall grid location of the city for IDF curve development. Out of the four locations, two (YIA and Mingaladon) are located in the densely urbanized central part of the city. The other two locations are near the coastal area, namely Thongwa, located in the southeast of Yangon, and Kawhmu in the southwest of Yangon.
3. Methodology
3.1. Research Design
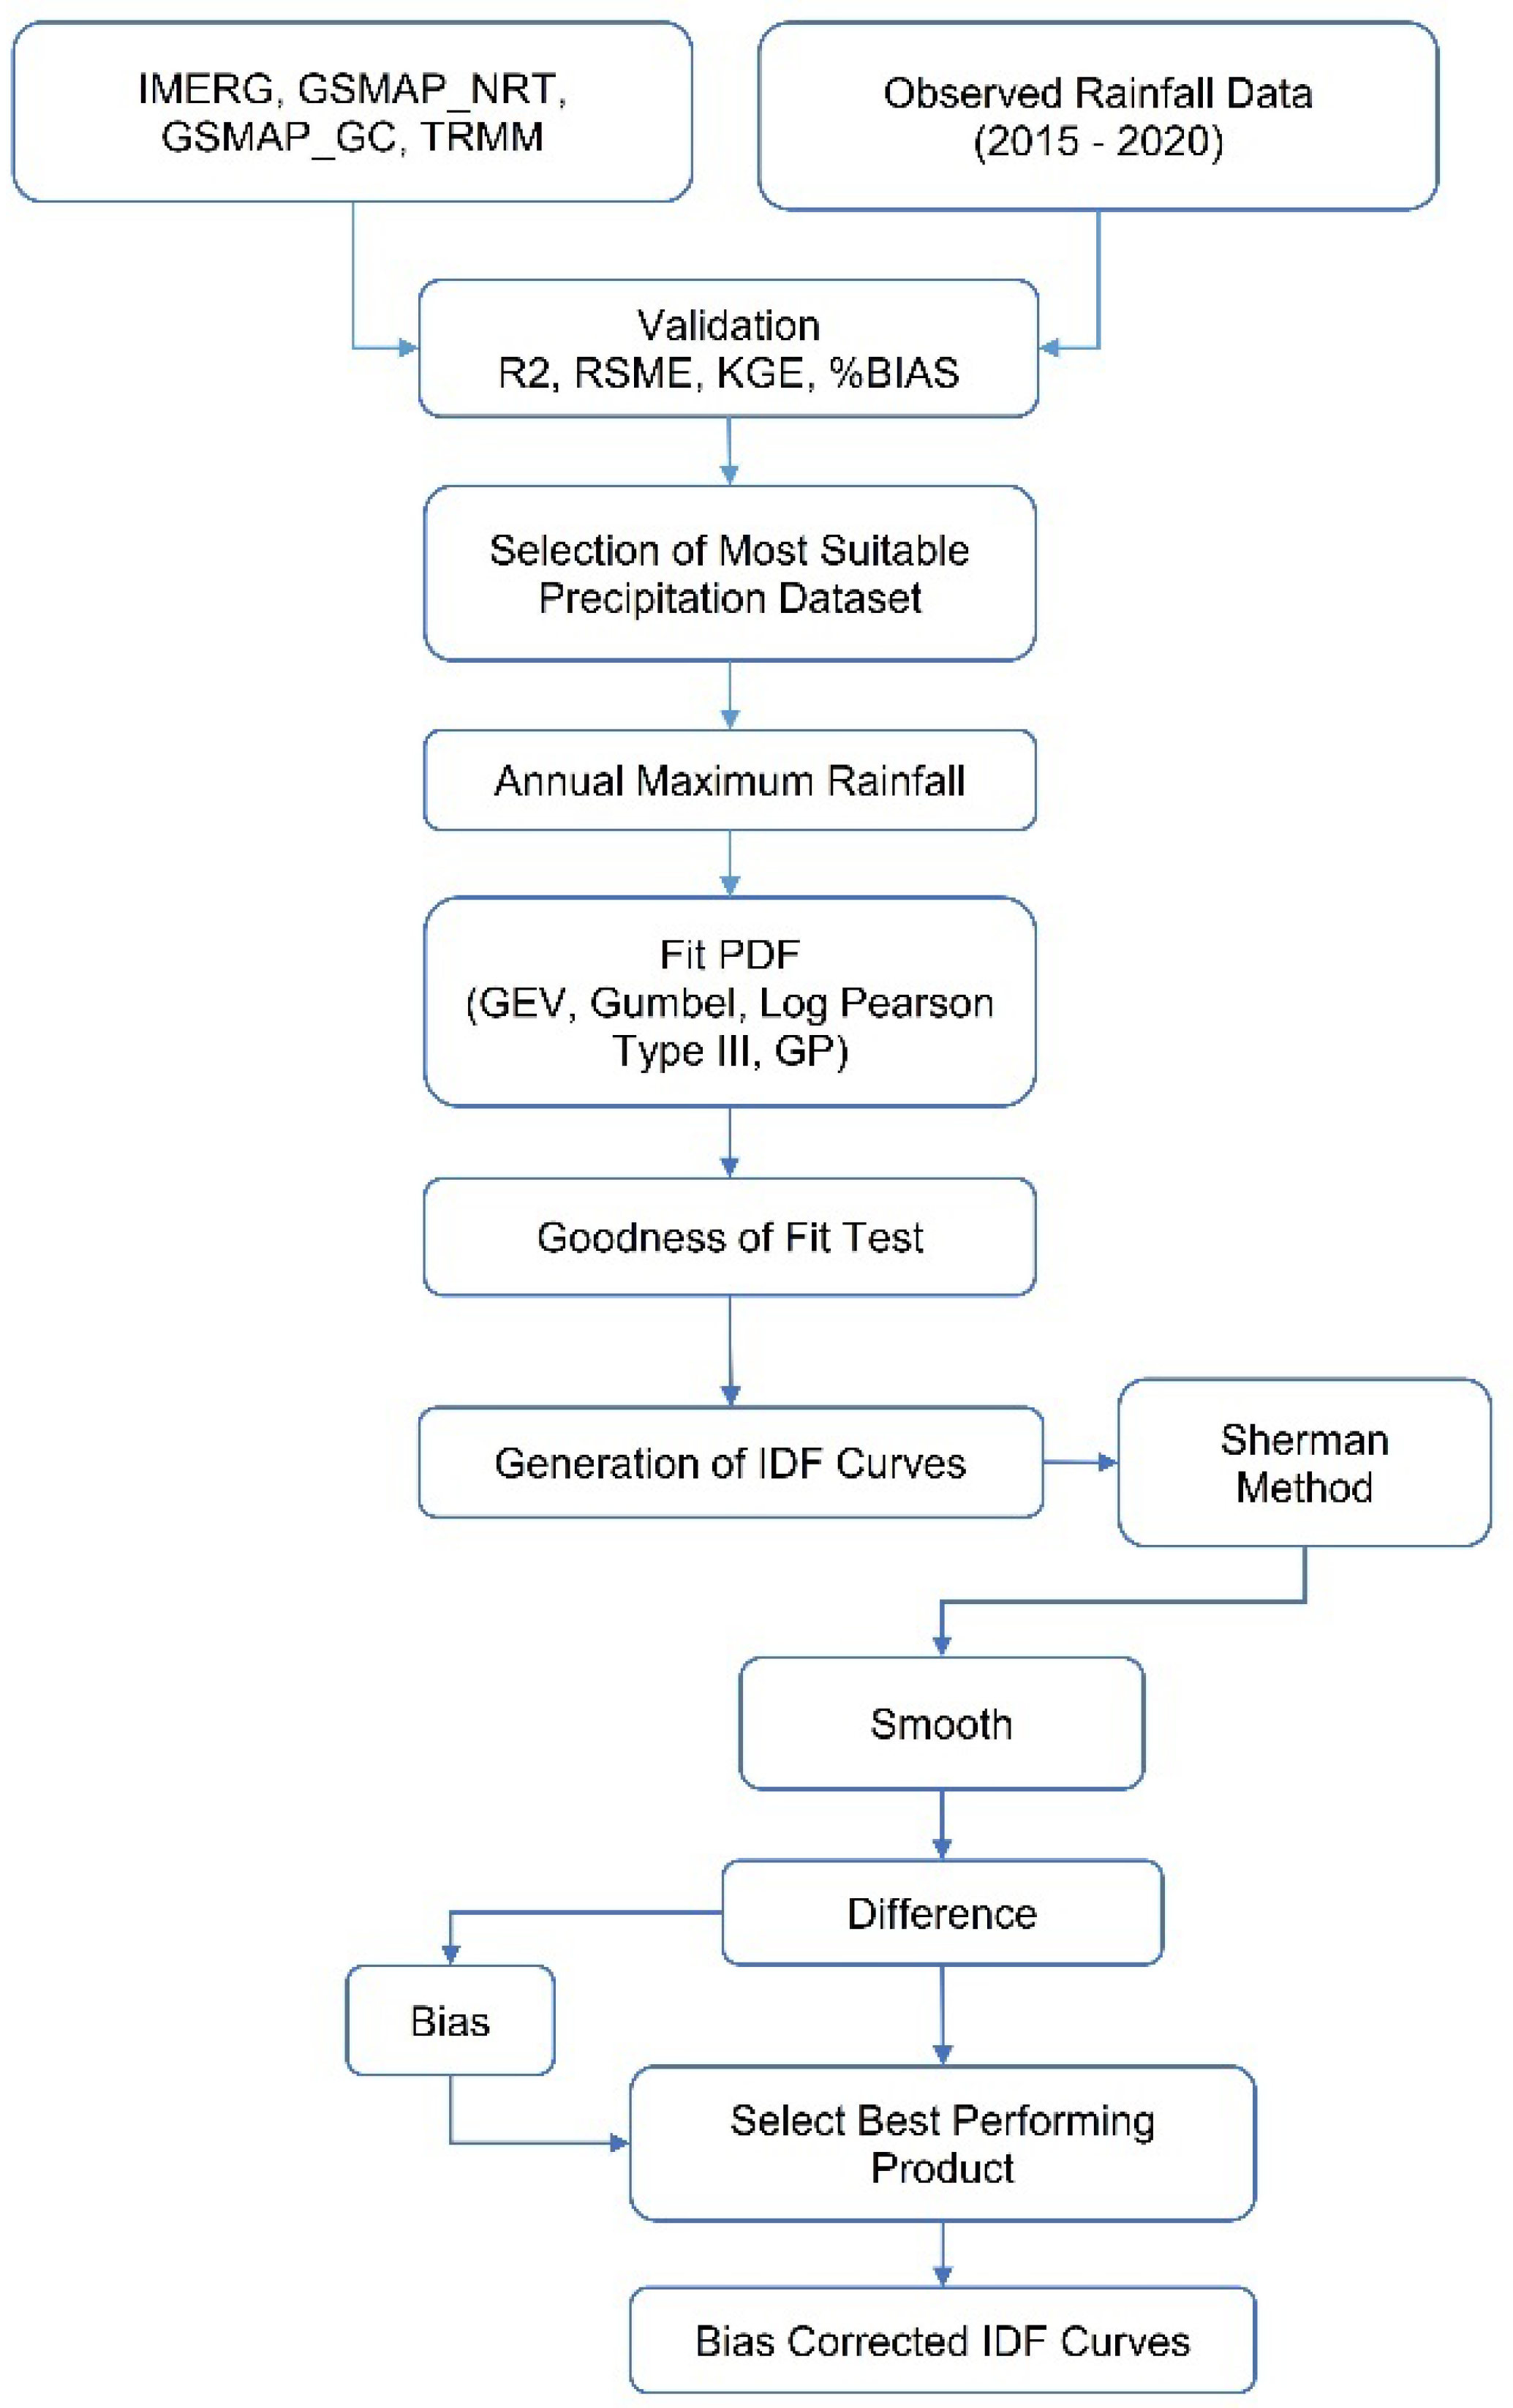
The main objective of this study is to develop IDF curves at ungauged locations of Yangon using satellite-based rainfall data. The detail of the procedure used for this purpose is shown using a flowchart in Figure 2. The following steps were used to achieve the objective.
- Generate annual rainfall intensity (ARI) time series by estimating rainfall intensities for specific durations in each year.
- Fit the ARI time series for each duration using different probability distribution functions (PDFs) to select the best-fit PDF.
- Estimate rainfall intensity for each duration and return period using the best-fit PDF.
- Construct the IDF curves using the Sherman equation employing regression techniques.
- Repeat steps 1 to 4 to develop IDF curves for all four satellite-based rainfall data.
- Generate IDF curve using daily rainfall (only for 24, 48, and 72 h durations) at YIA and compare with the satellite IDF curves to estimate the bias correction factor.
- Select satellite rainfall showing the least bias in the IDF curve for generating IDF curves at all locations.
- Apply the bias correction factor estimated at the YIA station to correct the bias at ungauged locations for generating the IDF curve.
3.2. Fitting Probability Density Function
A PDF selected for a satellite precipitation dataset may not exhibit good results for another dataset. Therefore, comparing various PDFs to select the most appropriate one is considered good practice [42]. This study analyses four commonly used PDFs, Generalized Extreme Value (GEV), Gumbel, Log Pearson (LP) Type III, and General Pareto (GP), to select the PDF that best fits the ARI time series of different durations. The previous studies in the nearby countries showed that the ARI time series generally best fit by one of these four PDFs. For example, Punlum et al. [43] showed GEV best fits the ARI of Thailand. Chaudhuri and Sharma [44] also showed GEV is the most suitable for fitting ARI data of India. Alam et al. [45] showed GEV, followed by LP, best fit the rainfall data of Bangladesh. Therefore, the present study considered only these four PDFs. The negative log-likelihood goodness of fit test was used to evaluate the performance of the maximum likelihood (MLE) PDF parameter estimation method. The negative likelihood ratio provides in-built strength of rule in or out probabilities; therefore, it is widely used to assess a diagnostic test’s performance [42]. The equations of the PDFs are given in Table 2.
The negative log-likelihood test was used for accessing the diagnostic test’s performance [42].
where = log-likelihood function, = likelihood function, and n = number of observations.
3.3. Sherman Equation
The Sherman equation (Sherman, 1905) was used to regress the IDF curves [46],
where i is the rainfall intensity, kT is the frequency factor, t is the storm duration, and x, b, and m are the regression parameters determined by the least square method. Different x, b, and m values were regressed for different return periods.
3.4. Performance Evaluation of Satellite Rainfall Data
Four statistical indices were used to evaluate the performance of the satellite-based precipitation datasets in estimating rainfall, namely coefficient of determination R2, root mean square error (RMSE), Kling–Gupta efficiency (KGE) index, and percentage of bias (PBIAS), and the ratio of standard deviation (rSD) [47]. The formulas, ranges, and optimum values are presented in Table 3. In the table, and represent observed and satellite precipitation for the day, i; n is the total number of days; μ and σ represent the mean and standard deviation (SD) of data.
4. Results and Discussion
4.1. Performance Evaluation of Satellite Precipitation Products
Hourly observed rainfall data are not available for Yangon. Therefore, the hourly and sub-hourly satellite precipitation data products were aggregated on a daily scale to compare with the observed daily rainfall data at YIA for 2015–2020. For this purpose, the converted daily precipitation data of four satellite products, GSMaP_GC, GSMaP_NRT, IMERG, and TRMM, were interpolated to the YIA station location. Four statistical metrics, as listed in Table 3, were used for performance assessment. The obtained results are summarized in Table 4.
The RMSE for different products was between 12.4 and 18.44 mm and PBIAS was −9.4 to −66.9%. TRMM showed the best performance in RMSE and GSMap_NRT in PBIAS. GSMaP_NRT underestimated while TRMM overestimated the mean rainfall. However, the overestimation by TRMM was much higher than other products. IMERG showed high RMSE and a large underestimation of rainfall. GSMaP_GC showed less RMSE but a large overestimation of mean rainfall at YIA. The overestimation by TRMM was much higher than GSMaP_GC.
For rSD, GSMaP_NRT showed perfect performance. IMERG underestimated the variability by more than 50%, while GSMaP_GC and TRMM overestimated the variability by 78% and 176%. All the products showed poor association with observed rainfall, with R2 ranging between 0.12 and 0.22. Both GSMaP_NRT and IMERG showed similar performance in R2, while TRMM showed the worst. KGE, an integrated metric of PBIAS, rSD, and R2, was positive only for GSMaP_NRT, while negative for all other products. The relative performance of the products revealed the best performance of GSMaP_NRT in estimating daily rainfall at YIA in all metrics except RMSE.
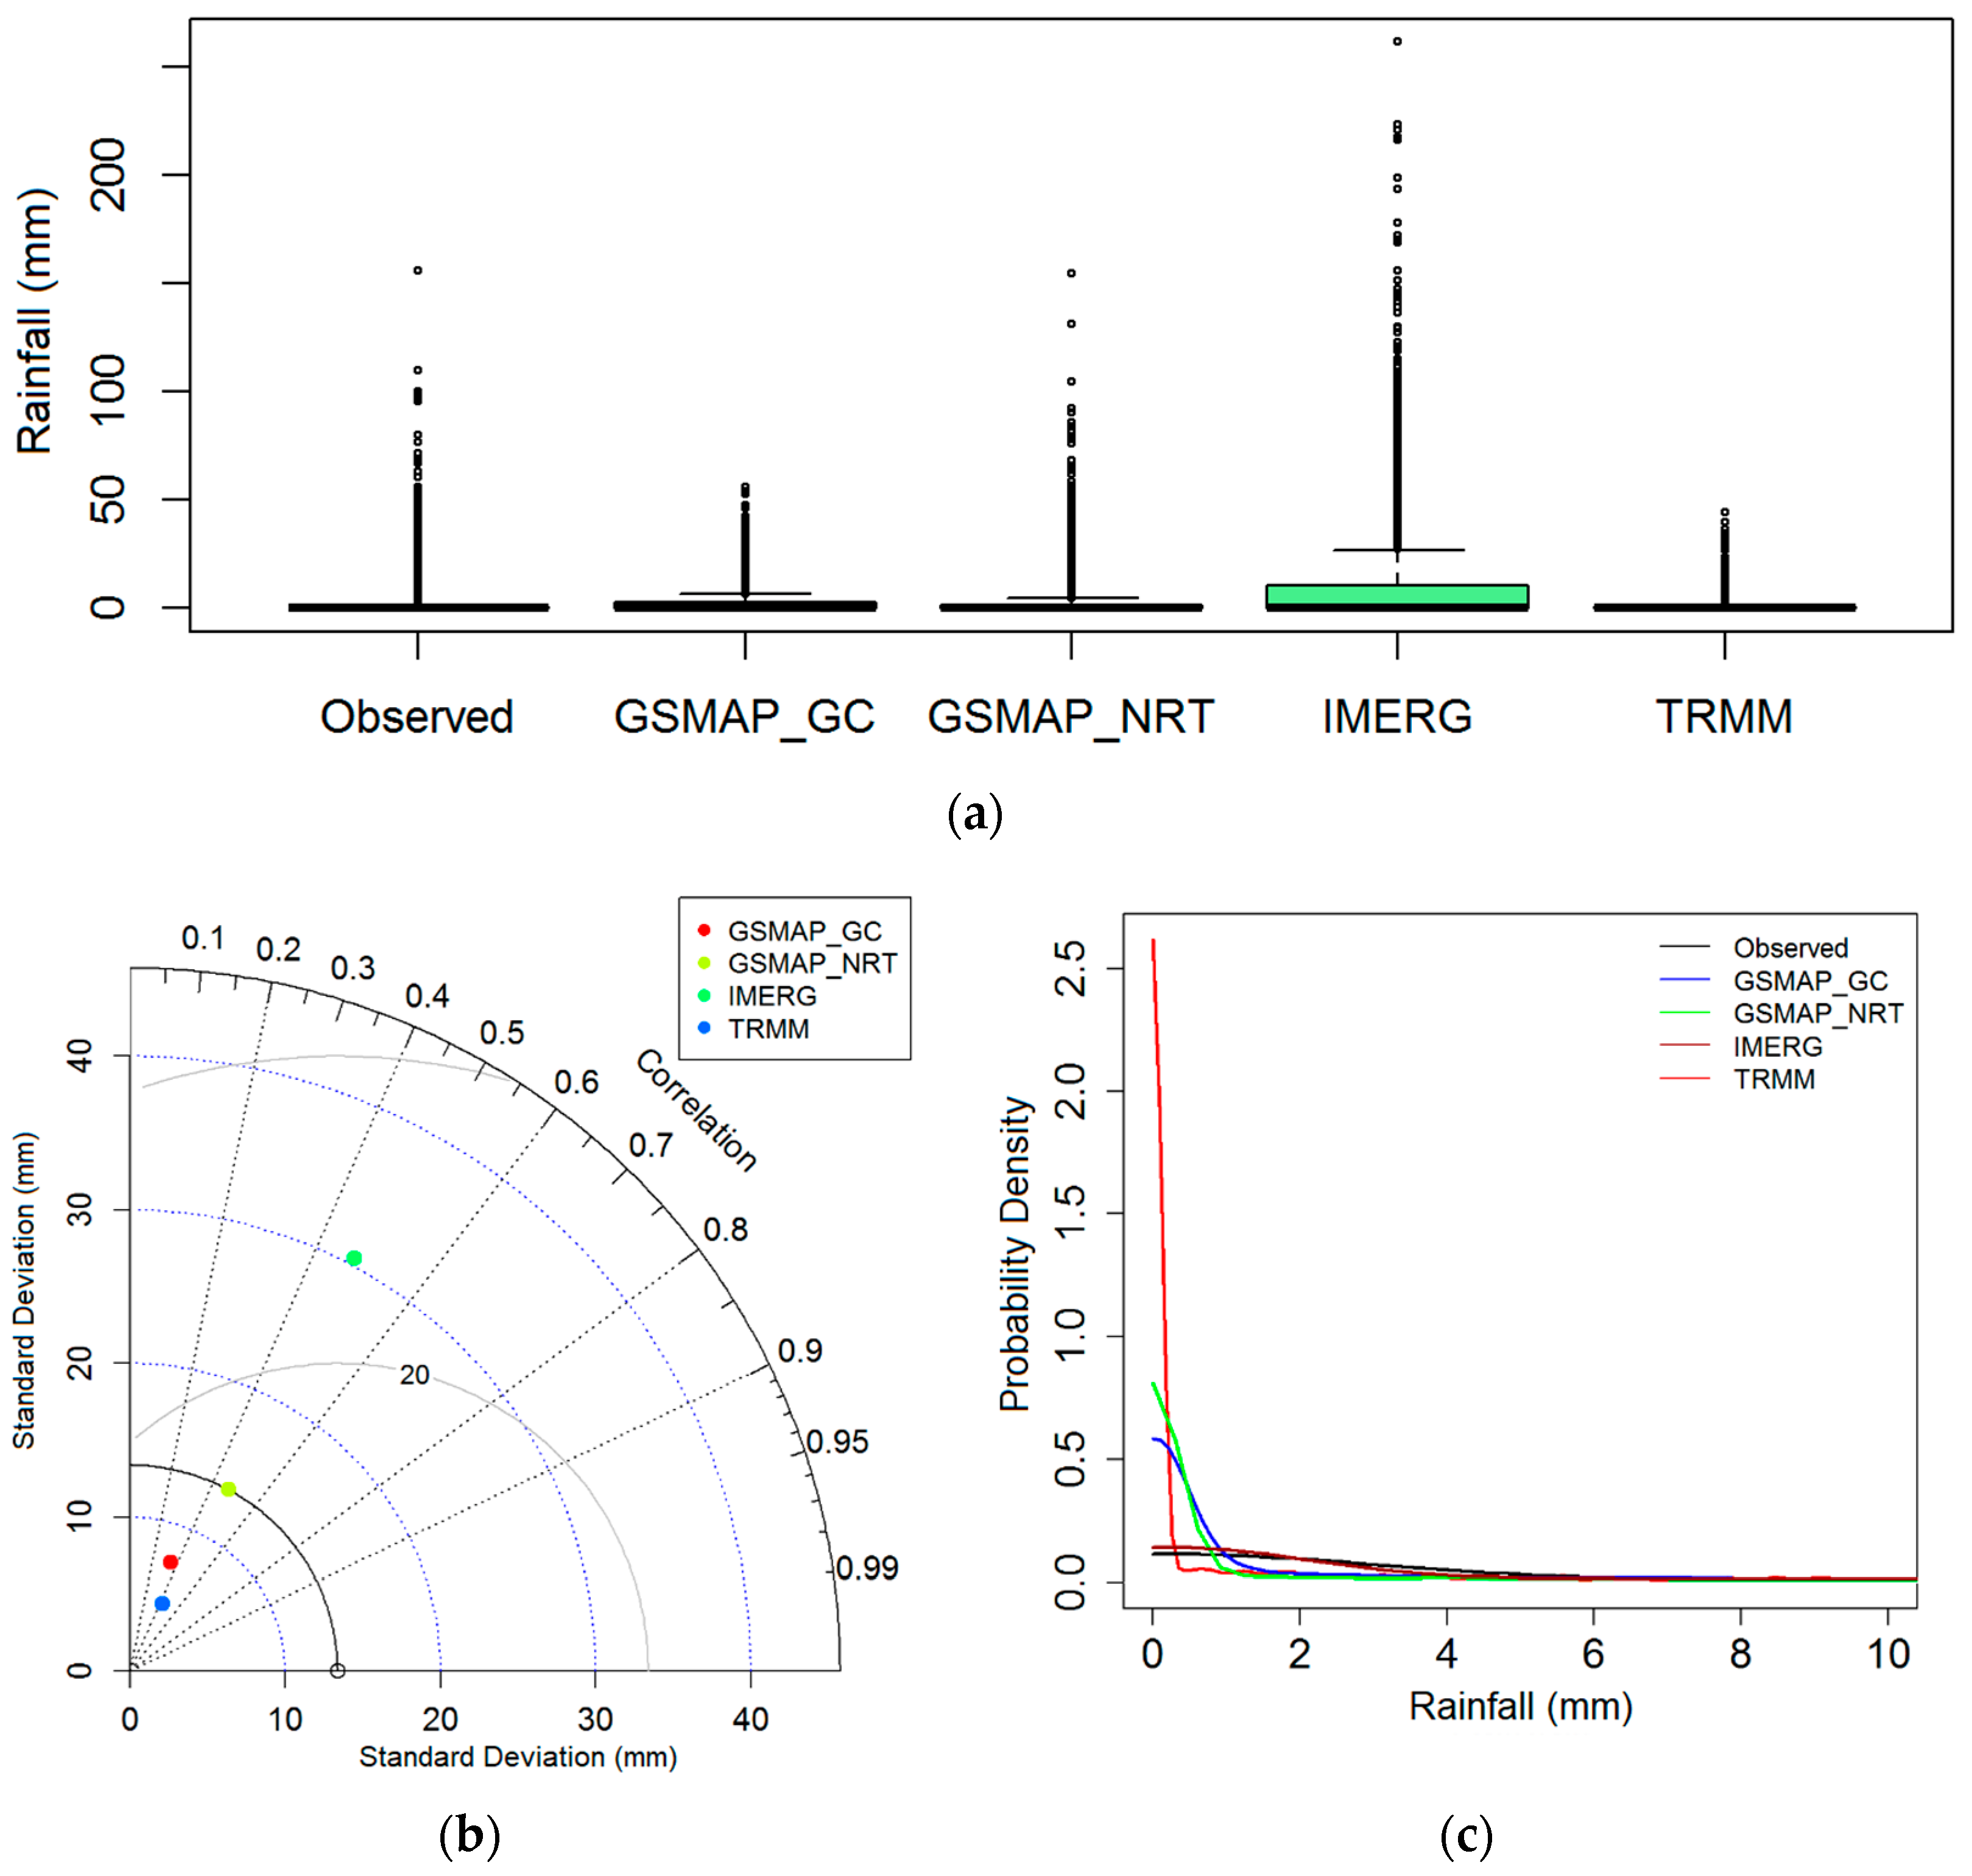
The box plot in Figure 3a indicates the variability of daily satellite precipitation compared to the observation. The IMERG showed a median rainfall of 1 mm and an upper quartile of around 11 mm in daily rainfall. IMERG also recorded the highest amount of rainfall than other products. For example, IMERG recorded more than 200 mm of rainfall in three days in 2015–2020. On the other hand, GSMaP_NRT estimated the upper quartile of daily rainfall as 2 mm. GSMaP_GC estimated slighter higher rainfall than NRT with an upper quartile of 3 mm. GSMaP_NRT showed a similar distribution of observed outliers. It estimated the same values of maximum daily rainfall of 152 mm during 2015–2020. GSMaP_GC showed a maximum 1-day rainfall of only 51 mm. TRMM showed the least rainfall variability. It estimated a daily rainfall upper quartile of 1 mm and 1-day maximum rainfall of only 42 mm during the evaluation period.
The Taylor diagram in Figure 3b summarizes the performance of each satellite precipitation dataset based on three statistics, correlation, root mean square error, and similarity in variability. The hollow circle on the x-axis represents the observed rainfall. On the other hand, the satellite-based precipitation data products are represented by fill color circles. The data point which is nearest to the observed data can be considered the best product in terms of three statistics. The results showed that GSMaP_NRT is the best dataset, followed by GSMaP_GC and TRMM. The density plot in Figure 3c represents the distribution of rainfall data compared to observed rainfall. The plot shows the best performance of IMERG in replicating observed rainfall distribution. The probability density line of IMERG was very close to the observed one. In contrast, the density lines of other products were far apart from the observed line.
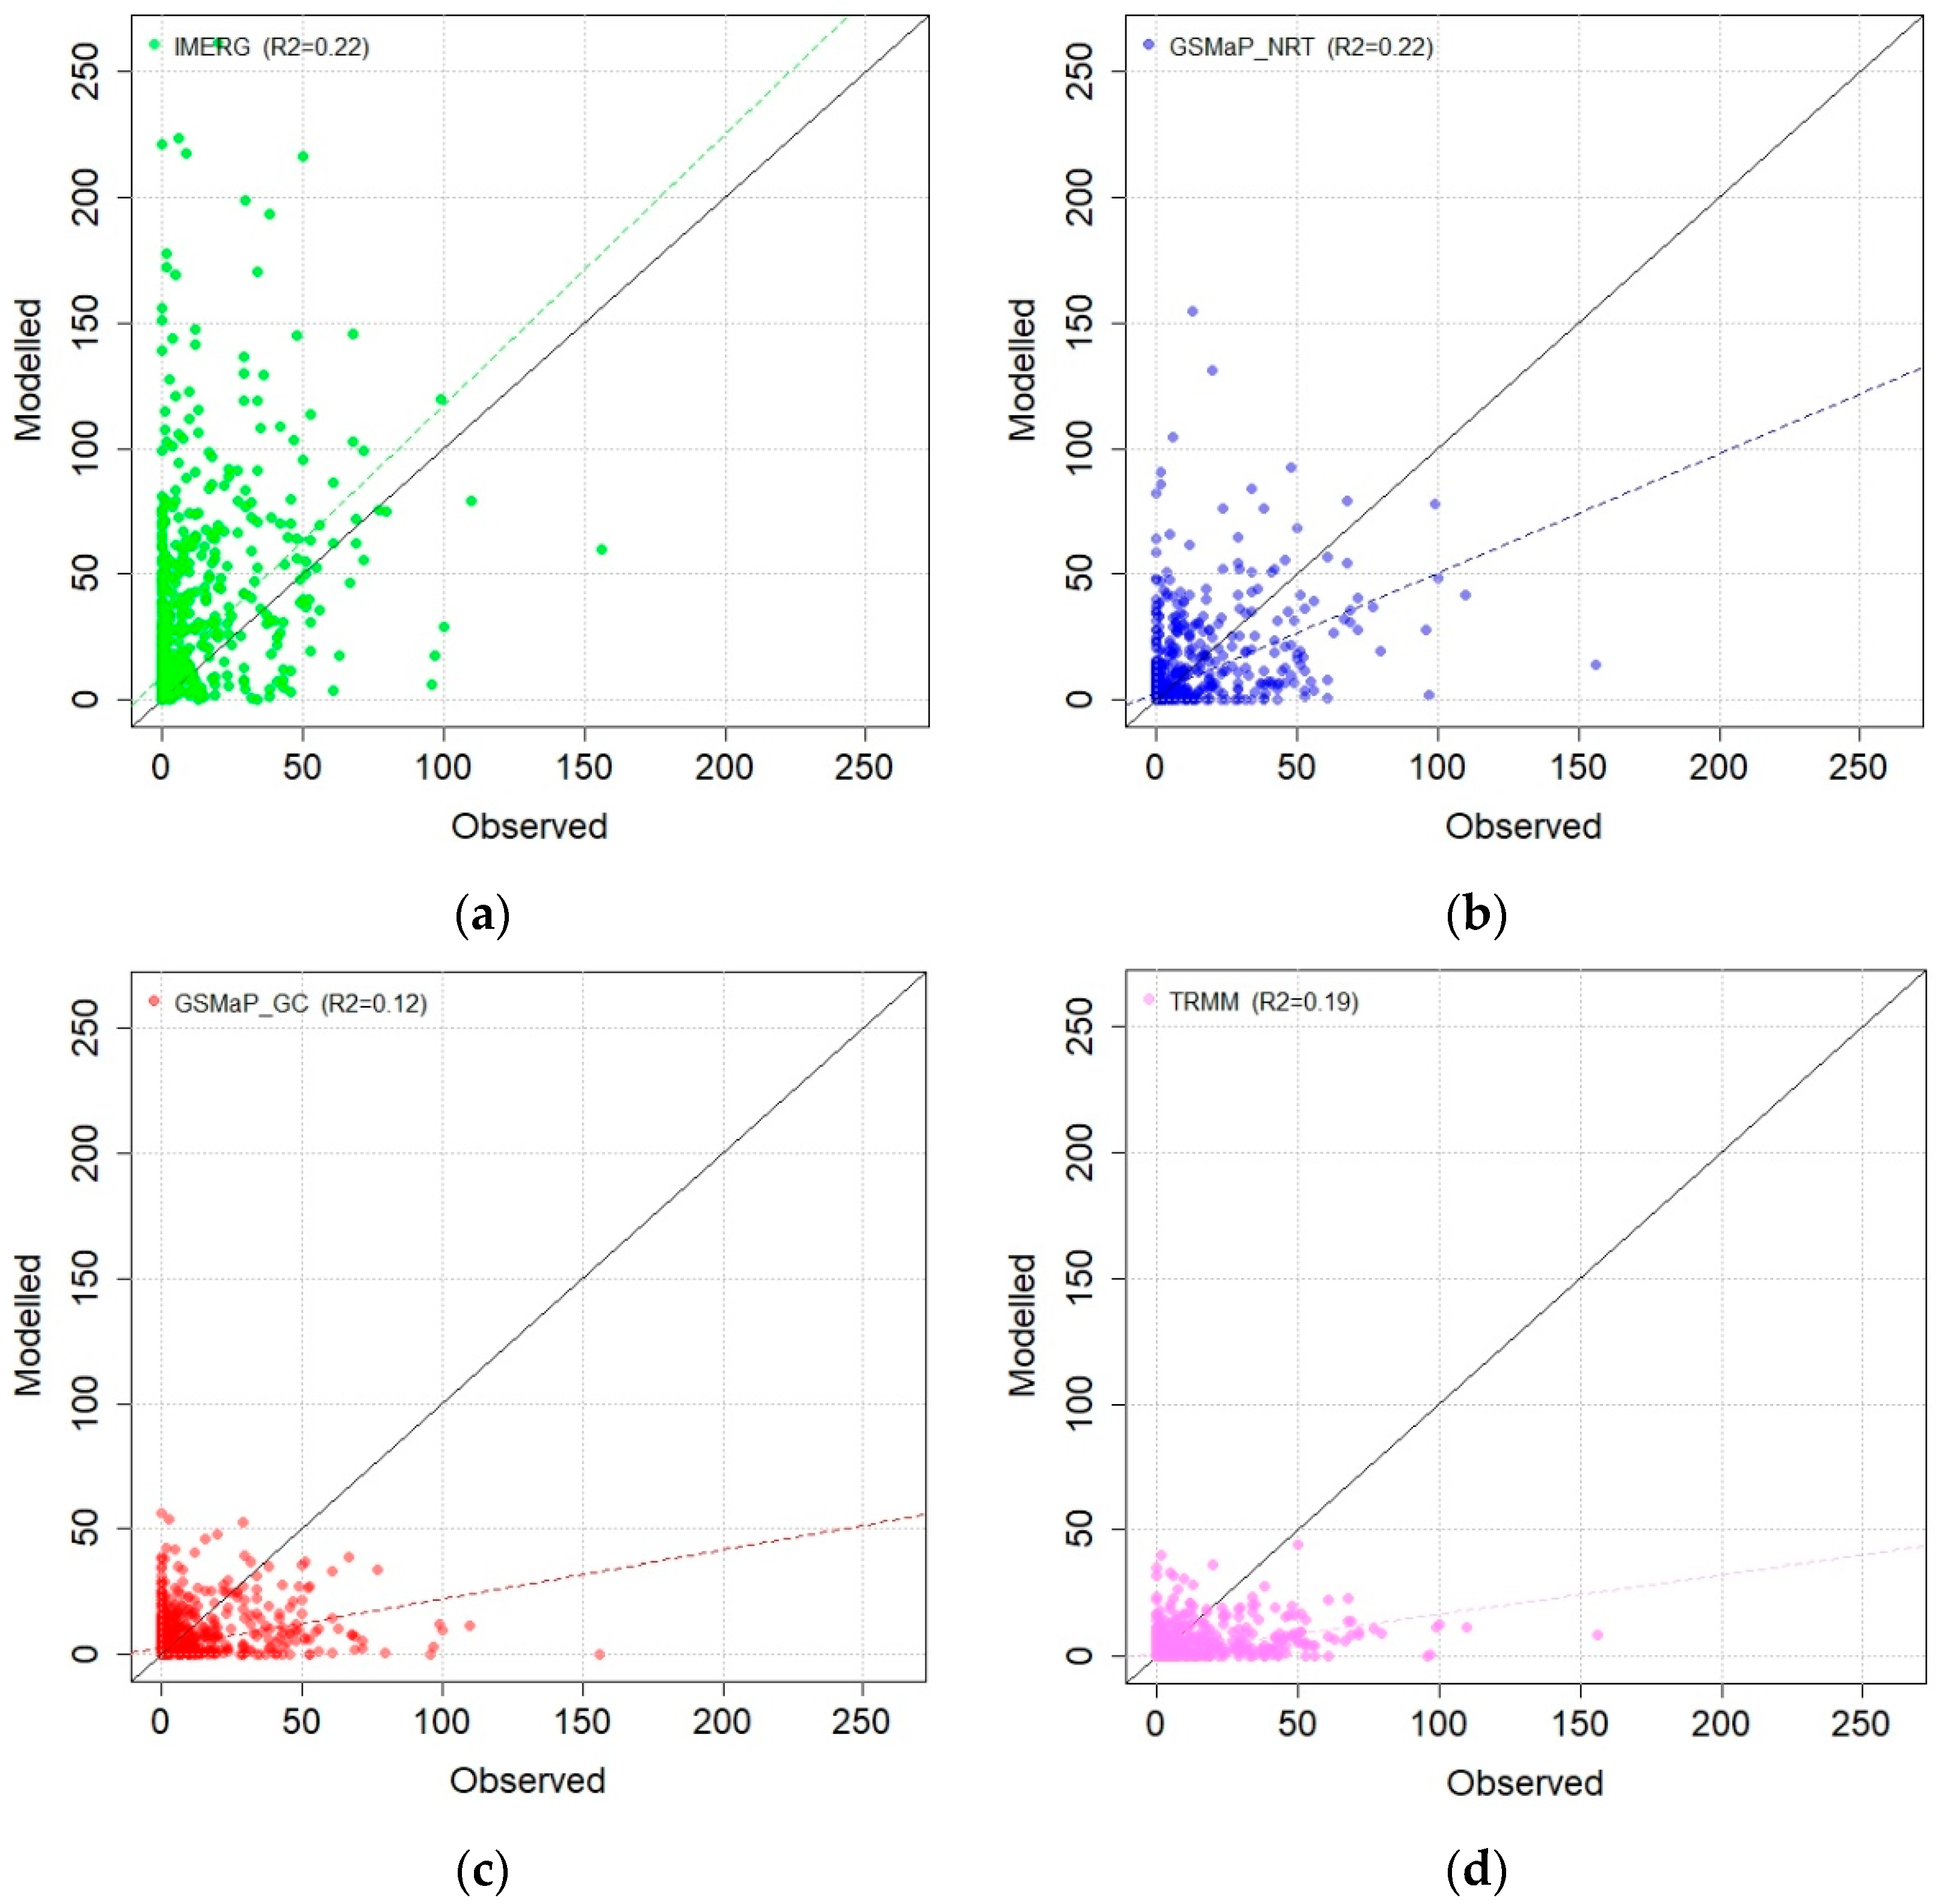
Figure 4 shows the scatter plots of daily observed and satellite rainfall data for 2015–2018. The scatter plot allowed us to inspect all data together. Both GSMaP_NRT and IMERG showed the same R2 of 0.22, the highest among the four datasets. In contrast, TRMM showed 0.19, and GSMaP GC showed the lowest R2 of 0.12. IMERG overestimated the rainfall, whereas the remaining products underestimated rainfall data. However, the IMERG regression line was the closest to the diagonal line than other data. This is due to the ability of IMERG to estimate high rainfall values more accurately than other data products. Therefore, we can ignore the results obtained based on statistical metrics presented in Table 4 and consider IMERG for generating IDF curves.
4.2. The Goodness of Fit Test
The PDFs of 30 min IMERG annual maximum rainfall for 0.5, 1, 1.5, 2, 3, 6, 12, 24, 36, 48, and 72 h durations were fitted with four distributions (GEV, Gumbel, GP, and LP3). GSMaP_GC and NRT data were fitted for 1, 2, 3, 6, 12, 24, 36, 48, and 72 h durations, while TRMM rainfall was fitted for 3, 6, 12, 18, 24, 36, 48, and 72 h durations. The data were fitted for all the four study locations, YIA, Mingaladon, Kawhmu, and Thongwa. The PDF parameters were estimated using MLE. A negative log-likelihood test was used to identify the best-fit distribution. The negative log-likelihood estimates of the fitted PDFs for IMERG at YIA are presented in Table 5 as an example. The lowest negative log-likelihood in the table indicates the best performance. GEV showed the lowest negative log-likelihood values for all rainfall durations. The negative log-likelihood values for Gumbel were similar to GEV for 3 and 12 h rainfall durations, but higher for other durations. LP3 showed the highest negative log-likelihood values for all cases. The results indicate GEV as the best-fitted PDF for all rainfall durations at YIA. Similar results were obtained for other satellite rainfalls and other locations.
4.3. Generation of Intensity–Duration–Frequency (IDF) Curves
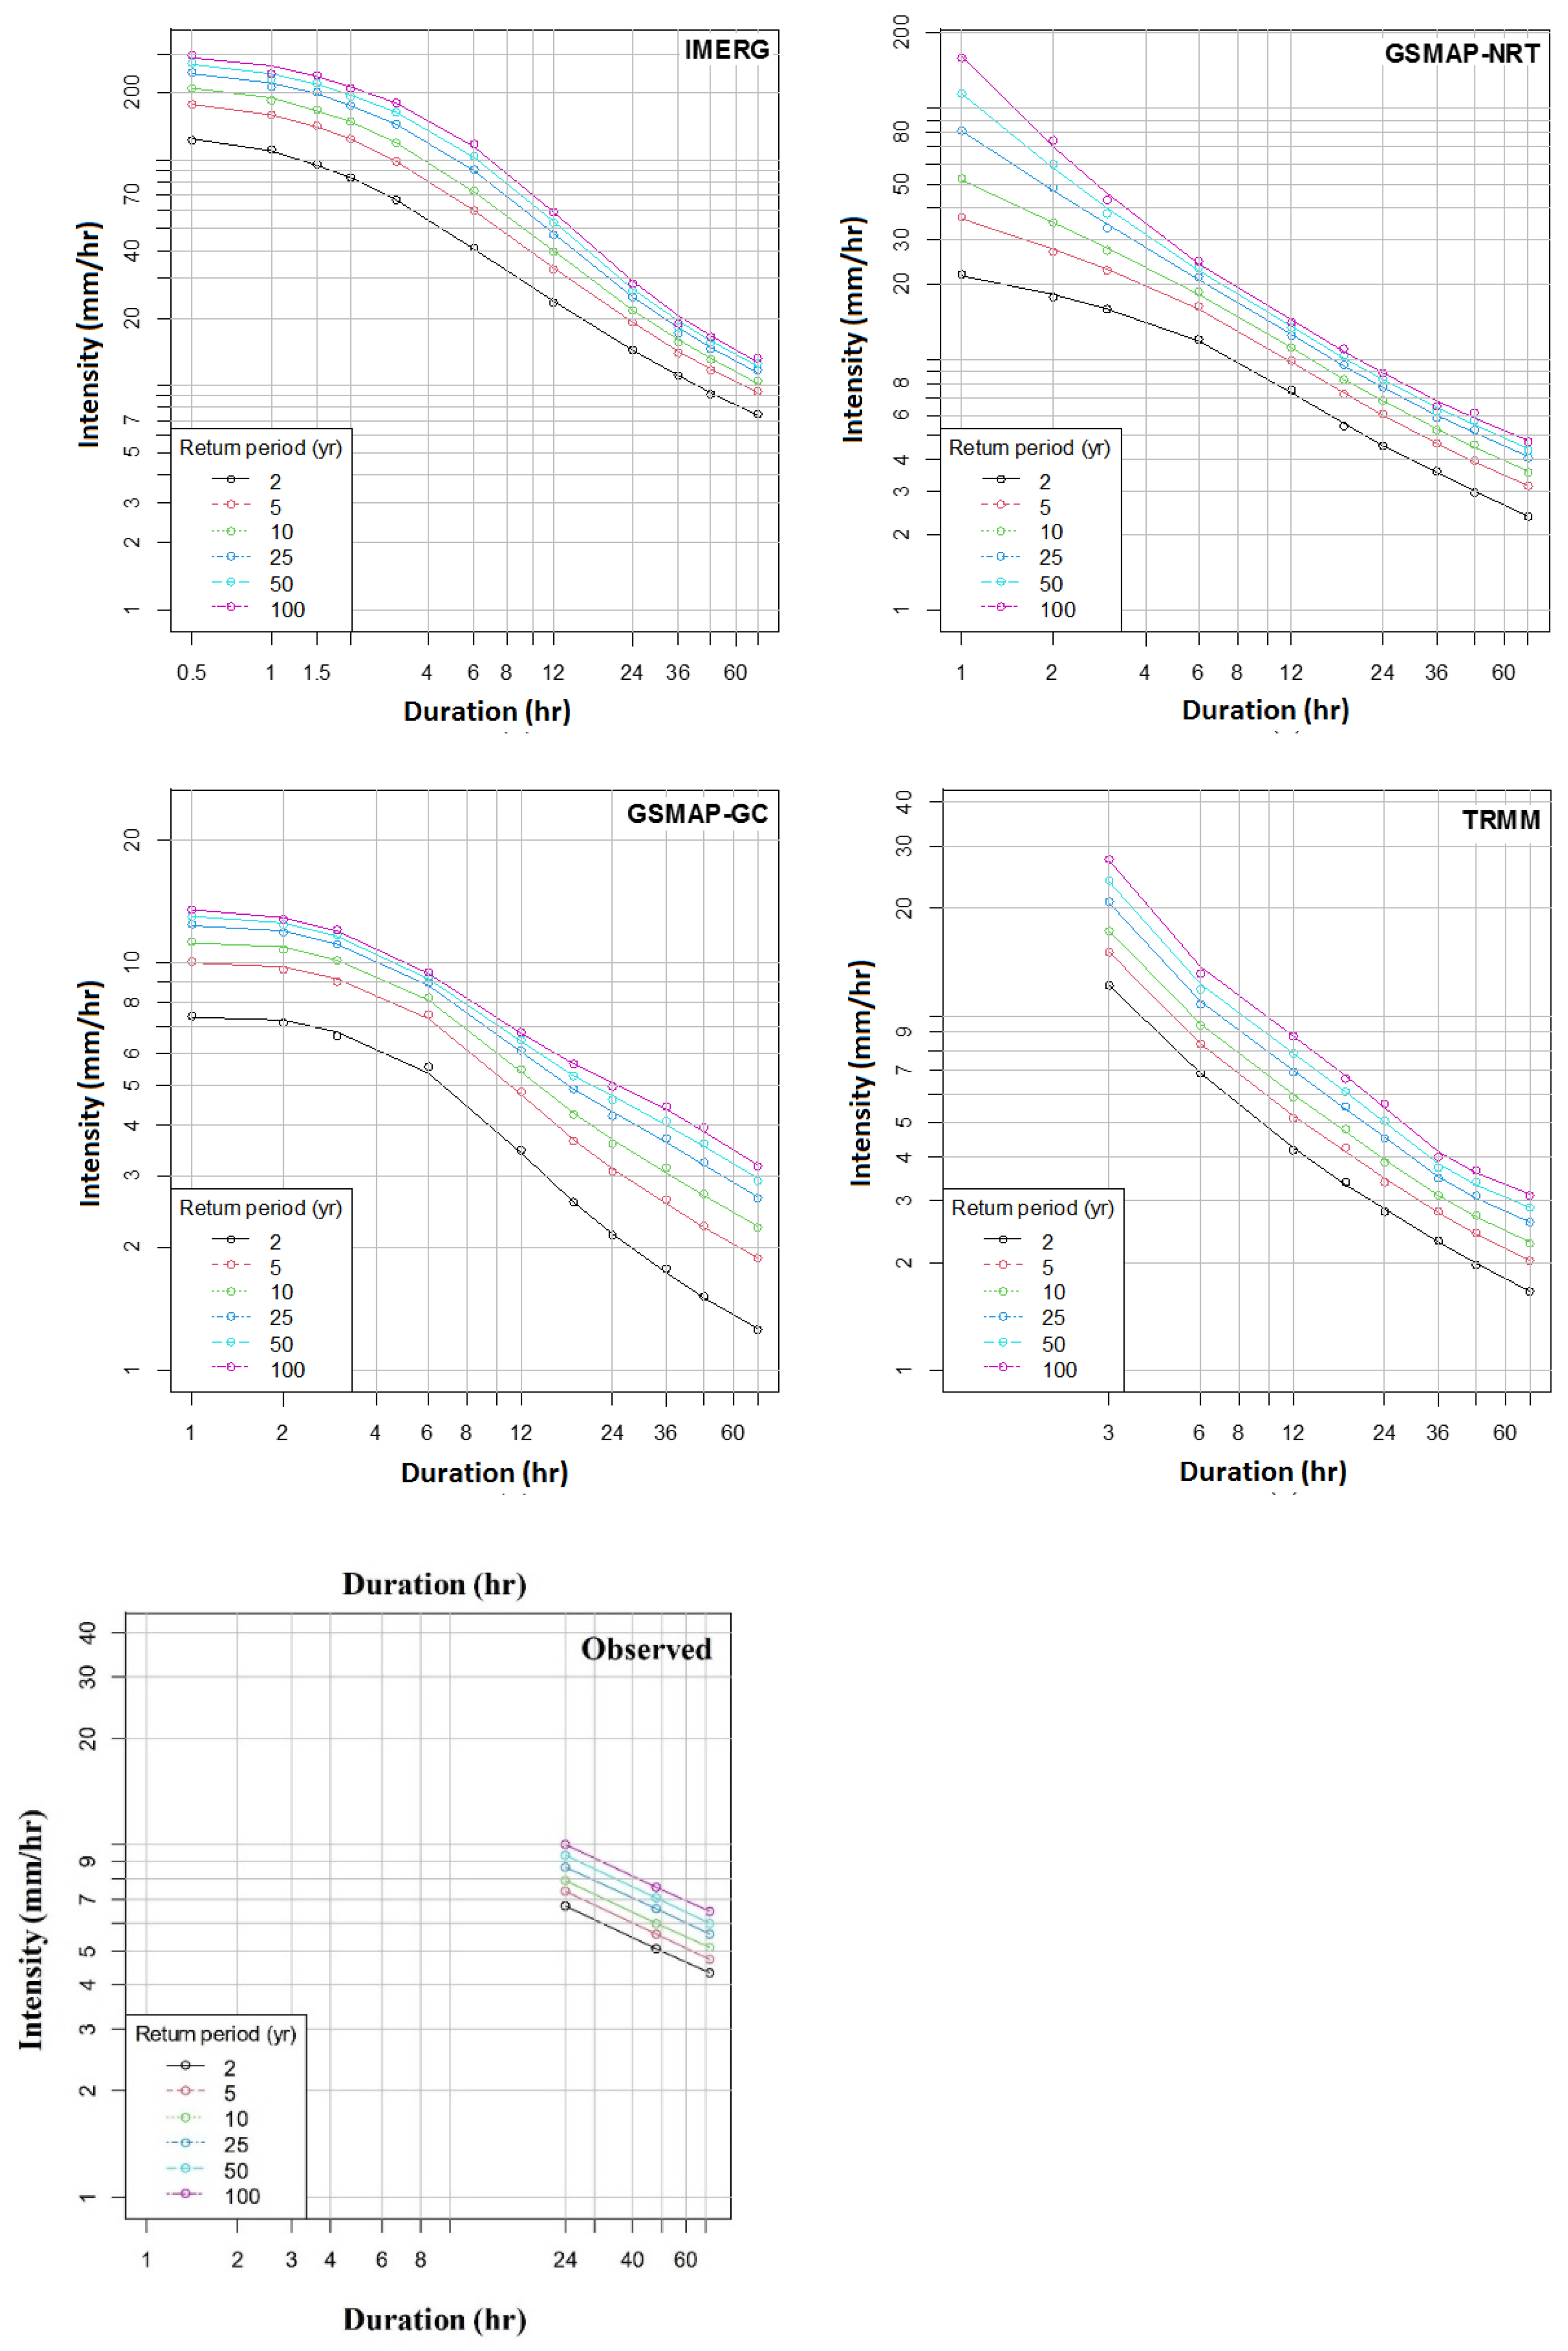
IDF curves were developed using both observed and satellite-based precipitation datasets at all four stations, with the GEV distribution parameters estimated using MLE. The IDF curves obtained using different satellite products and the observed IDF curve estimated using daily rainfall data at YIA are presented in Figure 5.
Sub-hourly or hourly rainfall data are not available at YIA or any other locations in Myanmar. Therefore, it was not possible to validate the satellite IDF curves. Therefore, the present study evaluated the performance of satellite IDF curves based on return periods of observed 24, 48, and 72 h rainfall intensities. The results showed that all the products severely underestimated the observed daily IDF curve at YIA, except IMERG. For example, the observed 2-year return period rainfall for 24, 48, and 72 h durations were 19.1, 13.2, and 10.5 mm/h, respectively. The GSMaP_NRT estimated those intensities as 4.5, 3.7, and 2.9 mm/h only. The TRMM and GSMaP_GC underestimated those values more than GSMaP_NRT. In contrast, IMERG provided the most realistic result. It slightly underestimated those rainfall intensities and estimated them as 16.1, 11.3, and 8.1 mm/h. Overall, the results revealed that the underestimations of observed IDFs for different return periods by IMERG were 19.5 to 29.1%, while those were more than 300% for all other satellite rainfall products.
4.4. IDF Curves Based on the Sherman Equation
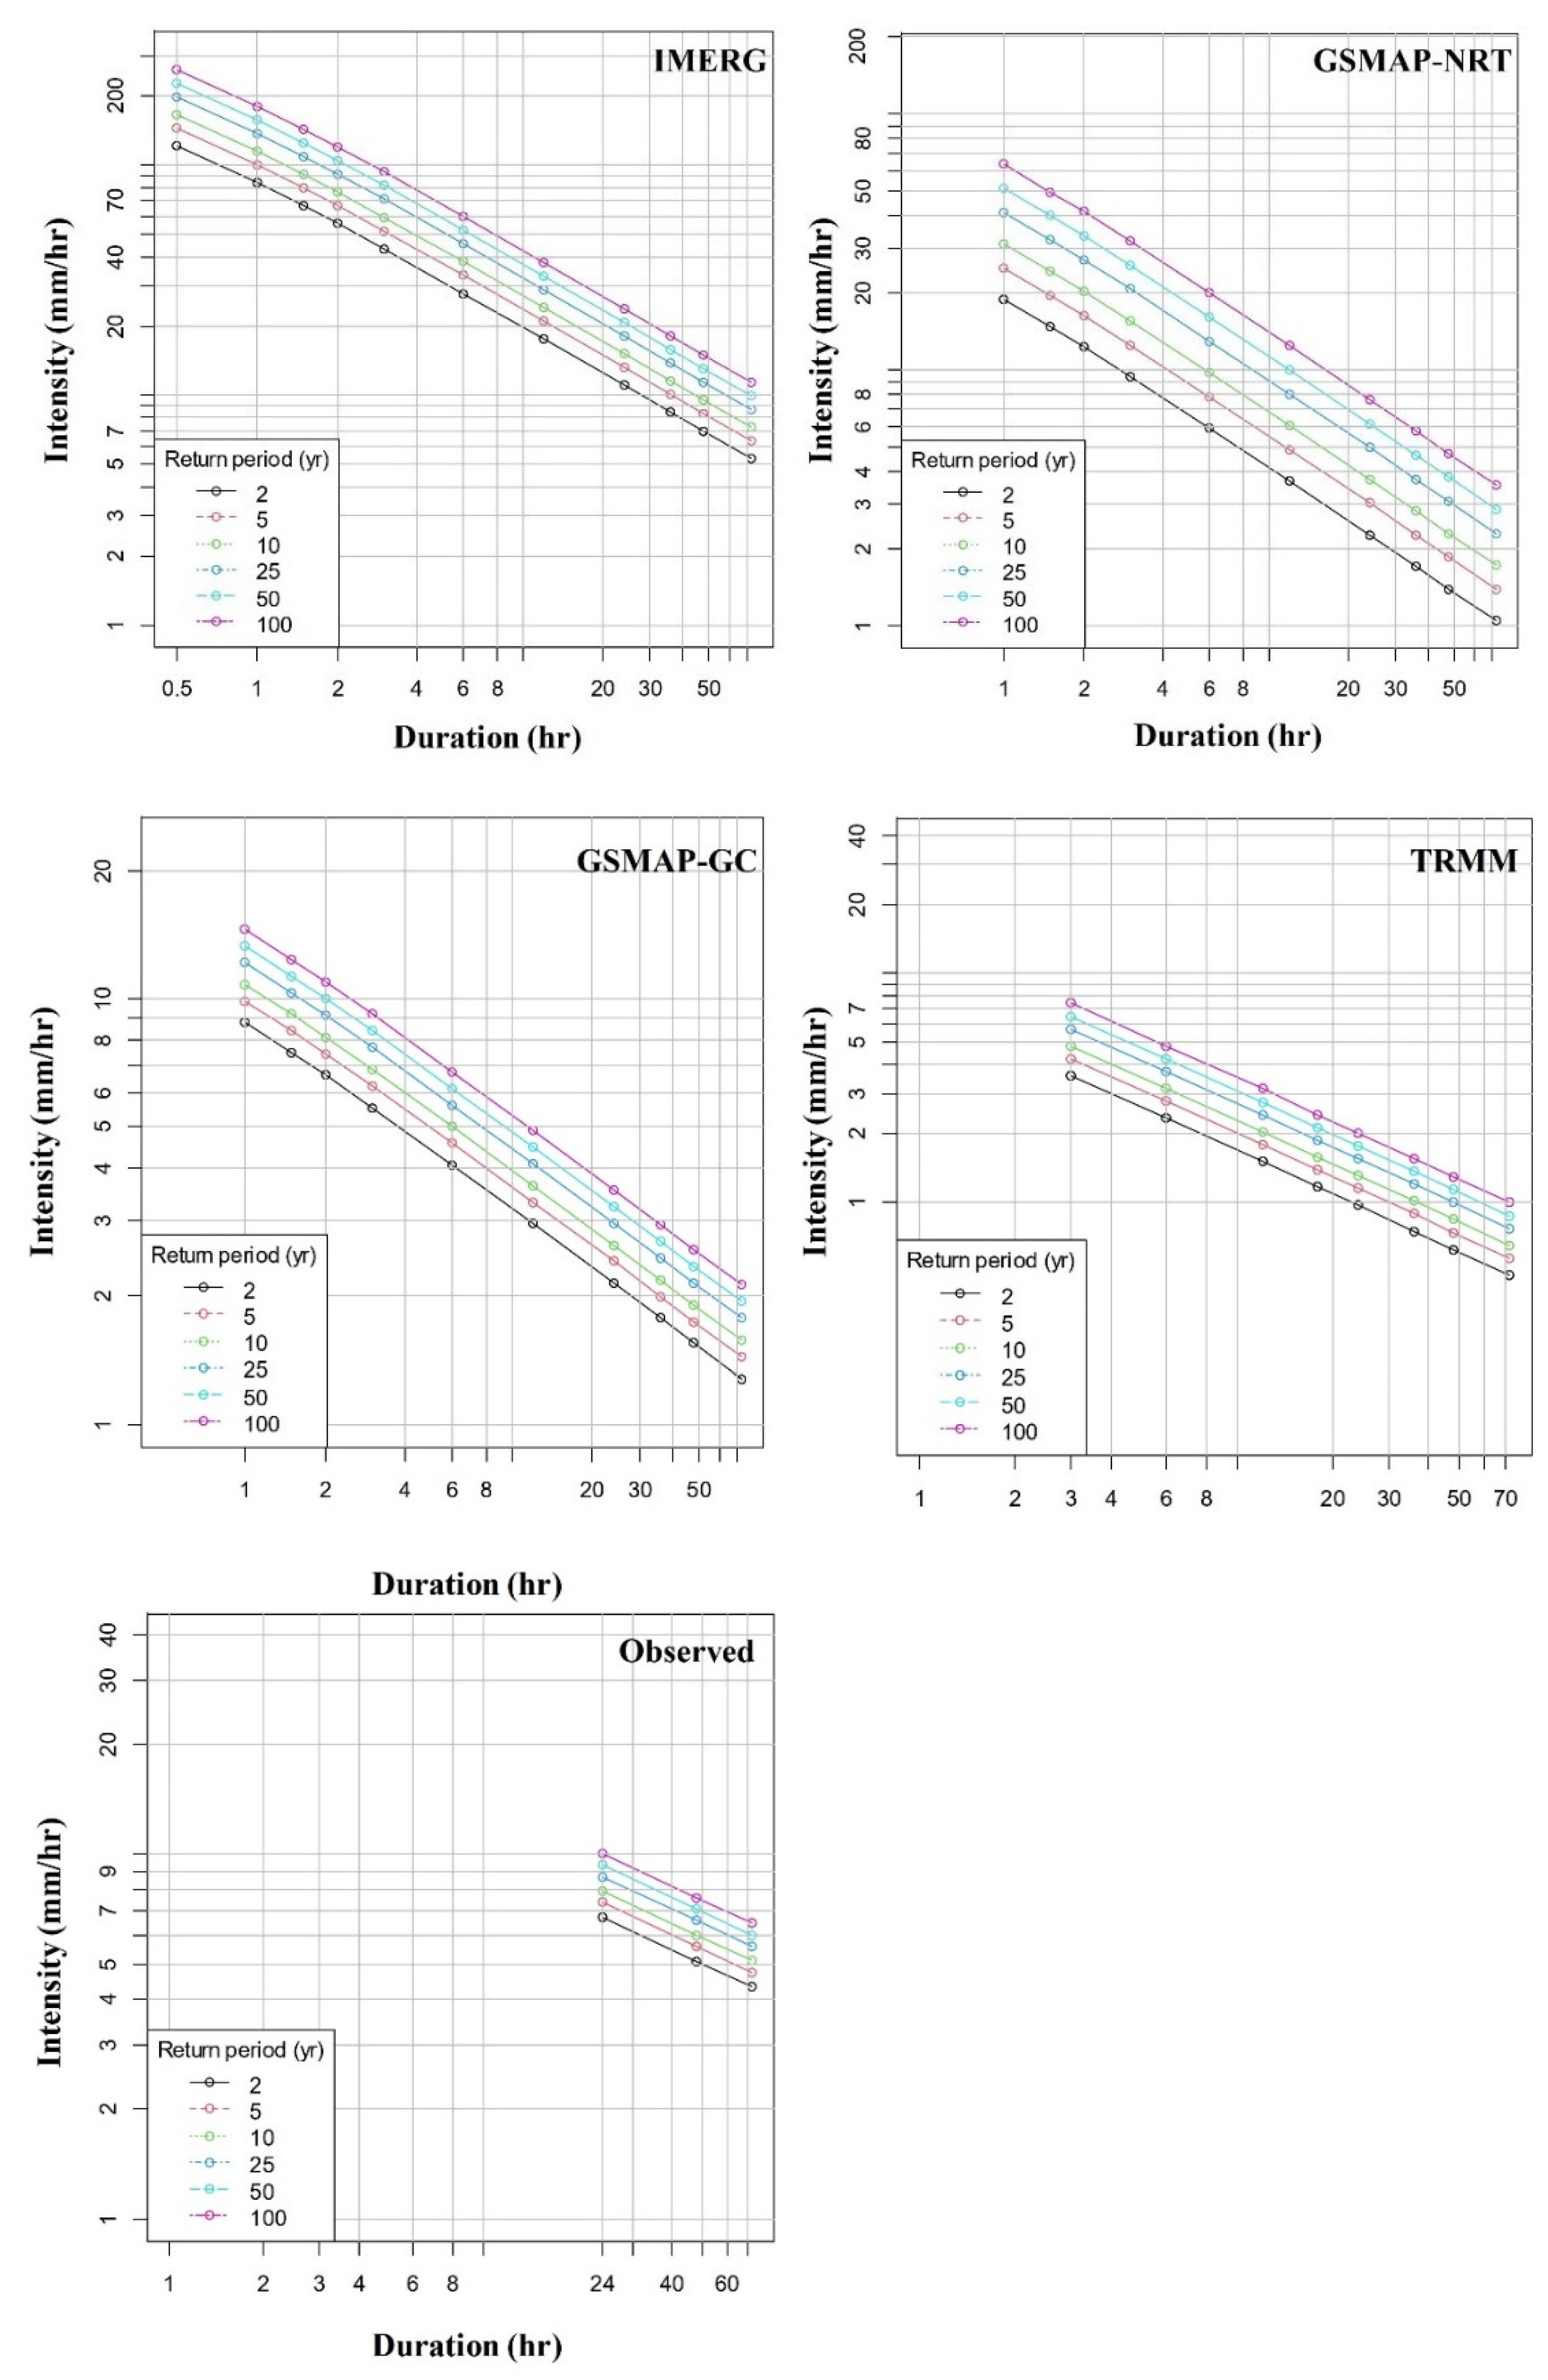
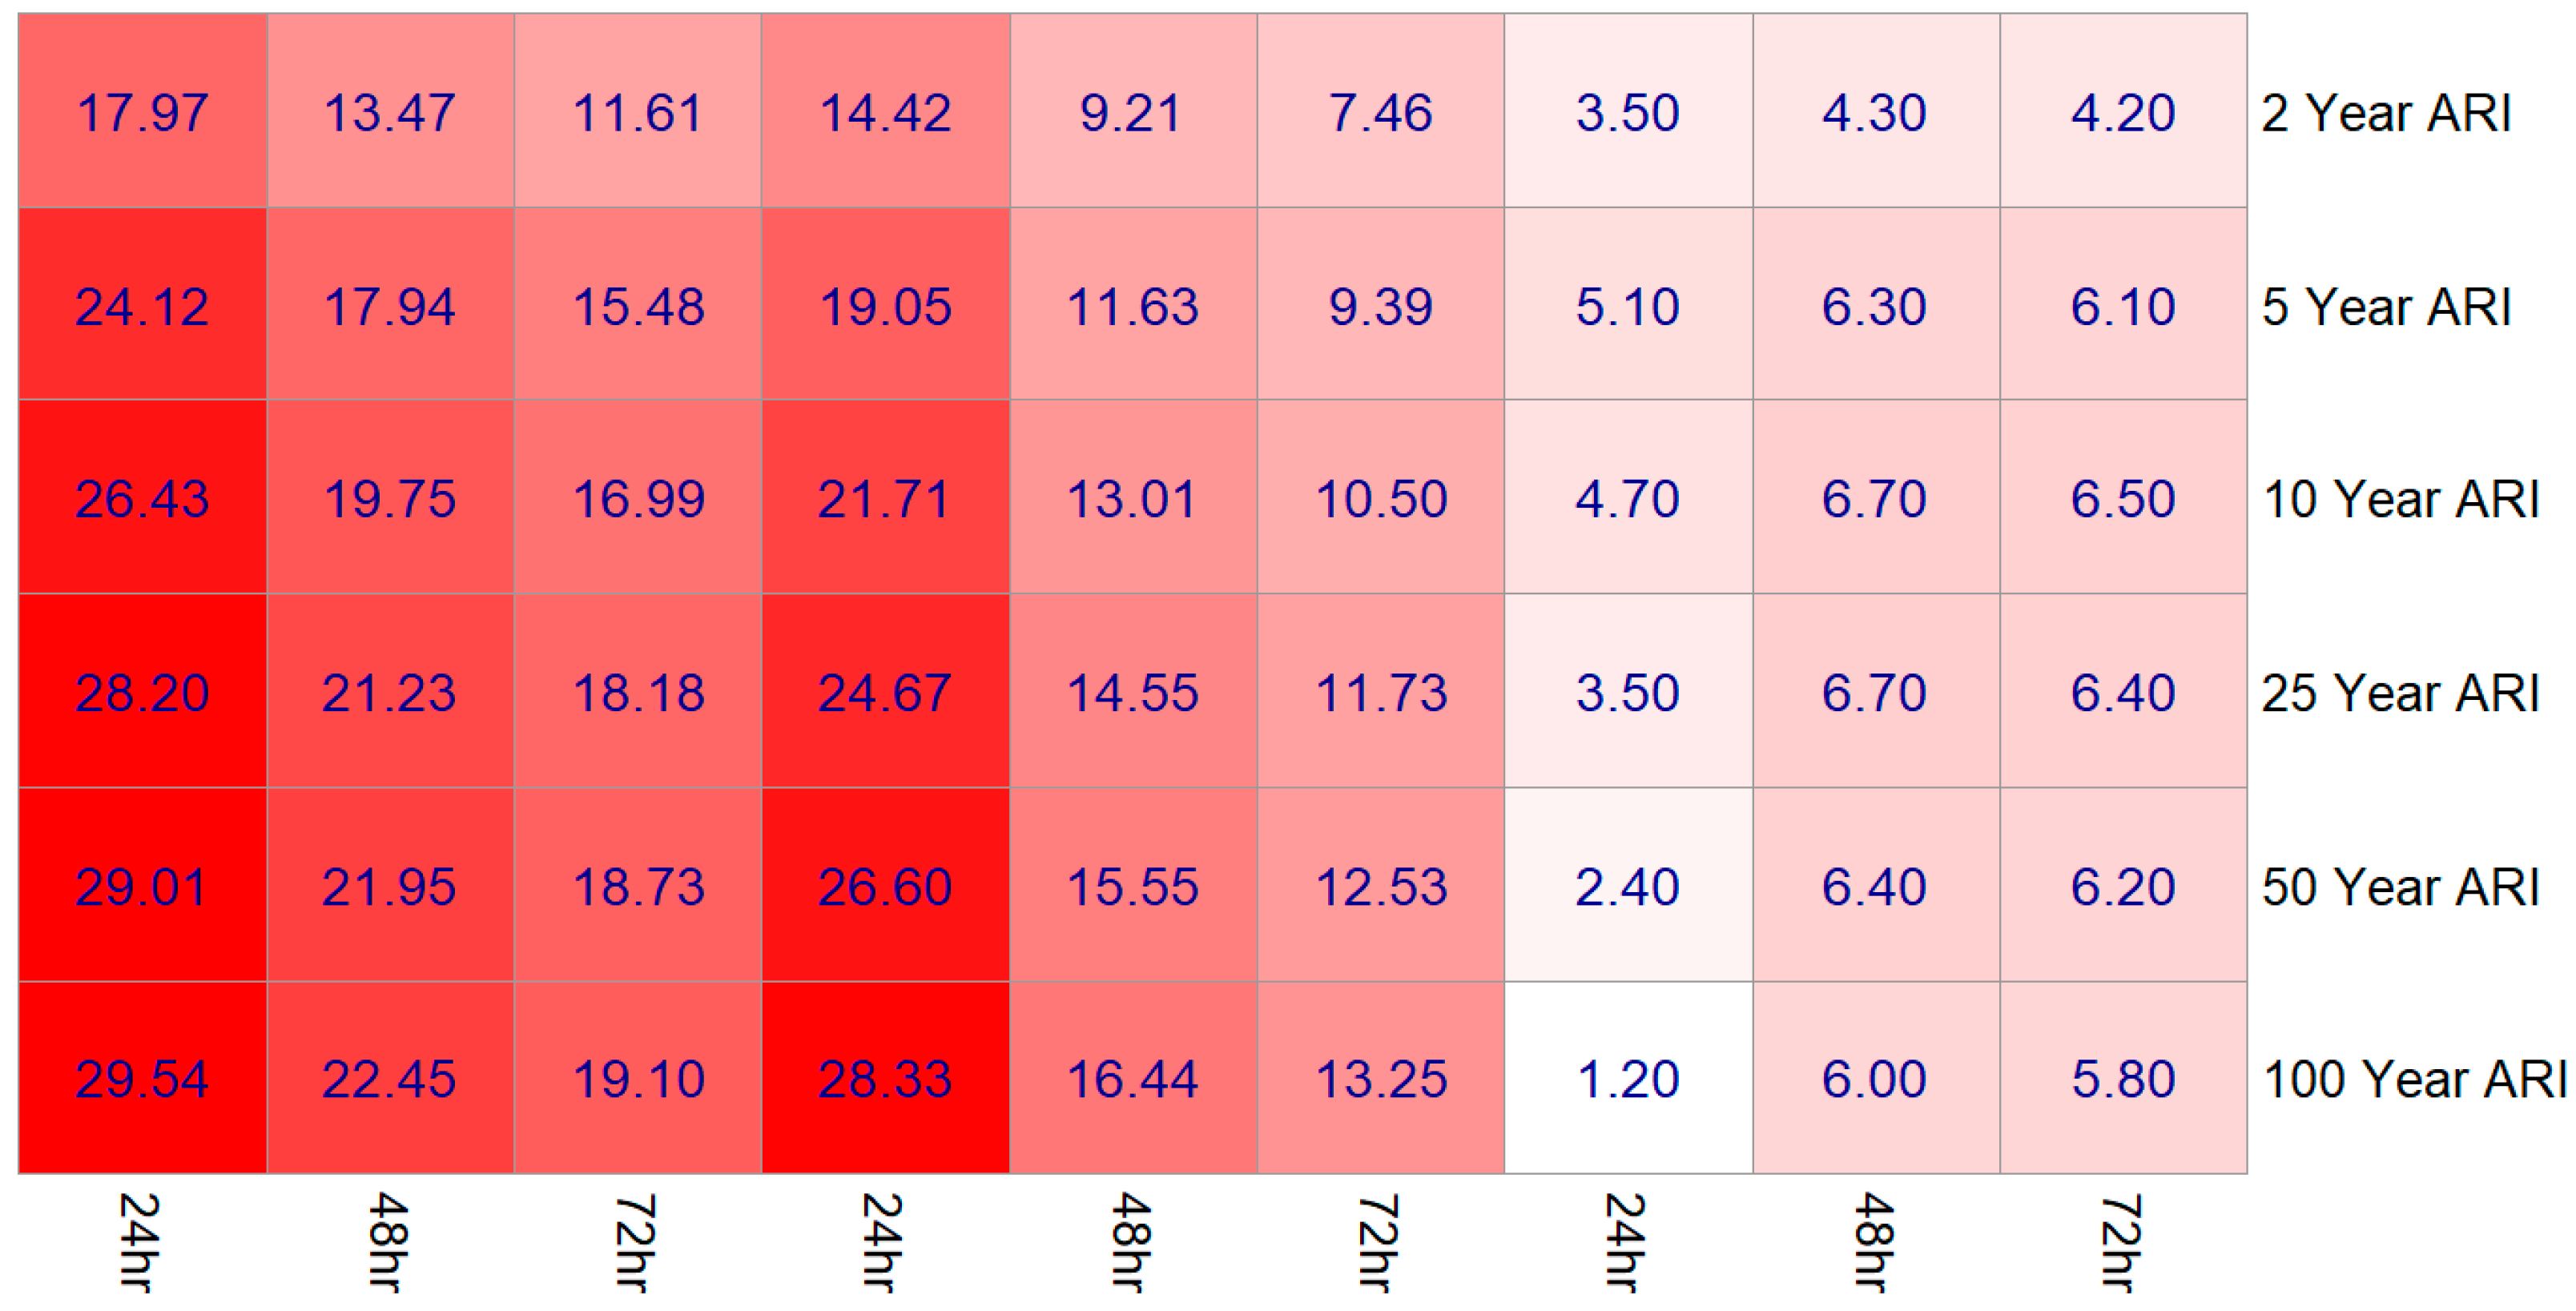
The observed and satellite IDF curves generated based on the Sherman equation are presented in Figure 6. The percentage difference between the fitted IDF and the Sherman method at Yangon International Airport (YIA) for IMERG is summarized using a heatmap in Figure 7. The results indicate IMERG has the least difference with observation than the other datasets. The white color in the map represents less difference while the red color represents a high difference. Overall, the higher differences were for 1.5 h to 6 h duration rainfall events. The difference was also generally high for higher return periods. The minimum difference of 2.4% was observed for the 2-year return period 0.5 h storm duration, whereas the maximum was 51.1% for the 25-year return period 3 h duration storm event.
The statistical performance of the satellite IDF curve compared to observed IDF curves based on the Sherman equation showed a slight overestimation by IMERG but severe underestimations by other satellite products. The results indicate IMERG as the best for generating IDF curves at YIA. Overestimation by IMERG was far less than the underestimations by other satellite products. Therefore, the bias correction factor of satellite rainfall IDF curves was estimated based on IMERG data.
4.5. Bias Correction
The bias correction factor was estimated based on the difference between observed and IMERG rainfall intensities for different durations and return periods. The bias correction factors for 2 to 100 years return periods and 24, 48, and 96 h rainfall intensities are presented in Table 6. The results showed an overall higher difference in rainfall intensity for higher durations and return periods. However, the difference was between 1.2 and 6.7 mm for all the cases.
Linear regression was used to develop functional relationships between IDF bias and rainfall duration for different return periods. Separate models were developed for each return period. The models were used to predict the bias for other durations for each return period. The bias was estimated only at YIA as data were available only at this station. It was considered that bias is similar in other locations within Yangon and nearby YIA. The bias in IMERG IDF curves estimated at all four locations was corrected based on the bias estimated at YIA.
4.6. The Bias-Corrected IDF Curves
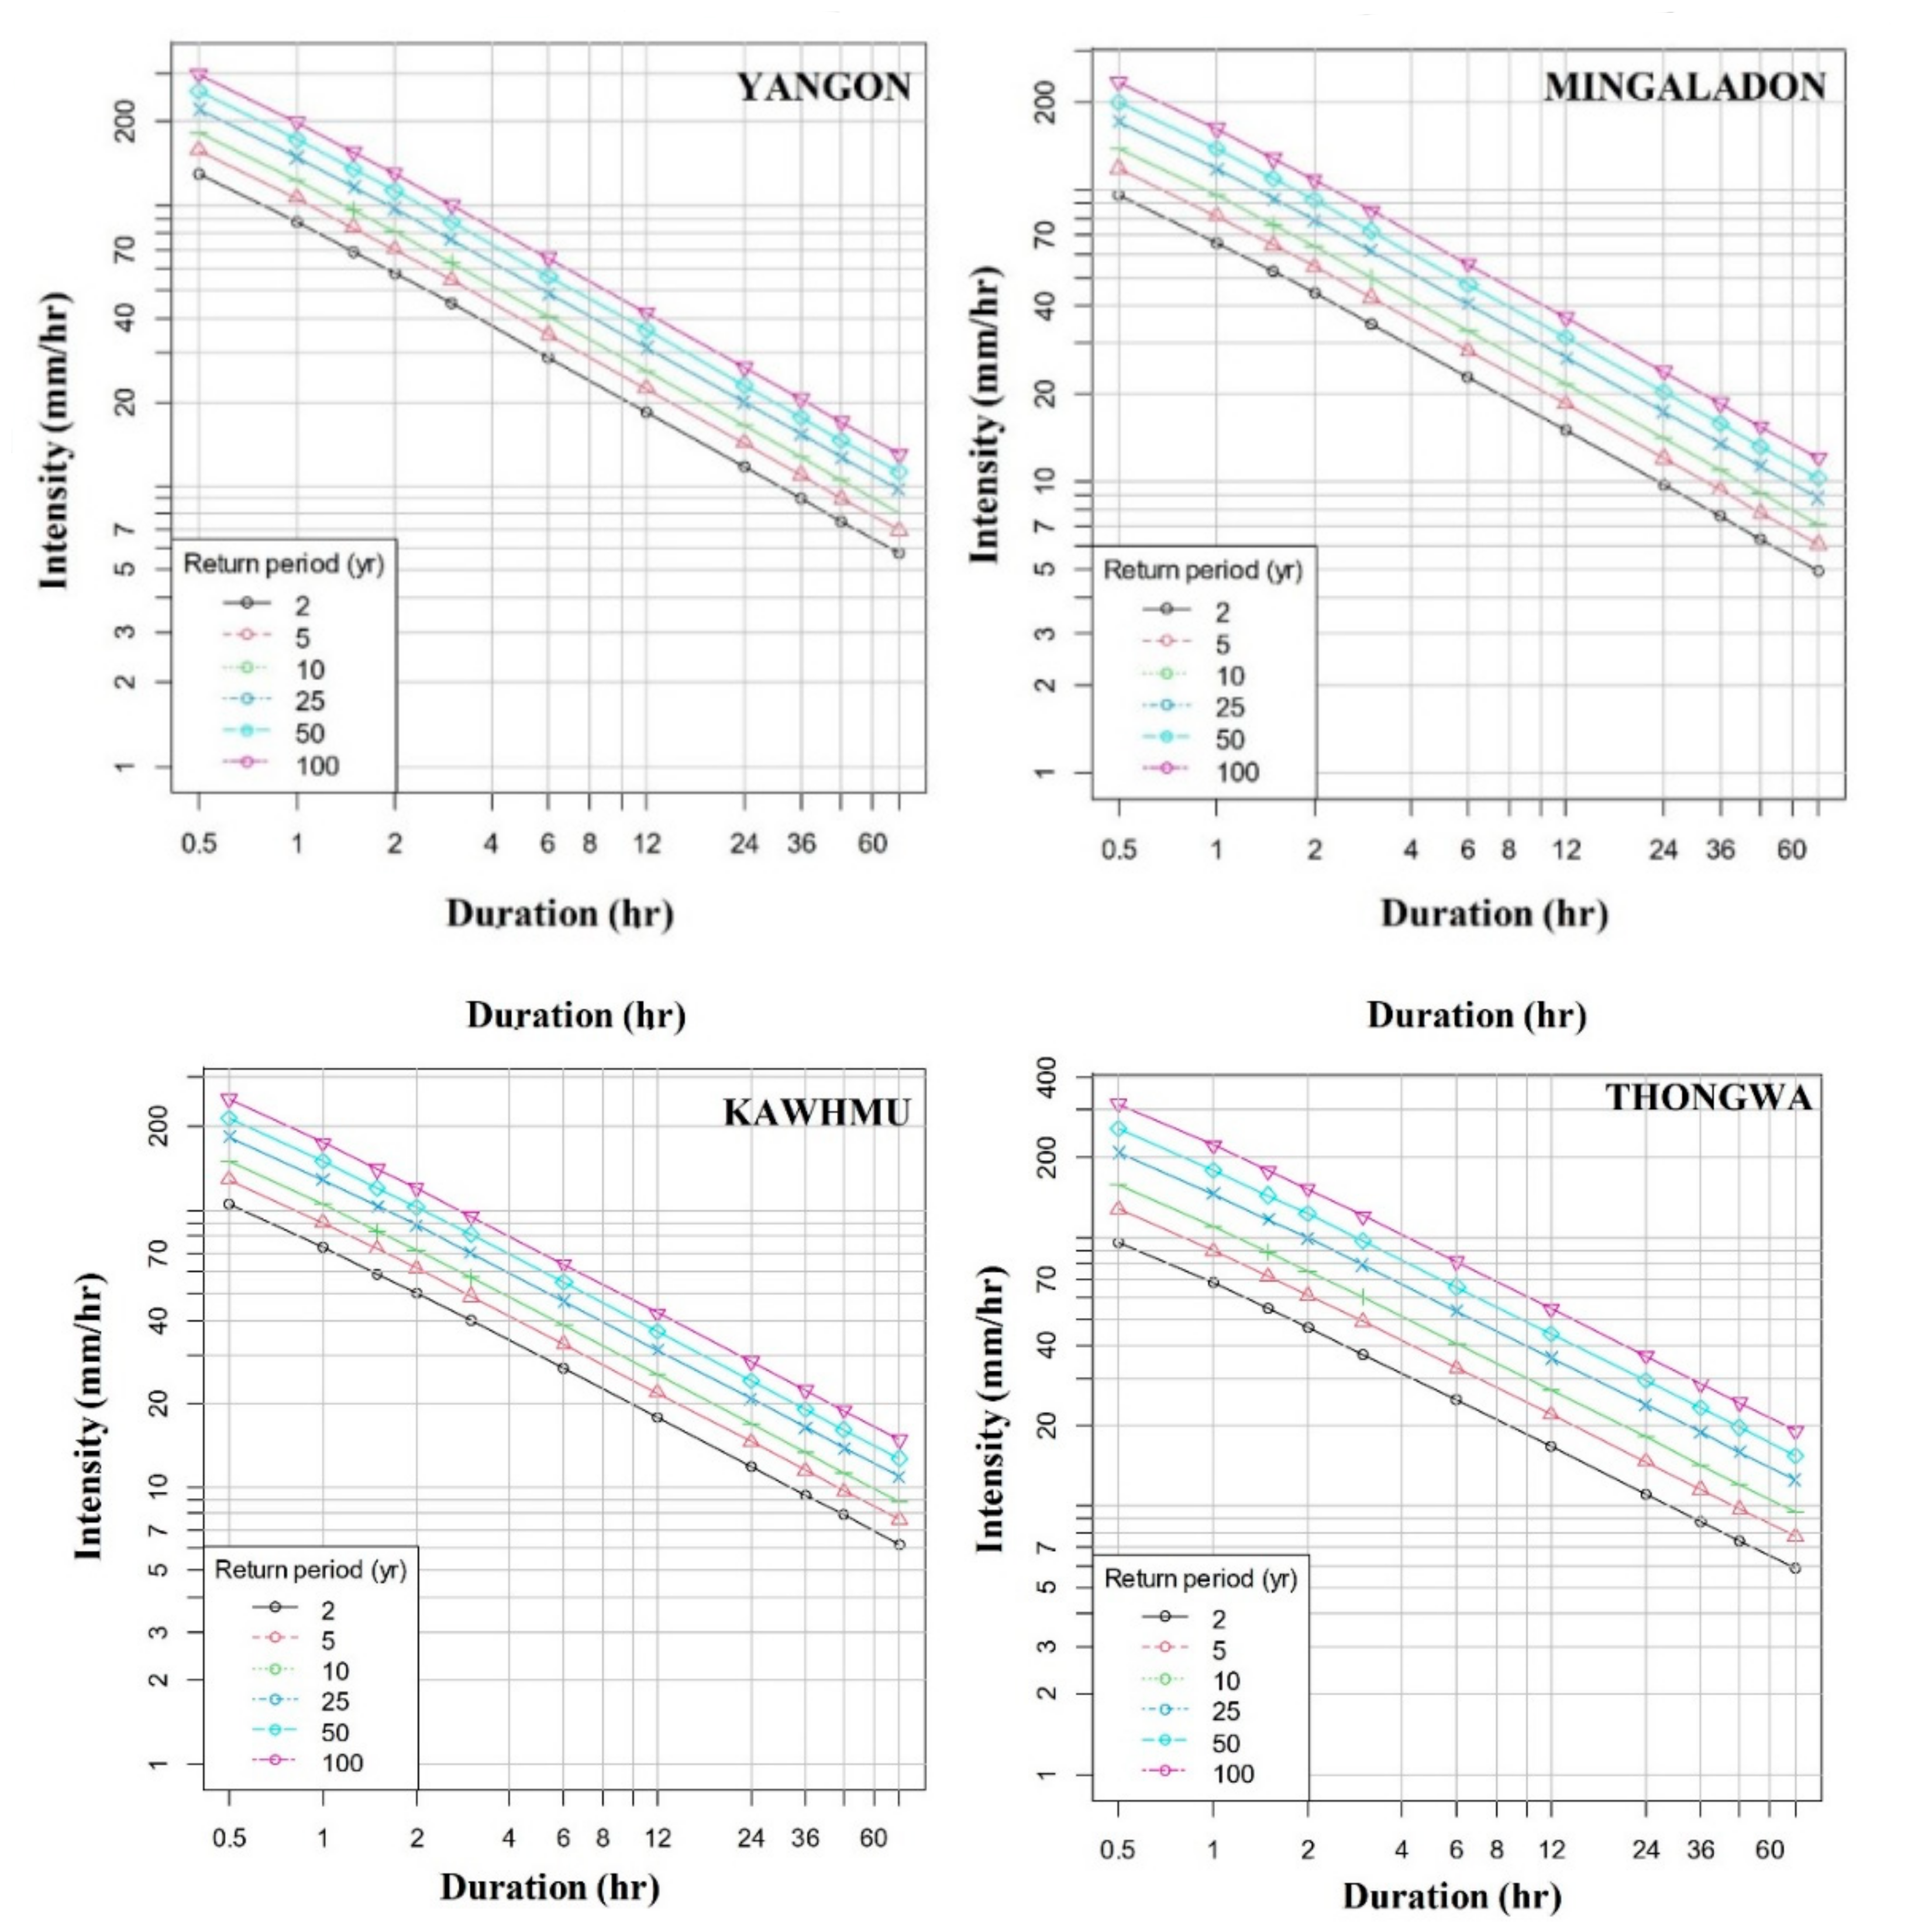
The bias values were subtracted from IMERG IDF curves, and then the Sherman method was used to smooth the derived IDF curves. The IDF curves for different return periods obtained at four stations based on this process are shown in Figure 8.
The bias-corrected IDF curves at YIA indicate a 2-year return period of 0.5 h rainfall is around 130 mm/h. In contrast, the 100-year return period similar duration rainfall can increase up to 290 mm/h. For Mingaladon station, the intensity of the 2- and 100-year return periods of 0.5 h rainfall was 95 and 234 mm/h, respectively. The highest rainfall intensity was noticed for coastal locations like Kawhmu and Thongwa. The 100-year return period of 0.5 h rainfall intensity at these two stations was measured as 316 and 249 mm/h. This is justifiable as the coastal stations receive more intense rainfall than inland stations. An increase in rainfall intensity with an increase in the return period was observed at all locations. It is justifiable as the storm duration influences the rainfall intensity. The longer the duration, the less intensity of rainfall is expected.
5. Discussion
The present study evaluated the performance of four satellite-based precipitation datasets and identified the most suitable product for developing rainfall IDF curves in Yangon. In situ rainfall observation is not available for most cities of Myanmar. Yangon, the commercial capital of Myanmar, has two rainfall observation stations. However, those stations do not measure hourly rainfall. Only daily cumulative rainfall is recorded in those stations but is not publicly available. This posed a major challenge in hydrological studies in Myanmar. Yangon city has experienced rapid development in recent years. Generation of IDF curves is the major milestone for appropriate designing of the urban hydraulic structures of the city.
The study showed contradictory results based on statistical evaluation and visual inspection of satellite precipitation. The statistical metrics showed the best performing method was GSMaP_NRT followed by IMERG, while the worst performance was from TRMM. The visual inspection of data and distribution using scatter and density plots revealed the much better performance of IMERG compared to other products. The IDF curves generated using satellite rainfall products also showed less bias in IMERG IDF curves than those obtained for other products. The present study showed that IMERG overestimated the 1-day maximum rainfall at YIA. This agrees with Chen et al. [48]. They evaluated the performance of satellite precipitation products over the globe and showed that IMERG overestimated extreme precipitation. The present study also showed a large bias in IMERG compared to GSMaP_GC. This agrees with Chen et al. [48]. They showed that the total bias in IMERG is higher than in GSMaP products over the globe. However, the higher biases in IMERG precipitation are due to their failure to estimate the low precipitation events. Yang et al. [49] reported that IMERG can capture rainfall intensity better than detecting precipitation events. Estimating large rainfall events is the major expectation for deriving a reliable IDF curve. Therefore, IMERG was more capable of deriving the IDF curve in the study area. This study used daily observed rainfall data only for six years (2015–2020). Satellite rainfall data employed in this study are also available only for the period 2000–2020. It is widely known that the selection of the appropriate distribution, which best fits the data, could be influenced by the time series length [50,51]. For that reason, this study could be repeated in the future when observed and satellite data will be available for a longer period.
No study has been conducted earlier to rigorously evaluate the performance of satellite rainfall data in Myanmar. Mohsan et al. only conducted a preliminary assessment of IMERG for Myanmar [17]. Therefore, it was not possible the compare the results of our study. However, the findings collaborate with that obtained in the other countries bordering Myanmar. Trang et al. [52] evaluated the skill of multiple satellite rainfall products in Thailand bordering Myanmar in the east. They showed that IMERG was the only product to estimate large precipitation events. Jiang et al. [53] evaluated the different satellite products over the humid region of south China, bordering Myanmar in the north. They showed that IMERG has a reasonable capability for hydrological simulations. Le et al. [54] evaluated the skill of eight satellite precipitation datasets over Vietnam and showed that the best performing method was IMERG. Nguyen [55] also showed the better performance of IMERG in north Vietnam. Da Silva et al. [56] evaluated the performance of IMERG with in situ data in Malaysia and showed its capacity to capture 95% of extreme rainfall events. Ramadhan [57] also showed the good capacity of IMERG to estimate extreme rainfall variability in Indonesia.
However, it should be noted that IMERG rainfall is also associated with large uncertainty [58]. For example, Wang and Yong [59] showed that IMERG underestimates extreme rainfall frequency. The present study showed that IMERG has a large bias in estimating rainfall mean in Yangon. It also severely underestimates the daily rainfall variability. This can be related to the inability of IMERG to reliability detect rainfall events [49]. Low detection of rainfall events increased its bias in estimating rainfall mean and variability. Therefore, the use of IMERG for other purposes like modeling droughts or estimating irrigation water availability is very limited. However, its capability to better estimate the extremes, which has been noticed in different parts of the globe [48], has made IMERG the best product for developing IDF curves and planning urban flood controlling hydraulic structures.
The IDF curves generated using IMERG showed high rainfall intensity, particularly for a short duration and higher return periods in Myanmar. The intensities are more in the coastal areas compared to the inland. At the coastal station of Kawhmu, a 100-year return period of 0.5 h rainfall intensity was measured as 316 mm/h, whereas it was measured as 290 mm/h in YIA. The high rainfall intensity is expected in the coastal region of Myanmar. Iqbal et al. [59] evaluated the spatial distribution of observed and global climate model precipitation over the mainland of southeast Asia. They showed the coastal regions adjoining Yangon receive the highest rainfall during monsoon.
6. Conclusions
Four satellite-based precipitation datasets are evaluated to identify the most suitable dataset to derive rainfall IDF curves in Yangon, Myanmar. The evaluation was conducted based on the observed daily data collected from Yangon International Airport (YIA) between 2015 and 2020. The following conclusion can be drawn from the study:
- GSMaP_NRT, followed by IMERG, performs the best in replicating daily rainfall in terms of statistical metrics. However, visual inspection through scatter and density plots revealed the better performance of IMERG followed by GSMaP_NRT.
- The statistical methods confirm the GEV best fits the sub-hourly and hourly satellite rainfall distribution. It also best fits the observed daily rainfall distribution of Yangon.
- Evaluation satellite IDF curves with observed IDF curves showed the best performance of IMERG IDF. It showed an underestimation of observed daily IDF in the range of 19.5 to 29.1%, compared to more than 300% for all other satellite rainfall products.
- Bias-corrected IMERG IDF curves showed higher intensity in short-duration rainfall in the coastal areas compared to the inland.
The lack of available ground observations of sub-hourly or hourly rainfall is a major challenge in developing IDF curves and designing hydraulic structures in Myanmar. The present study reports the first attempt to construct the IDF curves for Yangon. Satellite hourly and sub-hourly rainfall data were used to overcome the challenge of data scarcity. The derived IDF can be used in various infrastructure and development projects protecting the public from extreme hydraulic events.
This study used daily observed rainfall data only for six years (2015–2020). Satellite rainfall data employed in this study are also available only for the period 2000–2020. The study can be repeated in the future when observed and satellite data will be available for a longer period. For future work, the IDF curves for the future climate scenarios (up to 2100) based on the IPCC’s 6th Assessment Report (AR6) using the most suitable Global Climate Models (GCMs) are recommended. It should also be noted that deriving the IDF curves for other major cities in Myanmar is also considered an important task in tackling climate change and planning for climate-resilient and adaptable structures.
Author Contributions
Conceptualization, A.K.K. and S.S.; methodology, A.K.K., S.S., and X.W.; software, A.K.K. and S.S.; formal analysis, A.K.K. and S.S.; writing—original draft preparation, A.K.K.; writing—review and editing, A.K.K., S.S., and X.W.; supervision, S.S. and X.W. All authors have read and agreed to the published version of the manuscript.
Funding
We are grateful to The Belt and Road Special Foundation of the State Key Laboratory of Hydrology-Water Resources and Hydraulic Engineering (2019491311) for providing financial support for this research.
Institutional Review Board Statement
Not applicable.
Informed Consent Statement
Not applicable.
Data Availability Statement
The data used in this study are freely available on the websites mentioned in the manuscript.
Acknowledgments
We are grateful to the National Centers for Environmental Information (NCEI) of National Oceanic and Atmospheric Administration (NOAA), The United States, for publicly providing the daily rainfall data of Yangon International Airport (YIA) through their web portal Global Summary of the Day.
Conflicts of Interest
The authors declare no conflict of interest.
References
- Parvin, G.A.; Shimi, A.C.; Shaw, R.; Biswas, C. Flood in a changing climate: The impact on livelihood and how the rural poor cope in Bangladesh. Climate 2016, 4, 60. [Google Scholar] [CrossRef] [Green Version]
- Sapountzis, M.; Kastridis, A.; Kazamias, A.-P.; Karagiannidis, A.; Nikopoulos, P.; Lagouvardos, K. Utilization and uncertainties of satellite precipitation data in flash flood hydro-logical analysis in ungauged watersheds. Glob. NEST J. 2021, 23, 388–399. [Google Scholar] [CrossRef]
- Diakakis, M.; Andreadakis, E.; Nikolopoulos, E.; Spyrou, N.; Gogou, M.; Deligiannakis, G.; Katsetsiadou, N.; Antoniadis, Z.; Melaki, M.; Georgakopoulos, A.; et al. An integrated approach of ground and aerial observations in flash flood disaster investigations. The case of the 2017 Mandra flash flood in Greece. Int. J. Disaster Risk Reduct. 2018, 33, 290–309. [Google Scholar] [CrossRef]
- Fowler, H.J.; Wasko, C.; Prein, A.F. Intensification of short-duration rainfall extremes and implications for flood risk: Current state of the art and future directions. Philos. Trans. R. Soc. A 2021, 379, 20190541. [Google Scholar] [CrossRef] [PubMed]
- Pour, S.H.; Wahab, A.K.A.; Shahid, S.; Asaduzzaman, M.; Dewan, A. Low impact development techniques to mitigate the impacts of climate change-induced urban floods: Current trends, issues and challenges. Sustain. Cities Soc. 2020, 62, 102373. [Google Scholar] [CrossRef]
- Fuchs, R.; Conran, M.; Louis, E. Climate Change and Asia’s Coastal Urban Cities: Can they Meet the Challenge? Environ. Urban. ASIA 2011, 2, 13–28. [Google Scholar] [CrossRef]
- IPCC. Climate Change 2022: Impacts, Adaptation and Vulnerability. In Working Group II Contribution to the IPCC Sixth Assessment Report; IPCC: Geneva, Switzerland, 2021. [Google Scholar]
- Aung, N.N.; San Htwe, S.; Sein, K.K.; Aung, L.L. The Impact of Floods on the Socio-Economic Activities of Yangon. In Population, Development, and the Environment; Palgrave Macmillan: Singapore, 2019; pp. 255–271. [Google Scholar] [CrossRef]
- Mar, S.; Nomura, H.; Takahashi, Y.; Ogata, K.; Yabe, M. Impact of erratic rainfall from climate change on pulse production efficiency in lower Myanmar. Sustainability 2018, 10, 402. [Google Scholar] [CrossRef] [Green Version]
- Yazid, M.; Humphries, U. Regional observed trends in daily rainfall indices of extremes over the Indochina Peninsula from 1960 to 2007. Climate 2015, 3, 168–192. [Google Scholar] [CrossRef] [Green Version]
- Horton, R.; De Mel, M.; Peters, D.; Lesk, C.; Bartlett, R.; Helsingen, H.; Bader, D.; Capizzi, P.; Martin, S.; Rosenzweig, C. Assessing Climate Risk in Myanmar: Technical Report; Center for Climate Systems Research at Columbia University, WWF-US and WWF-Myanmar: New York, NY, USA, 2017. [Google Scholar]
- ADB. Project Concept Paper-Proposed Loan, Myanmar: Yangon Urban Services Improvement Project; Asian Development Bank: Mandaluyong, Philippines, 2018. [Google Scholar]
- UN Habitat. The Republic of the Union of Myanmar: National Urban Policy Framework; UN Habitat: Nairobi, Kenya, 2016. [Google Scholar]
- World Bank Group. Myanmar’s Urbanization: Creating Opportunities for All; World Bank: Washington, DC, USA, 2019. [Google Scholar]
- Noor, M.; Ismail, T.; Chung, E.-S.; Shahid, S.; Sung, J.H. Uncertainty in Rainfall Intensity Duration Frequency Curves of Peninsular Malaysia under Changing Climate Scenarios. Water 2018, 10, 1750. [Google Scholar] [CrossRef] [Green Version]
- Noor, M.; Ismail, T.; Shahid, S.; Asaduzzaman, M.; Dewan, A. Evaluating intensity-duration-frequency (IDF) curves of satellite-based precipitation datasets in Peninsular Malaysia. Atmos. Res. 2021, 248, 105203. [Google Scholar] [CrossRef]
- Mohsan, M.; Acierto, R.A.; Kawasaki, A.; Zin, W.W. Preliminary assessment of GPM satellite rainfall over Myanmar. J. Disaster Res. 2018, 13, 22–30. [Google Scholar] [CrossRef]
- Hirano, A.; Mar, S.S.; Myint, M.T.A.; Khaing, H.M. On the applicability of satellite-based rainfall estimates for the determination of monsoon onset date: Case study in the ayeyarwady delta, myanmar. In Proceedings of the Paper presented at the 40th Asian Conference on Remote Sensing, ACRS 2019: Progress of Remote Sensing Tech, Daejeon, South Korea, 14–18 October 2019; 2020. [Google Scholar]
- Gilewski, P.; Nawalany, M. Inter-comparison of rain-gauge, radar, and satellite (IMERG GPM) precipitation estimates performance for rainfall-runoff modeling in a mountainous catchment in Poland. Water 2018, 10, 1665. [Google Scholar] [CrossRef] [Green Version]
- Yuan, F.; Zhang, L.; Win, K.W.W.; Ren, L.; Zhao, C.; Zhu, Y.; Jiang, S.; Liu, Y. Assessment of GPM and TRMM multi-satellite precipitation products in streamflow simulations in a data-sparse mountainous watershed in Myanmar. Remote Sens. 2017, 9, 302. [Google Scholar] [CrossRef] [Green Version]
- Yuan, F.; Zhang, L.; Soe, K.M.W.; Ren, L.; Zhao, C.; Zhu, Y.; Jiang, S.; Liu, Y. Applications of TRMM-and GPM-era multiple-satellite precipitation products for flood simulations at sub-daily scales in a sparsely gauged watershed in Myanmar. Remote Sens. 2019, 11, 140. [Google Scholar] [CrossRef] [Green Version]
- Endreny, T.A.; Imbeah, N. Generating robust rainfall intensity–duration–frequency estimates with short-record satellite data. J. Hydrol. 2009, 371, 182–191. [Google Scholar] [CrossRef]
- Marra, F.; Morin, E.; Peleg, N.; Mei, Y.; Aanognostou, E.N. Intensity-duration-frequency curves from remote sensing rainfall estimates: Comparing satellite and weather radar over the eastern Mediterranean. Hydrol. Earth Syst. Sci. 2017, 21, 2389–2404. [Google Scholar] [CrossRef] [Green Version]
- Ombadi, M.; Nguyen, P.; Sorooshian, S.; Hsu, K.L. Developing intensity-duration-frequency (IDF) curves from satellite-based precipitation: Methodology and evaluation. Water Resour. Res. 2018, 54, 7752–7766. [Google Scholar] [CrossRef]
- Sun, Y.; Wendi, D.; Kim, D.E.; Liong, S.Y. Deriving intensity–duration–frequency (IDF) curves using downscaled in situ rainfall assimilated with remote sensing data. Geosci. Lett. 2019, 6, 1–12. [Google Scholar] [CrossRef] [Green Version]
- Nashwan, M.S.; Shahid, S.; Wang, X. Assessment of satellite-based precipitation measurement products over the hot desert climate of Egypt. Remote Sens. 2019, 11, 555. [Google Scholar] [CrossRef] [Green Version]
- Mie Sein, Z.M.; Ullah, I.; Saleem, F.; Zhi, X.; Syed, S.; Azam, K. Interdecadal Variability in Myanmar Rainfall in the Monsoon Season (May–October) Using Eigen Methods. Water 2021, 13, 729. [Google Scholar] [CrossRef]
- Gubbala, S.; Venkata, D.; Srinivas, D. Decreasing southwest monsoon rainfall over Myanmar in the prevailing global warming era. Meteorol. Appl. 2019, 27, 1816. [Google Scholar] [CrossRef]
- Shrivastava, S.; Kar, S.C.; Sharma, A.R. Inter-annual variability of summer monsoon rainfall over Myanmar. Int. J. Climatol. 2017, 37, 802–820. [Google Scholar] [CrossRef]
- Derin, Y.; Anagnostou, E.; Berne, A.; Borga, M.; Boudevillain, B.; Buytaert, W.; Chang, C.-H.; Delrieu, G.; Hong, Y.; Hsu, Y.C.; et al. Multiregional satellite precipitation products evaluation over complex terrain. J. Hydrometeorol. 2016, 17, 1817–1836. [Google Scholar] [CrossRef]
- Huffman, G.J.; Adler, R.F.; Bolvin, D.T.; Gu, G.; Nelkin, E.J.; Bowman, K.P.; Hong, Y.; Stocker, E.F.; Wolff, D.B. The TRMM Multisatellite Precipitation Analysis (TMPA): Quasi-Global, Multiyear, Combined-Sensor Precipitation Estimates at Fine Scales. J. Hydrometeorol. 2007, 8, 38–55. [Google Scholar] [CrossRef]
- Sharifi, E.; Steinacker, R.; Saghafian, B.; Sharifi, E.; Steinacker, R.; Saghafian, B. Multi time-scale evaluation of high-resolution satellite-based precipitation products over northeast of Austria. Atmos. Res. 2018, 206, 46–63. [Google Scholar] [CrossRef]
- Okamoto, K.; Iguchi, T.; Takahashi, N.; Iwanami, K.; Ushio, T. The global satellite mapping of precipitation (GSMaP) project. In Proceedings of the 25th IGARSS Proceedings, Seoul, Korea, 25–29 July 2005; pp. 3414–3416. [Google Scholar] [CrossRef]
- Ushio, T.; Sasashige, K.; Kubota, T.; Shige, S.; Okamoto, K.; Aonashi, K.; Inoue, T.; Takahashi, N.; Iguchi, T.; Kachi, M.; et al. A Kalman Filter Approach to the Global Satellite Mapping of Precipitation (GSMaP) from Combined Passive Microwave and Infrared Radiometric Data. J. Meteorol. Soc. Jpn. 2009, 87, 137. [Google Scholar] [CrossRef] [Green Version]
- Aonashi, K.; Awaka, J.; Hirose, M.; Kozu, T.; Kubota, T.; Liu, G.; Shige, S.; Kida, S.; Seto, S.; Takahashi, N.; et al. GSMaP passive, microwave precipitation retrieval algorithm: Algorithm description and validation. J. Meteorol. Soc. Jpn. 2009, 87, 119–136. [Google Scholar] [CrossRef] [Green Version]
- Nashwan, M.S.; Shahid, S. Symmetrical uncertainty and random forest for the evaluation of gridded precipitation and temperature data. Atmos. Res. 2019, 230, 104632. [Google Scholar] [CrossRef]
- Mega, T.; Ushio, T.; Takahiro, M.; Kubota, T.; Kachi, M.; Oki, R. Gauge Adjusted Global Satellite Mapping of Precipitation (GSMaP_Gauge). IEEE Trans. Geosci. Remote. Sens. 2019, 57, 1928–1935. [Google Scholar] [CrossRef]
- Gorelick, N.; Hancher, M.; Dixon, M.; Ilyushchenko, S.; Thau, D.; Moore, R. Google Earth Engine: Planetary-scale geospatial analysis for everyone. Remote Sens. Environ. 2017, 202, 18–27. [Google Scholar] [CrossRef]
- Huffman, G.J.; Stocker, E.F.; Bolvin, D.T.; Nelkin, E.J.; Tan, J. GPM IMERG Final Precipitation L3 Half Hourly 0.1 Degree X 0.1 degree V06, Greenbelt, MD, Goddard Earth Sciences Data and Information Services Center (GES DISC). Available online: https://disc.gsfc.nasa.gov/datasets/GPM_3IMERGHH_06/summary (accessed on 11 November 2021).
- Kubota, T.; Shige, S.; Hashizume, H.; Aonashi, K.; Takahashi, N.; Seto, S.; Hirose, M.; Takayabu, Y.N.; Ushio, T.; Nakagawa, K.; et al. Global Precipitation Map using Satelliteborne Microwave Radiometers by the GSMaP Project: Production and Validation. IEEE Trans. Geosci. Remote Sens. 2007, 45, 2259–2275. [Google Scholar] [CrossRef]
- Tropical Rainfall Measuring Mission (TRMM). TRMM (TMPA) Rainfall Estimate L3 3-h 0.25 Degree X 0.25 Degree V7, Greenbelt, MD, Goddard Earth Sciences Data and Information Services Center (GES DISC). Available online: https://disc.gsfc.nasa.gov/datasets/TRMM_3B42_7/summary (accessed on 10 September 2021).
- Rahman, A.S.; Rahman, A.; Zaman, M.A.; Haddad, K.; Ahsan, A.; Imteaz, M. A study on selection of probability distributions for at-site flood frequency analysis in Australia. Nat. Hazards 2013, 69, 1803–1813. [Google Scholar] [CrossRef]
- Punlum, P.; Chaleeraktrakoon, C.; Nguyen, V.T.V. Development of IDF relations for thailand in consideration of the scale-invariance properties of extreme rainfall processes. In Proceedings of the World Environmental and Water Resources Congress, Sacramento, CA, USA, 21–25 May 2017; pp. 634–641. [Google Scholar]
- Chaudhuri, R.R.; Sharma, P. An integrated stochastic approach for extreme rainfall analysis in the National Capital Region of India. J. Earth Syst. Sci. 2021, 130, 1–15. [Google Scholar] [CrossRef]
- Alam, M.A.; Emura, K.; Farnham, C.; Yuan, J. Best-fit probability distributions and return periods for maximum monthly rainfall in Bangladesh. Climate 2018, 6, 9. [Google Scholar] [CrossRef] [Green Version]
- Sherman, C.W. Maximum rates of rainfall at Boston. Trans. Am. Soc. Civ. Eng. 1905, 54, 173–181. [Google Scholar] [CrossRef]
- Gupta, H.V.; Kling, H.; Yilmaz, K.K.; Martinez, G.F. Decomposition of the mean squared error and nse performance criteria: Implications for improving hydrological modelling. J. Hydrol. 2009, 377, 80–91. [Google Scholar] [CrossRef] [Green Version]
- Chen, H.; Yong, B.; Kirstetter, P.E.; Wang, L.; Hong, Y. Global component analysis of errors in three satellite-only global precipitation estimates. Hydrol. Earth Syst. Sci. 2021, 25, 3087–3104. [Google Scholar] [CrossRef]
- Yang, M.; Liu, G.; Chen, T.; Chen, Y.; Xia, C. Evaluation of GPM IMERG precipitation products with the point rain gauge records over Sichuan, China. Atmos. Res. 2020, 246, 105101. [Google Scholar] [CrossRef]
- Kastridis, A.; Theodosiou, G.; Fotiadis, G. Investigation of Flood Management and Mitigation Measures in Ungauged NATURA Protected Watersheds. Hydrology 2021, 8, 170. [Google Scholar] [CrossRef]
- Koutsoyiannis, D.; Baloutsos, G. Analysis of a Long Record of Annual Maximum Rainfall in Athens, Greece, and Design Rainfall Inferences. Nat. Hazards 2000, 22, 29–48. [Google Scholar] [CrossRef]
- Trang, H.T.; Manomaiphiboon, K.; Singhrattna, N.; Assareh, N. Evaluation of multiple sub-daily satellite precipitation products for Thailand. J. Sustain. Energy. Environ. 2020, 11, 81–91. [Google Scholar]
- Jiang, S.; Ren, L.; Xu, C.; Yong, B.; Yuan, F.; Liu, Y.; Yang, X.; Zeng, X. Statistical and hydrological evaluation of the latest Integrated Multi-satellitE Retrievals for GPM (IMERG) over a midlatitude humid basin in South China. Atmos. Res. 2018, 214, 418–429. [Google Scholar] [CrossRef]
- Le, M.H.; Lakshmi, V.; Bolten, J.; Bui, D.D. Adequacy of Satellite-derived Precipitation Estimates for hydrological modeling in Vietnam basins. J. Hydrol. 2020, 586, 124820. [Google Scholar] [CrossRef]
- Nguyen, L.B. Accuracy of Integrated Multi-SatelliE Retrievals for GPM Satellite Rainfall Product over North Vietnam. Polish J. Environ. Stud. 2021, 30, 5657–5667. [Google Scholar] [CrossRef]
- Da Silva, N.A.; Webber, B.G.; Matthews, A.J.; Feist, M.M.; Stein, T.H.; Holloway, C.E.; Abdullah, M.F. Validation of GPM IMERG extreme precipitation in the Maritime Continent by station and radar data. Earth Space Sci. 2021, 8, e2021EA001738. [Google Scholar] [CrossRef]
- Ramadhan, R.; Marzuki, M.; Yusnaini, H.; Muharsyah, R.; Suryanto, W.; Sholihun, S.; Vonnisa, M.; Battaglia, A.; Hashiguchi, H. Capability of GPM IMERG Products for Extreme Precipitation Analysis over the Indonesian Maritime Continent. Remote Sens. 2022, 14, 412. [Google Scholar] [CrossRef]
- Wang, H.; Yong, B. Quasi-Global evaluation of IMERG and GSMaP precipitation products over land usinggauge observations. Water 2020, 12, 243. [Google Scholar] [CrossRef] [Green Version]
- Iqbal, Z.; Shahid, S.; Ahmed, K.; Ismail, T.; Ziarh, G.F.; Chung, E.S.; Wang, X. Evaluation of CMIP6GCM rainfall in mainland Southeast Asia. Atmos. Res. 2021, 254, 105525. [Google Scholar] [CrossRef]
Figure 1.
Location of Yangon in the map of Myanmar. The locations for rainfall intensity–duration–frequency curve generation are also shown on the map of Yangon.
Figure 1.
Location of Yangon in the map of Myanmar. The locations for rainfall intensity–duration–frequency curve generation are also shown on the map of Yangon.

Figure 2.
The flowchart of the procedure employed in the present study.

Figure 3.
(a) Box plot; (b) Taylor diagram; (c) density plot of observed and satellite daily rainfall during 2015–2018.
Figure 3.
(a) Box plot; (b) Taylor diagram; (c) density plot of observed and satellite daily rainfall during 2015–2018.

Figure 4.
Scatter plots of satellite-based daily precipitation datasets of (a) IMERG; (b) GSMaP_NRT; (c) GSMaP_GC; and (d) TRMM compared to observation.
Figure 4.
Scatter plots of satellite-based daily precipitation datasets of (a) IMERG; (b) GSMaP_NRT; (c) GSMaP_GC; and (d) TRMM compared to observation.

Figure 5.
IDF Curves at YIA using satellite and observed precipitation datasets for 2015–2020.

Figure 6.
IDF Curves at YIA using satellite and observed precipitation datasets for 2015–2020 based on the Sherman method.
Figure 6.
IDF Curves at YIA using satellite and observed precipitation datasets for 2015–2020 based on the Sherman method.

Figure 7.
Percent difference (%) in IDF curves estimated using GEV, MLE, and the Sherman method for IMERG. The white color represents less difference while the red color represents a high difference.
Figure 7.
Percent difference (%) in IDF curves estimated using GEV, MLE, and the Sherman method for IMERG. The white color represents less difference while the red color represents a high difference.

Figure 8.
The IMERG bias-corrected IDF curves at four study locations of Yangon.


Table 1.
List of satellite rainfall data used in the present study.
| Dataset | Temporal Resolution | Spatial Resolution | Period |
|---|---|---|---|
| IMERG [39] | 30 min | 0.1° × 0.1° | 2000–Present |
| GSMaP_NRT [33] | 1 h | 0.1° × 0.1° | 2000–Present |
| GSMaP_GC [40] | 1 h | 0.1° × 0.1° | 2000–Present |
| TRMM [41] | 3 h | 0.25° × 0.25° | 1998–2019 |
Table 2.
Probability distribution functions used to fit satellite rainfall data in the present study.
Table 2.
Probability distribution functions used to fit satellite rainfall data in the present study.
| Function | Equation | Parameter |
|---|---|---|
| GEV | k: shape μ: location σ: scale | |
| Gumbel | ||
| GP | ||
| Log Pearson-III | : shape : location |
Table 3.
Statistical indices used for the performance evaluation of satellite precipitation data.
| Index | Range | Optimum Value |
|---|---|---|
| 0 to 1 | 1 | |
| 0 | ||
| −∞ to 1 | 1 | |
| −∞ to +∞ | 0 | |
| −∞ to ∞ | 1 |
Table 4.
Performance of different satellite rainfall data in replicating observed daily rainfall in Yangon International Airport.
Table 4.
Performance of different satellite rainfall data in replicating observed daily rainfall in Yangon International Airport.
| Metrics | GSMaP_GC | GSMaP_NRT | IMERG | TRMM |
|---|---|---|---|---|
| RMSE | 12.91 | 13.75 | 18.44 | 12.4 |
| PBIAS% | 33.0 | −9.4 | −66.9 | 145.0 |
| rSD | 1.78 | 1.0 | 0.44 | 2.76 |
| R2 | 0.12 | 0.22 | 0.22 | 0.19 |
| KGE | −0.07 | 0.47 | −0.02 | −1.35 |
Bold number represents the best performance.
Table 5.
Negative log-likelihood values for Yangon International Airport (YIA).
| Negative Log-Likelihood Statistics (MLE Estimator) | |||||||||||
|---|---|---|---|---|---|---|---|---|---|---|---|
| Distribution | Duration (hour) | ||||||||||
| 0.5 | 1 | 1.5 | 2 | 3 | 6 | 12 | 24 | 36 | 48 | 72 | |
| GEV | 105.6 | 118.8 | 126.2 | 129.4 | 133.2 | 136.3 | 135.9 | 136.9 | 136.2 | 137.9 | 141.9 |
| Gumbel | 105.8 | 119.3 | 126.4 | 129.6 | 133.2 | 136.4 | 135.9 | 137.3 | 137.0 | 138.3 | 142.3 |
| GP | 108.1 | 118.4 | 127.4 | 130.9 | 135.8 | 141.1 | 143.9 | 153.9 | 143.3 | 146.7 | 151.1 |
| LP3 | 151.1 | 151.1 | 151.1 | 151.1 | 151.1 | 151.1 | 151.1 | 151.1 | 151.1 | 151.1 | 151.1 |
Bold numbers indicate the lowest value.
Table 6.
Observed and IMERG rainfall intensity for different durations and return periods and their difference.
Table 6.
Observed and IMERG rainfall intensity for different durations and return periods and their difference.
| Rainfall Intensity (mm) | |||||||||
|---|---|---|---|---|---|---|---|---|---|
| Observed (2015–2020) | IMERG | Difference | |||||||
| Durations | 24 h | 48 h | 72 h | 24 h | 48 h | 72 h | 24 h | 48 h | 72 h |
| 2 Year ARI | 17.97 | 13.47 | 11.61 | 14.42 | 9.21 | 7.46 | 3.5 | 4.3 | 4.2 |
| 5 Year ARI | 24.12 | 17.94 | 15.48 | 19.05 | 11.63 | 9.39 | 5.1 | 6.3 | 6.1 |
| 10 Year ARI | 26.43 | 19.75 | 16.99 | 21.71 | 13.01 | 10.50 | 4.7 | 6.7 | 6.5 |
| 25 Year ARI | 28.20 | 21.23 | 18.18 | 24.67 | 14.55 | 11.73 | 3.5 | 6.7 | 6.4 |
| 50 Year ARI | 29.01 | 21.95 | 18.73 | 26.60 | 15.55 | 12.53 | 2.4 | 6.4 | 6.2 |
| 100 Year ARI | 29.54 | 22.45 | 19.10 | 28.33 | 16.44 | 13.25 | 1.2 | 6.0 | 5.8 |
Publisher’s Note: MDPI stays neutral with regard to jurisdictional claims in published maps and institutional affiliations. |
© 2022 by the authors. Licensee MDPI, Basel, Switzerland. This article is an open access article distributed under the terms and conditions of the Creative Commons Attribution (CC BY) license (https://creativecommons.org/licenses/by/4.0/).
Share and Cite
MDPI and ACS Style
Kyaw, A.K.; Shahid, S.; Wang, X. Remote Sensing for Development of Rainfall Intensity–Duration–Frequency Curves at Ungauged Locations of Yangon, Myanmar. Water 2022, 14, 1699. https://doi.org/10.3390/w14111699
AMA Style
Kyaw AK, Shahid S, Wang X. Remote Sensing for Development of Rainfall Intensity–Duration–Frequency Curves at Ungauged Locations of Yangon, Myanmar. Water. 2022; 14(11):1699. https://doi.org/10.3390/w14111699
Chicago/Turabian StyleKyaw, Aung Kyaw, Shamsuddin Shahid, and Xiaojun Wang. 2022. "Remote Sensing for Development of Rainfall Intensity–Duration–Frequency Curves at Ungauged Locations of Yangon, Myanmar" Water 14, no. 11: 1699. https://doi.org/10.3390/w14111699
Note that from the first issue of 2016, this journal uses article numbers instead of page numbers. See further details here.