
Water Stress Thresholds and Evaluation of Coefficient Ks for Perennial Ryegrass in Tropical Conditions


1
Corporación Colombiana de Investigación Agropecuaria—AGROSAVIA, Centro de Investigación Tibaitatá—Km 14 Vía Mosquera, Bogotá 250047, Colombia
2
Research Institute of Water and Environmental Engineering (IIAMA), Universitat Politècnica de València, 46022 Valencia, Spain
*
Author to whom correspondence should be addressed.
Water 2022, 14(11), 1696; https://doi.org/10.3390/w14111696
Submission received: 16 April 2022
/
Revised: 11 May 2022
/
Accepted: 20 May 2022
/
Published: 25 May 2022
(This article belongs to the Special Issue Crop Water Stress and Deficit Irrigation)
Abstract
:Perennial ryegrass (Lolium perenne) is the predominant forage crop in the equatorial highland zones of Colombia due to its high nutritional value and versatility to produce both milk and meat. This study aimed to determine the relationship between the relative depletion of usable soil water and the Ks values of canopy expansion and closure stomatal of perennial ryegrass, as well as to identify the threshold values of water stress. The experiment was carried out in pots under a controlled environment condition. These pots were arranged in a completely randomized manner. The experiment consisted of five treatments—including control treatment—of water deficits in the soil that progressively increased the depletion level as the crop cycle developed. This generated a wide range of conditions in the growth stages. For each treatment, four repetitions were performed Biomass production was significantly affected by water stress. The results show that the upper and lower thresholds of Ks were 0.28 and 1.3 of the depletion level (p) of the total available water (TAW) in the soil for the expansion of the canopy (CE), and 0.25 and 1.1 p of the TAW for stomatal closure (gs). Quadratic functions were fitted for both the CE (R2 = 0.72) and CS (R2 = 0.73); moreover, the Ks function of FAO-AquaCrop with positive shape factor (sf) was as follows: sf = 11, RMSE 0.22 for CE, and sf = 4.3, RMSE 0.19 for gs. Our results indicate that ryegrass is moderately sensitive to water stress. The differences found between the Ks function of FAO and the experimental data call for the need to use modeling with parameters adapted for each case.
1. Introduction
Perennial ryegrass (Lolium perenne) is a cool season species used for pastures and as a forage crop, extensively grown for its high quality and usefulness in livestock production. Perennial ryegrass has a rapid response to stress and is susceptible to extreme environmental conditions such as drought, extreme cold, excessive heat, high salinity, and heavy metal contamination. Its responses to abiotic stress have been characterized at the transcriptomic level, including its response to heat [1], cold [2], and drought [3,4].
Feed quality reduction, leaf senescence, and leaf withering under drought stress are important concerns in the maintenance of perennial ryegrass across a wide range of geographic locations [5,6,7]. The sustainable production of forage requires appropriate maintenance practices for the management of resources and information; a fundamental element is the responsible use of water resources. Therefore, a basic understanding of the effects of hydrological stress on forage production is a requirement for the development of solid water resource management strategies.
Water stress can negatively impact crop production, depending on its intensity and duration; water stress is a dynamic process. Therefore, the plant’s response to certain levels of stress can be used as a diagnostic tool to increase drought tolerance [8]. Water stress occurs in a plant when the transpiration rate exceeds the intake of water in the soil [9]. Under water stress conditions, plants close their stomata to conserve water as a reaction. This reduces the exchange of oxygen, water, and carbon dioxide, decreasing both crop growth and development [10]. Closing the stomata also decreases the rates of transpiration and evaporative cooling used to maintain leaf temperature.
In the equatorial highland zones of Colombia, forage crops are the foundation of cattle production. Perennial ryegrass is one of the most important forage crops in the savannah region of Bogota. This region is considered an appropriate region for growing forage crops such as ryegrass, depending on their adaptability to the climate, which has an annual precipitation of 627–1121 mm, and a median annual temperature of 11.1–15.4 °C [11,12]. With a pattern of insufficient rainfall, seasonal drought places serious water stress on the growth of ryegrass from December to February and July to August. The meteorological record from 1995–2021 shows that 66% of precipitation occurs from April to June and September to November. Without irrigation, the water in the soil profile becomes the essential source of water for the ryegrass to survive and produce a high forage yield.
The studies that describe the effects of water stress in the cultivation of perennial ryegrass in the Colombian highlands are limited. To identify at what point the plant limits its growth is an important contribution to the selection of cultivars capable of coping with short-term water limitation. These cultivars can also be used to improve biomass production in future climatic conditions. Water stress can be quantified using the stress coefficient Ks, as suggested by the Food and Agriculture Organization of the United Nations. Ks is dependent on the water content in the root zone, which is expressed as the fractional depletion (p) of the total available water (TAW) in the soil. Its values range from the lower to the upper thresholds of soil water content specific to each plant [13].
Despite extensive research in perennial ryegrass physiological responses to drought [14,15,16,17,18], currently there are no identified thresholds in the processes of reduced canopy expansion, stomatal closure, or early presence of canopy senescence linked to water stress in this species. While plant responses to water limitations have generally been well described, the adoption of irrigation practices requires accurate measures of cultivar-specific responses to water limitations. Most studies have considered water stress threshold values to be constant throughout the growth period. However, plants show different degrees of sensitivity to water during different growth stages, which many studies have not considered. A new approach is therefore needed to solve this problem. We propose an experimental method that allows for simultaneously considering the impact of soil water on canopy expansion and stomatal closure at different stages of crop growth and obtaining the threshold values (upper and lower) of soil water content.
This study addresses measurements of a wide range of concurrent soil water deficits achieved over a range of growth stages conditions, which represents the robustness of the results, so far lacking in the scientific literature.
Data for the study were collected in a greenhouse experiment by testing cultivar Bestfor Plus, commonly used in the highland zones of Colombia. We preferred a study using potted plants in a controlled environment to field research because we had greater control over abiotic and biotic factors [19,20]. Consequently, such studies are generally more reproducible and repeatable, with results that are simpler to interpret [21,22].
Therefore, this study evaluated the dynamics of water stress in the cultivation of perennial ryegrass under controlled greenhouse conditions. Its main objectives were (1) to analyze the effect of water stress throughout the developmental stages of the crop; (2) to determine the upper and lower thresholds of water stress which cause developmental effects on the crop—including canopy reduction and stomatal closure; and (3) provide information for the optimization of the irrigation of ryegrass crops, thus determining the acceptable stress for an effective water–yield relationship.
2. Materials and Methods
2.1. Plant Material and Growth Conditions
The pot experiment was performed under controlled conditions at the Colombian Agricultural Research Corporation (Agrosavia) in Cundinamarca, Colombia. The study area was at latitude 4°42′ N and longitude 74°12′ W, with an elevation of 2543 m. The greenhouse was 8 m × 7 m × 5 m and covered with tempered glass, which allowed for 95% transmission of sunlight.
The roof of the greenhouse was sloped at an angle of 37° to the horizontal. The temperature and relative humidity inside the greenhouse were recorded using an iMetos weather station. We used a type A tank to measure direct evaporation.
During the study, the greenhouse interior climate was monitored, the maximum average daily temperature was 29.1 °C, and the minimum air temperature was 4.6 °C. Additionally, the atmospheric relative humidity varied between 48.3% and 82.4%. The average daily solar radiation was 2134 MJm2 d−1, according to the iMetos meteorological station.
We used ryegrass seeds from the cultivar Best for Plus with a sowing rate of 50 kg ha−1. We sowed the seeds within the recommended time for the study area. Since ryegrass is a perennial crop, the effect of water stress was evaluated in two cultivation cycles. The first cycle was from sowing to the first cut (15 August 2012–28 November 2012). The second cycle was from the first cut to the second cut (28 November 2012–30 January 2013).
We used 24 pots, which were randomly placed in the greenhouse. Pots made of polyvinyl chloride (PVC), with a depth of 30 cm and a diameter of 30 cm were selected for this experiment. An 8 m (length) by 7 m (width) space in the greenhouse was utilized to place pots in three rows, maintaining a row-to-row distance of 60 cm and a plant-to-plant distance of 10 cm. An aseptic tray was placed at the bottom of the pots so that excess water could be drained and measured with a graduated cylinder.
We used undisturbed soil from the Agrosavia Tibaitatá Research Center to fill the pots. The soil was a sandy loam, with 38% sand, 32% silt, and 30% clay. The soil also had a 50.69% field capacity and a 20.68% wilting point by volume.
We used the gravimetric method to determine the water retention capacity of the soil, as well as to define the humidity levels of the treatments. The water balance of each pot was calculated daily; the pots were weighed both before watering and after free drainage stopped.
The pots were watered with the same amount of water until 90% crop emergence was reached, at which point the stress treatments began. The fertilizer applications were performed based on the requirements derived from a soil chemical analysis. The fertilization was performed based on the existing levels of N, P, and K determined from the soil tests. In addition, magnesium sulfate was applied twice during the crop cycle.
2.2. Experimental Design
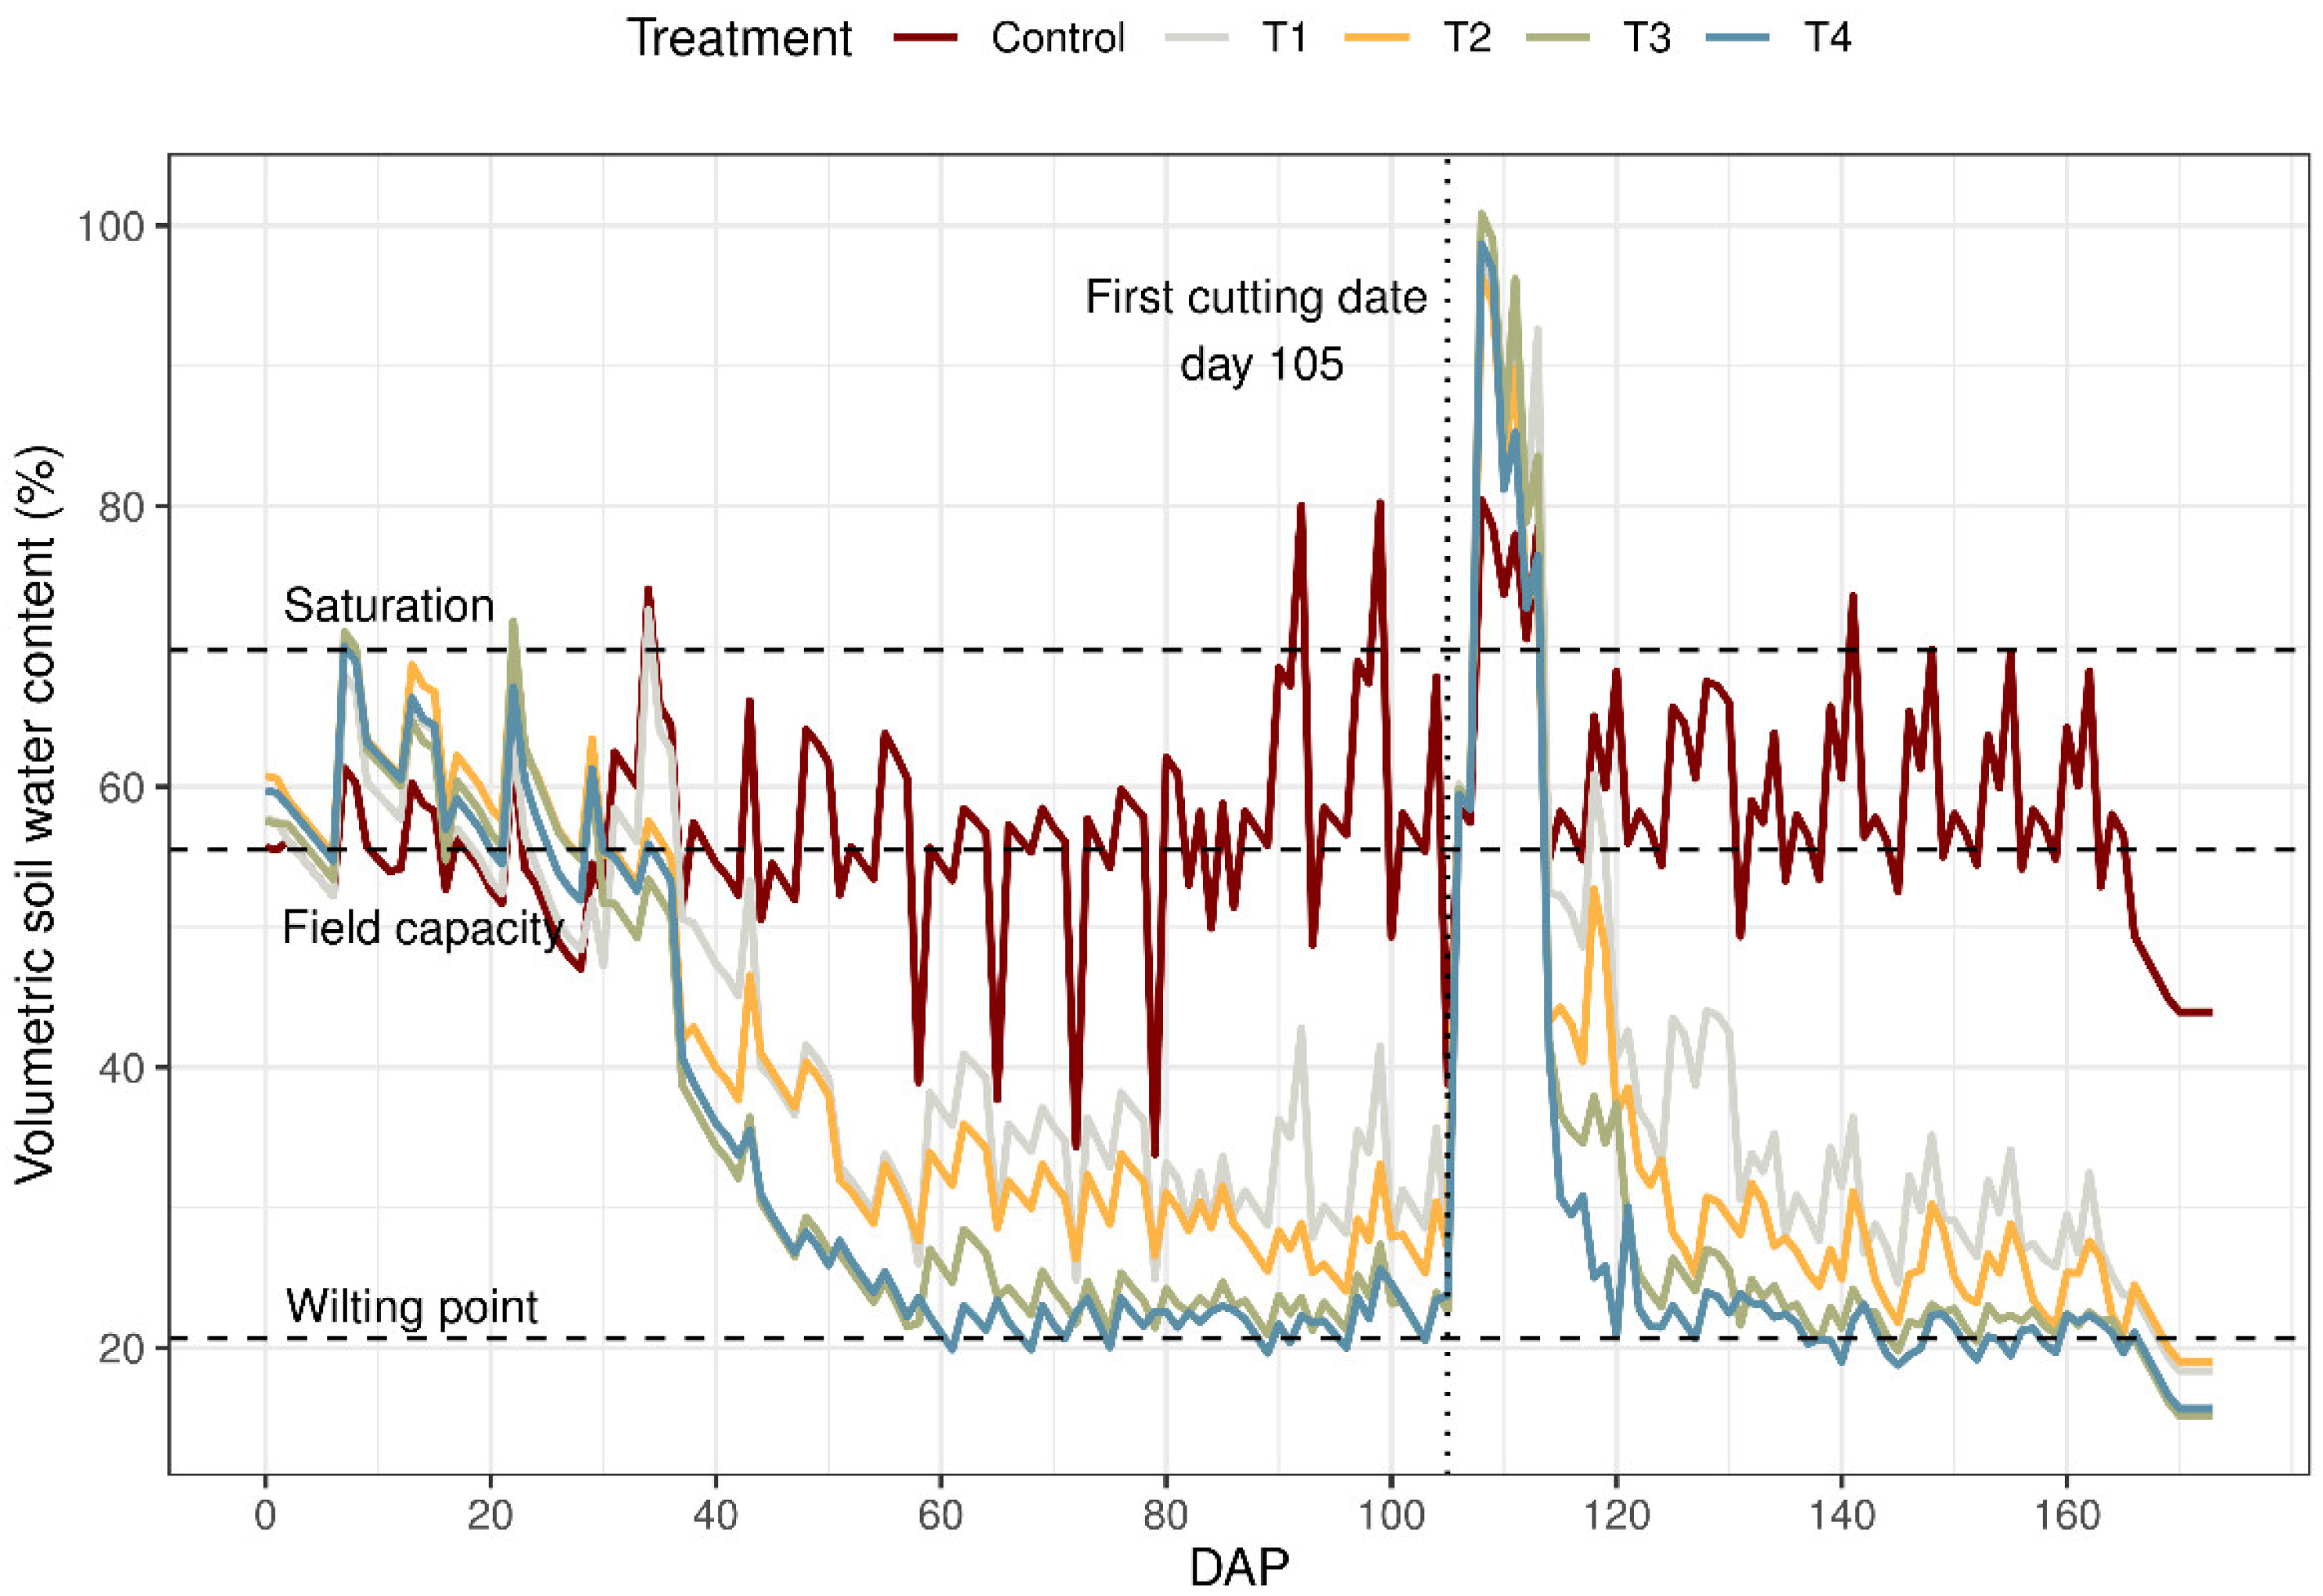
The experiment was completely randomized with five treatments, including the control. The treatments simulated different water stress gradients according to Terán-Chaves [23]. Figure 1 shows the volumetric soil water content (%) during the experimental period for the five irrigation treatments. This study included two moderate water stress treatments—T1 moderate–low water stress treatment and T2 moderate–high water stress treatment—as well as two severe water stress treatments—T3 medium intensity severe water stress treatment and T4 high intensity severe water stress treatment. A non-stressed treatment was used as the control. The soil moisture for the control without stress was maintained at 90–100% of the field capacity for the entire season. In the greenhouse experiment, there was a single factor (water stress) with 5 levels (i.e., 5 treatments), 4 replications, and a total of 20 experimental units (20 potted). Additionally, 4 pots were used to determine the direct daily water evaporation from the soil.
We evaluated four response variables: canopy cover (cc), plant height (ph), leaf width (lw), stomatal conductance (gs), and the wet and dry biomasses (wm and dm).
We watered each treatment considering the difference between the field capacity and the level of water depletion that day. The irrigation water needed daily was calculated from the water balance values for each pot using an Excel-based irrigation tool. Moreover, the pots were weighed once per week to adjust the volumes of water lost by evapotranspiration. We gradually increased the level of soil water depletion (p). For instance, if, during three consecutive readings, at least two of the four response variables varied by less than 25%, we assumed that the crop had acclimatized and, therefore, increased p to the next level.
The advantage of this experiment is that, by generating different levels of water stress during the crop’s developmental stages (Table 1 and Table 2), it is possible to monitor the intensity of and exposure time to hydrological stress throughout the crop cycle. This allows us to determine the response variables to express the upper and lower thresholds independently from the period of the crop cycle in which the water limitations occur.
2.3. Measuring the Crop’s Response Variables to Water Stress
To measure the canopy cover (cc), aerial images were taken of each pot three times per week using a Canon PowerShot G10 14.7 MP resolution digital camera and captured in JPG format. The digital images were analyzed with the free software, CobCal v 2.1 [24], to determine the canopy coverage area (cc, cm2). The plant height (ph) and leaf width (lw) were measured with a tape measure and a digital Vernier caliper, respectively. Stomatal conductance (gs) was measured three times a week in the morning with a Decagon Devices model gs-1 leaf porometer (Decagon Devices, Pullman, WA, USA), with a conductance range between 0 and 1000 mmol m−2 s−1 and 10% accuracy. The dm was measured at the end of the experiment. For this, the aerial biomass was harvested, and the production of wet and dry masses (wm and dm) was measured, where wm is the wet mass of the forage and dm is the estimated weight after drying the forage at 60 °C until reaching a constant weight.
2.4. Determining the Coefficient of Water Stress, Ks
We analyzed the effect of water stress on the development of the ryegrass crop using the approach proposed by the FAO [13]. Unlike other methods that estimate the effect of water stress on photosynthesis, the FAO method investigates the effect of water stress on canopy expansion, early canopy senescence, and reduction in stomatal conductance. To monitor crop development, canopy coverage was used instead of the leaf area index. The effect of water stress on canopy expansion was evaluated in three variables: (a) canopy cover (cc, %); (b) leaf width (lw, mm); and (c) plant height (ph, cm). The water stress coefficient was calculated for each crop stress indicator according to Equation (1). The value of Ks is between 0 (total stress) and 1 (no stress), inclusive.
where Drel (≤1) is the maximum relative stress level, and fexp is the shape factor; fexp > 0 for convex curves.
The shape factor of the Ks curve determines the magnitude of the effect of soil water stress. The shape can be linear, convex, or concave [25].
For each crop water stress variable, we determined the observed Ks value (Ksobs) from the relative distance between the indicator value recorded from the control treatment under conditions where water is not a limiting factor (a potential value of the indicator) and the value of the indicator in treatment i is (Ti), given the conditions of water stress (Equation (2)). As Ks varies between 0 and 1, the canopy growth rate begins to decline from its potential rate when soil water depletion reaches the upper threshold and stops completely when depletion reaches the lower threshold.
where Ksobs is the coefficient of experimental water stress for each indicator (cc, ph, lw, and gs), Ic is the potential value of the indicator at control treatment, and ITi is the value of the indicator under water stress conditions (treatment i = T1–T4).
The fexp parameter of Equation (1) was determined iteratively by finding the lowest RMSE (Equation (3)):
where RMSE is the root mean square error, Ks is the hydrological stress coefficient for the estimated indicator equation, Ksobs is the experimental hydrological stress coefficient, and n is the number of observations.
Thresholds are expressed as a fraction (p) of the total available water (TAW). The TAW is the amount of water that a soil can contain between field capacity (FC) and the wilting point (WP). For the growth of the leaves and, therefore, of the canopy, the threshold is above the WP (p < 1). Regarding stomata and senescence, the lower threshold is set at the WP (p = 1).
2.5. Statistical Analysis
The data were tested for a uniform or normal distribution and evaluated using an analysis of variance (ANOVA) in SAS (version 9.3; SAS Institute, Cary, NC, USA). The significance of the differences between treatments were evaluated using Tukey’s range test at a probability level of 5%.
3. Results
3.1. Crop Water Stress Response Variables
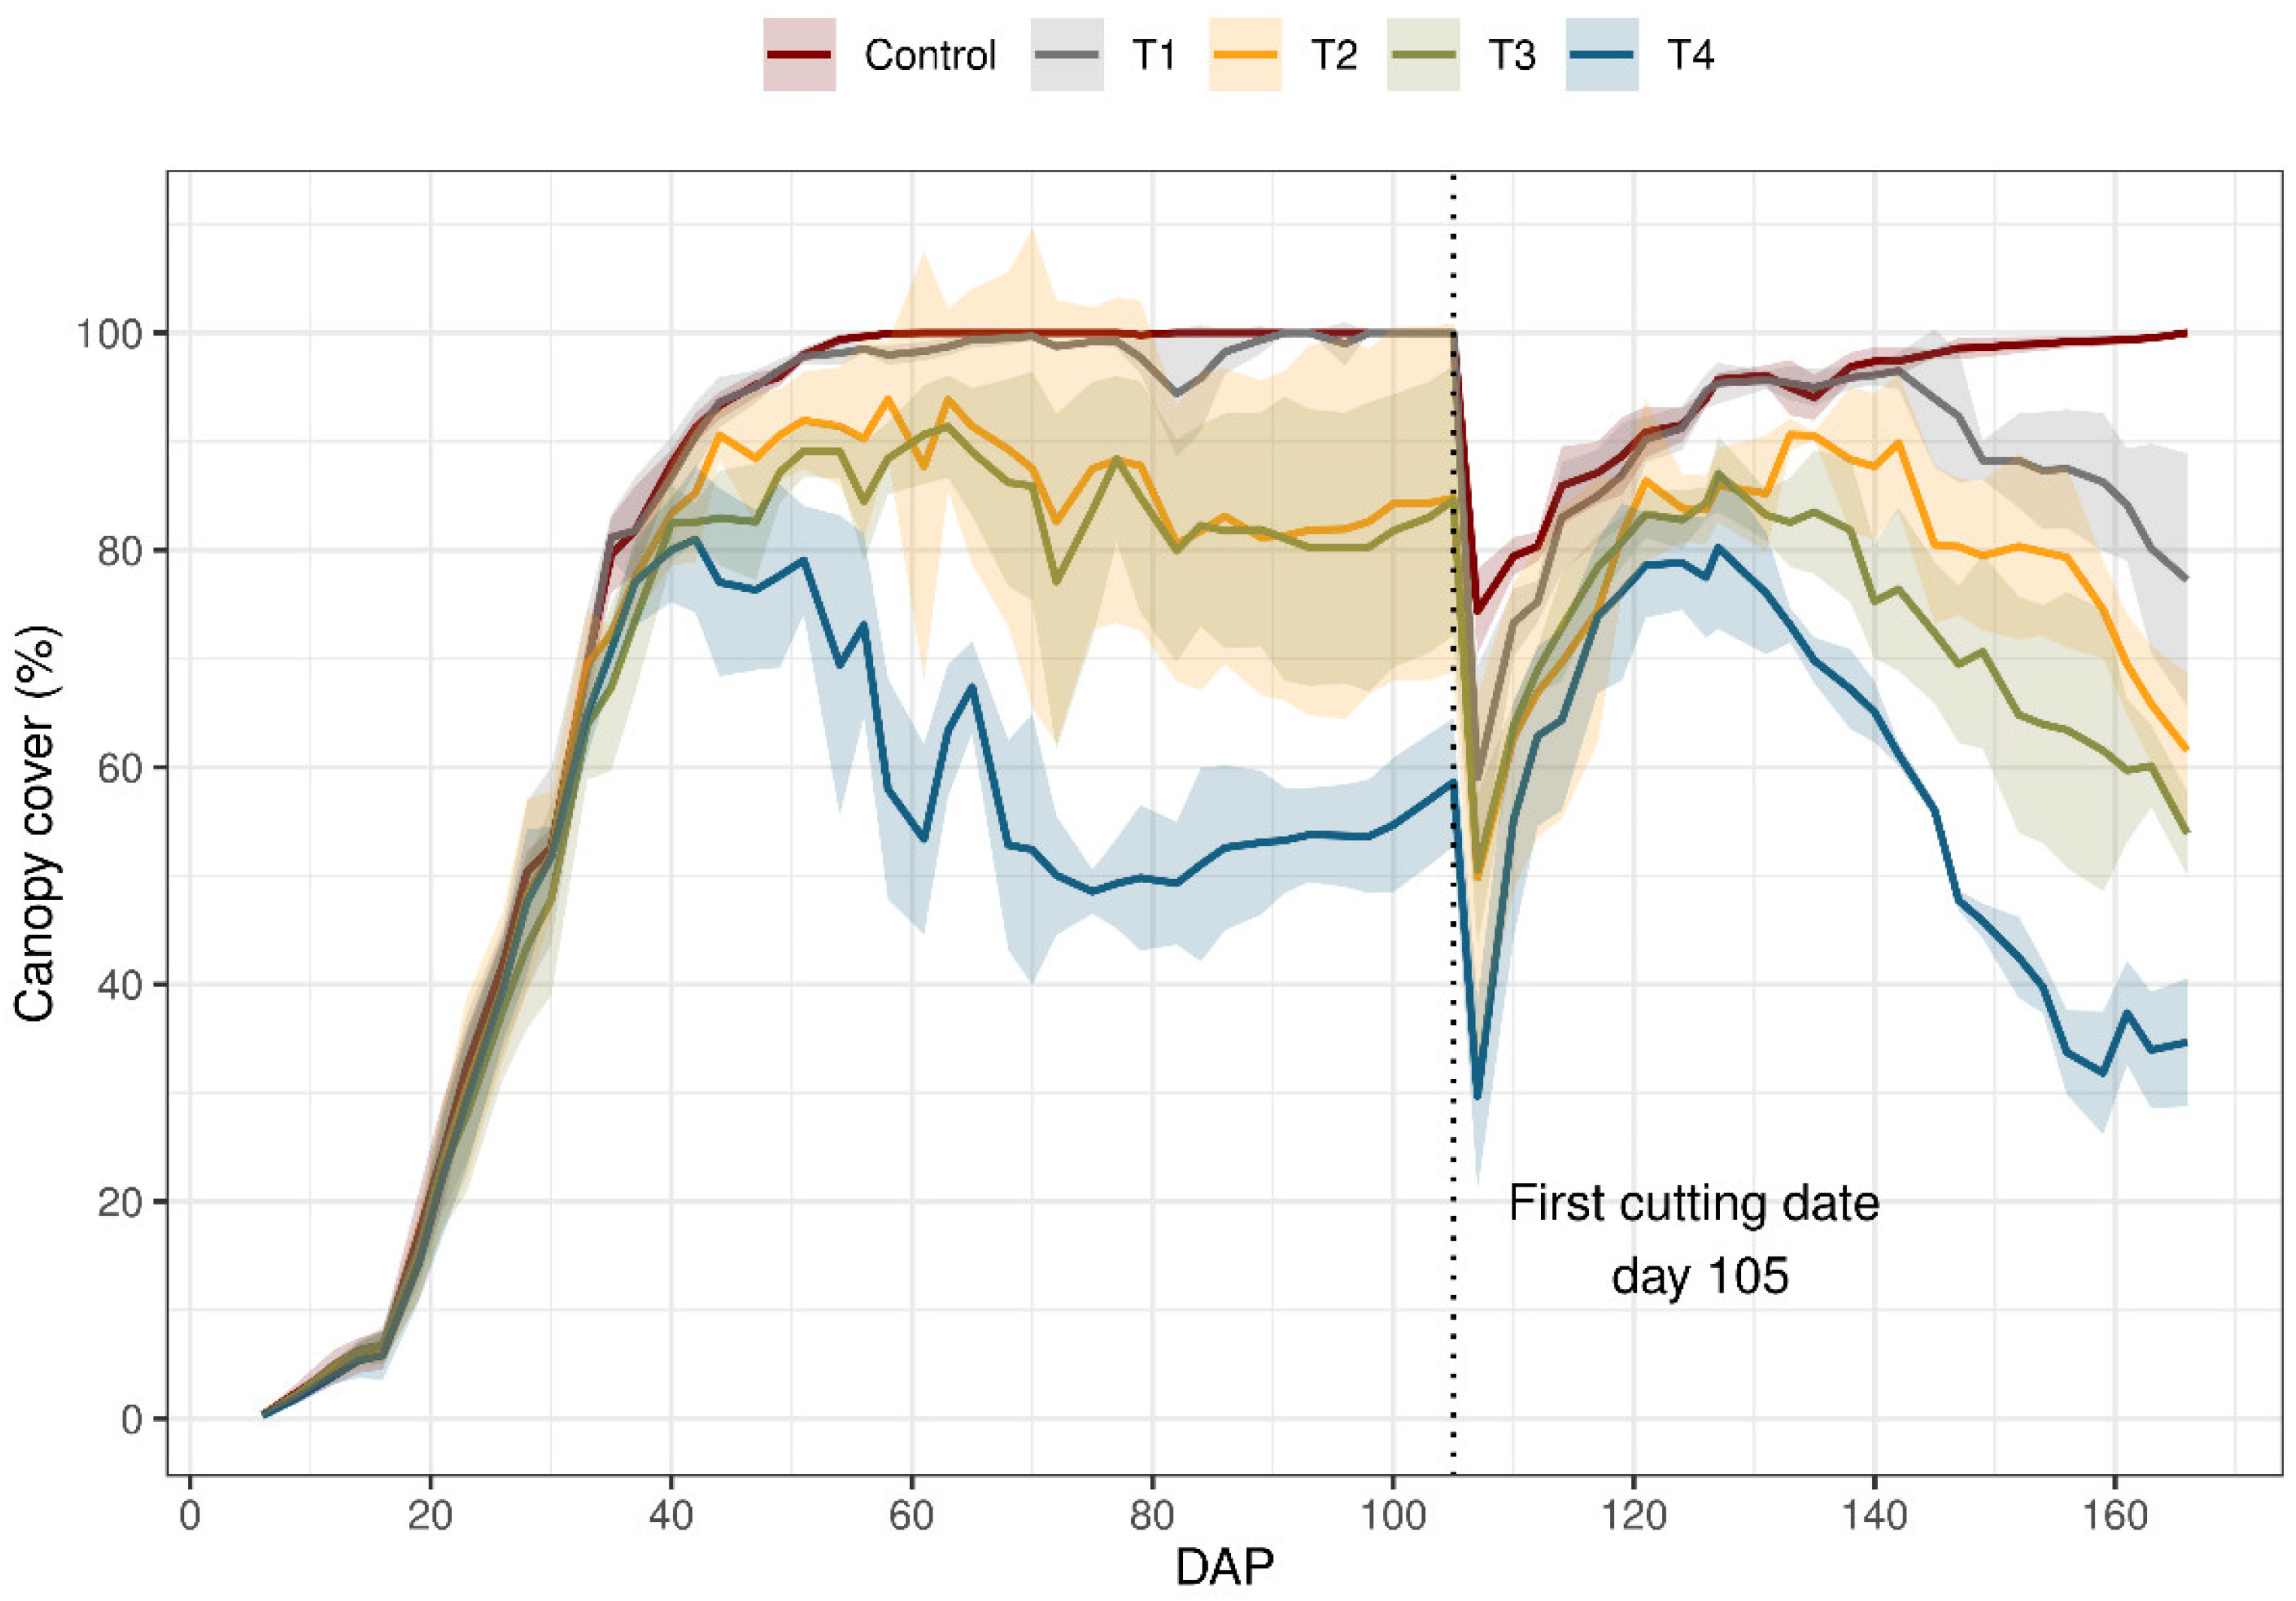
Water stress affected the growth of ryegrass in various stages. The results of the induced stress revealed varying degrees of reduction (%) in cc compared to plants grown under non-stressed conditions (control treatment) (Figure 2). The first cutting was made on day 105, and the bellow results are reported for before the first cut. For T4, the treatment with the highest intensity of water depletion obtained a maximum coverage of 80%, compared to the control treatment. Additionally, it was affected from 41 days after planting (DAP), with a depletion level of 75% TAW. Treatments T2 and T3 reached 90% cc and were severely affected from 66 DAP with 70–90% TAW. Finally, regarding cc, there were significant differences between the control and all the treatments. However, there were no significant differences between T1, T2, and T3.
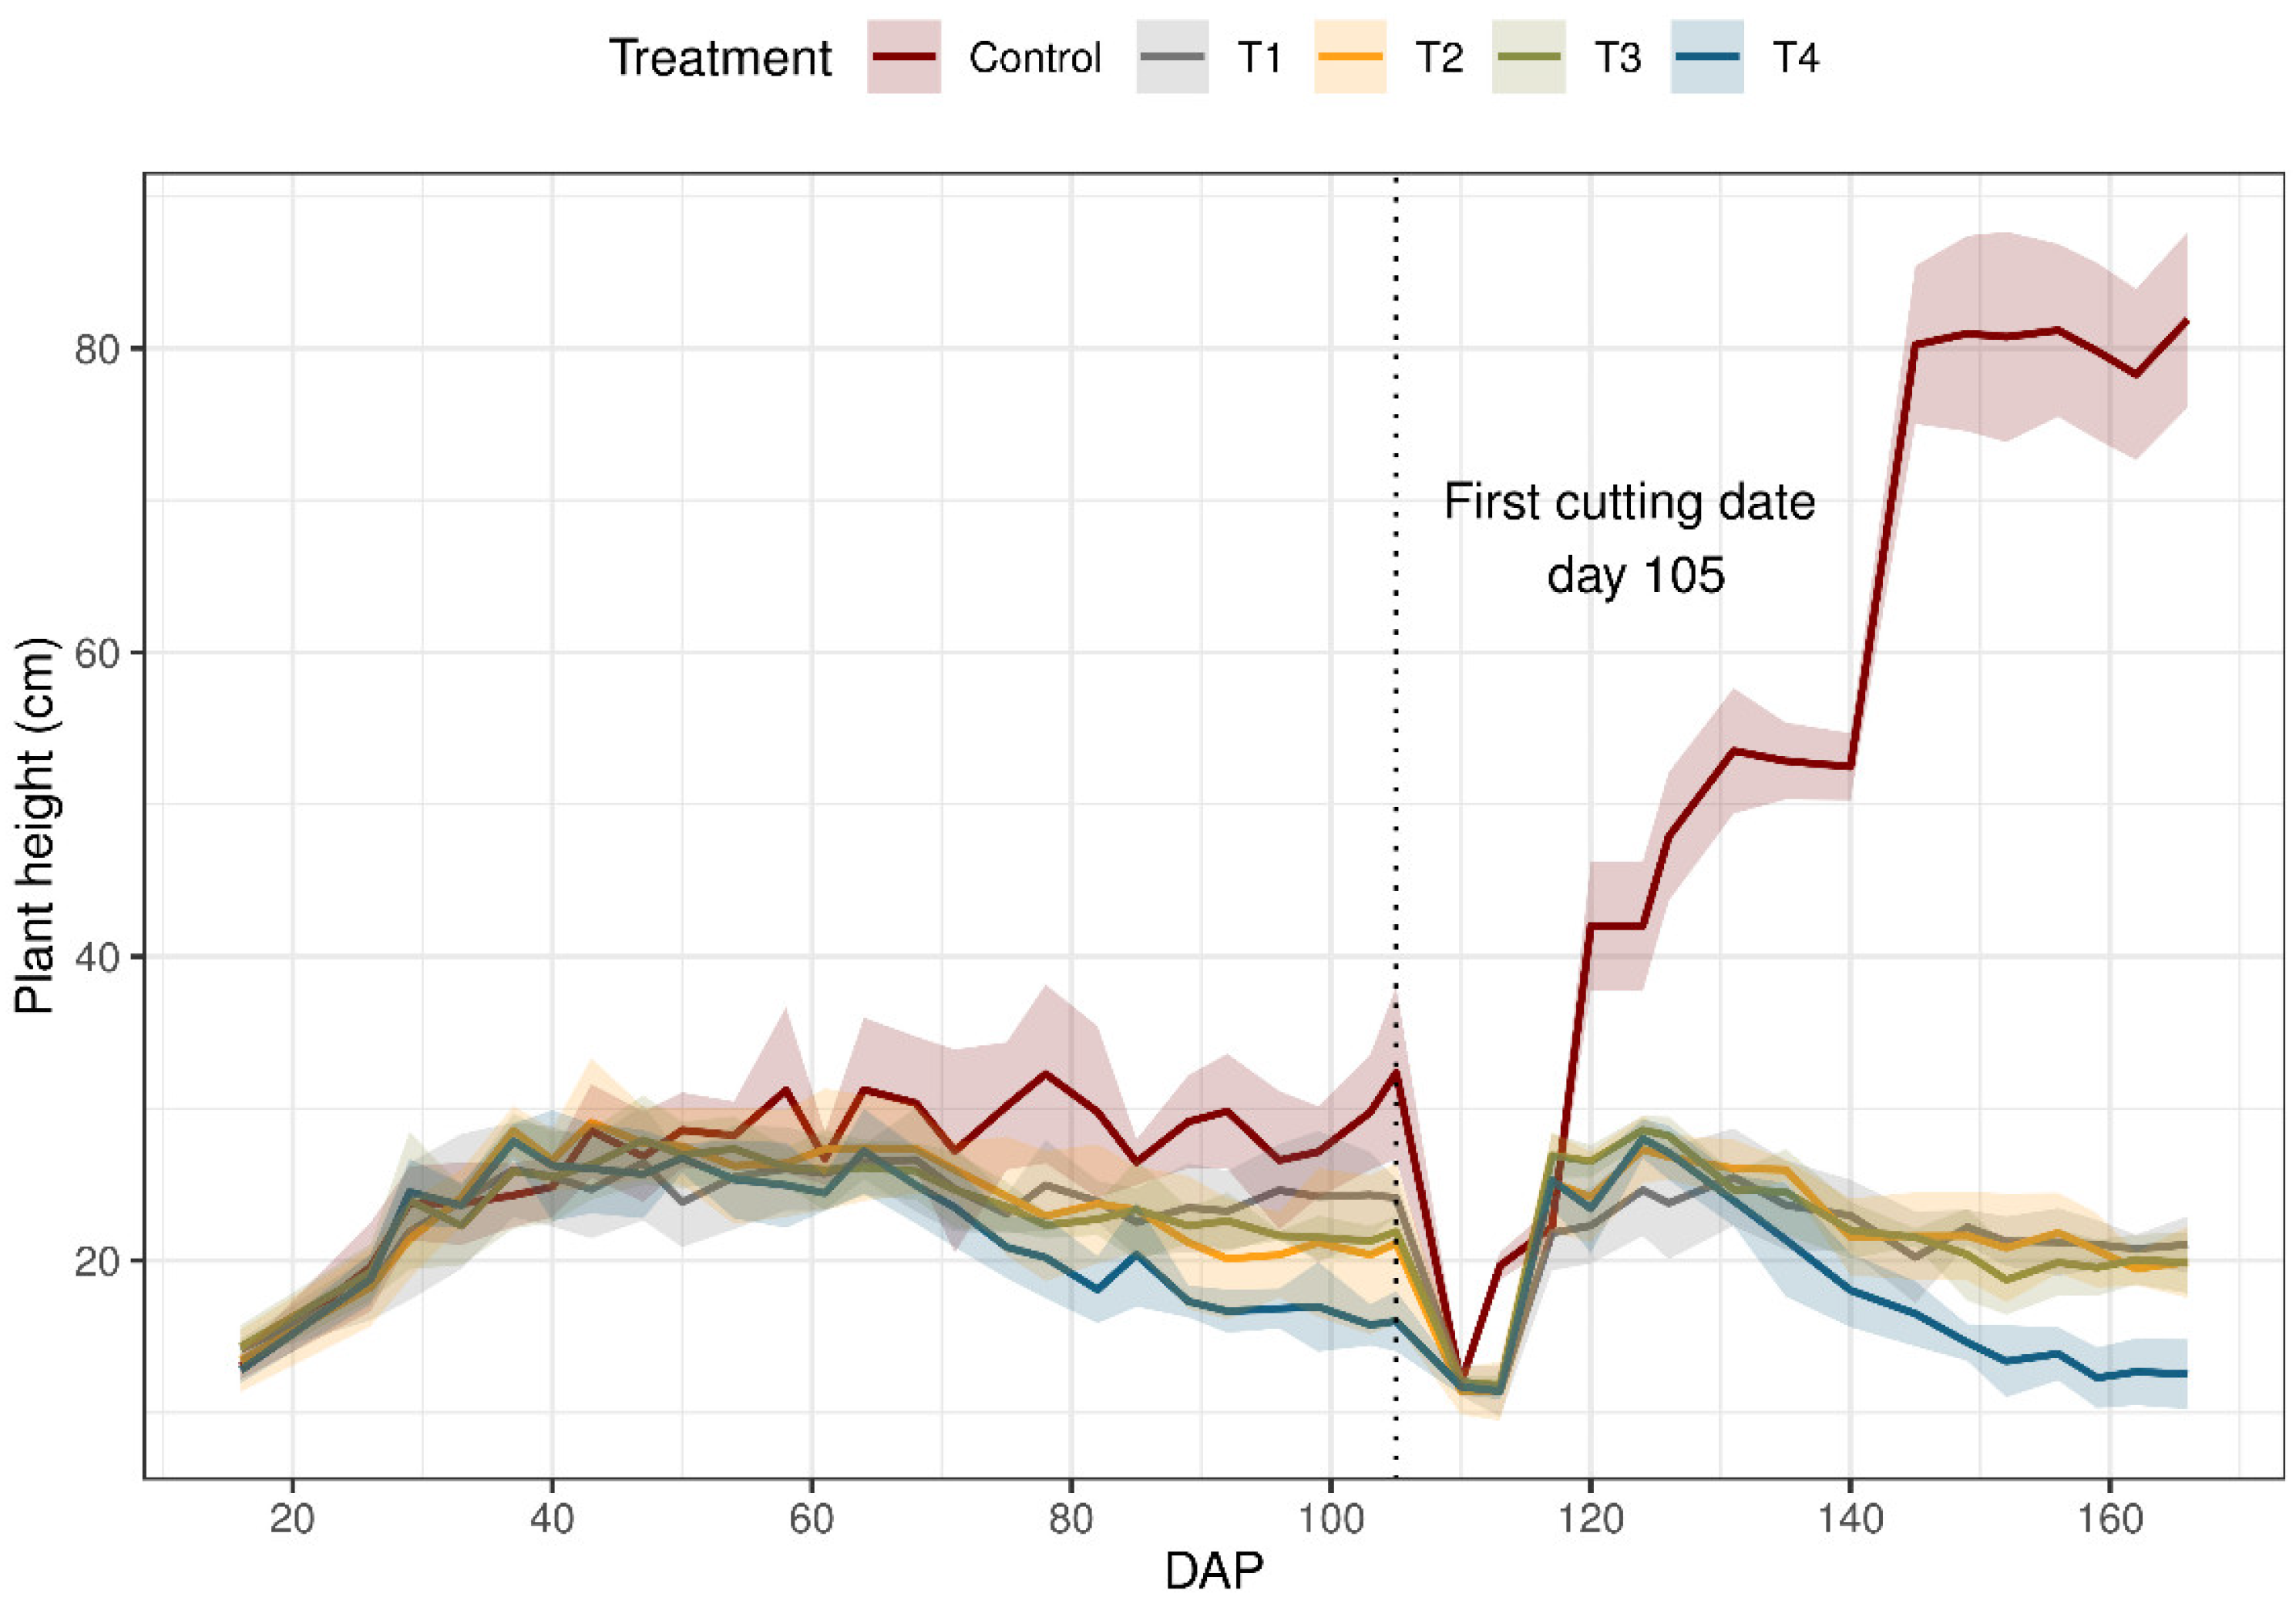
Figure 3 shows the result of average plant heights in all the treatments, with the corresponding DAP. There was a steady but gradual increase in plant height in all the treatments; however, plant height was affected beginning at 65 DAP, where it decreased with the depletion of soil water content levels of between 60% and 96% TAW. The treatment control was clearly distinguished. as the plants were tallest from the observation standpoint when compared with heights from other treatments. At the first cut, the average plant measured were 32.3, 24.1, 21.1, 21.8, and 16.0 cm for the treatments control, T1, T2, T3, and T4 respectively. For ph, there were significant differences between the control and the rest of the treatments. However, the T2 and T3 treatments were not significantly different from each other.
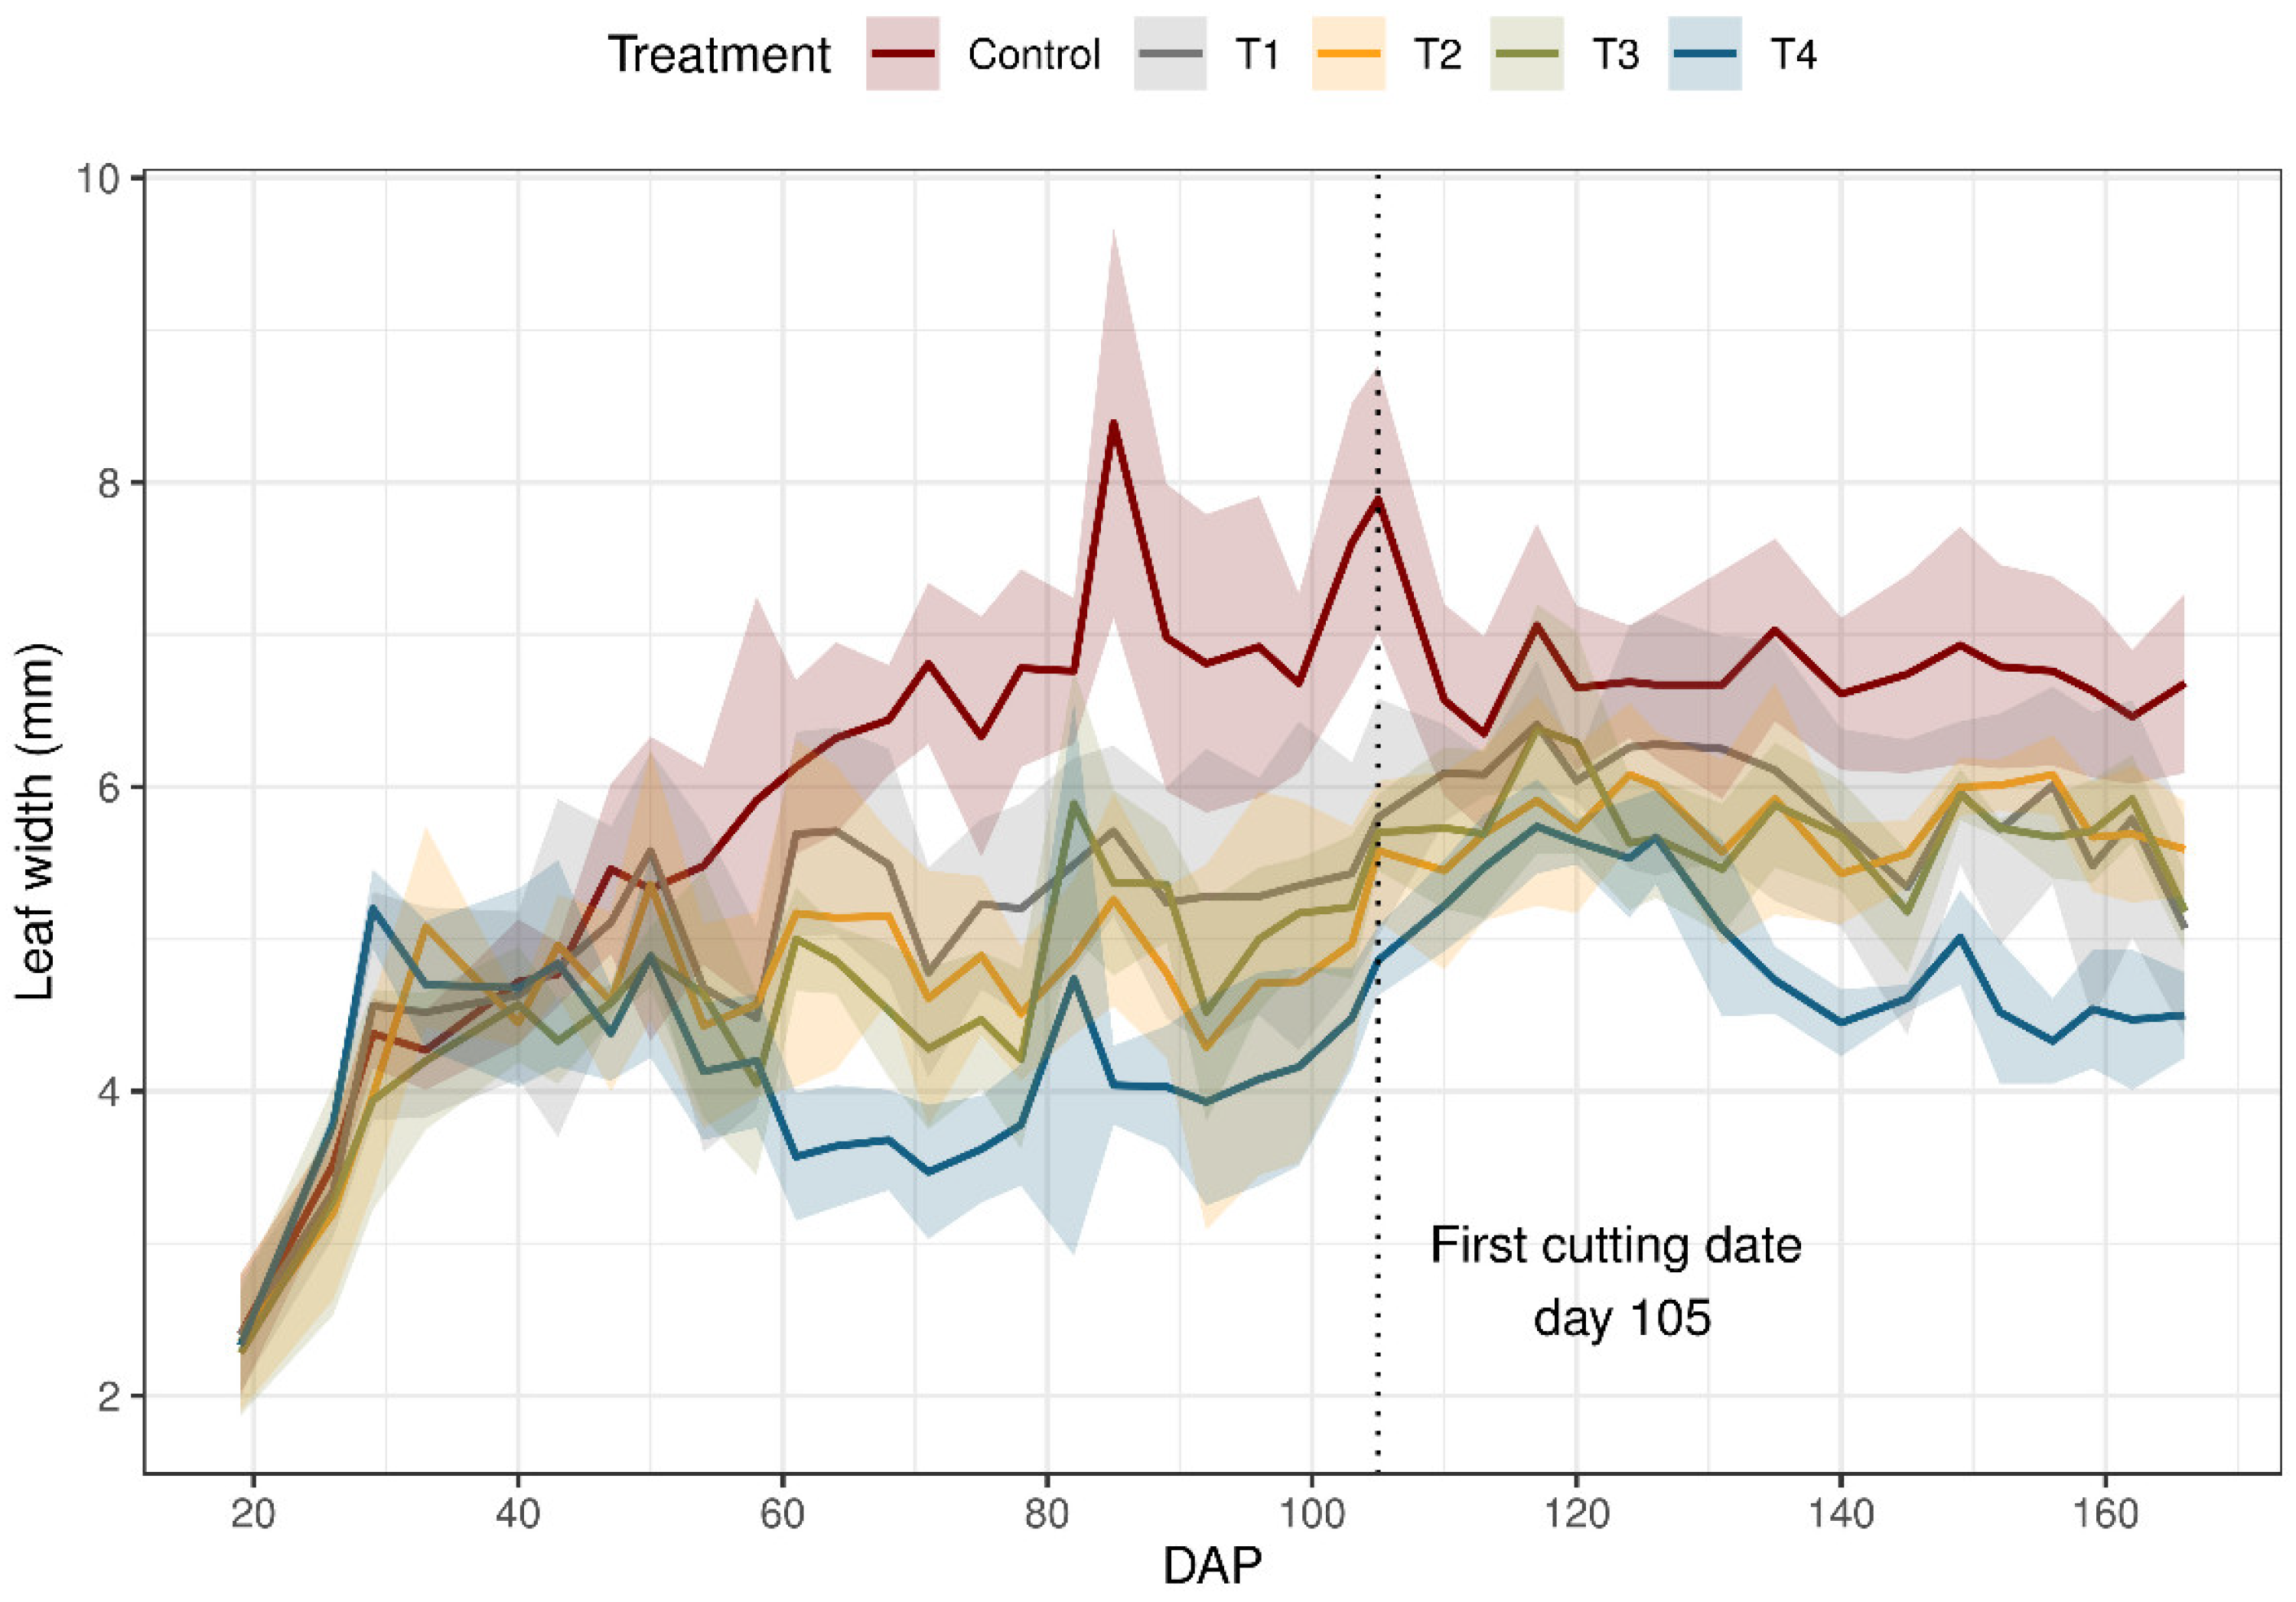
Data concerning the effect of water stress on the leaf width of Lolium perenne plant are plotted in Figure 4. Water application at the beginning growth increased the lw of all the treatments receiving water at this time; lw increased for the control until harvest. However, for T4, lw decreased from 51 DAP with 96% TAW. For lw, although there were significant differences between the control and the rest of the treatments, there were no significant differences between the treatments T1 and T4.
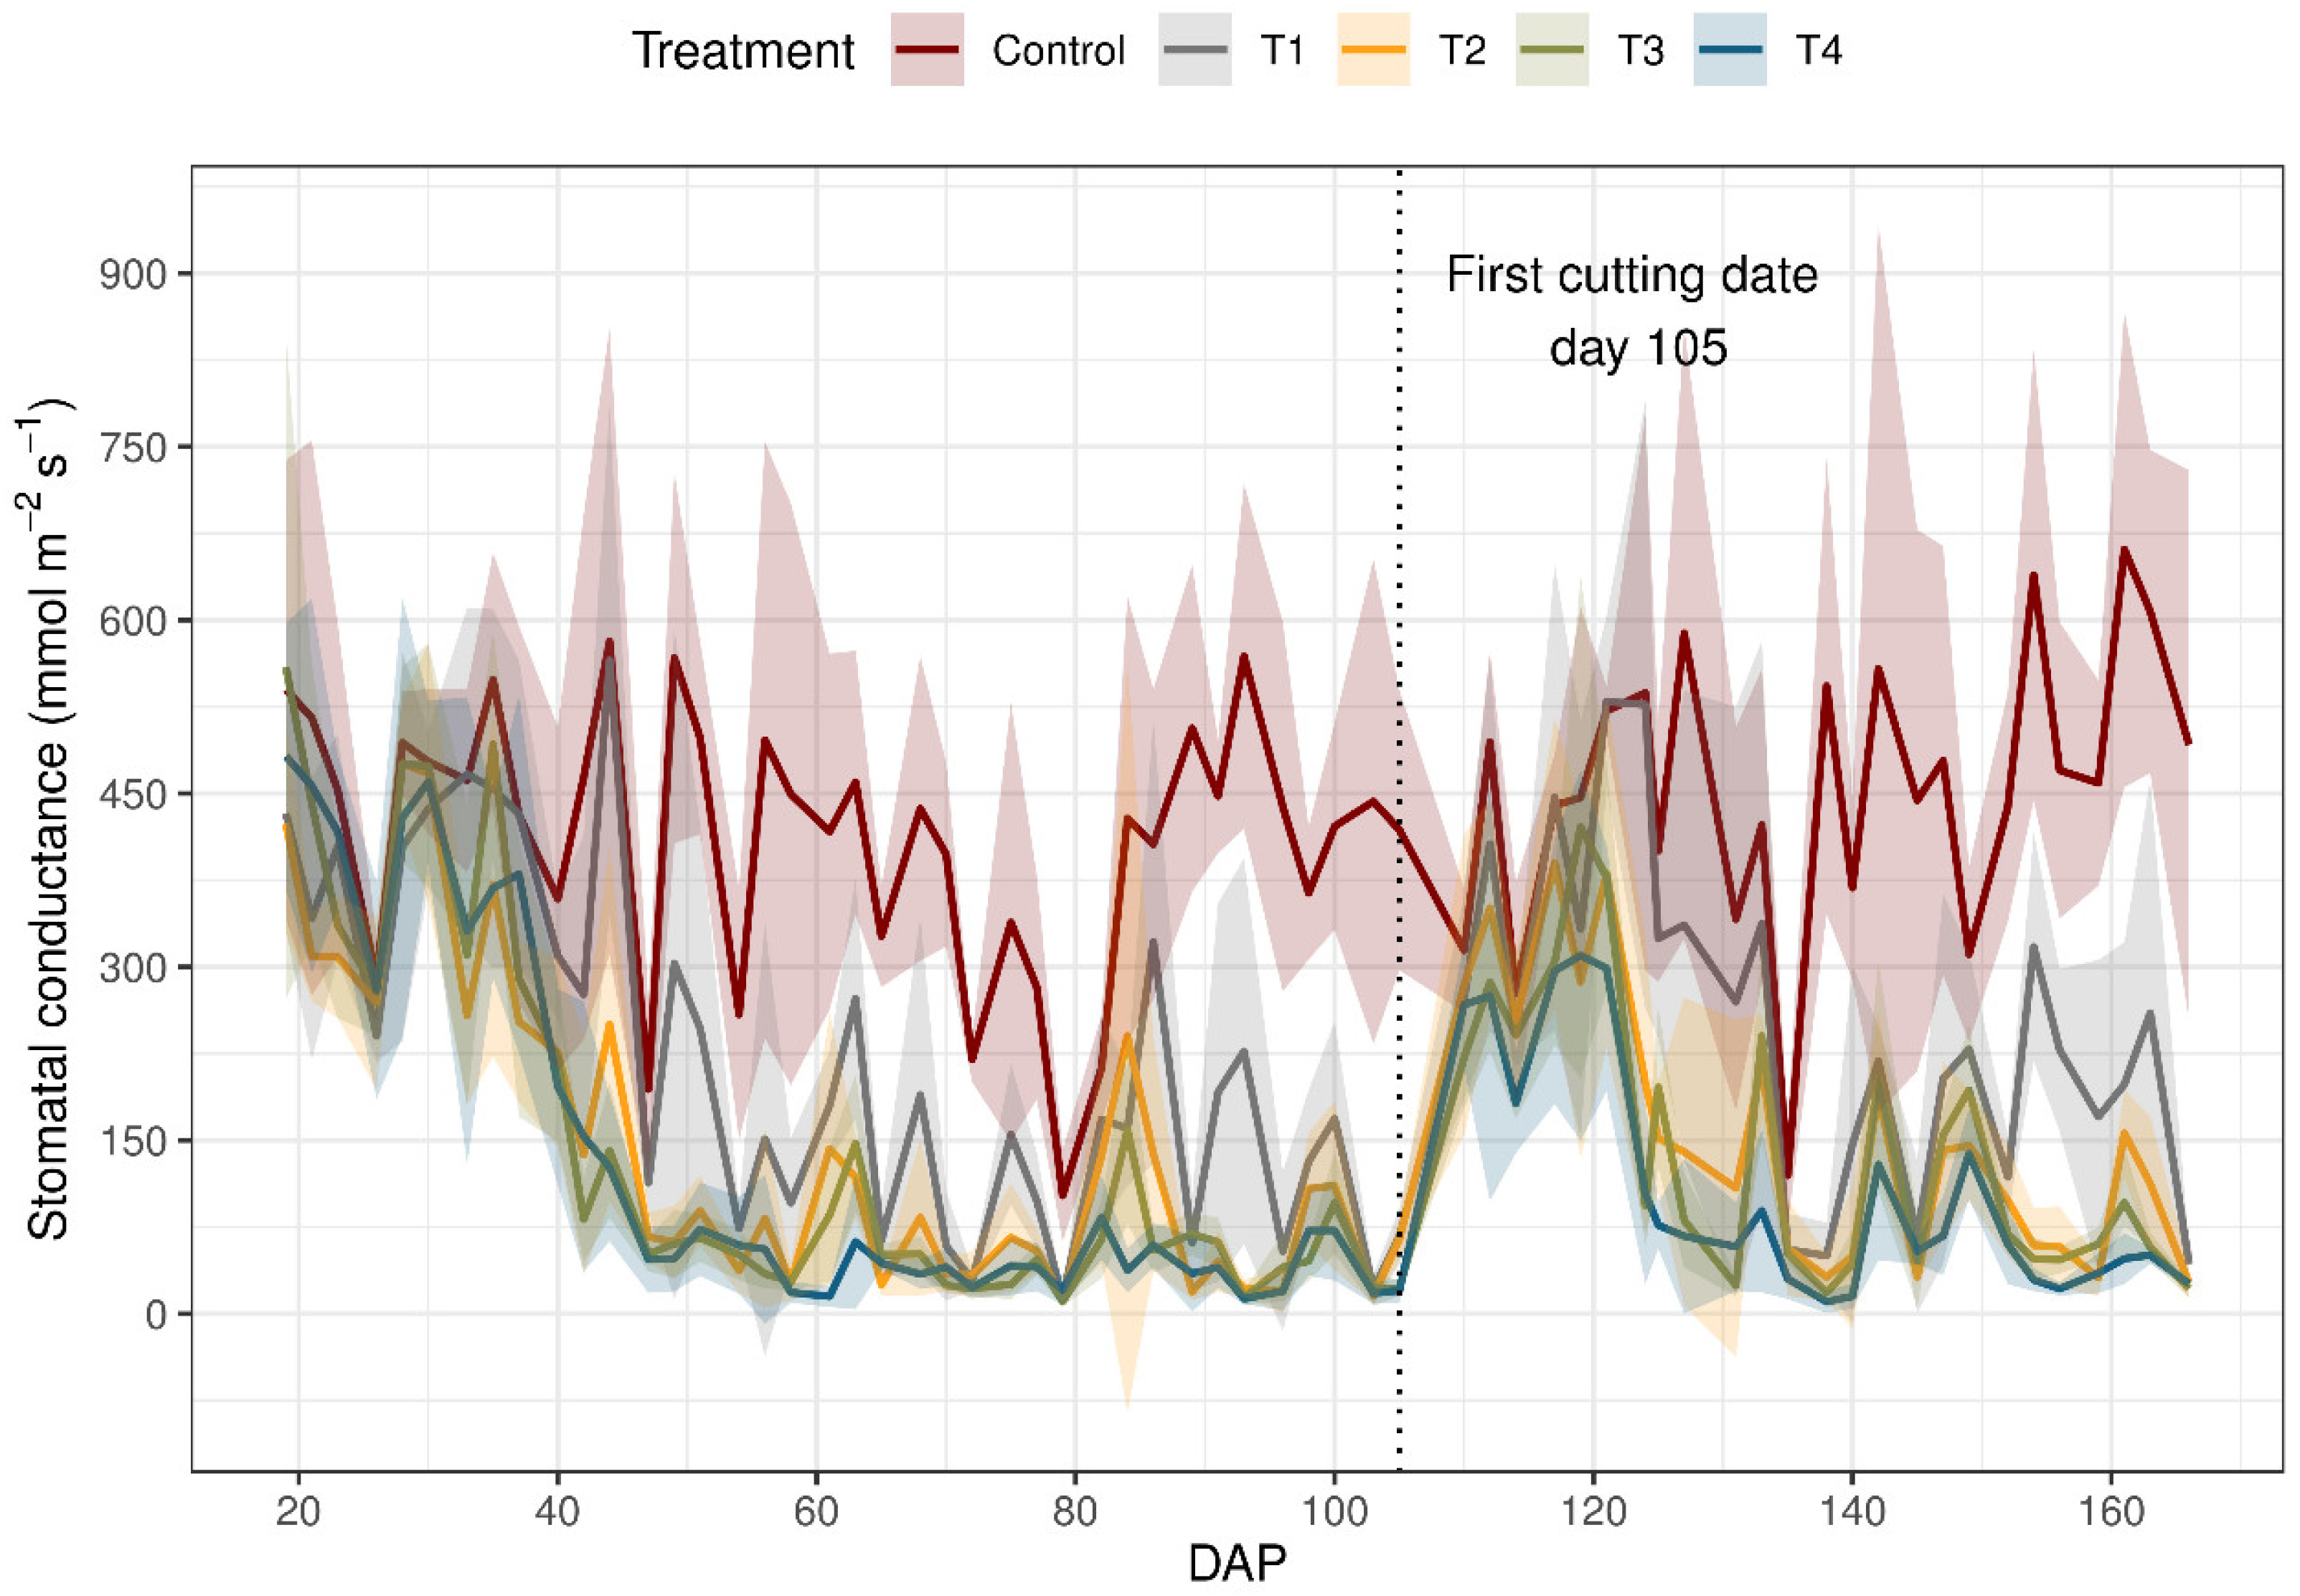
Figure 5 shows stomatal conductance data separated according to treatments. At both 40 and 80 DAP, variations in gs were mainly observed under limited water supply. Generally, gs was higher under proper irrigation conditions (control and T1), compared to water-limited conditions (T2, T3 and T4). Stomatal conductance was, on average, 3.47 times higher in the control than in T4 across measurement dates. In this experiment, for gs, there were significant differences between the control and the rest of the treatments, with T3 and T4 being equivalent.
Compared with the control, on average, biomass production was reduced by 22.4%, 49.1%, 56.9%, and 76.6% for T1, T2, T3, and T4, respectively. Control was significantly different from the other treatments (Table 3). In this research, the biomass produced is expressed as dry matter; the dry matter yield was between 6424.5 kg ha−1 for control and 2527.6 kg ha−1 for T4 in the first crop cycle. For the second cycle, it varied between 4261.3 kg∙ha−1 (control) and 1891.5 kg ha−1 (T4). The differences between the first and second cuttings of the ryegrass can be attributed to the plants’ lack of full recovery after the first cutting. All treatments were watered to field capacity during the three days following harvest. Nevertheless, the potted plants exhibited low recovery.
Table 3 shows the results of the response variables for the sowing period at the first cut, from the average of the lw, the control presented 7.9 mm against 4.9 mm of the T4. For ph, three significantly different levels were identified at 32.4 cm for control, T2 with 24.1 cm, and T4 with 16 cm. The cc presented three levels with significant differences for control 100%, T3 with 81.2%, and T4 reached only 53.1%. For the gs, three significantly different levels were identified: control with 363.3 mmol m2 s−1, T1 with 152.2 mmol m2 s−1, and T4 only reached a level of 40.72 mmol m2 s−1. The total biomass produced expressed as dm ranged between 6424.5 kg ha−1 for control against 2527.6 kg ha−1 for T4, showing significant differences between these two treatments.
These results indicate a direct relationship between gs and the available water content. That is, the lower the water content in the plant, the smaller its stomatal openings [26]. The maximum difference between treatments occurred at 66 DAP and 157 DAP. We obtained four Tukey groupings. The maximum difference between treatments occurred at 89 DAP and 166 DAP.
Table 4 shows the results obtained for the period from the first to the second cutting, For the lw, three significantly different levels were observed: 9.6 mm (control), 5.6 mm (T1), and 4.5 mm (T4). The ph also presented significant differences between treatment control (58.4 cm) and T4 (12.5 cm). In addition, treatments T1, T2, and T3 did not have significant differences between them, but did with the control. The cc presented four significantly different levels: control with 100%, T1, 77.2%, T4, 43.7%, and treatments T2 and T3 had no differences between them but did with the others. The gs presented three significantly different levels: control with 466.4 mmol m2 s−1, T1 with 209 mmol m2 s−1, and T2, T3, and T4 were similar among them, but presented significant differences compared to the control. The biomass dm again showed significant differences of 4261.3 kg ha−1 (control) and 1891.5 kg ha−1 (T4). The high differences in the magnitudes of biomass between the first and second cut were due to the fact that, after the first cut, the crop did not recover sufficiently, despite having balanced the treatments with irrigation to saturation during the three days following the harvest.
3.2. Water Stress Coefficients (Ks)
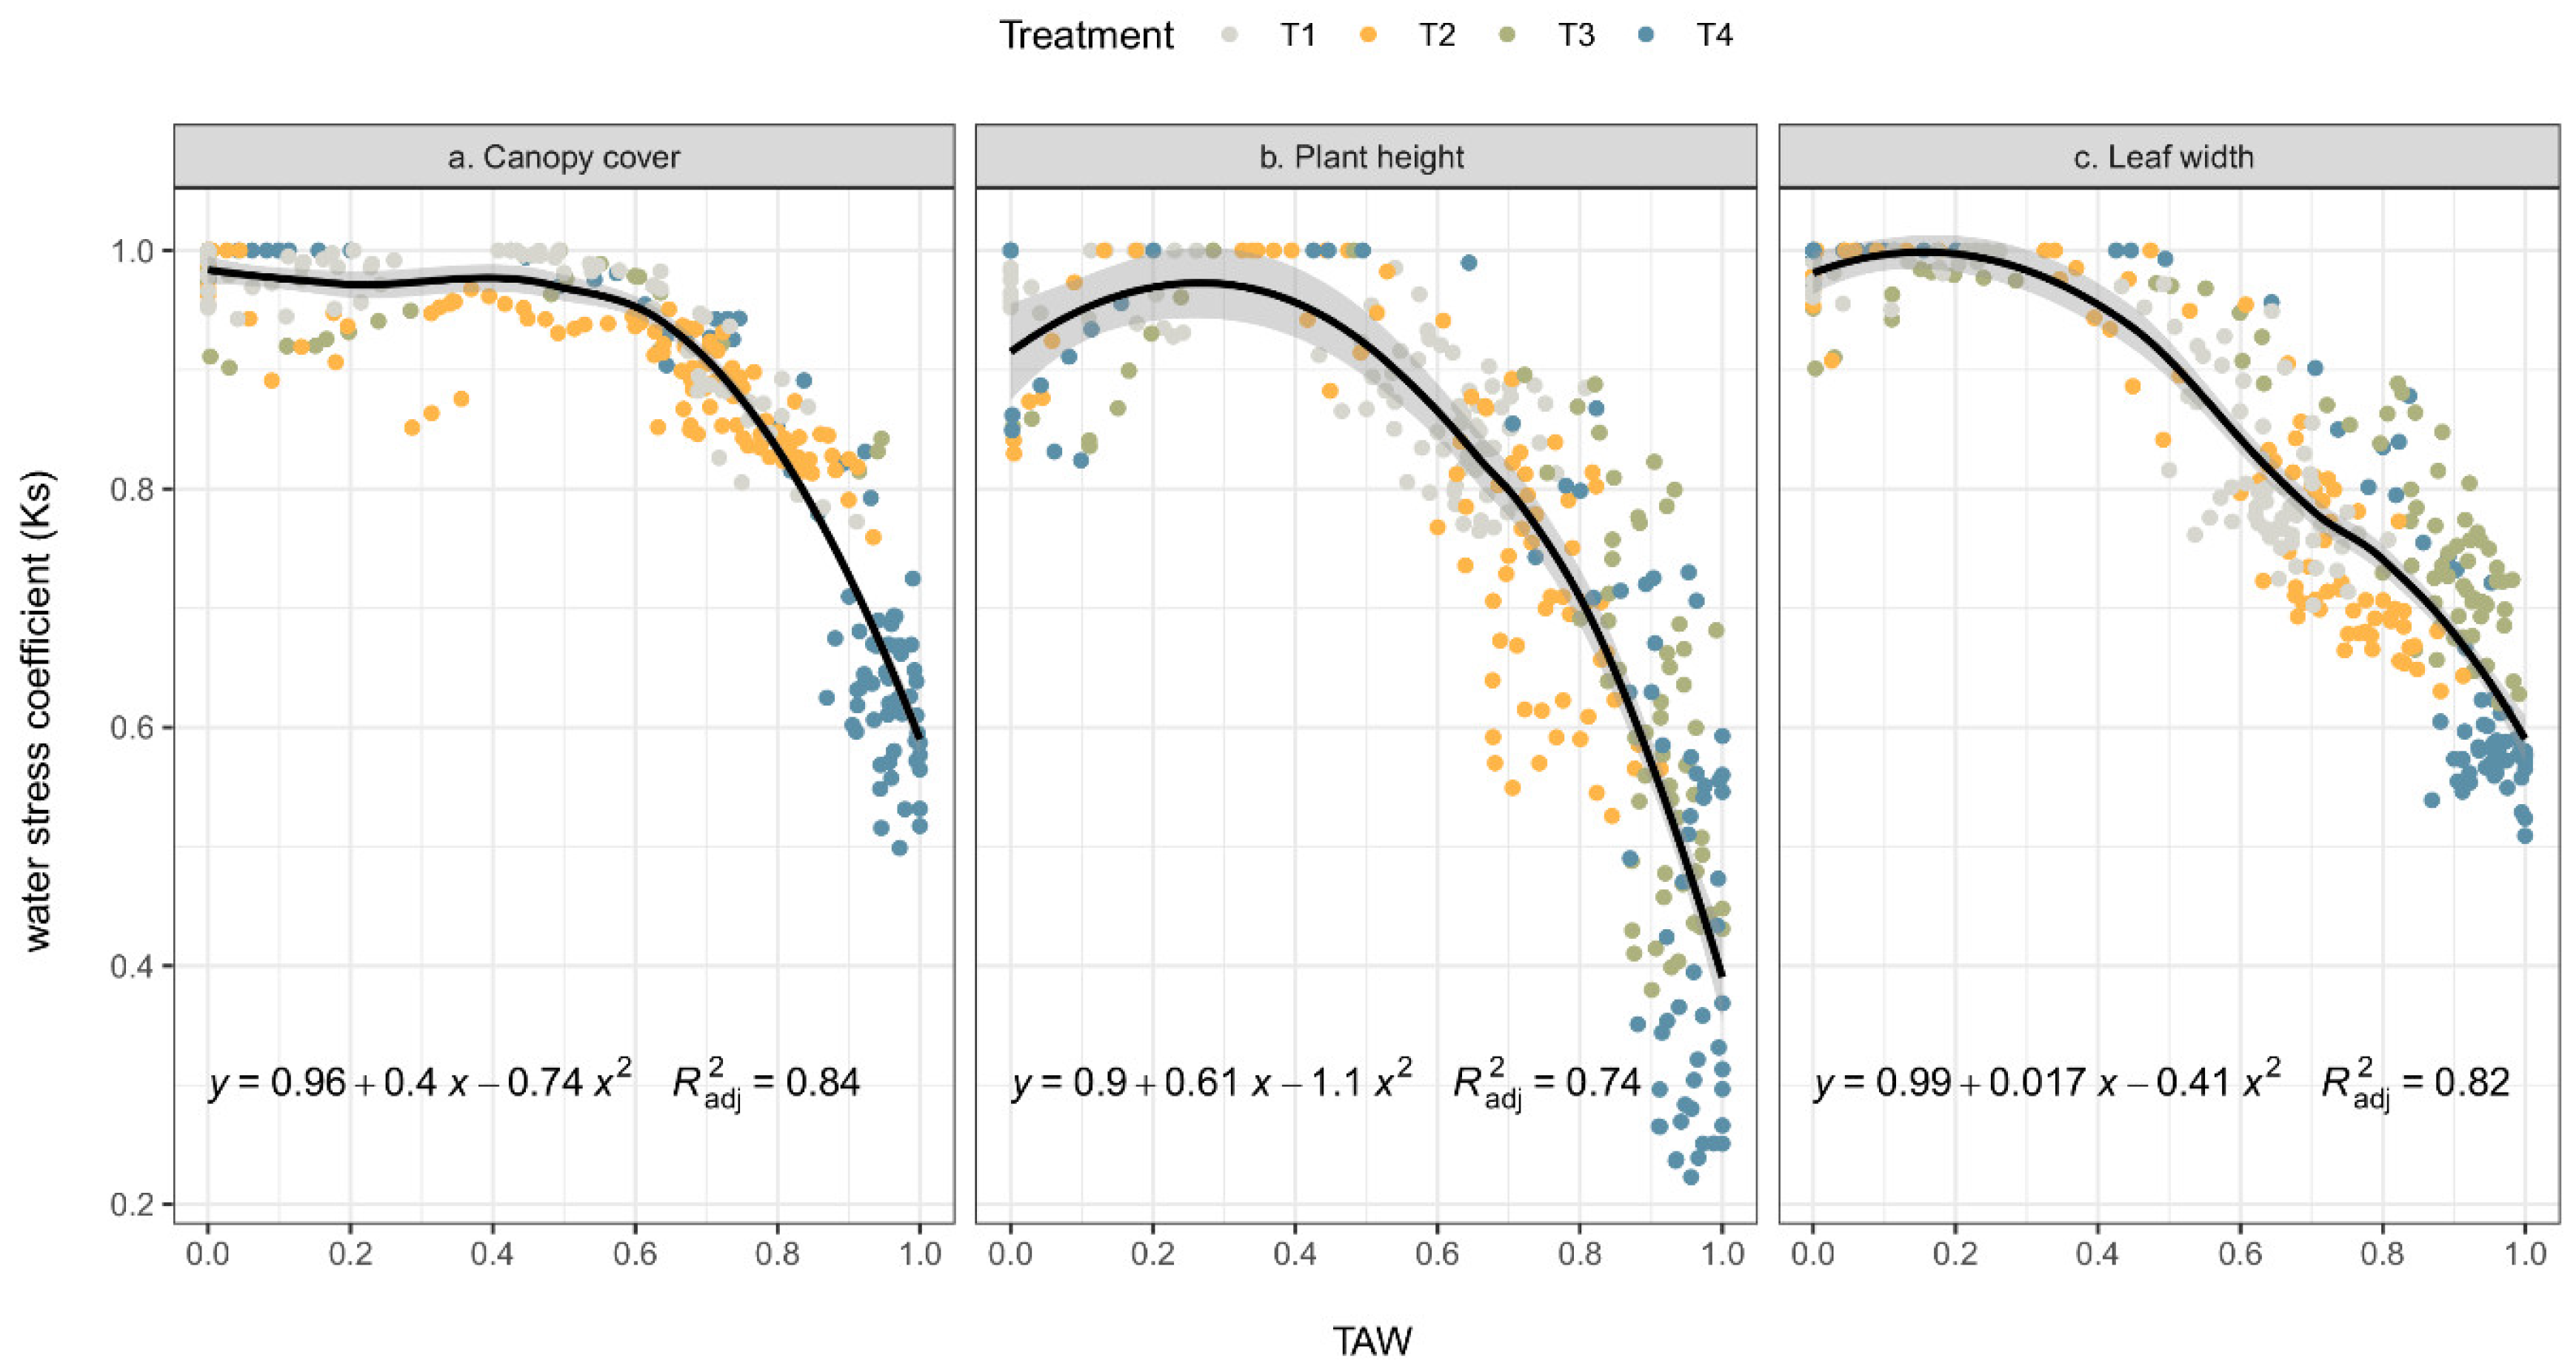
The stress occurs due to a depletion in the relative soil water content of the root zone approaching an upper threshold value, TAW, which ranges between zero and one. The stress coefficients (Ks) vary between 1 (no stress) and 0 (full stress). The rate of canopy growth starts to decline from its potential level when the depletion of the soil water reaches the upper threshold and stops completely when the depletion reaches the lower threshold. Figure 6 shows the relationship between Ks and TAW for the canopy cover, plant height, and leaf width. Generally, Ks had similar trends among response variables. The Ks value decreased as the TAW increased, regardless of the deficit irrigation treatment. The position of the irrigation treatments in the scattergram was expected, with moderate water stress treatments (T1 and T2) at the top left, and severe water stress treatments (T3 and T4) at the bottom right. The upper thresholds of the water stress coefficient (Ks) occurred at 0.45 TAW for the cc, 0.3 TAW for ph, and 0.2 TAW for lw. It was observed that the lower threshold was greater than 1 for the TAW, that is, less than the WP.
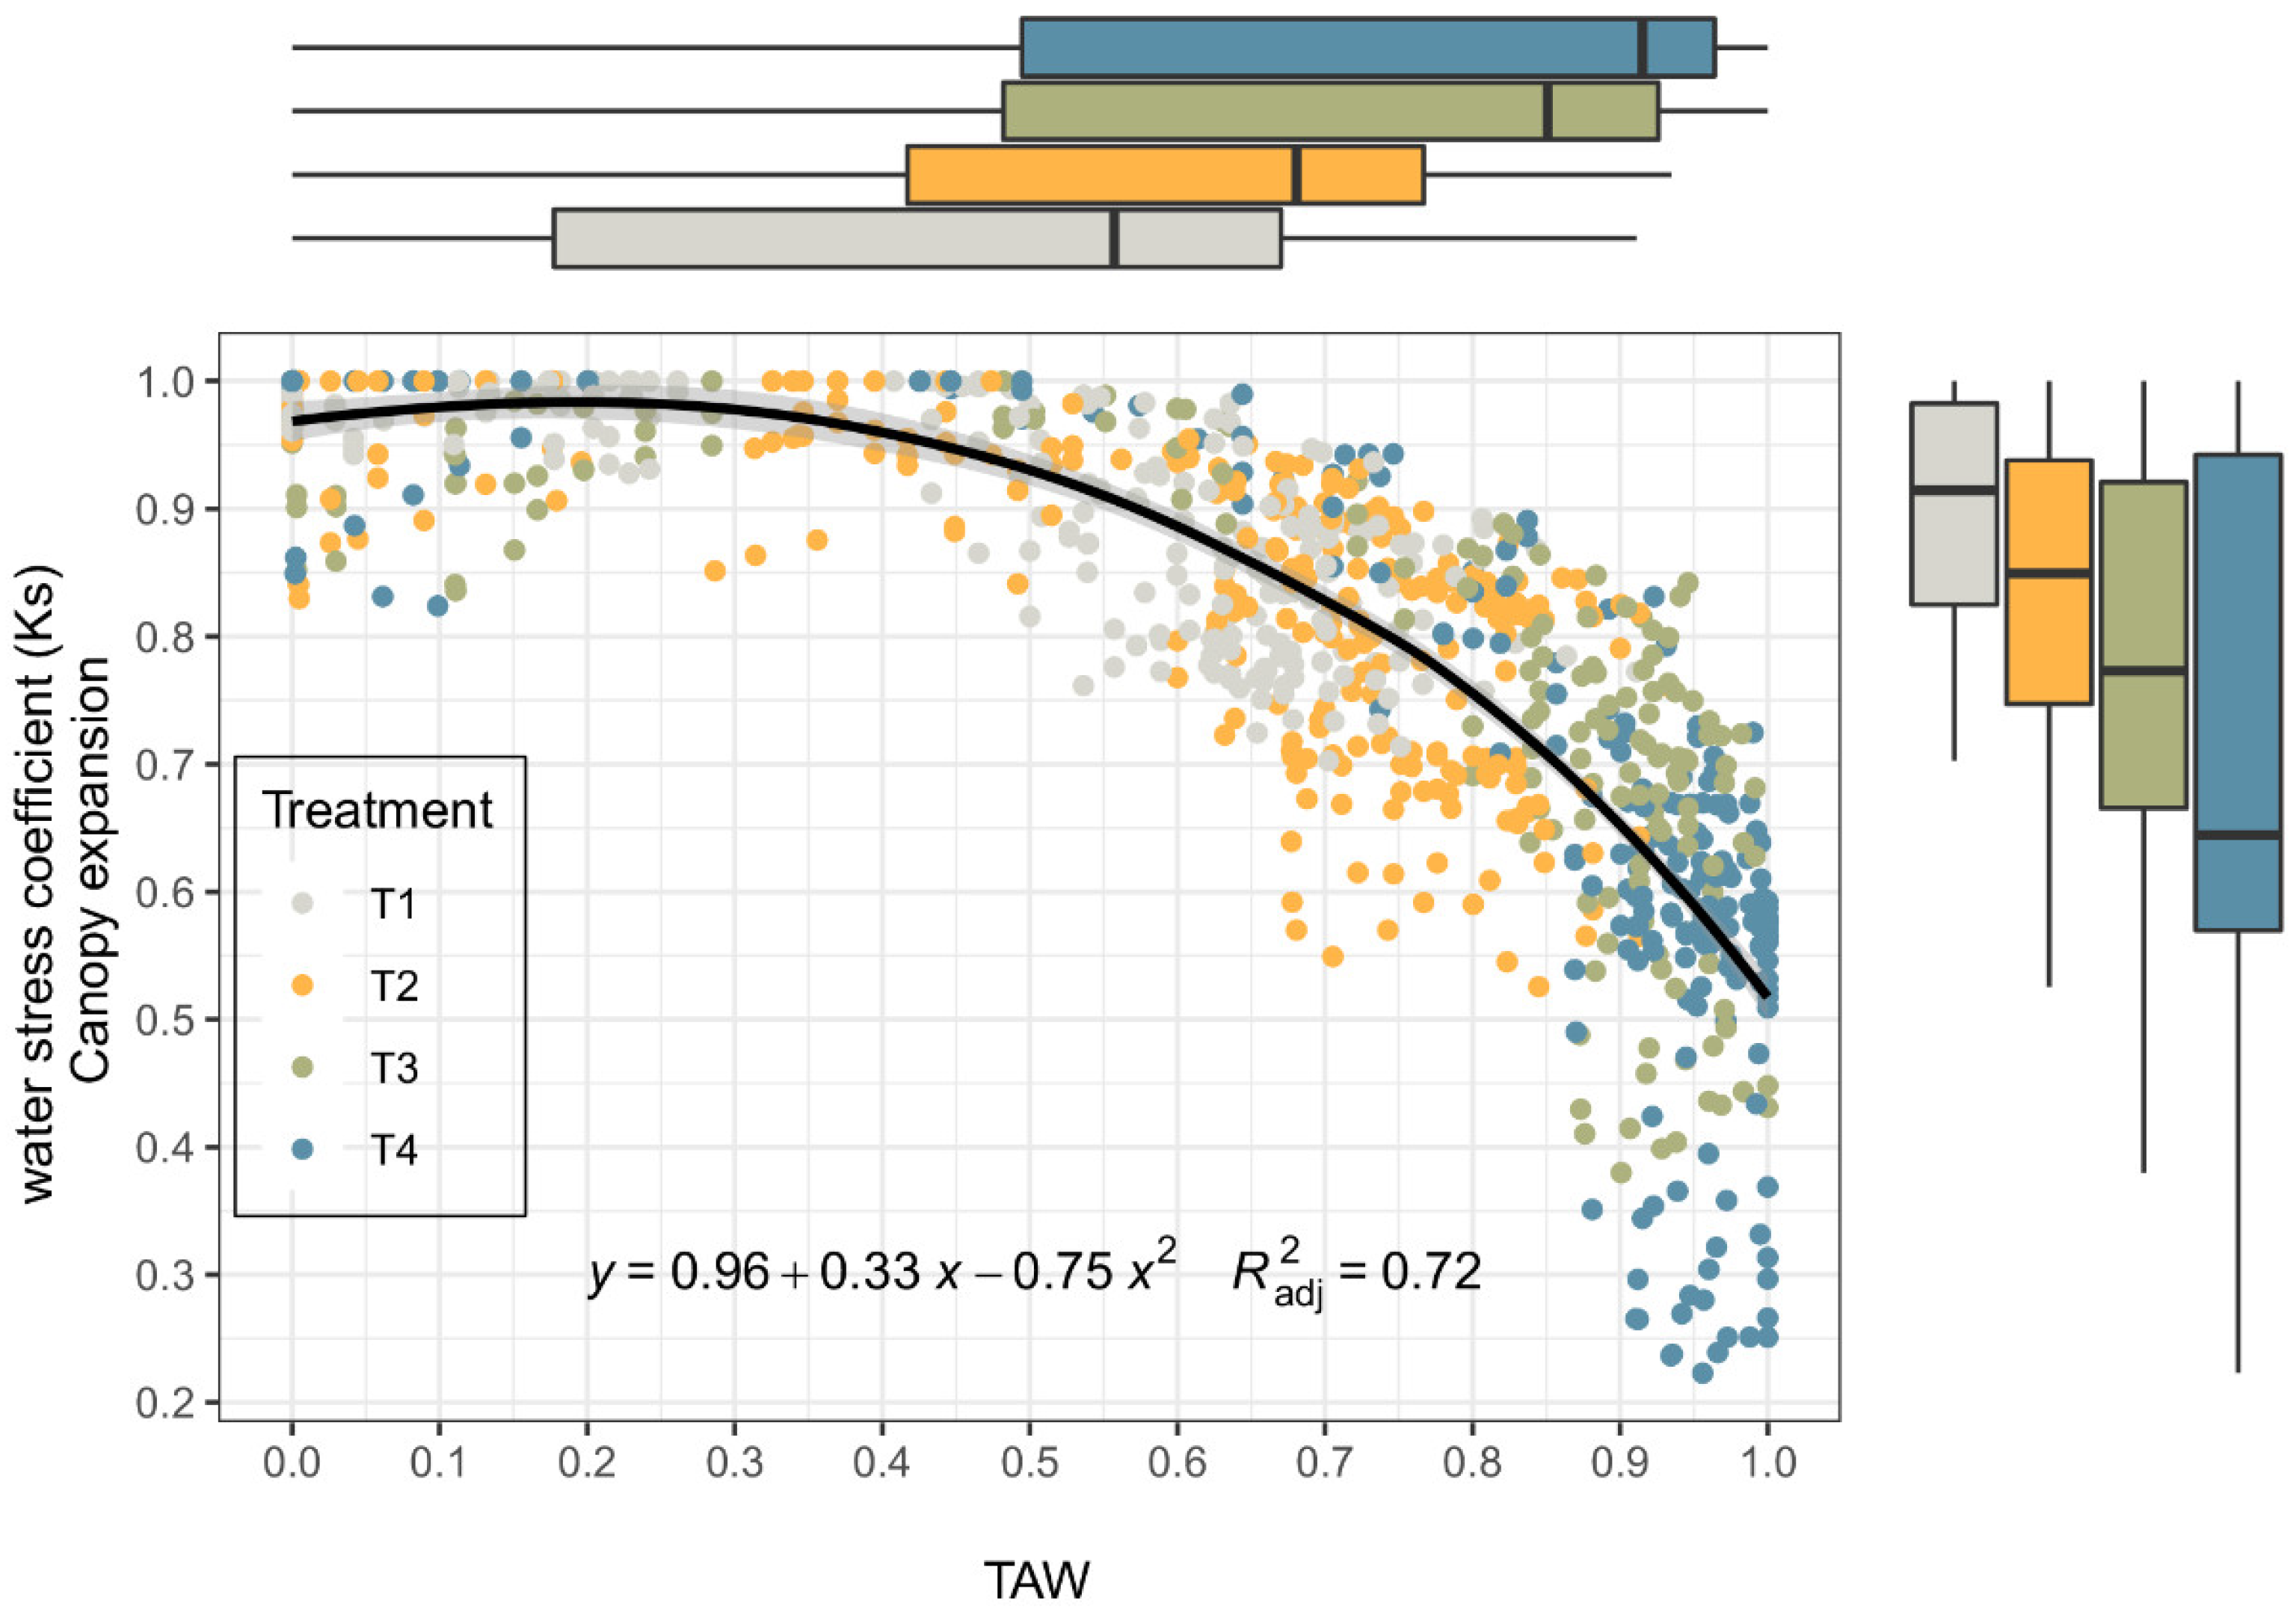
Figure 7 shows the relationship between the relative depletion of usable soil water and the Ks values of canopy expansion. The boxplots show the Ks and TAW variability for each treatment. In the boxplots, the black line within the box is the median, and the top and bottom of the box are the 75th and 25th quartile, respectively. The whiskers represent the upper and the lower limits, based on the difference in the interquartile ranges.
Initially, we calculated via Equation (1) that the AquaCrop exponential stress relationship with p = 0.25, and the shape factor for the water stress function was sf = 11 (RMSE 0.22). However, we observed that the measured Ks values deviate from the FAO–AquaCrop relationship. The Ks reduction caused by water stress followed a nonlinear and slightly concave trend (decreasing slope as stress progresses); therefore, this study explored the curvilinear trend modelled by a quadratic relationship between Ks and TAW (R2 = 0.72) with better results. The experimental data showed that the upper threshold and the lower threshold were 0.28 and 1.3, respectively.
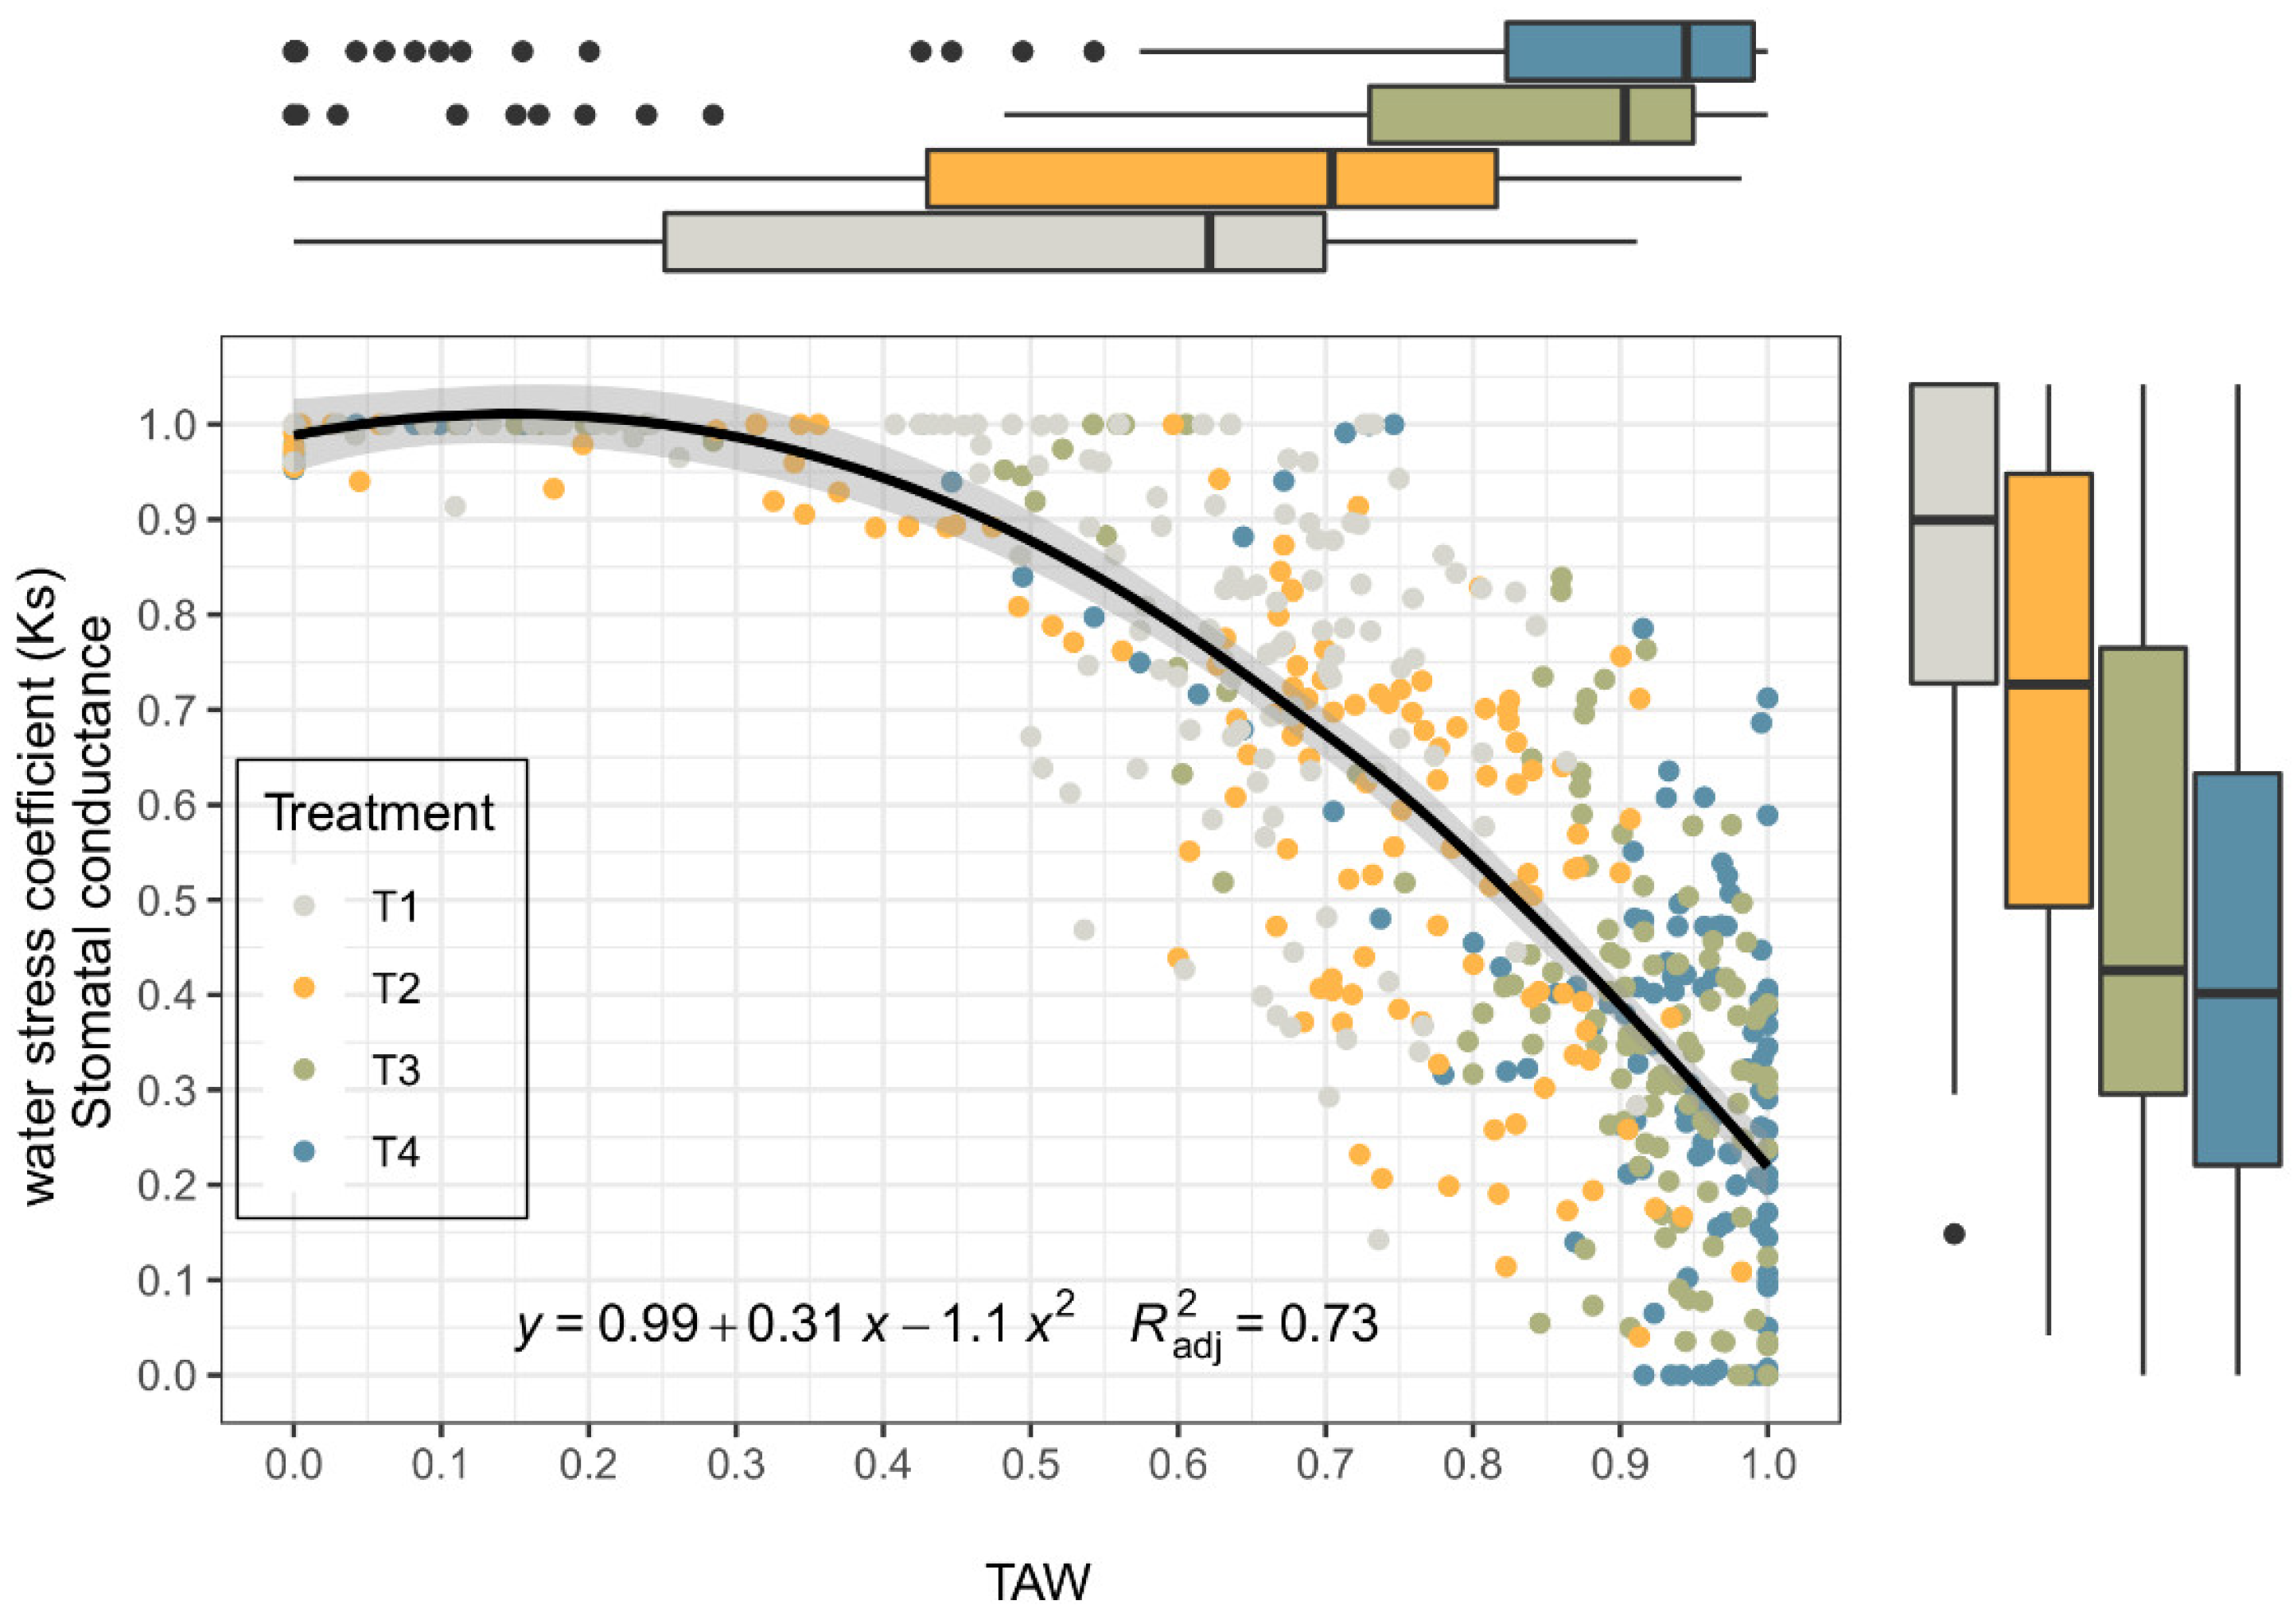
Figure 8 shows the relationship between the relative depletion of usable soil water and the Ks values of stomatal conductance. The outliers represented as black circles correspond to values of upper and lower limits. According to Equation (1), the shape of the water stress coefficient (Ks) curves between the upper and lower limits were taken as concave (positive shape factor 4.3, with RMSE 0.19). The selected concave shape is in accordance with the data experimental. However, the Ks value was calculated as a quadratic function of the soil water depletion (R2 = 0.72), with an upper limit of 0.25 and a lower limit of 1.1, of the total available soil water (TAW) depletion level.
4. Discussion
A water deficit causes several morphological and physiological effects in perennial ryegrass [3]. Ryegrass have a high-water requirement compared to other grasses. In this study, an insufficient amount of water was applied at different stages of crop growth, resulting in the gradual volumetric soil water content, and the consequent increase in plant water stress. We assessed the effects of this hydrological stress by examining four response variables: canopy coverage, plant height, leaf width, stomatal conductance, and dry biomass production. These indicators were significantly different between stress treatments.
A decrease in canopy coverage occurred beginning at 41 DAP. When the level of soil water depletion was 75%, a decrease in leaf turgor became evident, affecting the canopy cover due to wilting leaves. Plant height reduction was an early response to the water deficit, resulting from a lower rate of cell expansion. In this study, the height of the plant decreased notably with a reduction in soil water level in a similar way to that reported for other grasses [20]. In addition, we recorded a decrease in leaf width under all water stress treatments; this reduced the surface area available for light absorption and photosynthesis. A long period under a limited volumetric soil water content, as in T4, resulted in a lower canopy cover. The differences in the percentage of green grass cover could be related to the availability of remaining water in the soil profile, since the drought tolerance of perennial ryegrass is based on a low internal water potential.
We found that the closure of the stomatal occurred early in the period of water stress; according to Jurczyk et al. [27], this prevents foliar dehydration, and increases energy conservation for perennial ryegrass. The photosynthetic rate per unit area is reduced due to stomatal closure; this results in a measurable decrease in stomatal conductance [28]. As soil water content decreases, plants close their stomata and transpiration is reduced [29].
The results of our study are consistent with field observations [30,31,32,33] in the sense that perennial ryegrass dry biomass production is significantly affected by water stress. The production of ryegrass in the first cut was reduced by, on average, 76.6% due to water stress. Statistically significant differences also occurred between treatments. For the second cut, the reduction in production compared to the control was 44.4%. According to the results of this experiment, an acceptable yield and quality pasture can be achieved by watering ryegrass once a week; we found that ryegrass can tolerate a depletion level of 0.28 without reaching water stress. Applying this information can reduce the costs of irrigation and nitrogen fertilization [34].
We determined the upper and lower thresholds for the four response variables. Determining these thresholds allows for a more efficient use of water without affecting the performance of the ryegrass. According to Ninanya et al. [35], knowing the thresholds empirically can serve as a starting point for using remote sensing information to design future decision support systems (DSS). In this study, the thresholds were oriented to the estimation of the biomass of ryegrass using the AquaCrop model (FAO).
The upper threshold of Ks for canopy expansion was the most sensitive to water stress (0.28 TAW, averages of cc, ph, and lw). This result is consistent with the results described by Steduto et al. [36]; they found that the upper threshold for foliar growth should not be far below the field capacity of the root zone soil (very little depletion) in practically all crops. On the other hand, the upper threshold of water stress for gs was around 0.25 TAW. The lower threshold was greater than 1 of the TAW, that is, less than the WP. These experimental results show that the canopy opposes permanent senescence with low soil moisture contents, so the crop could recover with limited increases in soil water. According to Allen et al. [37], for most crops, a depletion level of 50 % TAW is the highest recommended depletion threshold for irrigation scheduling without a significant reduction in yield. Previous research has shown that stomata are much less sensitive than expansive leaf growth to water stress. According to Raes et al. [38], the upper threshold of soil water depletion for stomatal closure classifies ryegrass as a moderately sensitive crop to water stress.
The measured data showed that different levels of water stress caused physiological responses in all treatments during the experimental period. The lower threshold at which there is no more canopy growth can vary between 90% and 100% of TAW; this indicates that ryegrass is less susceptible to water stress than other grasses. Mild to moderate stress treatments do not reduce canopy cover early in the crop cycle.
Previous studies have shown that foliar expansion (hence, the canopy) is the most sensitive of the effects to water stress; stomatal conductance is substantially less sensitive. Depending on the species, early leaf senescence may be the same or slightly less sensitive to water stress than stomatal conductance [39].
What we found in this study corroborates that applying 75% of the crop water requirement has a better water use efficiency and is sufficient to keep the ryegrass healthy with a satisfactory appearance, meaning that we can save 25% compared to the application of 100% of the field capacity. This is consistent with the results in a study by Mahdavi et al. [40].
5. Conclusions
The concept of field capacity (FC) and wilting point (WP) are inherent to soil conditions rather than crop conditions, mainly due to the way in which they are determined in the laboratory. However, with the need to find the ranges of wetness that the crops can tolerate, it is necessary to determine these water levels that, in general, can vary with the plant species or variety. This study determined the water levels at which ryegrass is affected by water depletion in the soil. At those points, the value of the water stress coefficient (Ks) is exceeded. We found that the ryegrass canopy cover was not significantly reduced below depletion levels of 40% of TAW. Additionally, ryegrass stomatal closure begins at 28% of TAW, indicating that the cultivar is moderately tolerant to water stress.
We used the response variables to verify the water stress behavior of the integrated ryegrass (cc, ph, and lw). This crop tolerates soil water depletion levels of up to 28% without significant reduction in the canopy cover. However, biomass production was reduced by 76% at stress levels between 50% and 90% of TAW. We found that 40% TAW is acceptable for deficit irrigation for ryegrass production without major reductions in biomass yield.
Stress functions (functions to obtain stress coefficients) are an important step in designing an optimal irrigation scheduling. Our data confirm that, by using the quadratic function, the calculation of Ks appears to have a more realistic in this case tendency compared to the FAO method, ensured by the in-situ measurement of plant water status in terms of the canopy expansion and stomatal closure.
The present study can potentially provide a feasible method of assessing the real water stress of ryegrass for precision irrigation purposes in sceneries water excesses and deficits, since they are conservative magnitudes that can be extrapolated to various climate and soil conditions. The thresholds are inherent to the crop. With the thresholds, it is possible to identify when the crop will begin to be affected by the closure of stomata and by the reduction of canopy cover development due to the effects of water stress due to the lack of local environment water.
In future work on various genotypes and different crop phenological stages, perennial ryegrass will be investigated to ensure that the present method is applicable to general cases.
Author Contributions
Conceptualization, C.A.T.-C. Data curation, C.A.T.-C.; Formal analysis, C.A.T.-C., A.G.-P. and S.M.P.-M.; Investigation, C.A.T.-C., A.G.-P., and S.M.P.-M.; Methodology, C.A.T.-C. and A.G.-P. Resources, C.A.T.-C.; Supervision C.A.T.-C. and A.G.-P.; Visualization, S.M.P.-M.; Writing—Original draft, C.A.T.-C. and S.M.P.-M. All authors have read and agreed to the published version of the manuscript.
Funding
The research leading to this report was supported by the Ministry of Agriculture and Rural Development of Colombia, the Corporación Colombiana de Investigación Agropecuaria, AGROSAVIA and Ibero-American Program of Cooperation INIA Doctorate/2015, the project 1415-2007O5490-692/2007.
Acknowledgments
The authors acknowledge the kind support of the Corporación Colombiana de Investigación Agropecuaria, AGROSAVIA for allocating greenhouse space and providing equipment to conduct this experiment. The authors would also like to thank the Ibero-American Program of Cooperation INIA Doctorate/2015, the project 1415-2007O5490-692/2007.
Conflicts of Interest
The authors declare no conflict of interest.
References
- Wang, Y.; Dai, Y.; Tao, X.; Wang, J.Z.; Cheng, H.Y.; Yang, H.; Ma, X.R. Heat Shock Factor Genes of Tall Fescue and Perennial Ryegrass in Response to Temperature Stress by RNA-Seq Analysis. Front. Plant Sci. 2016, 6, 1226. [Google Scholar] [CrossRef] [PubMed] [Green Version]
- Förster, L.; Grant, J.; Michel, T.; Ng, C.; Barth, S. Growth under cold conditions in a wide perennial ryegrass panel is under tight physiological control. Peer J. 2018, 6, e5520. [Google Scholar] [CrossRef] [PubMed]
- Turner, L.R.; Holloway-Phillips, M.M.; Rawnsley, R.P.; Donaghy, D.J.; Pembleton, K.G. The morphological and physiological responses of perennial ryegrass (Lolium perenne L.), cocksfoot (Dactylis glomerata L.) and tall fescue (Festuca arundinaceaSchreb.; syn. Schedonorus phoenixScop.) to variable water availability. Grass Forage Sci. 2012, 67, 507–518. [Google Scholar] [CrossRef]
- Fessehazion, M.K.; Annandale, J.G.; Everson, C.S.; Stirzaker, R.J.; van der Laan, M.; Truter, W.F.; Abraha, A.B. Performance of simple irrigation scheduling calendars based on average weather data for annual ryegrass. Afr. J. Range Forage Sci. 2014, 31, 221–228. [Google Scholar] [CrossRef] [Green Version]
- Sheikh-Mohammadi, M.H.; Etemadi, N.; Arab, M.M.; Aalifar, M.; Arab, M.; Pessarakli, M. Molecular and physiological responses of Iranian Perennial ryegrass as affected by Trinexapac ethyl, Paclobutrazol and Abscisic acid under drought stress. Plant Physiol. Biochem. 2017, 111, 129–143. [Google Scholar] [CrossRef] [PubMed]
- Kemesyte, V.; Statkeviciute, G.; Brazauskas, G. Perennial Ryegrass Yield Performance under Abiotic Stress. Crop Sci. 2017, 57, 1935–1940. [Google Scholar] [CrossRef]
- Yates, S.; Jaškūnė, K.; Liebisch, F.; Nagelmüller, S.; Kirchgessner, N.; Kölliker, R.; Walter, A.; Brazauskas, G.; Studer, B. Phenotyping a Dynamic Trait: Leaf Growth of Perennial Ryegrass Under Water Limiting Conditions. Front. Plant Sci. 2019, 10, 344. [Google Scholar] [CrossRef]
- Tardieu, F. Plant response to environmental conditions: Assessing potential production, water demand, and negative effects of water deficit. Front. Physiol. 2013, 4, 17. [Google Scholar] [CrossRef] [Green Version]
- Grace, J.; Levitt, J. Responses of Plants to Environmental Stresses. Volume II. Water, Radiation, Salt, and other Stresses. J. Ecol. 1982, 70, 696. [Google Scholar] [CrossRef]
- Dangwal, N.; Patel, N.; Kumari, M.; Saha, S. Monitoring of water stress in wheat using multispectral indices derived from Landsat-TM. Geocarto Int. 2015, 31, 682–693. [Google Scholar] [CrossRef]
- Molina, O.; Bernhofer, C. Assessment of Regional and Historical Climate Records for a Water Budget Approach in Eastern Colombia. Water 2019, 12, 42. [Google Scholar] [CrossRef] [Green Version]
- Terán-Chaves, C.A.; Duarte-Carvajalino, J.M.; Polo-Murcia, S. Quality control and filling of daily temperature and precipitation time series in Colombia. Meteorol. Z. 2021, 30, 489–501. [Google Scholar] [CrossRef]
- Steduto, P.; Hsiao, T.C.; Raes, D.; Fereres, E. AquaCrop-The FAO Crop Model to Simulate Yield Response to Water: I. Concepts and Underlying Principles. Agron. J. 2009, 101, 426–437. [Google Scholar] [CrossRef] [Green Version]
- Neal, J.; Fulkerson, W.; Hacker, R. Differences in water use efficiency among annual forages used by the dairy industry under optimum and deficit irrigation. Agric. Water Manag. 2011, 98, 759–774. [Google Scholar] [CrossRef]
- Hatier, J.H.B.; Faville, M.J.; Hickey, M.J.; Koolaard, J.P.; Schmidt, J.; Carey, B.L.; Jones, C.S. Plant vigour at establishment and following defoliation are both associated with responses to drought in perennial ryegrass (Lolium perenne L.). J. Exp. Bot. 2014, 65, 5823–5834. [Google Scholar] [CrossRef] [Green Version]
- Hofer, D.; Suter, M.; Buchmann, N.; Lüscher, A. Severe water deficit restricts biomass production of Lolium perenne L. and Trifolium repens L. and causes foliar nitrogen but not carbohydrate limitation. Plant Soil 2017, 421, 367–380. [Google Scholar] [CrossRef] [Green Version]
- Bothe, A.; Westermeier, P.; Wosnitza, A.; Willner, E.; Schum, A.; Dehmer, K.J.; Hartmann, S. Drought tolerance in perennial ryegrass (Lolium perenne L.) as assessed by two contrasting phenotyping systems. J. Agron. Crop Sci. 2018, 204, 375–389. [Google Scholar] [CrossRef]
- Perera, R.S.; Cullen, B.R.; Eckard, R.J. Growth and Physiological Responses of Temperate Pasture Species to Consecutive Heat and Drought Stresses. Plants 2019, 8, 227. [Google Scholar] [CrossRef] [Green Version]
- Dalling, J.W.; Winter, K.; Andersen, K.M.; Turner, B.L. Artefacts of the pot environment on soil nutrient availability: Implications for the interpretation of ecological studies. Plant Ecol. 2013, 214, 329–338. [Google Scholar] [CrossRef]
- Borrajo, C.I.; Sánchez-Moreiras, A.M.; Reigosa, M.J. Morpho-physiological responses of tall wheatgrass populations to different levels of water stress. PLoS ONE 2018, 13, e0209281. [Google Scholar] [CrossRef] [Green Version]
- Hohmann, M.; Stahl, A.; Rudloff, J.; Wittkop, B.; Snowdon, R.J. Not a load of rubbish: Simulated field trials in large-scale containers. Plant Cell Environ. 2016, 39, 2064–2073. [Google Scholar] [CrossRef] [PubMed]
- Passioura, J.B. Viewpoint: The perils of pot experiments. Funct. Plant Biol. 2006, 33, 1075. [Google Scholar] [CrossRef] [PubMed]
- Terán-Chaves, C.A. Determinación de la huella hídrica y modelación de la producción de biomasa de cultivos forrajeros a partir del agua en la Sabana de Bogotá (Colombia). Ph.D. Thesis, Universitat Politècnica de València, Valencia, Spain, 2015. [Google Scholar]
- Ferrari, H.; Ferrari, C.; Ferrari, F. CobCal v 2.1. Instituto Nacional de Tecnología Agropecuaria.INTA. Entre Ríos, Argentina. 2006. Available online: https://www.cobcal.com.ar (accessed on 3 April 2013).
- Raes, D.; Steduto, P.; Hsiao, T.C.; Fereres, E. AquaCrop—The FAO Crop Model to Simulate Yield Response to Water: II. Main Algorithms and Software Description. Agron. J. 2009, 101, 438–447. [Google Scholar] [CrossRef] [Green Version]
- Ferreira, D.P.; Sousa, D.P.; Nunes, H.G.G.C.; Pinto, J.V.N.; Farias, V.D.S.; Costa, D.L.P.; Moura, V.B.; Teixeira, E.; Sousa, A.M.L.; Pinheiro, H.A.; et al. Cowpea Ecophysiological Responses to Accumulated Water Deficiency during the Reproductive Phase in Northeastern Pará, Brazil. Horticulturae 2021, 7, 116. [Google Scholar] [CrossRef]
- Jurczyk, B.; Pociecha, E.; Janowiak, F.; Kabała, D.; Rapacz, M. Variation in waterlogging-triggered stomatal behavior contributes to changes in the cold acclimation process in prehardened Lolium perenne and Festuca pratensis. J. Physiol. Biochem. 2016, 109, 280–292. [Google Scholar] [CrossRef]
- Lawlor, D.W.; Cornic, G. Photosynthetic carbon assimilation and associated metabolism in relation to water deficits in higher plants. Plant Cell Environ. 2002, 25, 275–294. [Google Scholar] [CrossRef] [Green Version]
- Pornaro, C.; Serena, M.; Macolino, S.; Leinauer, B. Drought Stress Response of Turf-Type Perennial Ryegrass Genotypes in a Mediterranean Environment. Agronomy 2020, 10, 1810. [Google Scholar] [CrossRef]
- Nie, Z.; Norton, M.R. Stress Tolerance and Persistence of Perennial Grasses: The Role of the Summer Dormancy Trait in Temperate Australia. Crop Sci. 2009, 49, 2405–2411. [Google Scholar] [CrossRef]
- Hussain, S. Drought Tolerance Mechanisms in “Mediterranean” Perennial Ryegrass (Lolium perenne L.) and Potential for Introgression of “Mediterranean” Germplasm into New Zealand Commercial Cultivars. Ph.D. Thesis, Massey University, Palmerston North, New Zealand, 2013. [Google Scholar]
- He, L.; Hatier, J.H.; Matthew, C. Drought tolerance of two perennial ryegrass cultivars with and without AR37 endophyte. N. Z. J. Agric. Res. 2017, 60, 173–188. [Google Scholar] [CrossRef]
- Cyriac, D.; Hofmann, R.W.; Stewart, A.; Sathish, P.; Winefield, C.S.; Moot, D.J. Intraspecific differences in long-term drought tolerance in perennial ryegrass. PLoS ONE 2018, 13, e0194977. [Google Scholar] [CrossRef] [Green Version]
- Abraha, A.B.; Truter, W.F.; Annandale, J.G.; Fessehazion, M.K. Forage yield and quality response of annual ryegrass (Lolium multiflorum) to different water and nitrogen levels. Afr. J. Range Forage Sci. 2015, 32, 125–131. [Google Scholar] [CrossRef] [Green Version]
- Ninanya, J.; Ramírez, D.A.; Rinza, J.; Silva-Díaz, C.; Cervantes, M.; García, J.; Quiroz, R. Canopy Temperature as a Key Physiological Trait to Improve Yield Prediction under Water Restrictions in Potato. Agronomy 2021, 11, 1436. [Google Scholar] [CrossRef]
- Steduto, P.; Hsiao, T.C.; Fereres, E.; Raes, D. Crop yield response to water. In FAO Irrigation and Drainage Paper 66; Food and Agriculture Organization of the United Nations: Rome, Italy, 2012; p. 503. [Google Scholar]
- Allen, R.G.; Pereira, L.S.; Raes, D.; Smith, M. FAO Irrigation and Drainage Paper No. 56—Crop Evapotranspiration; FAO: Rome, Italy, 1998. [Google Scholar]
- Raes, D.; Steduto, P.; Hsiao, T.C.; Fereres, E. AquaCrop, version 6.0–6.1; Chapter 1: FAO Crop-Water Productivity Model to Simulate Yield Response to Water; FAO: Rome, Italy, 2018. [Google Scholar]
- Bradford, K.J.; Hsiao, T.C. Physiological Responses to Moderate Water Stress. In Physiological Plant Ecology II. Encyclopedia of Plant Physiology (New Series); Lange, O.L., Nobel, P.S., Osmond, C.B., Ziegler, H., Eds.; Springer: Berlin/Heidelberg, Germany, 1982; Volume 12, Available online: https://citations.springernature.com/item?doi=10.1007/978-3-642-68150-9_10 (accessed on 15 April 2022).
- Mahdavi, S.; Kafi, M.; Fallahi, E.; Shokrpour, M.; Tabrizi, L. Drought and biostimulant impacts on mineral nutrients, ambient and reflected light-based chlorophyll index, and performance of perennial ryegrass. J. Plant Nutr. 2017, 40, 2248–2258. [Google Scholar] [CrossRef]
Figure 1.
Volumetric soil water content (%) across treatments as a function of days after planting during the experimental period. The values are an average of four replications. The planting date of the ryegrass (Lolium perenne) was 15 August 2012, and the first cut date was 28 November 2012; the second cycle was 28 November 2012–30 January 2013. Treatments: Control: non-stressed treatment, T1: moderate–low water stress treatment, T2: moderate–high water stress treatment, T3: medium intensity severe water stress treatment, T4: high intensity severe water stress treatment.

Figure 2.
Canopy cover (cc) of ryegrass (Lolium perenne) during the growing season under different irrigation treatments. Control: non-stressed treatment; T1: moderate–low water stress treatment; T2: moderate–high water stress treatment; T3: medium intensity severe water stress treatment; T4: high intensity severe water stress treatment. The first cutting was made day 105. Solid line connects cc means and shadow area shows standard deviation from the mean values.

Figure 3.
Plant height (ph) of ryegrass (Lolium perenne) during the growing season under different irrigation treatments. Control: non-stressed treatment, T1: moderate–low water stress treatment, T2: moderate–high water stress treatment, T3: medium intensity severe water stress treatment, T4: high intensity severe water stress treatment. The first cutting was made on day 105. The solid line connects the ph means, and the shaded area shows the standard deviation from the mean values.

Figure 4.
Leaf width (lw) of ryegrass (Lolium perenne) during the growing season under different irrigation treatments. Control: non-stressed treatment, T1: moderate–low water stress treatment, T2: moderate–high water stress treatment, T3: medium intensity severe water stress treatment, T4: high intensity severe water stress treatment. The first cutting was made on day 105. The solid line connects the lw means, and the shaded area shows the standard deviation from the mean values.

Figure 5.
Stomatal conductance (gs) of ryegrass (Lolium perenne) during the growing season under different irrigation treatments. Control: non-stressed treatment, T1: moderate–low water stress treatment, T2: moderate–high water stress treatment, T3: medium intensity severe water stress treatment, T4: high intensity severe water stress treatment. The first cutting was made on day 105. The solid line connects the gs means, and the shaded area shows the standard deviation from the mean values.

Figure 6.
Scattergram of the water stress coefficient (Ks) for each response variable: (a) canopy cover (b) plant height (c) leaf width during a stress cycle ryegrass (Lolium perenne). Treatment are color coded. T1: moderate–low water stress treatment (grey color), T2: moderate–high water stress treatment (yellow color), T3: medium intensity severe water stress treatment (green color), T4: high intensity severe water stress treatment (blue color).

Figure 7.
Relationship between stress coefficients (Ks) for canopy expansion (exp) and relative availability of soil water during a stress cycle ryegrass (Lolium perenne). Treatment are color coded. T1: moderate–low water stress treatment (grey color), T2: moderate–high water stress treatment (yellow color), T3: medium intensity severe water stress treatment (green color), T4: high intensity severe water stress treatment (blue color).

Figure 8.
Relationship between stress coefficients (Ks) for stomatal conductance (gs) and relative availability of soil water during a stress cycle ryegrass (Lolium perenne). Treatment are color coded. T1: moderate–low water stress treatment (grey color), T2: moderate–high water stress treatment (yellow color), T3: medium intensity severe water stress treatment (green color), T4: high intensity severe water stress treatment (blue color).


Table 1.
Treatment details for the period of the first cut ryegrass (Lolium perenne); depletion level (p) as % of total available water—TAW-(C.I. Tibaitatá, 2012/2013).
Table 1.
Treatment details for the period of the first cut ryegrass (Lolium perenne); depletion level (p) as % of total available water—TAW-(C.I. Tibaitatá, 2012/2013).
| Days after Planting (DAP) | 0–21 | 22–37 | 38–43 | 44–50 | 51–57 | 58–64 | 65–78 | 79–85 | 86–100 |
|---|---|---|---|---|---|---|---|---|---|
| Control | 0 | 0 | 0 | 0 | 0 | 0 | 0 | 0 | 0 |
| T1 | 0 | 10 | 20 | 50 | 60 | 50 | 60 | 70 | 75 |
| T2 | 0 | 20 | 40 | 60 | 70 | 60 | 70 | 75 | 85 |
| T3 | 0 | 30 | 60 | 80 | 90 | 80 | 90 | 93 | 95 |
| T4 | 0 | 40 | 75 | 95 | 96 | 95 | 96 | 97 | 98 |
Table 2.
Details of the treatment for the period of the second cut season; level of depletion (p) as % of total available water—TAW-(C.I. Tibaitatá, 2012/2013).
Table 2.
Details of the treatment for the period of the second cut season; level of depletion (p) as % of total available water—TAW-(C.I. Tibaitatá, 2012/2013).
| Days after the 1st Cut until the 2nd Cut | 1–4 | 5–8 | 9–13 | 14–15 | 16–21 | 22–27 | 28–34 | 35–46 | 47–57 |
|---|---|---|---|---|---|---|---|---|---|
| Control | 0 | 0 | 0 | 0 | 0 | 0 | 0 | 0 | 0 |
| T1 | 0 | 10 | 20 | 50 | 60 | 70 | 75 | 80 | 85 |
| T2 | 0 | 20 | 40 | 60 | 70 | 75 | 85 | 90 | 95 |
| T3 | 0 | 30 | 60 | 80 | 90 | 93 | 95 | 96 | 97 |
| T4 | 0 | 40 | 75 | 95 | 96 | 97 | 98 | 99 | 100 |
Table 3.
Effect of water stress treatments on the response variables in the first crop cycle ryegrass. (Lolium perenne).
Table 3.
Effect of water stress treatments on the response variables in the first crop cycle ryegrass. (Lolium perenne).
| Significance Period (from–to) | |||||
|---|---|---|---|---|---|
| Days after Planting (DAP) | 105 | 42–105 (66) * | 41–105 (89) * | 57–105 | 74–105 |
| Treatment | Average Biomass | Stomatal Conductance | Canopy Cover | Leaf Width | Plant Height |
| (kg ha−1) † | (mmol m2 s−1) † | (%) † | (mm) † | (cm) † | |
| Control | 6468.1 A | 363.3 A | 100.0 A | 7.9 A | 32.4 A |
| T1 | 5018.2 A B | 152.2 B | 99.4 A B | 5.8 B | 24.1 B |
| T2 | 3291.4 B C | 105.4 B C | 81.9 A B | 5.7 B | 21.9 B C |
| T3 | 2784.6 B C | 51.3 C D | 81.2 B | 5.6 B | 21.1 B C |
| T4 | 1513.2 C | 40.7 D | 53.1 C | 4.9 B | 16.0 C |
Note: Control: non-stressed treatment, T1: moderate–low water stress treatment, T2: moderate–high water stress treatment, T3: medium intensity severe water stress treatment, T4: high intensity severe water stress treatment. The first cutting was made on day 105. †: Tukey groupings. Letters (A, B, C, and D) represent the results of Tukey’s post-hoc comparisons of group means. * The values in parentheses show the day on which the treatments had the maximum significant differences for the response variable referenced in the column.
Table 4.
Effect of water stress treatments on the response variables in the second crop cycle ryegrass (Lolium perenne).
Table 4.
Effect of water stress treatments on the response variables in the second crop cycle ryegrass (Lolium perenne).
| Significance Period (from—to) | |||||
|---|---|---|---|---|---|
| Days after the First Cut until the Second Cut. | 166 | 121–166 (157) * | 106–166 | 127–166 | 111–166 |
| Average Biomass | Stomatal Conductance | Canopy Coverage | Leaf Width | Plant Height | |
| Treatment | (kg ha−1) † | (mmol m2 s−1) † | (%) † | (mm) † | (cm) † |
| Control | 4261.3 A | 466.4 A | 100.0 A | 9.6 A | 58.4 A |
| T1 | 3977.3 A | 209.0 B | 77.2 B | 5.6 B | 21.1 B |
| T2 | 3555.2 A | 51.3 C | 61.5 C | 5.2 B C | 19.9 B |
| T3 | 3133.2 A B | 49.0 C | 53.9 C | 5.1 B C | 19.9 B |
| T4 | 1891.5 B | 26.2 C | 34.7 D | 4.5 C | 12.5 C |
Note: Control: non-stressed treatment, T1: moderate–low water stress treatment, T2: moderate–high water stress treatment, T3: medium intensity severe water stress treatment, T4: high intensity severe water stress treatment. The first cutting was made on day 105. †: Tukey groupings. Letters (A, B, C, and D) represent the results of Tukey’s post-hoc comparisons of group means. * The values in parentheses show the day on which the treatments had the maximum significant differences for the response variable referenced in the column.
Publisher’s Note: MDPI stays neutral with regard to jurisdictional claims in published maps and institutional affiliations. |
© 2022 by the authors. Licensee MDPI, Basel, Switzerland. This article is an open access article distributed under the terms and conditions of the Creative Commons Attribution (CC BY) license (https://creativecommons.org/licenses/by/4.0/).
Share and Cite
MDPI and ACS Style
Terán-Chaves, C.A.; García-Prats, A.; Polo-Murcia, S.M. Water Stress Thresholds and Evaluation of Coefficient Ks for Perennial Ryegrass in Tropical Conditions. Water 2022, 14, 1696. https://doi.org/10.3390/w14111696
AMA Style
Terán-Chaves CA, García-Prats A, Polo-Murcia SM. Water Stress Thresholds and Evaluation of Coefficient Ks for Perennial Ryegrass in Tropical Conditions. Water. 2022; 14(11):1696. https://doi.org/10.3390/w14111696
Chicago/Turabian StyleTerán-Chaves, César Augusto, Alberto García-Prats, and Sonia Mercedes Polo-Murcia. 2022. "Water Stress Thresholds and Evaluation of Coefficient Ks for Perennial Ryegrass in Tropical Conditions" Water 14, no. 11: 1696. https://doi.org/10.3390/w14111696
Note that from the first issue of 2016, this journal uses article numbers instead of page numbers. See further details here.