
Vulnerability Hotspots Mapping for Enhancing Sanitation Services Provision: A Case Study of Jordan
by
 , , and
Nezar Hammouri
1,2,* ,
,
Mohammad Talafha
3, 
Qais Hamarneh
3,
Zeina Annab
3,
Rami Al-Ruzouq
4,5 and
Abdallah Shanableh
4,5 1
Faculty of Science, Department of Applied Physics and Astronomy, University of Sharjah, Sharjah P.O. Box 27272, United Arab Emirates
2
Prince El-Hassan Bin Talal Faculty of Natural Resource and Environment, The Hashemite University, Zarqa 13133, Jordan
3
Bremen Overseas Research and Development Agency (BORDA) Jordan Country Office, Amman 11183, Jordan
4
Civil and Environmental Engineering Department, University of Sharjah, Sharjah P.O. Box 27272, United Arab Emirates
5
GIS and Remote Sensing Center, Research Institute of Sciences and Engineering, University of Sharjah, Sharjah P.O. Box 27272, United Arab Emirates
*
Author to whom correspondence should be addressed.
Water 2022, 14(11), 1689; https://doi.org/10.3390/w14111689
Submission received: 23 April 2022
/
Revised: 21 May 2022
/
Accepted: 23 May 2022
/
Published: 25 May 2022
(This article belongs to the Topic Emerging Solutions for Water, Sanitation and Hygiene)
Abstract
:Enhancing sanitation services is a major challenge for sustainable development and plans. This work aims at developing a vulnerability hotspot mapping for improving sanitation services provision in Jordan based on a multi-weighted criteria model. Multiple spatial, physical, demographic, social, economic, and sanitation data were collected and compiled using GIS. We also considered experts’ and stakeholders’ opinions to determine the necessary indicators needed to develop Sanitation Hotspot Index (SHI). We used the Analytic Hierarchy Process (AHP) analysis to assign the relative weights of ten criteria. We also checked the consistency of AHP results. We found that the sanitation and population density got the highest relative weights, while soil hydraulic conductivity got the lowest. Based on the results of AHP, we developed two SHI mapping for two administrative levels: district and neighborhood levels. The maps classified the sanitation vulnerability into five classes ranging from most vulnerable to least vulnerable. The developed SHI maps can be used as a decision support tool for decision-makers and planners to allocate the necessary funds and orient the aids from donors and international agencies to enhance sanitation services in the country’s most vulnerable areas.
1. Introduction
Since the last industrial and technological revolutions, humanity has recognized the necessity of responding properly and timely to the risks and hazards that resulted from the unsustainable utilization of natural resources on this planet. Pollution, global warming, climate change, and extreme weather are just a few examples of consequences that humanity is currently facing due to the imbalanced deployment of natural resources and the need for social and economic development. As this situation is expected to worsen in the future, almost all countries worldwide have committed themselves to achieving 17 goals known later as Sustainable Development Goals (SDG) by 2030. These goals aim at achieving a better and more sustainable future for current and next generations. “Ensure availability and sustainable management of water and sanitation for all” is the sixth SDG goal which includes several targets that seek to achieve universal and equitable access to safe and affordable drinking water and access to adequate and equitable sanitation and hygiene [1]. Although many countries have achieved remarkable progress towards these targets, many people still lack access to clean water resources and essential sanitation services. According to the United Nations, about two out of five people do not have a primary hand-washing facility with soap and water. More than 673 million people still practice open defecation (UN SDG’s website). Many countries worldwide, especially developing countries, are not on track to achieve these goals and targets [2].
Safe drinking water and proper sanitation services are fundamental to the health and wellbeing of the people, and water is a central component of food production and economic growth. However, most developing countries face challenges in securing adequate and safe water amounts for different purposes, including drinking. Water quality is another primary concern in such countries as the sanitation services are still limited and cover restricted regions of these countries. This is mainly due to the poor treatment of wastewater, which is usually discharged into drainage systems without any treatment [3]. In addition, many challenges for providing safe water and sanitation services are facing planners and decision-makers, these include water distribution system contamination, elevated water scarcity, lack of low-cost innovative sanitation systems, large communities’ needs for adequate water supplies and sanitation services, financial challenges to sustain water and sanitation services [4].
Recently, advances in geographic information systems (GIS), global navigation satellite systems (GNSS), remote sensing, and multispectral and spatial sensors led to widening the application of these technological tools in environmental management and planning and sustainable development planning. With the availability of low-cost and high-performance computing platforms, GIS became a standard tool to collect, manage, process, and visualize spatial data sets. The integration between these technologies enables their use as decision support tools for management and planning activities, including urban planning and environmental management. Many researchers worldwide have developed several GIS-based frameworks associated with enhancing sanitation services for sanitation mapping services [5,6,7].
Jordan is a country with limited and stressed water resources; this situation recognizes the country as the second poorest country in terms of water resources in the world. The country’s renewable water supply currently only meets about half of the population’s water demands, with groundwater being used twice as quickly as it can be recharged [8]. A high rate of population growth and the influx of refugees from regional conflicts are putting additional stresses on an already diminished water supply.
In the last decade, Jordan has recognized the importance of achieving Sustainable Development Goals that are related directly to water and sanitation. Therefore, policies, strategies, and action plans were drawn up by the Ministry of water and irrigation (MWI) of Jordan that emphasize its efforts on centralized and decentralized sanitation solutions [9,10,11]. Although alternative sanitation and reuse approaches have increasingly received attention and general support from governmental institutions, feasible and sustainable solutions for remote communities have not yet been successfully implemented on the ground. A significant challenge facing different development plans in Jordan is the abnormal population growth due to the high growth rate and the critical situation in the region that urges hundreds of thousands of refugees to settle in the country. This massive number of refugees adds additional stress on the already exhausted resources and infrastructures. According to the Department of Statics (DOS), the population of Jordan in 2020 was about 10.8 million people, while in 2005, it was only about half of this number (DOS, 2021).
Strategic planning of prioritizing wastewater infrastructure projects is challenging in Jordan as many factors influence the process of steering funds and investments for sanitation implementation. Some factors are related to societal powers, as communities pressure municipalities and their officials to provide essential services, including sanitation. On the other hand, financial constraints due to funding or budget allocation play a crucial role in determining the served area and the type and level of service. In addition, the interest of donor organizations is an essential factor in directing funds to a specific site or community that needs to host, for example, refugees. Finally, and most importantly, the environmental factors where water resources are at risk of pollution due to the lack of essential sanitation services.
Efforts have been made to guide sanitation planning in Jordan on different scales. UNICEF has conducted a geographical multidimensional vulnerability analysis for Jordan, tackling other social and environmental sectors, including WASH [12]. In terms of water vulnerability, the highest vulnerability index score was associated with North-west parts of the country where most Syrian refugees are hosted within these areas. Furthermore, in terms of sanitation vulnerability, the highest vulnerability indexes correspond to these areas too. MWI prepared a second relevant report titled Vulnerable Water Resources in Jordan, Helmholtz Centre for Environmental Research (UFZ), and the Federal Institute for Geosciences and Natural Resources (BGR) [13]. This report identified 16 groundwater hotspots in Jordan, where domestic wastewater has contaminated water.
This paper aims to propose, design, and implement an integrated approach for sanitation services hotspots mapping in Jordan based on Analytic Hierarchy Process (AHP) method through Geographic Information Systems (GIS). This will support as a decision-making tool for future sanitation services development and interventions.
Evaluating the need for a specific area for sanitation services relies basically on evaluating and assessing several parameters and criteria. These parameters should include physical, demographic, and socio-economic factors to provide an accurate assessment of sanitation service needs. Ref. [14] developed a community-based sanitation sustainability index for evaluating the sustainability of sanitation systems in South Korea. The developed index takes into account several parameters, including water efficiency, public health, energy efficiency, capital costs, and other parameters. In another work by [15] in northern Argentina, a water and sanitation sustainability index was developed and estimated. This index was built with nine descriptors and fifteen indicators. These parameters covered all essential aspects of the sustainability of local water and sanitation management systems. Another model developed by [16] focuses on environmental issues and the efficiency and performance of the technical system. This model considered the temporal variations of several parameters like freshwater resources, drinking water, wastewater, and by-products. It was noted from these studies and others that they depend on evaluating several parameters and criteria, however, the method of evaluating and assessing these criteria was different.
2. Materials and Methods
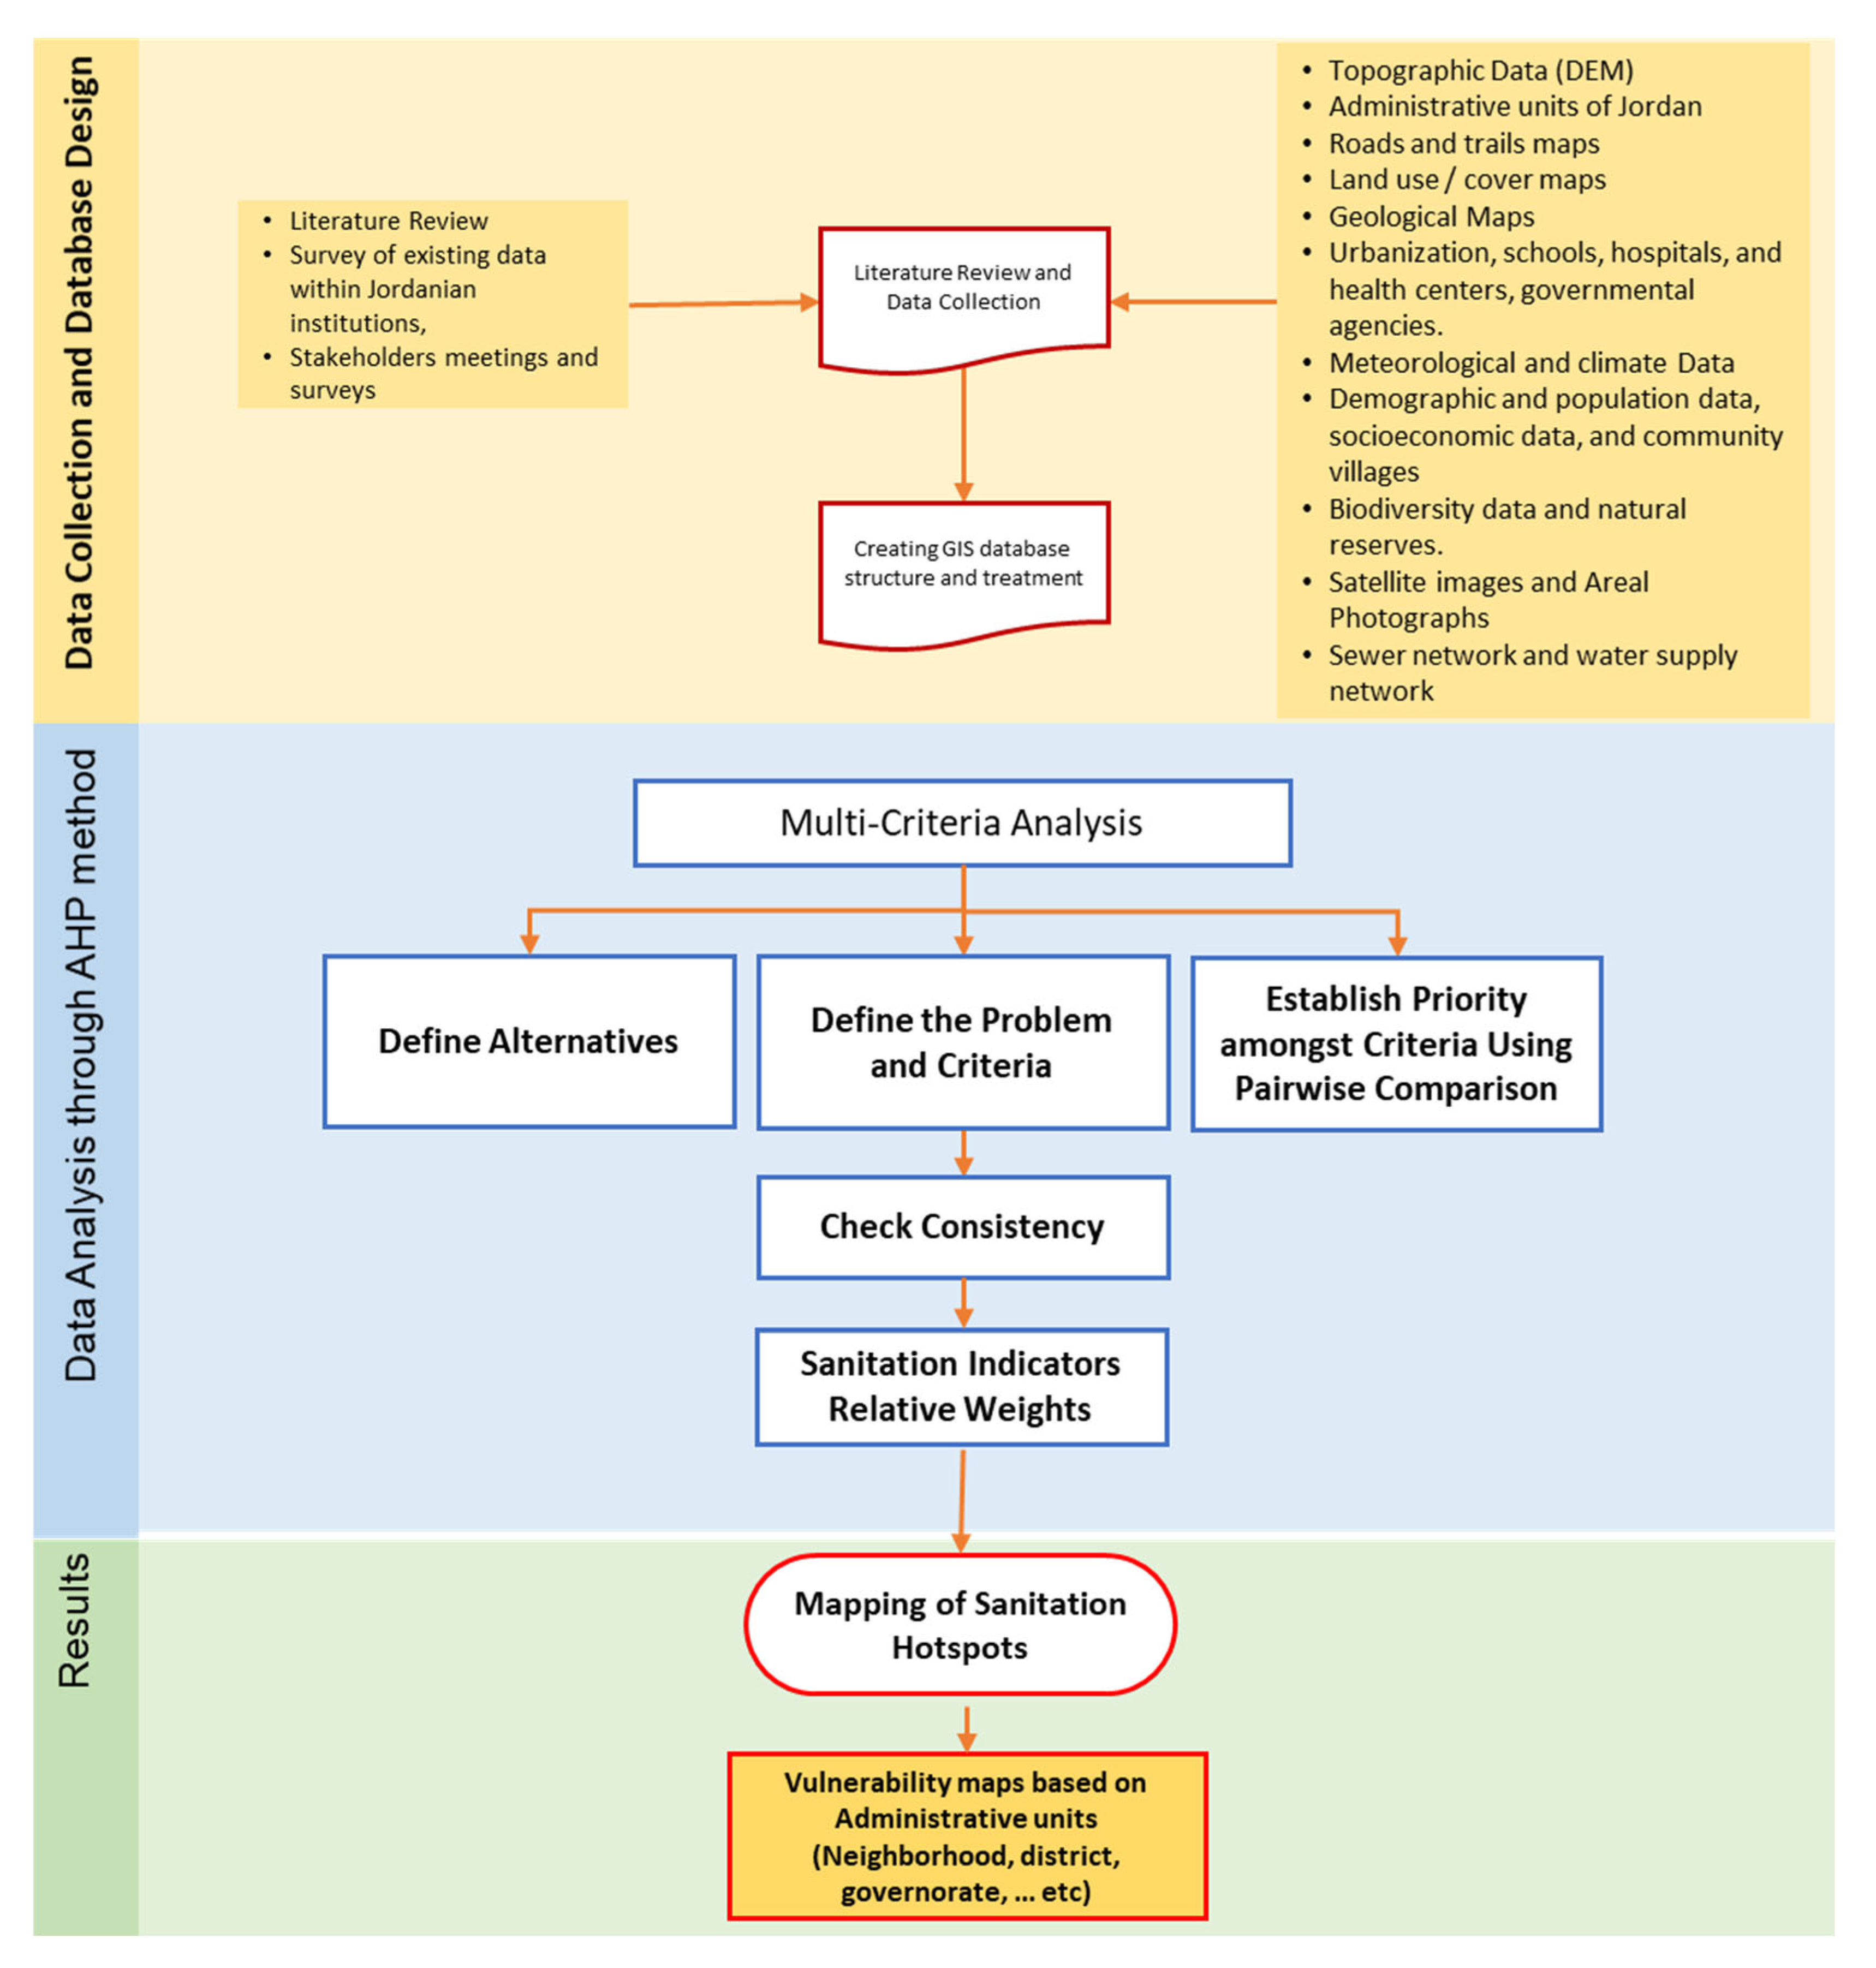
Figure 1 summarizes the adopted methodology to achieve the objective of this study, this includes data collection and creation of geodatabase, data processing and analysis, and sanitation hotspot mapping based on AHP results.
2.1. Data Collection and Geodatabase Creation
Collecting all relevant data sets from different ministries, departments, and data providers is essential for preparing sanitation hotspot mapping for Jordan. This includes collecting data with different standards, formats, projections, and datums; it is necessary to unify all collected data with a single standard datum and projection. Jordan Transverse Mercator (JTM) was used in this study for this purpose. JTM is based on Universal Transverse Mercator (UTM) zones 36 and 37. The collected data include topographic, demographic, meteorological, infrastructural, and land use/cover data, as shown in Figure 1, in addition to available information about areas with sanitation services in Jordan. File geodatabase was created to store and manipulate the collected data using ArcGIS 10.8.1 (University of Sharjah, Sharjah, UAE).
2.2. Data Processing and Analysis
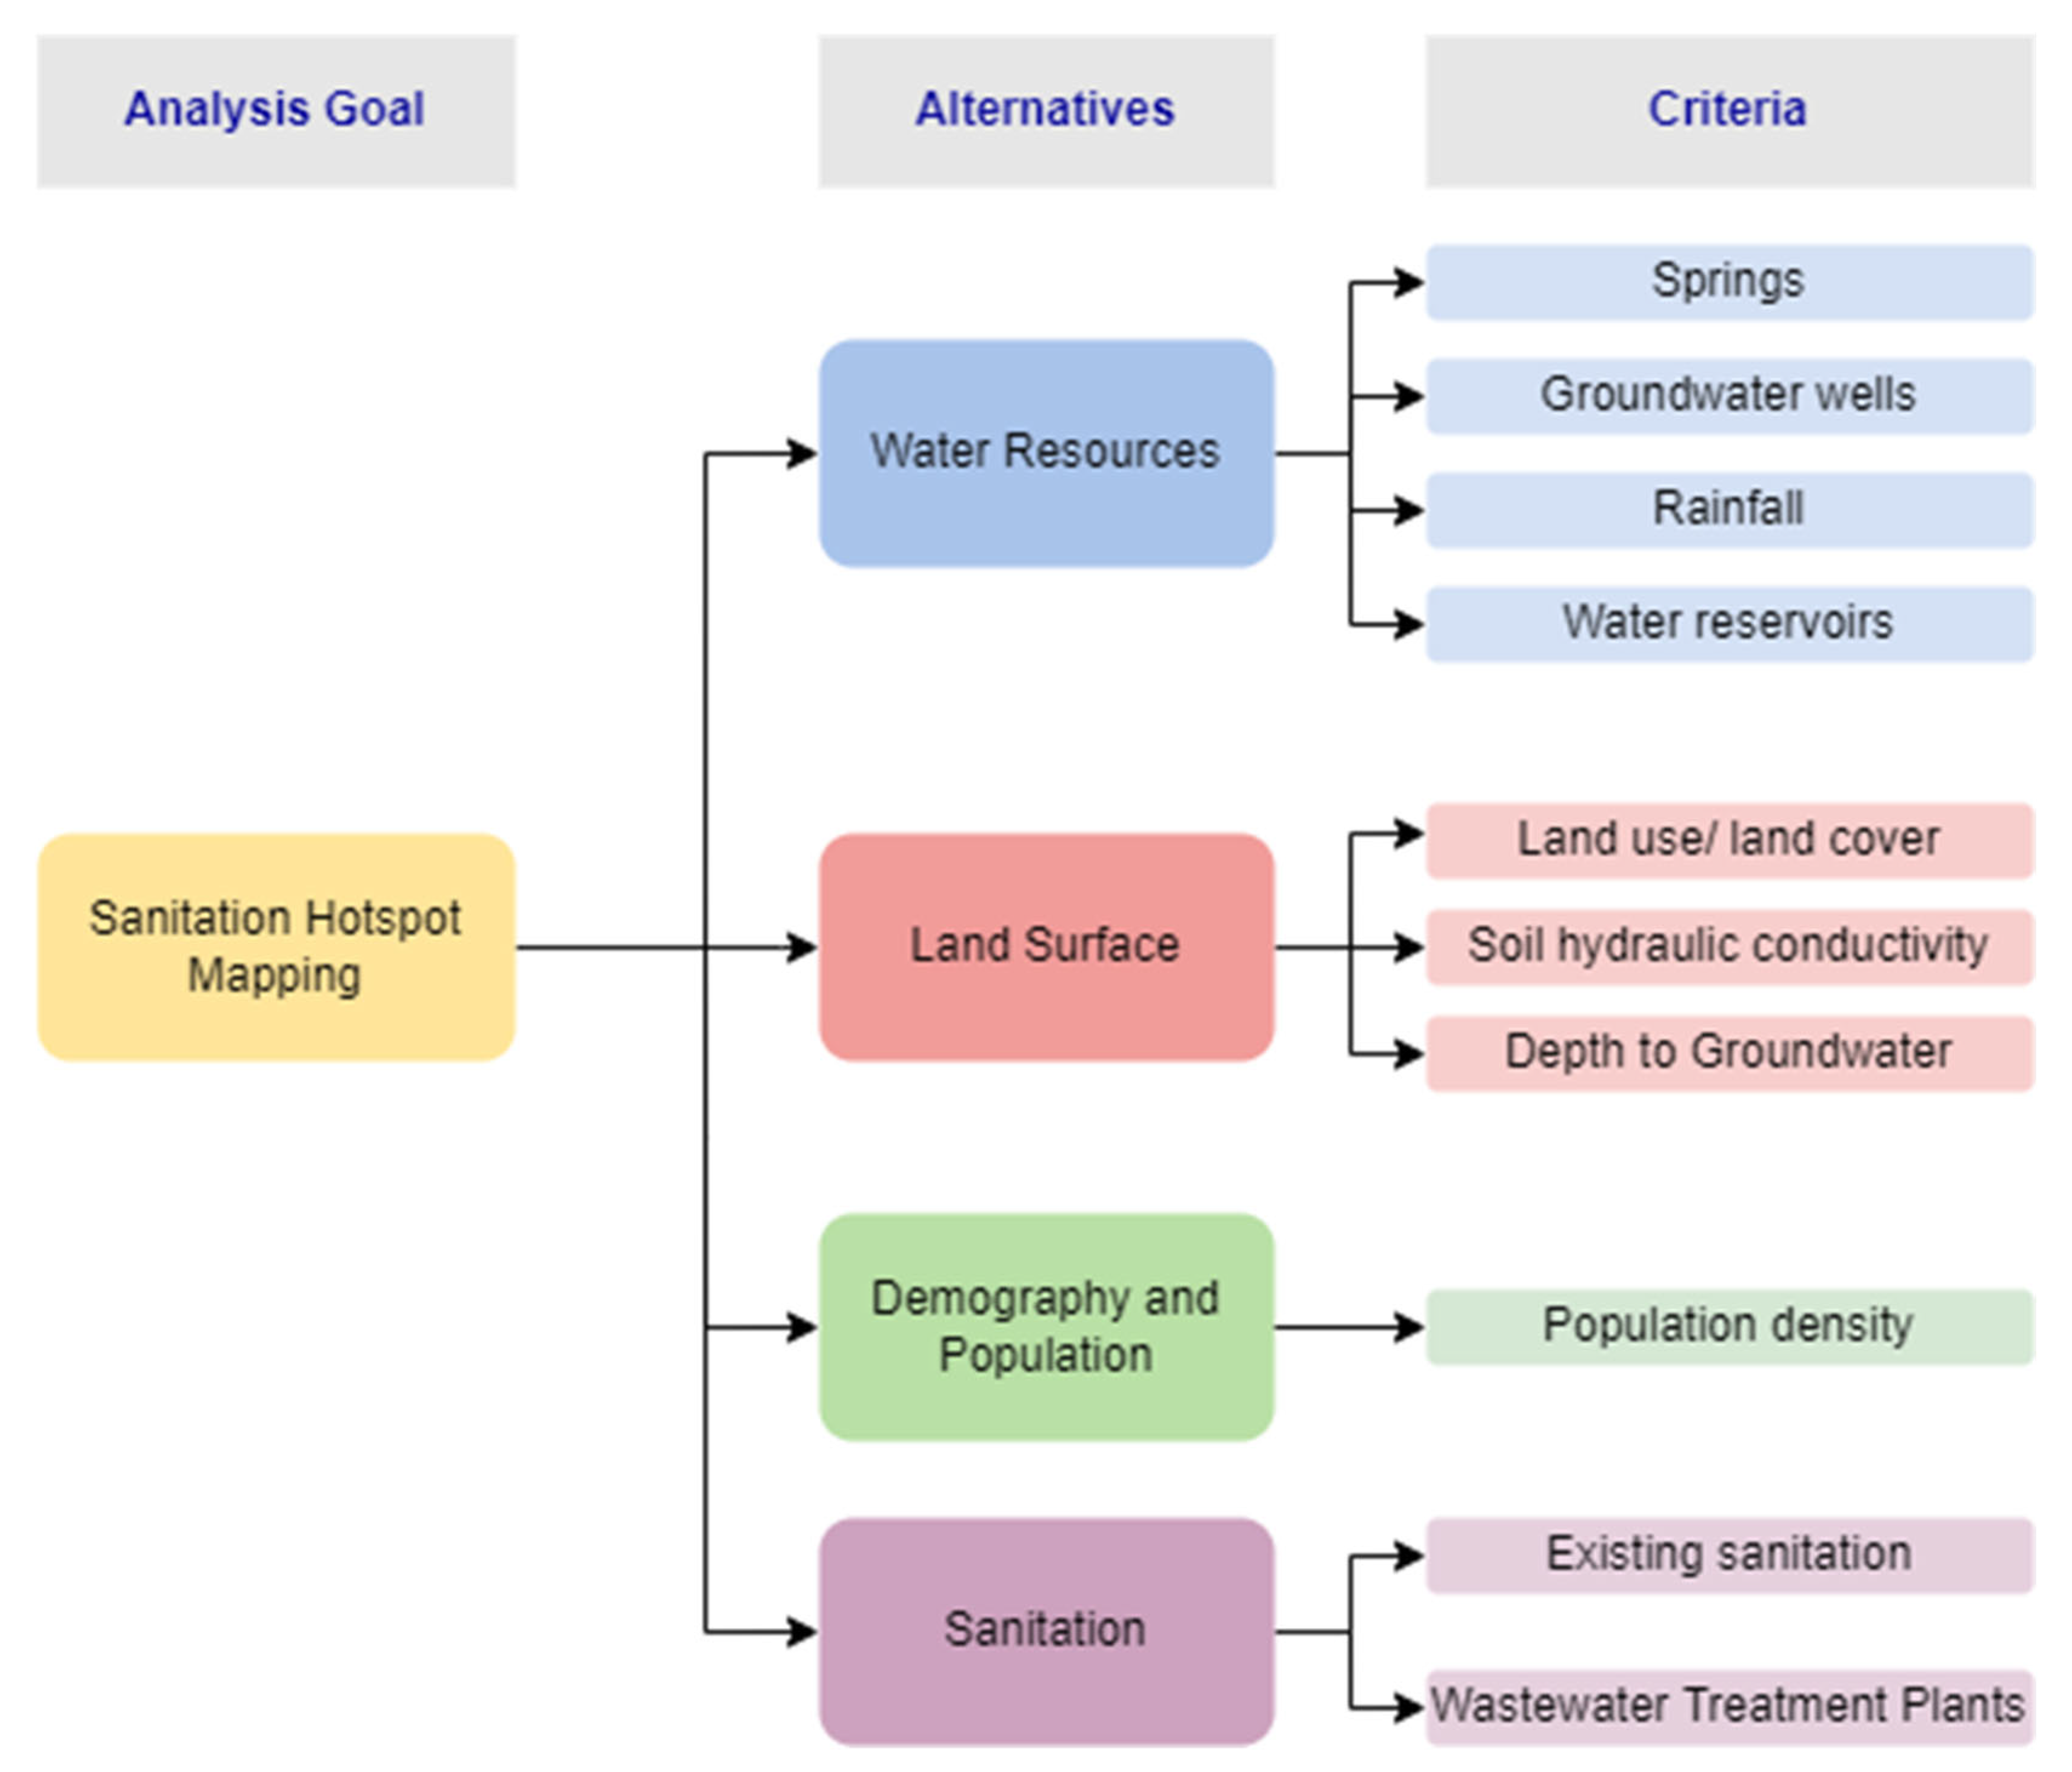
In this work, Analytic Hierarchy Process (AHP) method was used to develop a GIS model for sanitation hotspot mapping. This is a decision-making support method for selecting a solution from alternatives based on a multiple-criteria assessment [17]. Several researchers around the world used this method for different purposes, including decision-making in complex environments [18], landfill site selection [19,20], and natural hazards risk assessment [21,22,23]. However, a limited number of publications have tackled sanitation hotspot mapping using AHP. According to [17], AHP can be implemented by setting an analysis goal and then evaluating a set of alternatives and criteria that define this goal. The requirements are prioritized by making a pairwise comparison and calculating the relative weight of every bar. This step is followed by consistency analysis to check the reliability of this analysis. AHP will be used in this paper to develop a weighted multi-criteria model for sanitation hotspot mapping. This model will be based on the developed geodatabase that contains all relevant layers. Figure 2 shows a schematic diagram that shows the goal, alternatives, and criteria for the implemented AHP.
2.3. Sanitation Hotspot Mapping Based on AHP Results
The outcomes of the AHP analysis are a set of weighted criteria for sanitation hotspots in Jordan. Each criterion will be presented as a separate GIS layer within the created geodatabase. The Sanitation Hotspot Index (SHI) will be calculated based on these layers according to the following equation:
where, i: Criterion, n: Number of Criteria, Wi: Criteria Weight (Based on AHP Analysis), Vi: Value of each Criterion (Based on stockholders and expert judgment). The generated map will be validated based on collected information about the existing sanitation services in Jordan.
3. Results and Discussion
As shown in Figure 2, a goal was set for this work to start with mapping the sanitation hotspots in Jordan. Ten criteria grouped into four main categories (alternatives) were analyzed to achieve this goal. A pairwise analysis matrix was created to establish the relative importance of different aspects related to sanitation hotspot mapping. Selecting the appropriate number of pairwise criteria and calculating the measure weights based on this pairwise analysis is one of the challenges of AHP [24]. One option to overcome this challenge is to collect an expert judgment in pairwise criteria analysis [25]. A virtual workshop was conducted online due to COVID-19 pandemic restrictions, where relevant experts from academia, private sectors, NGOs, representatives from ministries, water and sanitation authorities, and municipalities were invited and participated in this workshop. Roundtable discussions were aimed at selecting and prioritizing criteria for sanitation hotspot mapping. Based on these discussions, experts and stakeholders concluded that the most critical parameters for this purpose are shown in Table 1. A pairwise matrix was developed to calculate every criterion’s relative weight based on the selected criteria. Table 2 and Table 3 show the AHP pairwise comparison and the calculated standard’s relative weights.
To construct Table 2, the AHP Pairwise matrix for the selected criteria, each criterion was assigned a score from 1 to 9 based on its relative importance, with 9 having the highest relative importance. If the row criterion is more important than the column criterion, the score ranges between 1 and 9. Contrarily, when the row criterion is less important than the column criterion, the score ranges between the reciprocals of 1 and 9 (i.e., 1/9 to 1/2). Once the AHP pairwise matrix was established, the criteria scores were normalized to obtain each criterion’s relative weight. The normalization was performed by dividing each value in Table 2 by its corresponding total column value. The relative weight of each criterion was calculated by adding its corresponding row values in the normalized matrix. The normalized matrix, as well as the relative weights, are shown in Table 3.
Following the collection of criteria relative weights, a consistency analysis was performed based on Consistency Index (C.I) and Consistency Ratio (C.R), which are given by [17]:
where, n: number of parameters included in the analysis, Random Index (R.I) values are given in Table 4.
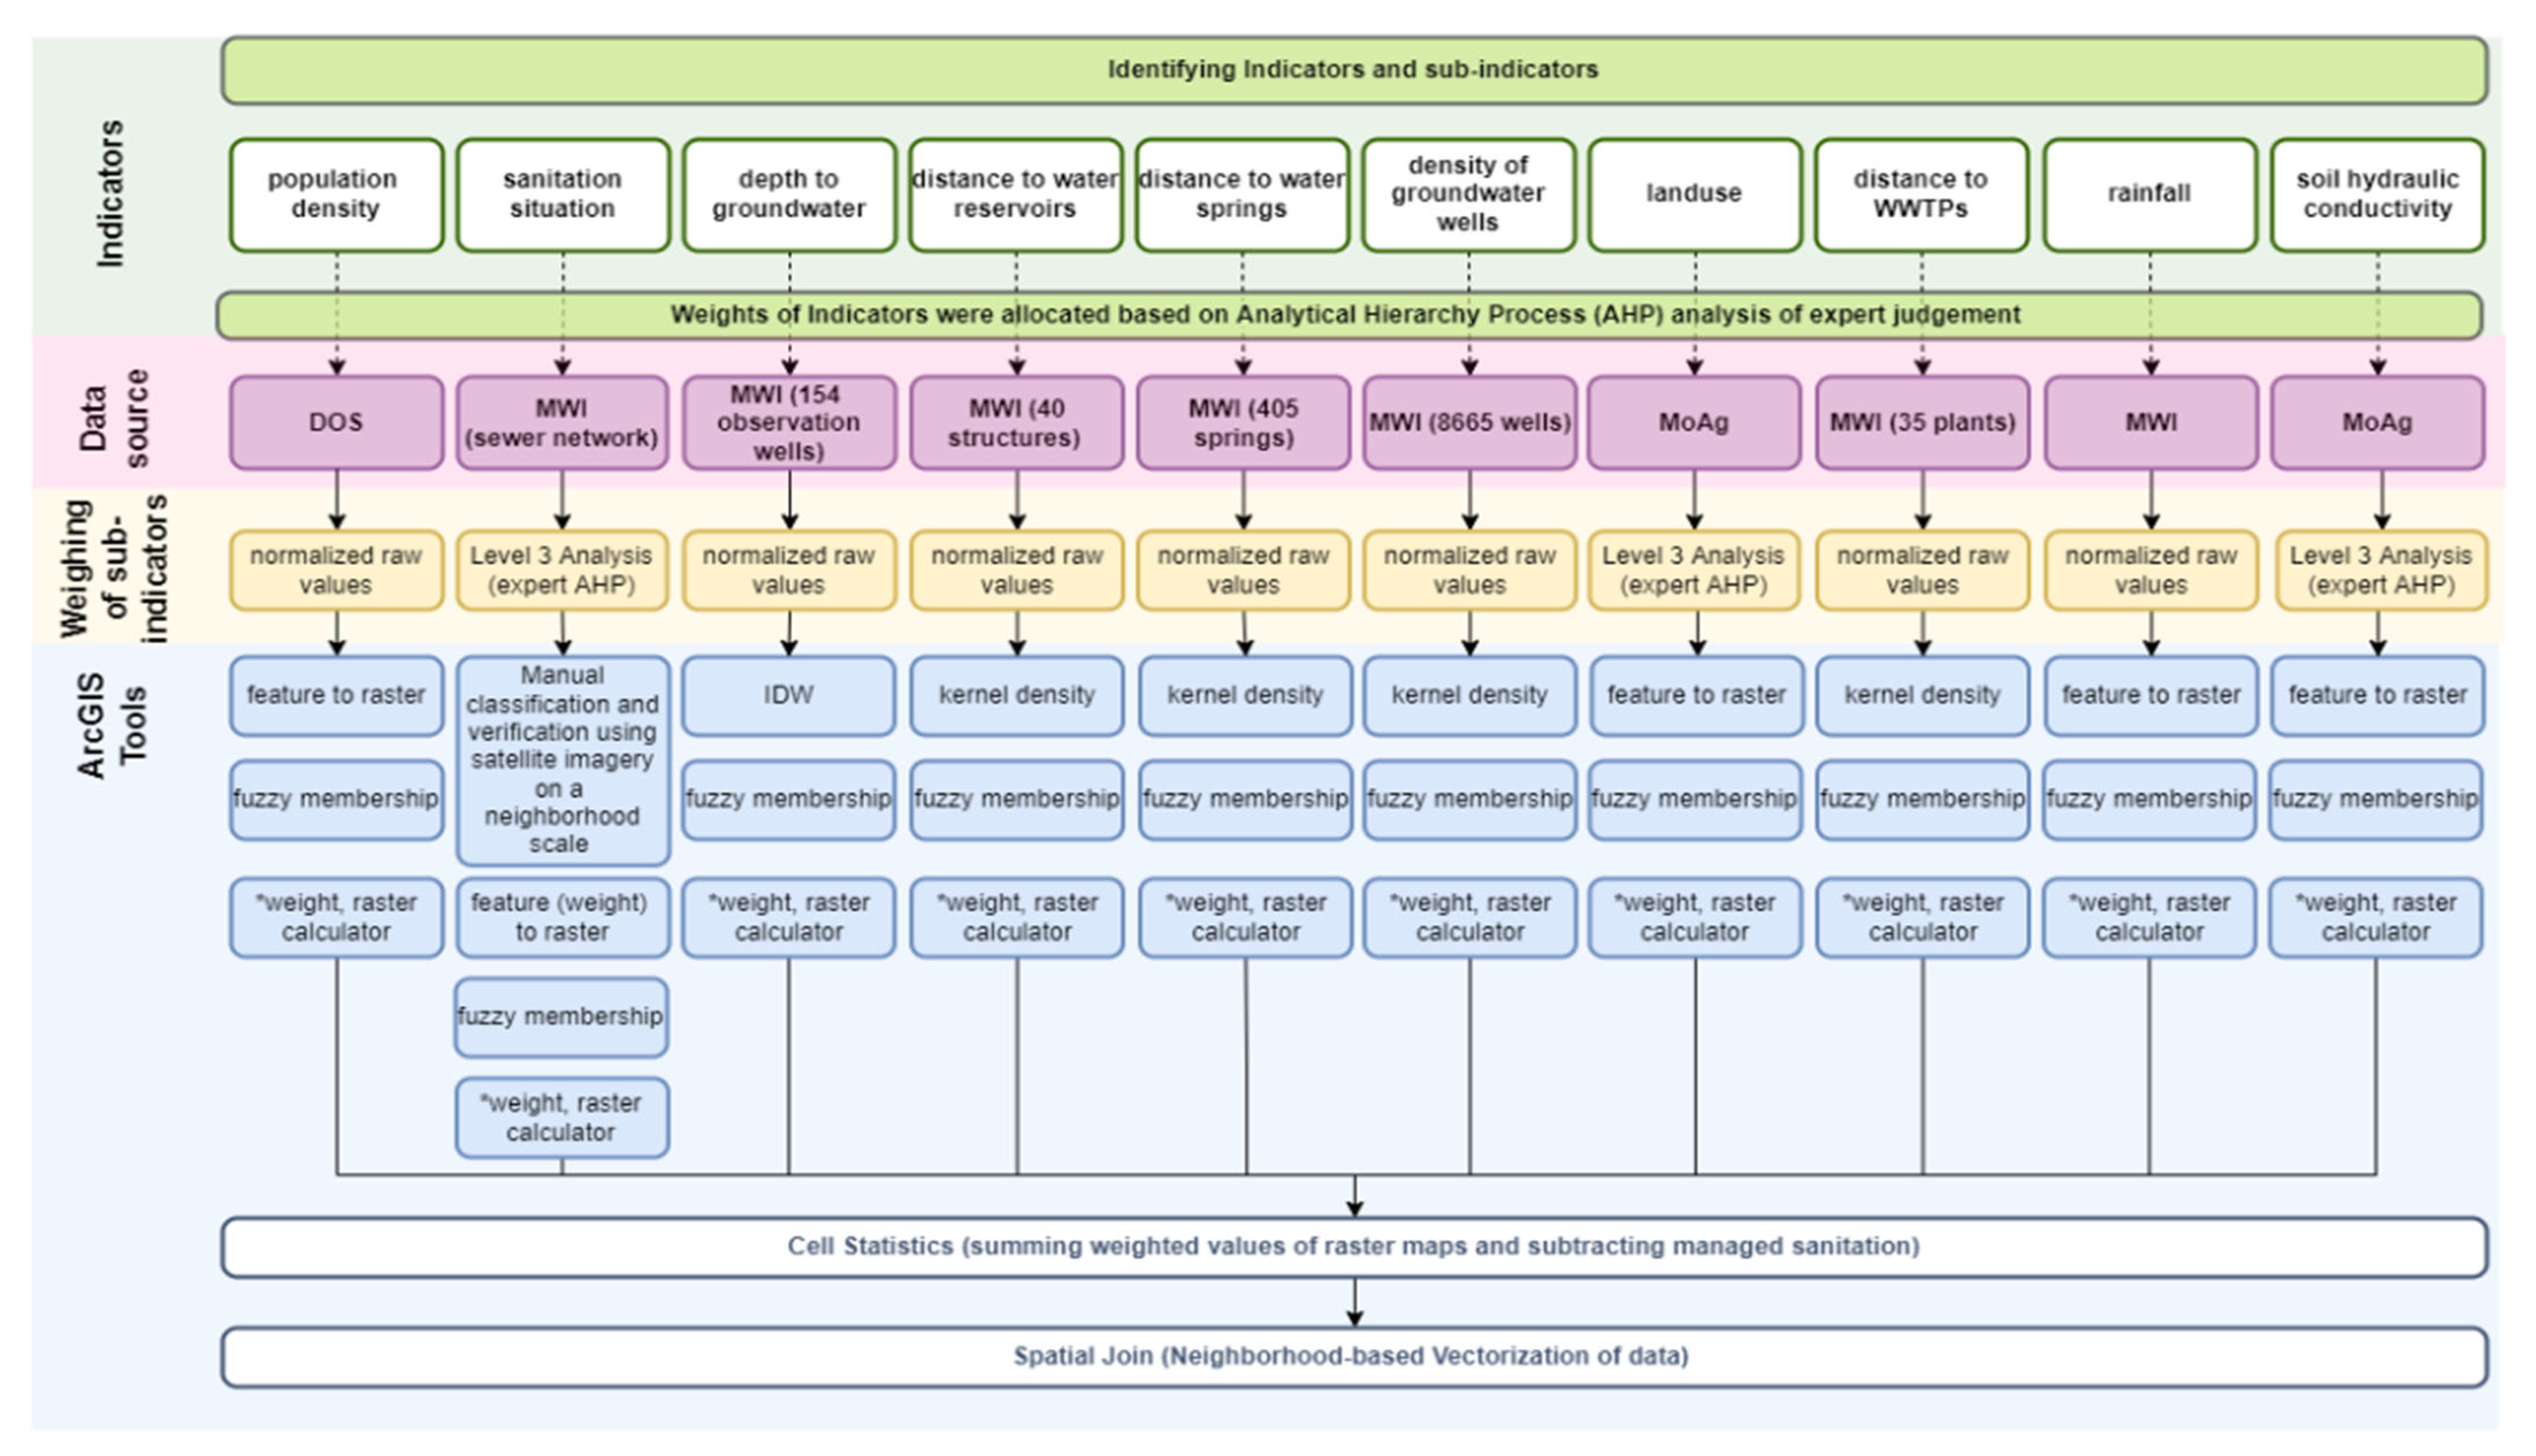
The calculated consistency ratio was (0.0619), and according to [17], the acceptable ratio should be less than (0.1). As each criterion includes multiple sub-criteria that make up its relative weight, detailed analysis for each criterion was performed via ArcGIS tools, classification, and verification to result in raster maps that represent each indicator, and its sub-indicators, and their respective weights, as shown in Figure 3. In the next sections, a detailed description of these criteria will be presented.
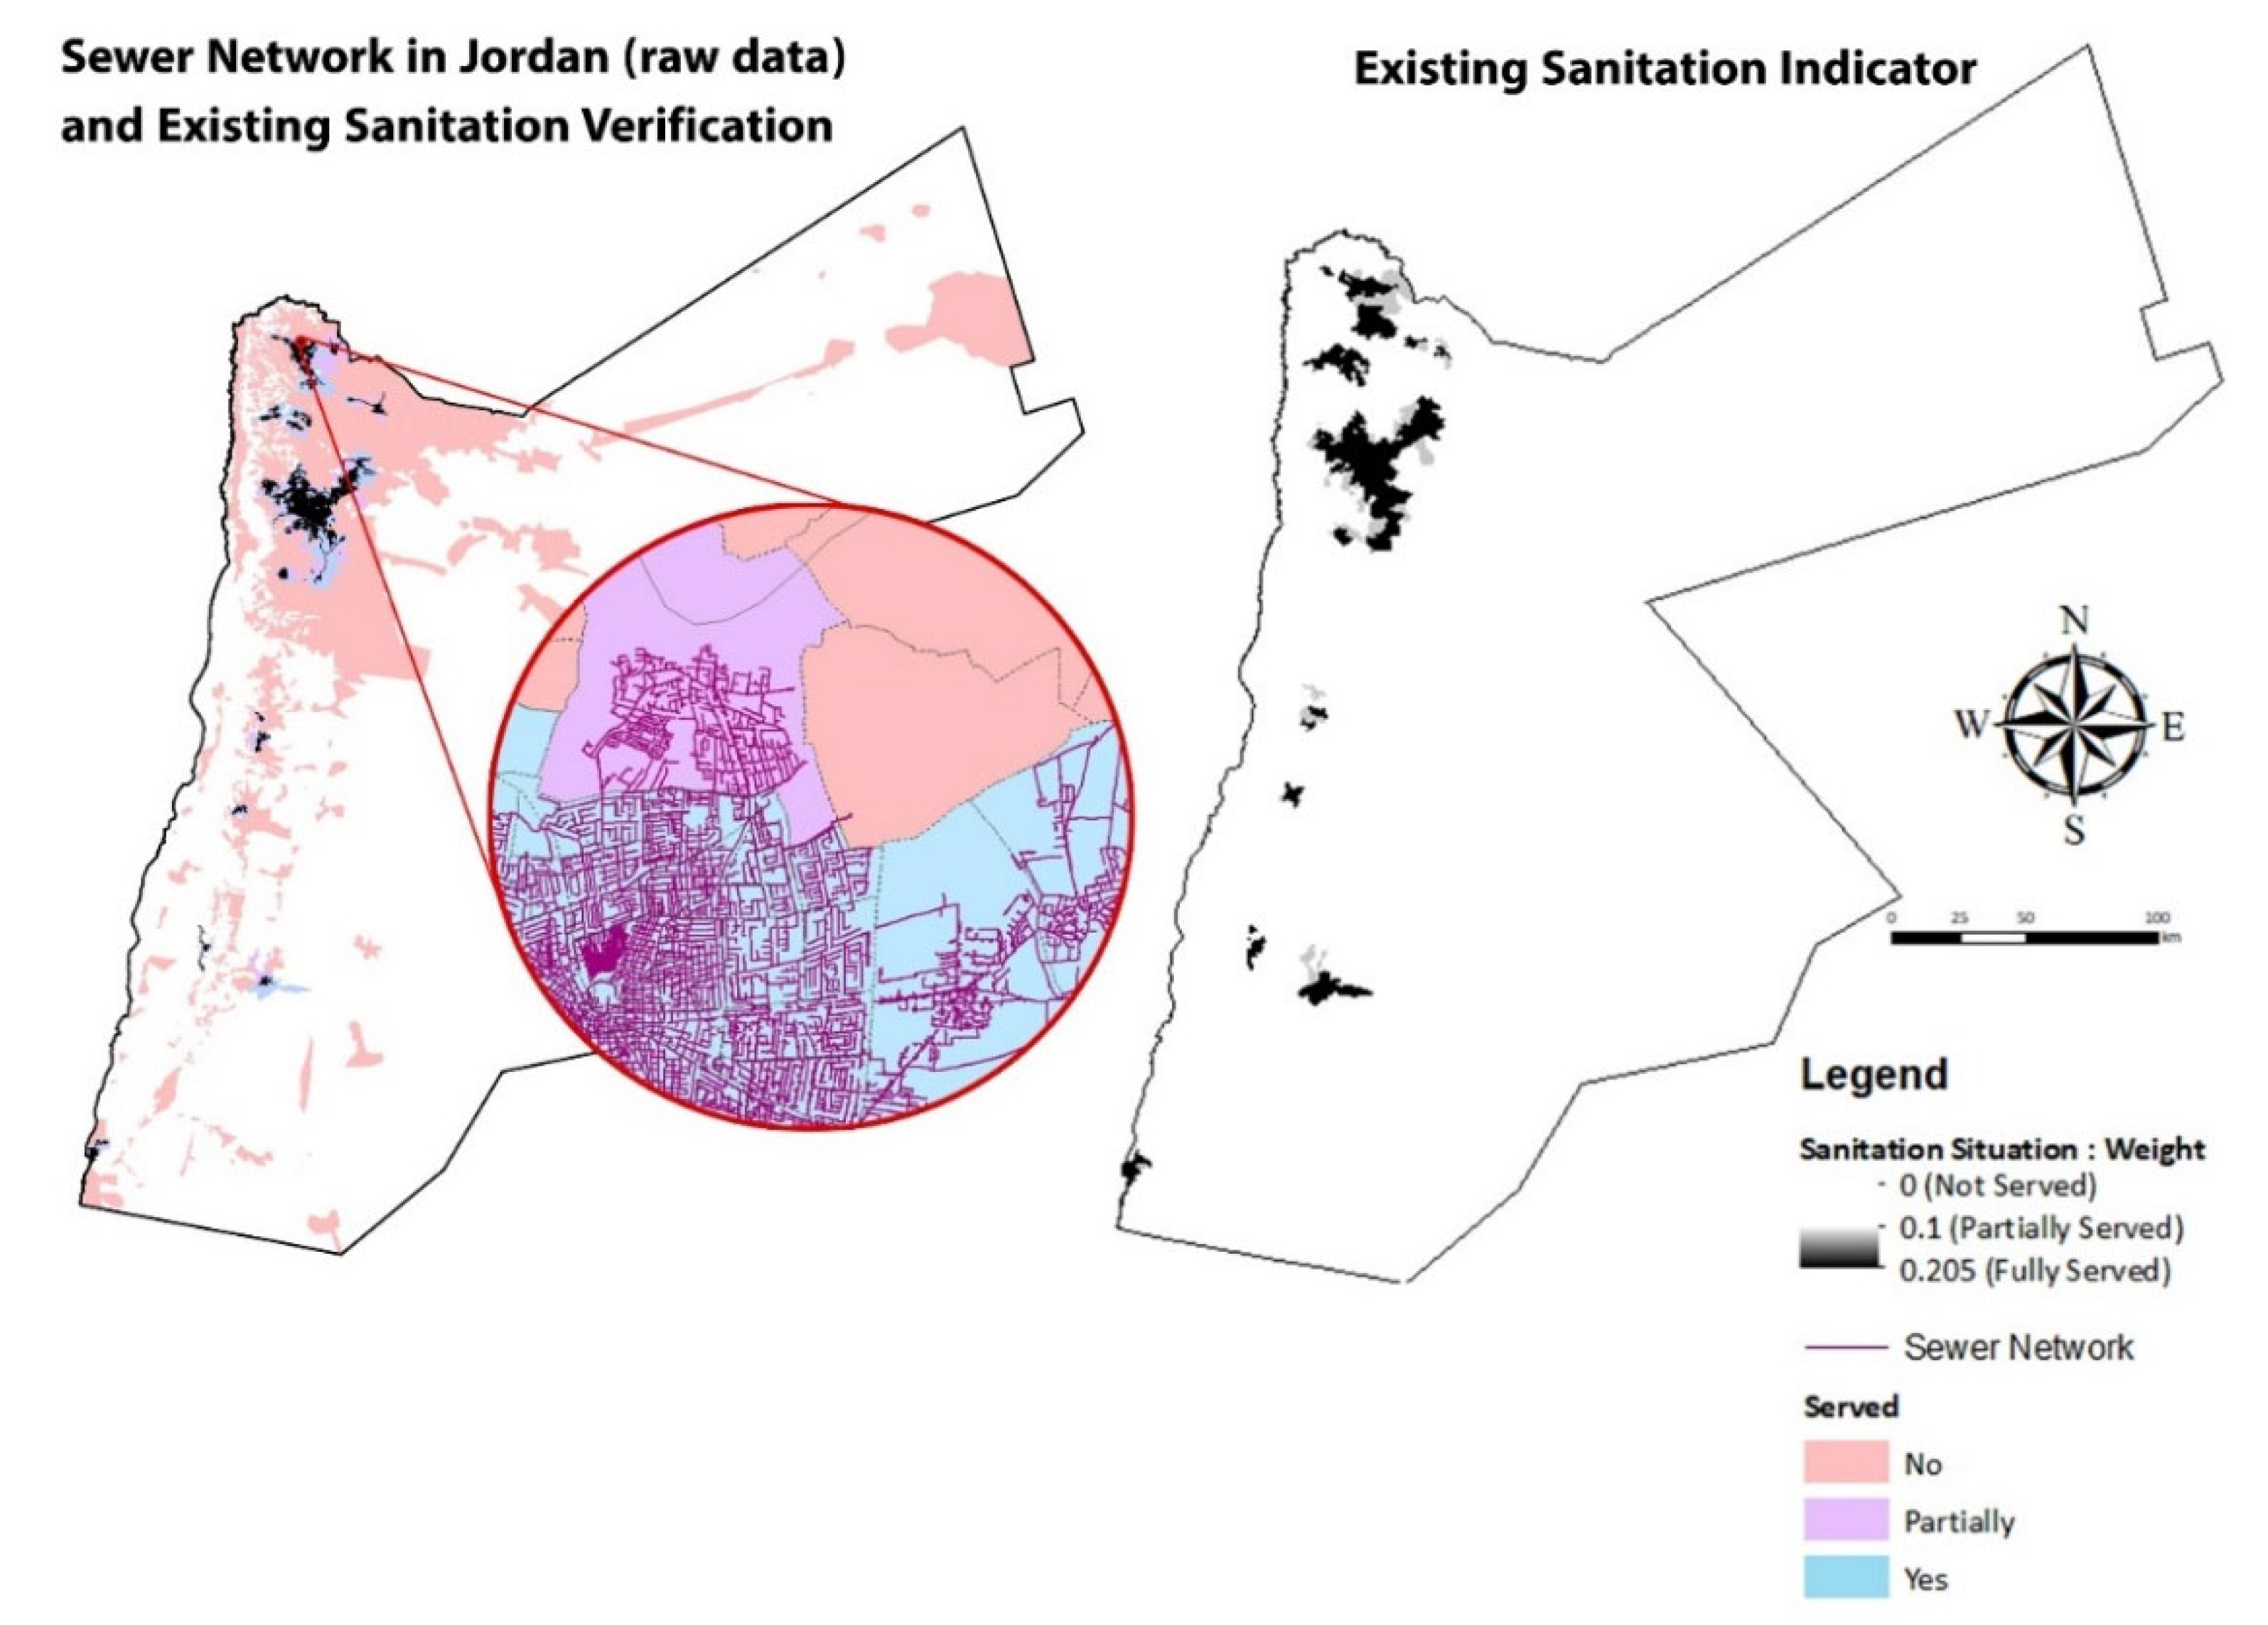
3.1. Existing Sanitation Services
This parameter describes the situation of sanitation services within the country’s neighborhoods. The collected data mainly depended on obtained sewer network data from MWI and a survey done by DOS in 2015 and revised in 2018. According to the collected DOS data, three responses were collected to the question “What type of sanitation do you currently have at your home/facility? These are sanitation network, cesspit, and none of these”. The collected data was finally verified using satellite imagery to determine the level of sanitation service (fully, partially, or not served) for each neighborhood in Jordan. Fully served areas obtained a score of 0.205, while the scores of partially served and unserved neighborhoods were 0.1 and 0, respectively. As Figure 4 shows, almost 31.5% of neighborhoods in Jordan are fully served, 4.8% are partially served, and 63.7% are unserved. In addition, more than 65% of the population is connected to the sewerage system.
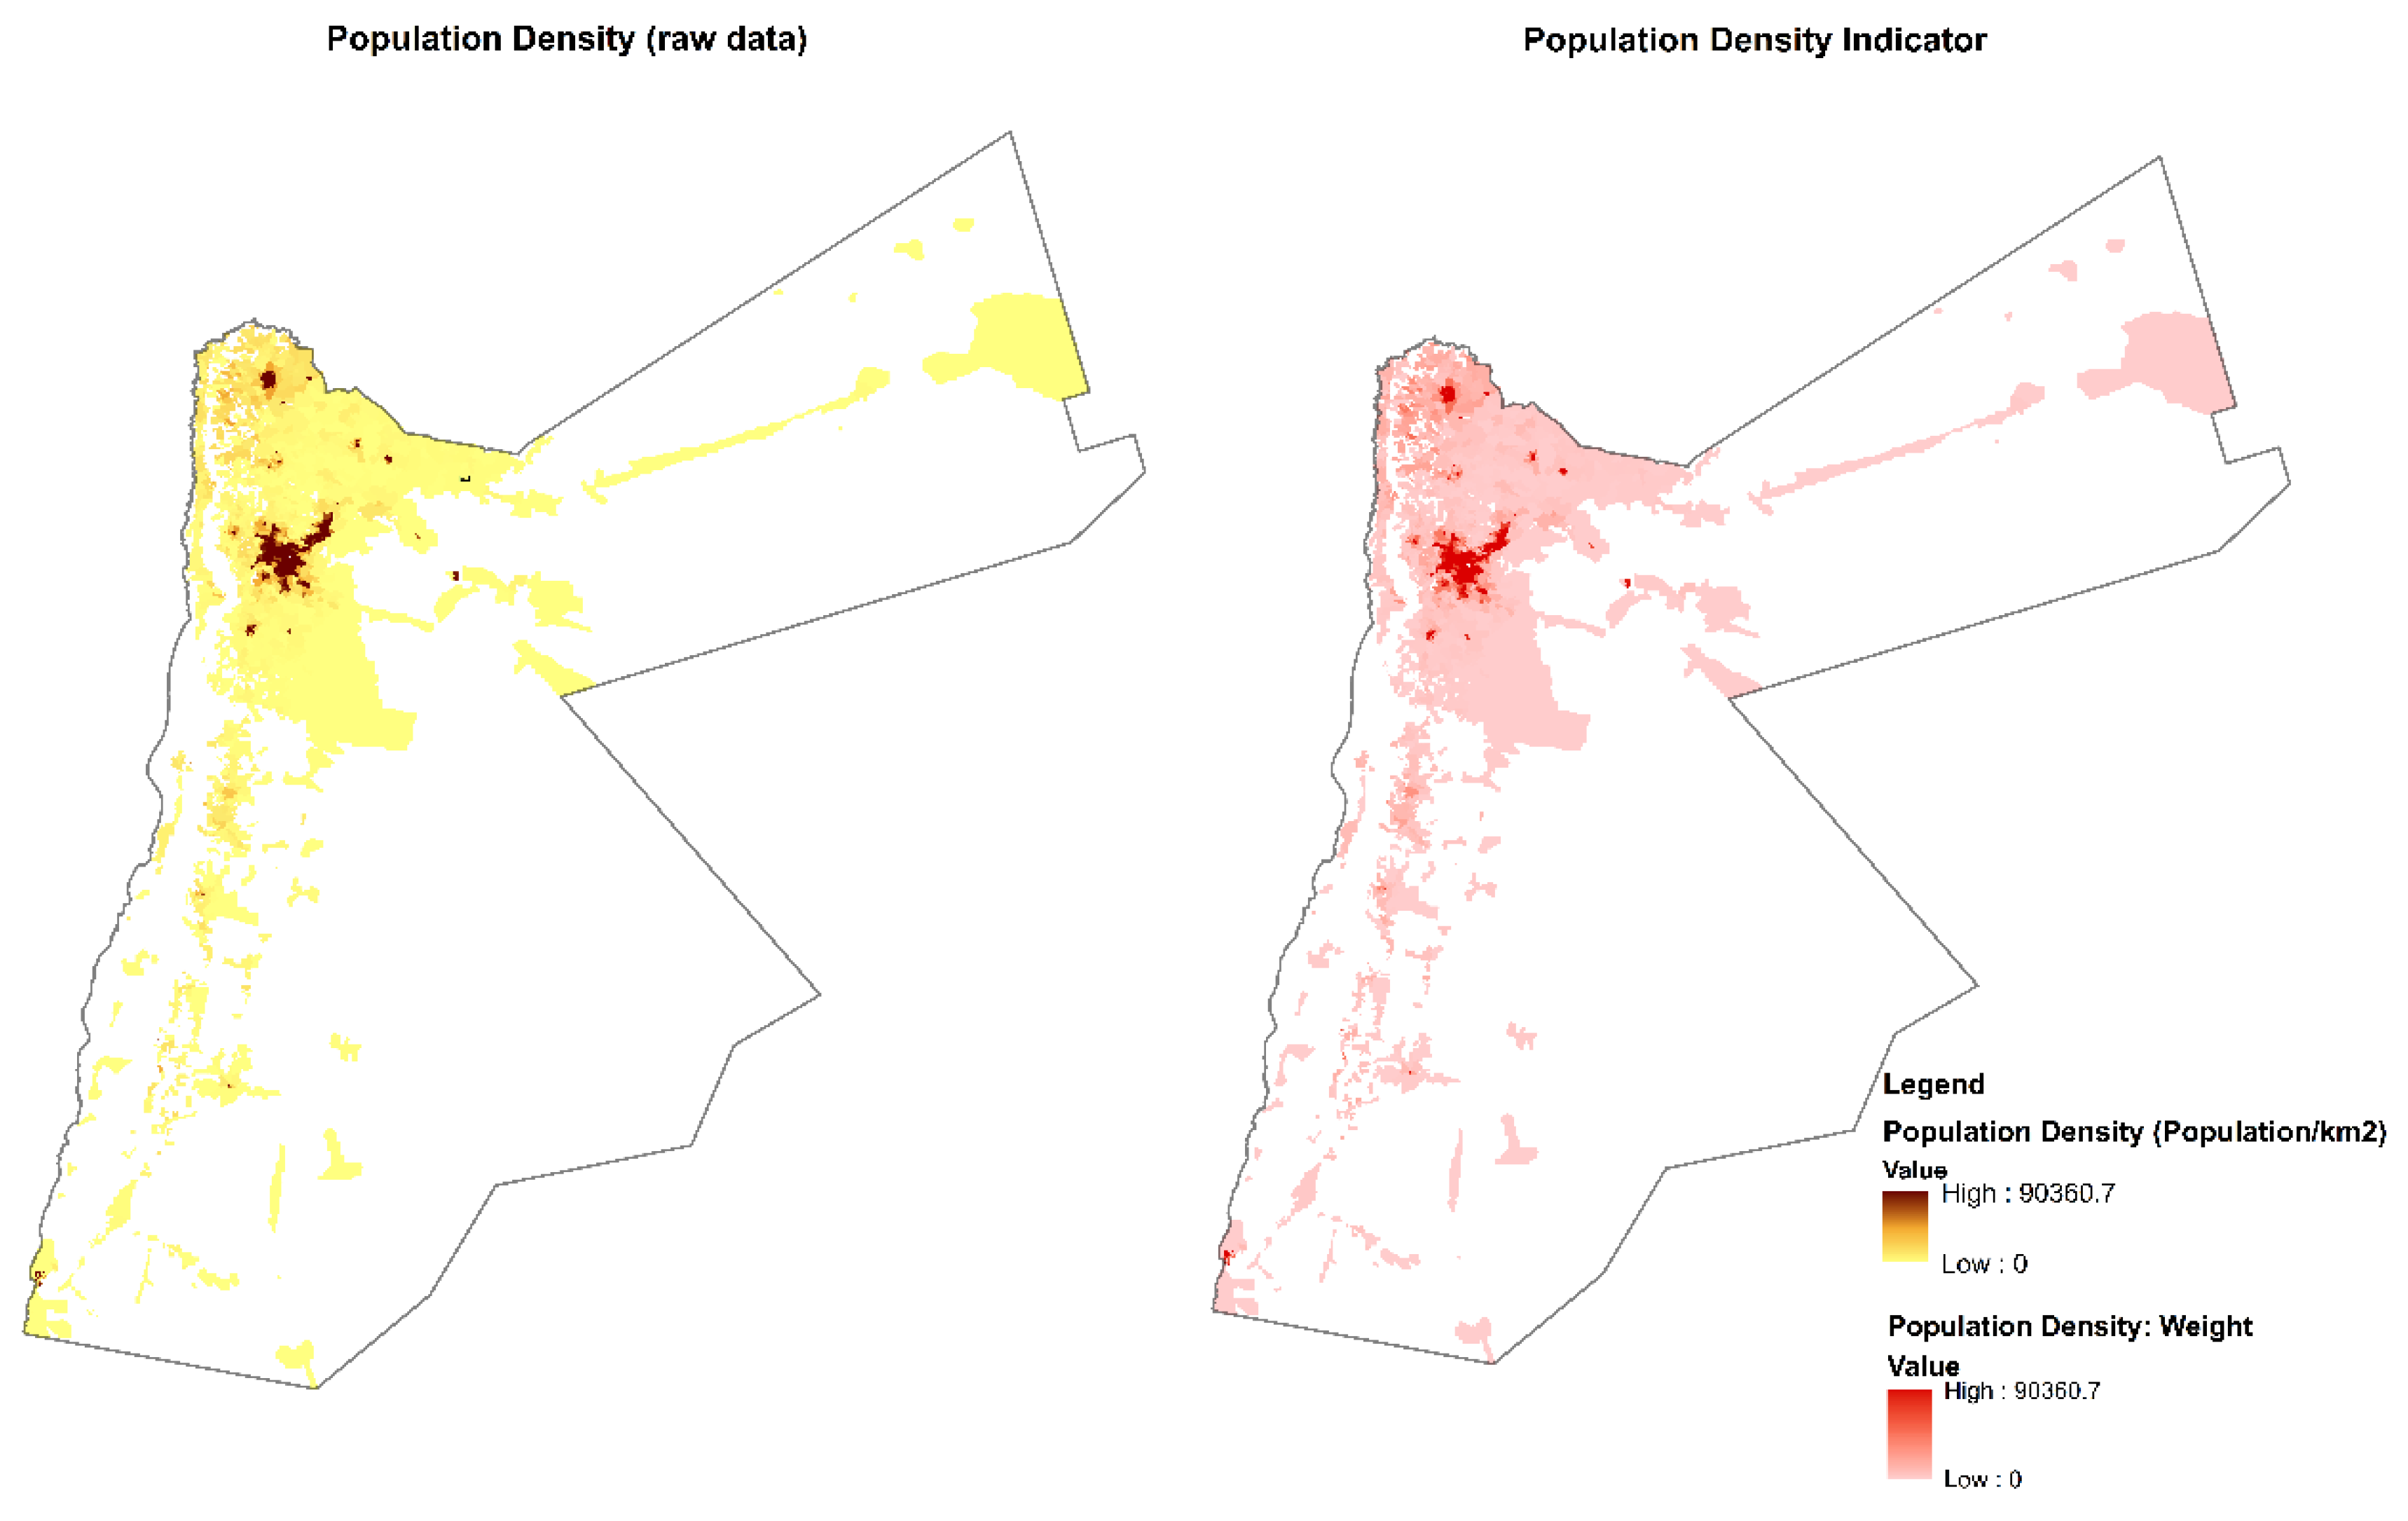
3.2. Population Density
Another critical parameter in this study was the population density, as areas with higher population densities require prompt sanitation services. The obtained population density data were normalized and scored from 0–0.285. Figure 5 shows the generated population density indicator layer.
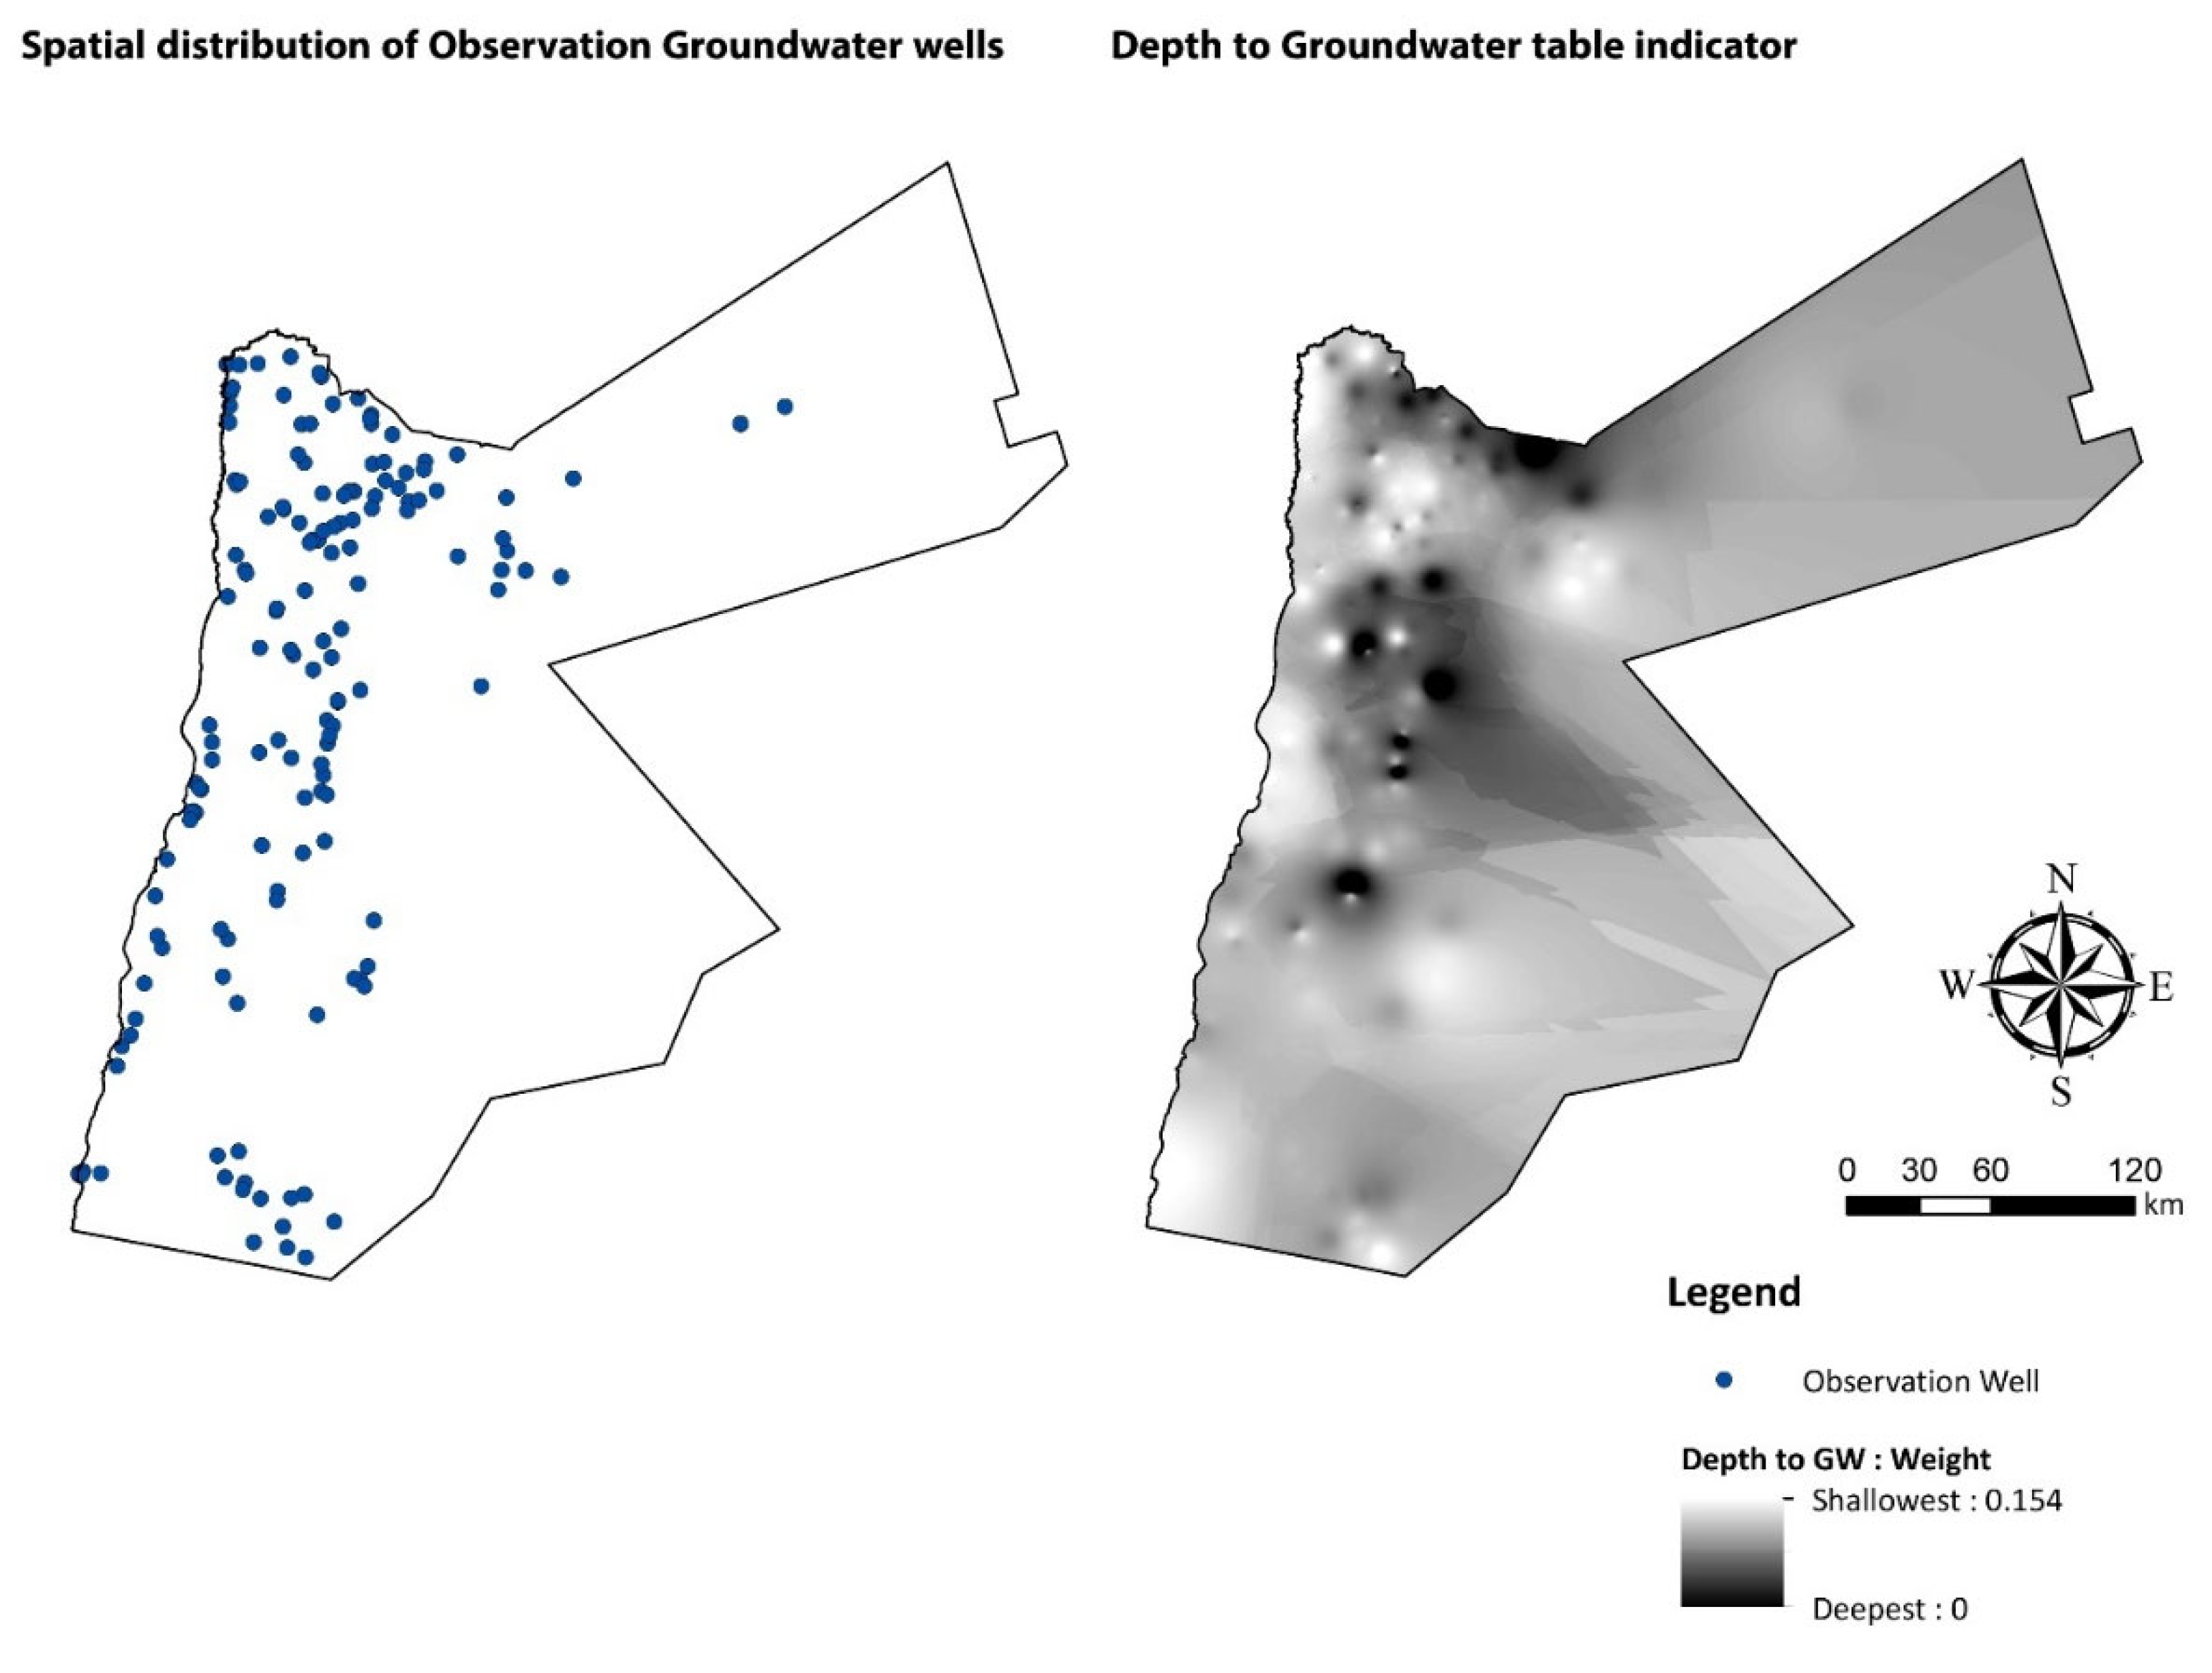
3.3. Depth to Groundwater
Jordan is one of the countries with limited and stressed water resources. The government of Jordan pays great attention to protecting these resources, including groundwater (GW) resources. Therefore, as the GW table becomes shallower, it becomes more vulnerable to pollution. GW data was collected from the Ministry of Water and Irrigation (MWI). The GW depth ranges were normalized according to the total indicator weight (0.154), as shown in Figure 6.
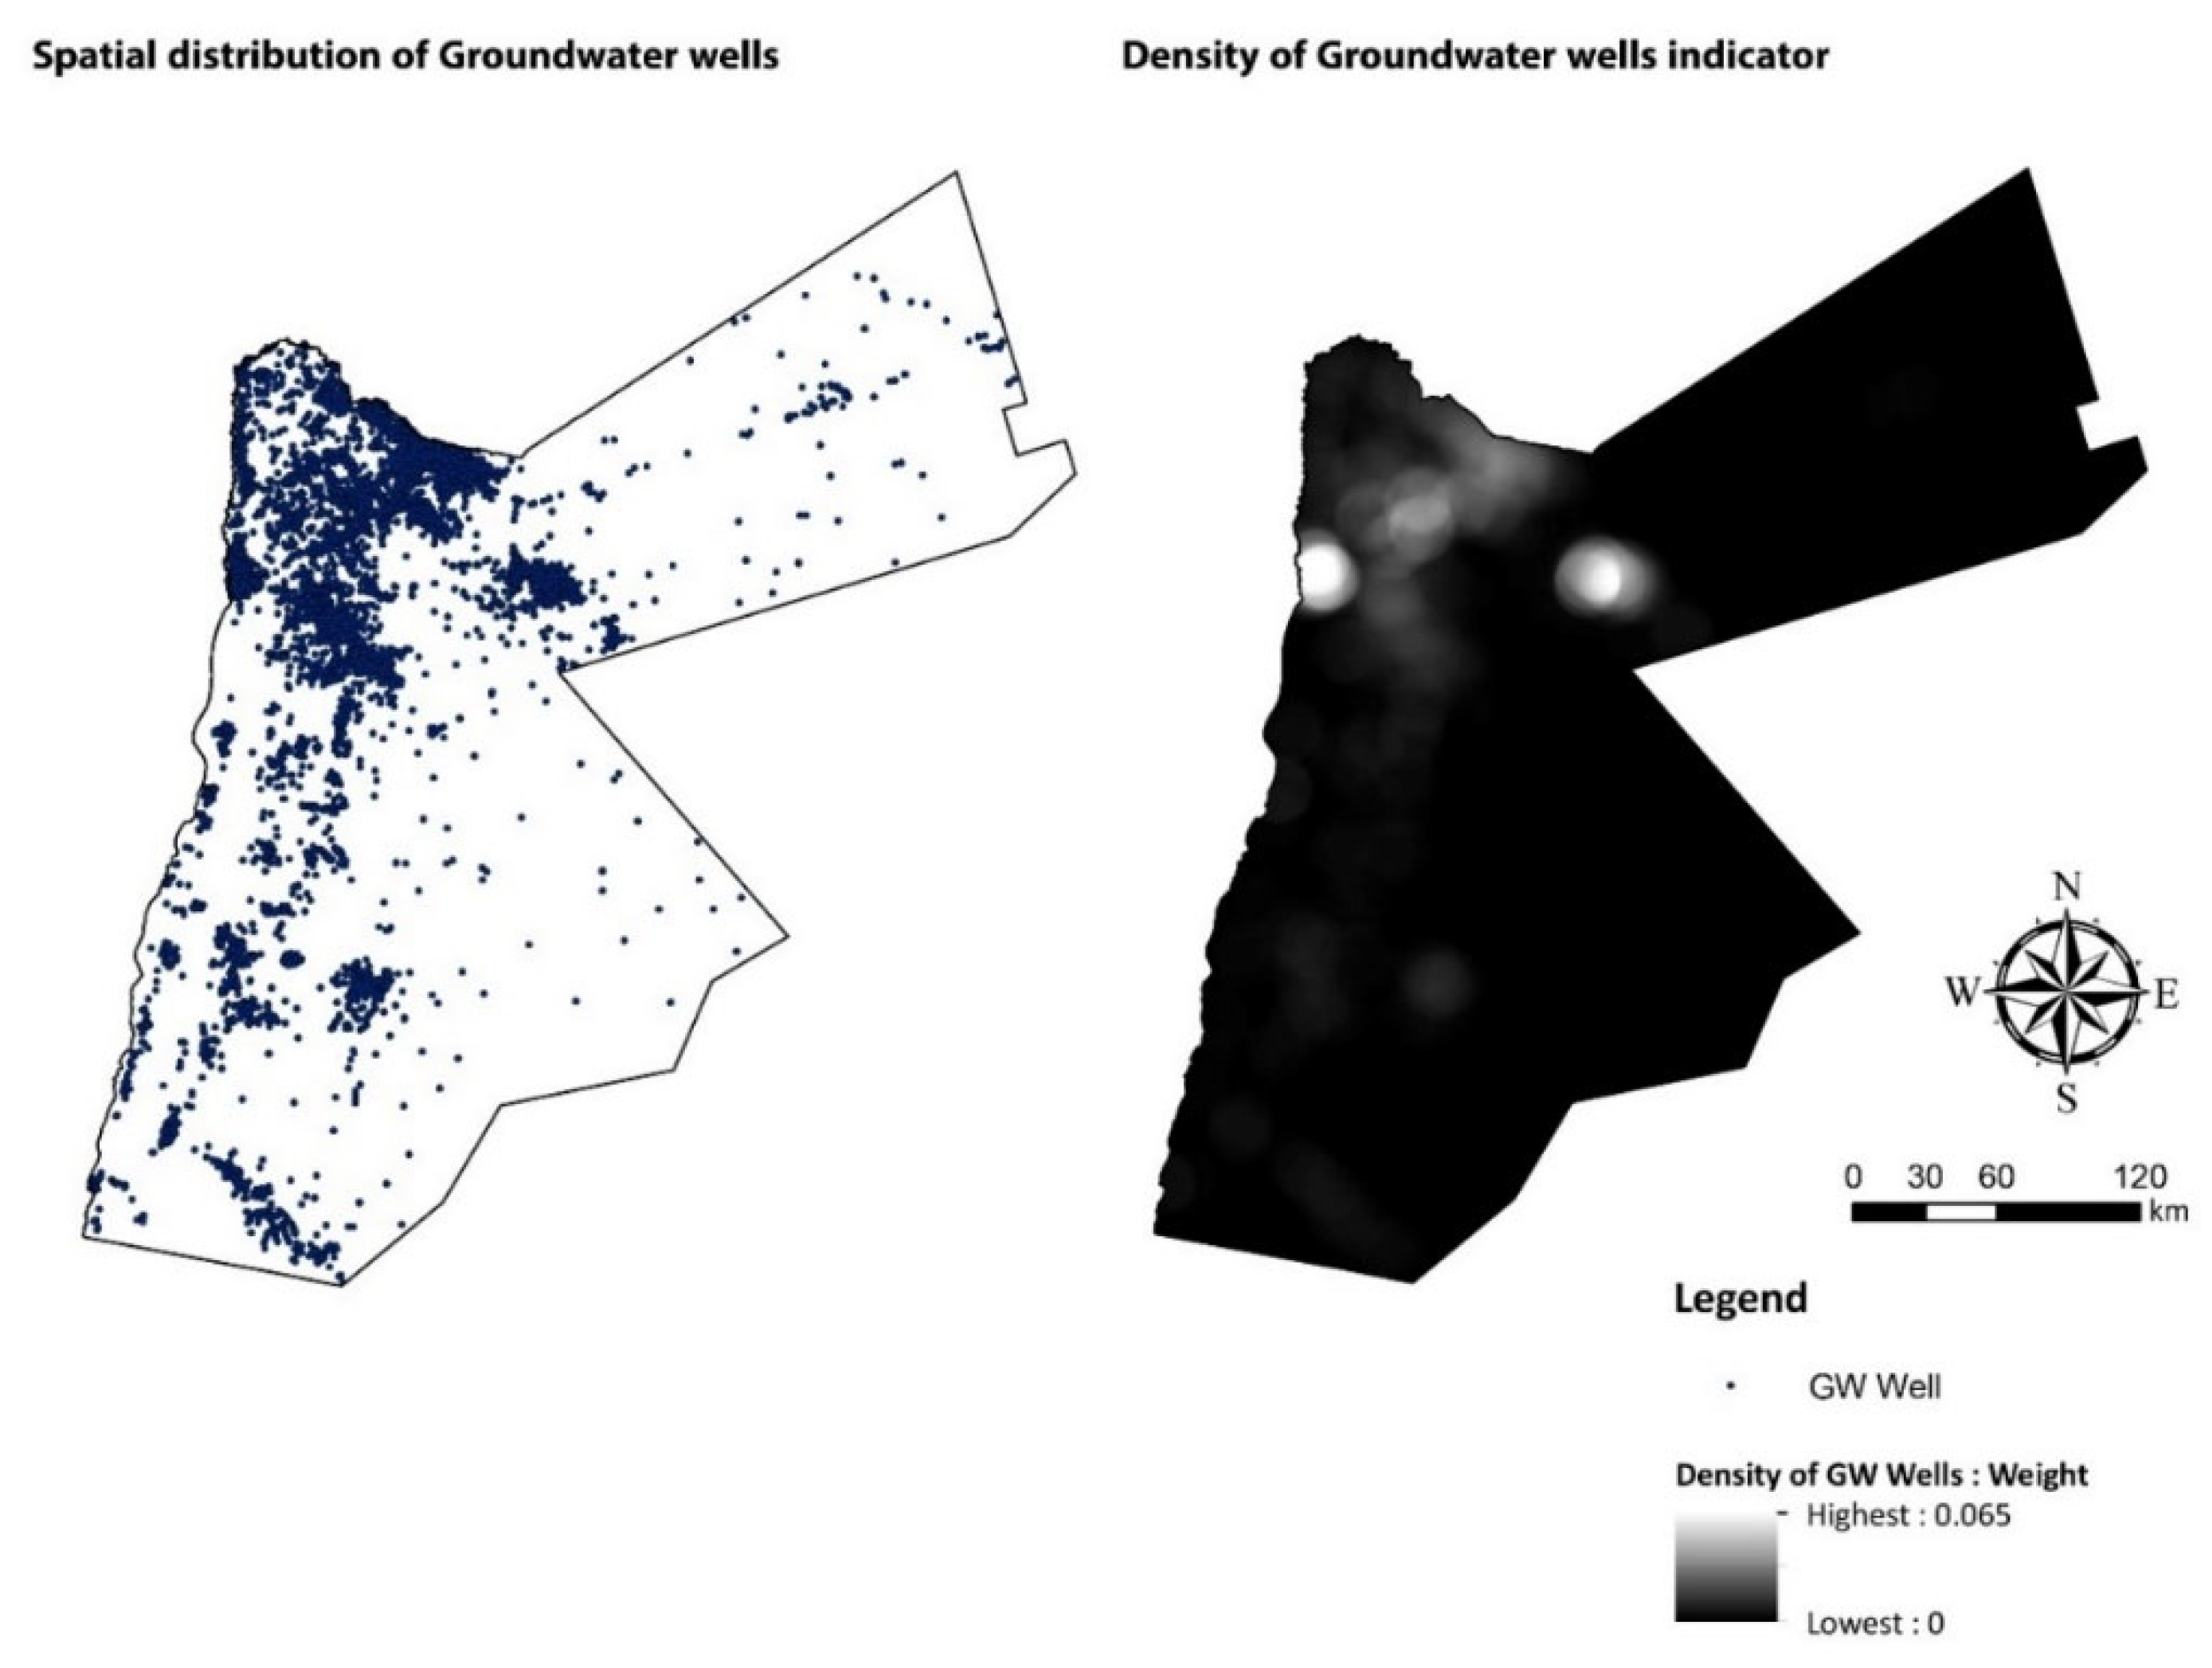
3.4. Density of Groundwater Wells
Another parameter related to groundwater protection is the density of groundwater wells. In Jordan, GW is a significant source for drinking, irrigation, and other activities as the country lacks an abundance of surface water resources. The density of GW wells indicates the freshwater pumping activities. Therefore, the density of GW wells was considered in this analysis to protect this vital source from contamination resulting from cesspits. The densities of GW wells were normalized according to the total indicator weight (0.065) (Figure 7).
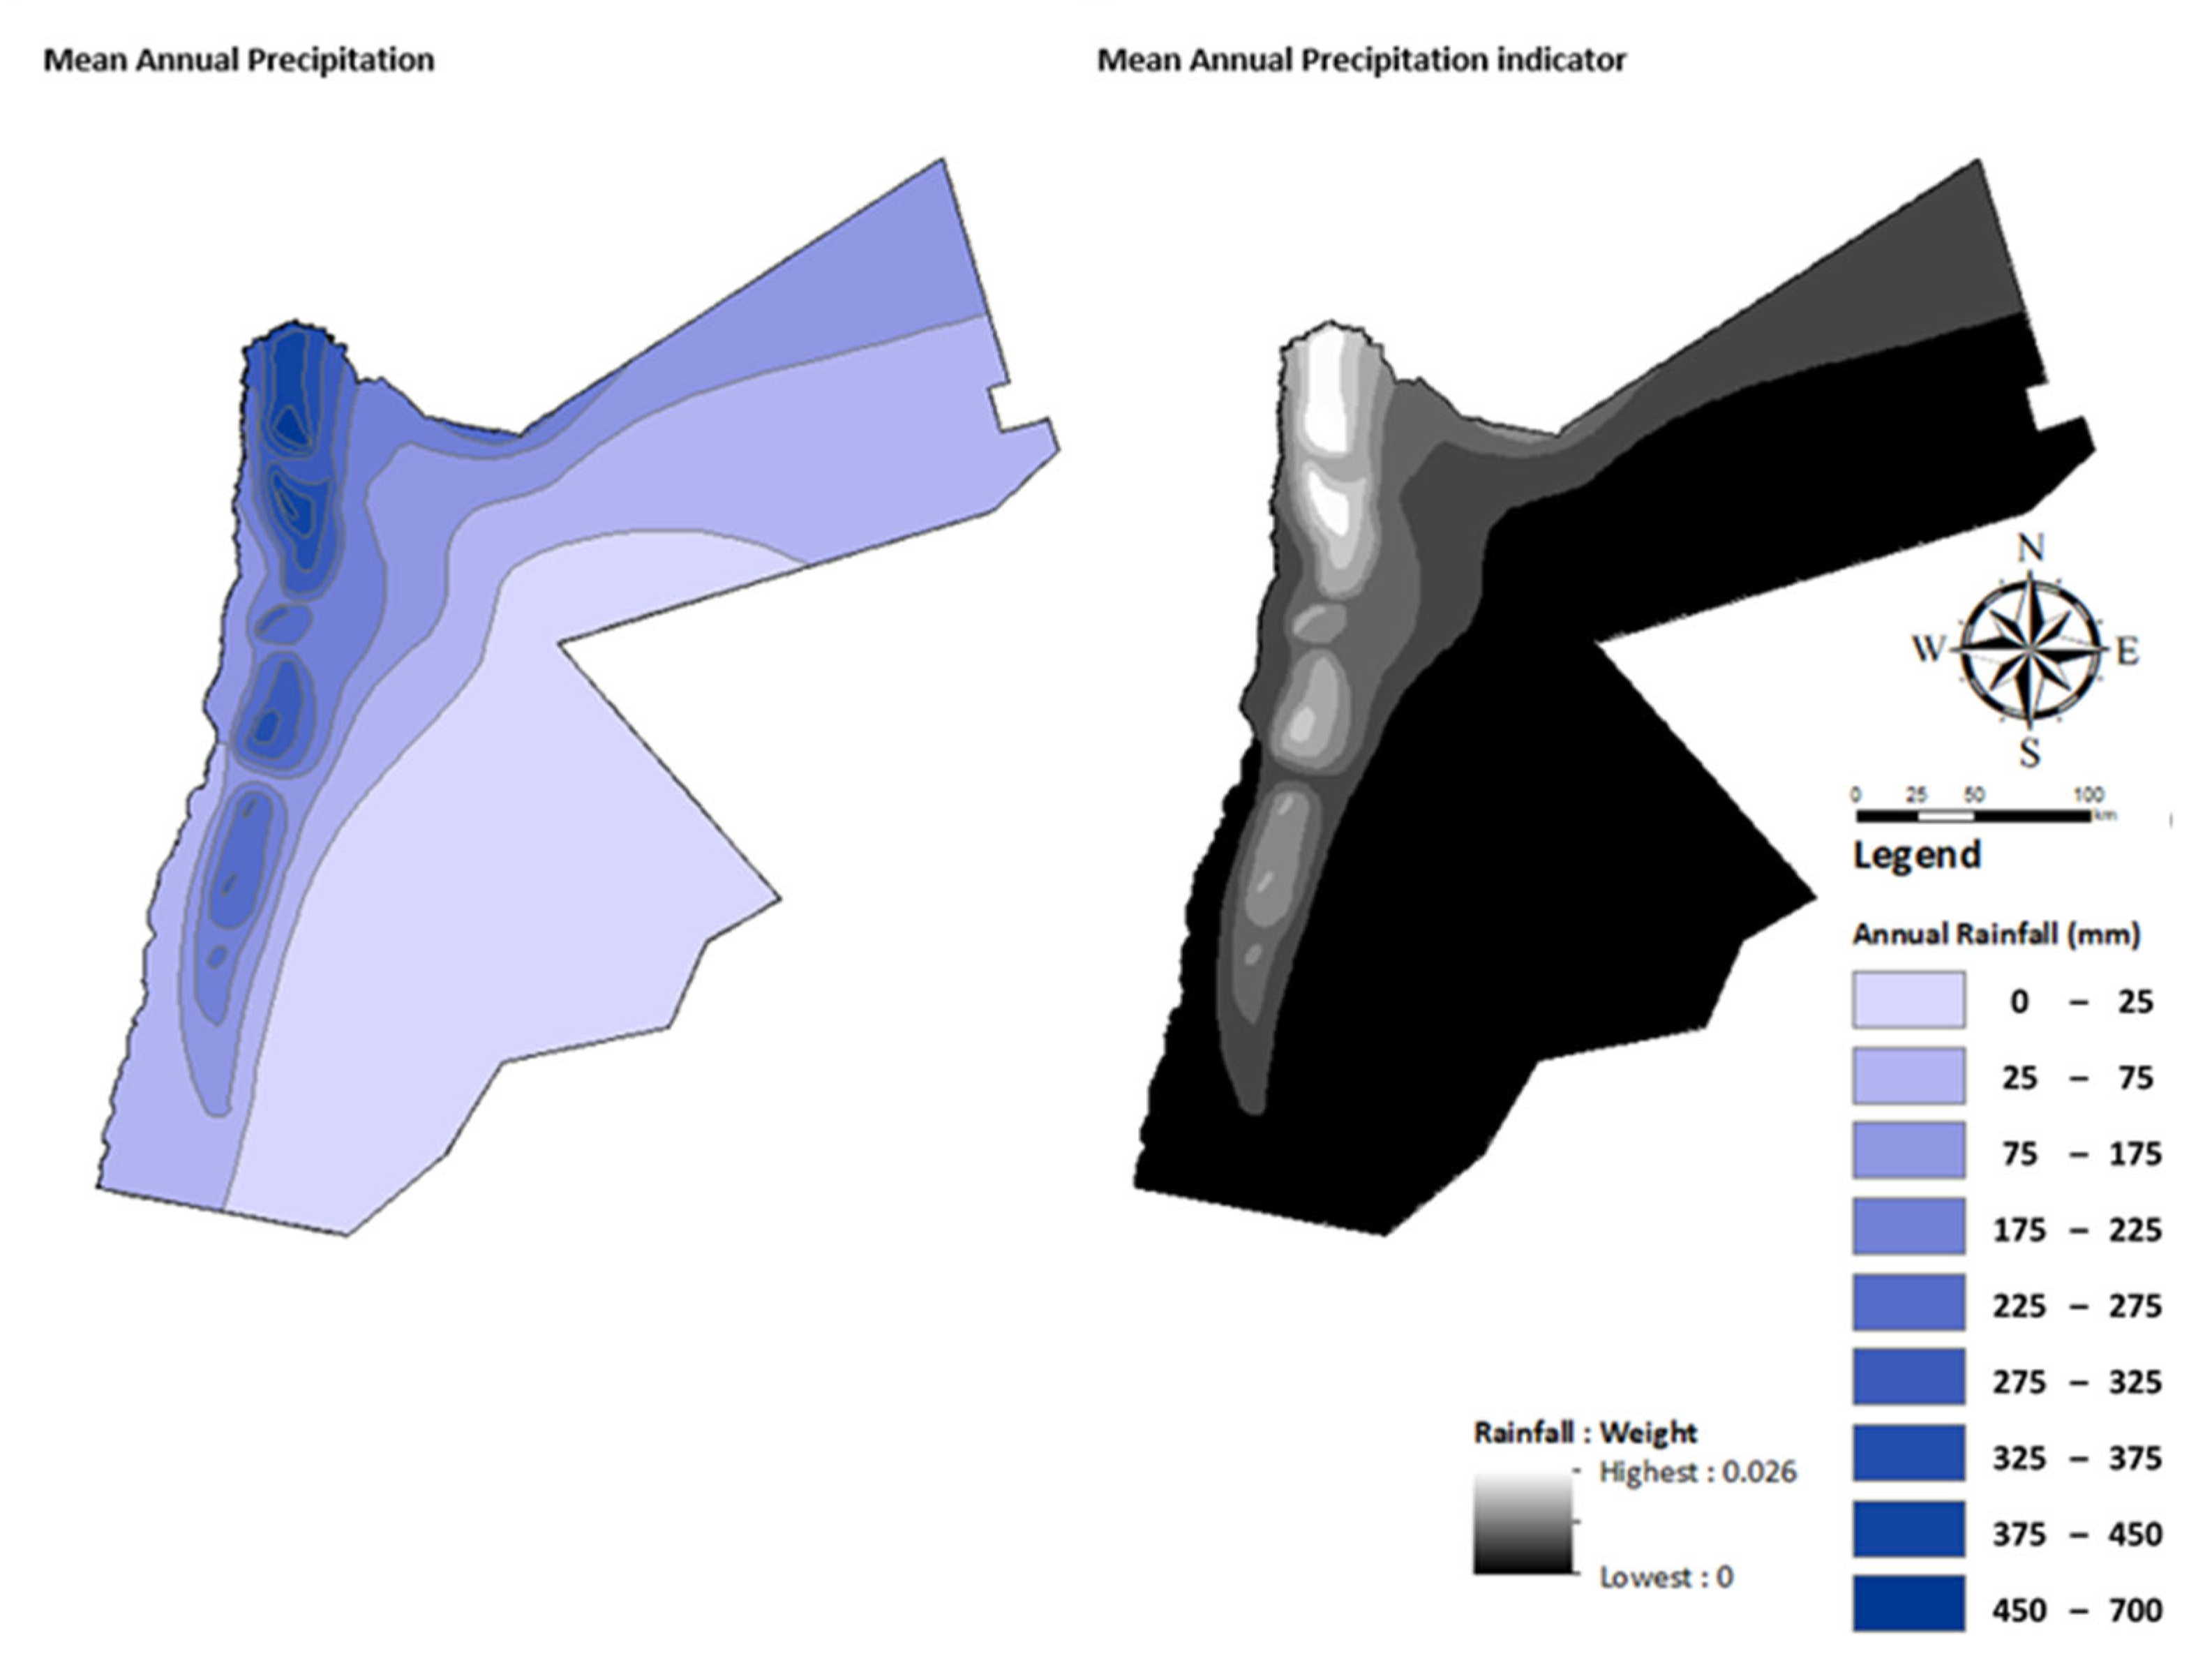
3.5. Precipitation
About 85% of the country receives less than 150 mm/year. As precipitation is the primary source of both natural artificial and groundwater recharge, it is vital to protect areas with higher precipitation from pollution. Therefore, precipitation was normalized according to the total indicator weight (0.026), as shown in Figure 8. Areas with higher precipitation were classified as a high necessity for immediate sanitation services according to the expert’s judgment performed in the earlier stages of this study.
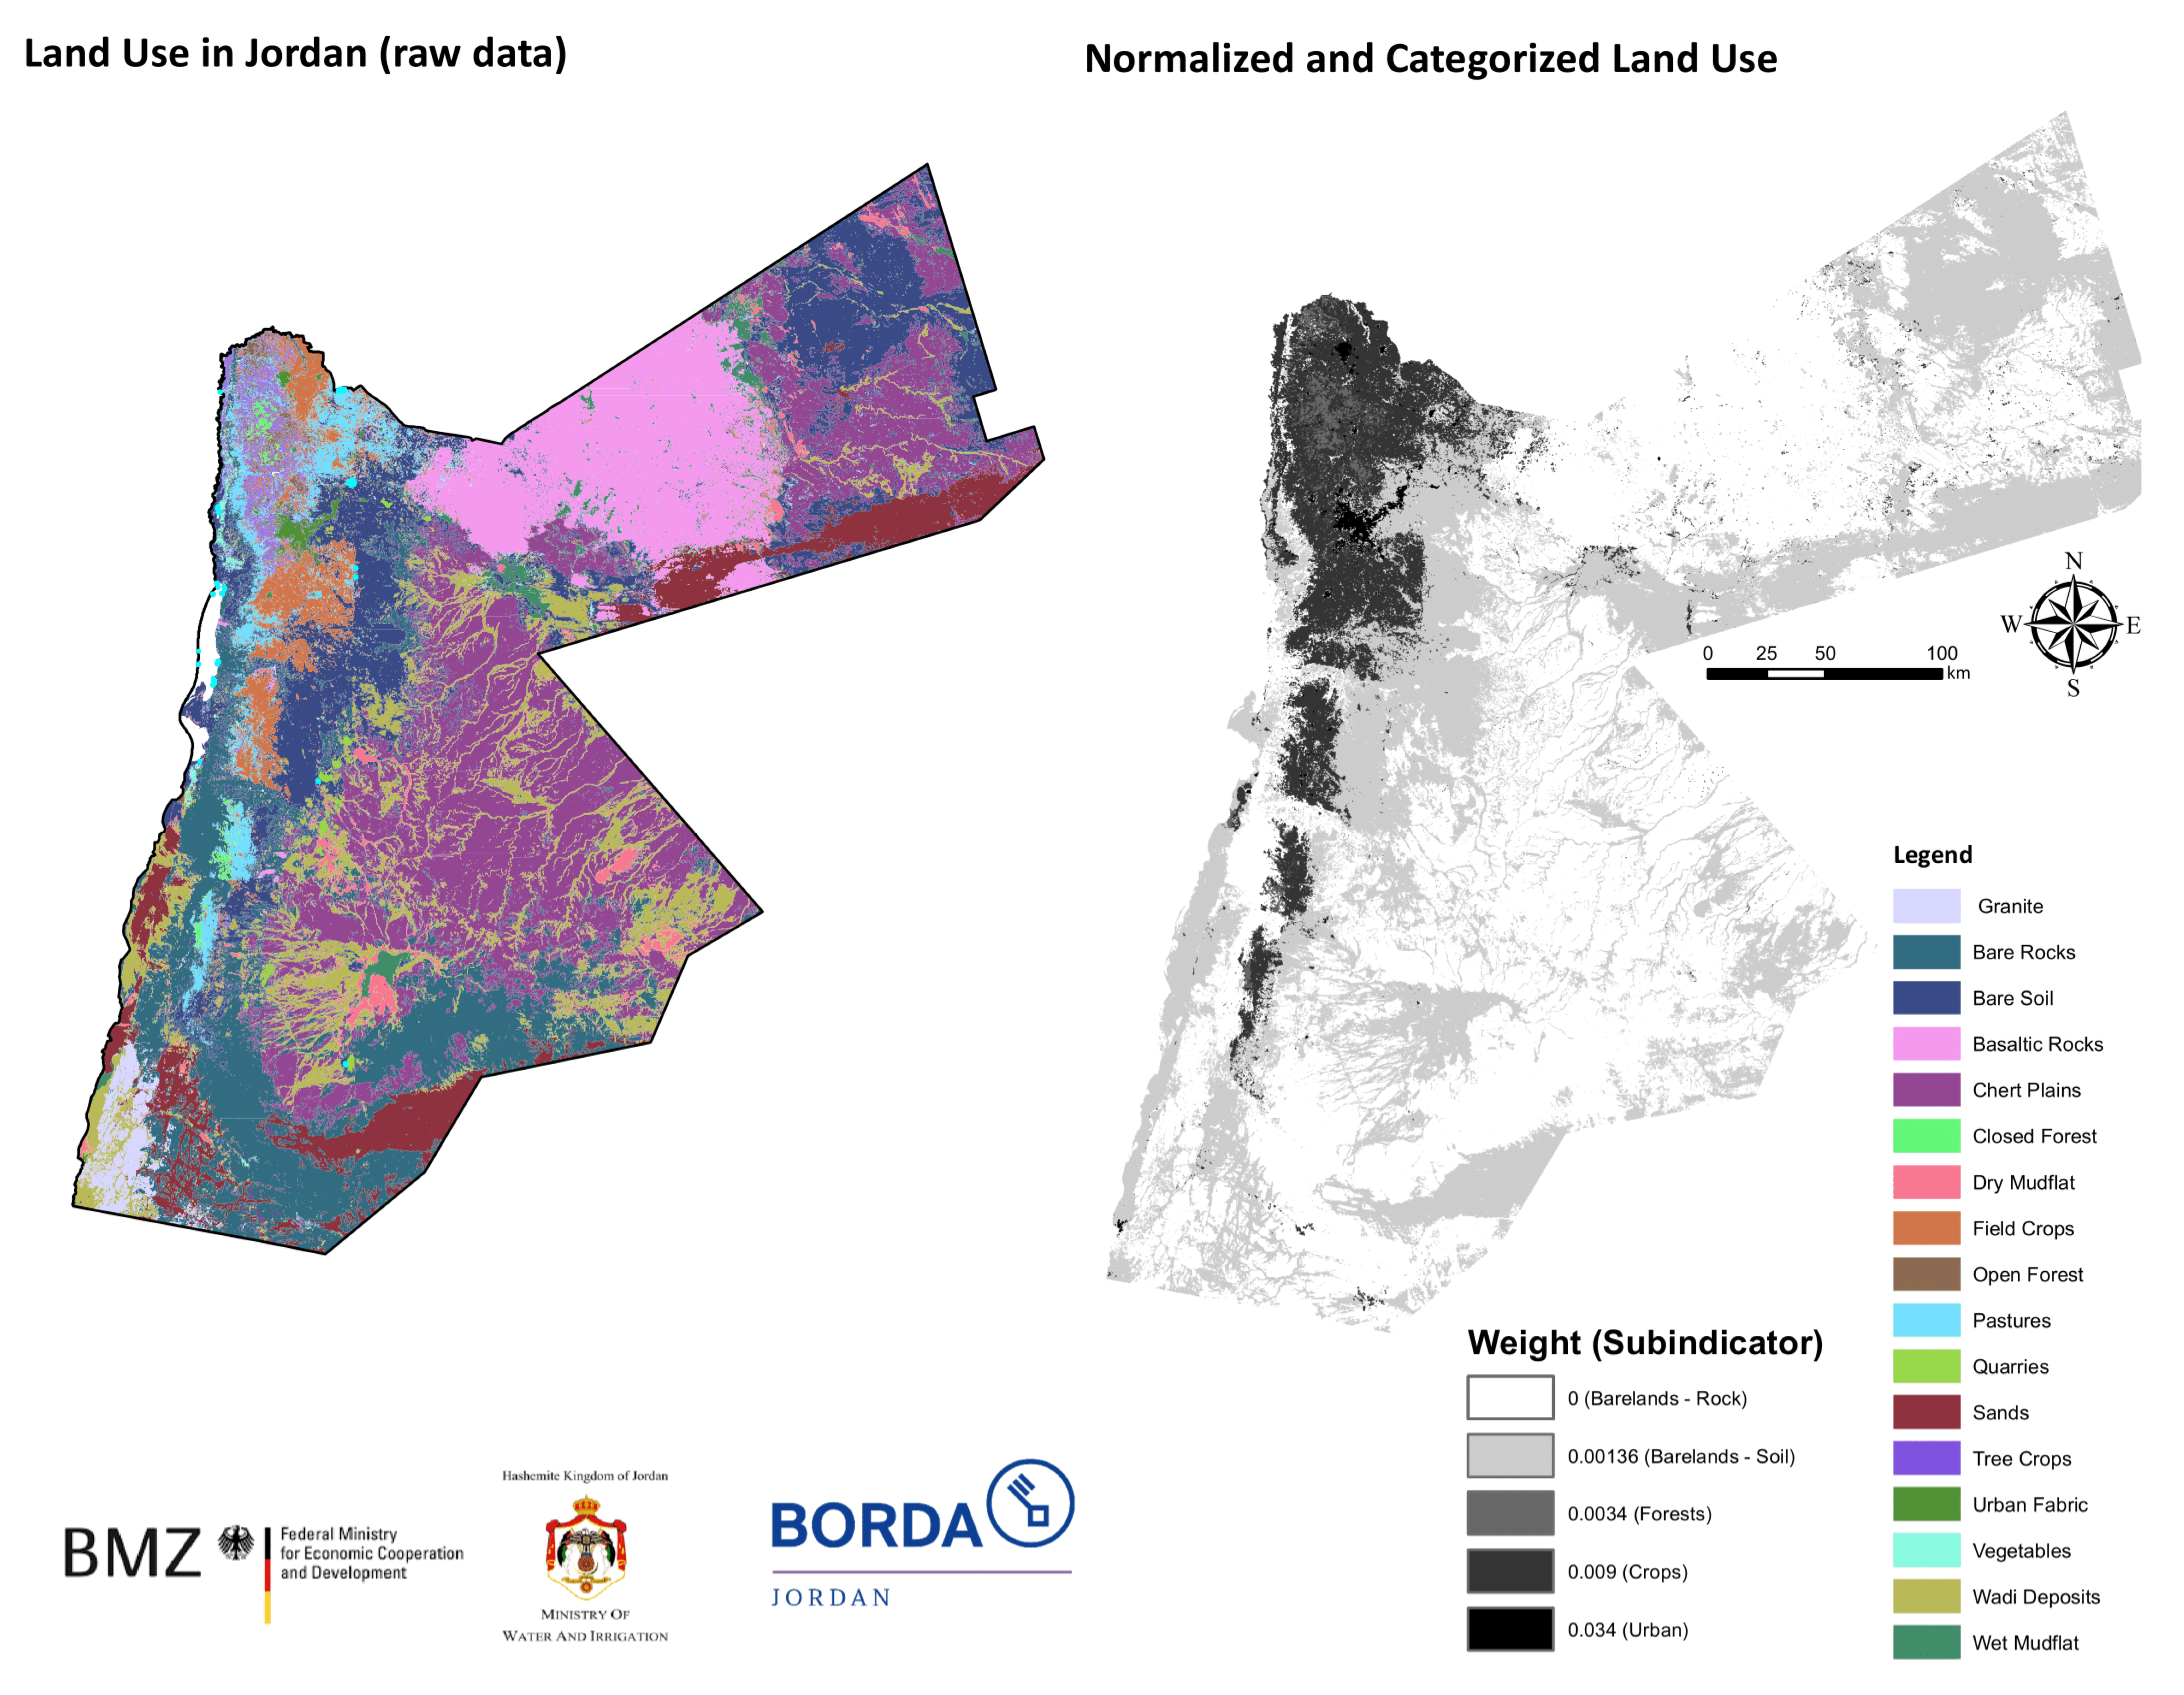
3.6. Land Use
Land use/land cover information was analyzed in this study to identify areas with a higher need for sanitation services. Twenty classes were tested for this purpose, as shown in Figure 9. Based on experts’ and stakeholders’ workshop feedback, these classes were carefully assessed and converted into basically five sub-indicators (Urban Areas, Crops, Forests, Bare lands-rock, Bare lands-soil). Each sub-indicator was also assigned a relative weight, and the relative weights were normalized according to the total indicator weight (0.034), as can Figure 9 shows.
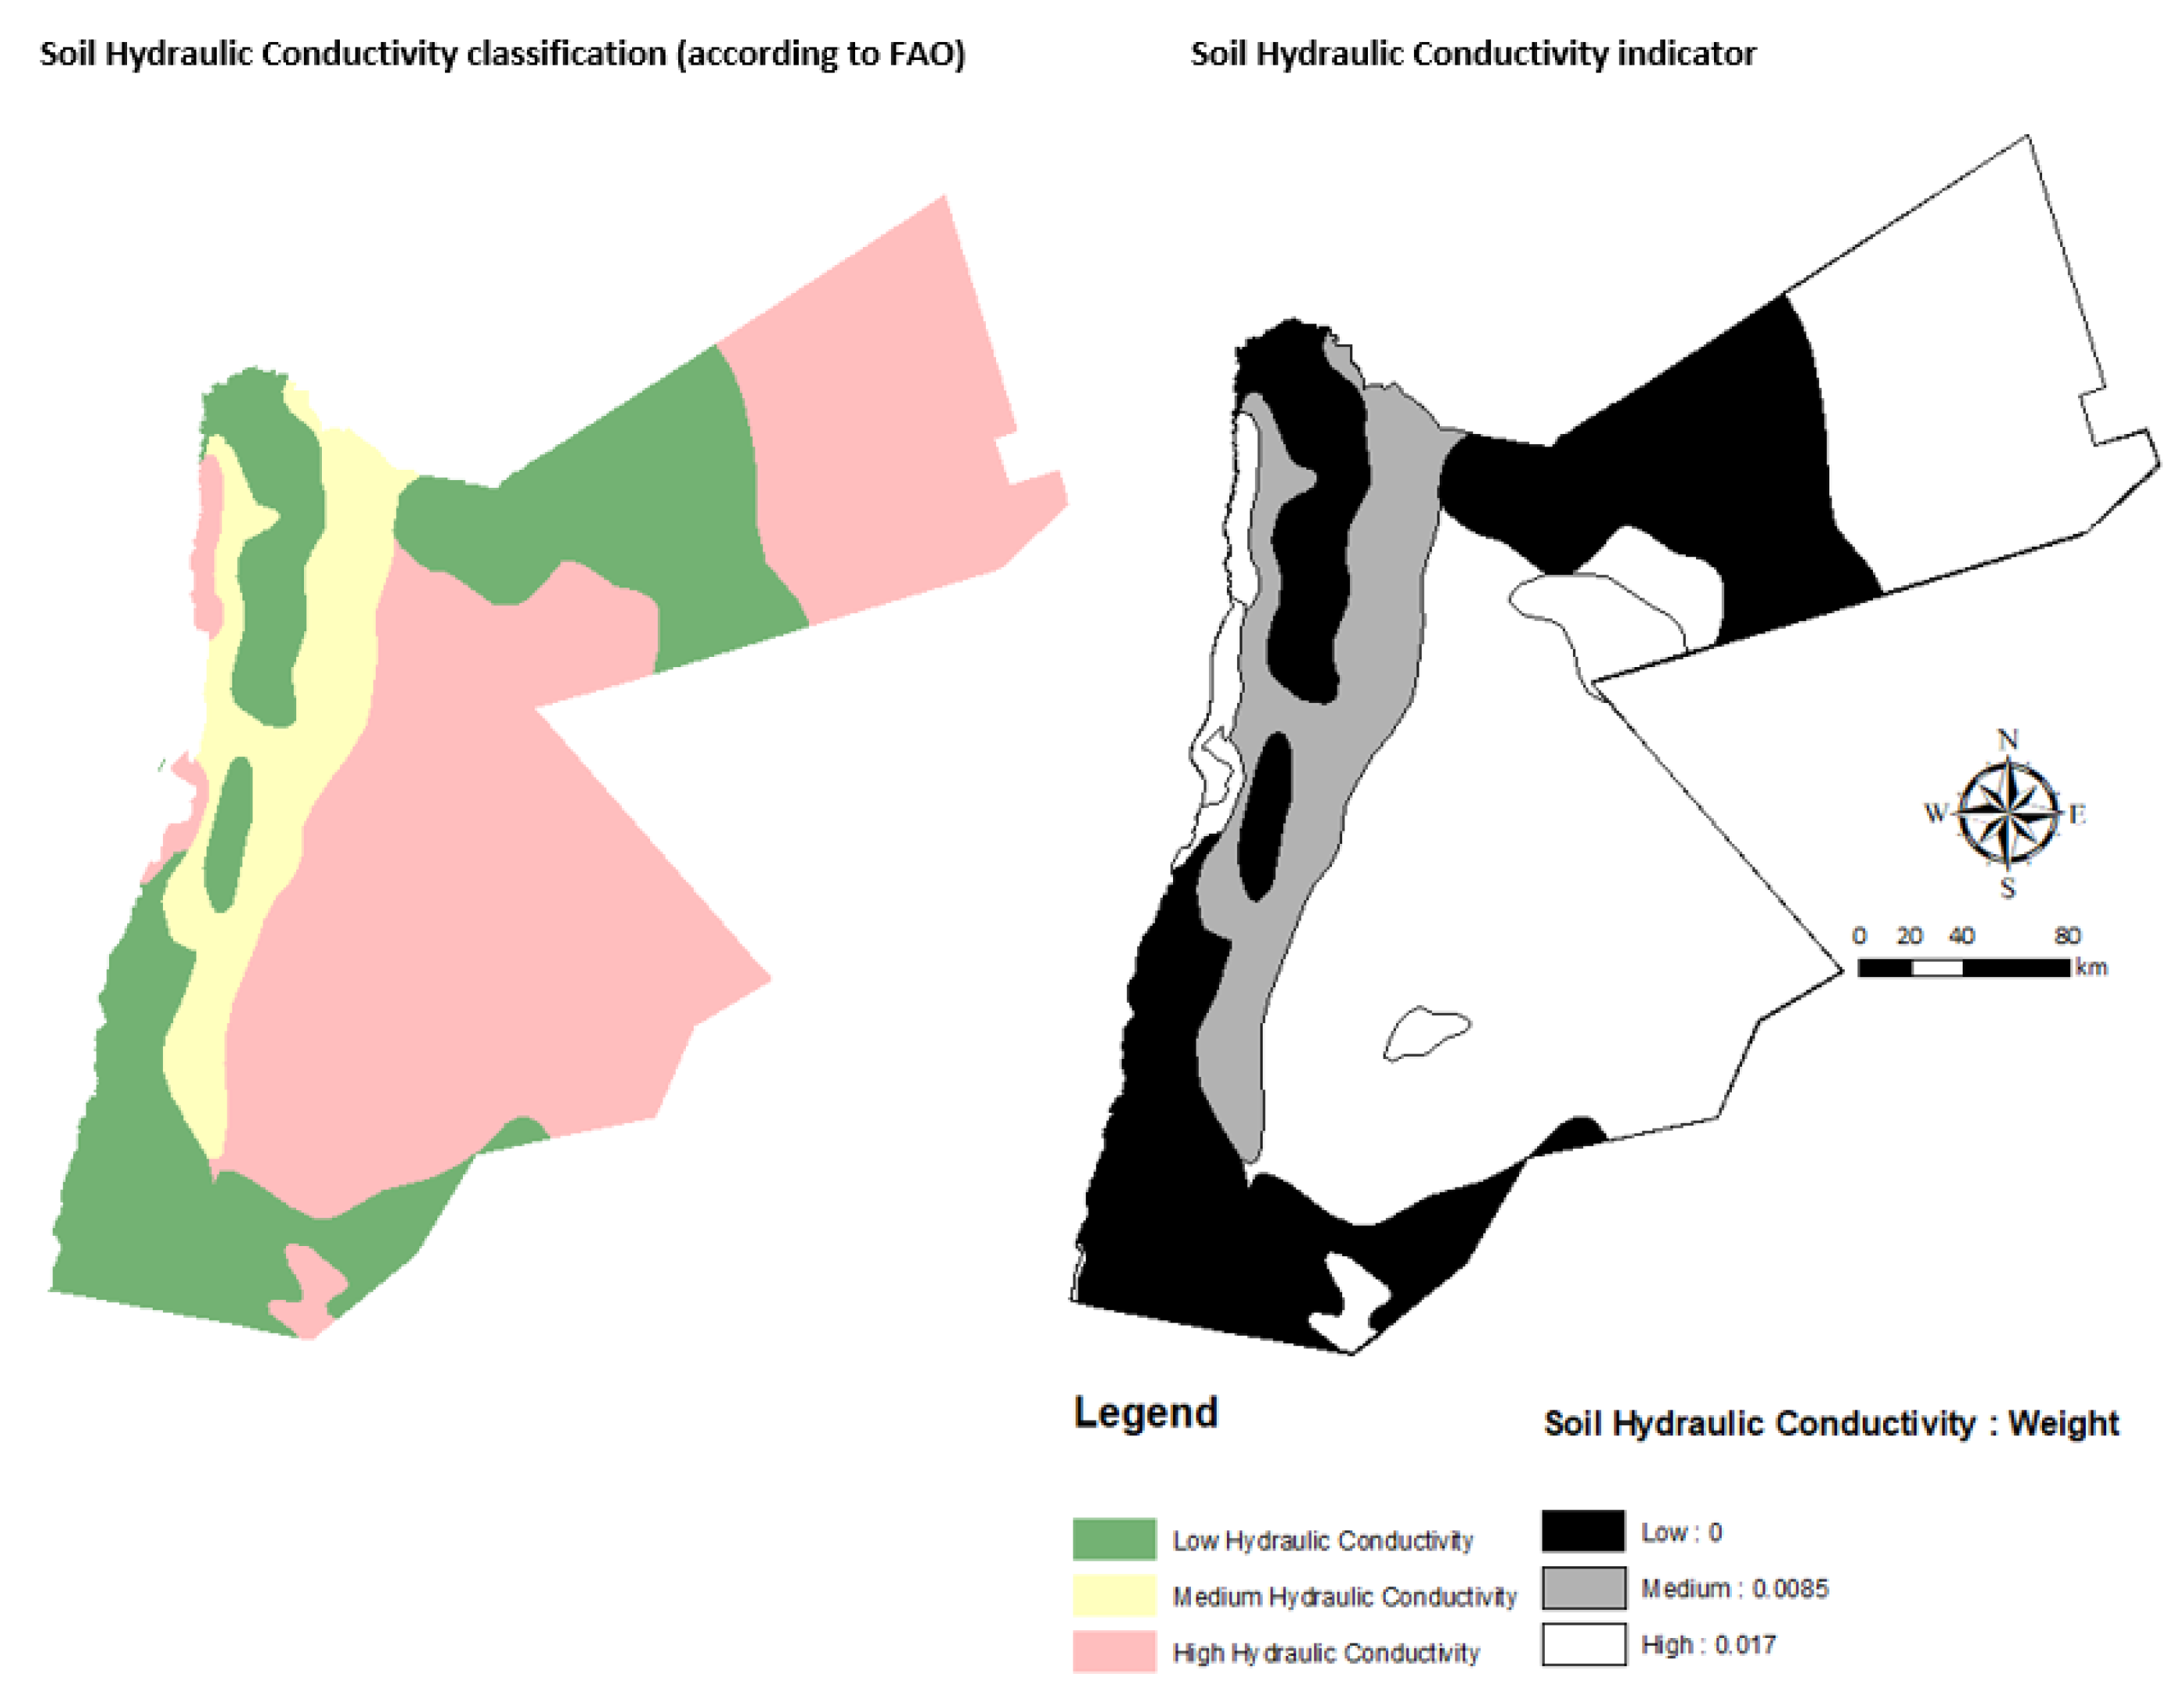
3.7. Soil Hydraulic Conductivity
Soil is another parameter that was considered in this study. Figure 10 shows different soil classes based on the land systems of Jordan. One parameter was considered in this study: the hydraulic conductivity of the soil. It describes the ease with which water can move through pore spaces or fractures. It depends on the intrinsic permeability of the material, the degree of saturation, and the density and viscosity of the fluid [26]. Therefore, areas with high hydraulic conductivity were classified as highly vulnerable areas that need sanitation services to prevent pollutants from transporting and infiltrating groundwater. Figure 10 shows the resultant classification map based on hydraulic conductivity.
3.8. Distance to Water Reservoirs, Wastewater Treatment Plants (WWTPs) and Springs
Jordan is a country that depends on water reservoirs such as dams, Wastewater Treatment Plants (WWTPs), and Springs. Many dams in Jordan are located near rural areas, which are considered a potential source of contamination as most rural areas in Jordan do not have safely managed sanitation.
Raw data were obtained from MWI on 35 WWTPs and 405 springs. Jordan is a leading country in treating and reusing treated wastewater in the region. However, there exist many inhabited areas situated not far away from WWTPs that are still not fully served with sewer networks, which according to the experts’ judgment, should be given a priority when planning for new sanitation projects due to technical as well as financial reasons.
Springs are a vital source of drinking water in Jordan and have protection zones guaranteed by the Jordanian Law [27]. Many people in Jordan use spring water directly without treatment, especially from tankers, which is a public health hazard as springs are subject to domestic wastewater contamination. It has been found that some springs in Jordan are contaminated with E. coli [13]. Therefore, springs are an essential indicator to consider while performing sanitation hotspot mapping.
Table 5 summarize that normalized values resulted from Distance to Water Reservoirs, Wastewater Treatment Plants (WWTPs), and Springs.
3.9. Sanitation Hot Spot Mapping
Based on the analysis presented above for every indicator shown in Figure 3. A combined sanitation hotspot map was developed based on Equation (1) using Map Calculator tools with ArcGIS software and combining the sum of weights in the raster maps shown in Figure 4, Figure 5, Figure 6, Figure 7, Figure 8, Figure 9 and Figure 10. The sanitation vulnerability index was calculated both on a neighborhood and district scale.
These results were validated using records about sanitation services obtained from the Ministry of Water and Irrigation (MWI). Areas with the highest vulnerability fit well with areas of high population and lack sanitation services. However, it was noted that some of the neighborhoods classified with high sanitation indexes were partially served with a sanitation network. Therefore, Equations (1) was revised to include a management factor (P). The main objective of this factor is to reduce the SHI values in areas that are fully or partially served with sanitation services. According to AHP analysis, three values for management factors were obtained, these are (0) for areas without any sanitation network, (0.1) for areas with partial sanitation network service, and (0.205) for areas that are fully served with a sanitation network. The revised sanitation hotspot index (SHI) is that takes this parameter is given by:
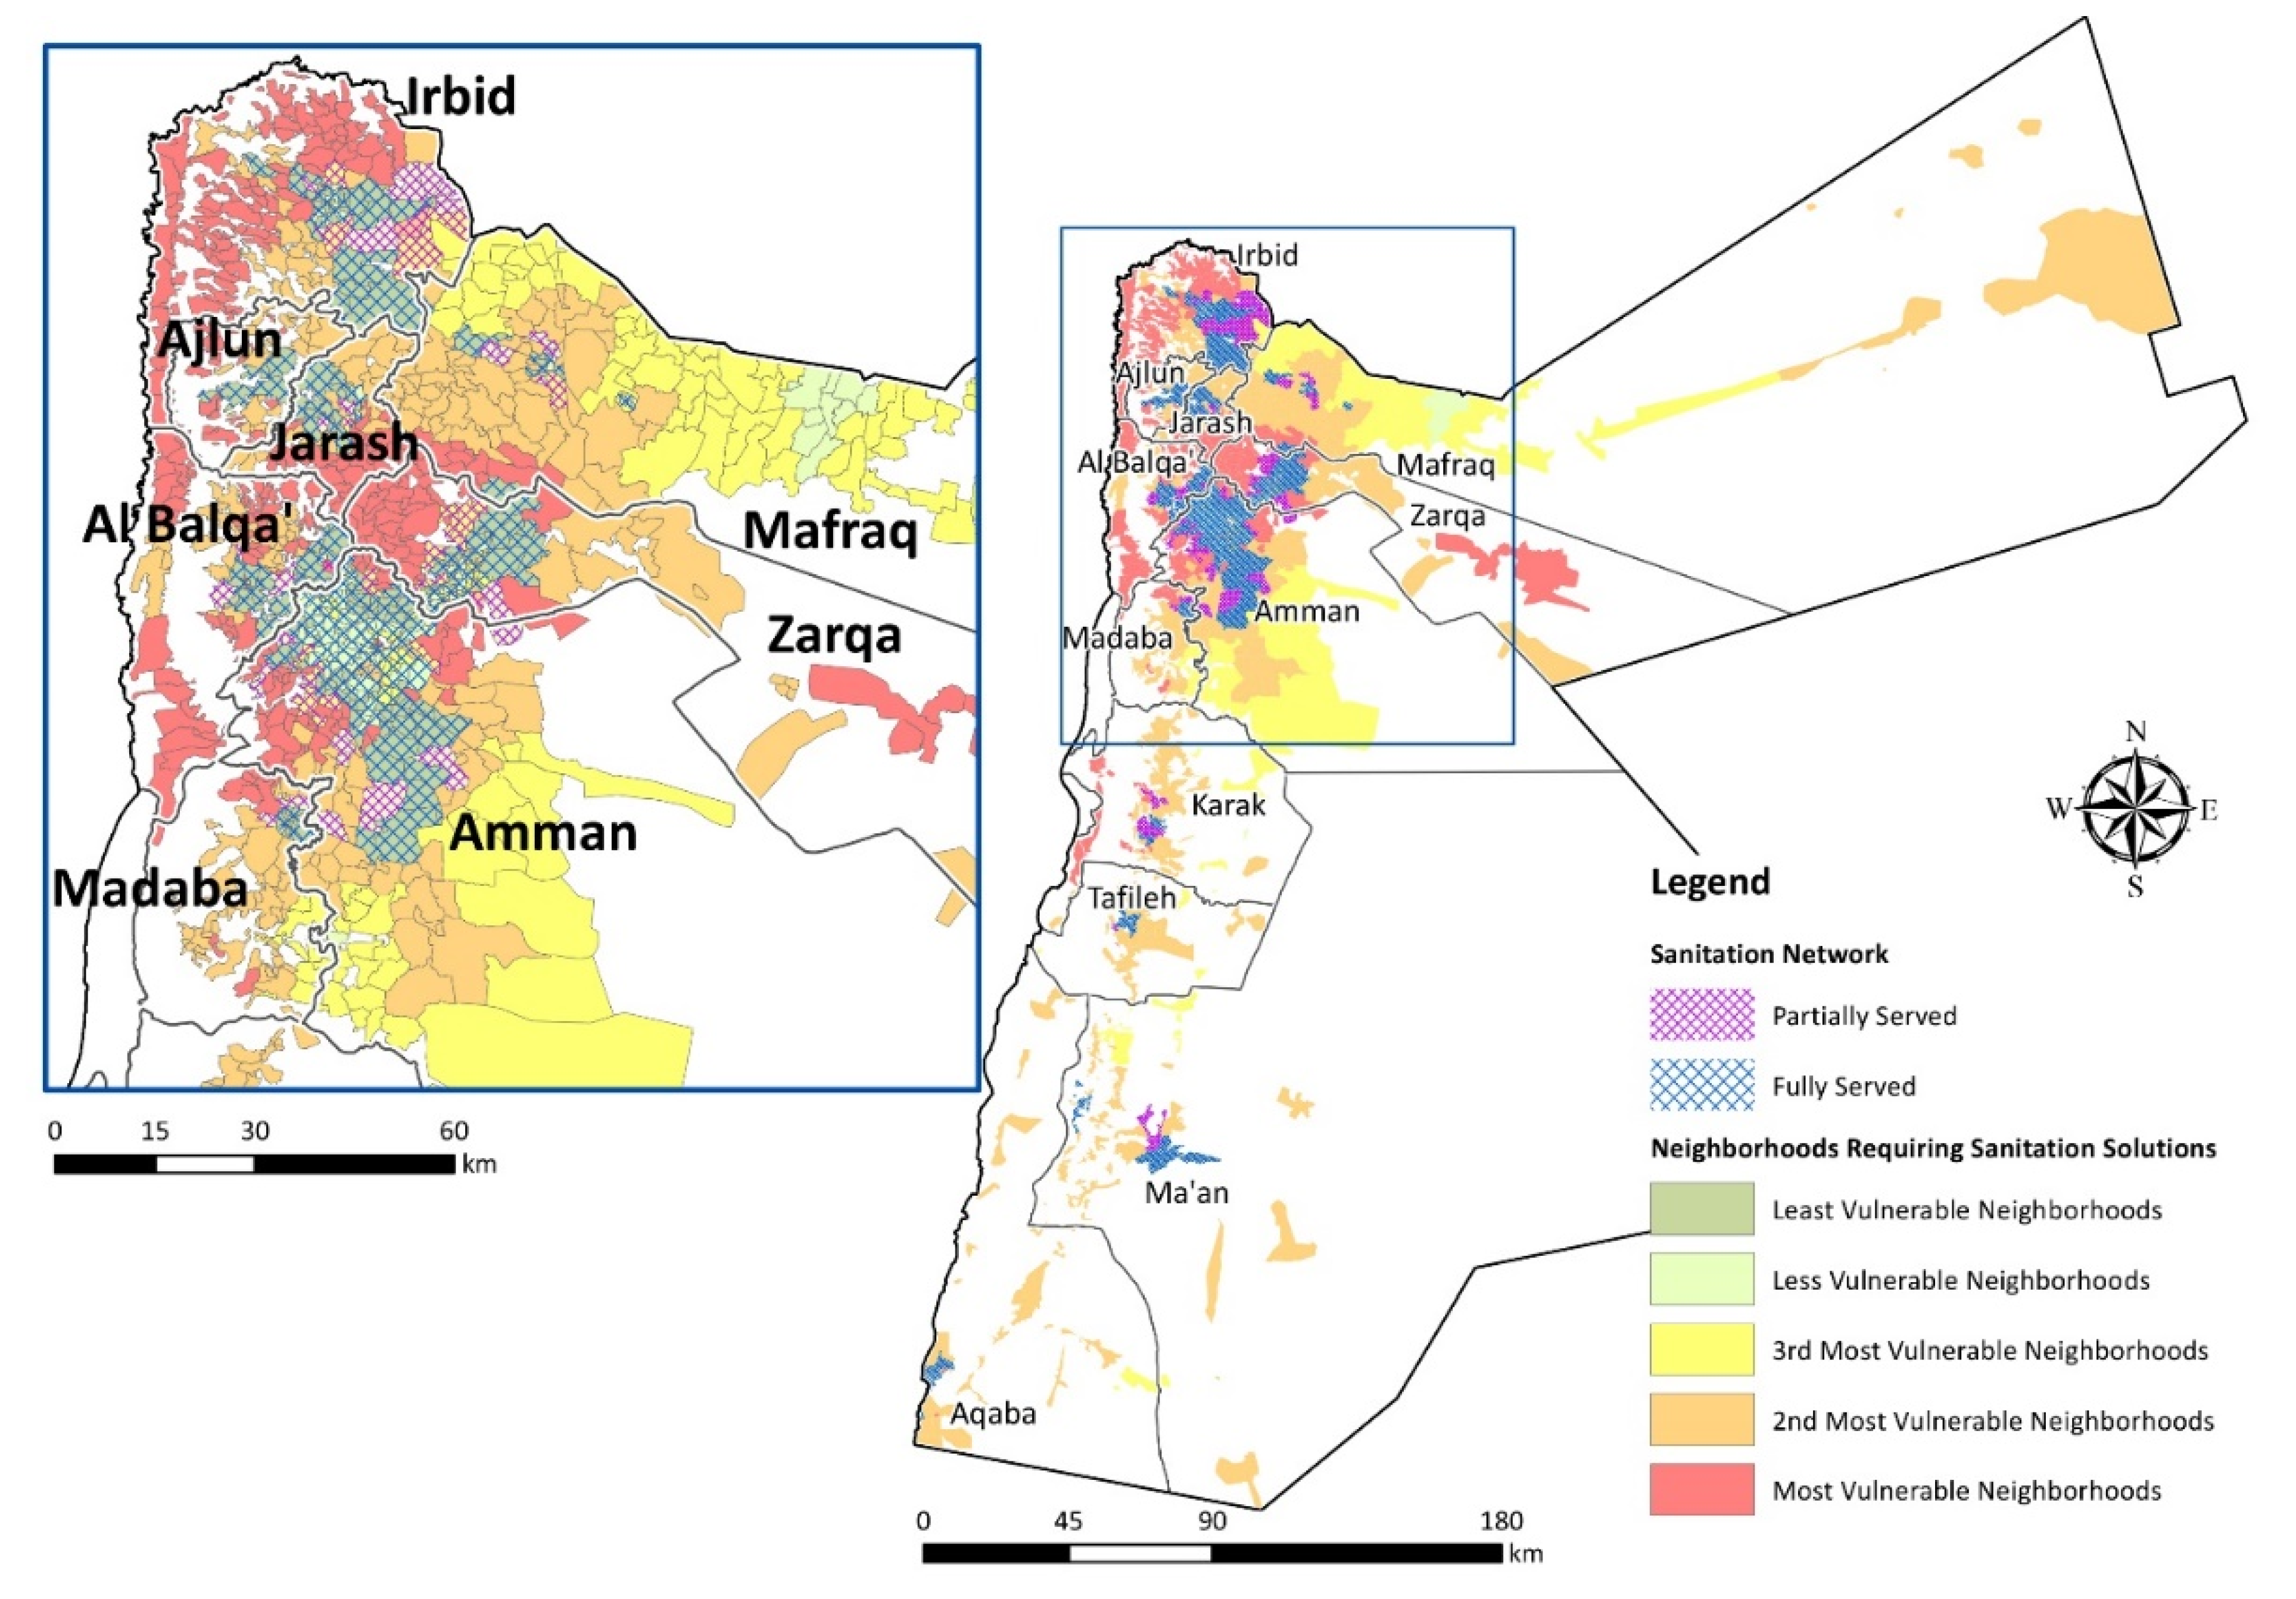
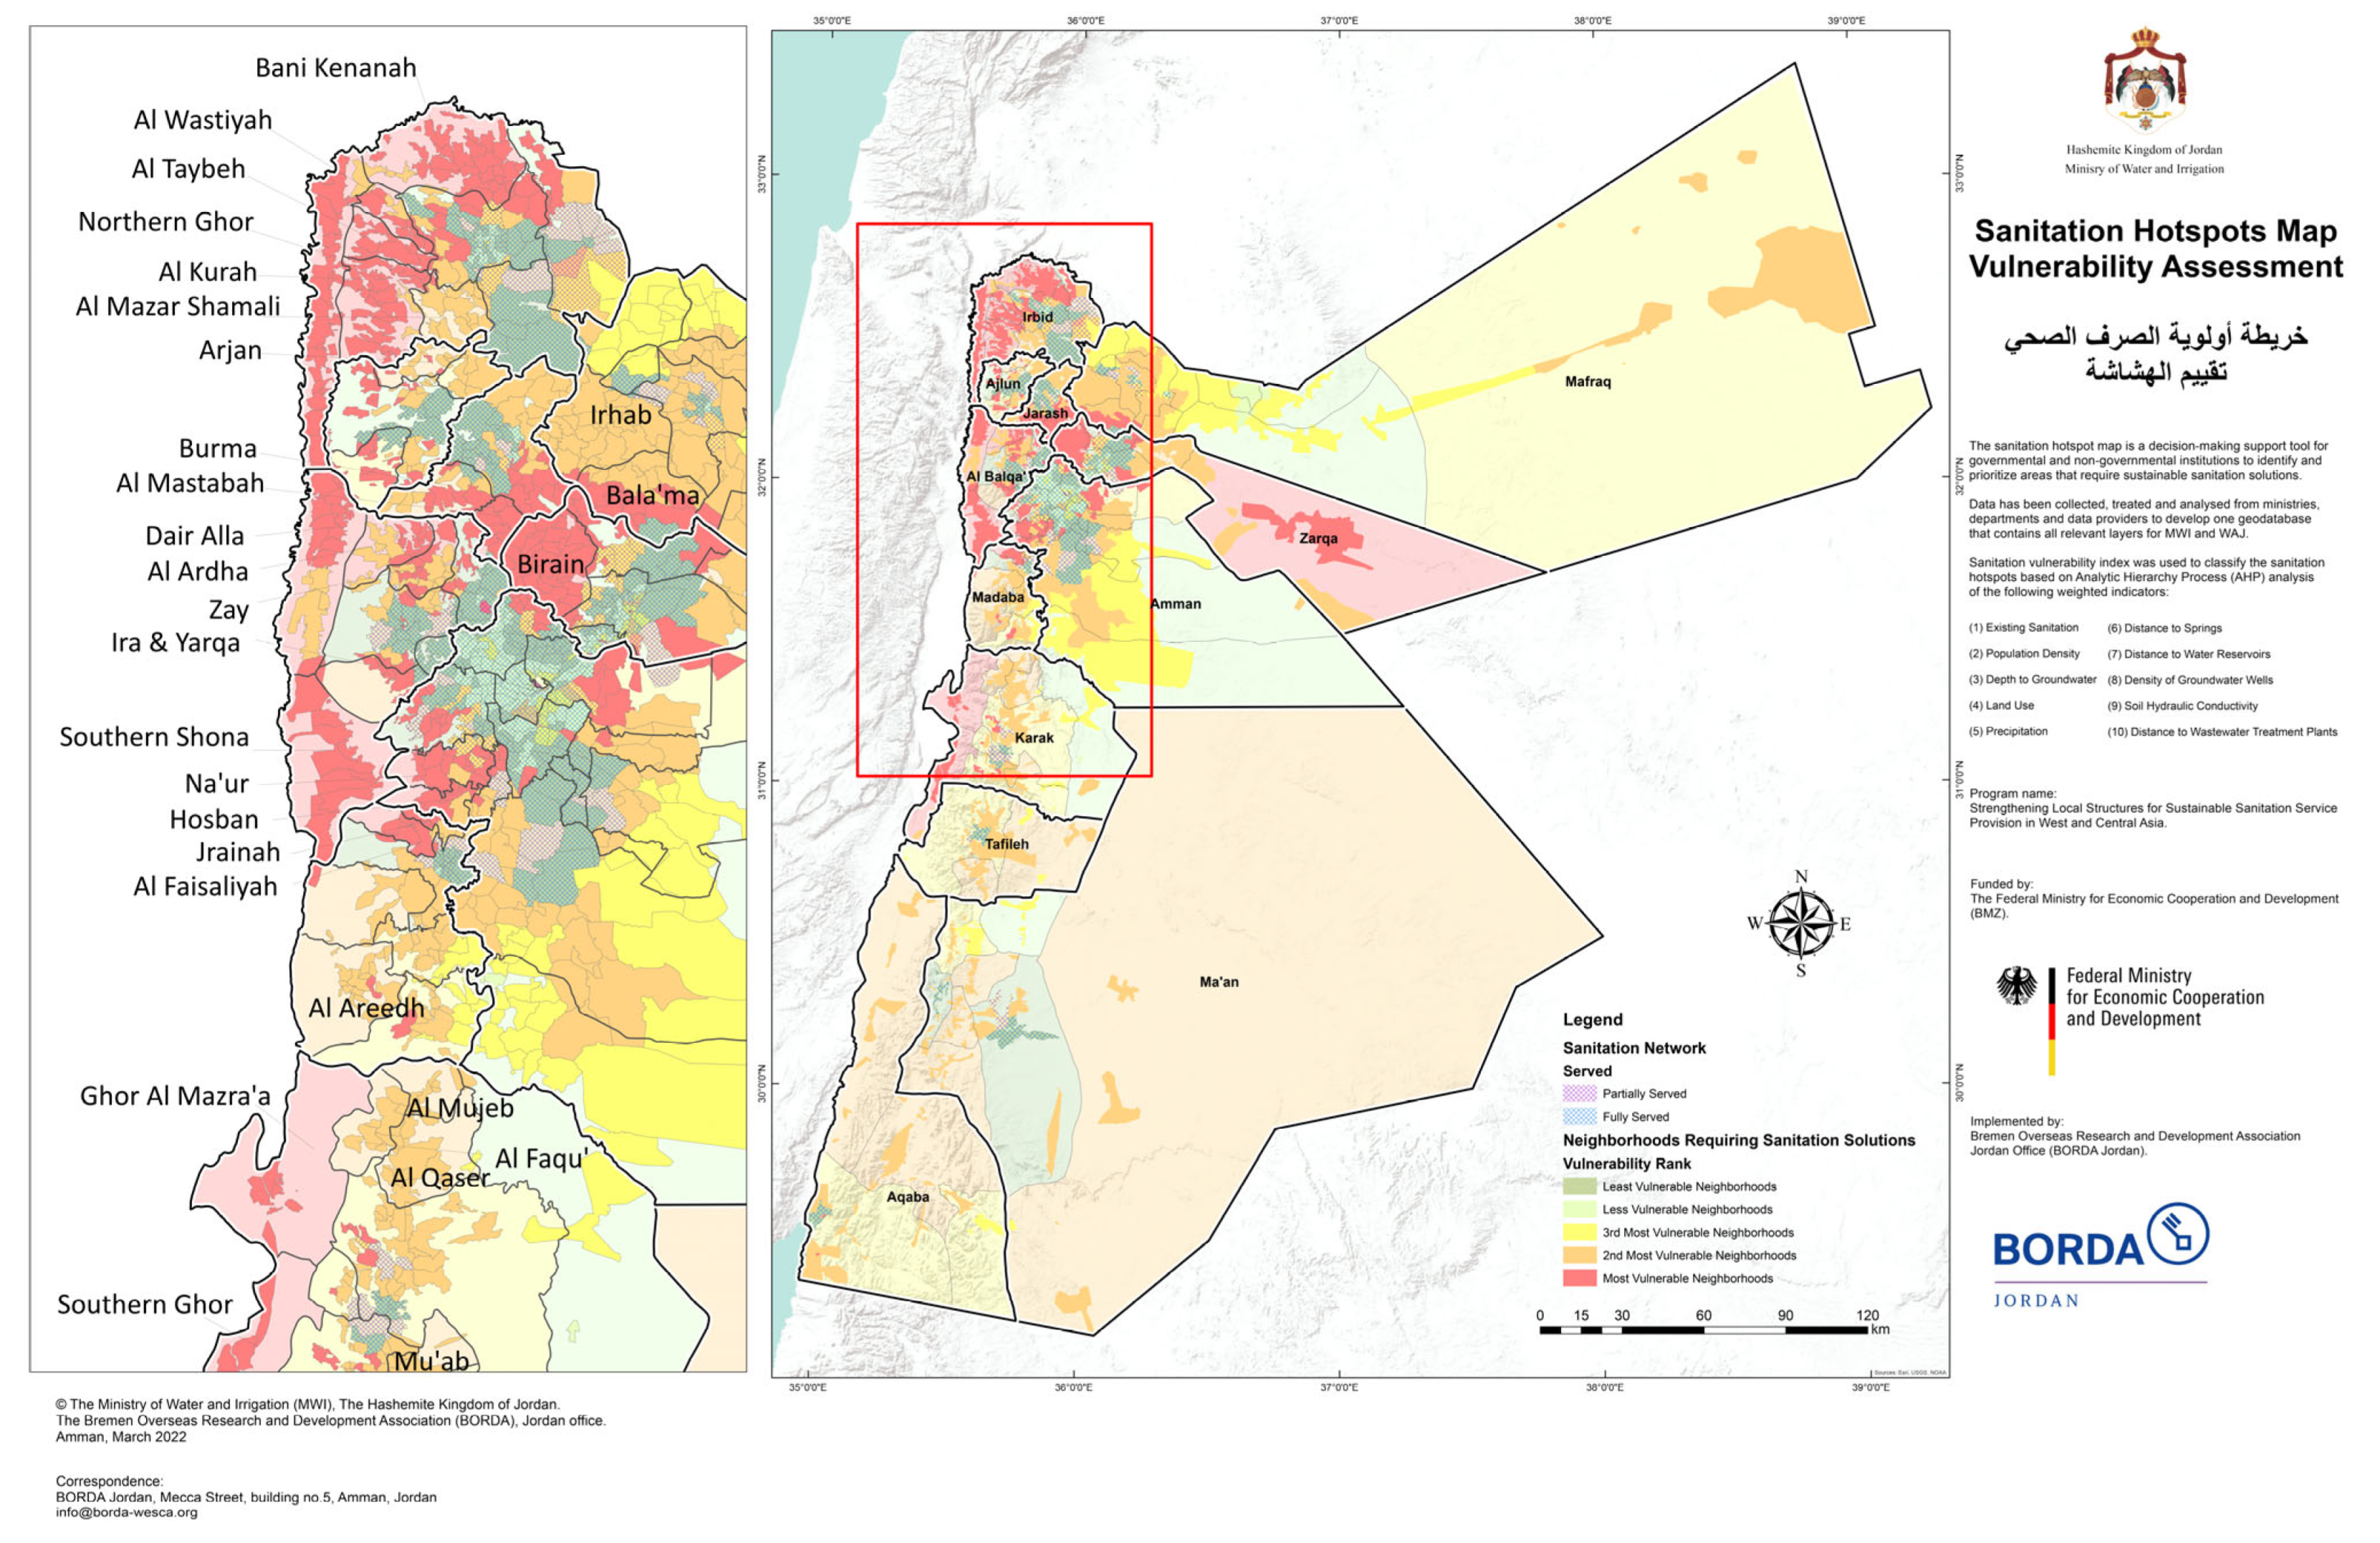
Figure 11 and Figure 12 show the final sanitation hotspot index map based on the revised equation on a district and neighborhood scale, respectively. As can be observed from the figures, it is evident that areas served with a wastewater network lie in the less vulnerable range. Moreover, and as Figure 11 and Figure 12 demonstrate, areas with the greatest need for sanitation solutions are concentrated in the north-western part of the country except for Ghawr Al Mazra’a, Al Aghwar Janubiyah, and Al Azraq. Table 6 summarizes the most vulnerable districts per governorate. Moreover, Figure 13 shows more detailed vulnerability on a neighborhood scale per district.
4. Conclusions
Sanitation service is a major environmental and sustainable challenge for developing countries and communities. Jordan is one of the countries with limited water resources that needs more investments in water resources management and sanitation services. In this work, a sanitation vulnerability index model was developed to map sanitation hotspots in Jordan. This map will be used later by decision-makers to allocate funds and to orient external aid towards areas with a high need for immediate sanitation serveries. Several relevant data sets were collected for this study and converted into a unified geodatabase using GIS. Experts and stockholders selected the most critical parameters for developing the sanitation index. Seven parameters were set, which include Sanitation Situation, Population Density, Depth to Groundwater, Density of Groundwater wells, Precipitation, Land use, Soil Hydraulic Conductivity, Distance to Springs, Distance to Water Reservoirs, and Distance to Wastewater Treatment Plants. AHP approach was used to calculate the critical weights for the selected parameters. The highest weights were for the population density and existing sanitation parameters, and the least weights were for soil hydraulic conductivity and precipitation parameters. The calculated consistency ratio was (0.0619), which approves the consistency of the analysis. Sanitation hotspot maps (district- and neighborhood-scale) were created based on this analysis. The resultant maps were validated, verified, and calibrated using collected information about existing sanitation services and expert judgment. The final sanitation hotspot maps classify all Jordan districts and neighborhoods into five vulnerability categories.
Based on the final SHI map, an area that is classified as the most vulnerable district requires immediate sanitation services mainly due to the high publication density and lack of sanitation services. Spatially, these areas are located in the northern governates, including Irbid, Jarash, Ajlun, and Al’Balqa’. In addition to Zarqa, the second most highly populated governate in the country. As we move to the southern parts of the country, the value of SHI becomes lower indicating less need for sanitation services. This is due to even the less population in these areas, or due to the availability of sanitation services, as in the case of Aqaba city, where it is entirely served by a sanitation network.
These results are of great value for the decision-makers at MWI and donor entities for implementing sanitation projects and solutions based on the need and prioritization of highly vulnerable areas. This work is part of a project that is supported by the Bremen Overseas Research and Development Association (BORDA)/Jordan. The developed SHI hotspots sanitation map along with the developed GIS geodatabase were officially handed over to the Water Authority of Jordan (WAJ), as well as the Ministry of Water and Irrigation (MWI). The developed GIS database is being currently used to establish a sanitation GIS department at WAJ. BORDA Jordan will be working in close partnership with WAJ and MWI to train the staff on working with and updating the GIS database and map as a component of signed memorandums of understanding. This map is currently under the process of accreditation by MWI to serve as an official guide and reference to all stakeholders in Jordan for sanitation decision and policy-making, fund steering, and capital investment plans.
Author Contributions
Conceptualization, N.H. and M.T.; methodology, N.H. and M.T.; software, N.H., M.T. and Q.H.; validation, Z.A., R.A.-R. and A.S.; formal analysis, N.H., M.T., Q.H. and Z.A.; investigation, N.H., M.T. and Q.H.; resources, Z.A.; data curation, N.H., M.T., Q.H. and Z.A.; writing—original draft preparation, N.H., M.T., R.A.-R. and A.S.; writing—review and editing, R.A.-R. and A.S.; visualization, Q.H. and M.T.; supervision, N.H. and M.T.; project administration, M.T. and Z.A.; funding acquisition, Z.A. All authors have read and agreed to the published version of the manuscript.
Funding
The authors would like to acknowledge the funding of this work from “Federal Ministry for Eco-nomic Cooperation and Development (BMZ)-Germany” under the program “Strengthening Local Structures for Sustainable Sanitation Service Provision in West and Central Asia”.
Data Availability Statement
Not applicable.
Acknowledgments
The authors would like to express their great appreciation and gratitude to the Federal Ministry for Economic Cooperation and Development (BMZ) for funding this study and to BORDA Jordan for implementing, in addition to MWI, DOS, MoA, and other relevant ministries, for providing the data used in this study, and for the reviewers of this work for their valuable comments and suggestions.
Conflicts of Interest
The authors declare no conflict of interest.
References
- United Nations. General Assembly Resolution 71/313, Work of the Statistical Commission Pertaining to the 2030 Agenda for Sustainable Development, A/RES/71/313. Available online: undocs.org/en/ A/RES/71/313 (accessed on 10 July 2017).
- WHO; UNICEF. Progress on Household Drinking Water, Sanitation and Hygiene 2000–2020: Five Years into the SDGs; World Health Organization: Geneva, Switzerland, 2021. [Google Scholar]
- Deepshikha, P.; Shelly, V.; Priyanka, V.; Biswanath, M.; Kasturi, D.; Achlesh, D.; Kusum, A. SARS-CoV-2 in wastewater: Challenges for developing countries. Int. J. Hyg. Environ. Health 2021, 231, 113634. [Google Scholar]
- Moe, C.; Rheingans, R. Global challenges in water, sanitation and health. J. Water Health 2006, 4 (Suppl. 1), 41–57. [Google Scholar] [CrossRef] [PubMed]
- de Moura, E.N.; Procopiuck, M. GIS-based spatial analysis: Basic sanitation services in Parana State, Southern Brazil. Environ. Monit Assess 2020, 192, 96. [Google Scholar] [CrossRef] [PubMed]
- Ntozini, R.; Marks, S.J.; Mangwadu, G.; Gerema, G.; Julian, T.R.; Humphrey, J.H.; Zungu, L.; Mbuya, M.N.N.; Mutasa, B.; Schwab, K.J. Using Geographic Information Systems and Spatial Analysis Methods to Assess Household Water Access and Sanitation Coverage in the SHINE Trial. Clin. Infect. Dis. 2015, 61, S716–S725. [Google Scholar] [CrossRef] [PubMed] [Green Version]
- Wyber, R.; Potter, J.R.; Weaver, J.B. Making mapping matter: A case study for short project international partnerships by global public health students. Glob. Health Action 2014, 7, 23593. [Google Scholar] [CrossRef] [PubMed] [Green Version]
- USAID. Water Resources & Environment. 2020. Available online: https://www.usaid.gov/jordan/water-and-wastewater-infrastructure (accessed on 31 July 2021).
- Ministry of Water and Irrigation. National Water Strategy 2016–2025; Ministry of Water and Irrigation: Amman, Jordan, 2016. [Google Scholar]
- Ministry of Water and Irrigation. Decentralized Wastewater Management Policy; Ministry of Water and Irrigation: Amman, Jordan, 2016. [Google Scholar]
- Ministry of Water and Irrigation. The Certification of Wastewater Treatment Systems with Capacities up to 5.000 PE in Jordan; Ministry of Water and Irrigation: Amman, Jordan, 2021. [Google Scholar]
- Unicef Jordan. Geographic Multidimensional Vulnerability Analysis—Jordan; Unicef Jordan: Amman, Jordan, 2020. [Google Scholar]
- MWI; UFZ; BGR. Vulnerable Water Resources in Jordan; Ministry of Water and Irrigation: Amman, Jordan, 2020. [Google Scholar]
- Hashemi, S. Sanitation Sustainability Index: A Pilot Approach to Develop a Community-Based Indicator for Evaluating Sustainability of Sanitation Systems. Sustainability 2020, 12, 6937. [Google Scholar] [CrossRef]
- Iribarnegaray, M.A.; D’Andrea, M.L.G.; Rodriguez-Alvarez, M.S.; Hernández, M.E.; Brannstrom, C.; Seghezzo, L. From Indicators to Policies: Open Sustainability Assessment in the Water and Sanitation Sector. Sustainability 2015, 7, 14537–14557. [Google Scholar] [CrossRef] [Green Version]
- Lundin, M.; Molander, S.; Morrison, G.M. A set of indicators for the assessment of temporal variations in the sustainability of sanitary systems. Water Sci. Technol. 1999, 39, 235–242. [Google Scholar] [CrossRef]
- Saaty, T.L. The Analytic Hierarchy Process; McGraw-Hill: New York, NY, USA, 1980. [Google Scholar]
- Saaty, T.L. The Analytic Hierarchy Process: Decision Making in Complex Environments. In Quantitative Assessment in Arms Control; Avenhaus, R.H.R., Ed.; Springer: Boston, MA, USA, 1980. [Google Scholar] [CrossRef]
- Chabu, A.J.; Al-Ansari, N.; Hussain, M.H.; Knutsson, S.; Pusch, R. Landfill Siting Using GIS and AHP (Analytical Hierarchy Process): A Case Study Al-Qasim Qadhaa, Babylon, Iraq. J. Civ. Eng. Archit. 2016, 10, 530–543. [Google Scholar]
- Ardeshir, A.; Behzadian, K.; Jalilsani, F. Landfill Site Selection Using Gis and Analytical Hierarchy Process. In Proceedings of the 5th International Conference on Environmental Science and Technology, Houston, TX, USA, 12–16 July 2010. [Google Scholar]
- Shadmaan, M.; Islam, M. Estimation of earthquake vulnerability by using analytical hierarchy process. Nat. Hazards Res. 2021, 4, 153–160. [Google Scholar] [CrossRef]
- Panchal, S.; Shrivastava, A.K. Landslide hazard assessment using analytic hierarchy process (AHP): A case study of National Highway 5 in India. Ain Shams Eng. J. 2021, 13, 101626. [Google Scholar] [CrossRef]
- Denison, L.C.; Antonio, D.S.M.M.; Augusto, M.V.M. Method AHP to Flood Risk Map Approach. Int. J. Adv. Eng. Res. Sci. 2018, 5, 40. [Google Scholar] [CrossRef]
- Harker, P. Incomplete pairwise comparisons in the analytic hierarchy process hierarchy process. Math. Model. 1987, 9, 837–848. [Google Scholar] [CrossRef] [Green Version]
- Benítez, J.; Delgado-Galván, X.; Gutiérrez, J.; Izquierdo, J. Balancing consistency and expert judgment in AHP. Math. Comput. Model. 2010, 54, 1785–1790. [Google Scholar] [CrossRef]
- Papadopol, C. Determination of soil hydraulic conductivity in nurseries and plantations. Tree Plant. Notes 2005, 51, 22–26. [Google Scholar]
- WAJ. Groundwater Control by-Law No. 85/2002; Water Authority of Jordan: Amman, Jordan, 2002. [Google Scholar]
Figure 1.
Schematic framework for the methodology of this study.

Figure 2.
Hierarchy model used for sanitation hotspot mapping.

Figure 3.
Methodology of detailed spatial analysis of indicators.

Figure 4.
Existing Sanitation Services Indicator.

Figure 5.
Population Density Indicator.

Figure 6.
Depth to GW Indicator.

Figure 7.
Density of GW Wells Indicator.

Figure 8.
Precipitation Indicator.

Figure 9.
Land Use Indicator.

Figure 10.
Soil Hydraulic Conductivity Indicator.

Figure 11.
District-scale Sanitation Hotspot Map.

Figure 12.
Neighborhoods-scale Sanitation Hotspot Map.

Figure 13.
Final Sanitation Hotspots Map.


Table 1.
List the selected criteria for sanitation hotspot mapping based on experts’ and stakeholders’ judgment.
Table 1.
List the selected criteria for sanitation hotspot mapping based on experts’ and stakeholders’ judgment.
| Criterion | Description | Source of Raw Data | |
|---|---|---|---|
| 1 | Existing Sanitation | Collected data about existing sanitation services which include Sanitation Network, Cesspits, or none of these | Department of Statistics (DOS), Ministry of Water and Irrigation (MWI) |
| 2 | Population Density | Collected information about population densities on neighborhood-scale | DOS |
| 3 | Depth to Groundwater (GW) | Collected information about the depth to GW in different observation wells | MWI |
| 4 | Land Use/Land Cover | Land use and land cover as extracted from satellite images | Ministry of Agriculture (MoA) |
| 5 | Precipitation | Mean annual precipitation | Department of Meteorology (DOM) |
| 6 | Distance to Springs | Calculated distance away from springs | MWI |
| 7 | Distance to Water Reservoirs | Calculated distance away from water reservoirs and dams | MWI |
| 8 | The density of Groundwater (GW) Wells | The calculated density of GW wells | MWI |
| 9 | Soil Hydraulic Conductivity | Soil physical property | MoA |
| 10 | Distance to Wastewater Treatment Plants (WWTPs) | Calculated distance away from WWTPs | MWI |
Table 2.
AHP Pairwise matrix for the selected criteria.
| Existing Sanitation | Population Density | Depth to GW | Land Use | Precipitation | Distance to Springs | Distance to Water Reservoirs | The Density of GW Wells | Soil Hydraulic Conductivity | Distance to WWTPs | |
|---|---|---|---|---|---|---|---|---|---|---|
| Existing Sanitation | 1.00 | 0.50 | 2.00 | 6.00 | 7.00 | 4.00 | 3.00 | 4.00 | 8.00 | 6.00 |
| Population Density | 2.00 | 1.00 | 3.00 | 7.00 | 8.00 | 5.00 | 4.00 | 5.00 | 9.00 | 7.00 |
| Depth to GW | 0.50 | 0.33 | 1.00 | 5.00 | 6.00 | 3.00 | 3.00 | 3.00 | 7.00 | 5.00 |
| Land use | 0.17 | 0.14 | 0.20 | 1.00 | 2.00 | 0.25 | 0.25 | 0.33 | 3.00 | 1.00 |
| Precipitation | 0.14 | 0.13 | 0.17 | 0.50 | 1.00 | 0.25 | 0.25 | 0.33 | 3.00 | 0.50 |
| Distance to Springs | 0.25 | 0.20 | 0.33 | 4.00 | 4.00 | 1.00 | 0.50 | 2.00 | 5.00 | 4.00 |
| Distance to Water Reservoirs | 0.33 | 0.25 | 0.33 | 4.00 | 4.00 | 2.00 | 1.00 | 2.00 | 6.00 | 4.00 |
| The density of GW Wells | 0.25 | 0.20 | 0.33 | 3.00 | 3.00 | 0.50 | 0.50 | 1.00 | 5.00 | 3.00 |
| Soil Hydraulic Conductivity | 0.13 | 0.11 | 0.14 | 0.33 | 0.33 | 0.20 | 0.17 | 0.20 | 1.00 | 0.33 |
| Distance to WWTPs | 0.17 | 0.14 | 0.20 | 1.00 | 2.00 | 0.25 | 0.25 | 0.33 | 3.00 | 1.00 |
Table 3.
Normalized AHP matrix and calculated relative weight for every criterion.
| Existing Sanitation | Population Density | Depth to GW | Land Use | Precipitation | Distance to Springs | Distance to Water Reservoirs | Density of GW Wells | Soil Hydraulic Conductivity | Distance to WWTPs | Criterion Weight | |
|---|---|---|---|---|---|---|---|---|---|---|---|
| Existing Sanitation | 0.203 | 0.166 | 0.259 | 0.188 | 0.188 | 0.243 | 0.232 | 0.220 | 0.160 | 0.188 | 0.205 |
| Population Density | 0.405 | 0.333 | 0.389 | 0.220 | 0.214 | 0.304 | 0.310 | 0.275 | 0.180 | 0.220 | 0.285 |
| Depth to GW | 0.101 | 0.111 | 0.130 | 0.157 | 0.161 | 0.182 | 0.232 | 0.165 | 0.140 | 0.157 | 0.154 |
| Land Use | 0.034 | 0.048 | 0.026 | 0.031 | 0.054 | 0.015 | 0.019 | 0.018 | 0.060 | 0.031 | 0.034 |
| Precipitation | 0.029 | 0.042 | 0.022 | 0.016 | 0.027 | 0.015 | 0.019 | 0.018 | 0.060 | 0.016 | 0.026 |
| Distance to Springs | 0.051 | 0.067 | 0.043 | 0.126 | 0.107 | 0.061 | 0.039 | 0.110 | 0.100 | 0.126 | 0.083 |
| Distance to Water Reservoirs | 0.068 | 0.083 | 0.043 | 0.126 | 0.107 | 0.122 | 0.077 | 0.110 | 0.120 | 0.126 | 0.098 |
| Density of GW Wells | 0.051 | 0.067 | 0.043 | 0.094 | 0.080 | 0.030 | 0.039 | 0.055 | 0.100 | 0.094 | 0.065 |
| Soil Hydraulic Conductivity | 0.025 | 0.037 | 0.019 | 0.010 | 0.009 | 0.012 | 0.013 | 0.011 | 0.020 | 0.010 | 0.017 |
| Distance to WWTPs | 0.034 | 0.048 | 0.026 | 0.031 | 0.054 | 0.015 | 0.019 | 0.018 | 0.060 | 0.031 | 0.034 |
| n | 1 | 2 | 3 | 4 | 5 | 6 | 7 | 8 | 9 | 10 | 11 |
|---|---|---|---|---|---|---|---|---|---|---|---|
| R.I | 0.00 | 0.00 | 0.58 | 0.90 | 1.12 | 1.24 | 1.32 | 1.41 | 1.45 | 1.49 | 1.51 |
Table 5.
Distance to Water Reservoirs, Wastewater Treatment Plants (WWTPs) and Springs normalized range of values.
Table 5.
Distance to Water Reservoirs, Wastewater Treatment Plants (WWTPs) and Springs normalized range of values.
| Distance Parameter | Normalized Values Range |
|---|---|
| Water Reservoirs | 0–0.098 |
| Wastewater Treatment Plants (WWTPs) | 0–0.034 |
| Springs | 0–0.083 |
Table 6.
Most Vulnerable Districts in Jordan.
| Governorate | Most Vulnerable Districts |
|---|---|
| Irbid | Al Aghwar Shamaliyeh, Al Kurah, Al Mazar Shamali, Al Taybeh, Al Wastiyah, Bani Kenanah |
| Mafraq | Al Khaldiyah, Bala’ma, Irhab |
| Ajlun | Arjan |
| Jarash | Al Mastabah, Burma |
| Al Balqa’ | Al Ardha, Al Shunah Janubiyah, Dair Alla, Ira & Yarqa, Zay |
| Zarqa | Al Azraq, Al Dhlail, Birain |
| Amman | Hosban, Na’ur |
| Madaba | Al Areedh, Al Faisaliyah, Jrainah, Ma’in |
| Karak | Al Aghwar Janubiyah, Al Faqu’, Al Mujib, Al Qaser, Ghawr Al Mazara’a, Mu’ab |
| Tafileh | Al Hasa, Bsaira |
| Ma’an | Al Jafr, Al Mraighah, Athroh, Iyll |
| Aqaba | Al Qwairah, Wadi Araba |
Publisher’s Note: MDPI stays neutral with regard to jurisdictional claims in published maps and institutional affiliations. |
© 2022 by the authors. Licensee MDPI, Basel, Switzerland. This article is an open access article distributed under the terms and conditions of the Creative Commons Attribution (CC BY) license (https://creativecommons.org/licenses/by/4.0/).
Share and Cite
MDPI and ACS Style
Hammouri, N.; Talafha, M.; Hamarneh, Q.; Annab, Z.; Al-Ruzouq, R.; Shanableh, A. Vulnerability Hotspots Mapping for Enhancing Sanitation Services Provision: A Case Study of Jordan. Water 2022, 14, 1689. https://doi.org/10.3390/w14111689
AMA Style
Hammouri N, Talafha M, Hamarneh Q, Annab Z, Al-Ruzouq R, Shanableh A. Vulnerability Hotspots Mapping for Enhancing Sanitation Services Provision: A Case Study of Jordan. Water. 2022; 14(11):1689. https://doi.org/10.3390/w14111689
Chicago/Turabian StyleHammouri, Nezar, Mohammad Talafha, Qais Hamarneh, Zeina Annab, Rami Al-Ruzouq, and Abdallah Shanableh. 2022. "Vulnerability Hotspots Mapping for Enhancing Sanitation Services Provision: A Case Study of Jordan" Water 14, no. 11: 1689. https://doi.org/10.3390/w14111689
Note that from the first issue of 2016, this journal uses article numbers instead of page numbers. See further details here.