
Transcriptomic Analysis of the Molecular Response Mechanism of Microcystis aeruginosa to Iron Limitation Stress

Department of Environmental Science and Engineering, Fudan University, Shanghai 200433, China
*
Author to whom correspondence should be addressed.
Water 2022, 14(11), 1679; https://doi.org/10.3390/w14111679
Submission received: 31 March 2022
/
Revised: 20 May 2022
/
Accepted: 20 May 2022
/
Published: 24 May 2022
(This article belongs to the Section Water Quality and Contamination)
Abstract
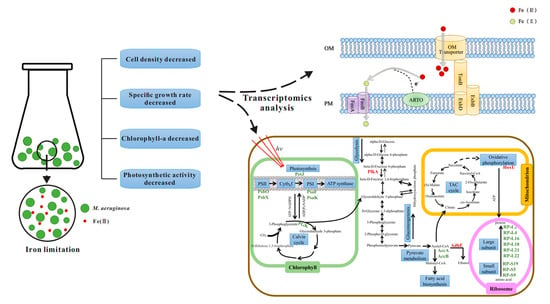
:Iron is an essential micronutrient for cyanobacteria. It is involved in physiological activities such as photosynthesis, respiration, and the synthesis of pigments. The impact of iron limitation on planktonic algae growth occurs in surface oceans globally, as well as in freshwater ecosystems. However, the molecular and physiological effects and response mechanism of cyanobacteria under iron-limited conditions have not been reported in detail. In this study, the effects of iron limitation on the cell density, chlorophyll content, and photosynthetic activity of Microcystis aeruginosa were determined, and transcriptome sequencing was undertaken. In a severely iron-deficient environment, the cell density and chlorophyll-a content of M. aeruginosa were significantly lower than in the iron-rich group (a 55.42% and 83.51% reduction, respectively). Similarly, the photosynthetic efficiency of M. aeruginosa was also inhibited by iron deficiency, and the maximum photochemical efficiency (Fv/Fm) of the severe iron deficiency group was only 66.72% of the control group. The transcriptome results showed that to cope with the iron-deficient environment, most genes involved in iron absorption and transport in M. aeruginosa were up-regulated. In particular, the fur and perR genes that regulate the iron uptake regulatory protein (Fur) were both up-regulated. Due to the high demand for iron in the photosynthetic electron transport chain of M. aeruginosa, most photosynthesis-related genes were down-regulated, for example, petJ, which regulates iron-containing cytochrome c6. In contrast, most of the genes related to glycolysis and respiration were up-regulated. These changes in gene expression may be a survival strategy for M. aeruginosa to cope with a long-term iron-deficient environment. This study provides insights into the molecular response mechanism of M. aeruginosa under iron limitation stress.
1. Introduction
Cyanobacteria are primitive photosynthetic oxygen-evolving organisms, and are widely distributed in oceans and lakes globally [1]. From a human perspective, cyanobacteria are important primary producers [2]. However, in nitrogen- and phosphorus-rich waters, cyanobacteria will proliferate in large numbers, causing oxygen depletion and negatively affecting aquatic ecosystems [3]. Iron is an essential trace element required by cyanobacteria, involved in photosynthesis, respiration, chlorophyll and phycobilin synthesis, nitrogen fixation, and other physiological processes [4,5,6,7].
Iron limitation is known to have a significant impact on plankton on the global ocean surface [8]. Furthermore, iron availability is very low due to the special iron chemistry in lakes, such as the combination of organic matter and iron, the oxidation of ferrous iron to ferric iron, and precipitation in water bodies. Many lakes are also limited in the level of bioavailable iron, which restricts the growth of cyanobacteria [9]. For example, the dissolved iron concentration in the summer upper layer of Lake Kinneret in Israel is 10–20 nmol/L [10], and the dissolved iron concentration in the water layer above 50 m of Lake Nyos in Africa is 36 μmol/L [11]. Cyanobacteria have evolved various strategies to adapt to low bioavailable iron environments. The iron absorption of cyanobacteria is regulated by siderophores and the absorption of free inorganic iron ions. Short-term iron absorption experiments have shown that Synechocystis sp. PCC 6803 can easily absorb and utilize soluble inorganic. In an iron-limited environment, Synechocystis has an efficient inorganic free Fe(Ⅲ) transport system [12]. Both Guo-Wei Qiu [13] and Hai-Bo Jiang [14] demonstrated that the TonB-dependent transporters (TBDTs) in the outer membrane (OM) of Synechocystis sp. PCC 6803 not only participate in the absorption of organic iron siderophores, but also in the acquisition of inorganic free Fe. Studies on the iron absorption mechanism of Microcystis aeruginosa show that M. aeruginosa. PCC 7806 can secrete extracellular superoxide substances that can reduce iron in a low-iron Fraquil medium [15]. This superoxide can reduce inorganic Fe(Ⅲ) to free Fe(Ⅱ) for absorption and utilization by algal cells.
In cyanobacteria under iron-limited biological conditions, the maximum photochemical efficiency (Fv/Fm), saturation light intensity (Ik), and maximum electron transfer efficiency (ETRmax) of photosystem Ⅱ also decreased significantly [16,17]. Sonia [5] studied the coastal strain, Synechococcus sp. PCC7002, under a long-term iron-limited culture. Iron limitation induced the up-regulation of genes involved in energy metabolism, down-regulated macronutrient intake, and affected the activation of cofactors against oxidative stress. Wan [18] studied the effects of iron on the growth, lipid accumulation, and gene expression profile of Chlorella sorokiniana CCTCC M209220, under photosynthetic autotrophic conditions. After 10−5 mol/L iron was added, cell density and lipid content increased. The expression of several genes that regulate carbonic anhydrase, involved in the growth of microalgae cells, and choline transporter, related to lipid synthesis, increased. However, there remains a lack of in-depth studies on the molecular mechanisms in freshwater cyanobacteria under long-term iron limitation, including changes in the expression of energy metabolism-related genes.
Therefore, in this study, M. aeruginosa was used as a representative cyanobacteria of freshwater ecosystems to study the effects of iron limitation. M. aeruginosa was cultivated for 20 days in an iron-limited medium, and the algal density, growth rate, chlorophyll content, and photochemical efficiency were measured. As there are a number of studies on the adaptation mechanism of cyanobacteria under iron-limited conditions at the molecular level, gene expression was analyzed by RNA sequencing (RNA-Seq). RNA-Seq has been widely used to elucidate differential gene expression patterns, in response to various environmental factors [19,20]. The results provide detailed information on the differential expression of genes related to iron absorption and photosynthesis, and contribute to the comprehensive understanding of the adaptation and response mechanism of M. aeruginosa in iron-limited environments.
2. Materials and Methods
2.1. Culture of Microcystis aeruginosa
M. aeruginosa (FACHB 912) was purchased from Wuhan Institute of Hydrobiology, Chinese Academy of Sciences, and expanded in BG11 standard culture medium.
During the experiment, the algae were transferred to Fraquil* medium [21] (this medium is suitable for studying cells’ response to trace metal availability). Since the concentrations of some nutrients (mainly nitrogen and phosphorus) were relatively low in the original Fraquil* medium, BG11 medium was used as a reference to adjust the nutrient concentration to an appropriate level. The nitrogen element was adjusted to 17.65 mmol/L, and the phosphorus element was adjusted to 0.23 mmol/L. A nutrient-rich Fraquil* BG11 medium [22] for optimal cell growth was developed.
The chemicals used in the study were of high purity and all reagents were prepared with Milli-q ultrapure water (Millipore, Boston, MA, USA). M. aeruginosa was cultured in acid-washed 250 mL Corning polycarbonate bottles (Corning Inc., Corning, New York, NY, USA). All containers that came into contact with the medium reagents were made of plastic to avoid iron adsorption by glassware. All vessels were pre-soaked with 0.1 mol/L hydrochloric acid 24 h, washed with ultrapure water (at least four times), and dried.
2.2. Experimental Design
M. aeruginosa was cultured under conditions of iron starvation for 72 h when it reached the exponential growth stage. The supernatant was then removed by centrifugation at 4000 rpm for 10 min, and the cell precipitates were gently washed twice in Fraquil* BG11 medium without iron. The cells were then rinsed with 2 mmol/L NaHCO3 [23] to remove iron hydroxide adsorbed to the cell surface. M. aeruginosa was inoculated into a Corning cone flask containing fresh Fraquil* BG11 medium and the initial cell concentration was adjusted to 1.5 (±0.05) × 105 cell/mL. The iron concentrations were set as 20 nmol/L (severe Fe deficiency), 100 nmol/L (moderate Fe deficiency), and 1000 nmol/L (sufficient Fe), and each treatment was performed in triplicate, in parallel. M. aeruginosa was incubated for 20 d under a cold white fluorescent lamp at 26 °C, at a light intensity of 2000 lx (12 h/12 h light/dark cycle). During the experiment, all the culture bottles were shaken by hand three times a day and their positions were randomly altered to minimize the effect of light intensity.
2.3. Physiological Index Measurement
2.3.1. Cell Density
Samples were collected every two days and cell density was measured using a CountStar Automated Algae Counter (Countstar, Shanghai, China). Specific growth rate (μ) was calculated as follows
where N1 and N2 were the cell densities at t1 and t2, respectively.
2.3.2. Determination of Chlorophyll-a and Carotenoid Content
During the experiment, 5 mL of algal fluid was taken every two days and centrifuged at 8000 rpm for 10 min to remove the supernatant. The pigment was extracted by resuspending the precipitate with 95% ethanol at 4 °C for 24 h without light. It was then centrifuged at 8000 rpm for 10 min and the supernatant was collected. The absorbance of the supernatant was measured at 664.1 nm, 648.6 nm, and 470.0 nm using a UV-visible spectrophotometer (UV-5200, Shanghai Yuanyi, Shanghai, China). The chlorophyll-a and carotenoid content were calculated according to Equations (2) and (3) [24], respectively.
2.3.3. Determination of Chlorophyll Fluorescence
M. aeruginosa cells were collected every two days to determine the chlorophyll fluorescence. After dark adapting the samples for 20 min, the Rapid Light Response Curve (RLC) was measured using the Phytopam Phytoplankton Fluorescence Spectrometer (Walz, Germany) to obtain the maximum chlorophyll fluorescence yield (Fm) and the minimum chlorophyll fluorescence yield (Fo) of the samples after dark adaptation [25]. Fm − Fo = Fv, Fv represents the maximum variable fluorescence, and thus the maximum photochemical efficiency (Fv/Fm) of PSII is obtained [26]. A total of nine photosynthetically active radiation (PAR) values were measured by fluorimetry, which were 34, 110, 161, 248, 366, 559, 833, 1181, 1627 μmol photons·m−2·s−1. The potential maximum relative electron transfer rate (rETRmax) and the initial slope (α) of the fast light curve were obtained by fitting the RLC.
2.4. RNA Extraction and Determination
Total RNA was isolated using Trizol reagent (Invitrogen Life Technologies, Carlsbad, CA, USA). Quality and integrity were measured using a Nanodrop spectrophotometer (Thermo Scientific, Waltham, MA, USA) and a BioAnalyzer 2100 system (Agilent, Santa Clara, CA, USA), and then the quality was checked by denaturing formaldehyde-agarose gel electrophoresis. The quantified values of RNA integrity of all samples in this study were >7.0. Messenger RNA was then isolated for sequencing using the Ribo-Zero rRNA removal kit (Illumina, San Diego, CA, USA), following the manufacturer’s instructions. Since the prokaryotic mRNA had no polyA tail structure, the library was constructed by removing rRNA, and the library was constructed by using the Quant-It Picogreen dsDNA Assay Kit (Invitrogen, Carlsbad, CA, USA). The constructed libraries were sequenced on an Illumina HiSeq 2000.
2.5. Genome Annotation and Analysis
To obtain high quality data, read segments with contaminated joints, low quality reads, and reads with poly-N were removed from the original data. The expression abundance of the samples was standardized by fragments per kilo bases per million fragments (FPKM). Differential gene expression analysis was performed by DESeq to compare three biologically-duplicated samples. Expression fold difference log2|fold change| > 1 and significant p-value < 0.05 were used to define the significant differentially expressed genes (DEG).
3. Results and Discussion
3.1. Effect of Iron Limitation on Microcystis aeruginosa Growth
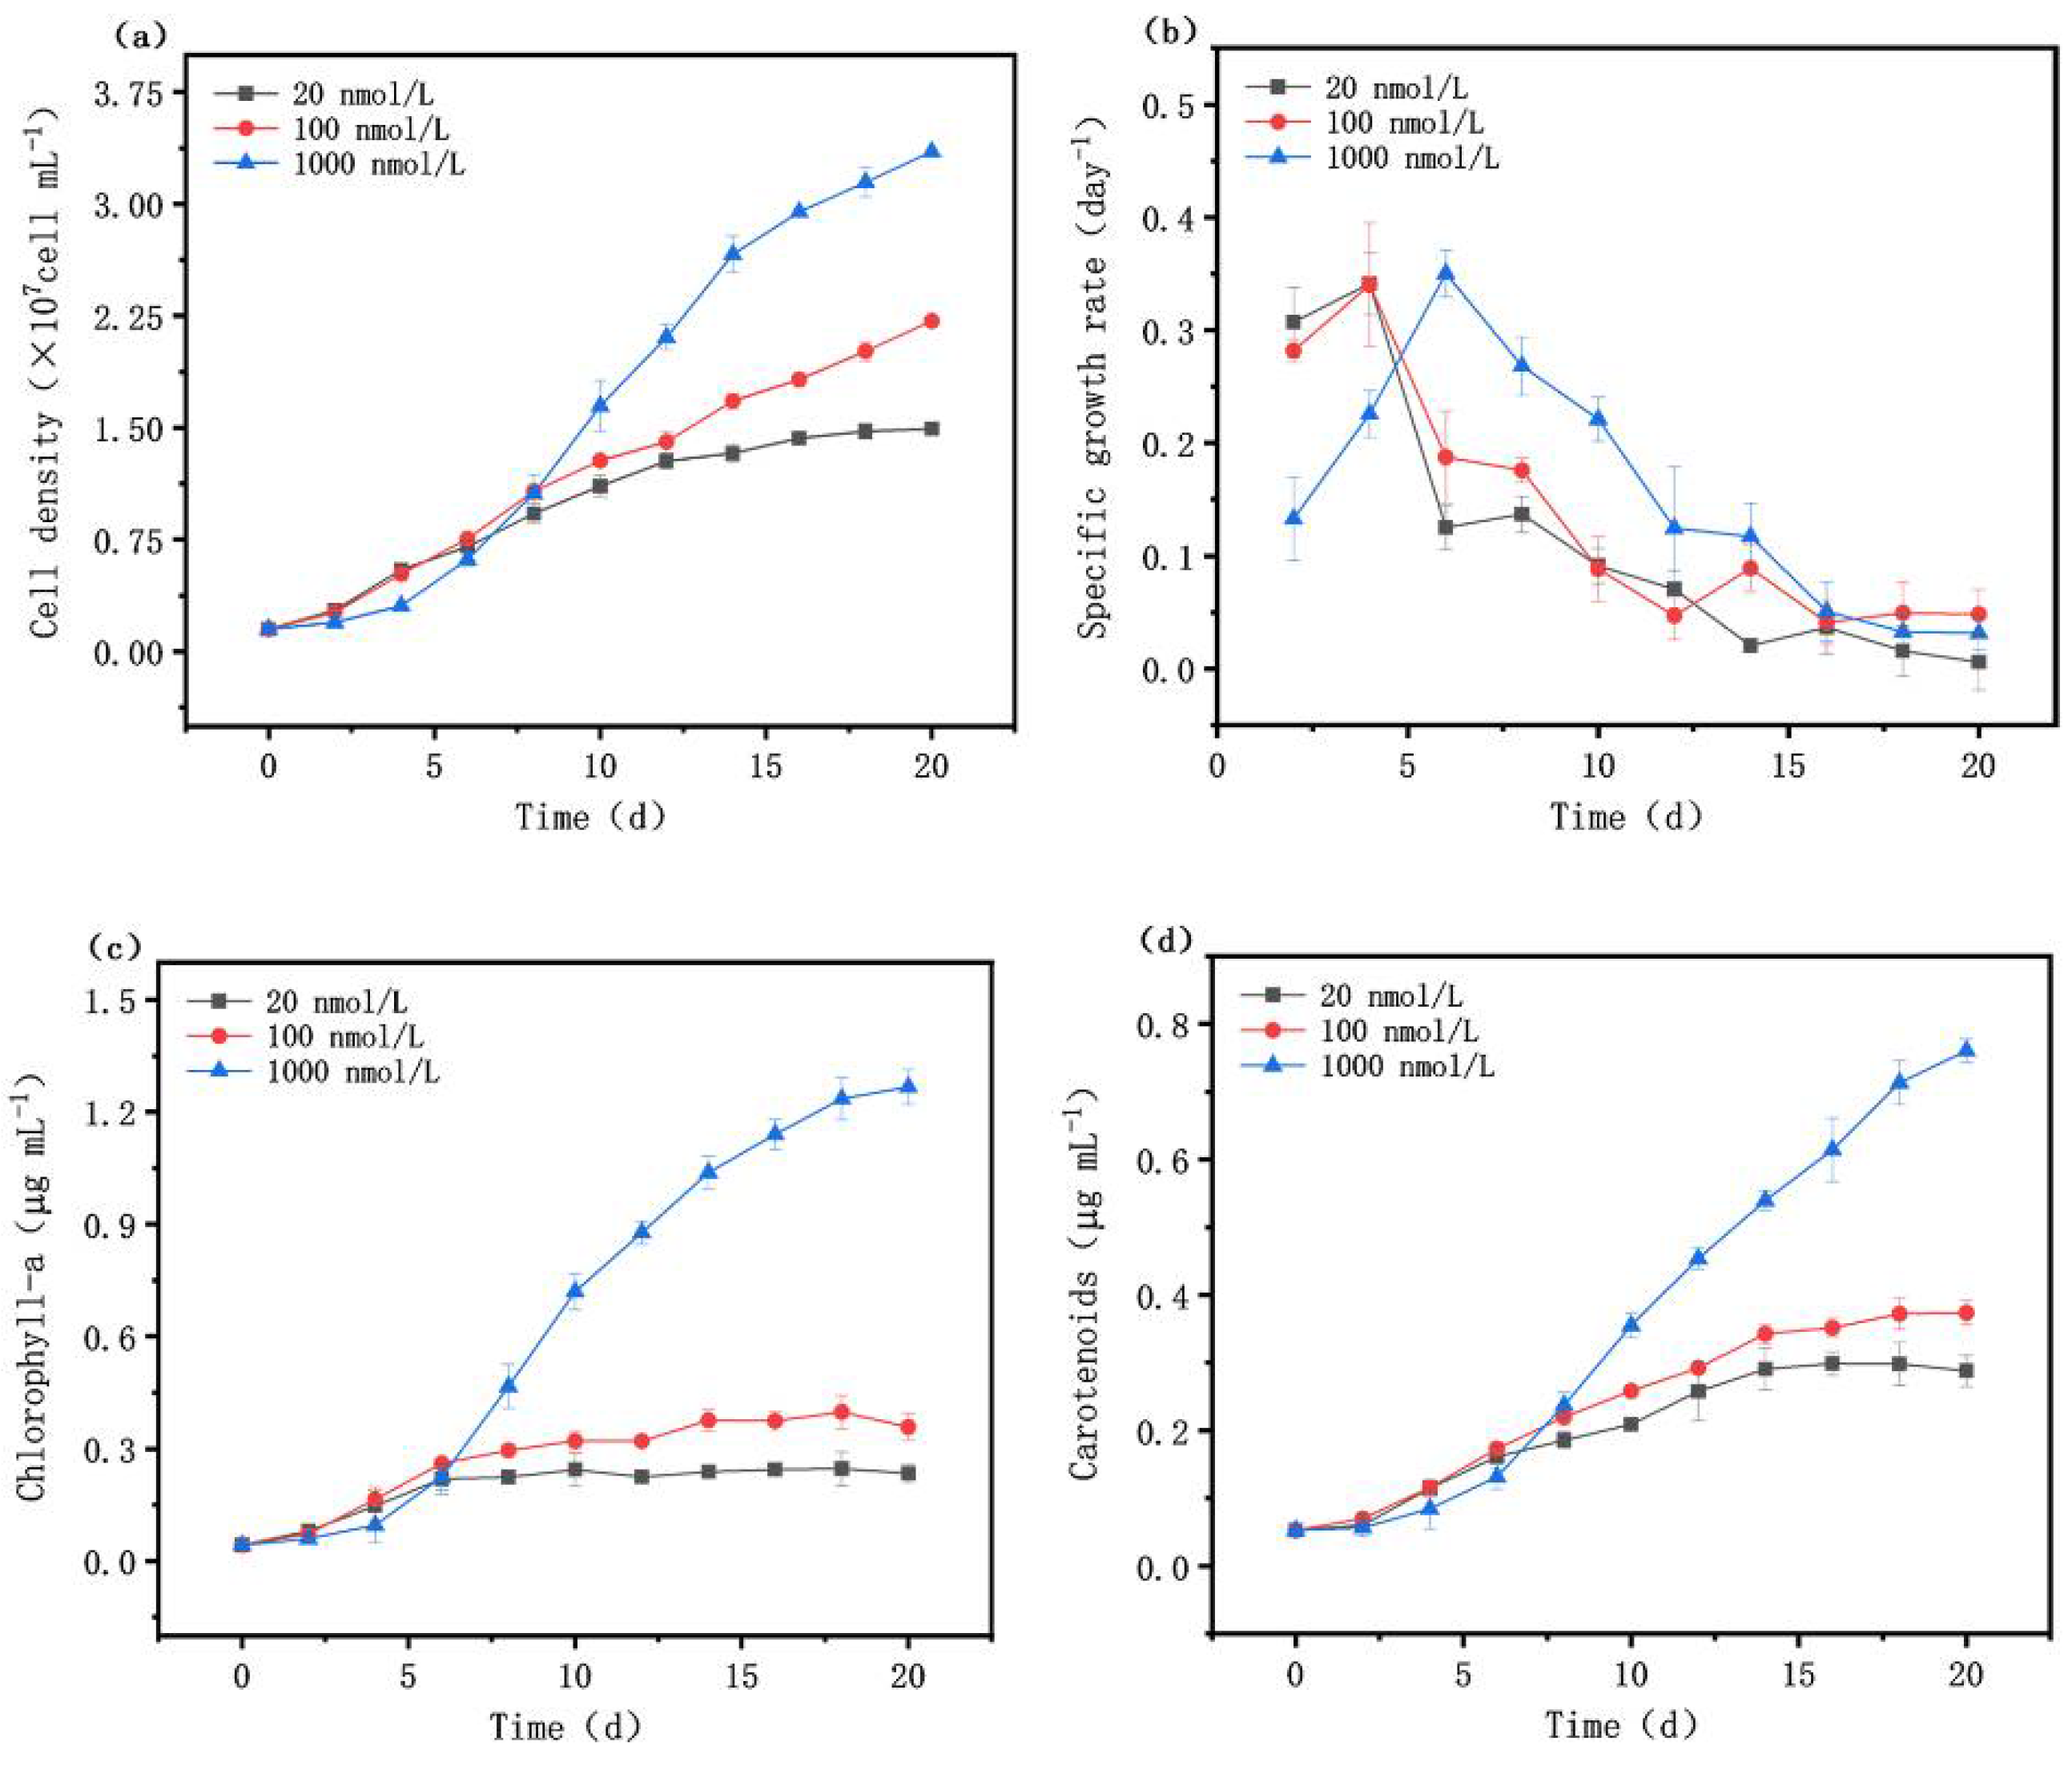
Cell density, specific growth rate, and chlorophyll-a and carotenoid concentrations were measured during the cultivation of M. aeruginosa, as shown in Figure 1. Compared with the growth of M. aeruginosa under iron-abundant conditions (1000 nmol/L), the cell density under iron-limited conditions (including 20 nmol/L and 100 nmol/L iron) increased faster initially, while the specific growth rate decreased sharply after day 7 (Figure 1a,b). After 20 days, the cell density in the severely iron-deficient group was 1.49 × 10⁷ cell/mL, while the cell density in the moderately iron-deficient group was slightly higher, reaching 2.22 × 10⁷ cell/mL; only 44.58% and 66.17% of the iron-sufficient group, respectively. These results are similar to the previously reported changes in cell density and the specific growth rate of M. aeruginosa PCC7806 in Fraquil* medium with a total iron concentration of 0.1 μm/L and 1 μm/L [27]. In the first week of growth, the iron concentration in the culture medium did not significantly affect cell density. However, after about two weeks of growth, the cell density of the iron-sufficient group was significantly higher than that of the other two iron-deficient groups.
Although chlorophyll-a itself does not contain iron atoms, iron acts as a component of coproporphyrinogen oxidase (CPOX) to catalyze the synthesis of chlorophyll-a [28,29]. Therefore, with the decrease in iron concentration, chlorophyll-a and carotenoids showed similar trends to cell density. At the beginning of the experiment, there was no significant difference in the chlorophyll-a and carotenoid content under different iron concentrations. After 6 d, the growth levels of chlorophyll-a and carotenoids in the iron-sufficient group gradually accelerated, and increased to a level higher than the two iron-deficient groups (Figure 1c,d). Compared with carotenoids, chlorophyll-a is more inhibited under conditions of iron deficiency, indicating that different photosynthetic pigments are affected by iron limitation to varying degrees at different growth stages.
3.2. Effects of Iron Limitation on Genes Related to Iron Absorption and Transport
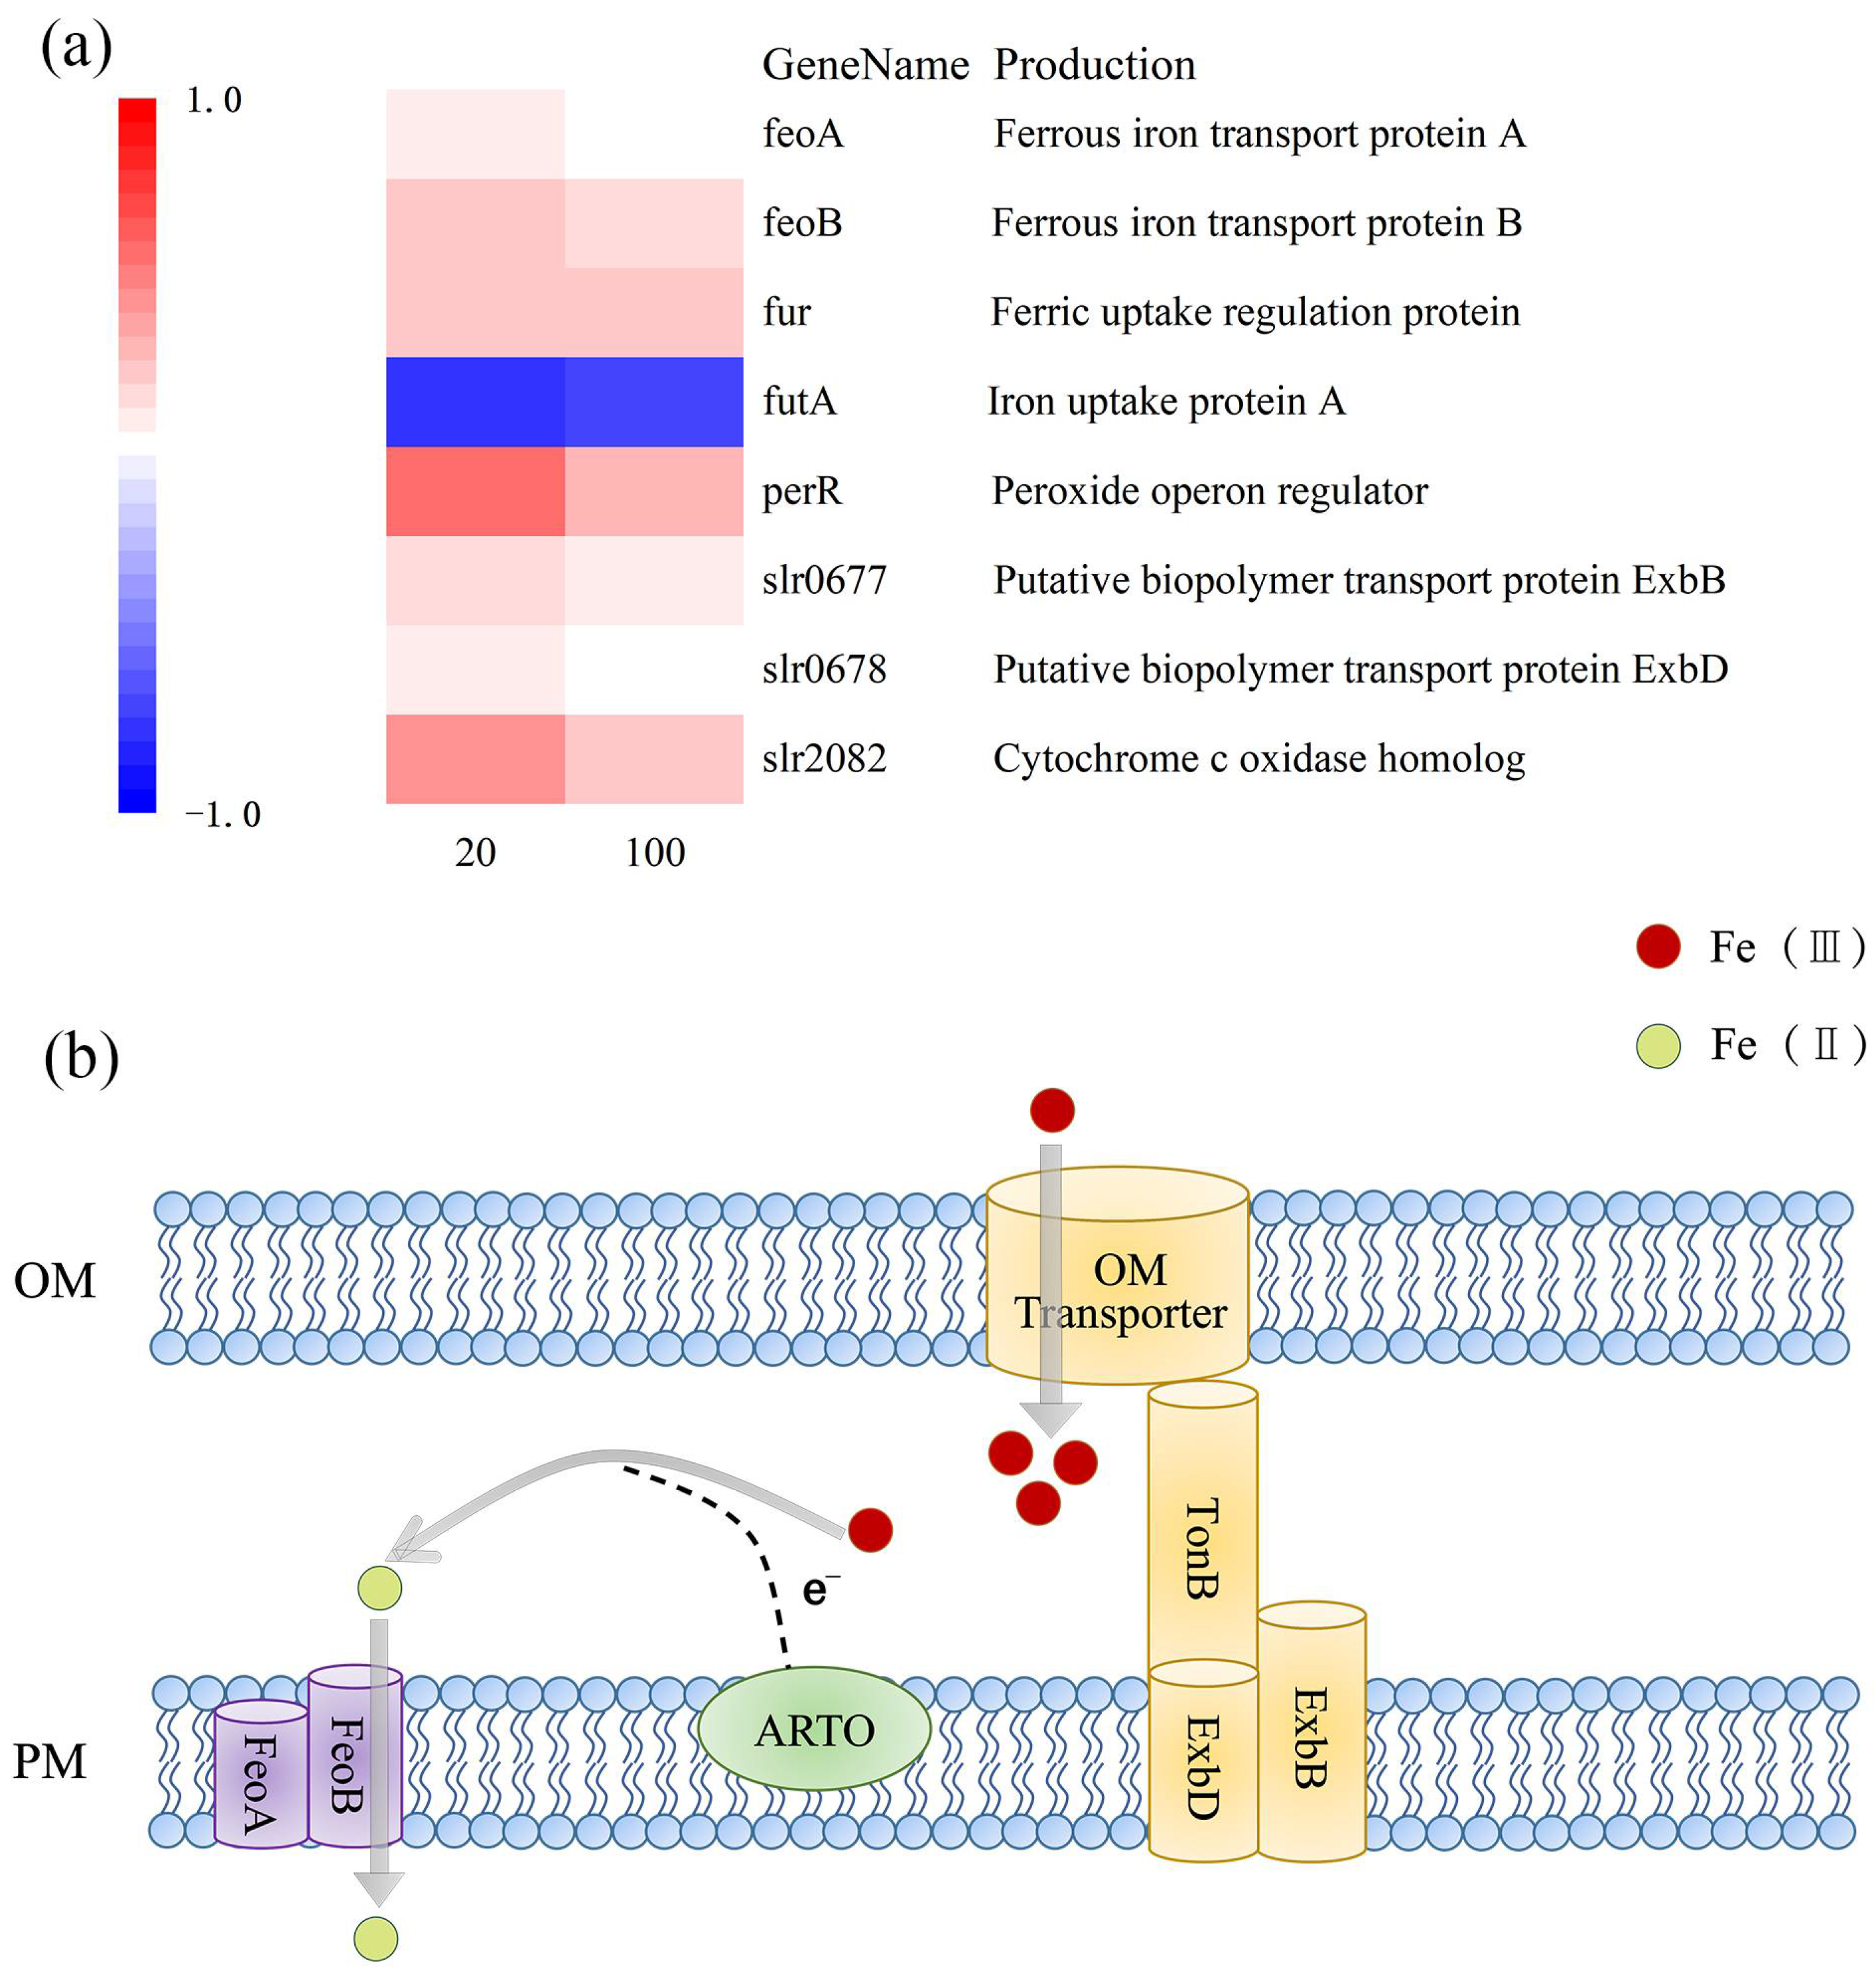
After iron limitation, the fur and perR genes, which regulate the iron uptake regulator protein (Fur), were up-regulated (Figure 2a). In addition, the up-regulation of the perR gene in M. aeruginosa FACHB912 was higher than the fur gene under both iron deficiency conditions. This may be because the Fe2+ ion content of M. aeruginosa is low, so the divalent iron binding site on the iron uptake regulator does not have Fe2+ ion binding, resulting in Fur being in an inactive state. Turning off the transcriptional suppression of iron uptake-related genes activates the transcription of fur and perR genes. As a result, gene expression is up-regulated to increase the uptake capacity of M. aeruginosa [30,31]. Under the regulation of Fur, the genes feoA and feoB involved in ferroportin are up-regulated: the more severe the iron deficiency, the higher the degree of gene up-regulation (Figure 2a). The gene slr2802, which regulates Alternate Respiratory Terminal Oxidase (ARTO), was also up-regulated. The TonB-ExbB-ExbD system captures soluble free iron by active absorption for utilization by algal cells [14]. The related slr0677 and slr0678 genes involved in regulating this process were slightly up-regulated in iron deficiency.
Under conditions of iron deficiency, the futA gene was down-regulated (Figure 2a). The futA gene encodes the iron uptake protein, FutA. Inorganic Fe(Ⅲ) can bind to FutA in the periplasmic space and is transported into the plasma membrane by permease (FutB) and membrane-associated ATPase (FutC) [32]. Therefore, it was speculated that the down-regulation of the futA gene may be because, in an iron-deficient environment, M. aeruginosa preferentially absorbs and transports inorganic Fe(Ⅱ) rather than inorganic Fe(Ⅲ).
Based on this, a model of M. aeruginosa FACHB-912 to absorb and transport iron in an iron-deficient environment was proposed (Figure 2b). Fe(Ⅲ) is transported into the cell from the external environment through the outer membrane via the complex TonB-ExbB-ExbD. After entering the periplasmic space, most of Fe(III) is reduced to Fe(II) with the participation of ARTO located on the plasma membrane [13,14,33]. FeoB, as an efficient transporter of iron, and the interaction of the protein with FeoA [34], means the Fe(Ⅱ) is immediately transported into the cytoplasm to facilitate the storage and use of M. aeruginosa iron. The combined action of ARTO and FeoB enables M. aeruginosa cells to have an iron absorption and transport mode that reduces Fe(III) to Fe(II) and then transports it.
3.3. The Effect of Iron Limitation on Photosynthesis
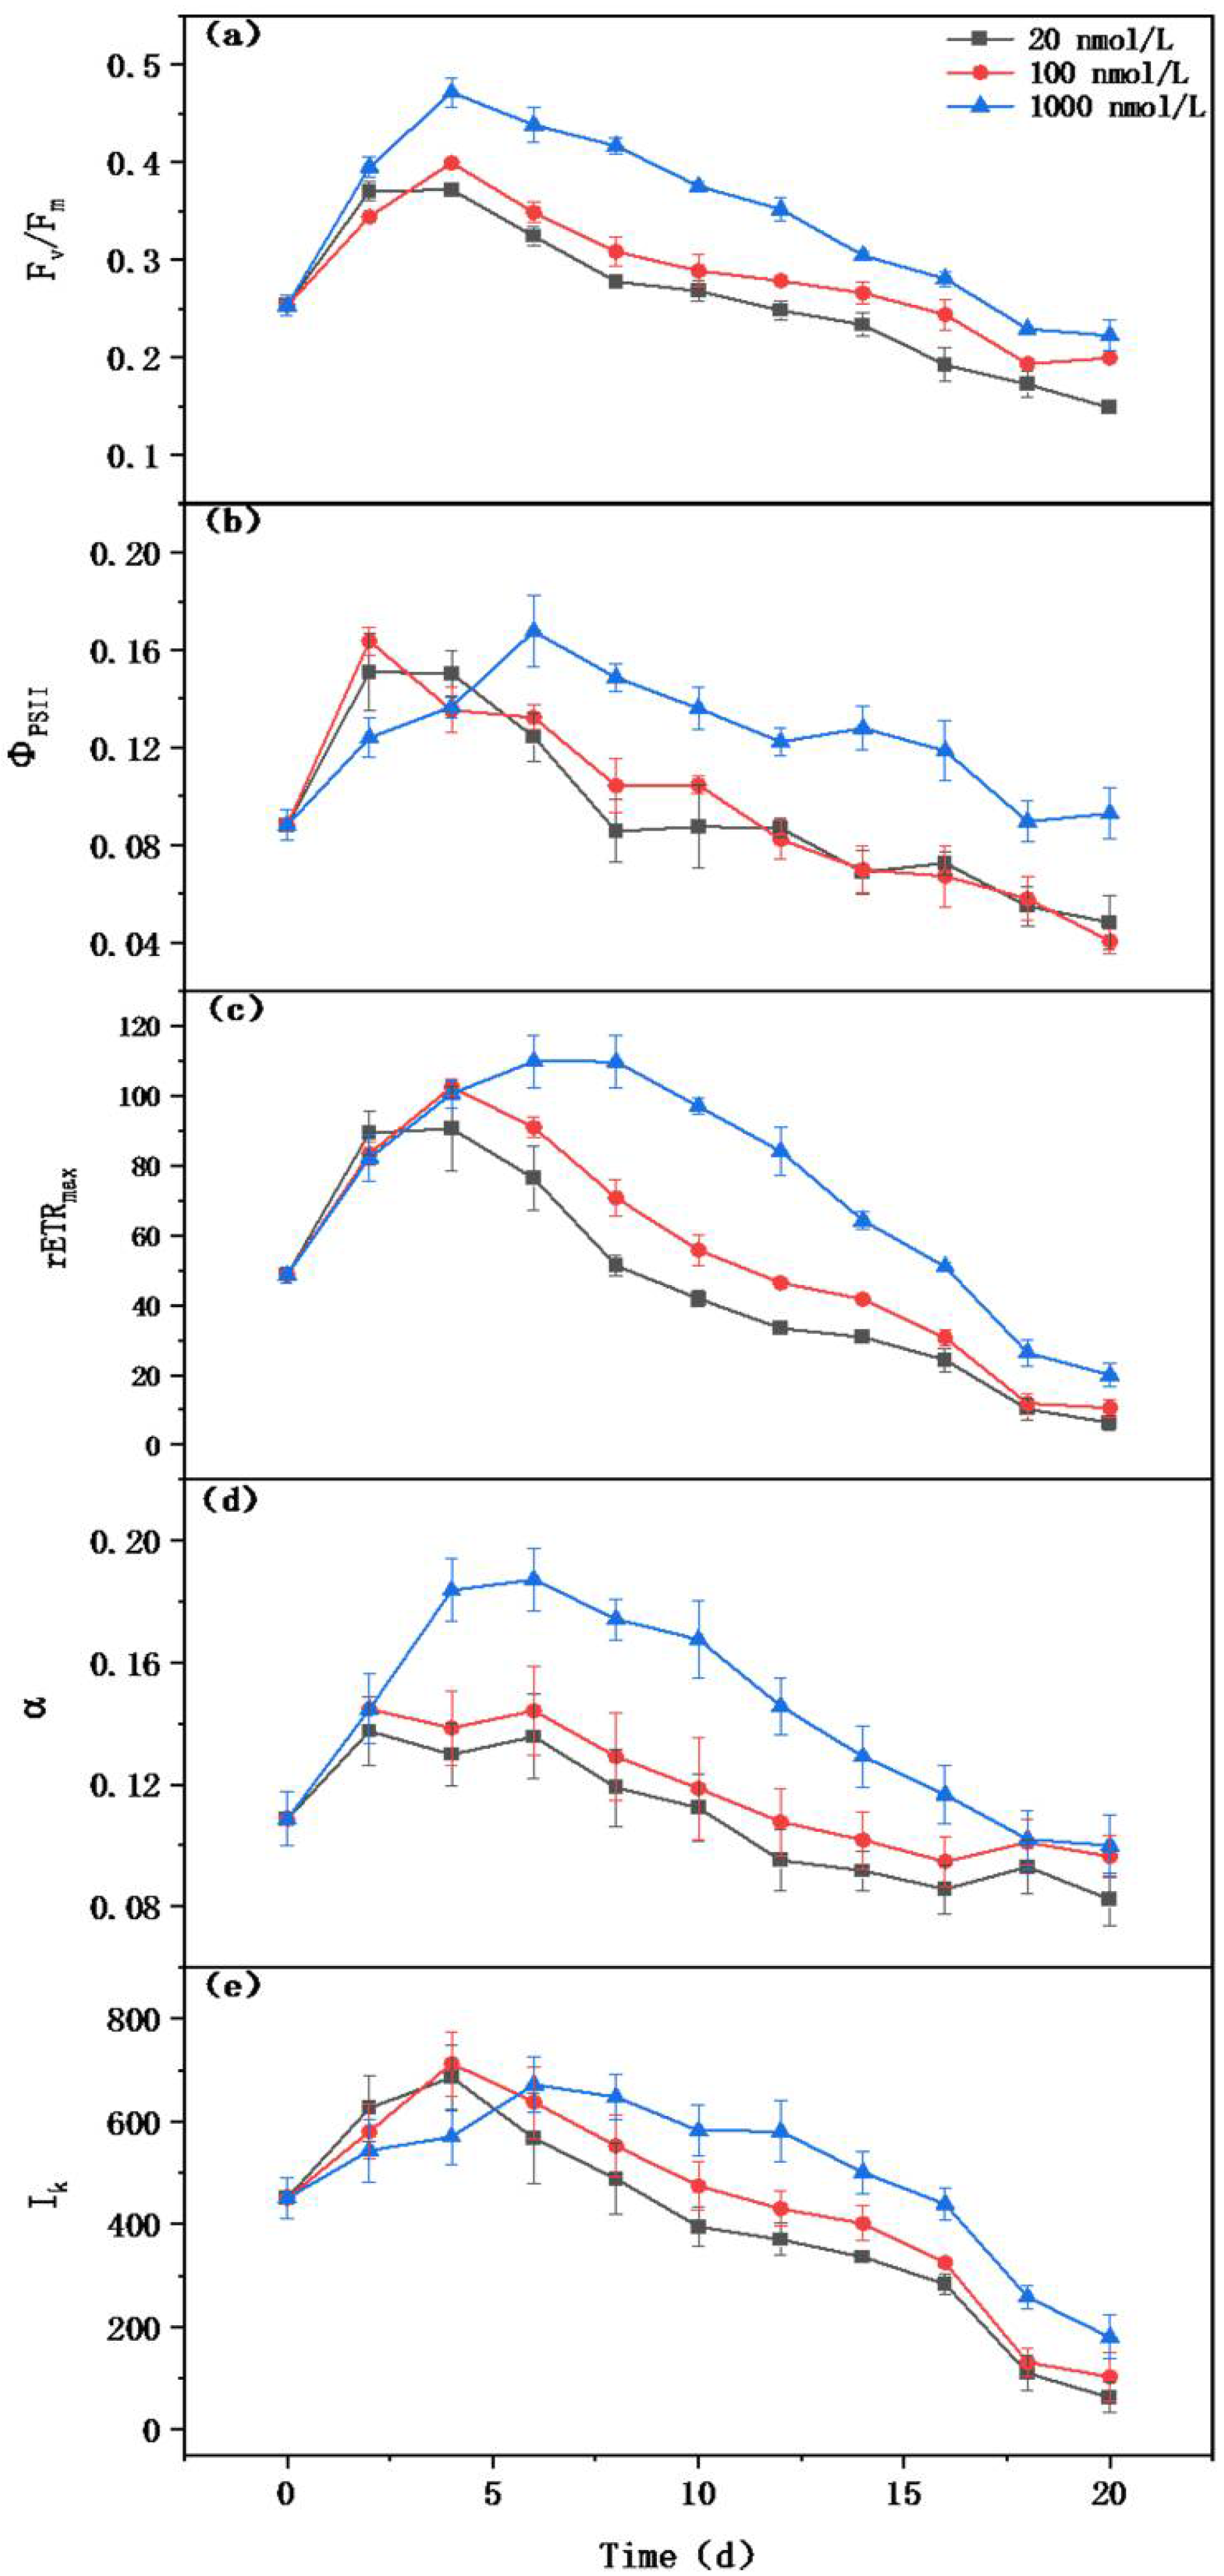
The photosynthetic electron transport chain is rich in iron atoms, so can be easily affected by limitations in iron concentrations [7]. While culturing M. aeruginosa for 20 d, a series of photosynthetic activity parameters was measured (Figure 3). Fv/Fm reflects the potential photochemical efficiency of PSII under dark adaptation [35]. Fv/Fm showed an initial upward trend, then gradually decreased after 4 d cultivation (Figure 3a). The greater the iron limitation, the more significant the inhibition of Fv/Fm. Similar to the change in Fv/Fm, ΦPSII also first increased and then decreased, and was inhibited as the degree of iron limitation increased (Figure 3b). Therefore, an increase in iron limitation reduces the maximum and actual photosynthetic efficiency of PSII.
Meanwhile, in an iron-deficient environment, photosynthetic parameters including the maximum linear electron transfer rate (rETRmax), photosynthetic efficiency (α), and saturated light intensity (Ik) also significantly decreased (Figure 3c–e). rETRmax represents the maximum relative linear electron transfer rate through PSII [36]. The rETRmax of M. aeruginosa in severely and moderately iron-deficient environments decreased by 68.34% and 46.94%, respectively. Ik refers to the light intensity required when the photosynthetic electricity transfer rate reaches its maximum value, and it was significantly inhibited as the iron concentration decreased. These data indicate that low-iron environments are more likely to cause photo-inhibition of M. aeruginosa.
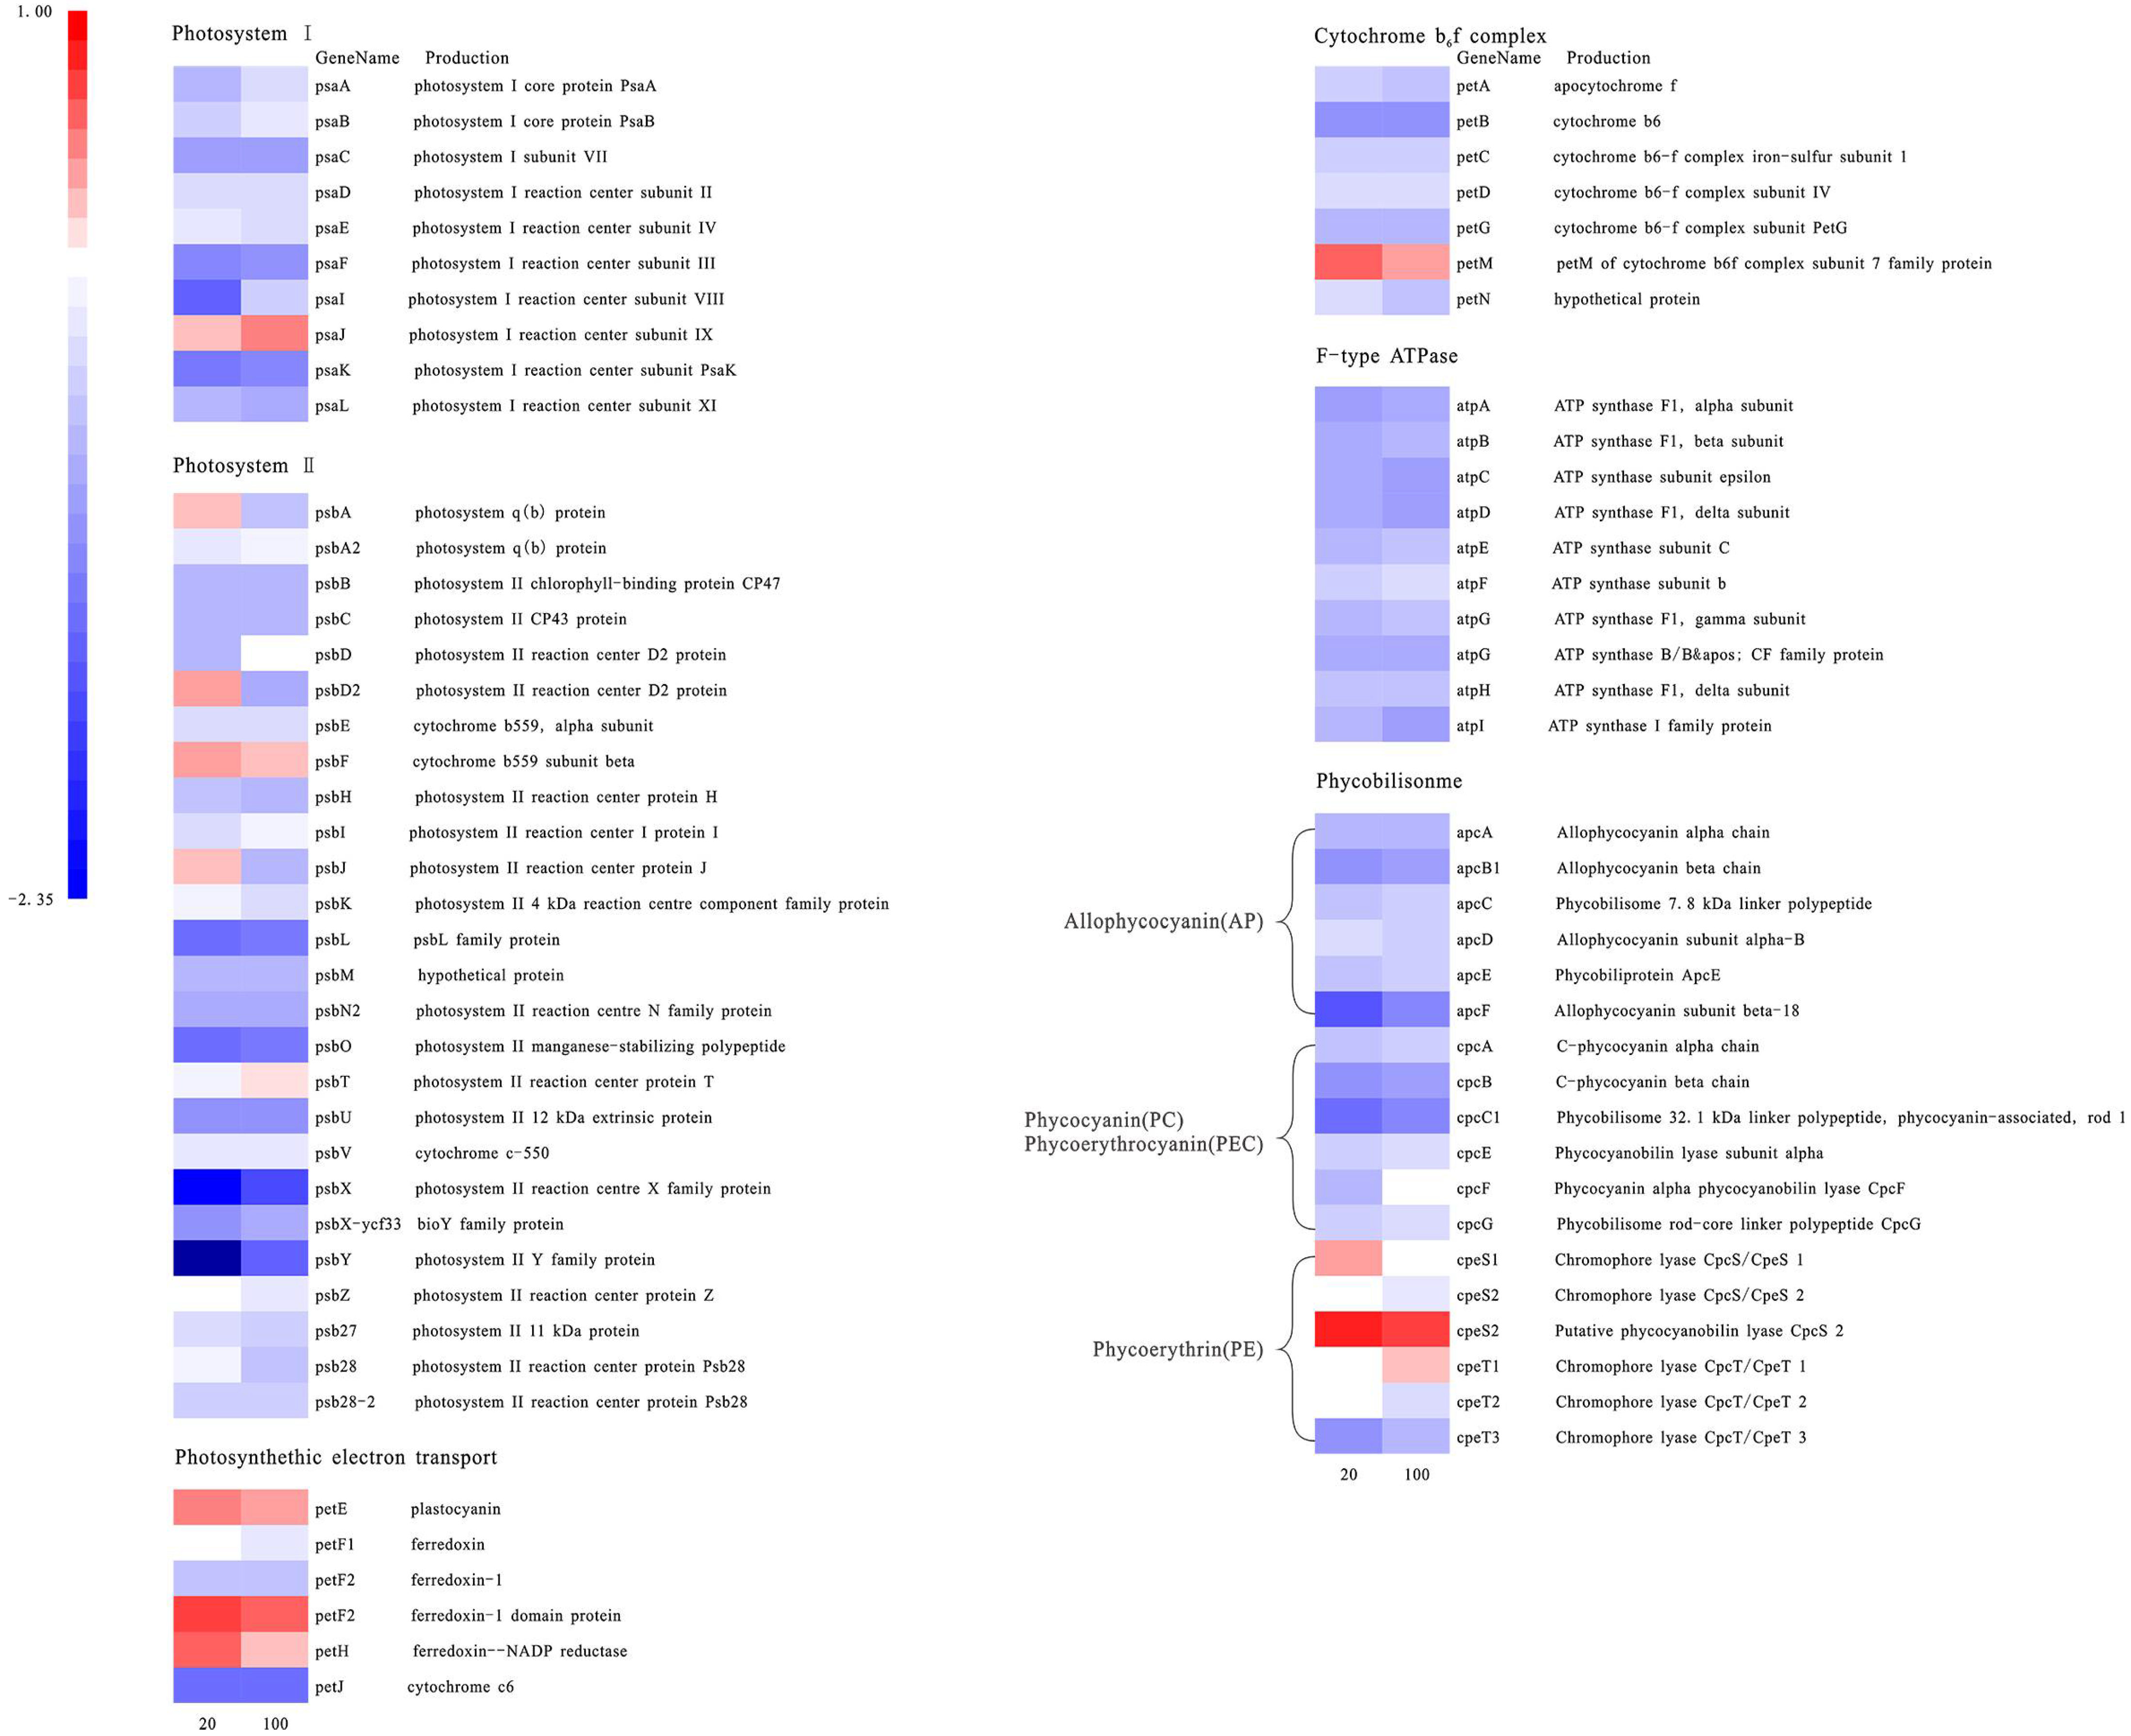
Photosynthesis uses light energy to convert carbon dioxide and water into energy-rich organic matter, and is closely related to the physiology of algae. Following the iron limitation in this study, most genes involved in photosynthesis were differentially expressed (Figure 4).
The expression of most genes in photosynthesis system I (PSI) and photosynthesis system II (PSII) showed a decreasing trend (Figure 4). Among them, the psaK gene, which regulates an important part of the reaction center protein K subunit in PSI, was significantly down-regulated under severe and moderate iron deficiency. The proteins PSAK and PSAG enhance the connection between the light-harvesting complex I (LHC I) and the PSI reaction center, thereby improving the stability of photosystem I. The related gene psaF, of photosystem I reaction center subunit III, was down-regulated under severe iron deficiency conditions, more than in the moderate iron deficiency treatment group. In PSII, psbO involved in the photosystem II manganese-stabilizing polypeptide and psbX of the photosystem II reaction center X protein were significantly down-regulated (Figure 4). At the same time, petJ, which encodes cytochrome c6 in the photosynthetic electron transport chain, was also significantly down-regulated. Most genes in the F-type ATP synthase complex and cytochrome b6f complex were also down-regulated compared with the control group. In an iron-deficient environment, the photosynthetic electron transport chain is the main iron pool for cyanobacteria [37]. Among them, PSI has three 4Fe-4S centers (12 Fe atoms in total, the highest amount of iron required) and PSⅡ contains three to four Fe atoms, thus inhibiting the photosynthetic system of M. aeruginosa. The mobile Cyt c6, encoded by the gene petJ contains one heme and is a water-soluble ferritin located on the thylakoid membrane. In cyanobacterial cells, Cyt c6 and Pcy (plastocyanin, encoded by the petE gene) are the electron carriers shared by the photosynthetic and respiratory transport chain, located between Cyt b6f (cytochrome b6f complex) and PSI, and can effectively transfer electrons to PSI and Cyt c oxidase [38,39,40]. In a low-iron environment, Cyt c6 is often replaced by Pcy. This is consistent with the result that the petE gene was up-regulated, while the petJ gene was significantly down-regulated [41].
In an iron-deficient environment, the phycobilisome nuclear protein gene (apcF) and the phycocyanin connexin gene (cpcC) were significantly down-regulated in the phycobilisomes (PBS) of cyanobacteria. Similarly, other genes related to phycocyanin and allophycocyanin, such as allophycocyanin subunit genes (apcA and apcB), phycobilisome rod nuclear connexin (apcC), phycobilisome anchoring protein genes (cpcF), allophycocyanin connexin gene (apcL), phycocyanin subunit genes (cpcA and cpcB), phycocyanin subunit phycocyaninase (cpcE), rod and nuclear connexin gene (cpcG), etc. [42,43], were all down-regulated. This is because the synthesis of phycocyanin and phycoerythrin requires the participation of ferredoxin, and the synthesis of phycobiliprotein chromophore also requires the participation of heme oxygenase. When algal cells are under low-iron stress, most of the genes related to PBS are down-regulated, resulting in a decrease in the PBS content.
This study demonstrates that, in an iron-limited environment, M. aeruginosa will reduce photosynthetic activity by down-regulating photosynthesis-related genes (Figure 3 and Figure 4), and replace iron-containing proteins with iron-free proteins. For example, Pcy replaces Cyt c6 and iron-free flavodoxin (Fld) replaces ferredoxin (Fd), to adapt to the iron-deficient environment.
3.4. Effect of Iron Limitation on the Molecular Regulatory Network of Microcystis aeruginosa
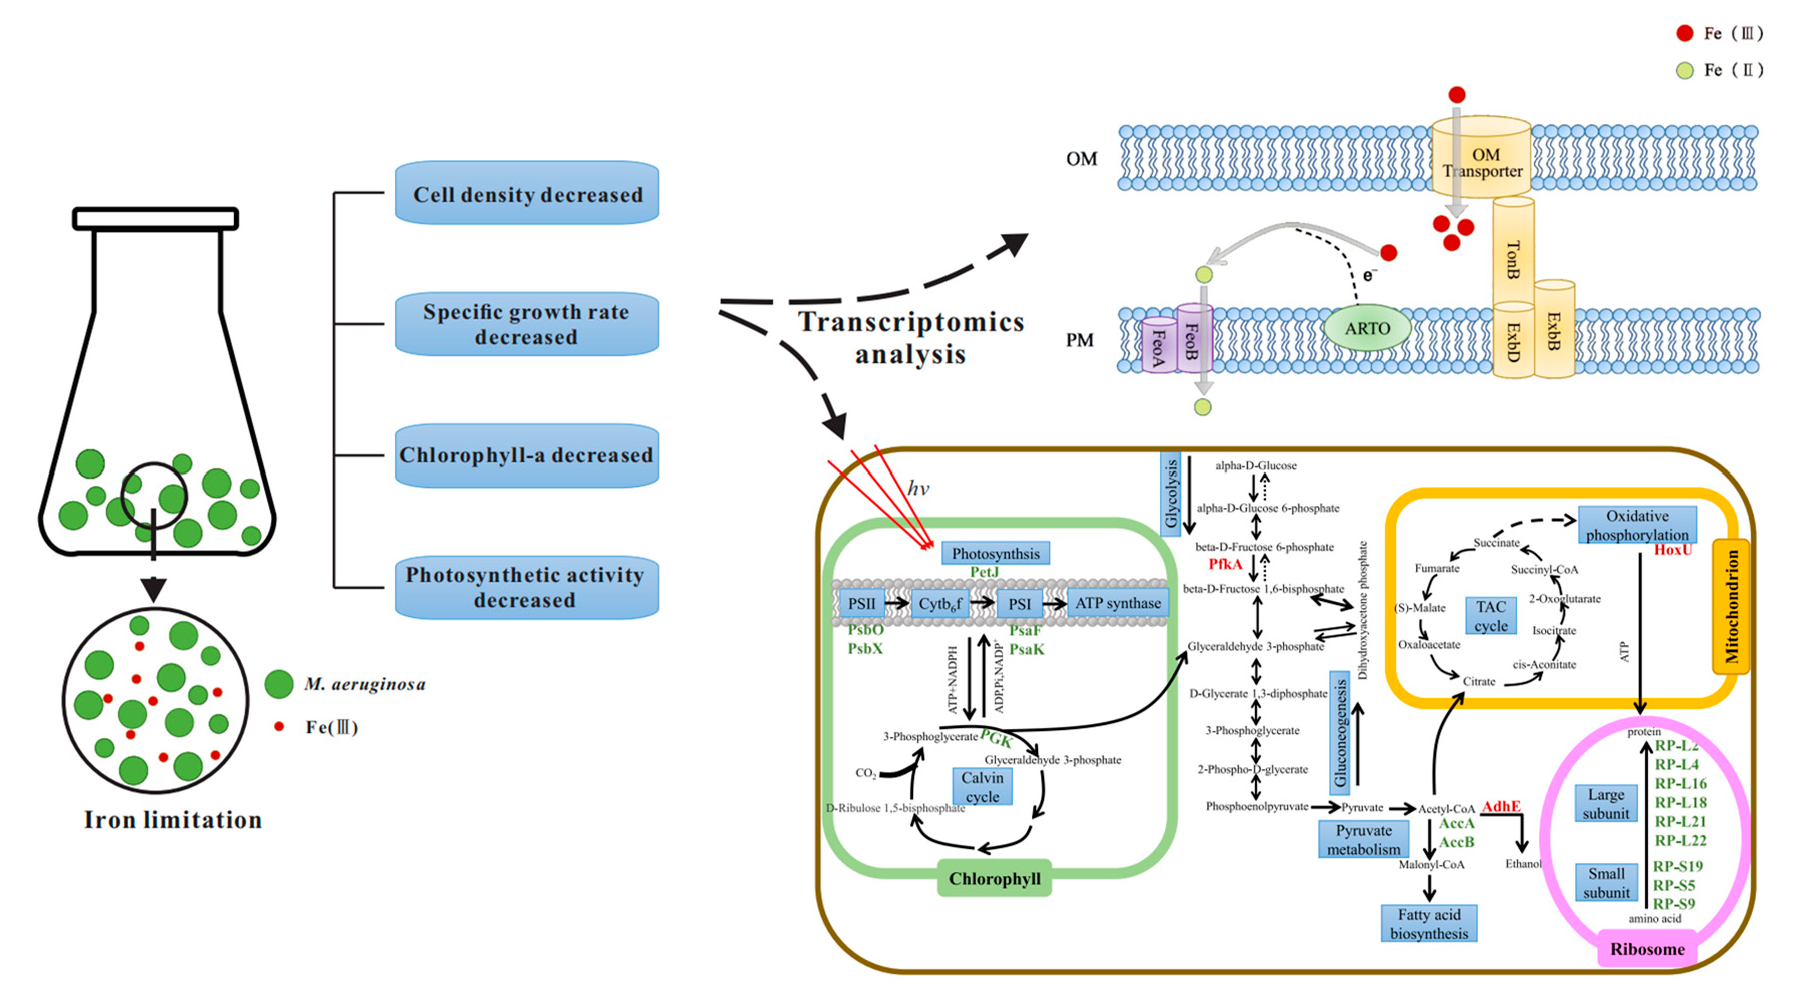
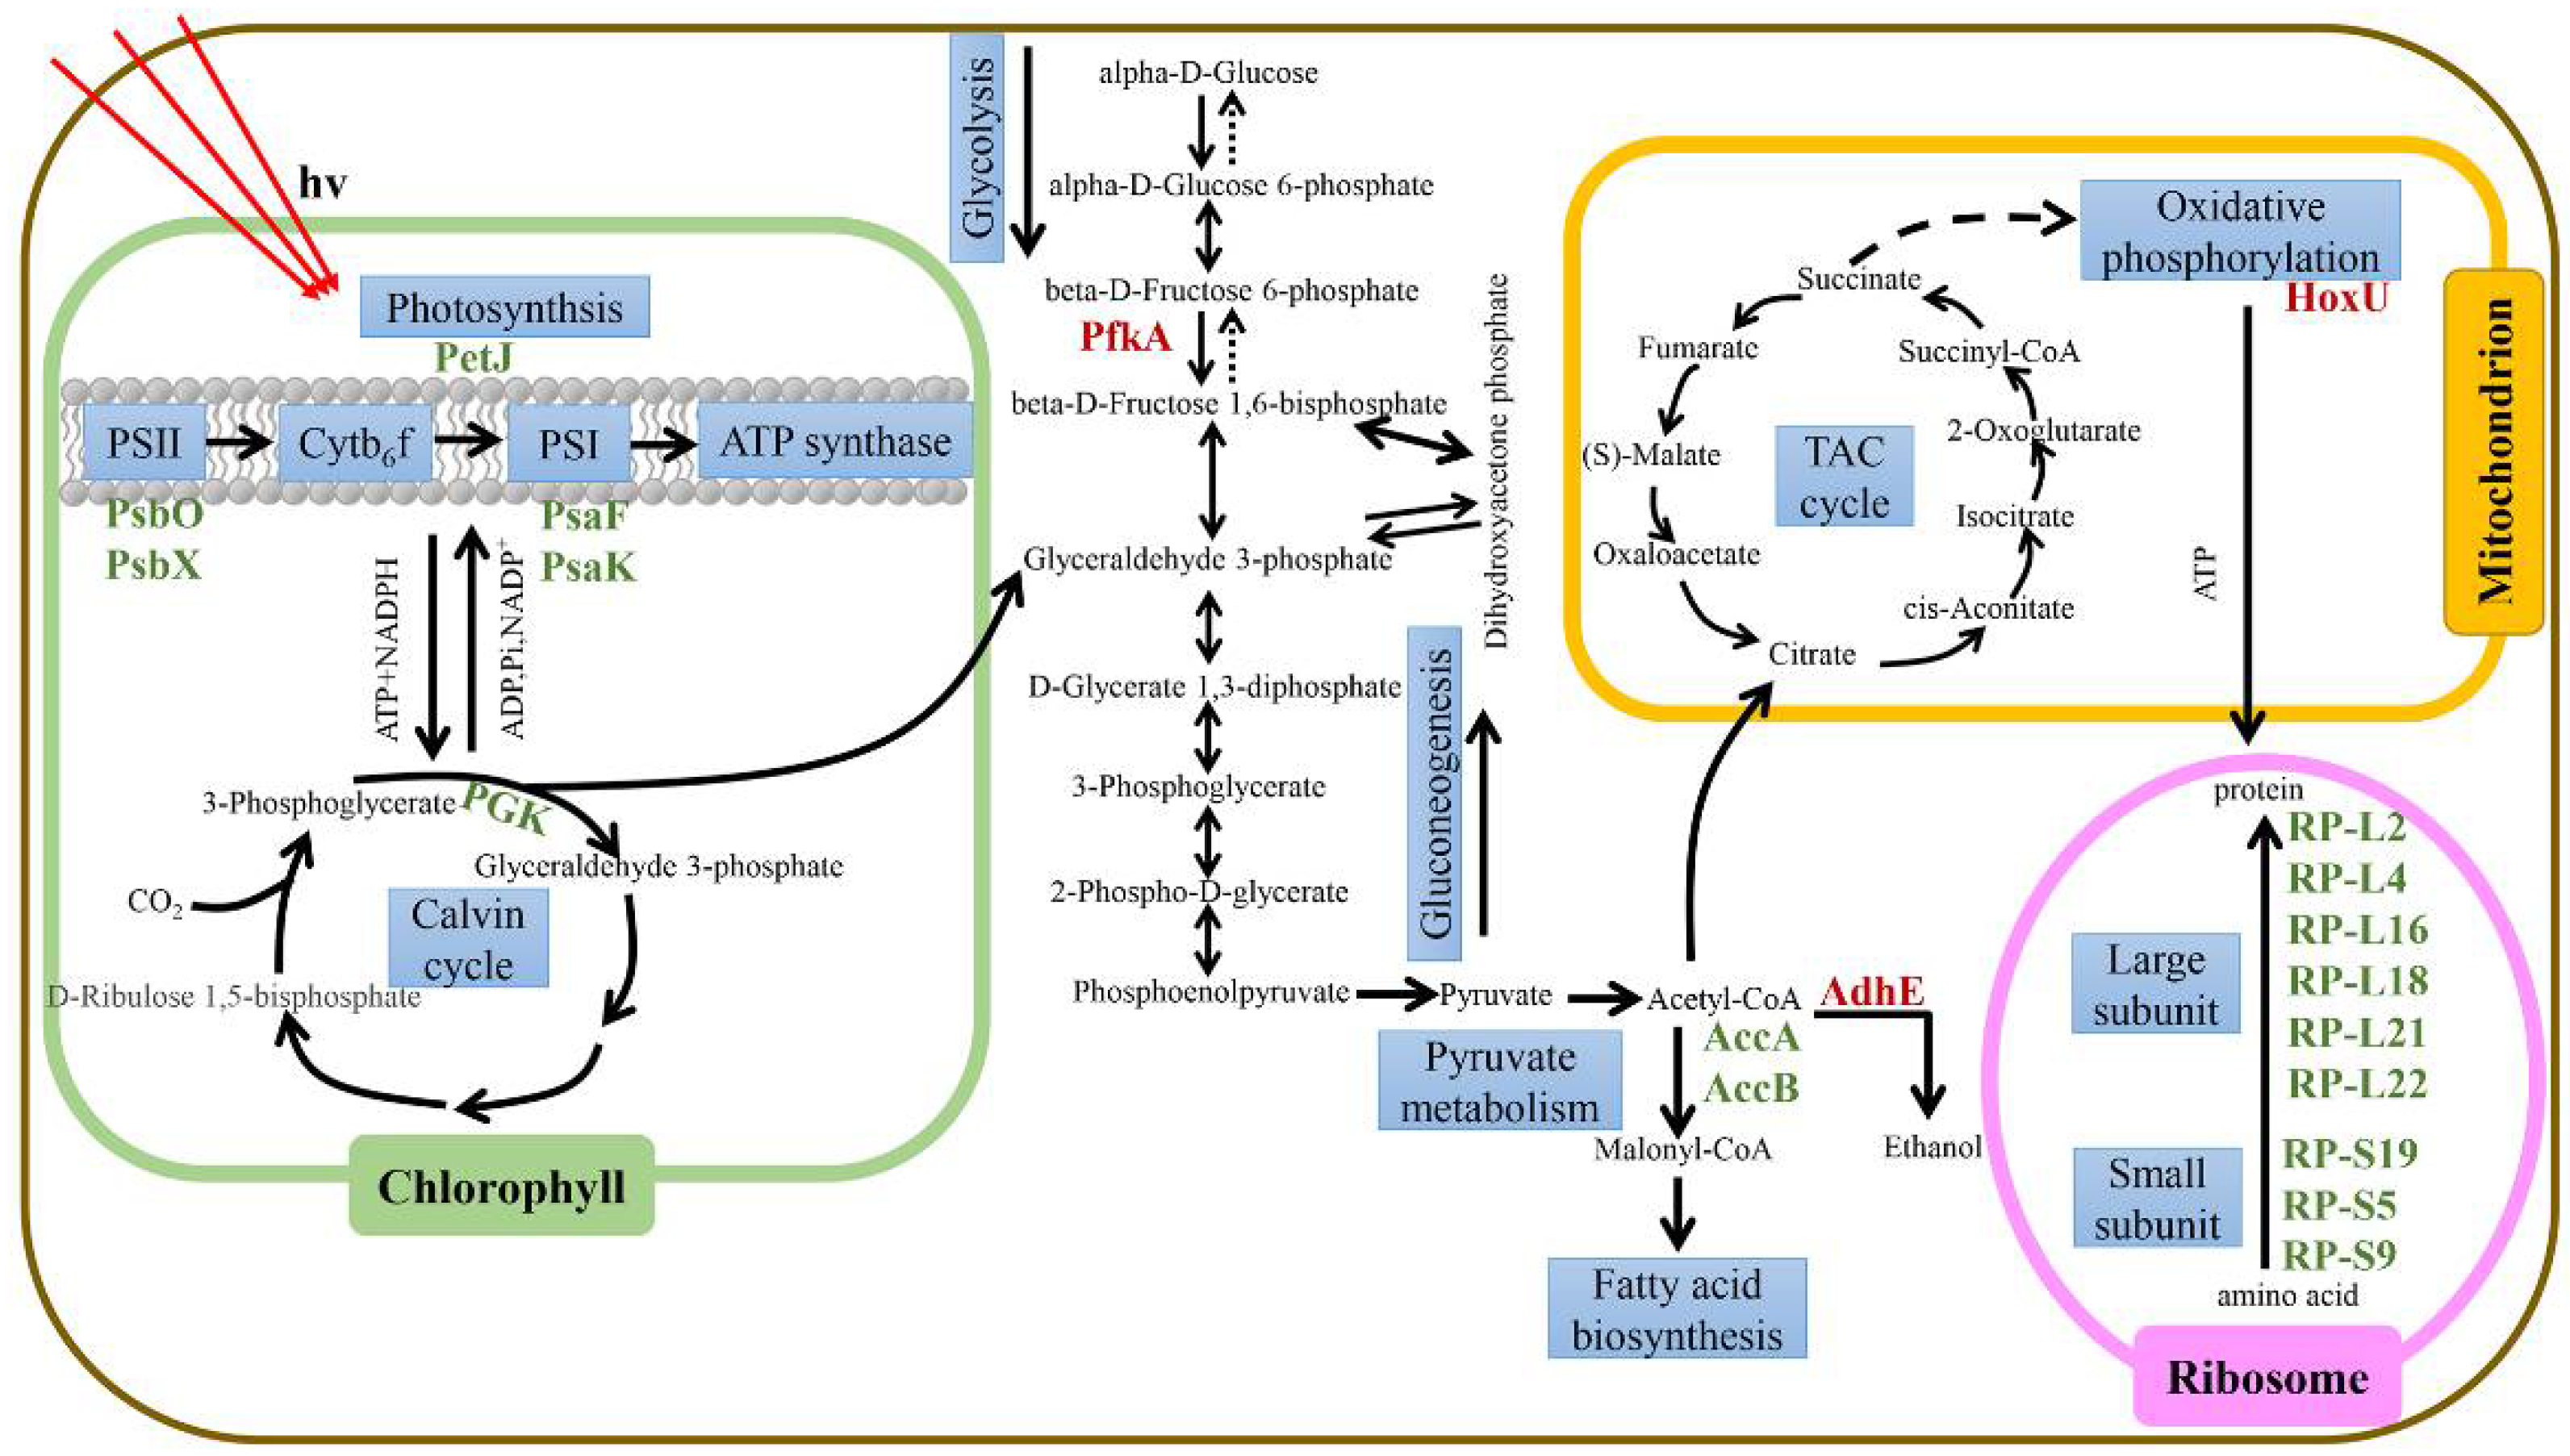
To determine the overall changes in M. aeruginosa metabolism under limited iron, differentially expressed genes were mapped to the metabolic network (Figure 5). The specific related pathways are shown in Table S2. In addition to changes in the expression of photosynthesis-related genes under iron limitation, genes related to the ribosome, fatty acid metabolism, and respiratory electron transport chain were also affected to a certain extent.
Under severe iron deficiency, most of the gene expression in the photosynthetic system was down-regulated, which significantly reduced the photosynthetic efficiency of M. aeruginosa. The Calvin cycle fixes CO2 in the atmosphere to produce three-carbon sugars for use by algal cells [44,45]. In an iron-deficient environment, the gene pgk related to phosphoglycerate kinase (PGK), which catalyzes the conversion of 3-phosphoglycerate to 1,3-diphosphoglycerate, is significantly down-regulated in the Calvin cycle of M. aeruginosa. Similarly, related genes gap2, prk, and cbbL involved in the regulation of other catalytic enzymes in the Calvin cycle are also down-regulated, with the gap2 gene only present in cyanobacteria [46]. Under iron-deficient conditions, the photosynthetic activity of M. aeruginosa is reduced, and insufficient ATP and NADPH are generated. The genes pgk, gap2, prk, and cbbL, which are the key enzymes that regulate the Calvin cycle, are all down-regulated to varying degrees; Calvin cycle activity is reduced, and the carbon fixation ability of the cell decreases.
Glycolysis is the process of breaking down glucose to form pyruvate. 6-phosphofructokinase (PFKA) catalyzes the formation of fructose 6-phosphate to fructose 1,6-diphosphate, which is one of the rate-limiting steps of the glycolysis pathway [47]. The gene involved in this step, pfkA, was significantly up-regulated. When M. aeruginosa experiences iron deficiency, it up-regulates genes related to glycolysis, breaks down glucose to produce pyruvate, and pyruvate further produces acetyl-CoA. Acetyl-CoA will generate malonyl-CoA under the catalysis of acetyl-CoA carboxylase, which is the rate-limiting step of fatty acid synthesis [48]. The genes accA and accB that regulate acetyl-CoA carboxylase are significantly down-regulated under low iron conditions, and the activity of acetyl-CoA carboxylase decreases. Malonyl-CoA is an important signaling molecule involved in the transcriptional regulation of fatty acid biosynthesis [49], and the decrease in malonyl-CoA in M. aeruginosa inhibits subsequent fatty acid synthesis. AdhE is a key enzyme in the anaerobic fermentation pathway of ethanol. It also has the catalytic activities of acetaldehyde dehydrogenase and alcohol dehydrogenase [50], and in cyanobacteria, regulates the conversion of acetyl-CoA to ethanol. The gene adhE is significantly up-regulated in an iron-deficient environment, and the overexpression of the protein AdhE can increase the production of ethanol [51].
In addition, under severe iron deficiency, most genes in the ribosomal 50S large subunit were down-regulated. Among them, genes RP-L2 (rplB), RP-L4 (rplD), RP-L16 (rplP), RP-L18 (rplR), RP-L21 (rplU), and RP-L22 (rplV) were significantly down-regulated. Similarly, genes RP-S5 (rpsE), RP-S9 (rpsI), and RP-S19 (rpsS) in the small 30S subunit of the ribosome were significantly down-regulated. The down-regulation of these genes that regulate ribosomal proteins may affect the normal translation of proteins in cells [52]. Among the expression of ribosome-related genes, the severe iron deficiency group had more down-regulated genes. In general, this study shows that most photosynthesis-related genes of M. aeruginosa were down-regulated in an iron-deficient environment (Figure 4), and the reduction in photosynthetic activity decreases the photochemical energy acquisition (Figure 3a). Conversely, the expressions of genes related to glycolysis and respiration (including anaerobic and aerobic respiration) were up-regulated (Figure 5), which will increase respiration. This may be a more complex and refined energy metabolism response mechanism of cyanobacteria to maintain their long-term survival in the face of iron deficiency.
4. Conclusions
In this study, the physiological, ecological, and molecular regulation mechanisms of M. aeruginosa in iron-limited environments were explored. Iron limitation has a significant impact on the cellular function of M. aeruginosa. Cell density in the early stage of iron deficiency was similar to that of the iron-sufficient group, and showed a similar upward trend. The growth rate in the middle and late stages decreased with time, and the final algae density was much lower than that of the control group. The photosynthetic activity of M. aeruginosa gradually increased in the first 4 d, and then decreased significantly over time. These data are consistent with the transcriptome results. In the severe and the moderate iron deficiency treatment groups, 61 and 45 genes were significantly up-regulated, respectively. These genes are mainly related to the metabolism of terpenoids and polyketides, the degradation of fatty acids, carbohydrate metabolism, amino acid metabolism, glycolysis, and oxidative phosphorylation. In these groups, the 103 and 52 down-regulated genes were related to the ribosome, ABC transporter, photosynthesis, pantothenate and coenzyme a biosynthesis, porphyrin and chlorophyll metabolism, fatty acid synthesis, pyruvate metabolism, and carbon fixation in photosynthetic organisms. The gene expression of most transporters related to iron uptake was up-regulated. Consistent with the apparent decrease in photosynthetic efficiency, most genes involved in photosynthesis were down-regulated, while most genes related to respiration were up-regulated, and respiration activity increased. This analysis of the M. aeruginosa transcriptome shows that, under long-term iron limitation, the balance of energy costs in the body and the specific adjustment of different metabolic pathways vary from those in an iron-sufficient environment. In this way, M. aeruginosa adapts to an iron-deficient environment and can survive for a long time.
Supplementary Materials
The following supporting information can be downloaded at: https://www.mdpi.com/article/10.3390/w14111679/s1, Figure S1. P Agarose electrophoresis results; Figure S2. Volcano plot and MA plot of differentially expressed genes between Fe-1000 group and Fe-20 group; Figure S3. Volcano plot and MA plot of differentially expressed genes between Fe-1000 group and Fe-100 group; Table S1. Test results of total RNA quality; Table S2. Quality of sample sequencing data.; Table S3. Potential candidate genes associated with iron-limited stress responses.
Author Contributions
Conceptualization, X.C.; methodology, X.C.; software, X.C. and Q.S.; validation, X.C., J.W. and Z.D.; formal analysis, X.C.; investigation, Z.Z., J.W., Q.S. and Z.D.; resources, X.C.; data curation, X.C.; writing—original draft preparation, X.C.; writing—review and editing, X.L.; visualization, X.C. All authors have read and agreed to the published version of the manuscript.
Funding
This research received no external funding.
Institutional Review Board Statement
Not applicable.
Informed Consent Statement
Not applicable.
Data Availability Statement
Not applicable.
Acknowledgments
This study was supported by ABA Chemicals for funding support and the National Major Science and Technology Project (2017ZX07204-005). The authors are very grateful to the members of the research group for their enthusiastic help and guidance.
Conflicts of Interest
The authors declare no conflict of interest.
References
- Singh, S.P.; Häder, D.-P.; Sinha, R.P. Cyanobacteria and ultraviolet radiation (UVR) stress: Mitigation strategies. Ageing Res. Rev. 2010, 9, 79–90. [Google Scholar] [CrossRef] [PubMed]
- Koller, M.; Muhr, A.; Braunegg, G. Microalgae as versatile cellular factories for valued products. Algal Res. 2014, 6, 52–63. [Google Scholar] [CrossRef]
- Paerl, H.W.; Huisman, J. Climate change: A catalyst for global expansion of harmful cyanobacterial blooms. Environ. Microbiol. Rep. 2009, 1, 27–37. [Google Scholar] [CrossRef] [PubMed]
- Carrier, M.C.; Bourassa, J.S.; Masse, E. Cellular Homeostasis: A Small RNA at the Crossroads of Iron and Photosynthesis. Curr. Biol. 2017, 27, R380–R383. [Google Scholar] [CrossRef] [Green Version]
- Blanco-Ameijeiras, S.; Cosio, C.; Hassler, C.S. Long-Term Acclimation to Iron Limitation Reveals New Insights in Metabolism Regulation of Synechococcus sp. PCC7002. Front. Mar. Sci. 2017, 4, 13. [Google Scholar] [CrossRef] [Green Version]
- Larson, C.A.; Mirza, B.; Rodrigues, J.L.M.; Passy, S.I. Iron limitation effects on nitrogen-fixing organisms with possible implications for cyanobacterial blooms. FEMS Microbiol. Ecol. 2018, 94, 1–8. [Google Scholar] [CrossRef]
- Kroh, G.E.; Pilon, M. Regulation of Iron Homeostasis and Use in Chloroplasts. Int. J. Mol. Sci. 2020, 21, 3395. [Google Scholar] [CrossRef]
- Behrenfeld, M.J.; Milligan, A.J. Photophysiological expressions of iron stress in phytoplankton. Annu. Rev. Mar. Sci. 2013, 5, 217–246. [Google Scholar] [CrossRef]
- North, R.L.; Guildford, S.J.; Smith, R.E.H. Evidence for phosphorus, nitrogen, and iron colimitation of phytoplankton communities in Lake Erie. Limnol. Oceanogr. 2007, 52, 315–328. [Google Scholar] [CrossRef] [Green Version]
- Shaked, Y.; Erel, Y.; Sukenik, A. The biogeochemical cycle of iron and associated elements in Lake Kinneret. Geochim. Cosmochim. Acta 2004, 68, 1439–1451. [Google Scholar] [CrossRef]
- Teutsch, N.; Schmid, M.; Müller, B.; Halliday, A.N.; Bürgmann, H.; Wehrli, B. Large iron isotope fractionation at the oxic–anoxic boundary in Lake Nyos. Earth Planet. Sci. Lett. 2009, 285, 52–60. [Google Scholar] [CrossRef]
- Kranzler, C.; Lis, H.; Shaked, Y.; Keren, N. The role of reduction in iron uptake processes in a unicellular, planktonic cyanobacterium. Environ. Microbiol. 2011, 13, 2990–2999. [Google Scholar] [CrossRef] [PubMed]
- Qiu, G.-W.; Lou, W.-J.; Sun, C.-Y.; Yang, N.; Li, Z.-K.; Li, D.-L.; Zang, S.-S.; Fu, F.-X.; Hutchins, D.A.; Jiang, H.-B.; et al. Outer Membrane Iron Uptake Pathways in the Model Cyanobacterium Synechocystis sp. Strain PCC 6803. Appl. Environ. Microbiol. 2018, 84, e01512-18. [Google Scholar] [CrossRef] [PubMed] [Green Version]
- Jiang, H.-B.; Lou, W.-J.; Ke, W.-T.; Song, W.-Y.; Price, N.M.; Qiu, B.-S. New insights into iron acquisition by cyanobacteria: An essential role for ExbB-ExbD complex in inorganic iron uptake. ISME J. 2015, 9, 297–309. [Google Scholar] [CrossRef] [Green Version]
- Fujii, M.; Dang, T.C.; Rose, A.L.; Omura, T.; Waite, T.D. Effect of light on iron uptake by the freshwater cyanobacterium Microcystis aeruginosa. Environ. Sci. Technol. 2011, 45, 1391–1398. [Google Scholar] [CrossRef]
- Xing, W.; Huang, W.M.; Li, D.H.; Liu, Y.D. Effects of iron on growth, pigment content, photosystem II efficiency, and siderophores production of Microcystis aeruginosa and Microcystis wesenbergii. Curr. Microbiol. 2007, 55, 94–98. [Google Scholar] [CrossRef]
- Liu, S.-W.; Qiu, B.-S. Different responses of photosynthesis and flow cytometric signals to iron limitation and nitrogen source in coastal and oceanic Synechococcus strains (Cyanophyceae). Mar. Biol. 2012, 159, 519–532. [Google Scholar] [CrossRef]
- Wan, M.; Jin, X.; Xia, J.; Rosenberg, J.N.; Yu, G.; Nie, Z.; Oyler, G.A.; Betenbaugh, M.J. The effect of iron on growth, lipid accumulation, and gene expression profile of the freshwater microalga Chlorella sorokiniana. Appl. Microbiol. Biotechnol. 2014, 98, 9473–9481. [Google Scholar] [CrossRef]
- Makower, A.K.; Schuurmans, J.M.; Groth, D.; Zilliges, Y.; Matthijs, H.C.P.; Dittmann, E. Transcriptomics-Aided Dissection of the Intracellular and Extracellular Roles of Microcystin in Microcystis aeruginosa PCC 7806. Appl. Environ. Microbiol. 2015, 81, 544–554. [Google Scholar] [CrossRef] [Green Version]
- Cooper, J.T.; Sinclair, G.A.; Wawrik, B. Transcriptome analysis of Scrippsiella trochoidea CCMP 3099 reveals physiological changes related to nitrate depletion. Front. Microbiol. 2016, 7, 639. [Google Scholar] [CrossRef] [Green Version]
- Bolton, J.J. Algal culturing techniques. J. Exp. Mar. Biol. Ecol. 2006, 336, 262. [Google Scholar] [CrossRef]
- Fujii, M.; Dang, T.C.; Bligh, M.W.; Waite, T.D. Cellular characteristics and growth behavior of iron-limited Microcystis aeruginosa in nutrient-depleted and nutrient-replete chemostat systems. Limnol. Oceanogr. 2016, 61, 2151–2164. [Google Scholar] [CrossRef]
- Fu, Q.-L.; Fujii, M.; Natsuike, M.; Waite, T.D. Iron uptake by bloom-forming freshwater cyanobacterium Microcystis aeruginosa in natural and effluent waters. Environ. Pollut. 2019, 247, 392–400. [Google Scholar] [CrossRef] [PubMed]
- Lichtenthaler, H.K.; Buschmann, C. Chlorophylls and carotenoids: Measurement and characterization by UV-VIS spectroscopy. Curr. Protoc. Food Anal. Chem. 2001, 1, F4.3.1–F4.3.8. [Google Scholar] [CrossRef]
- Xu, K.; Jiang, H.; Juneau, P.; Qiu, B. Comparative studies on the photosynthetic responses of three freshwater phytoplankton species to temperature and light regimes. J. Appl. Phycol. 2012, 24, 1113–1122. [Google Scholar] [CrossRef]
- Alderkamp, A.-C.; Kulk, G.; Buma, A.G.J.; Visser, R.J.W.; Van Dijken, G.L.; Mills, M.M.; Arrigo, K.R. The effect of iron limitation on the photophysiology of phaeocystis antarctica (prymnesiophyceae) and fragilariopsis cylindrus (bacillariophyceae) under dynamic irradiance1. J. Phycol. 2012, 48, 45–59. [Google Scholar] [CrossRef]
- Fujii, M.; Rose, A.L.; Omura, T.; Waite, T.D. Effect of Fe(II) and Fe(III) Transformation Kinetics on Iron Acquisition by a Toxic Strain of Microcystis aeruginosa. Environ. Sci. Technol. 2010, 44, 1980–1986. [Google Scholar] [CrossRef]
- Goto, T.; Aoki, R.; Minamizaki, K.; Fujita, Y. Functional Differentiation of Two Analogous Coproporphyrinogen III Oxidases for Heme and Chlorophyll Biosynthesis Pathways in the Cyanobacterium Synechocystis sp. PCC 6803. Plant Cell Physiol. 2010, 51, 650–663. [Google Scholar] [CrossRef] [Green Version]
- Masoumi, A.; Heinemann, I.U.; Rohde, M.; Koch, M.; Jahn, M.; Jahn, D. Complex formation between protoporphyrinogen IX oxidase and ferrochelatase during haem biosynthesis in Thermosynechococcus elongatus. Microbiology 2008, 154, 3707–3714. [Google Scholar] [CrossRef] [Green Version]
- Andrews, S.C. The Ferritin-like superfamily: Evolution of the biological iron storeman from a rubrerythrin-like ancestor. Biochim. Biophys. Acta (BBA) Biomembr. 2010, 1800, 691–705. [Google Scholar] [CrossRef]
- Kaushik, M.S.; Srivastava, M.; Mishra, A.K. Iron Homeostasis in Cyanobacteria, Cyanobacteria; Elsevier Inc.: Amsterdam, The Netherlands, 2019; pp. 245–260. [Google Scholar]
- Katoh, H.; Hagino, N.; Ogawa, T. Iron-binding activity of FutA1 subunit of an ABC-type iron transporter in the cyanobacterium Synechocystis sp. Strain PCC 6803. Plant Cell Physiol. 2001, 42, 823–827. [Google Scholar] [CrossRef] [PubMed] [Green Version]
- Kranzler, C.; Lis, H.; Finkel, O.M.; Schmetterer, G.; Shaked, Y.; Keren, N. Coordinated transporter activity shapes high-affinity iron acquisition in cyanobacteria. ISME J. 2014, 8, 409–417. [Google Scholar] [CrossRef] [PubMed] [Green Version]
- Kim, H.; Lee, H.; Shin, D. The FeoA protein is necessary for the FeoB transporter to import ferrous iron. Biochem. Biophys. Res. Commun. 2012, 423, 733–738. [Google Scholar] [CrossRef] [PubMed]
- Perri, K.A.; Manning, S.R.; Watson, S.B.; Fowler, N.L.; Boyer, G.L. Dark adaptation and ability of pulse-amplitude modulated (PAM) fluorometry to identify nutrient limitation in the bloom-forming cyanobacterium, Microcystis aeruginosa (Kutzing). J. Photochem. Photobiol. B-Biol. 2021, 219, 9. [Google Scholar] [CrossRef]
- Juneau, P.; Green, B.R.; Harrison, P.J. Simulation of Pulse-Amplitude-Modulated (PAM) fluorescence: Limitations of some PAM-parameters in studying environmental stress effects. Photosynthetica 2005, 43, 75–83. [Google Scholar] [CrossRef]
- Zhang, X.; Yin, L. Research progress in chloroplast iron transport proteins. Plant Physiol. J. 2017, 53, 9–16. [Google Scholar] [CrossRef]
- Diaz-Quintana, A.; Navarro, J.A.; Hervas, M.; Molina-Heredia, F.P.; De la Cerda, B.; De la Rosa, M.A. A comparative structural and functional analysis of cyanobacterial plastocyanin and cytochrome c (6) as alternative electron donors to Photosystem I. Photosynth. Res. 2003, 75, 97–110. [Google Scholar] [CrossRef]
- Navarro, J.A.; Durán, R.V.; Miguel, A.; Hervás, M. Respiratory cytochrome c oxidase can be efficiently reduced by the photosynthetic redox proteins cytochrome c6 and plastocyanin in cyanobacteria. FEBS Lett. 2005, 579, 3565–3568. [Google Scholar] [CrossRef]
- Dibrova, D.V.; Shalaeva, D.N.; Galperin, M.Y.; Mulkidjanian, A.Y. Emergence of cytochrome bc complexes in the context of photosynthesis. Physiol. Plant. 2017, 161, 150–170. [Google Scholar] [CrossRef] [Green Version]
- Peers, G.; Price, N.M. Copper-containing plastocyanin used for electron transport by an oceanic diatom. Nature 2006, 441, 341–344. [Google Scholar] [CrossRef]
- Nodop, A.; Pietsch, D.; Hocker, R.; Becker, A.; Pistorius, E.K.; Forchhammer, K.; Michel, K.P. Transcript profiling reveals new insights into the acclimation of the mesophilic fresh-water cyanobacterium Synechococcus elongatus PCC 7942 to iron starvation. Plant Physiol. 2008, 147, 747–763. [Google Scholar] [CrossRef] [PubMed] [Green Version]
- Zhan, J.; Steglich, C.; Scholz, I.; Hess, W.R.; Kirilovsky, D. Inverse regulation of light harvesting and photoprotection is mediated by a 3′-end-derived sRNA in cyanobacteria. Plant Cell 2021, 33, 358–380. [Google Scholar] [CrossRef] [PubMed]
- Tang, K.H.; Blankenship, R.E. Both forward and reverse TCA cycles operate in green sulfur bacteria. J. Biol. Chem. 2010, 285, 35848–35854. [Google Scholar] [CrossRef] [PubMed] [Green Version]
- Ito, S.; Hakamada, T.; Ogino, T.; Osanai, T. Reconstitution of oxaloacetate metabolism in the tricarboxylic acid cycle in Synechocystis sp. PCC 6803: Discovery of important factors that directly affect the conversion of oxaloacetate. Plant J. 2021, 105, 1449–1458. [Google Scholar] [CrossRef] [PubMed]
- Figge, R.M.; Cassier-Chauvat, C.; Chauvat, F.; Cerff, R. The carbon metabolism-controlled Synechocystis gap2 gene harbours a conserved enhancer element and a Gram-positive-like-16 promoter box retained in some chloroplast genes. Mol. Microbiol. 2000, 36, 44–54. [Google Scholar] [CrossRef] [PubMed]
- Suo, Y.K.; Fu, H.X.; Ren, M.M.; Liao, Z.P.; Ma, Y.; Wang, J.F. Enhanced butyric acid production in Clostridium tyrobutyricum by overexpression of rate-limiting enzymes in the Embden-Meyerhof-Parnas pathway. J. Biotechnol. 2018, 272, 14–21. [Google Scholar] [CrossRef]
- Thelen, J.J.; Ohlrogge, J.B. Metabolic Engineering of Fatty Acid Biosynthesis in Plants. Metab. Eng. 2002, 4, 12–21. [Google Scholar] [CrossRef]
- Foster, D.W. Malonyl-CoA: The regulator of fatty acid synthesis and oxidation. J. Clin. Investig. 2012, 122, 1958–1959. [Google Scholar] [CrossRef] [Green Version]
- Peng, H.; Wu, G.G.; Shao, W.L. The aldehyde/alcohol dehydrogenase (AdhE) in relation to the ethanol formation in Thermoanaerobacter ethanolicus JW200. Anaerobe 2008, 14, 125–127. [Google Scholar] [CrossRef]
- Pei, J.; Zhou, Q.; Jiang, Y.; Le, Y.; Li, H.; Shao, W.; Wiegel, J. Thermoanaerobacter spp. control ethanol pathway via transcriptional regulation and versatility of key enzymes. Metab. Eng. 2010, 12, 420–428. [Google Scholar] [CrossRef]
- Loveland, A.B.; Korostelev, A.A. Structural dynamics of protein S1 on the 70S ribosome visualized by ensemble cryo-EM. Methods 2018, 137, 55–66. [Google Scholar] [CrossRef] [PubMed] [Green Version]
Figure 1.
Effects of different iron concentrations on the growth of Microcystis aeruginosa. (a) Cell density; (b) specific growth rate; (c) chlorophyll-a; (d) carotenoids.
Figure 1.
Effects of different iron concentrations on the growth of Microcystis aeruginosa. (a) Cell density; (b) specific growth rate; (c) chlorophyll-a; (d) carotenoids.

Figure 2.
(a) Heat map of genes related to iron absorption and transport. Blue corresponds to a decrease in transcript abundance, and red corresponds to an increase in transcript abundance. White means no difference from the control condition; (b) schematic diagram of the iron absorption pathway. Fe(III) is first transported through the outer membrane (OM) of the cell (yellow), the respiratory terminal oxidase, ARTO (green), is involved in Fe(III) reduction before transport through the plasma membrane (PM). Fe(II) is transported through FeoB (purple).

Figure 3.
The effect of different iron concentrations on the photosynthetic efficiency of Microcystis aeruginosa (a) Fv/Fm, the maximum photosynthetic efficiency of PSII; (b) ΦPSII, the actual photosynthetic efficiency of PSII; (c) rETRmax, the maximum electron transfer rate; (d) α, initial slope; (e) Ik, saturated light intensity.

Figure 4.
Gene expression heat map of photosynthesis-related genes. Blue corresponds to a decrease in transcript abundance, and red corresponds to an increase in transcript abundance. White means no difference from the control condition.
Figure 4.
Gene expression heat map of photosynthesis-related genes. Blue corresponds to a decrease in transcript abundance, and red corresponds to an increase in transcript abundance. White means no difference from the control condition.

Figure 5.
Schematic diagram of cellular metabolic pathways derived from transcriptome analysis of Microcystis aeruginosa under iron limitation. The arrows represent biochemical pathways. Black font indicates metabolites. The red and green bold names indicate gene expression that is up- or down-regulated in response to iron limitation.

Publisher’s Note: MDPI stays neutral with regard to jurisdictional claims in published maps and institutional affiliations. |
© 2022 by the authors. Licensee MDPI, Basel, Switzerland. This article is an open access article distributed under the terms and conditions of the Creative Commons Attribution (CC BY) license (https://creativecommons.org/licenses/by/4.0/).
Share and Cite
MDPI and ACS Style
Chen, X.; Wang, J.; Du, Z.; Shu, Q.; Zheng, Z.; Luo, X. Transcriptomic Analysis of the Molecular Response Mechanism of Microcystis aeruginosa to Iron Limitation Stress. Water 2022, 14, 1679. https://doi.org/10.3390/w14111679
AMA Style
Chen X, Wang J, Du Z, Shu Q, Zheng Z, Luo X. Transcriptomic Analysis of the Molecular Response Mechanism of Microcystis aeruginosa to Iron Limitation Stress. Water. 2022; 14(11):1679. https://doi.org/10.3390/w14111679
Chicago/Turabian StyleChen, Xiaxia, Jie Wang, Zunqing Du, Qihang Shu, Zheng Zheng, and Xingzhang Luo. 2022. "Transcriptomic Analysis of the Molecular Response Mechanism of Microcystis aeruginosa to Iron Limitation Stress" Water 14, no. 11: 1679. https://doi.org/10.3390/w14111679
Note that from the first issue of 2016, this journal uses article numbers instead of page numbers. See further details here.