
Estimation of Soil Erosion and Evaluation of Soil and Water Conservation Benefit in Terraces under Extreme Precipitation
by
 ,
,
Hao Jia
1, 
Xidong Wang
1,
Wenyi Sun
1,2,*,
Xingmin Mu
1,2,
Peng Gao
1,2 ,
,
Guangju Zhao
1,2 and
Zixuan Li
3 1
Institute of Soil and Water Conservation, Northwest A&F University, Xianyang 712100, China
2
Institute of Soil and Water Conservation, Chinese Academy of Sciences and Ministry of Water Resources, Xianyang 712100, China
3
Soil and Water Conservation Monitoring Center, Haihe Basin, Tianjin 300170, China
*
Author to whom correspondence should be addressed.
Water 2022, 14(11), 1675; https://doi.org/10.3390/w14111675
Submission received: 18 March 2022
/
Revised: 12 May 2022
/
Accepted: 19 May 2022
/
Published: 24 May 2022
(This article belongs to the Special Issue Monitoring of the Water and Soil Conservation Using Remote Sensing Techniques)
Abstract
:In recent years, soil erosion caused by water erosion has gradually increased due to the increase of extreme precipitation. In order to reduce soil erosion caused by extreme precipitation, it is necessary to monitor soil erosion and found out the factors that affect soil erosion under extreme precipitation. The objective of this study was to assess the amount of soil erosion, the damage degree of soil and water conservation measures and benefit evaluation under extreme precipitation in Henan Province. The results indicated that the ridges of terraces in two small watersheds had been damaged to varying degrees. Terraces, as one of soil and water conservation measures, can better preserve soil and water erosion under extreme precipitation. The amount of soil preserved in two small watersheds were 744.50t and 1121.01t. The amount of soil loss in two small watersheds were reduced by 67.67% and 78.63% when terraces existed. The soil conservation amount of vegetation restoration measures in two small watersheds were 2960.23t and 3320.36t. The amount of soil loss in two small watersheds were reduced by 89.27% and 90.98%, when vegetation restoration measures exist. Compared with soil and water conservation engineering measures, vegetation restoration measures can better reduce soil erosion caused by water erosion under extreme precipitation. In addition to the amount of rainfall, the soil and water conservation benefits of terraces were also affected by the width of the terrace, the slope of the terrace, and whether there were vegetation restoration measures in the terrace.
1. Introduction
Rain-induced soil erosion threatens world food production, global ecological security, ecosystem services and biodiversity [1,2,3,4]. For example, due to extreme precipitation, Kerala was hit by flooding in 2018, causing economic losses of over USD 3 billion and more than 440 deaths [5]. From 14 to 15 July 2021, more than 180 lives were claimed by floods caused by heavy rain in Germany, and more than 40,000 people were affected [6]. Under extreme precipitation, the surface of the soil will generate a large amount of runoff and cause severe soil erosion. It will carry a large amount of sediment, which will not only cause the loss of soil nutrients and reduce soil productivity, but also silt up the downstream river channels [7,8,9]. In recent decades, due to global warming, many countries in the world have been threatened by extreme rainfall [10,11]. The Sixth Assessment Report (AR6) of the Intergovernmental Panel on Climate Change (IPCC) noted that the intensity and frequency of extreme precipitation will continue to increase in many regions of the world. It will cause serious soil degradation, damage to soil and water conservation measures, and threaten the safety of local people’s lives and property [12,13,14]. Many scholars have gradually begun to study soil erosion caused by extreme precipitation, for example, in a typical Mediterranean ecosystem of Northern Greece, the rate of soil erosion is stable at the present stage, but without protection measures, it will increase by 9% in the future [15]. By 2050, mean soil loss rates due to water erosion may increase by 13—22.5% in agricultural areas of the EU and the UK compared to the 2016 baseline [16]. Therefore, in order to reduce the soil erosion caused by extreme precipitation in the future, monitoring the extreme precipitation events and their consequences is essential.
Methods for measuring and quantifying soil erosion mainly include runoff plots, suspended sediment measurement, remote sensing assessment, model simulation, etc. Runoff plots are a commonly used field measurement method for soil erosion in different ecoregions [17,18,19,20]. Because of the scale on sit experiments, runoff plots are used to measure sheet and rill erosion, rather than gully erosion. The collection and determination of suspended sediment samples in rivers is applied to monitoring soil erosion and sediment transported to rivers at the watershed scale [21,22,23,24]. Sediment delivery ratio reflects the relationship between erosion and sediment transport, which is a difficult problem to solve at present, and the influencing factors are extremely complex. Remote sensing data provide a significant information source on surface landscape characteristics for mapping, monitoring and predicting of soil erosion [25,26,27,28]. The combination of erosion models and remote sensing data is currently a hot spot in soil erosion assessment and mapping. There are numerous empirical erosion models, such as USLE, RUSLE, CSLE, InVEST, MUSLE in SWAT [29,30,31,32], that rely on factors such as topography, land use and cover, soil, and characteristics of rainfall events. Through the use of GIS model construction simulator for model construction, remote sensing data required by the model is input, so as to output soil erosion estimation [15,33,34,35]. These models can be applied at both watershed and regional scales and are widely used in the world. The time and location of extreme precipitation events are contingent and random, which makes it difficult to monitor soil erosion caused by them. Therefore, the measurement and quantification of soil erosion in extreme precipitation need further research.
In China, the changes in precipitation extremes have been distinct in recent decades. Generally, a decrease in extreme precipitation events has been reported in northern, and central China, while extreme precipitation events have increased in northwest China, southern China and near the Yangtze River [28,36,37,38,39,40]. The Yangtze River region experienced more severe and extreme precipitation events, in the 1990s [41]. As the region with the most serious soil erosion in China, the Loess Plateau has experienced increasing frequency of extreme precipitation. More than one-third of the area (approximately 2.5 × 10⁵ km2) are subject to extremely severe soil erosion rate, typically exceeding 500 kg per km2 per year [42]. However, most studies use long-term precipitation data for trend analysis. There were few studies on soil erosion and damage caused by a single extreme precipitation event, which cannot provide good theoretical support for ecological protection construction under extreme precipitation conditions. From 18 to 23 July 2021, Henan Province was hit by extremely heavy rain rarely seen in history. According to daily rainfall statistics from 18 to 23 July, 66% of the 113 meteorological stations in the province exceeded the precipitation standard of 50 mm, half of the meteorological stations received more than 100 mm of precipitation. As of the afternoon of 29 July, the storm caused the crops affected area 10.485 km2, disaster area 5.273 km2, resulting in a direct economic loss of CNY 90.981 billion.
In order to reduce the risks caused by extreme precipitation, improve the disaster resistance of soil and water conservation measures, and clarify the practical application of UAV remote sensing in soil erosion monitoring, the study analyzes soil erosion caused by extreme precipitation event in Henan Province. The specific objectives of this study are to: (i) quantify soil erosion in extreme precipitation conditions, and (ii) to assess the ability of soil and water conservation measures to withstand extreme precipitations, and (iii) to discuss the application of UAV in soil erosion assessment.
2. Materials and Methods
2.1. Study Area
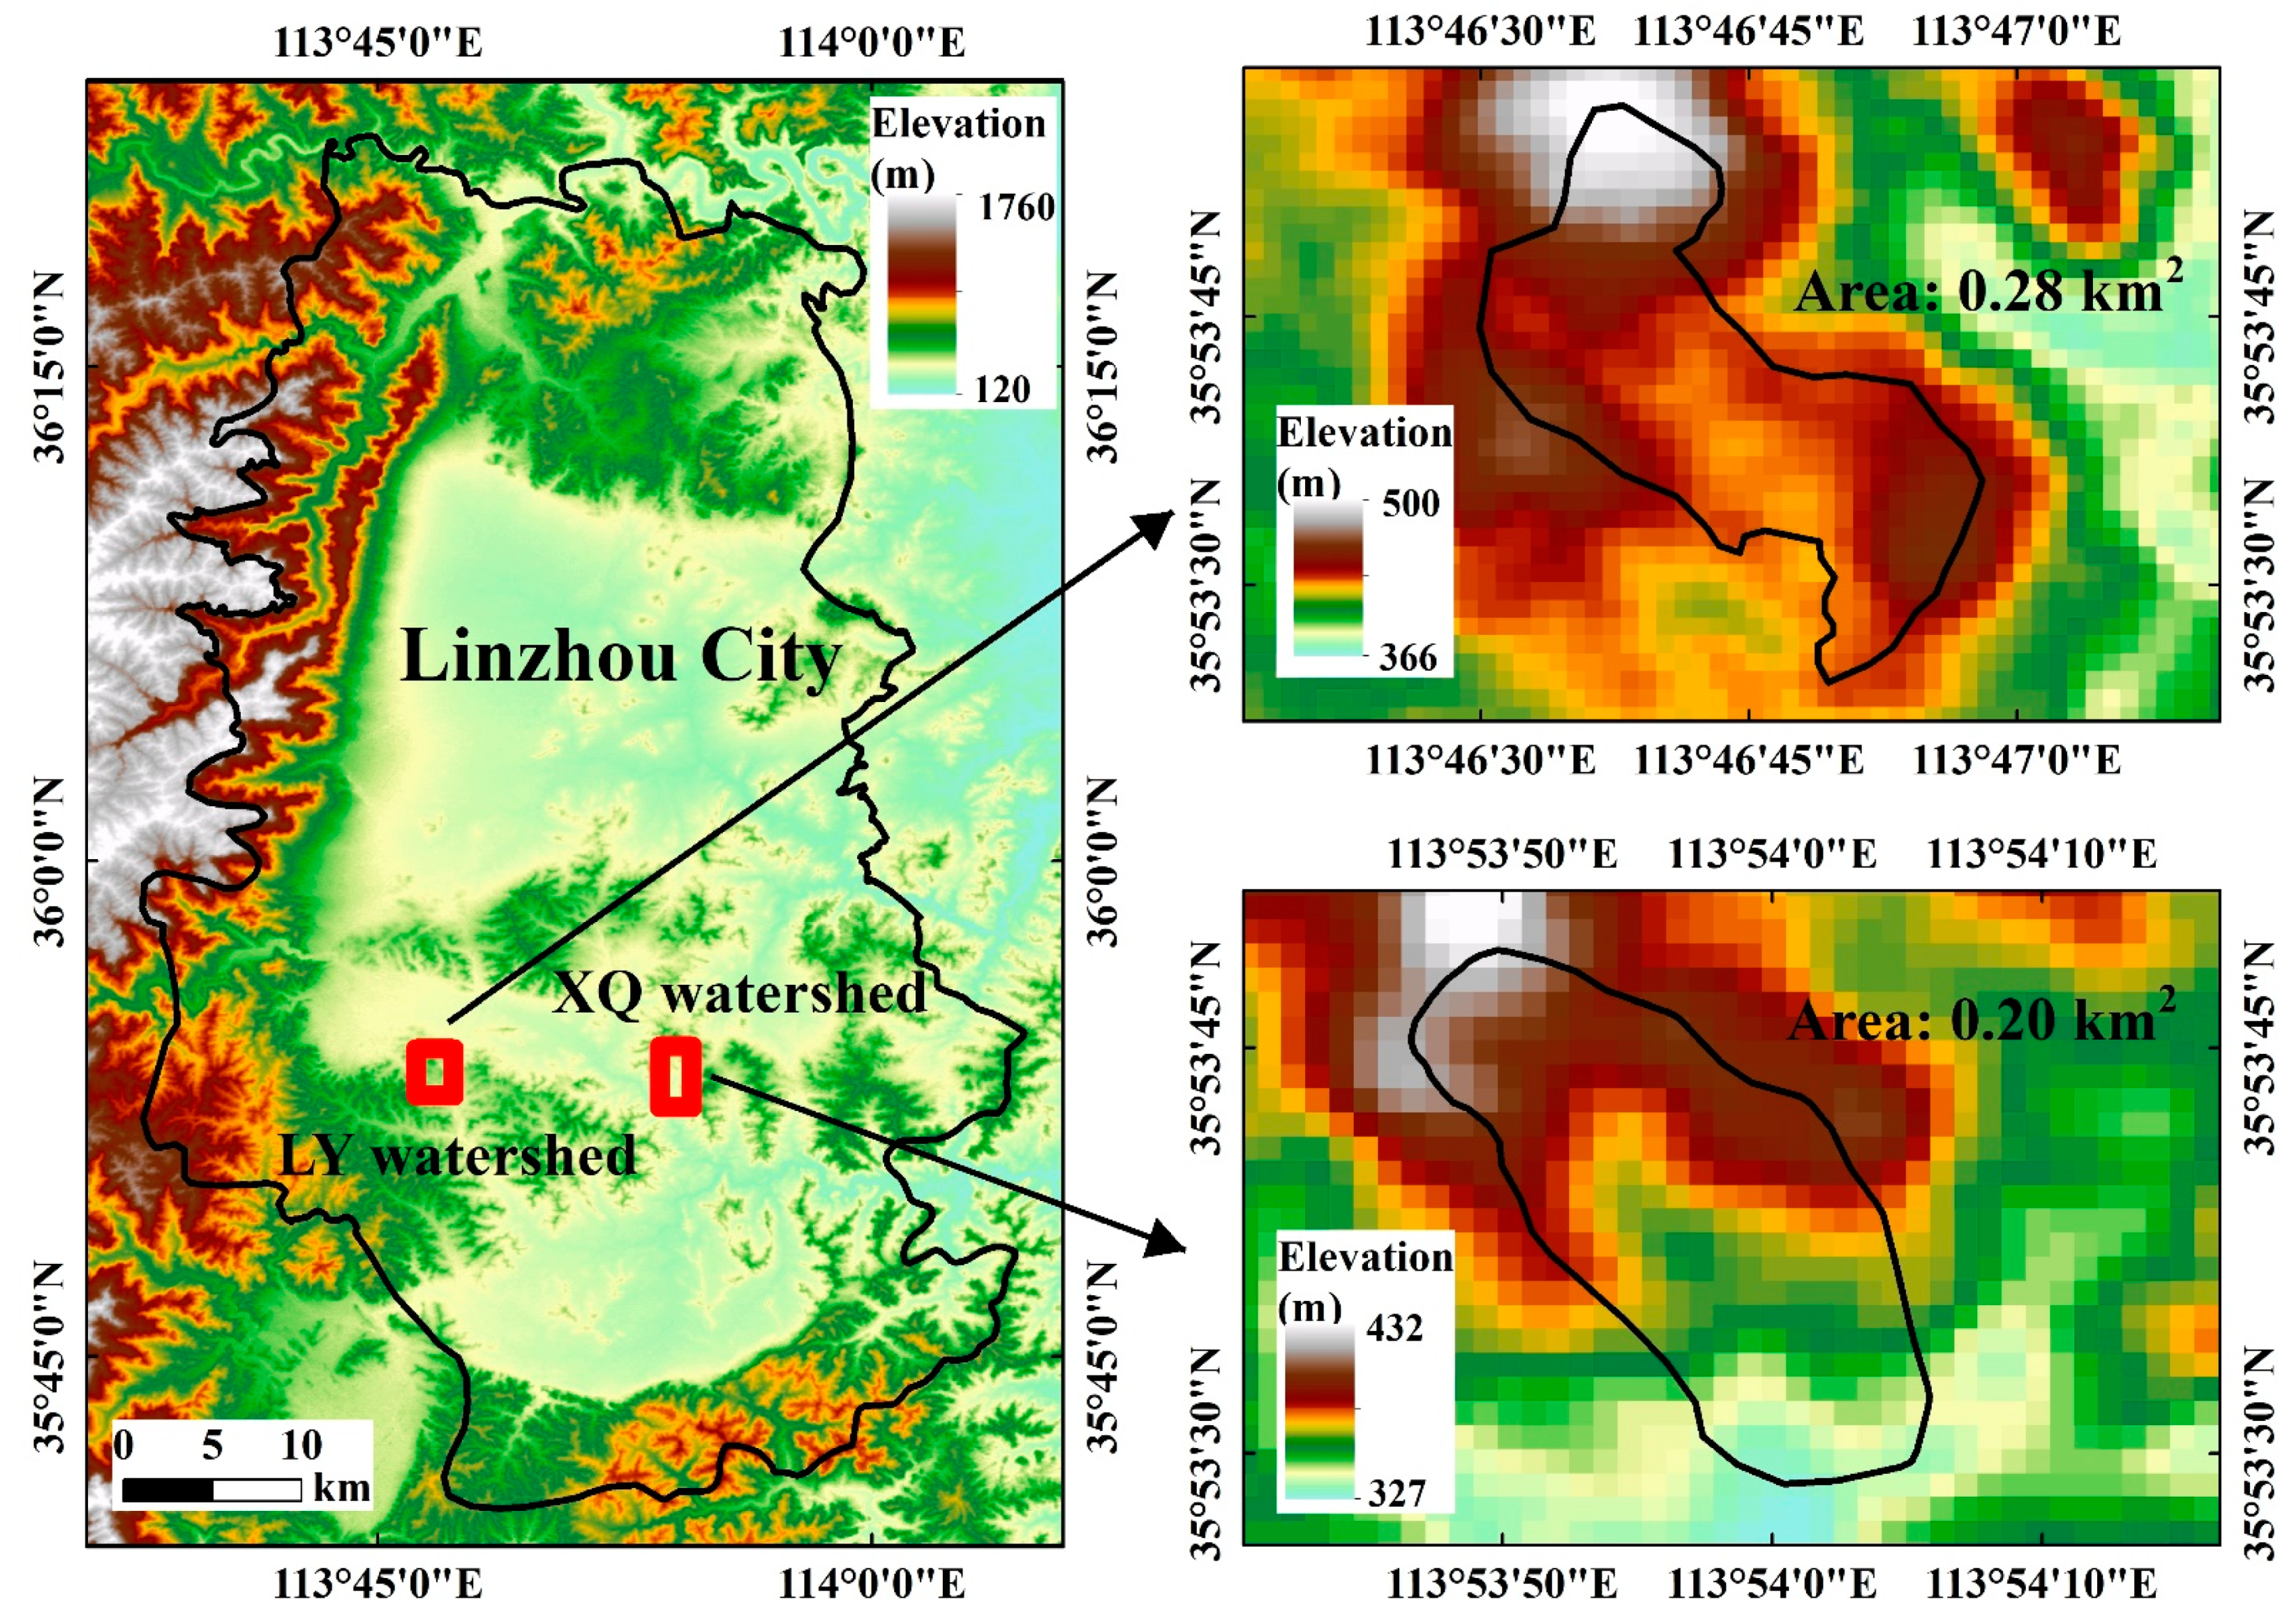
The study area consists of two small watersheds, one with an area of 0.2 km2 in Xingquan (XQ) watershed (35.89° N, 113.90° E) and another with an area of 0.28 km2 in Liyuan (LY) watershed (35.89° N, 113.78° E), which are located in Linzhou city, Northwest Henan Province (Figure 1). The climate in Linzhou is a warm temperate sub-humid continental monsoon, with an average annual temperature of 12.8 °C and an average annual precipitation of 635.5 mm. The rainfall is unevenly distributed, and most of the rainfalls fall between July and September and is dominated by precipitations. It is located in a rocky mountainous area, which is prone to soil erosion under extreme precipitation. In order to control the serious soil erosion in this area, a series of soil and water conservation measures have been adopted, including conversion of farmland to forest and grass, terracing and construction of check dams. The total area of soil and water conservation in Linzhou City is 1198.64 km2, and the area of soil and water losses has been reduced from 1800 km2 to 601.36 km2.
The area of soil erosion in Guilin town of XQ watershed accounts for 2.31% of the total area, which is a key watershed for investigation. Soil and water conservation engineering measures is terrace, while vegetation restoration measures are forest and grass land. The land use situation of XQ watershed is as follows: the terrace area is 0.05 km2, accounting for 25% of the total watershed area, the average width of terrace is 4.71 m, and the main crop types are corn, sweet potato, etc. Forest and grass area accounted for 57.1% of the watershed area, mainly for platycladus, Vitex, etc., and the rest for residential land and ditch platform.
The area of soil erosion in Yuankang Town of LY watershed accounts for 3.21% of the total area. This watershed is the key prevention area of soil erosion in Linzhou City. Soil and water conservation engineering measures is terrace, while vegetation restoration measures are forest and grass land. The land use situation of LY watershed is as follows: the terrace area is 0.12 km2, accounting for 43% of the total watershed area, and the average width of terrace is 5.92 m. The land use type is mainly cultivated land, with a small amount of forest and grass distribution, and the main crop types are corn and sweet potato, etc. Forest and grass area accounted for 53.42% of the watershed area, mainly for platycladus, vitex, etc., and the rest for ditch platform.
During the investigation, no drainage measures were taken for the terraces in both small watersheds. Rill erosion, gully erosion and gravity erosion were not found in both watersheds.
2.2. Data Collection
Individual rainfall data provided by the Haihe Water Conservancy Committee of the Ministry of Water Resources were used to calculate the rainfall erosivity for the two small watersheds from 18–23 July 2021.
Using two high-resolution (spatial resolution of 0.5m) satellite images before and after the extreme precipitation in the two small watersheds and surrounding areas, the distribution and situation of damage to soil and water conservation measures caused by this extreme precipitation event were analyzed, and the damage rate was calculated.
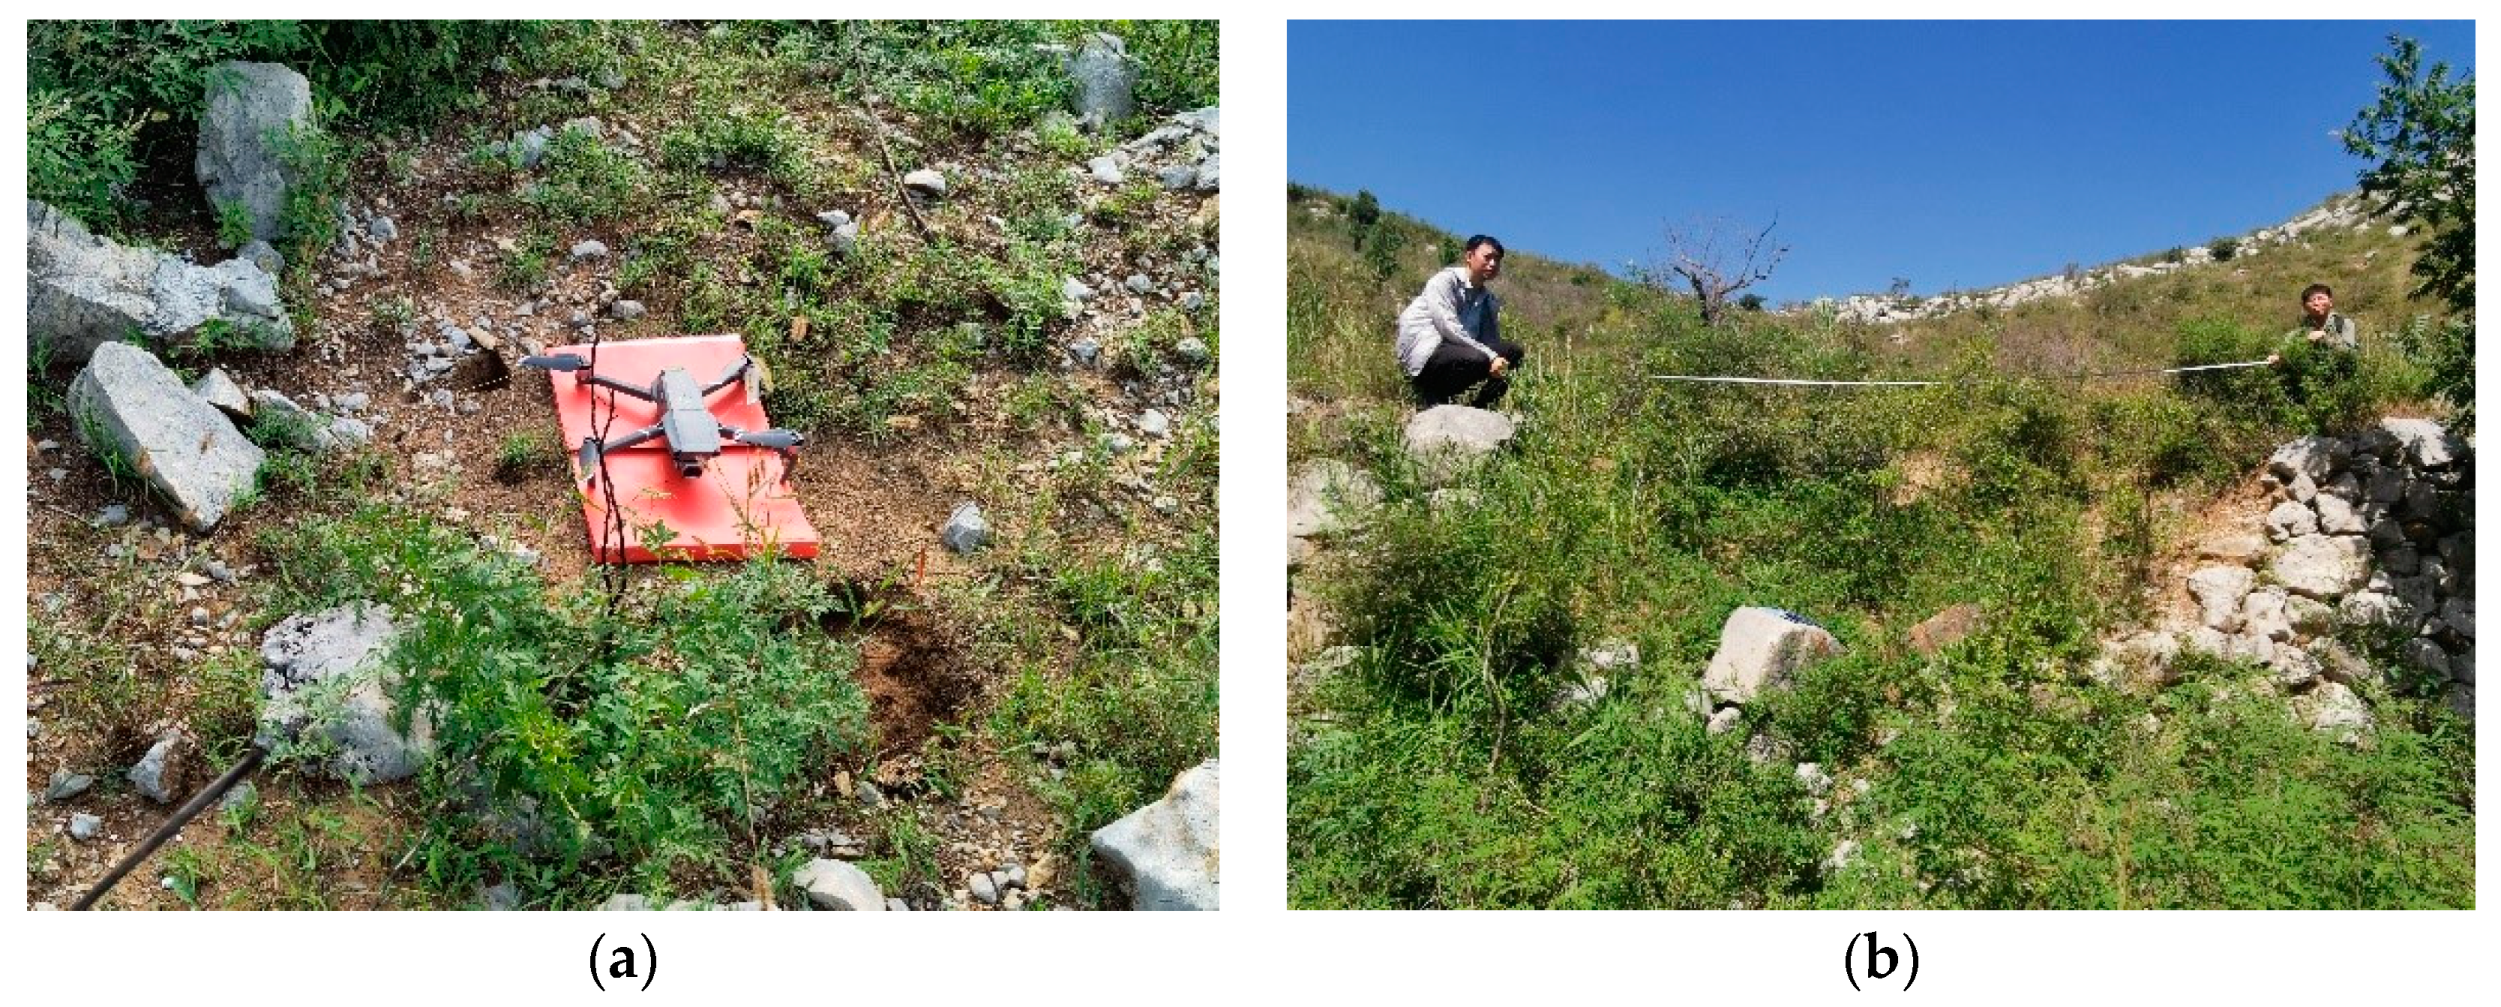
Field data were collected between the 7th and 11th of September 2021, affected by the COVID-19 in Henan Province. The field measurement of soil erosion is mainly divided into two parts: 1. Using the UVA to take aerial photos of two small watersheds, DOM and DSM data with a resolution of 0.05 m were obtained, and ArcGIS software was used to interpret the data captured. The content to be interpreted were the width of the terrace, the height of the ridge, the type of ridge (earth ridge, rocky ridge), the length of damage, the location of damage, the form of damage, and the type of land use. 2. Manual field measurement. The accuracy of UAV remote sensing image measurement was calculated by manual field measurement. The slope of the terrace and the slope of the ridge were measured by a laser range finder (Figure 2).
2.3. Soil Erosion Modelling
The Chinese Soil Loss Equation (CSLE) was used to quantitatively assess soil erosion under extreme precipitation. The CSLE was developed based on the USLE model according to the actual situation of soil erosion and soil and water conservation in China [43,44,45,46,47]. The equation is as follows:
where A is the average soil erosion amount t/(hm2·a), R is rainfall erosivity, (MJ·mm/(hm2·h·a)), K is the factor of soil erodibility (t·hm2·h/(hm2·MJ·mm)), L is the slope length factor, S is slope steepness factor, B is the dimensionless factor of biomass-control in water and soil conservation, E is the dimensionless factor of engineering-control in water and soil conservation, T is the dimensionless factor of tillage practices in water and soil conservation. The parameterization of the CSLE model was described as follows.
2.3.1. Rainfall Erosivity Factor R
R: This study calculates the rainfall erosivity of this extreme precipitation event in Henan Province, not the annual rainfall erosivity of the entire Henan Province. Therefore, based on the individual precipitation data of the two small watersheds from 17 to 22 July 2021, combined with the method proposed by Wischmeier [48], rainfall erosivity (Rt) in individual event had been used in CSLE to calculate individual soil erosion in two small watersheds. The equations are as follows:
where Rt is individual rainfall erosivity, (MJ·mm/(hm2·h·a)), E is individual rainfall energy, (MJ/m2), I30 is maximum 30-min extreme rain intensity, (mm/h), e is the energy of unit rainfall during the period, (MJ/(m2·mm)), P is the rainfall during the period, (mm), i is the rainfall intensity of a period of relatively average rainfall intensity, (mm/h).
2.3.2. Soil Erodibility Factor K
K: On the basis of the first national water survey and dynamic monitoring of soil and water loss in Henan Province, relevant revisions and improvements were made.
2.3.3. Slope Length Factor L and Slope Gradient Factor S
LS: This factor was calculated by “topographic Factor calculation Tool for soil erosion Model” developed by Beijing Normal University. The slope steepness factor needs to be revised in combination with the field situation. The specific revision method is as follows: The land use types are forest land, shrub land, other forest land and grassland, the critical value of S of these land types was 0.97. When S value was greater than 0.97, it was calculated as 0.97.
2.3.4. Vegetation Cover and Biological-Practices Factor B
B: The vegetation cover and vegetation restoration measures factors of gardens, forestland and grassland were calculated by using the following formula according to canopy density/coverage:
where, WRi is the ratio of rainfall erosivity of the i-th half-month to the annual erosivity calculated previously, and the value range from 0 to 1. SLRi is the soil loss ratio of garden plots, woodlands and grasslands in the i-th half-month, the value ranges from 0 to 1.
Tea Gardens and Shrublands SLRi:
Orchards, other garden lands, wooded lands and other wooded lands SLRi:
Grassland SLRi:
where, FVC is the vegetation coverage calculated based on NDVI, and the value range from 0 to 1, GD is the understory coverage of arbor forest, and the value range from 0 to 1, including all vegetation (shrubs, the understory coverage composed of herbs and litter) is determined according to the observed seasonal variation curve of typical understory vegetation coverage, supplemented by the understory coverage of field investigations.
2.3.5. Engineering-Control in Water and Soil Conservation Factor E and Tillage Practices in Water and Soil Conservation Factor T
E: The engineering-control in water and soil conservation factor E reflects the effects of engineering-control practices on soil loss. Engineering-control refer to the construction of terraces, dams, and other projects to change the topography in order to reduce runoff and soil erosion. The E factor was determined by the Table 1.
T: The tillage practices in water and soil conservation factor T represents the ratio of the soil loss of certain tillage measures to the soil loss under the same conditions without tillage practices [49,50,51,52]. Tillage practices are measures to conserve water and prevent soil erosion through tillage to alter micro-topography and increase surface cover. The T factor was determined by the Table 1.
3. Results
3.1. The Damaged of Terraces under Extreme Precipitation
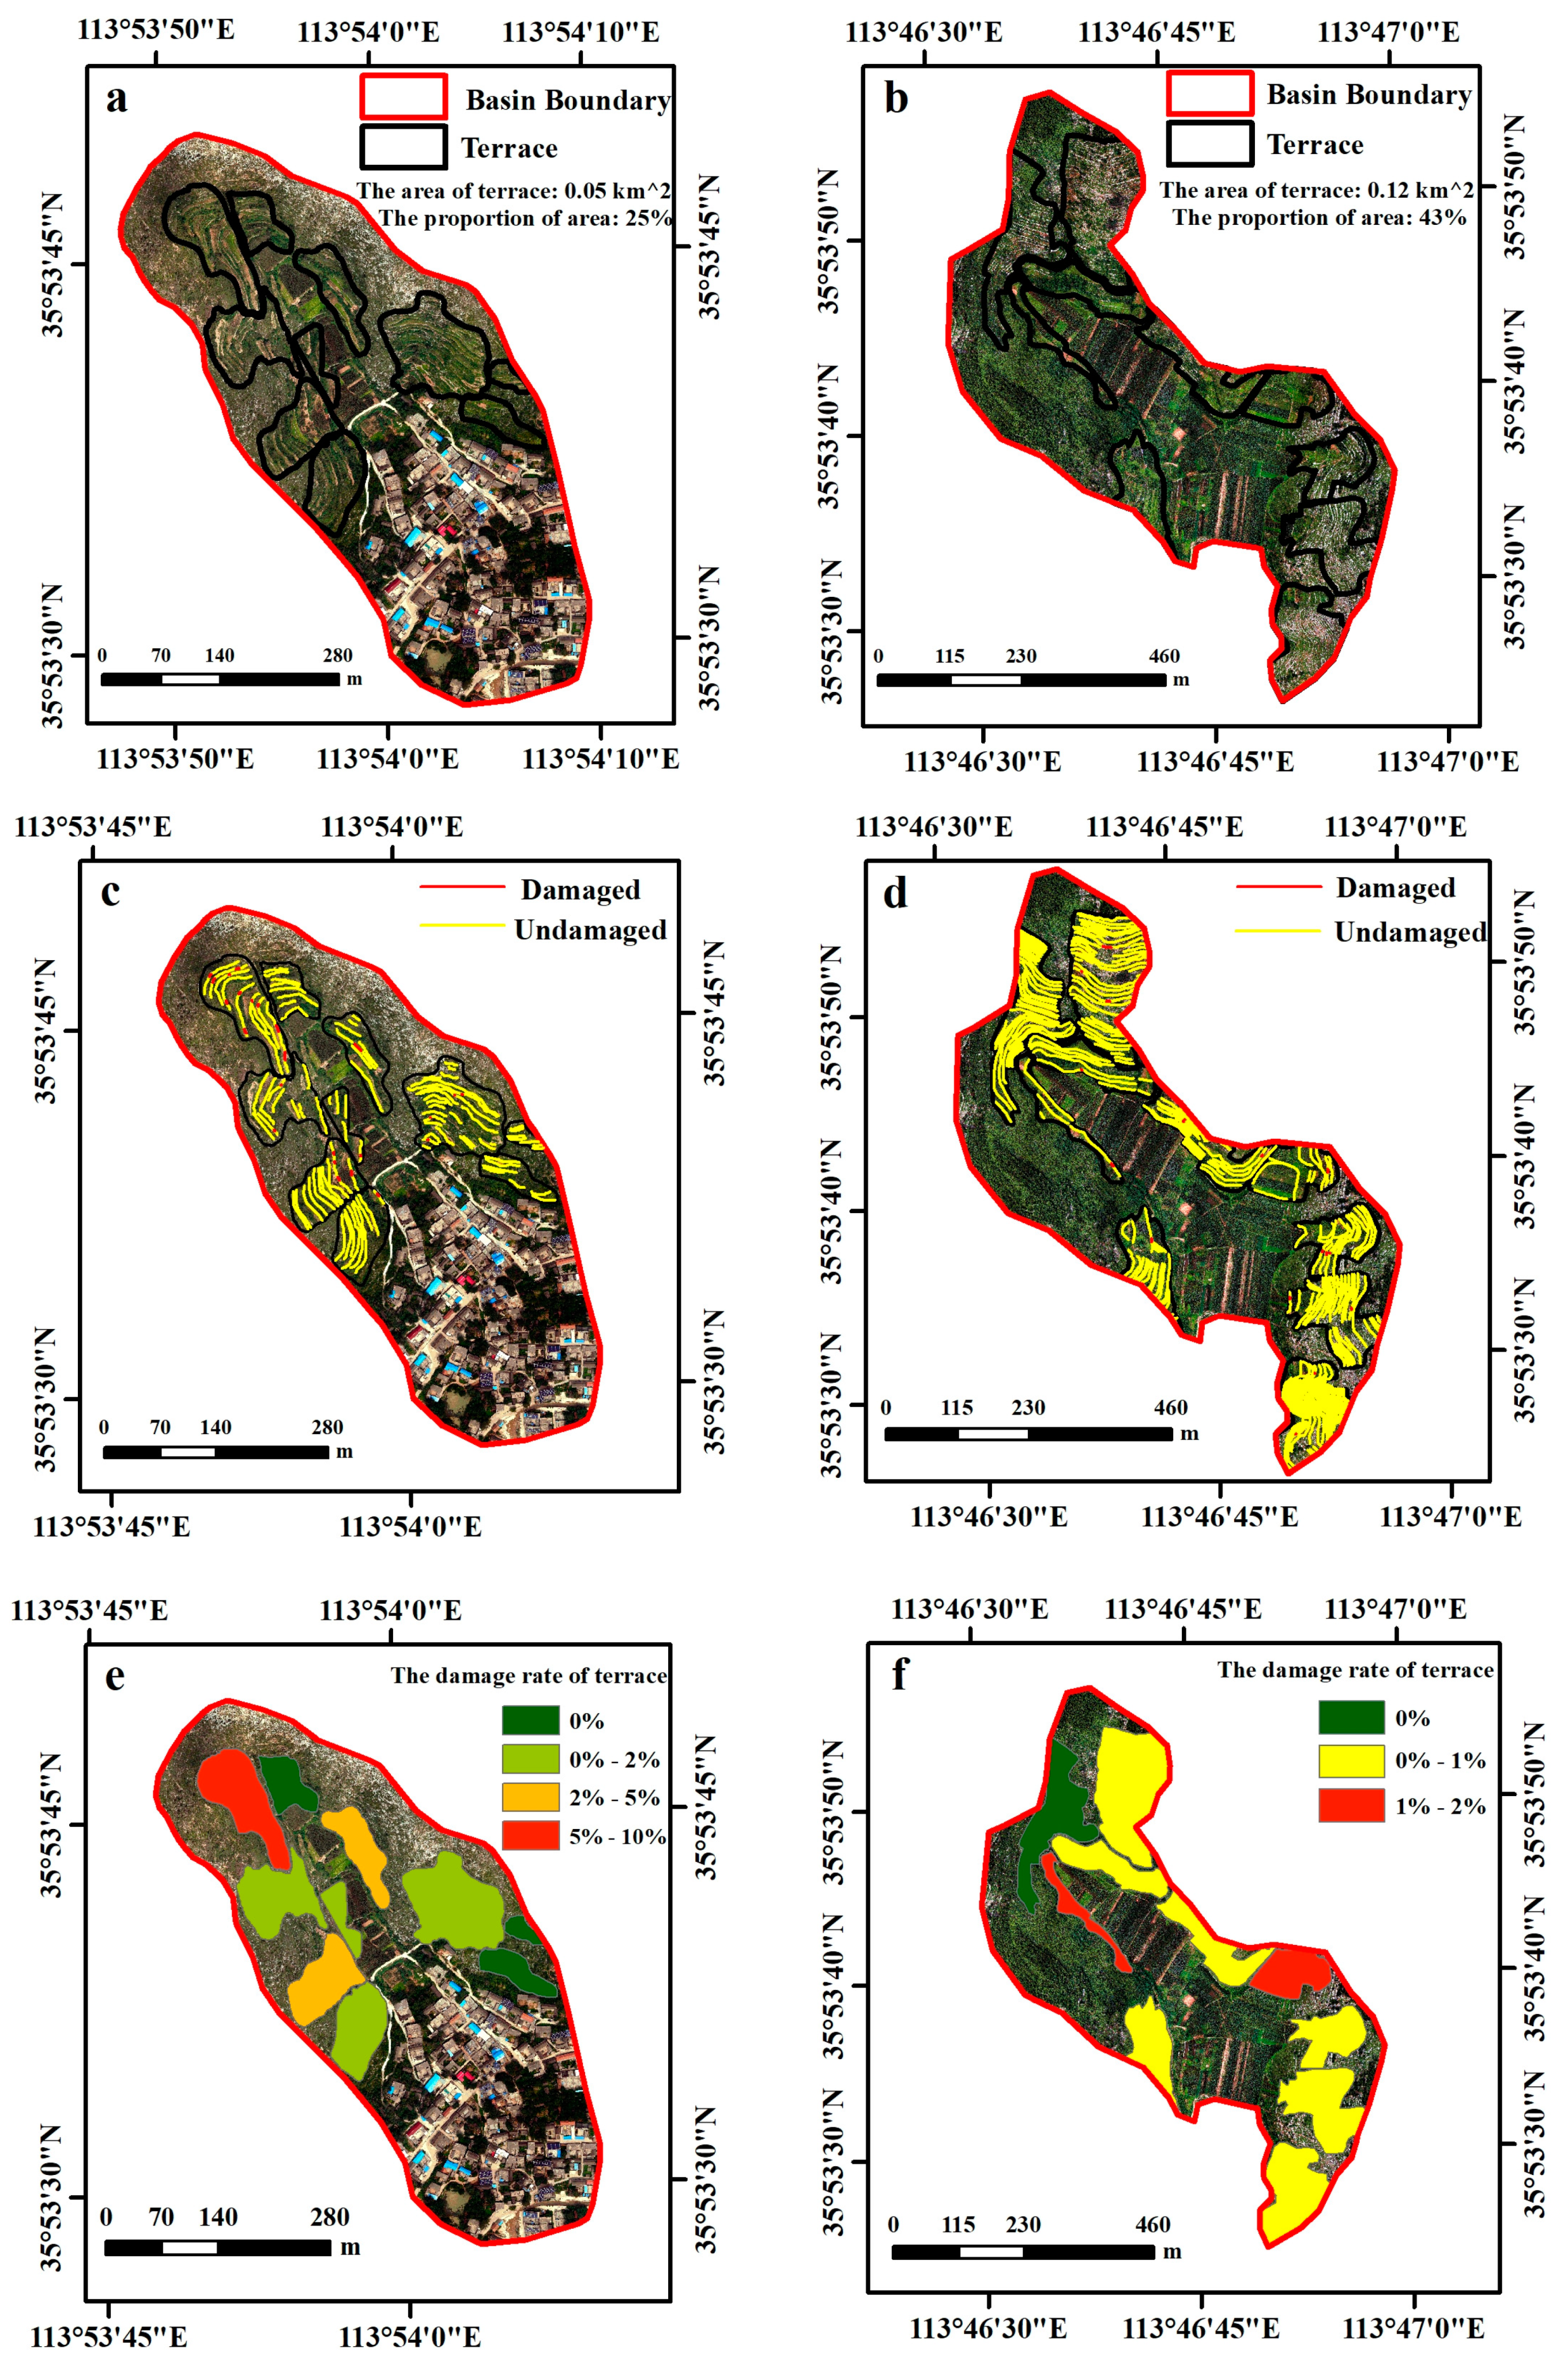
The distribution of terraces interpreted using UAV imagery with a 0.5m spatial resolution is shown in Figure 3. The terraced areas in XQ watershed are 0.05 km2, accounting for 25% of the total watershed. The terraces marked 1, 2, 9 and 10 were damaged in extreme precipitation, with an average damage rate of 2.44%. Among them, the terrace marked 1 suffered the most damage, with a damage rate of 8.45% (Figure 3e). In the comparison watershed of LY, the area of terraces is 0.12 km2, accounting for 43% of the total area of the watershed. The damage rate of terraces caused by extreme precipitations in LY watershed was 0.43%, which was much lighter than that in XQ. The most damaged terraces marked 4 in LY watershed were less than 2% (Figure 3f).
3.2. Soil Erosion under Extreme Precipitation
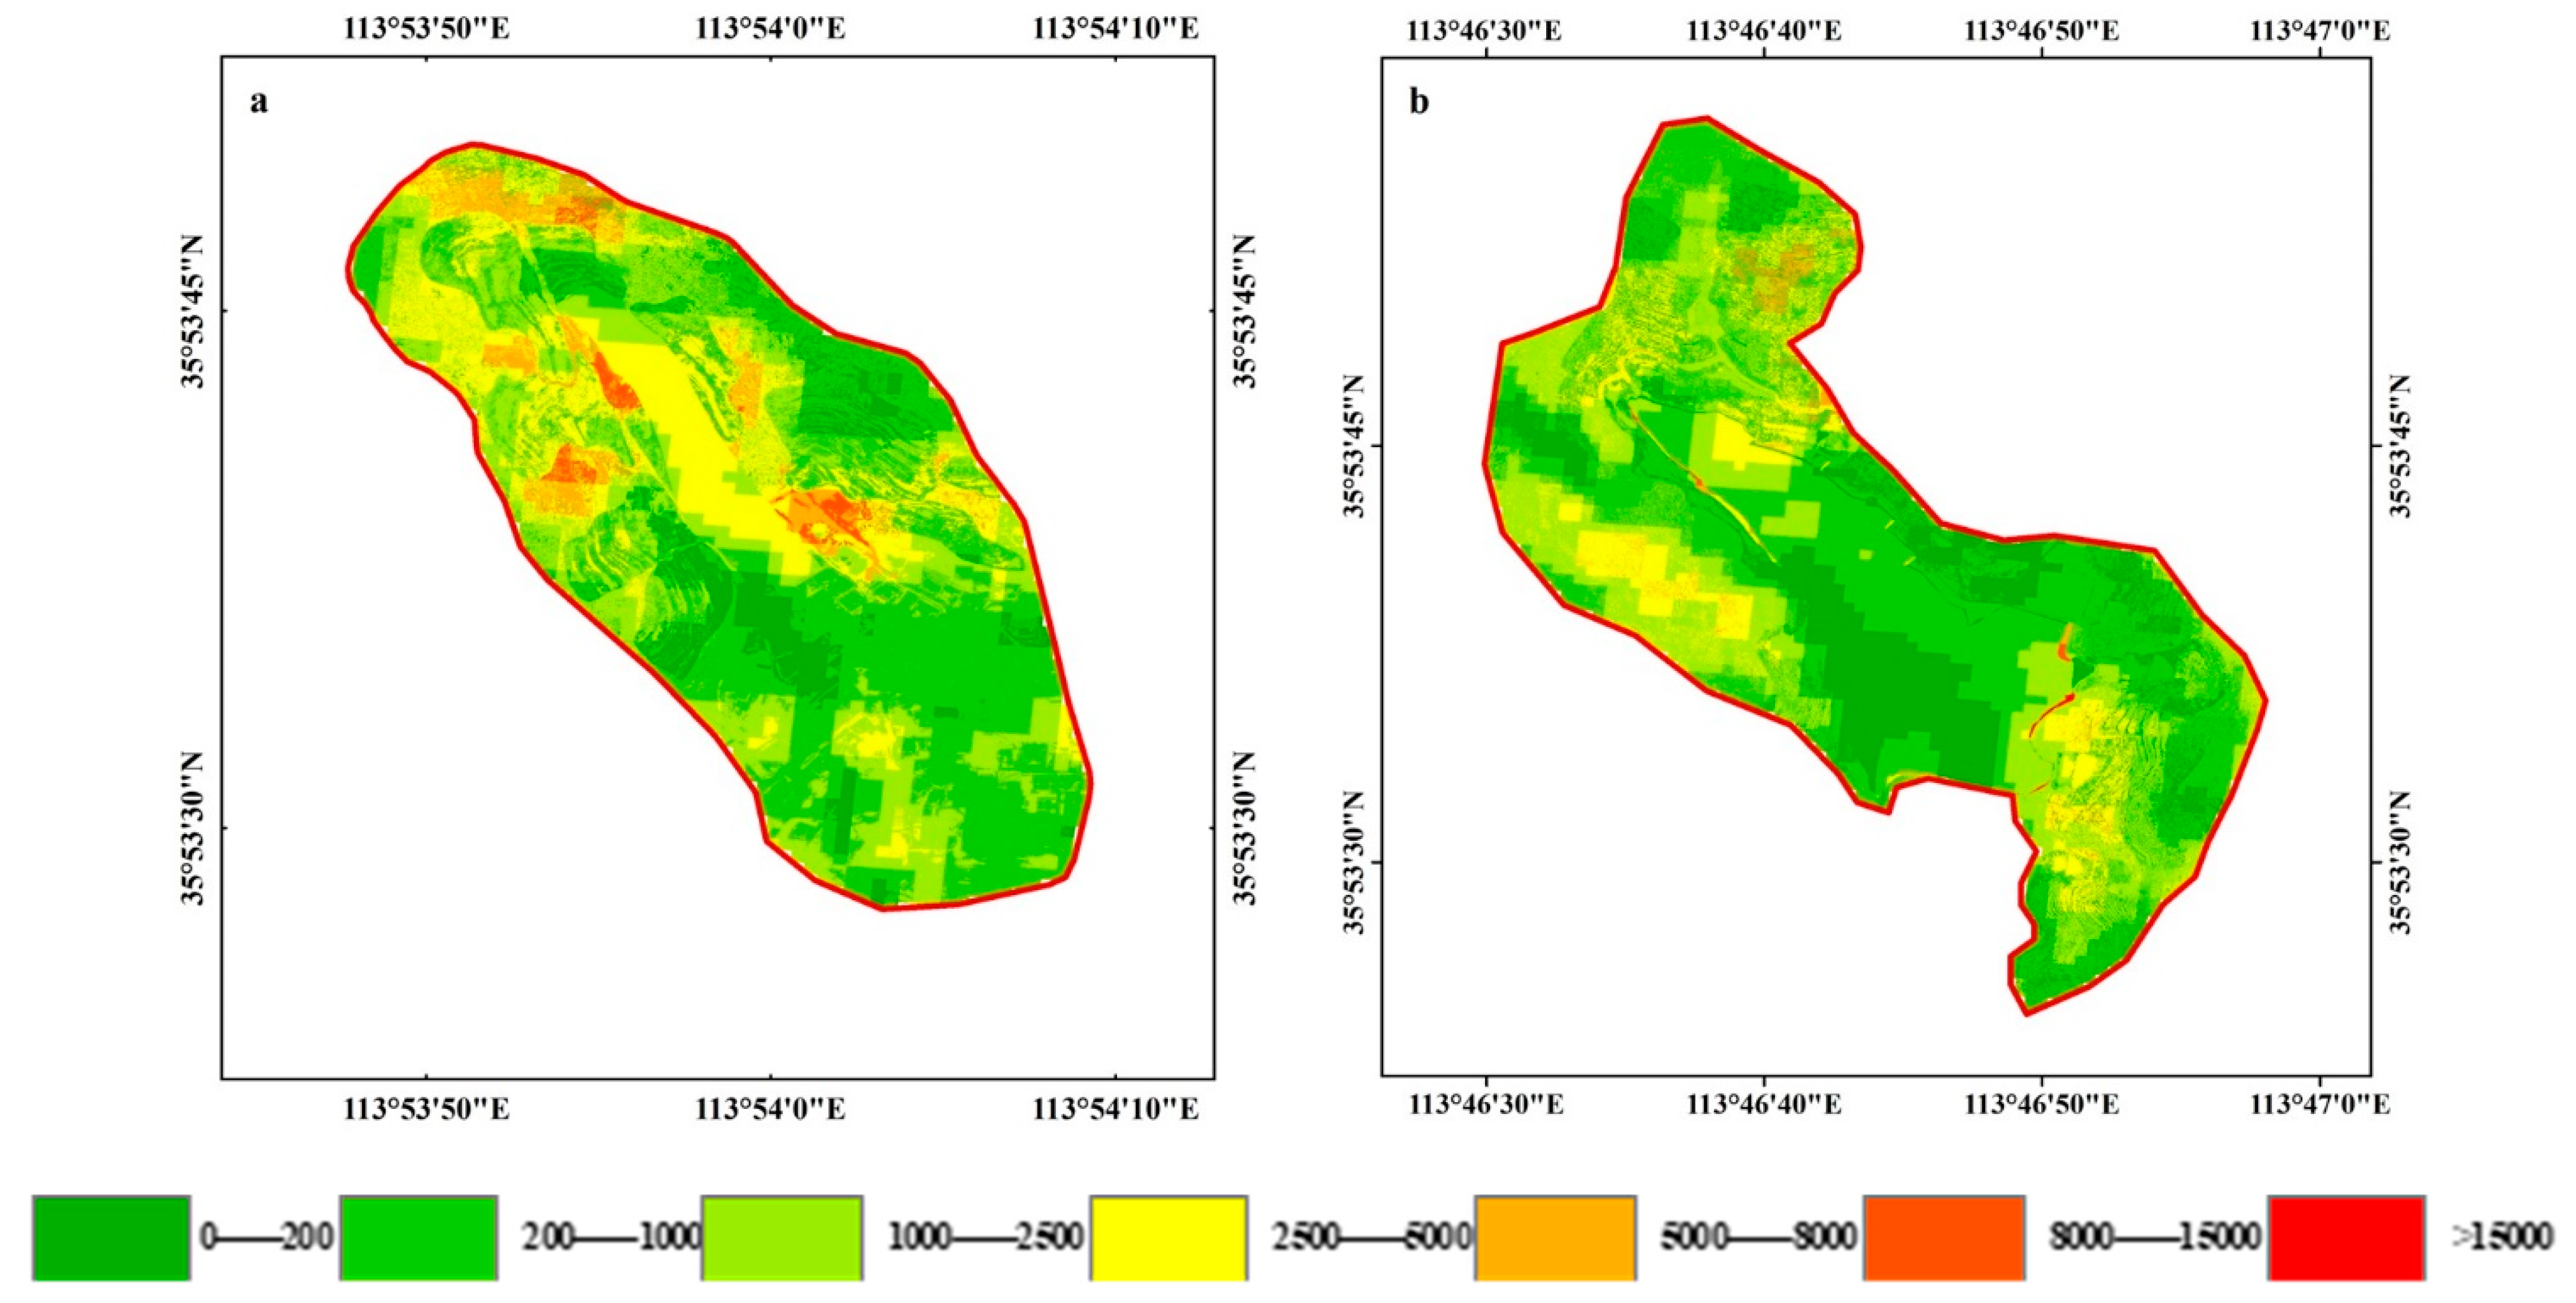
The soil erosion intensities of these two small watersheds were calculated using the CSLE model with high-resolution UAV images. The results of soil erosion intensity are in Table 2. And the spatial distributions of soil erosion are shown in Figure 4.
The area of soil and water loss (>200 t/km2) in XQ watershed caused by the precipitation was 91.3%, much higher than in LY watershed (79.1%). The difference in soil erosion between two small watersheds is more than 2500 t/km2. The area of more than moderate soil erosion (>2500 t/km2) in XQ watershed was 26.4%, higher than that (14.5%) in LY watershed.
The average soil erosion modulus of XQ watershed was 1778.2 t/km2, which was 51.3% higher than that of LY watershed (1175.4 t/km2). The areas with high soil erosion intensity are mainly distributed on the steep slopes on both sides of the small watershed. Strong soil erosion (>5000 t/km2) marked in light and dark red can be clearly seen in XQ watershed, which is less distributed in LY watershed (Figure 4).
3.3. Benefits of Soil and Water Conservation Measures against Extreme Precipitations
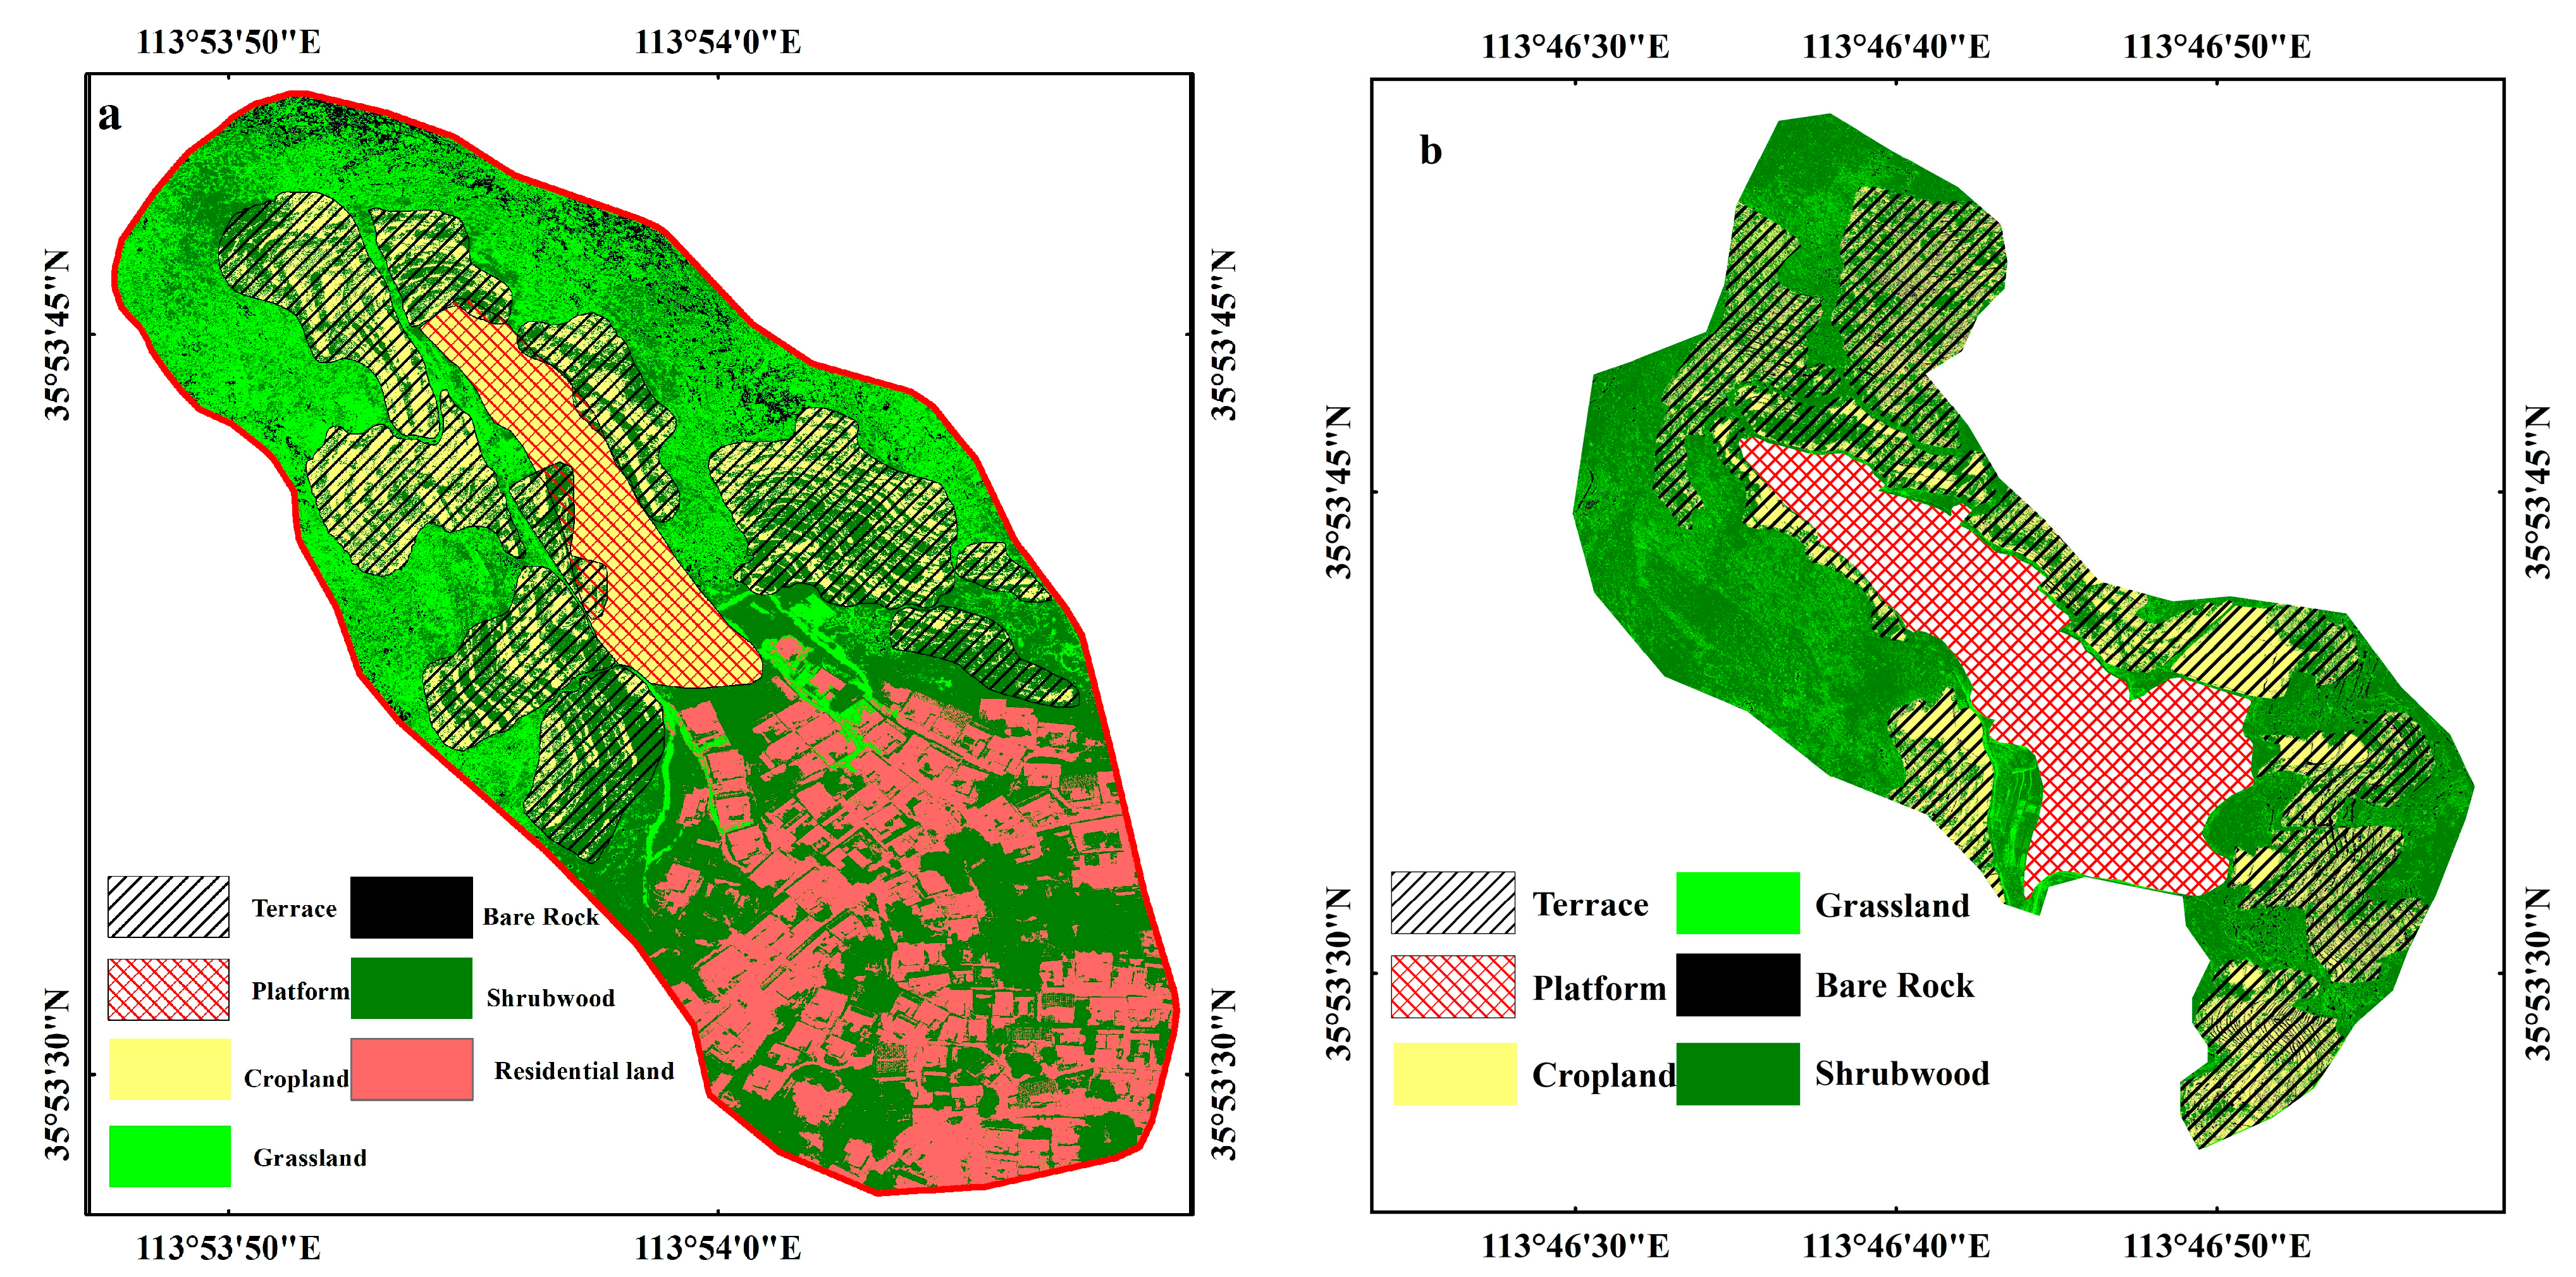
The distribution of soil and water conservation measures in the two watersheds is interpreted using UAV images combined with field investigation (Figure 5). It includes engineering measures for terraces and vegetation restoration measures for forest and grass. The area of terraces on hillslopes in LY watershed accounts for 43%, which is 18% higher than that in XQ watershed. The area of terraces distributed along the gullies in LY watershed accounts for 21%, which is 16% higher than that in XQ watershed. The proportion of forest and grass in LY watershed is 53.42%, which is similar in XQ watershed (57.1%).
The amount of soil retention in terraces was calculated against extreme precipitations using the comparative method, with and without distribution of terraces. The amount of soil retention of terraces in XQ watershed was 744.50t, and 1121.01t in LY watershed under the precipitation conditions. Soil erosion was reduced by 67.67% in XQ watershed and 78.63% in LY watershed with the existence of terrace measures, respectively.
The soil retention of forest and grass under the precipitation conditions is calculated by the comparison method based on the distribution of forest and grass versus sloping farmland. The amount of soil retention by forest and grass was 2960.23t in XQ watershed and 3320.36t in LY watershed, respectively. Forests and grasslands can greatly reduce soil erosion. The soil erosion decreased by 89.27% in XQ watershed and 90.98% in LY watershed, respectively, when the sloping farmland was transformed into forest and grassland.
4. Discussion
4.1. Application of UAV Remote Sensing Image in Gully Erosion Field Investigation
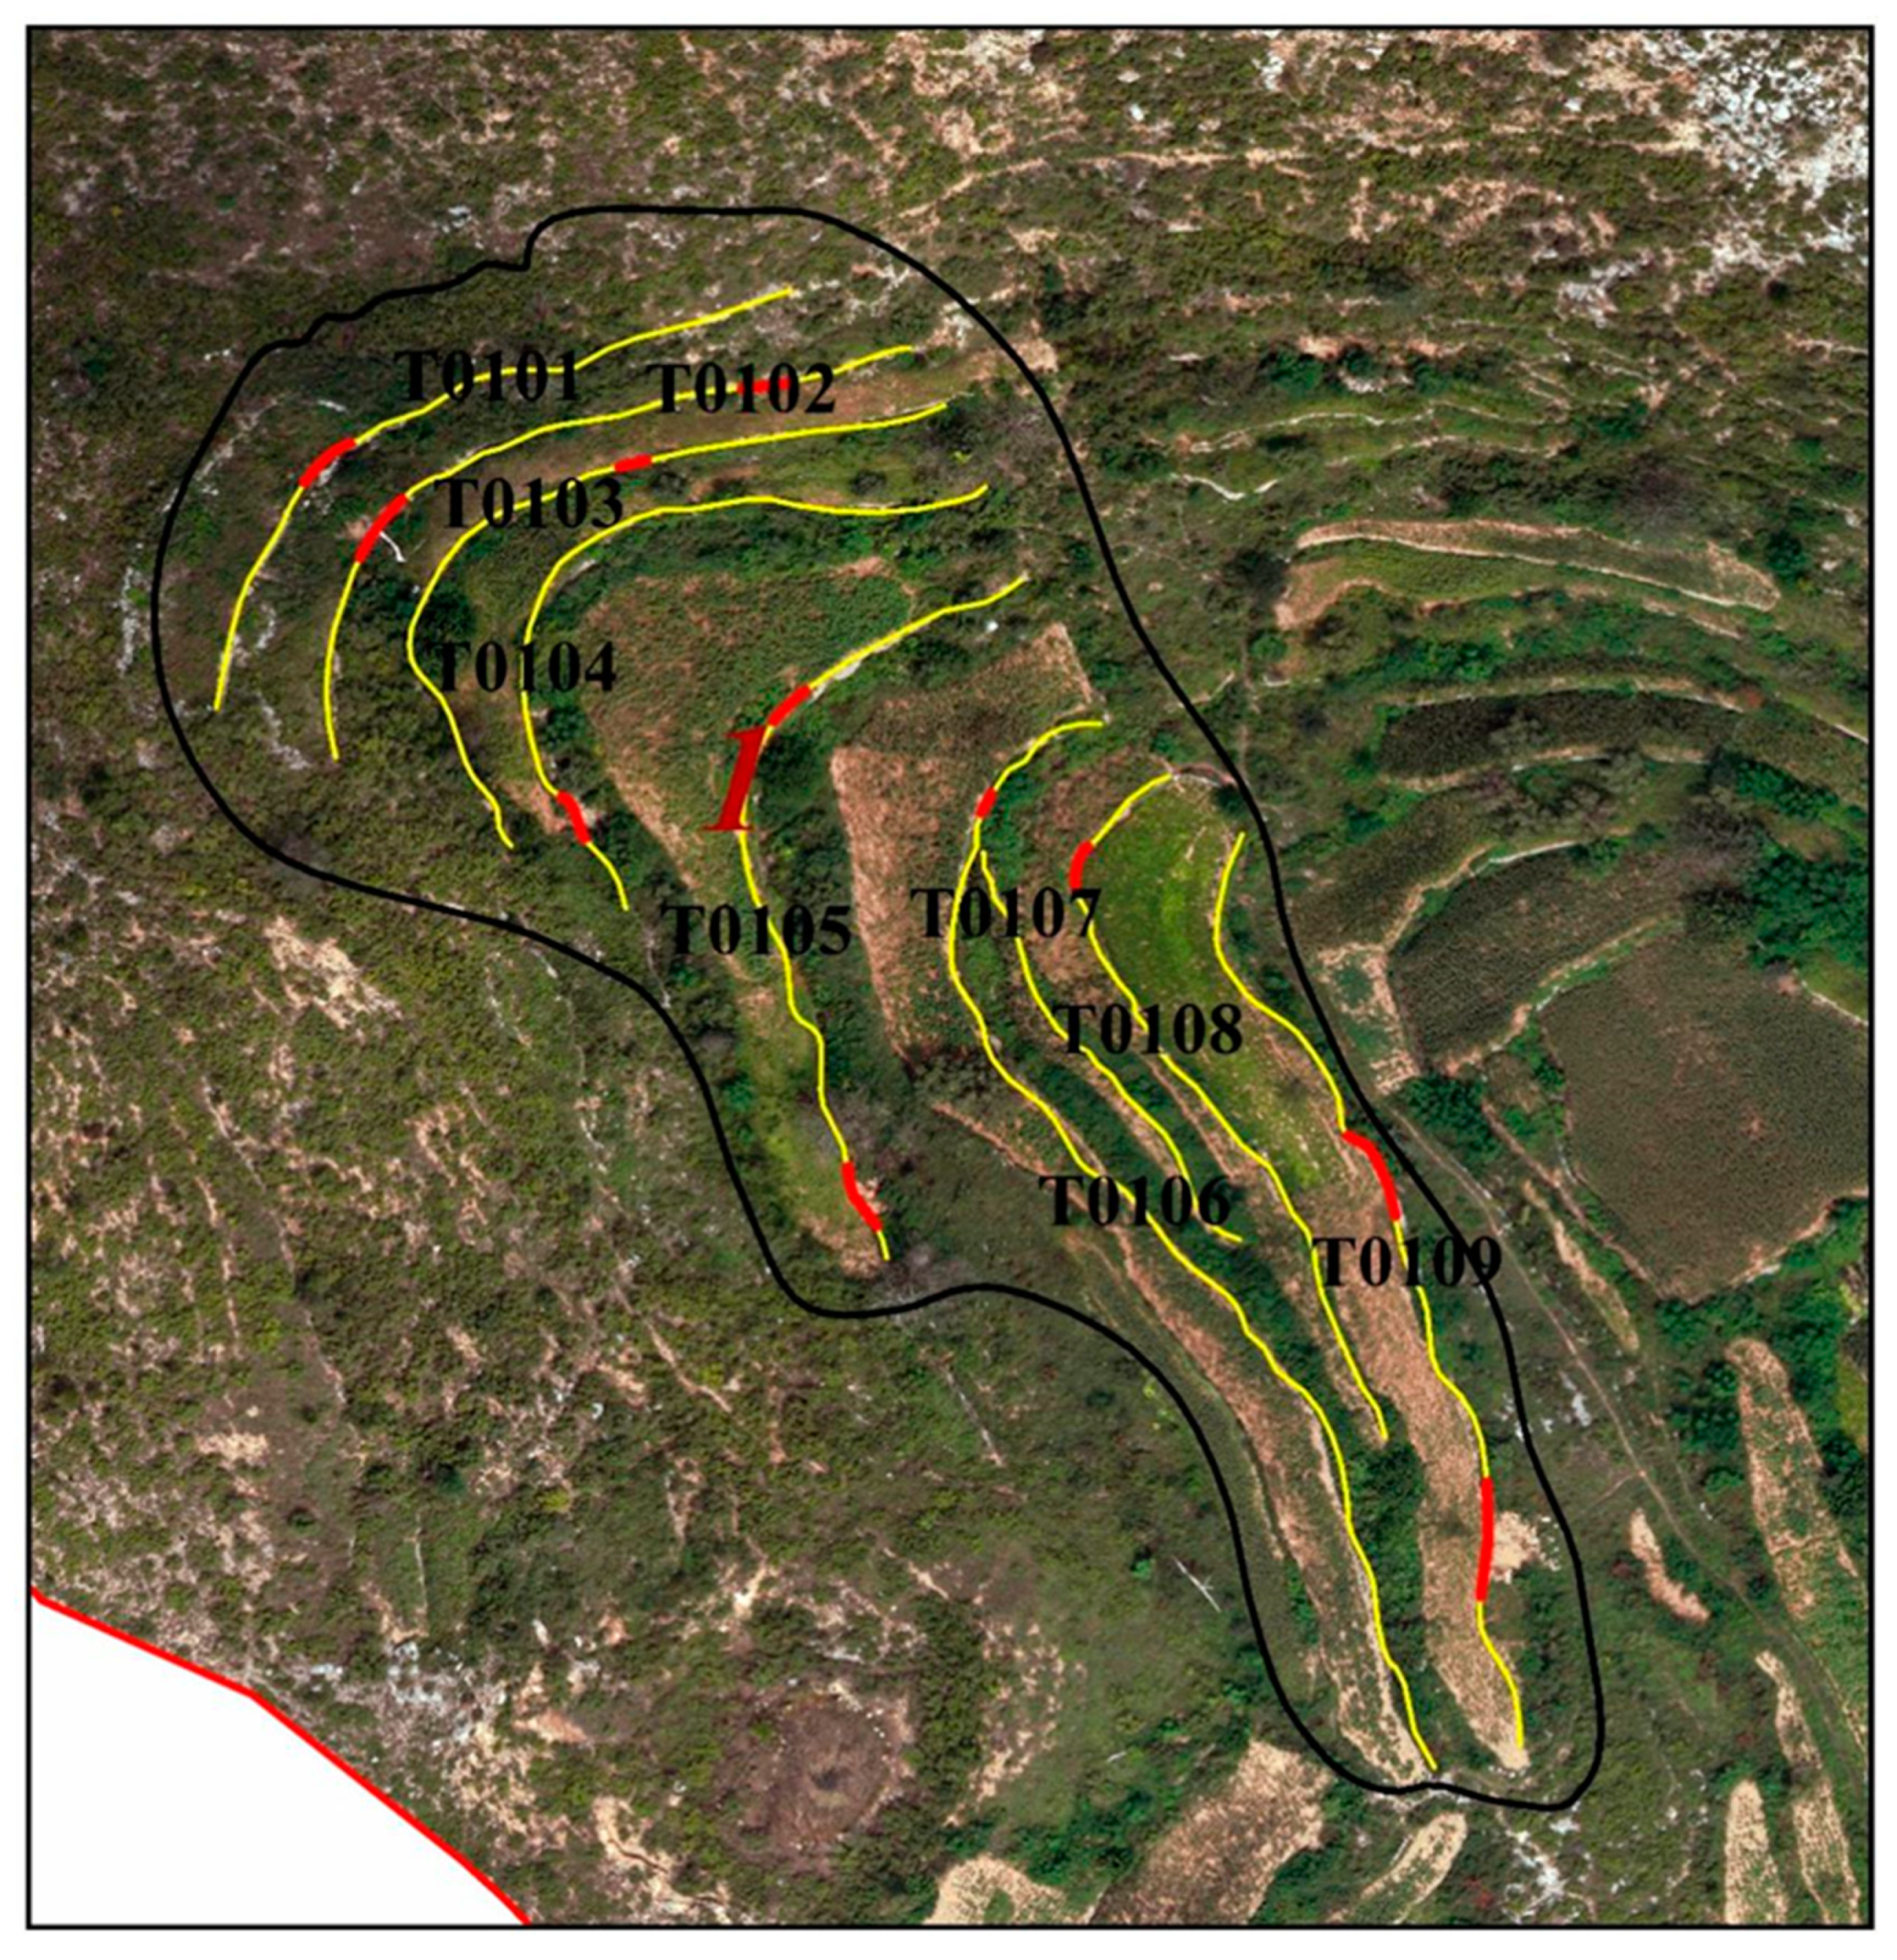
This study investigated the structural damage to soil and water conservation measures by UAV remote sensing image and manual field measurement. Taking the No. 1 block in XQ watershed as an example, the UAV images of the damage of terrace ridges were compared with the field investigation results (Figure 6 and Table 3). There were 9 terraces in block 1 of XQ watershed, and the length of terrace was 687m in total through UVA image. Among them, the length of damaged terrace was 58.1m, and the damage rate is 8.5%. According to field investigation and statistics, the terrace had a total length of 695 m, of which the damaged terrace had a total length of 46.4 m, with a damage rate of 6.7%. Therefore, UVA images overestimate terrace damage to a certain extent, but the spatial pattern of damaged locations was basically consistent with that of the field, and the main damaged locations were T0105 and T0109 terraces. The results showed that although there was some error in the UAV remote sensing image compared with the manual field measurement, the overall error was not large, which was suitable for soil erosion investigation in small watershed. This conclusion was the same as that of many scholars [48,49,50,51]. Therefore, field investigation combined with UAV monitoring was adopted to assess soil erosion under extreme precipitation.
4.2. Influencing Factors of Terrace Damage in Two Small Watersheds
Terraces play an important role in soil and water conservation and improving land productivity. But when extreme precipitation hits, the terraces can be damaged by many factors. In contrast to similar articles, Zhao et al. [53] used UAV remote sensing images to obtain land use and DSM data, and explored the impact of extreme precipitation on the rill and gully erosion of unpaved roads in the Loess Plateau of China. Santo et al. [54] used UAV remote sensing imagery and satellite imagery to analyze flooding caused by extreme precipitation in the Paupisi-Solopaca area (Southern Italy). Although the research areas and research methods are different, the factors that affect soil erosion are analyzed. In this study, by analyzing two comparative watersheds with approximately equal areas, the influencing factors of soil erosion in rocky mountainous areas were found out. The specific analysis process and influencing factors were as follows:
(a) Type of terrace
Terrace ridges in both basins are dry masonry ridges. The structure of Stone Ridge Terrace was different from that of earth Ridge Terrace. The stone ridge and field surface of terrace were not a whole, but a retaining wall added outside the field surface. Compared with earth sill, stone sill had many advantages, such as good stability, can be used as road and easy to walk.
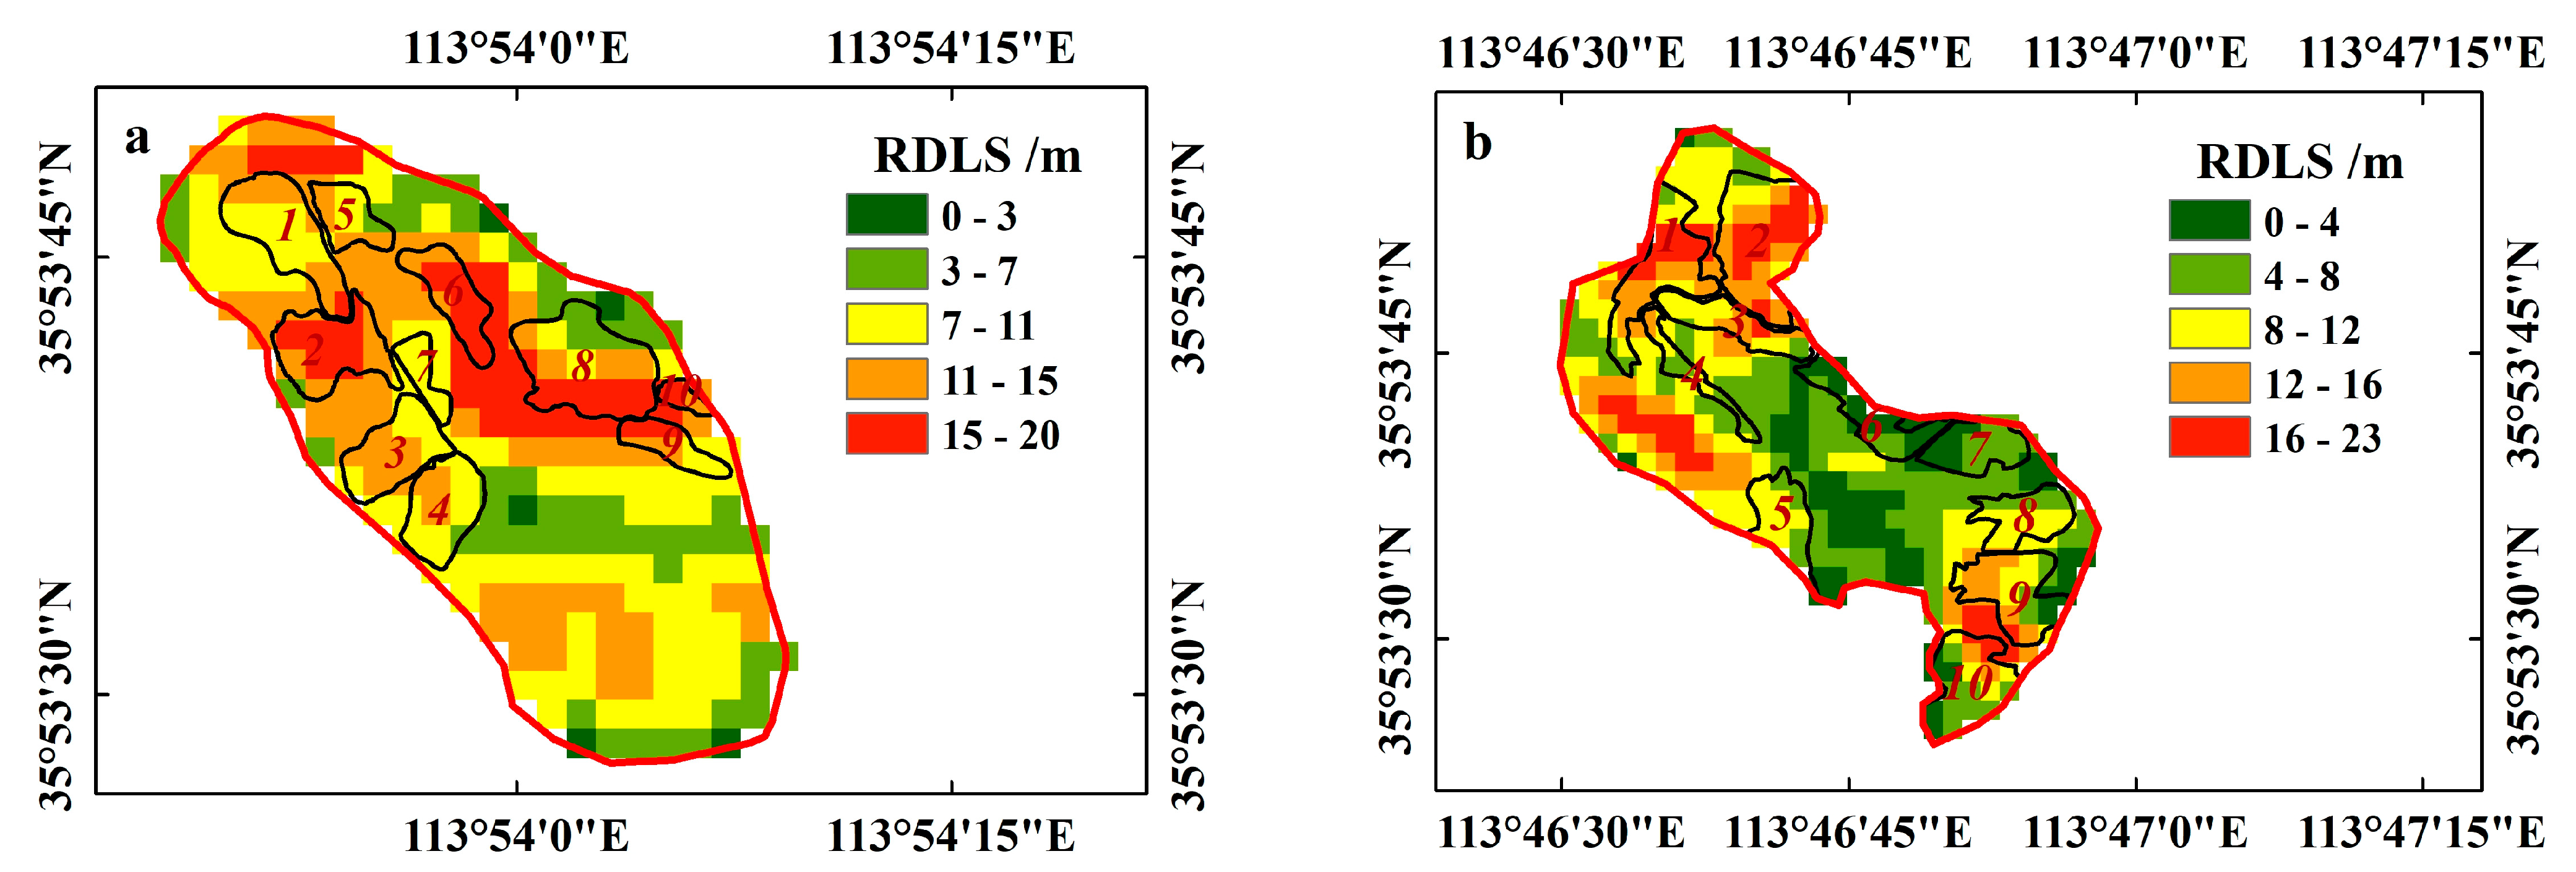
(b) Topographic relief of terrace
Topographic relief was an important topographic factor to evaluate soil and water loss. The place with large topographic relief had serious soil and water loss, while the place with small topographic relief had slight soil and water loss. The average topographic relief of XQ watershed was 10.7 m, and that of LY watershed was 9.8m. The average topographic relief of XQ watershed was larger than that of LY watershed (Figure 7). The average damage rate of terrace fields was 2.44%, higher than that of LY watershed (0.43%).
(c) The width of terrace
The average width of terraces in XQ watershed was 4.71m, and it was 5.92 m in LY watershed. According to b, the average damage rate of terraces in XQ watershed and LY watershed were 2.44% and 0.43% respectively. The failure rate of terrace decreased with increasing field width.
(d) The slope of terrace
The larger the overall slope of terraces, the higher the average damage rate and proportion of terraces. The average slope of terraces in XQ watershed was greater than that in LY watershed (Figure 8). The slope of terraces in XQ watershed was 8–20 degrees. The average damage rate of terraces was 2.44%, and the proportion of damage was 19.19%. The slope of the terraces in LY watershed was 6.89 degrees, mainly 5–10 degrees and 10–15 degrees. The average damage rate of terraces was 0.43%, and the proportion of damage was 6.69%. The average slope of damaged terraces in LY watershed ranged from 5.29–10.29 degrees. The average slope of damaged terraces in XQ watershed is 7.11–12.11 degrees.
(e) Vegetation restoration measures
LY watershed was the key prevention area of water and soil loss in Linzhou city. A large area of artificial forest was planted at the top of the mountain area, mainly Platycladus orientalis and twigs of the chaste tree. It had strong water conservation capacity, peak cutting and flood dissipation capacity, and plays a certain role in protecting the terrace in the middle and bottom of the slope.
5. Conclusions
In this study, CSLE model was used to calculate and evaluate the soil conservation amount and soil and water conservation benefit of terraces and vegetation restoration measures under extreme precipitation in Henan Province. First, the amount of soil erosion in LY watershed (1175.4 t/km2) is lower than that in XQ watershed (1778.2 t/km2) because the terraces in LY watershed (0.12 km2) are higher than that in XQ watershed (0.05 km2), and the amount of soil conservation in LY watershed (1121.01 t) is 1.5 times that in XQ watershed (744.50 t). In the same watershed, the soil conservation amount of XQ watershed’s vegetation restoration (2960.23 t) is much higher than that of terraces (744.50 t), the soil conservation amount of LY watershed’s vegetation restoration (3320.36 t) is much higher than that of terraces (1121.01 t). Second, Terrace can change the topography of sloping farmland, slow down the slope, shorten the slope length, increase the time of rainfall infiltration, store runoff and sediment, and reduce the loss of soil nutrients. Therefore, when analyzing the soil erosion of terraces under extreme precipitation, the width of the terraces, the slope of the terraces and whether there are drainage measures in the terraces should also be considered. Finally, compared with manual field measurement, UAV remote sensing image recognition had smaller error, but it had advantages of convenience, ignoring topography and saving time and labor cost, so it could be used as a field investigation of soil erosion under extreme precipitation.
Author Contributions
Conceptualization, X.M.; Methodology, P.G.; Validation, G.Z.; investigation, X.W. and Z.L.; writing—original draft preparation, H.J.; writing—review and editing, W.S. All authors have read and agreed to the published version of the manuscript.
Funding
This study was supported by the National Natural Science Foundation of China (Grant No. 42177328).
Institutional Review Board Statement
Not applicable.
Informed Consent Statement
Not applicable.
Data Availability Statement
Not applicable.
Conflicts of Interest
The authors declare no conflict of interest.
References
- Borrelli, P.; Robinson, D.A.; Fleischer, L.R.; Lugato, E.; Ballabio, C.; Alewell, C.; Meusburger, K.; Modugno, S.; Schuett, B.; Ferro, V.; et al. An Assessment of the Global Impact of 21st Century Land Use Change on Soil Erosion. Nat. Commun. 2017, 8, 2013. [Google Scholar] [CrossRef] [Green Version]
- Lu, L.; Cheng, H.; Pu, X.; Wang, J.; Cheng, Q.; Liu, X. Identifying Organic Matter Sources Using Isotopic Ratios in a Watershed Impacted by Intensive Agricultural Activities in Northeast China. Agric. Ecosyst. Environ. 2016, 222, 48–59. [Google Scholar] [CrossRef]
- Meliho, M.; Nouira, A.; Benmansour, M.; Boulmane, M.; Khattabi, A.; Mhammdi, N.; Benkdad, A. Assessment of Soil Erosion Rates in a Mediterranean Cultivated and Uncultivated Soils Using Fallout 137Cs. J. Environ. Radioact. 2019, 208, 106021. [Google Scholar] [CrossRef]
- Stefanidis, S.; Alexandridis, V.; Ghosal, K. Assessment of Water-Induced Soil Erosion as a Threat to Natura 2000 Protected Areas in Crete Island, Greece. Sustainability 2022, 14, 2738. [Google Scholar] [CrossRef]
- Mishra, V.; Shah, H.L. Hydroclimatological Perspective of the Kerala Flood of 2018. J. Geol. Soc. India 2018, 92, 645–650. [Google Scholar] [CrossRef]
- Fekete, A.; Sandholz, S. Here Comes the Flood, but Not Failure? Lessons to Learn after the Heavy Rain and Pluvial Floods in Germany 2021. Water 2021, 13, 3016. [Google Scholar] [CrossRef]
- Crosta, G.B.; Frattini, P. Rainfall-Induced Landslides and Debris Flows—Preface. Hydrol. Process. 2008, 22, 473–477. [Google Scholar] [CrossRef]
- Fowler, H.J.; Lenderink, G.; Prein, A.F.; Westra, S.; Allan, R.P.; Ban, N.; Barbero, R.; Berg, P.; Blenkinsop, S.; Do, H.X.; et al. Anthropogenic Intensification of Short-Duration Rainfall Extremes. Nat. Rev. Earth Environ. 2021, 2, 107–122. [Google Scholar] [CrossRef]
- Santoso, A.M.; Phoon, K.-K.; Quek, S.-T. Effects of Soil Spatial Variability on Rainfall-Induced Landslides. Comput. Struct. 2011, 89, 893–900. [Google Scholar] [CrossRef]
- Dey, R.; Lewis, S.C.; Arblaster, J.M.; Abram, N.J. A Review of Past and Projected Changes in Australia’s Rainfall. Wiley Interdiscip. Rev.-Clim. Change 2019, 10, e577. [Google Scholar] [CrossRef]
- Westra, S.; Fowler, H.J.; Evans, J.P.; Alexander, L.V.; Berg, P.; Johnson, F.; Kendon, E.J.; Lenderink, G.; Roberts, N.M. Future Changes to the Intensity and Frequency of Short-Duration Extreme Rainfall. Rev. Geophys. 2014, 52, 522–555. [Google Scholar] [CrossRef]
- Bhardwaj, A.; Wasson, R.J.; Ziegler, A.D.; Chow, W.T.L.; Sundriyal, Y.P. Characteristics of Rain-Induced Landslides in the Indian Himalaya: A Case Study of the Mandakini Catchment during the 2013 Flood. Geomorphology 2019, 330, 100–115. [Google Scholar] [CrossRef]
- Dezfuli, A. Rare Atmospheric River Caused Record Floods across the Middle East. Bull. Am. Meteorol. Soc. 2020, 101, E394–E400. [Google Scholar] [CrossRef]
- Hashimoto, R.; Tsuchida, T.; Moriwaki, T.; Kano, S. Hiroshima Prefecture Geo-Disasters Due to Western Japan Torrential Rainfall in July 2018. Soils Found. 2020, 60, 283–299. [Google Scholar] [CrossRef]
- Stefanidis, S.; Alexandridis, V.; Chatzichristaki, C.; Stefanidis, P. Assessing Soil Loss by Water Erosion in a Typical Mediterranean Ecosystem of Northern Greece under Current and Future Rainfall Erosivity. Water 2021, 13, 2002. [Google Scholar] [CrossRef]
- Panagos, P.; Ballabio, C.; Himics, M.; Scarpa, S.; Matthews, F.; Bogonos, M.; Poesen, J.; Borrelli, P. Projections of Soil Loss by Water Erosion in Europe by 2050. Environ. Sci. Policy 2021, 124, 380–392. [Google Scholar] [CrossRef]
- El Kateb, H.; Zhang, H.; Zhang, P.; Mosandl, R. Soil Erosion and Surface Runoff on Different Vegetation Covers and Slope Gradients: A Field Experiment in Southern Shaanxi Province, China. Catena 2013, 105, 1–10. [Google Scholar] [CrossRef]
- Hartanto, H.; Prabhu, R.; Widayat, A.S.E.; Asdak, C. Factors Affecting Runoff and Soil Erosion: Plot-Level Soil Loss Monitoring for Assessing Sustainability of Forest Management. For. Ecol. Manag. 2003, 180, 361–374. [Google Scholar] [CrossRef]
- Keesstra, S.; Pereira, P.; Novara, A.; Brevik, E.C.; Azorin-Molina, C.; Parras-Alcantara, L.; Jordan, A.; Cerda, A. Effects of Soil Management Techniques on Soil Water Erosion in Apricot Orchards. Sci. Total Environ. 2016, 551, 357–366. [Google Scholar] [CrossRef] [Green Version]
- Zhang, L.; Wang, J.; Bai, Z.; Lv, C. Effects of Vegetation on Runoff and Soil Erosion on Reclaimed Land in an Opencast Coal-Mine Dump in a Loess Area. Catena 2015, 128, 44–53. [Google Scholar] [CrossRef]
- Haddadchi, A.; Nosrati, K.; Ahmadi, F. Differences between the Source Contribution of Bed Material and Suspended Sediments in a Mountainous Agricultural Catchment of Western Iran. Catena 2014, 116, 105–113. [Google Scholar] [CrossRef]
- Kumar, G.; Sena, D.R.; Patra, S.; Singh, D.; Kurothe, R.S.; Mishra, P.K.; Nyonand. Design and Development of a Low-Cost Automatic Runoff Sampler for Time Distributed Sampling. J. Hydrol. 2021, 592, 125845. [Google Scholar] [CrossRef]
- Mhiret, D.A.; Dagnew, D.C.; Guzman, C.D.; Alemie, T.C.; Zegeye, A.D.; Tebebu, T.Y.; Langendoen, E.J.; Zaitchik, B.F.; Tilahun, S.A.; Steenhuis, T.S. A Nine-Year Study on the Benefits and Risks of Soil and Water Conservation Practices in the Humid Highlands of Ethiopia: The Debre Mawi Watershed. J. Environ. Manage. 2020, 270, 110885. [Google Scholar] [CrossRef] [PubMed]
- Walling, D.E.; Russell, M.A.; Hodgkinson, R.A.; Zhang, Y. Establishing Sediment Budgets for Two Small Lowland Agricultural Catchments in the UK. Catena 2002, 47, 323–353. [Google Scholar] [CrossRef]
- Hu, Y.; Tian, G.; Mayer, A.L.; He, R. Risk Assessment of Soil Erosion by Application of Remote Sensing and GIS in Yanshan Reservoir Catchment, China. Nat. Hazards 2015, 79, 277–289. [Google Scholar] [CrossRef]
- Sun, W.; Tian, Y.; Mu, X.; Zhai, J.; Gao, P.; Zhao, G. Loess Landslide Inventory Map Based on GF-1 Satellite Imagery. Remote Sens. 2017, 9, 314. [Google Scholar] [CrossRef] [Green Version]
- Vrieling, A. Satellite Remote Sensing for Water Erosion Assessment: A Review. Catena 2006, 65, 2–18. [Google Scholar] [CrossRef]
- Wang, F.; Yang, S. Regional Characteristics of Long-Term Changes in Total and Extreme Precipitations over China and Their Links to Atmospheric-Oceanic Features. Int. J. Climatol. 2017, 37, 751–769. [Google Scholar] [CrossRef] [Green Version]
- Duan, X.; Bai, Z.; Rong, L.; Li, Y.; Ding, J.; Tao, Y.; Li, J.; Li, J.; Wang, W. Investigation Method for Regional Soil Erosion Based on the Chinese Soil Loss Equation and High-Resolution Spatial Data: Case Study on the Mountainous Yunnan Province, China. Catena 2020, 184, 104237. [Google Scholar] [CrossRef]
- Hamel, P.; Chaplin-Kramer, R.; Sim, S.; Mueller, C. A New Approach to Modeling the Sediment Retention Service (InVEST 3.0): Case Study of the Cape Fear Catchment, North Carolina, USA. Sci. Total Environ. 2015, 524, 166–177. [Google Scholar] [CrossRef]
- Song, X.; Duan, Z.; Kono, Y.; Wang, M. Integration of Remotely Sensed C Factor into SWAT for Modelling Sediment Yield. Hydrol. Process. 2011, 25, 3387–3398. [Google Scholar] [CrossRef]
- Toumi, S.; Meddi, M.; Mahe, G.; Brou, Y.T. Remote sensing and GIS applied to the mapping of soil loss by erosion in the Wadi Mina catchment. Hydrol. Sci. J.-J. Sci. Hydrol. 2013, 58, 1542–1558. [Google Scholar] [CrossRef] [Green Version]
- AbdelRahman, M.A.E.; Natarajan, A.; Hegde, R.; Prakash, S.S. Assessment of Land Degradation Using Comprehensive Geostatistical Approach and Remote Sensing Data in GIS-Model Builder. Egypt. J. Remote Sens. Space Sci. 2019, 22, 323–334. [Google Scholar] [CrossRef]
- Bayat, F.; Monfared, A.B.; Jahansooz, M.R.; Terol Esparza, E.; Keshavarzi, A.; Gimenez Morera, A.; Pulido Fernandez, M.; Cerda, A. Analyzing Long-Term Soil Erosion in a Ridge-Shaped Persimmon Plantation in Eastern Spain by Means of ISUM Measurements. Catena 2019, 183, 104176. [Google Scholar] [CrossRef]
- Zhang, Y.; Degroote, J.; Wolter, C.; Sugumaran, R. Integration of Modified Universal Soil Loss Equation (Musle) into a Gis Framework to Assess Soil Erosion Risk. Land Degrad. Dev. 2009, 20, 84–91. [Google Scholar] [CrossRef] [Green Version]
- Li, Y.-G.; He, D.; Hu, J.-M.; Cao, J. Variability of Extreme Precipitation over Yunnan Province, China 1960–2012. Int. J. Climatol. 2015, 35, 245–258. [Google Scholar] [CrossRef]
- Qiong, W.; Mingjun, Z.; Shengjie, W.; Qian, M.; Meiping, S. Changes in Temperature Extremes in the Yangtze River Basin, 1962–2011. J. Geogr. Sci. 2014, 24, 59–75. [Google Scholar] [CrossRef]
- Sun, W.; Mu, X.; Song, X.; Wu, D.; Cheng, A.; Qiu, B. Changes in Extreme Temperature and Precipitation Events in the Loess Plateau (China) during 1960–2013 under Global Warming. Atmospheric Res. 2016, 168, 33–48. [Google Scholar] [CrossRef]
- Tao, Y.; Wang, W.; Song, S.; Ma, J. Spatial and Temporal Variations of Precipitation Extremes and Seasonality over China from 1961–2013. Water 2018, 10, 719. [Google Scholar] [CrossRef] [Green Version]
- You, Q.; Kang, S.; Aguilar, E.; Pepin, N.; Fluegel, W.-A.; Yan, Y.; Xu, Y.; Zhang, Y.; Huang, J. Changes in Daily Climate Extremes in China and Their Connection to the Large Scale Atmospheric Circulation during 1961–2003. Clim. Dyn. 2011, 36, 2399–2417. [Google Scholar] [CrossRef]
- Xukai, Z.; Fumin, R. Changes in Regional Heavy Rainfall Events in China during 1961–2012. Adv. Atmospheric Sci. 2015, 32, 704–714. [Google Scholar] [CrossRef]
- Chen, L.; Wei, W.; Fu, B.; Lu, Y. Soil and Water Conservation on the Loess Plateau in China: Review and Perspective. Prog. Phys. Geogr.-Earth Environ. 2007, 31, 389–403. [Google Scholar] [CrossRef]
- Li, N.; Zhang, Y.; Wang, T.; Li, J.; Yang, J.; Luo, M. Have Anthropogenic Factors Mitigated or Intensified Soil Erosion over the Past Three Decades in South China? J. Environ. Manage. 2022, 302, 114093. [Google Scholar] [CrossRef] [PubMed]
- Liu, J.; Liu, H. Soil Erosion Changes during the Last 30 Years and Contributions of Gully Erosion to Sediment Yield in a Small Catchment, Southern China. Geomorphology 2020, 368, 107357. [Google Scholar] [CrossRef]
- Shi, W.; Huang, M.; Barbour, S.L. Storm-Based CSLE That Incorporates the Estimated Runoff for Soil Loss Prediction on the Chinese Loess Plateau. Soil Tillage Res. 2018, 180, 137–147. [Google Scholar] [CrossRef]
- Wu, L.; Liu, X.; Ma, X. Application of a Modified Distributed-Dynamic Erosion and Sediment Yield Model in a Typical Watershed of a Hilly and Gully Region, Chinese Loess Plateau. Solid Earth 2016, 7, 1577–1590. [Google Scholar] [CrossRef] [Green Version]
- Yin, S.; Zhu, Z.; Wang, L.; Liu, B.; Xie, Y.; Wang, G.; Li, Y. Regional Soil Erosion Assessment Based on a Sample Survey and Geostatistics. Hydrol. Earth Syst. Sci. 2018, 22, 1695–1712. [Google Scholar] [CrossRef] [Green Version]
- Wischmeier, W.H.; Smith, D.D. Predicting Rainfall Erosion Losses—A Guide to Conservation Planning; Agriculture Handbook No. 537; Department of Agriculture, Science and Education Administration: Washington, DC, USA, 1978; pp. 285–291. [Google Scholar]
- Chen, S.; McDermid, G.J.; Castilla, G.; Linke, J. Measuring Vegetation Height in Linear Disturbances in the Boreal Forest with UAV Photogrammetry. Remote Sens. 2017, 9, 1257. [Google Scholar] [CrossRef] [Green Version]
- Moe, K.T.; Owari, T.; Furuya, N.; Hiroshima, T. Comparing Individual Tree Height Information Derived from Field Surveys, LiDAR and UAV-DAP for High-Value Timber Species in Northern Japan. Forests 2020, 11, 223. [Google Scholar] [CrossRef] [Green Version]
- Roeder, M.; Latifi, H.; Hill, S.; Wild, J.; Svoboda, M.; Bruna, J.; Macek, M.; Novakova, M.H.; Guelch, E.; Heurich, M. Application of Optical Unmanned Aerial Vehicle-Based Imagery for the Inventory of Natural Regeneration and Standing Deadwood in Post-Disturbed Spruce Forests. Int. J. Remote Sens. 2018, 39, 5288–5309. [Google Scholar] [CrossRef]
- Sebastian, D.O.; Irene, M.; Klaus, P.; Johannes, R. Unmanned Aerial Vehicle (UAV) for Monitoring Soil Erosion in Morocco. Remote Sens. 2012, 4, 3390–3416. [Google Scholar] [CrossRef] [Green Version]
- Zhao, Y.; Zhang, Y.; Yuan, M.; Yang, M.; Deng, J. Estimation of Initiation Thresholds and Soil Loss from Gully Erosion on Unpaved Roads on China’s Loess Plateau. Earth Surf. Process. Landf. 2021, 46, 1713–1724. [Google Scholar] [CrossRef]
- Santo, A.; Santangelo, N.; Forte, G.; De Falco, M. Post Flash Flood Survey: The 14th and 15th October 2015 Event in the Paupisi-Solopaca Area (Southern Italy). J. Maps 2017, 13, 19–25. [Google Scholar] [CrossRef] [Green Version]
Figure 1.
Location of the study area.

Figure 2.
UAV remote sensing image measurement (a) and manual field measurement (b).

Figure 3.
The distribution of terraced in XQ and LY watershed; (a) The distribution of terraces in XQ watershed; (b) The distribution of terraces in LY watershed; (c) The damage distribution of terraces in XQ watershed; (d) The damage distribution of terraces in LY watershed; (e) The damage rate of terraces in XQ watershed and (f) The damage rate of terraces in LY watershed.

Figure 4.
Spatial distribution of soil erosion modulus: (a) XQ watershed and (b) LY watershed.

Figure 5.
Distribution of terrace and terrace measures: (a) XQ watershed and (b) LY watershed.

Figure 6.
Remote sensing interpretation results of typical terraces.

Figure 7.
Topographic relief of terrace: (a) XQ watershed and (b) LY watershed.

Figure 8.
The distribution of terrace’s slope: (a) Spatial distribution of slope in XQ watershed and (b) Spatial distribution of slope in LY watershed.
Figure 8.
The distribution of terrace’s slope: (a) Spatial distribution of slope in XQ watershed and (b) Spatial distribution of slope in LY watershed.


Table 1.
Assignment table of engineering control (E) and tillage practices (T) in water and soil conservation.
Table 1.
Assignment table of engineering control (E) and tillage practices (T) in water and soil conservation.
| The Primary Classification | The Secondary Classification | The Three-Level Classification | Factor Value |
|---|---|---|---|
| Engineering Measures | Terrace | Earth Ridge Terrace | 0.084 |
| Stone Ridge Terrace | 0.121 | ||
| Slope Terrace | 0.414 | ||
| Broad-Base Terrace | 0.414 | ||
| Rverse Slope Terrace | 0.151 | ||
| Parallel Ditch | 0.335 | ||
| Fish Scale Pits | 0.249 | ||
| Tillage Measures | Contour Tillage | 0.431 | |
| Ridge Tillage and Pitting Field | 0.152 | ||
| Contour Furrow | 0.425 | ||
| Lea Farming | 0.225 | ||
| Intercropping | 0.225 | ||
| Green Manure | 0.225 | ||
| Minimum Tillage | 0.212 | ||
| No-Tillage | 0.136 | ||
| Crop Rotation | 0.392 |
Table 2.
The precipitation soil erosion intensity.
| Watershed Name | Proportion of Soil Erosion Intensity in Each Area | Average Soil Loss Modulus (t/km2) | ||||||
|---|---|---|---|---|---|---|---|---|
| 0–200 | 200–1000 | 1000–2500 | 2500–5000 | 5000–8000 | 8000–15,000 | >15,000 | ||
| XQ Watershed | 8.74 | 40.53 | 24.31 | 20.41 | 4.58 | 1.43 | 0.00 | 1778.2 |
| LY Watershed | 20.90 | 41.07 | 23.52 | 12.90 | 1.44 | 0.09 | 0.07 | 1175.4 |
Table 3.
Field survey results of typical terraces.
| Number | Width (m) | Height (m) | The Slope of Terrace (°) | Land Utilization | The Type of Terrace | The Length of Damaged (m) | The Length of the Terrace (m) |
|---|---|---|---|---|---|---|---|
| T0101 | 7.5 | 1.2 | 3.2 | Grassland | Horizontal Terraces | 4.9 | 64.3 |
| T0102 | 6.9 | 2.7 | 2.1 | Grassland | Horizontal Terraces | 5.7 | 70.5 |
| T0103 | 5.1 | 1.68 | 1.9 | Grassland | Horizontal Terraces | 4 | 75.5 |
| T0104 | 6.6 | 2.7 | 2.3 | Grassland | Horizontal Terraces | 6.6 | 70.2 |
| T0105 | 16 | 2.65 | 2.4 | Farmland | Horizontal Terraces | 6.1 | 80.1 |
| T0106 | 12 | 2.4 | 2.7 | Farmland and Grassland | Horizontal Terraces | 2.7 | 107.9 |
| T0107 | 5.6 | 1.58 | 1.9 | Farmland | Horizontal Terraces | 0 | 50.1 |
| T0108 | 6.1 | 1.2 | 3.0 | Farmland | Horizontal Terraces | 4.1 | 70 |
| T0109 | 12.1 | 1.85 | 2.0 | Farmland | Horizontal Terraces | 6.9 | 106.6 |
Publisher’s Note: MDPI stays neutral with regard to jurisdictional claims in published maps and institutional affiliations. |
© 2022 by the authors. Licensee MDPI, Basel, Switzerland. This article is an open access article distributed under the terms and conditions of the Creative Commons Attribution (CC BY) license (https://creativecommons.org/licenses/by/4.0/).
Share and Cite
MDPI and ACS Style
Jia, H.; Wang, X.; Sun, W.; Mu, X.; Gao, P.; Zhao, G.; Li, Z. Estimation of Soil Erosion and Evaluation of Soil and Water Conservation Benefit in Terraces under Extreme Precipitation. Water 2022, 14, 1675. https://doi.org/10.3390/w14111675
AMA Style
Jia H, Wang X, Sun W, Mu X, Gao P, Zhao G, Li Z. Estimation of Soil Erosion and Evaluation of Soil and Water Conservation Benefit in Terraces under Extreme Precipitation. Water. 2022; 14(11):1675. https://doi.org/10.3390/w14111675
Chicago/Turabian StyleJia, Hao, Xidong Wang, Wenyi Sun, Xingmin Mu, Peng Gao, Guangju Zhao, and Zixuan Li. 2022. "Estimation of Soil Erosion and Evaluation of Soil and Water Conservation Benefit in Terraces under Extreme Precipitation" Water 14, no. 11: 1675. https://doi.org/10.3390/w14111675
Note that from the first issue of 2016, this journal uses article numbers instead of page numbers. See further details here.