Article

Spatiotemporal Distribution Pattern of Phytoplankton Community and Its Main Driving Factors in Dongting Lake, China—A Seasonal Study from 2017 to 2019

1
National Engineering Laboratory for Lake Pollution Control and Ecological Restoration, Chinese Research Academy of Environmental Sciences, Beijing 100012, China
2
State Environmental Protection Key Laboratory of Drinking Water Source Protection, Chinese Research Academy of Environmental Sciences, Beijing 100012, China
3
State Environmental Protection Scientific Observation and Research Station for Lake Dongting, Chinese Research Academy of Environmental Sciences, Yueyang 414000, China
4
School of Ecological and Environmental Sciences, East China Normal University, Shanghai 200241, China
5
Ecological and Environmental Monitoring Center of Dongting Lake of Hunan, Yueyang 414000, China
*
Author to whom correspondence should be addressed.
Water 2022, 14(11), 1674; https://doi.org/10.3390/w14111674
Submission received: 13 April 2022 / Revised: 15 May 2022 / Accepted: 20 May 2022 / Published: 24 May 2022
(This article belongs to the Special Issue Eutrophication Mechanism Evaluation)

Abstract

:
As it is the second-largest freshwater lake downstream of the Three Gorges Dam and an important international wetland for migratory birds, there have been concerns about the ecological water health of Dongting Lake for a long time. In the present study, we studied the evolutionary characteristics of water quality in Dongting Lake in three recent years. Moreover, the evolution rules and dominant groups of the phytoplankton community were explored, and the major influencing factors of phytoplankton and their distribution were assessed based on the field survey and detection data from 2017 to 2019. The results indicated that the water quality of Dongting Lake improved in recent years. The concentration of dissolved oxygen (DO) increased by 6.91%, whereas the concentrations of the five-day biochemical oxygen demand (BOD5), chemical oxygen demand (CODCr), ammonia nitrogen (NH4+–N), total phosphorus (TP), and total nitrogen (TN) decreased by 17.5%, 13.0%, 33.8%, 7.6%, and 13.3%, respectively. The mean phytoplankton density reached 4.15 × 10⁵ cells·L−1 in September 2017, whereas it was only 1.62 × 10⁵ cells·L−1 in December 2018. There were 15 dominant species belonging to Cyanobacteria, Chlorophyta, Bacillariophyta, Cryptophyta, and Miozoa. Moreover, Fragilaria radians (Kützing) D.M.Williams & Round and Aulacoseira granulata (Ehrenberg) Simonsen were the dominant populations in all seasons. The Pearson and linear regression analysis also indicated that the composition and distribution of phytoplankton in Dongting Lake were mainly affected by electrical conductivity (Cond), BOD5, potassium permanganate (CODMn), and CODCr, especially in Eastern Dongting Lake. Of course, NH4+–N, TN, and TP were also the main factors affecting the density and species of the phytoplankton community, especially in Western Dongting Lake. Finally, we suggested that local government could take “The relationship between Yangtze River and Dongting Lake”, “The relationship between the seven fed rivers and Dongting Lake”, and “The relationship between human activities and Dongting Lake” as the breakthrough points to guarantee the ecological flow, water environment, and ecological quality of Dongting Lake.

1. Introduction

Phytoplankton are primary producers in the food chain of aquatic ecosystems. Their life cycle is short, and the community structure changes with the change in the physical and chemical properties of water. Phytoplankton are widely used as an indicator of water environment quality in aquatic ecosystems [1,2,3,4,5]. Overgrowth of phytoplankton can lead to ecosystem damage and biodiversity loss [6]. Cyanobacteria bloom is a thorny environmental problem caused by the excessive growth of phytoplankton in recent years [7]. There are many adverse effects of the high bloom densities of cyanobacteria, such as the decrease in water quality, transparency, and growth of aquatic vegetation, which affect the stability of the lake ecosystem [8].
The phytoplankton community structure has been studied as the core for many decades. It is generally believed that nutrient accumulation is considered the driving force of cyanobacterial outbreaks and blooms in lakes [9]. Nutrients are considered to directly induce cyanobacteria bloom [10]. However, some researchers have found that reducing nutrient concentration does not reduce cyanobacteria density [11]. For example, in Taihu Lake of China, the cyanobacteria blooms were not reduced when the nutrient levels were significantly decreased during the past 10 years [12]. Therefore, the phytoplankton community is affected by many environmental factors. Many studies have been carried out on the effects of water quality parameters and other abiotic variables, such as water temperature, chemical oxygen demand, nutrients, pH, water levels, transparency [13,14,15,16,17,18,19,20,21,22,23], and especially the water residence time, which can act as the primary contributor of eutrophication in the lake and reservoir [24,25]. The extension of water residence time is conducive to retaining and accumulating nutrients in the lake, providing good conditions for algal growth. Therefore, it is necessary to determine the relationship between human activities and lake ecosystems when assessing the influence of main driving factors on phytoplankton communities [26,27].
Dongting Lake, located at 28°30′–30°20′ N and 111°40′–113°40′ E in the middle Yangtze River region, is the first and second largest freshwater lake downstream of the Three Gorges Dam and an important international wetland for migratory birds, with the lake area of 2625 km2, the total volume of 174 × 108 m3, and the basin area of 25.72 × 10⁴ km2 [28,29]. It is also a critical ecological zone and on the list of Ramsar Wetlands of International Importance in the world designated by WWF. Dongting Lake is fed by seven rivers, covering four tributaries (Xiang River, Zi River, Yuan River, and Li River) and three outlets of the Yangtze River (Songzi River, Hudu River, and Ouchi River), and its outflow returns into the Yangtze River from Chenglingji section, which plays a vital role in flood control and storage, biodiversity protection, water supply, and climate regulation [30,31]. However, in the past 30 years, due to social and economic development and resource exploitation, the problems of water shortage, seasonal drought, water quality deterioration, and eutrophication in Dongting Lake have gradually emerged, seriously threatening the health of the lake ecosystem and the sustainable development of the basin [32,33,34,35,36,37].
In the present study, we hypothesized that environmental changes led to significant changes in phytoplankton in recent years. Therefore, we analyzed the three-year (2017–2019) data based on the seasonal monitoring of Dongting Lake. We mainly aimed to assess (1) the evolution trend of phytoplankton community distribution, diversity, and environmental parameters; (2) how phytoplankton density, species, and biodiversity responded to changes in environmental parameters; (3) the main affecting parameters of phytoplankton community distribution. Finally, we suggested that the local government management departments take correct measures against the current problems and influencing factors to ensure the water ecological security of Dongting Lake.

2. Materials and Methods
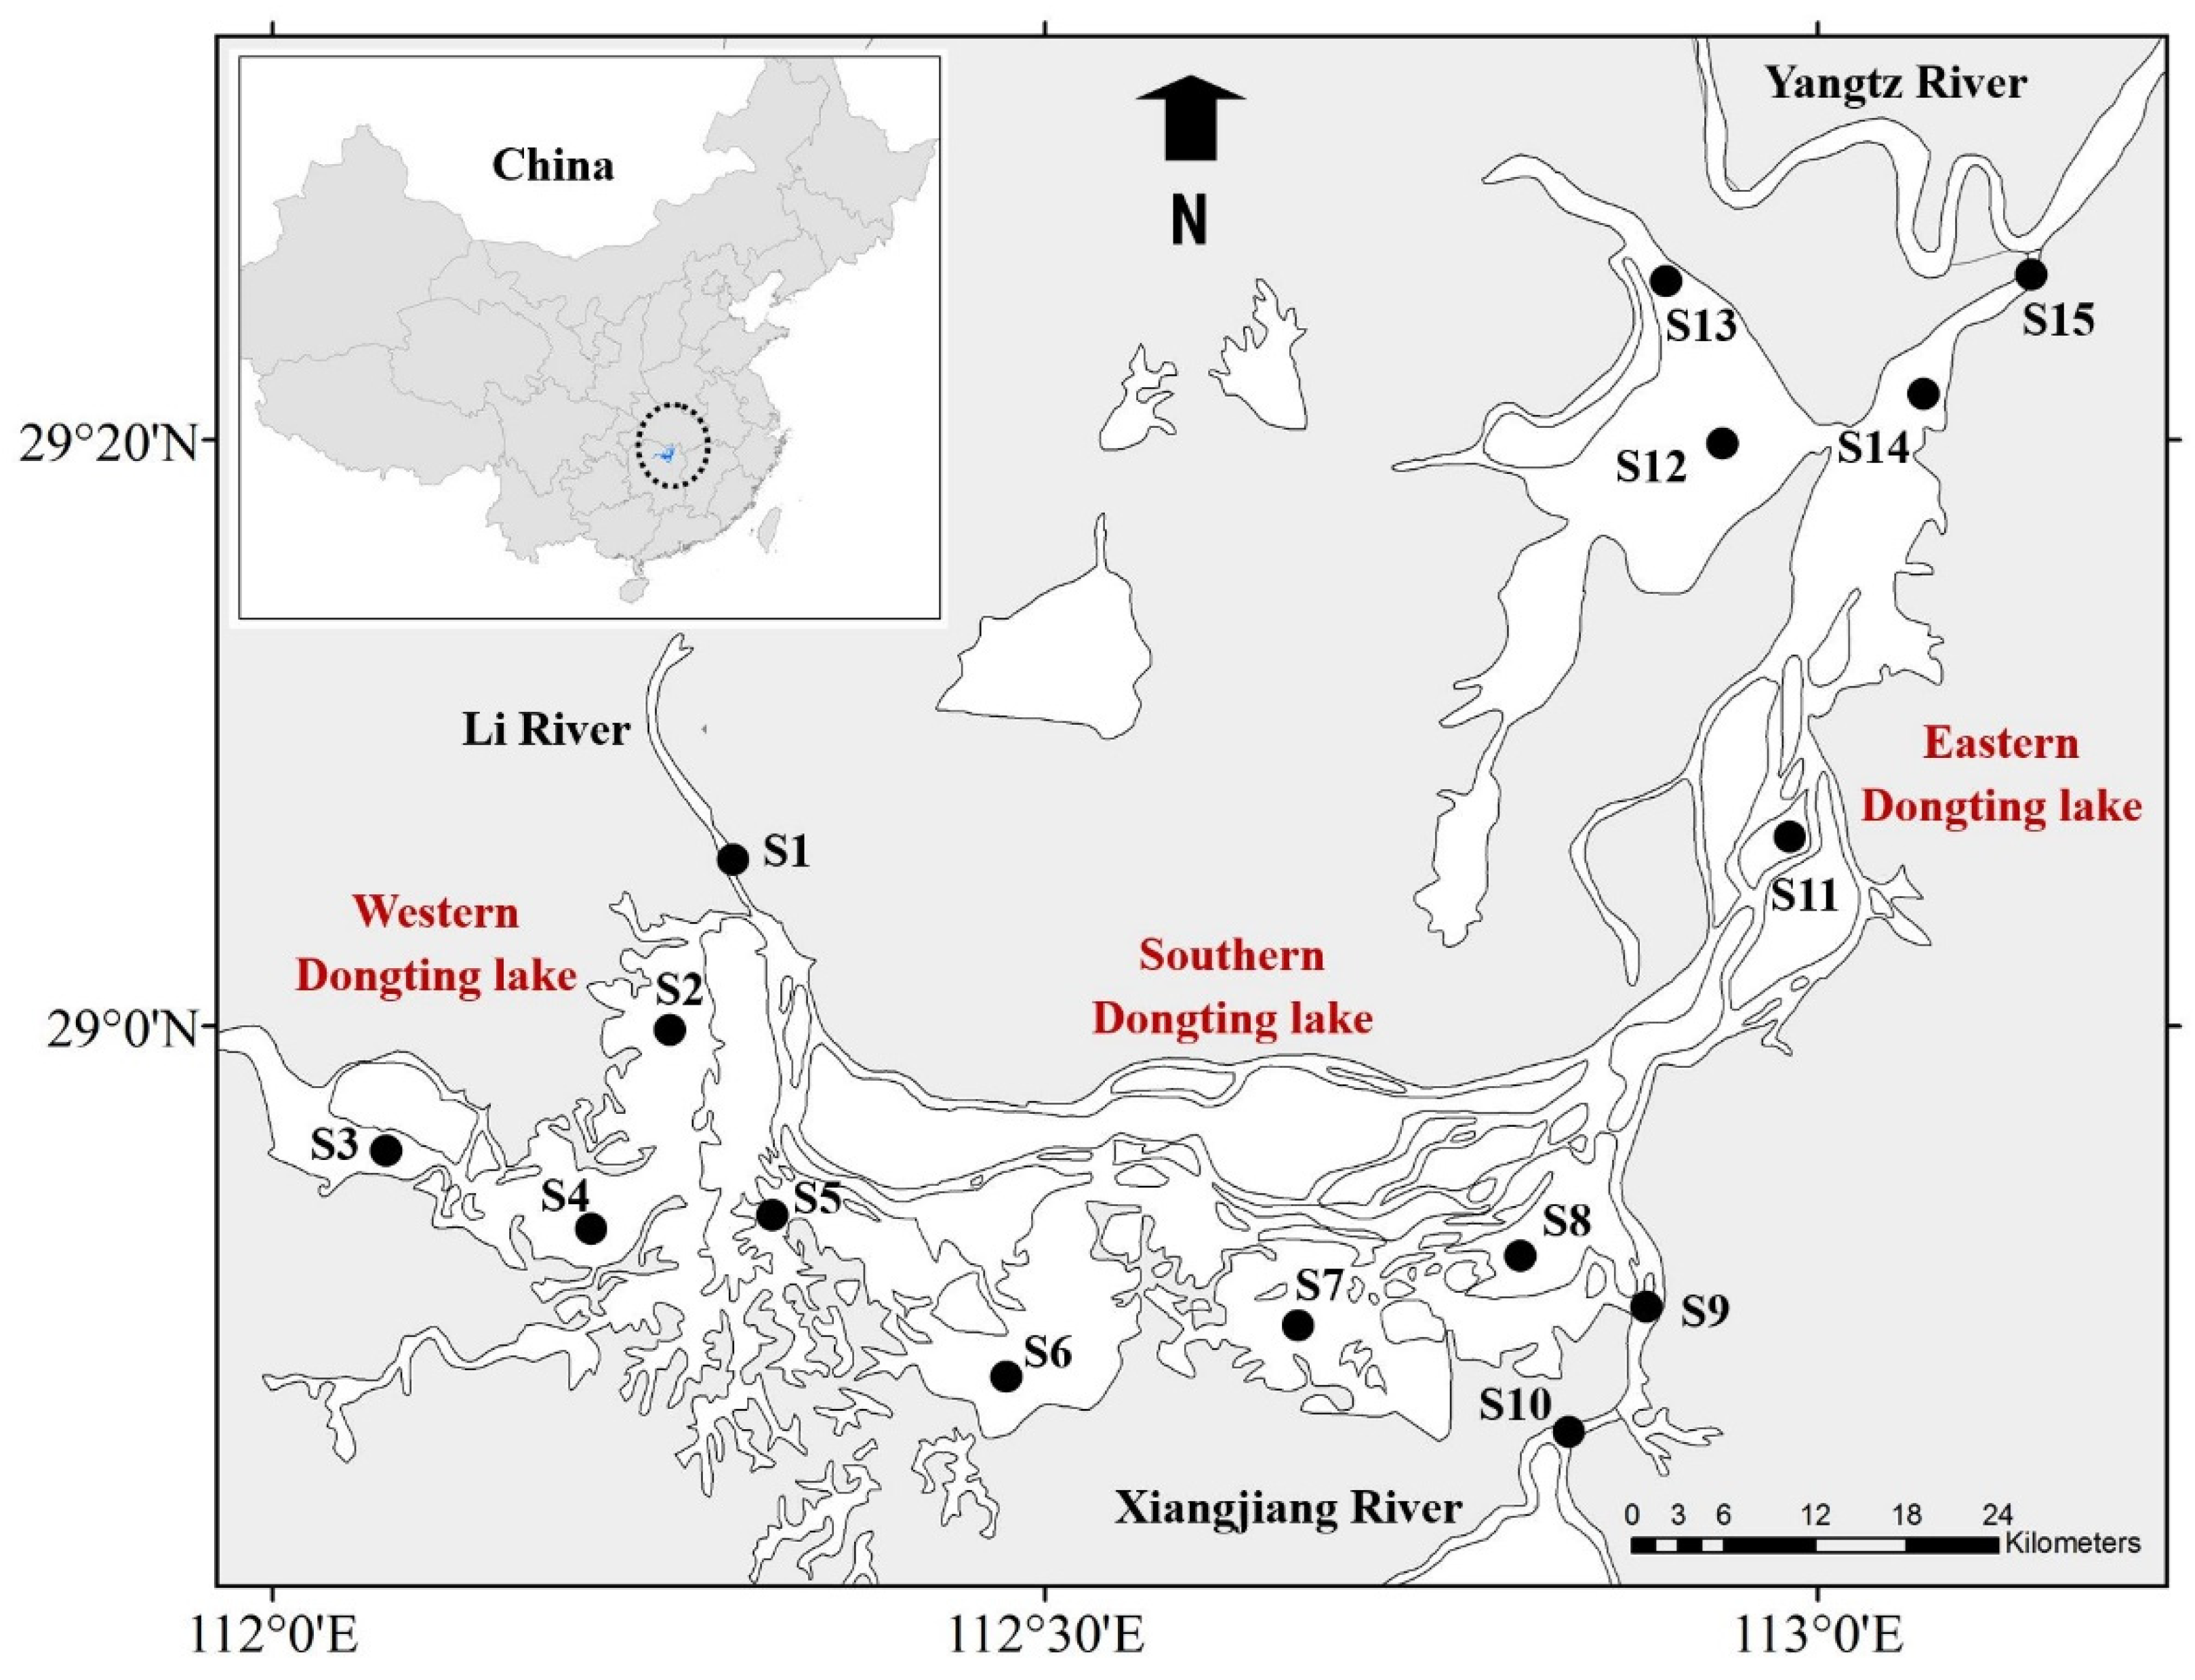
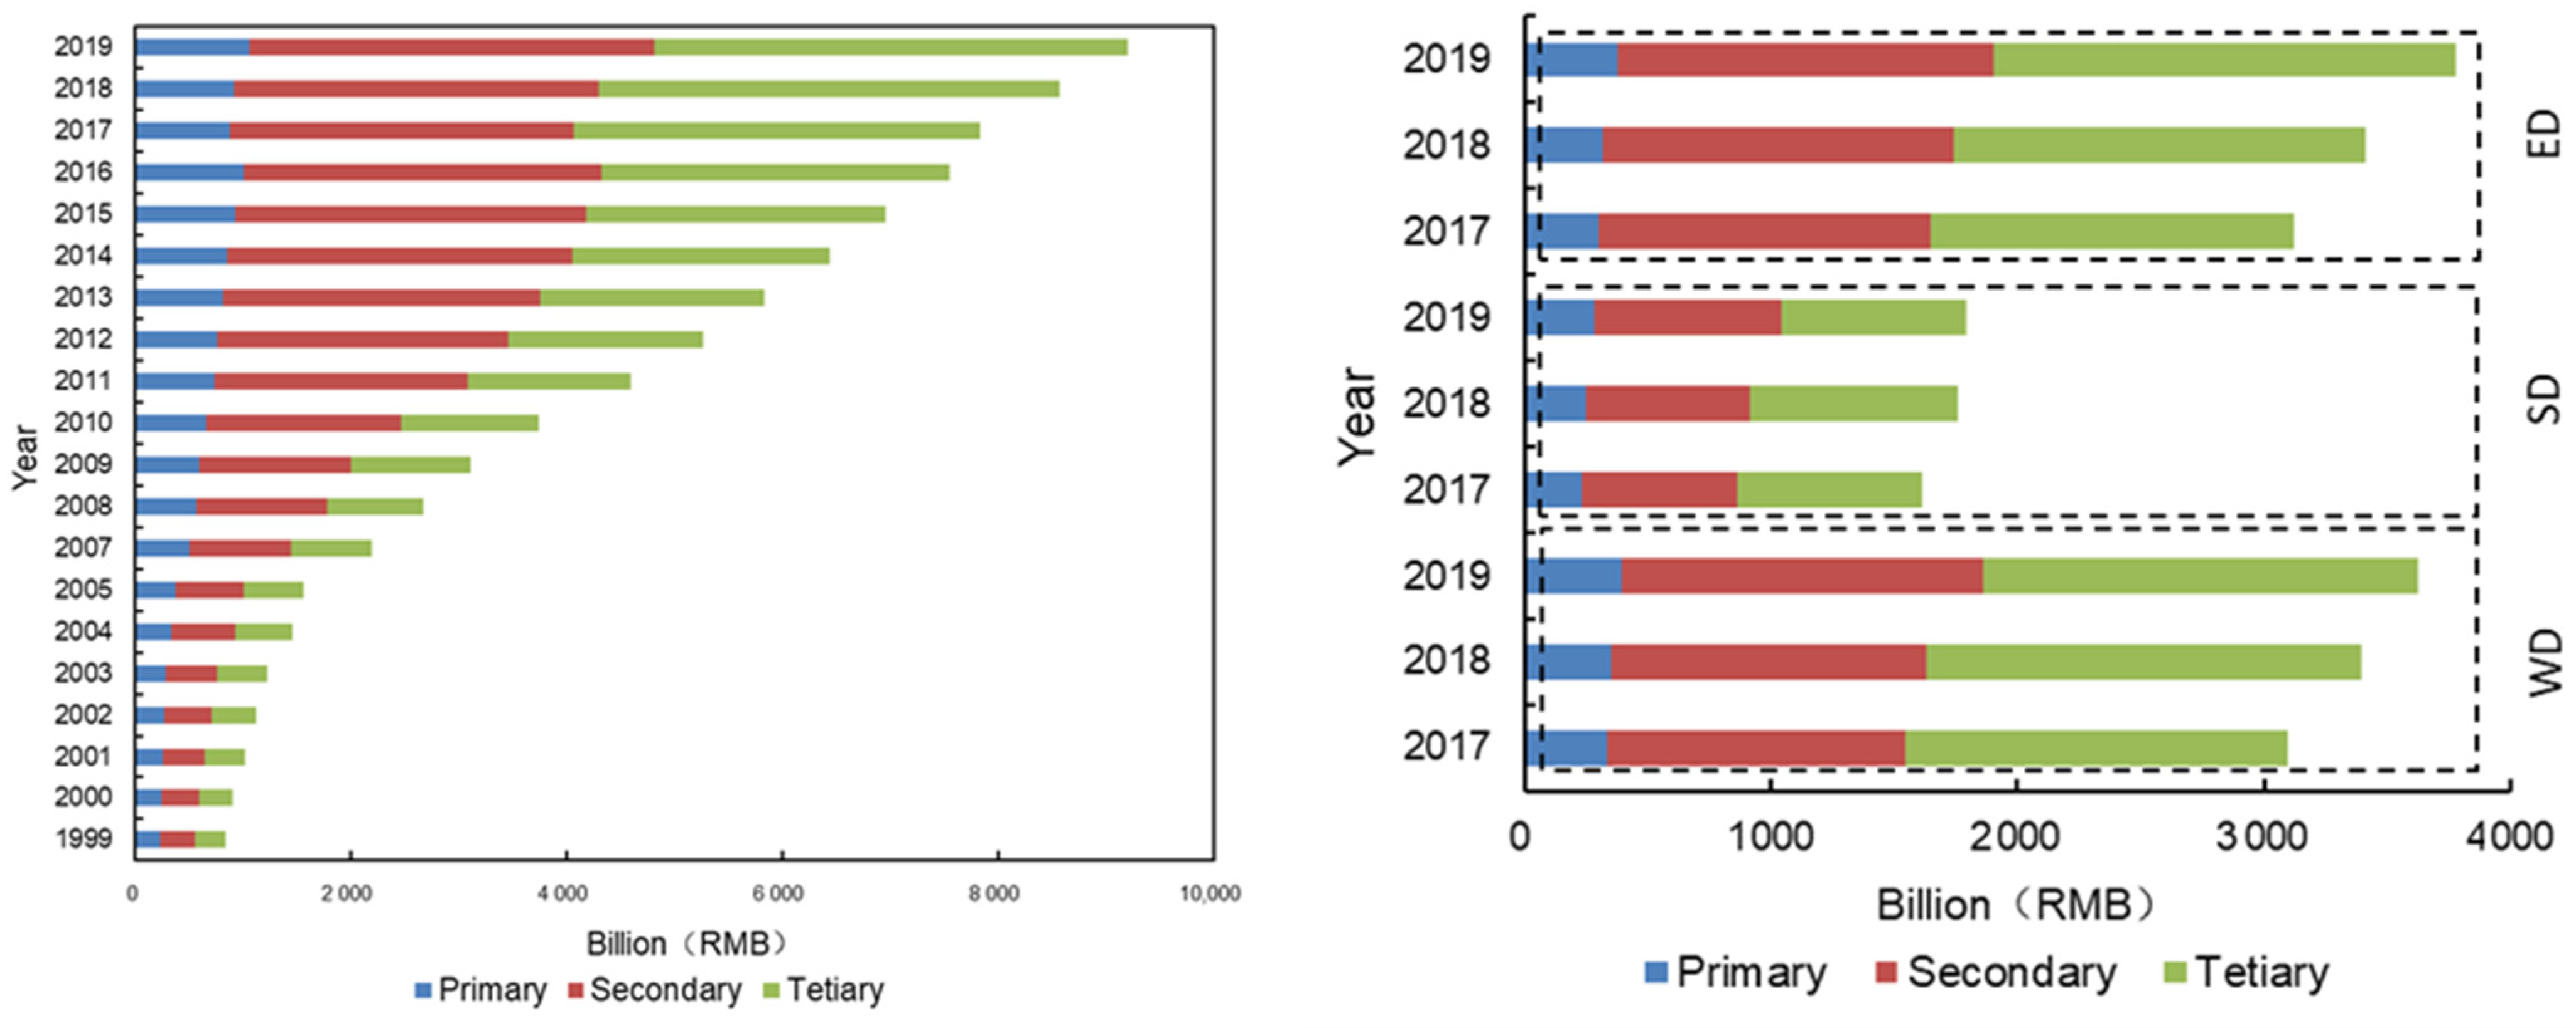
2.1. Study Area

Dongting Lake is one of the lakes with a considerable water level fluctuation in China, especially in the Yangtze River Basin. The lake’s elevation is 33.5 m, while the annual average water level is between 24.00 m and 31.00 m, and the average water depth is 6.7 m, with the deepest point at 15 m. The average pH value of the whole lake is 7.54, which is weakly alkaline. Dongting Lake is a typical alluvial silting plain dominated by onshore composite Delta, which belongs to the subtropical humid monsoon climate area. Therefore, monsoon circulation is the primary weather system controlling the climate of Dongting Lake. The annual average temperature of Dongting Lake is between 16.4 and 17.0 °C, while the annual average precipitation is between 1200 mm and 1450 mm, and the annual average evaporation (water surface evaporation) is about 1270 mm. Dongting Lake is in a mesotrophic to slightly eutrophic state.
A total of 15 sampling sites were set up in Dongting Lake (DL): Shahekou (S1), Nanzui (S2), Potou (S3), Jiangjiazui (S4), and Xiaohezui (S5), representing Western Dongting Lake (WD); Wanzi Lake (S6), Wanjiazui (S7), Hengling Lake (S8), Yugongmiao (S9), and Zhangshugang (S10), representing Southern Dongting Lake (SD); Lujiao (S11), East-Dongting Lake (S12), Big-small West Lake (S13), Yueyanglou (S14), and Dongting Lake outlet (S15), representing Eastern Dongting Lake (ED). Figure 1 illustrates the overall situation of the study area in Dongting Lake. In detail, the average water depth in S2 and S3 was 6 m, with the bottom mainly composed of yellow and black sand, whereas it was 8 m in S4 and S6, with water and yellow silt on the bottom. The average water depth was 5 m in S9 and S11, with the bottom mainly composed of yellow sand, whereas it was 8 m in S8, with water and yellow silt on the bottom. The average water depth was 10 m in S12, S13, and S15, with the bottom mainly composed of yellow silt.

2.2. Sampling and Analyses

Sampling was carried out seasonally from 2017 to 2019 at 15 sites, and 178, 60, 58, and 60 samples were obtained in Dongting Lake, Western Dongting Lake, Southern Dongting Lake, Eastern Dongting Lake, respectively. Water specimens were collected from the surface to bottom (three depths) at each site, fixed, refrigerated, and stored in the dark as required before transportation, and follow-up operations were completed within the specified time. A portable multiparameter detector for water quality was used to measure the real-time water temperature (WT), electrical conductivity (Cond), dissolved oxygen (DO), and pH in real time at each sampling site. In addition, the five-day biochemical oxygen demand (BOD5) was determined by the standard dilution method, the potassium permanganate (CODMn) was measured by the permanganate index method, the chemical oxygen demand (CODCr) was measured by potassium dichromate method, the ammonia nitrogen (NH4+–N) was measured by Nessler’s reagent spectrophotometry, the total phosphorus (TP) was measured by ammonium molybdate spectrophotometry, and the total nitrogen (TN) was measured by alkaline potassium persulfate ultraviolet spectrophotometry [38].
The sampling of phytoplankton in both left and right sides of each site was carried out from bottom to top in the water column with a 25-mesh sieve. Collected organisms were stored in 1.5% (v/v) Lugol’s and kept in a cylindrical separating funnel with a volume of 1 L. The supernatant was gradually sucked through a siphon until the volume of the water sample was concentrated to 10 mL less than the constant volume, the bottle piston was unscrewed, and it was transferred into the sample bottle. The supernatant was taken and shaken to the final volume of 30 mL. The concentrated plankton sample was shaken evenly, a 0.1 L sample was placed in the plankton counting box for identification and counting, and then ×300 cells were counted using a microscope under the magnification of 400× (40× on the lens and 10× on eyepiece) and identified to the lowest taxonomic level (genus or species). Taxonomic identification was performed according to a previously described method [39] and AlgaeBase (www.alagebase.org, accessed on 20 February 2022). Meanwhile, the experts were invited to verify identification results.

2.3. Data Analysis

The phytoplankton diversity, evenness, and dominance were investigated according to previously described methods [40,41,42,43]. The biological diversity (H′), evenness (J), richness (D), and dominance (Y) were calculated according to the following equations:
H = i = 1 S ( N i / N ) log 2 ( N i / N )
D = ( S 1 ) / ln N
J = H / ln S
Y = f i × ( N i / N )
where Ni is the number of individuals of the ith species, N is the total number of individuals, S is the total species, and fi is the occurrence frequency of the ith species. The species were defined as dominant when the value of Y was above 0.02 [44]. The number of species evaluated was based on the sum of all species observed in the sample.
Pearson correlation analysis was carried out to assess the relationship between environmental parameters and the abundance, species, diversity indices, and evenness of phytoplankton using SPSS 2020, which was also used for linear regression and curve estimation. Moreover, a univariate linear regression analysis was conducted. The regression equation was established, including two variables. One was the independent variable, expressed in x, and the other one was the dependent variable (predictive variable), represented by y. All figures were drawn by Origin 2018.

3. Results

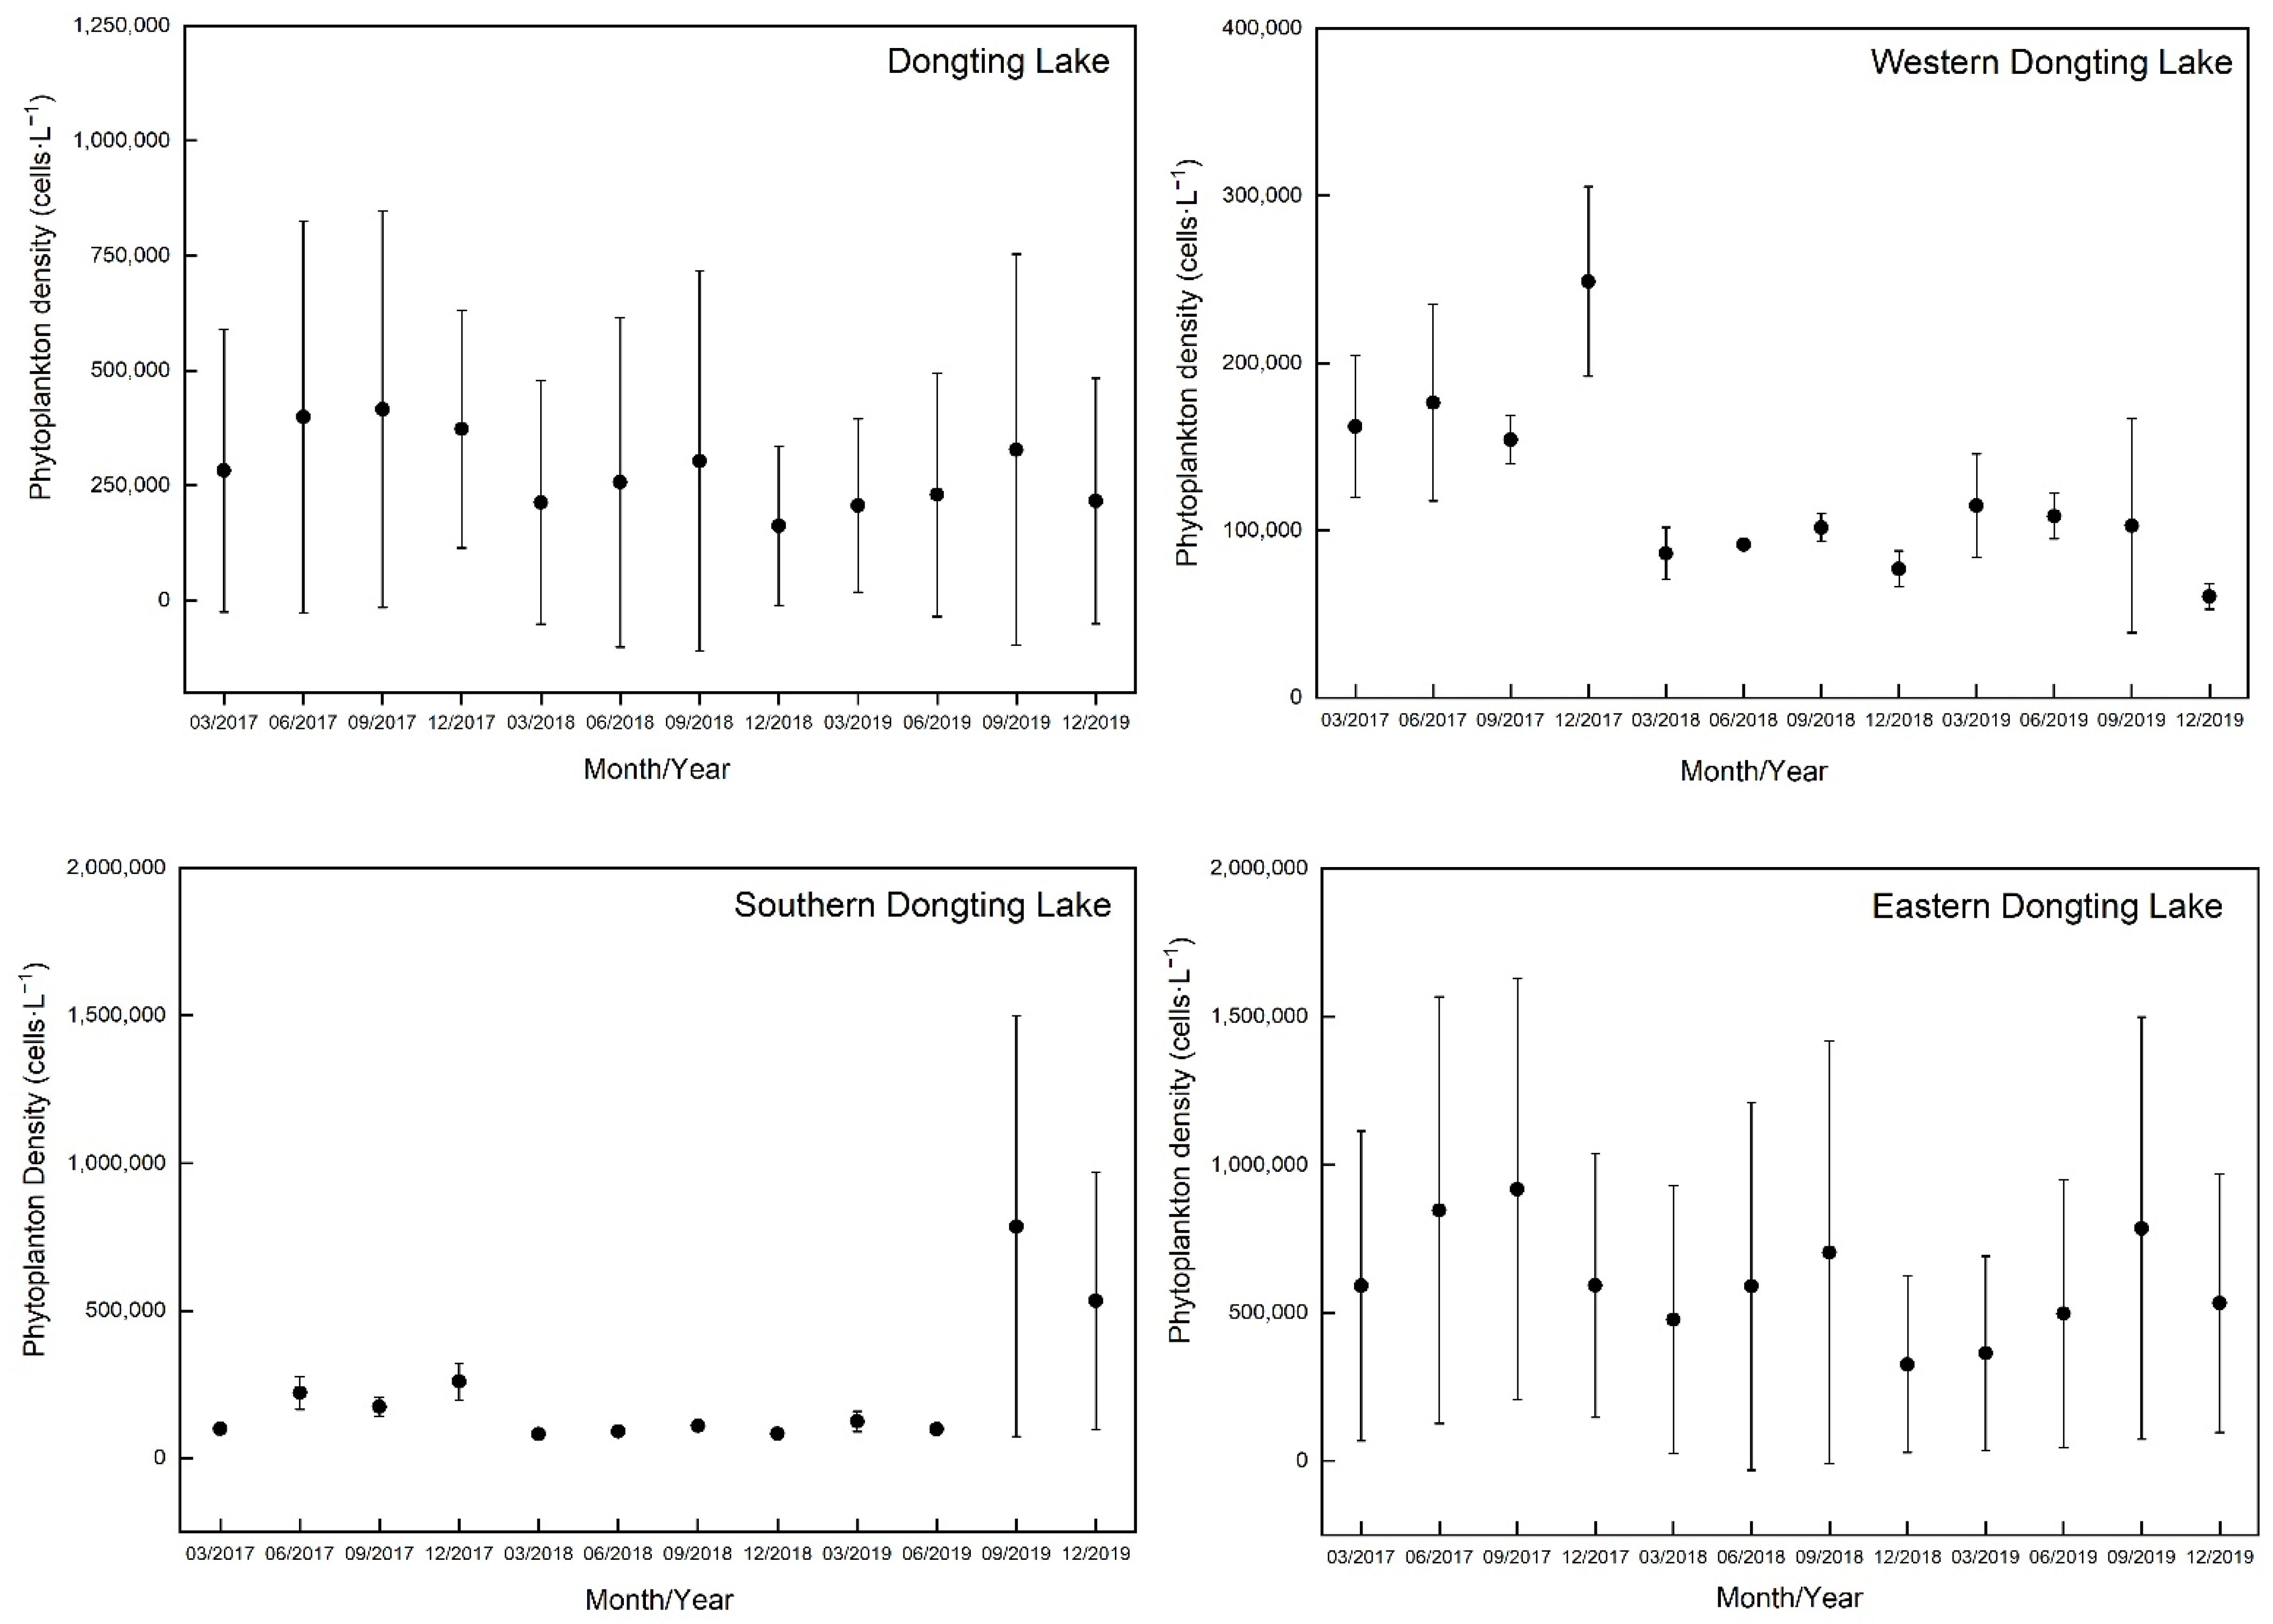
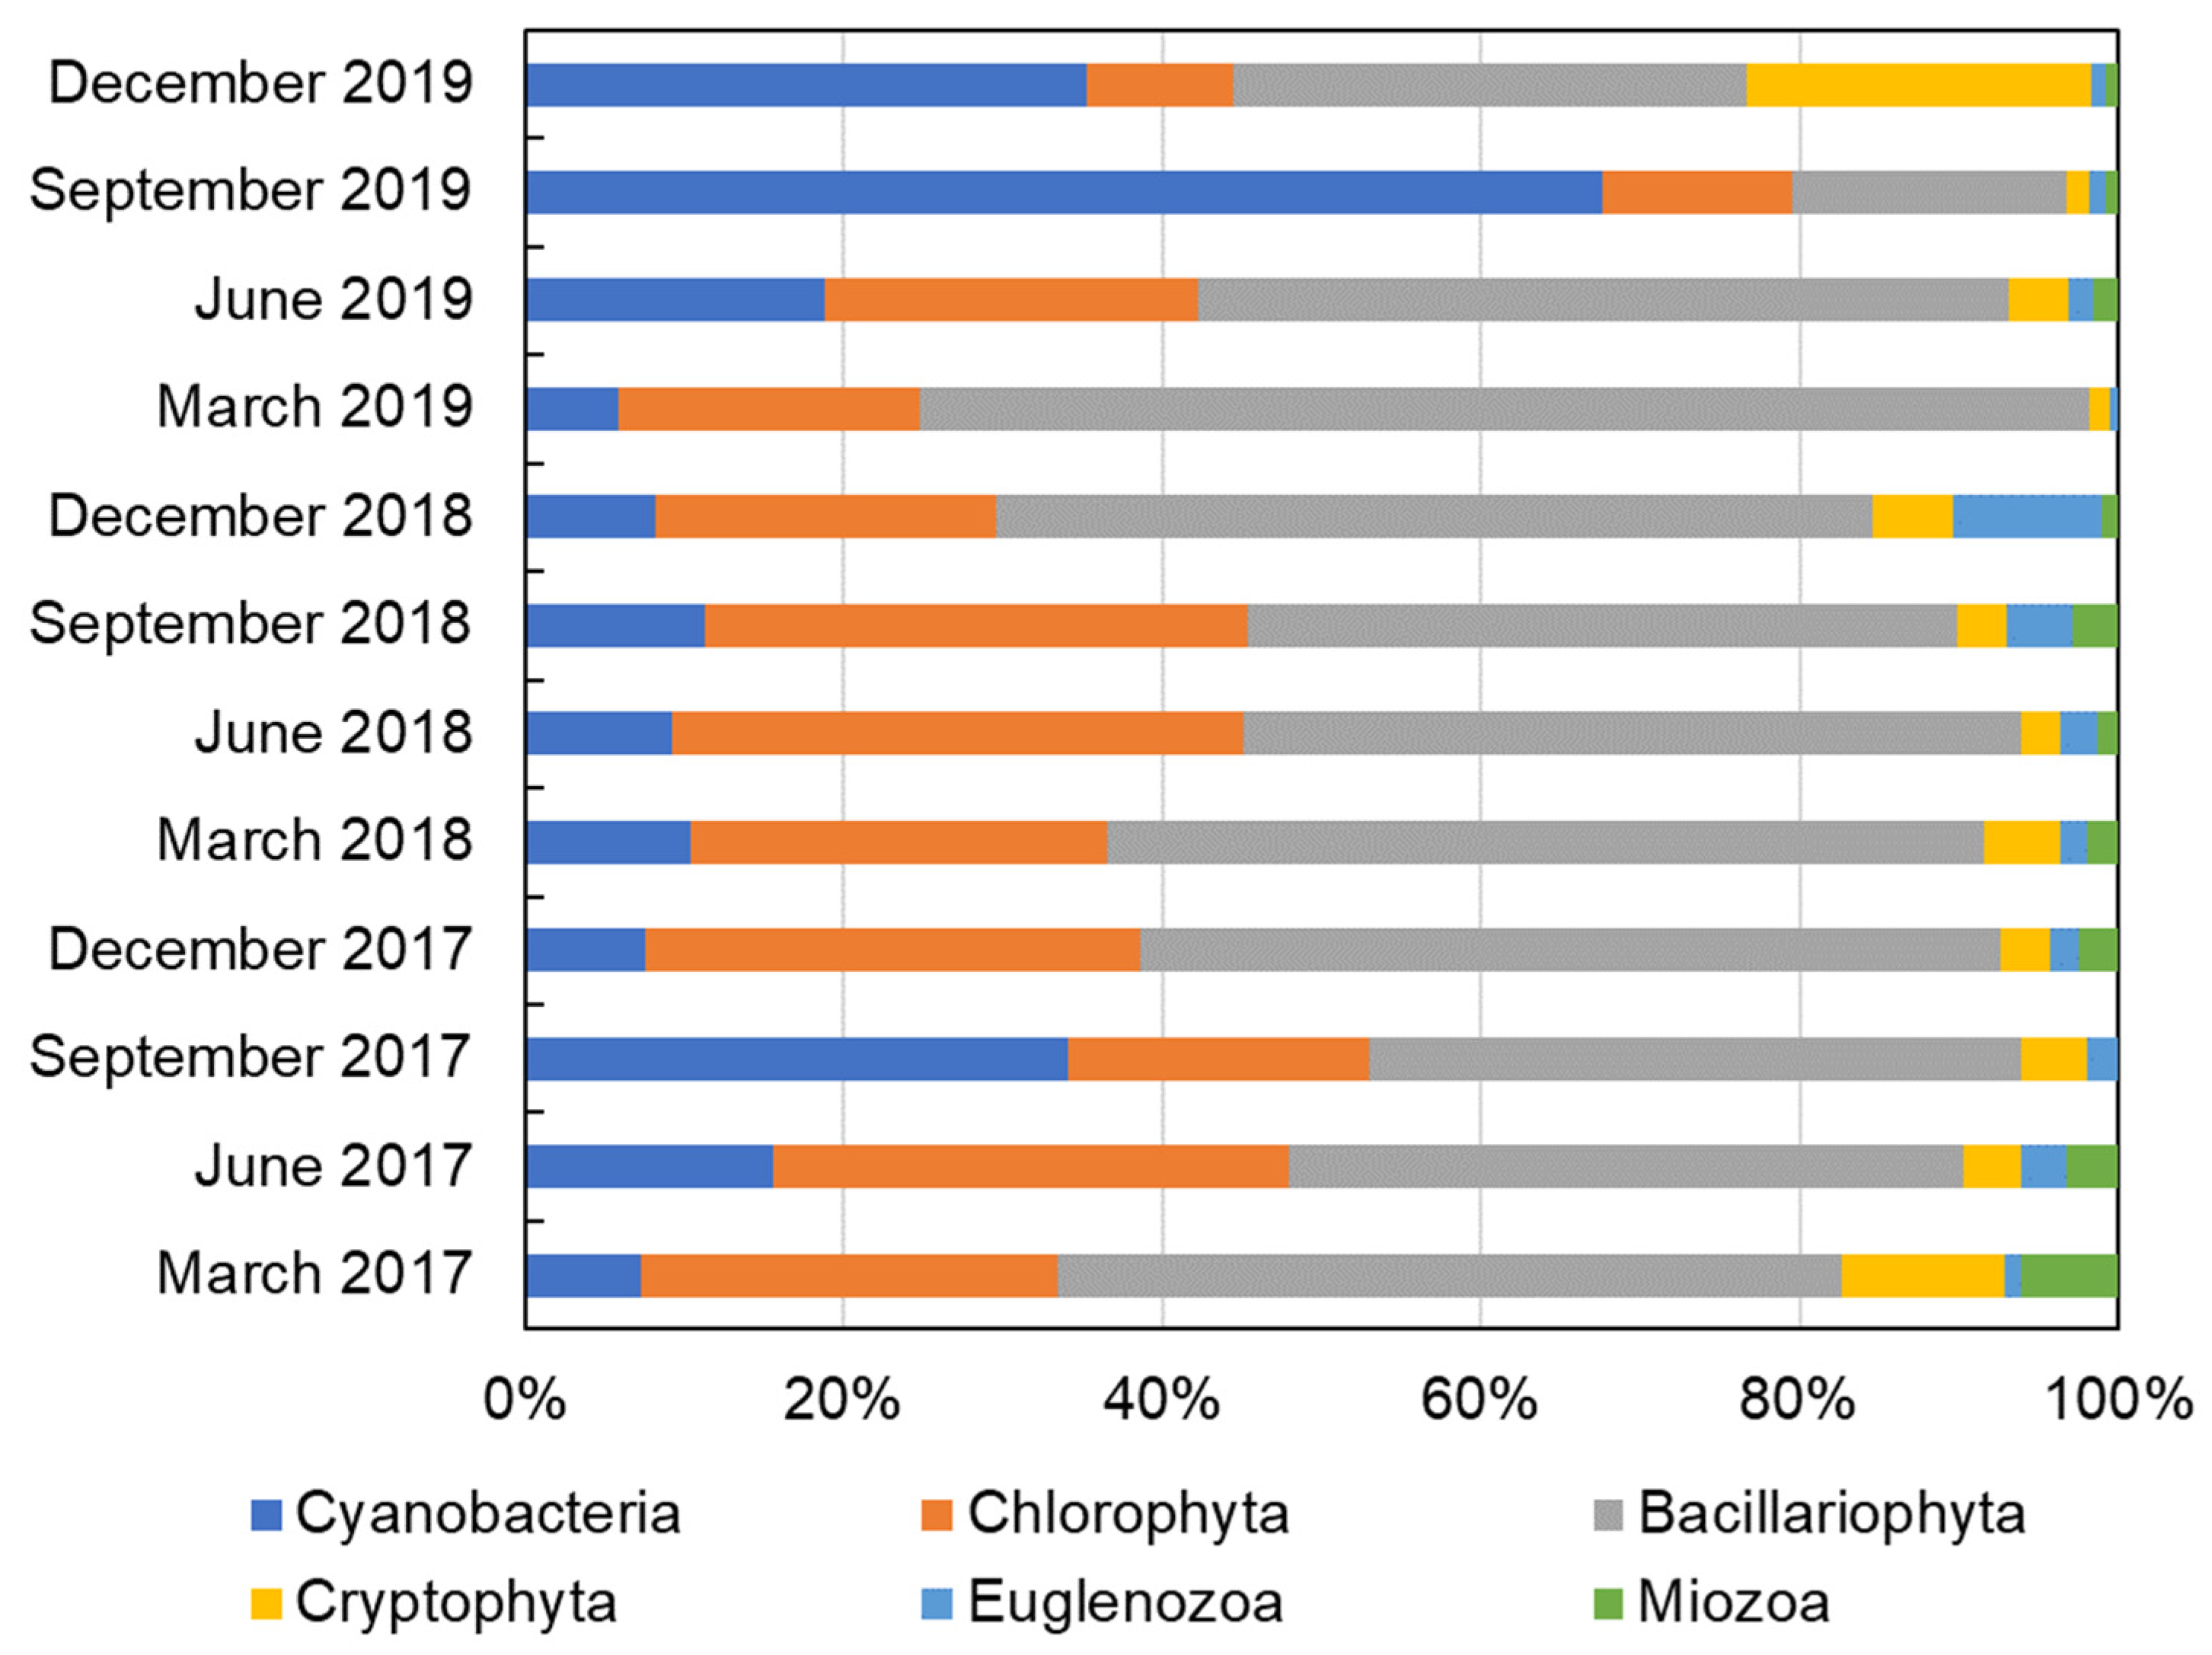
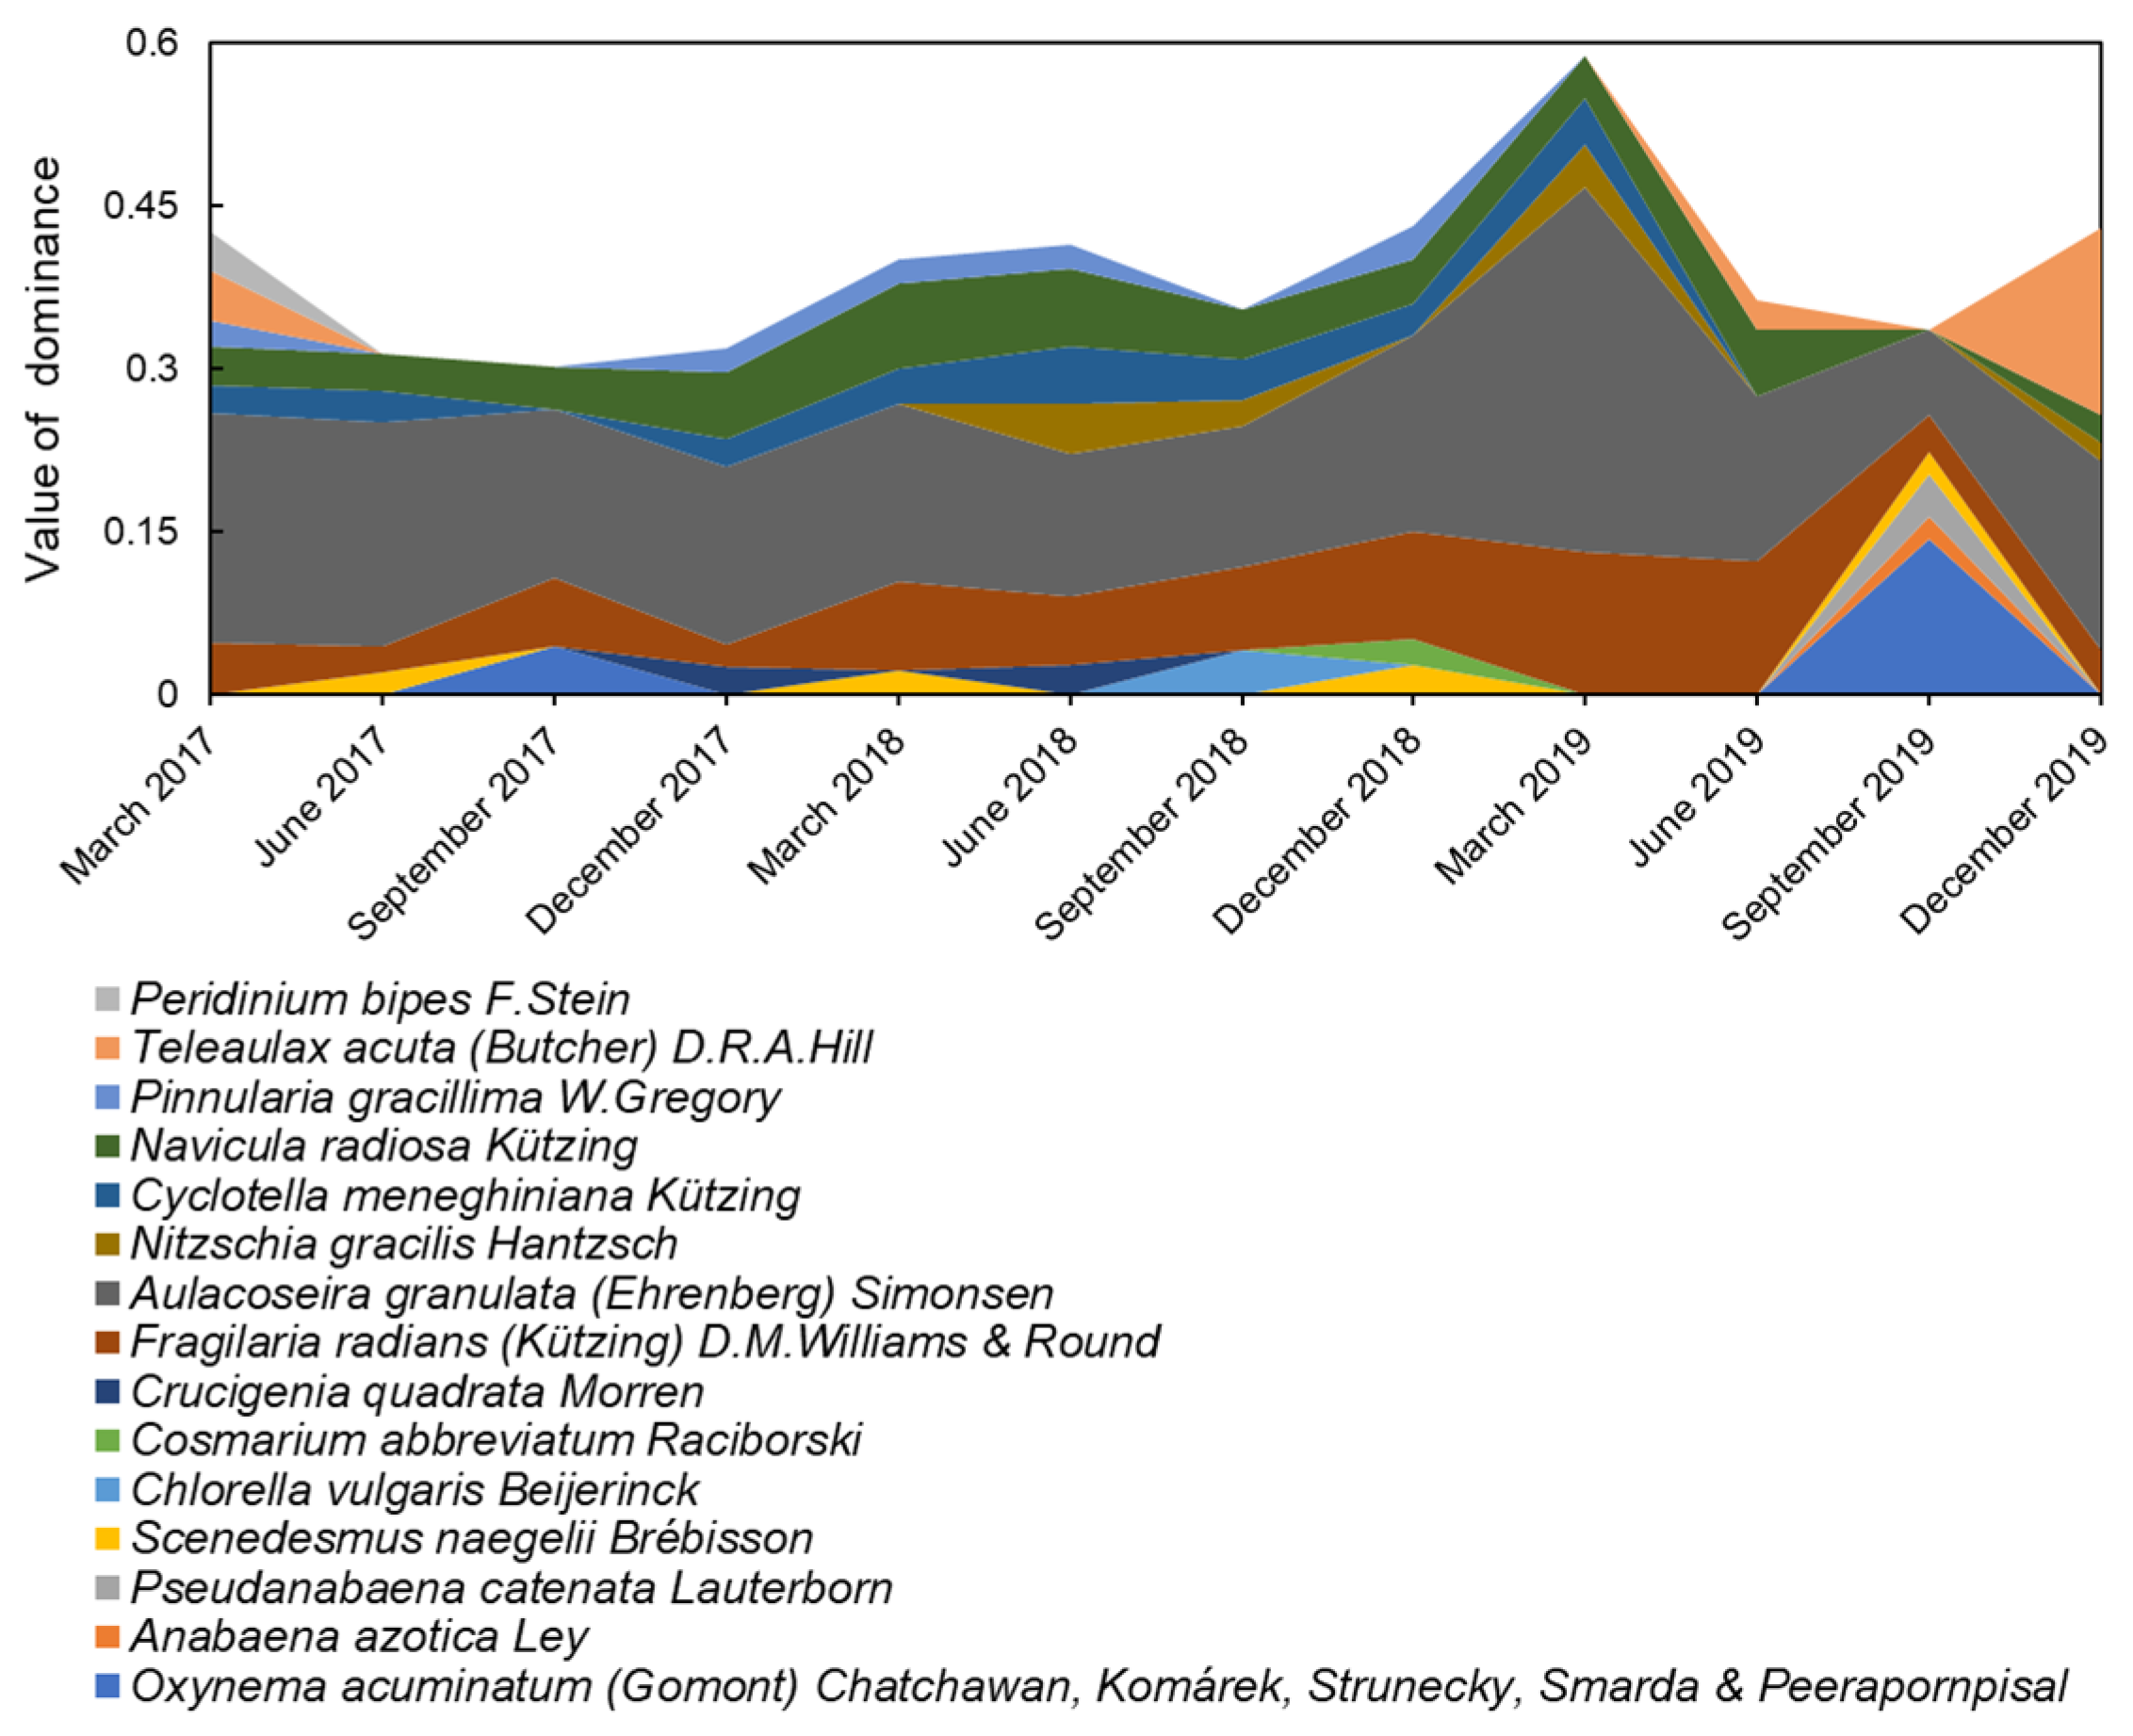
3.1. Phytoplankton Community and Dominant Genera

In the present study, we identified 67 genera of phytoplankton belonging to six phyla in Dongting Lake (Table S1). Figure 2 shows that the density of phytoplankton gradually increased from spring to summer (March, June, and September), and it significantly decreased from autumn to winter (December). The density of phytoplankton was higher in Eastern Dongting Lake compared with Western and Southern Dongting Lake. The mean phytoplankton density reached 4.15 × 10⁵ cells·L−1 in September 2017, whereas it was only 1.62 × 10⁵ cells·L−1 in December 2018. Bacillariophyta and Chlorophyta were the most abundant taxonomic groups from March 2017 to June 2019, whereas Cyanobacteria became the dominant group in the summer, with a peak value of 3.33 × 10⁶ cells·L−1 in September 2019. In addition, Cryptophyta was the dominant group only in the winter (December) of 2019 (Figure 3).
There were 15 dominant species that belonged to five phyla from March 2017 to December 2019, with the dominance ranging from 0.020 to 0.143, 0.021 to 0.041, 0.020 to 0.337, 0.020 to 0.048, and 0.020 to 0.036 in Cyanobacteria, Chlorophyta, Bacillariophyta, Cryptophyta, and Miozoa, respectively. Fragilaria radians (Kützing) D.M.Williams & Round and Aulacoseira granulata (Ehrenberg) Simonsen were the dominant populations in all seasons, and the dominant area of Aulacoseira granulata (Ehrenberg) Simonsen could reach a peak of 0.337 in March 2019. In addition, Oxynema acuminatum (Gomont) Chatchawan, Komárek, Strunecky, Smarda & Peerapornpisal, Anabaena azotica Ley, and Pseudanabaena catenata Lauterborn became dominant species in September 2019 (Figure 4).

3.2. Environmental Parameters

Table 1 shows that the environmental parameters of Dongting Lake changed significantly. The WT changed obviously among seasons, with a minimum of 8.76 °C in March 2019, whereas the maximum of 31.44 °C was found in September 2018. The mean pH value was relatively stable, ranging from 7.51 to 7.89. The mean values of Cond, DO, NH4+–N, and TN concentrations were higher in March and December (dry season) compared with June and September (wet season), whereas the mean value of CODCr concentration was higher in June and September compared with March and December. The mean values of CODMn (between 2.1 mg/L and 2.5 mg/L) and TP (between 0.06 mg/L and 0.09 mg/L) concentrations showed no noticeable difference in different seasons. The mean concentration of BOD5 showed an apparent downward trend from 2017 (between 1.62 mg/L and 2.18 mg/L) to 2019 (between 1.44 mg/L and 1.71 mg/L).

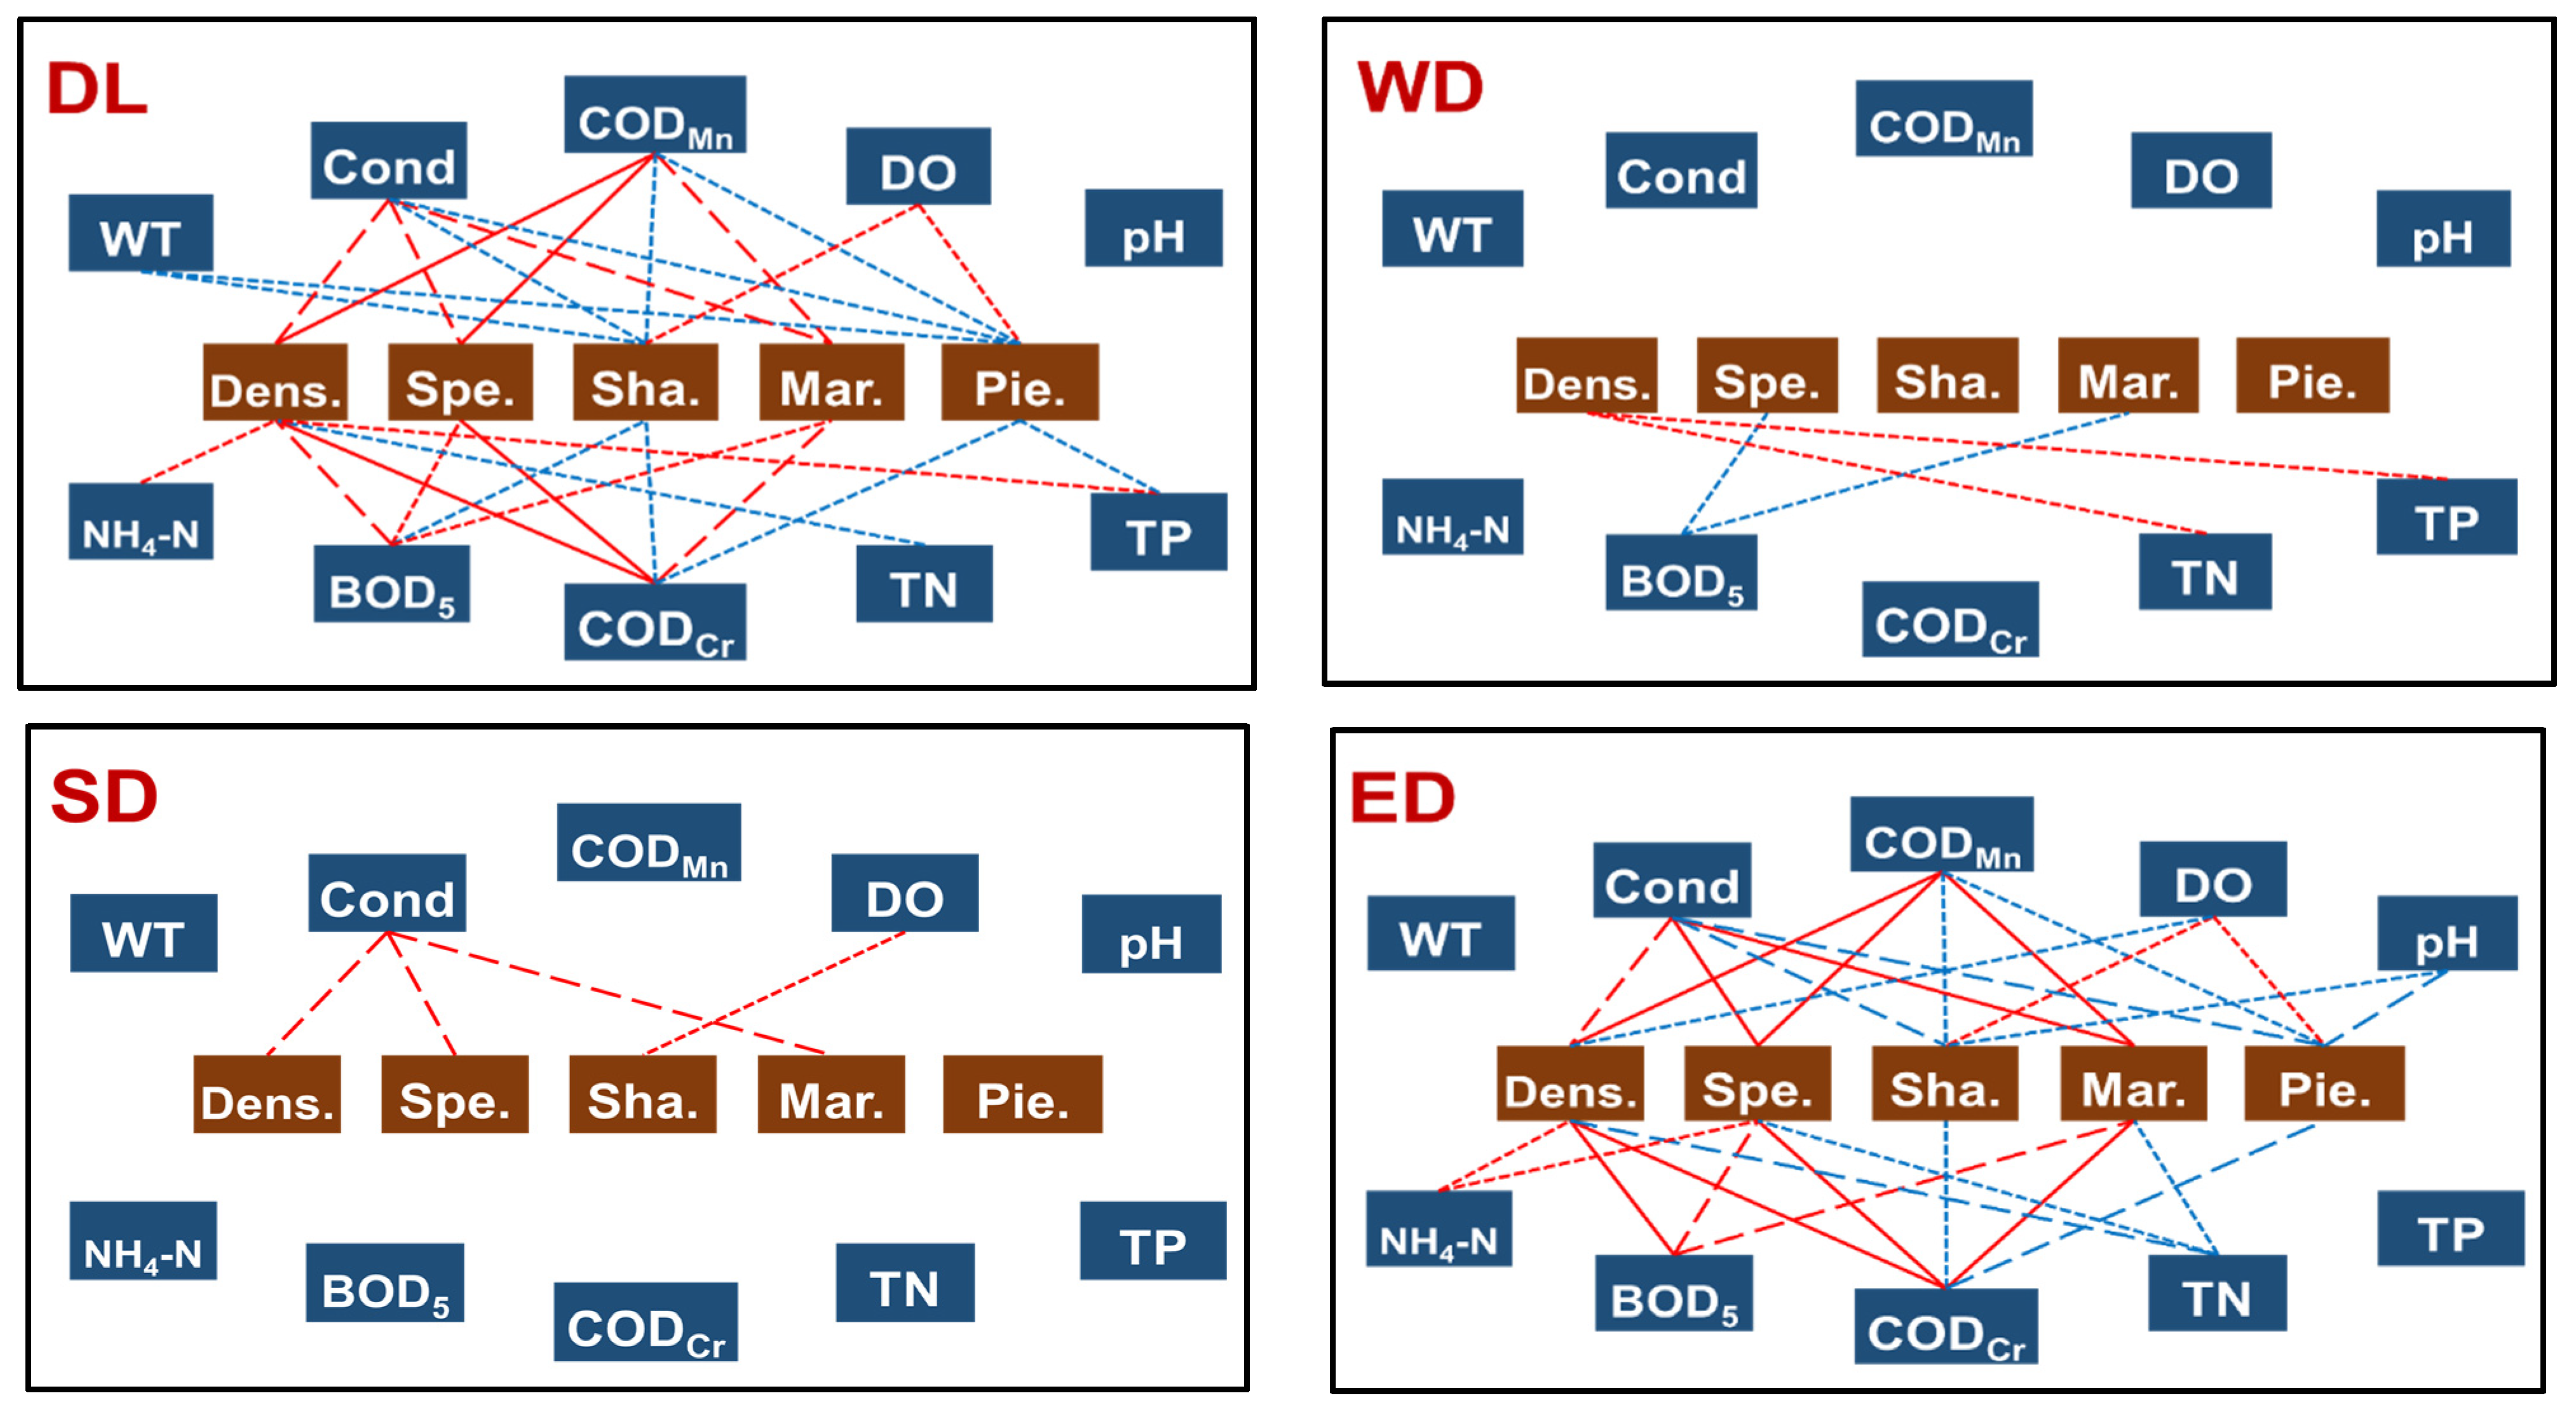
3.3. Relationship between Phytoplankton and Water Quality

In DL, the Pearson analysis indicated that the phytoplankton density was positively related to Cond (R = 0.486, p < 0.05), CODMn (R = 0.857, p < 0.01), BOD5 (R = 0.581, p < 0.05), CODCr (R = 0.849, p < 0.01), NH4+–N (R = 0.202, p < 0.05), and TP (R = 0.270, p < 0.05), whereas it was negatively related to TN (R = −0.168, p < 0.05). Moreover, the phytoplankton species was positively related to Cond (R = 0.521, p < 0.05), CODMn (R = 0.719, p < 0.01), BOD5 (R = 0.378, p < 0.05), and CODCr (R = 0.717, p < 0.01). In addition, the phytoplankton diversity was negatively related to WT (R = −0.161, p < 0.05), Cond (R = −0.181, p < 0.05), CODMn (R = −0.226, p < 0.05), BOD5 (R = −0.159, p < 0.05), and CODCr (R = −0.281, p < 0.05), whereas it was positively related to DO (R = 0.238, p < 0.05). The phytoplankton richness was positively related to Cond (R = 0.477, p < 0.05), CODMn (R = 0.622, p < 0.05), BOD5 (R = 0.284, p < 0.05), and CODCr (R = 0.615, p < 0.05), and the phytoplankton evenness was negatively related to WT (R = −0.167, p < 0.05), Cond (R = −0.243, p < 0.05), CODMn (R = −0.291, p < 0.05), CODCr (R = −0.335, p < 0.05), and TP (R = −0.157, p < 0.05), whereas it was positively related to DO (R = 0.226, p < 0.05) (Figure 5; Table S2; Figures S1, S3–S10).
Figure 5 also shows that the phytoplankton density was positively related to TN (R = 0.255, p < 0.05) and TP (R = 0.275, p < 0.05), whereas the species (R = −0.353, p < 0.05) and richness (R = −0.341, p < 0.05) were negatively related to BOD5 in WD. The phytoplankton density (R = 0.507, p < 0.05), species (R = 0.501, p < 0.05), and richness (R = 0.448, p < 0.05) were positively related to Cond, and the diversity was positively related to DO (R = 0.298, p < 0.05) in SD (Table S2; Figures S3, S4, S6, S9 and S10).
In addition, the phytoplankton density was positively related to Cond (R = 0.612, p < 0.05), CODMn (R = 0.889, p < 0.01), BOD5 (R = 0.711, p < 0.01), CODCr (R = 0.881, p < 0.01), and NH4+–N (R = 0.315, p < 0.05), whereas it was negatively related to DO (R = −0.267, p < 0.05) and TN (R = −0.408, p < 0.05). The phytoplankton species was positively related to Cond (R = 0.733, p < 0.01), CODMn (R = 0.793, p < 0.01), BOD5 (R = 0.602, p < 0.05), CODCr (R = 0.788, p < 0.01), and NH4+–N (R = 0.273, p < 0.05), whereas it was negatively related to TN (R = −0.339, p < 0.05). Moreover, the phytoplankton diversity was negatively related to pH (R = −0.369, p < 0.05), Cond, (R = −0.428, p < 0.05), CODMn (R = −0.316, p < 0.05), and CODCr (R = −0.373, p < 0.05), whereas it was positively related to DO (R = 0.257, p < 0.05). In addition, the phytoplankton richness was positively related to Cond (R = 0.710, p < 0.01), CODMn (R = 0.710, p < 0.01), BOD5 (R = 0.515, p < 0.05), and CODCr (R = 0.707, p < 0.01), whereas it was negatively related to TN (R = −0.291, p < 0.05). Moreover, the phytoplankton evenness was negatively related to pH (R = −0.425, P < 0.05), Cond (R = −0.476, p < 0.05), CODMn (R = −0.370, p < 0.05), and CODCr (R = −0.424, p < 0.05), whereas it was positively related to DO (R = 0.283, p < 0.05) (Figure 5; Table S2; Figures S2–S10).

4. Discussion

4.1. Temporal and Spatial Evolution Characteristics of Phytoplankton and Physicochemical Parameters

Our data indicated that the phytoplankton density in Dongting Lake decreased obviously from 2017 to 2019, especially in Western Dongting Lake, which was closely related to the improvement of water quality in Dongting Lake in recent years. For example, the concentration of DO increased by 6.91%, whereas the concentrations of BOD5, CODCr, NH4+–N, TN, and TP decreased by 17.5%, 13.0%, 33.8%, 7.6%, and 13.3%, respectively. In addition, the phytoplankton density in Eastern Dongting Lake was significantly higher compared with Western and Southern Dongting Lake. Such difference could be explained by the fact that the Big-small West Lake site of Eastern Dongting Lake was in the backwater area, with a significantly lower water velocity compared with other areas, resulting in the significantly higher phytoplankton density of this site compared with other sites.
Bacillariophyta, Cyanobacteria, and Miozoa are usually dominant in mesotrophic lakes, while Chlorophyta and Cyanobacteria dominate in eutrophic lakes [45]. We found that the dominant and subdominant species of phytoplankton in Dongting Lake were Fragilaria radians (Kützing) D.M.Williams & Round, Aulacoseira granulata (Ehrenberg) Simonsen, Nitzschia gracilis Hantzsch, Cyclotella meneghiniana Kützing, Navicula radiosa Kützing, Pinnularia gracillima W.Gregory, and Teleaulax acuta (Butcher) D.R.A.Hill, indicating that the water in Dongting Lake was basically in a mesotrophic state. However, it is worth noting that in September 2019, the Oxynema acuminatum (Gomont) Chatchawan, Komárek, Strunecky, Smarda & Peerapornpisal of Cyanobacteria became the first dominant group, which might be attributed to the temperature from August to September of 2019 being 1.5 to 2 degrees higher compared with 2017 and 2018.

4.2. Factors Determining Phytoplankton Density and Biodiversity

The growth and distribution of phytoplankton largely depend on the influence of environmental variables [46,47]. The temperature has species-specific effects on different phytoplankton taxa [48], affecting the growth and reproduction rates of most phytoplankton [49] and leading to changes in phytoplankton community composition. It is generally believed that a higher temperature induces the reproduction and growth of Chlorophyta and Cyanobacteria [50,51]. When the water temperature is higher than 25 °C, Cyanobacteria reach their maximum growth rate, and their cell abundance increases rapidly when the water temperature sharply increases in spring or summer. On the contrary, Bacillariophyta prefer cooler water [52]. In autumn and winter, the water temperature is relatively low and accompanied by the destruction of thermal stratification in water [53]. Bacillariophyta usually thrive while water is completely mixed. The results also indicated that the phytoplankton community was negatively related to WT just in Dongting Lake, but not in the Western, Southern, and Eastern Dongting Lake. Such a finding could be attributed to the change in the water cycle of Dongting Lake being faster (14 to 18 days) as it is a typical river-connected lake, resulting in a faster water mixing rate, unobvious thermal stratification, and the dominant Bacillariophyta. Meanwhile, Dongting Lake belongs to the subtropical region, and the WT is between 10 °C and 28 °C. Chlorophyta became the second most dominant group, which was consistent with the results of phytoplankton composition. It was worth noting that Cyanobacteria became the dominant group under the influence of continuous high temperatures in the summer of 2019.
DO was positively related to phytoplankton density, which might be attributed to the carbon dioxide absorbed and the oxygen released by phytoplankton [54]. However, we found that DO was only significantly correlated with the phytoplankton diversity in Dongting Lake, but not in Western Dongting Lake. Peroxide (O2) is mainly produced during the release of electrons by the photosynthetic system I (PSI), and oxygen takes electrons from PSI to form O2 when the electron utilization of dehydrogenase (NADPH) is not ideal or limited [55]. However, excessive oxygen free radicals can lead to protein denaturation and cell membrane damage, affecting the metabolism and reproduction of normal cells, and this might be the primary reason for the negative correlation between phytoplankton density and DO in Eastern Dongting Lake.
The electrical conductivity reflects the current-transmitting ability of substances in water. Our results also indicated that the electrical conductivity was positively related to the phytoplankton density, species, and richness in Dongting Lake, especially in Eastern Dongting Lake, with a high positive relationship between the electrical conductivity and the species and richness of phytoplankton. The above results are also consistent with previous studies [56,57]. The photosynthesis of cyanobacteria is realized through the energy and electron transfer between light systems. The process of energy and electron transfer is photosynthetic system II ( P S I I ) e P S I e N A D P H , which is finally converted into carbohydrates for growth and metabolism [55]. Therefore, electrical conductivity played a decisive role in the community and distribution of phytoplankton in Dongting Lake, especially in Eastern Dongting Lake.
Studies have shown that TN, TP, NH4+–N, BOD5, and chemical oxygen demand can be the main driving parameters affecting the phytoplankton community and distribution [58,59,60,61,62,63,64,65,66,67,68,69,70,71,72]. Figure 6 showed that the three major industries (industry, agriculture, and service) of the economic belt around the Dongting Lake illustrated a significant growth trend in the past 20 years, especially in the past 3 years, and the proportion of industry and service far exceeded that of agriculture. Western Dongting Lake belongs to Changde City, with a large amount of agricultural wastewater and domestic sewage discharge around the lake, which directly or indirectly enters the lake. Eastern Dongting Lake is located in Yueyang City, with many organic pollutants from different sources. The pollutants, dominated by agricultural product processing, building materials, light textile and clothing, paper industry, and chemical industry, directly or indirectly enter the lake. South Dongting Lake is located in Yiyang City, which is dominated by tourism, and its economic level is far lower compared with Yueyang City and Changde City. Therefore, the amount of point source and non-point source pollutants produced in this area is relatively small [73]. On the whole, BOD5, CODMn, CODCr, and nutrients were the primary parameters affecting the water quality in Eastern Dongting Lake, while nutrients were the major parameters in Western Dongting Lake. In contrast, point source and non-point source pollutants were the minor influencing factors affecting the water quality in Southern Dongting Lake, which is basically consistent with the results of this study. In detail, BOD5, CODMn, and CODCr were positively related to the phytoplankton density, species, and richness, but negatively related to the diversity and evenness in Eastern Dongting Lake. Meanwhile, the phytoplankton community was positively related to NH4+–N, but negatively related to TN. There was a significant positive correlation between TN, TP, and the phytoplankton density and species in Western Dongting Lake, while there was no apparent relationship between the phytoplankton community and oxygen-consuming organic matter and nutrients in Southern Dongting Lake.

4.3. Implications for Dongting Lake Management

In the present study, we found that the community and distribution of phytoplankton in Dongting Lake were affected by multiple physicochemical factors, especially oxygen-consuming organic matter. Of course, the impact of nutrients could not be ignored. Dongting Lake, the second largest lake influenced by the Three Gorges Project (TGP), is significantly affected by the three outlets of the Yangtze River (Songzi River, Hudu River, and Ouchi River) flowing into the lake. Meanwhile, the four tributaries (Xiang River, Zi River, Yuan River, and Li River) also exert direct or indirect effects on water quality and phytoplankton community. Moreover, with the rapid development of the social economy in recent years, the impact of human activities has become prominent. Therefore, to ensure the water environment safety of Dongting Lake, three suggestions were put forward as follows. (1) In response to the unstable water level dominated by the change in the relationship between Yangtze River and Dongting Lake, it is necessary to further explore and promote the joint ecological regulation of the Three Gorges Reservoir and its upstream flows, to ensure the ecological flow of Dongting Lake. (2) In response to the water quality deterioration caused by the unbalanced relationship between the seven rivers and Dongting Lake, local managers should focus on the prevention and control of water pollution in the Western and Southern Dongting Lake, explore and promote the assessment and management model of nitrogen and phosphorus indicators linked by the rivers to ensure the water quality of Dongting Lake. (3) To deal with the ecological damage caused by the uncontrolled human activities, the local government of Dongting Lake, especially in the Eastern Dongting Lake, should take supervision and management as the core, delimit and stick to the ecological red line, strictly control the pollutant input, and guarantee the ecological space.

5. Conclusions

In the present study, we analyzed the evolutionary characteristics of water quality in Dongting Lake in three recent years. Moreover, we assessed the evolution rules and dominant groups of the phytoplankton community, and the main parameters affecting the phytoplankton community and distribution were investigated based on the field survey and detection data from 2017 to 2019. The results indicated that the composition and distribution of the phytoplankton community in Dongting Lake were mainly affected by Cond, BOD5, CODMn, and CODCr, and this phenomenon was particularly pronounced in Eastern Dongting Lake. Of course, NH4+–N, TN, and TP were the main factors affecting the phytoplankton density and species, especially in Western Dongting Lake. As Dongting Lake is the second-largest lake influenced by the TGP, there have been concerns about its water ecological health and safety for a long time, and the water level fluctuation has been the critical factor influencing the species diversity of Dongting Lake. Therefore, in the next step, we will combine the water level and corresponding hydrological factors to further analyze the impact of TGP operation on the water ecological environment of Dongting Lake and its evolution trend. Finally, we suggested that local government could take “The relationship between Yangtze River and Dongting Lake”, “The relationship between the seven fed rivers and Dongting Lake”, and “The relationship between human activities and Dongting Lake” as the breakthrough points to guarantee the ecological flow, water environment, and ecological water quality of Dongting Lake.

Supplementary Materials

The following supporting information can be downloaded at: https://www.mdpi.com/article/10.3390/w14111674/s1. Data supported by this article were named Table S1: The list of phytoplankton species in Dongting Lake (March 2017–December 2019); Table S2: Correlation between water quality factors and phytoplankton community in different areas of Dongting Lake; Figure S1: Linear relationship between water temperature and phytoplankton community; Figure S2: Linear relationship between pH and phytoplankton community; Figure S3: Linear relationship between electrical conductivity and phytoplankton community; Figure S4: Linear relationship between DO and phytoplankton community; Figure S5: Linear relationship between CODMn and phytoplankton community; Figure S6: Linear relationship between BOD5 and phytoplankton community; Figure S7: Linear relationship between CODCr and phytoplankton community; Figure S8: Linear relationship between NH4+-N and phytoplankton community; Figure S9: Linear relationship between TN and phytoplankton community; Figure S10: Linear relationship between TP and phytoplankton community.

Author Contributions

X.W. developed the original ideas. X.Y. and X.W. drafted the manuscript, which was revised substantially by all authors. G.Y., D.H. and L.L. carried out sample collection and test. All authors have read and agreed to the published version of the manuscript.

Funding

This research was financially funded by the Three Gorges Follow-up Research Project (2017HXXY-05) and a special project of the Chinese Research Academy of Environmental Sciences (2020-JY-009).

Institutional Review Board Statement

Not applicable.

Informed Consent Statement

Not applicable.

Data Availability Statement

Not applicable.

Acknowledgments

We thank Ecological and Environmental Monitoring Center of Dongting Lake of Hunan for the assistance in water samples collection and test.

Conflicts of Interest

The authors declare no conflict of interest.

References

  1. Hill, B.H.; Herlihy, A.T.; Kaufmann, P.R.; DeCelles, S.J.; Vander Borgh, M.A. Assessment of streams of the eastern United States using a periphyton index of biotic integrity. Ecol. Indic. 2003, 2, 325–338. [Google Scholar] [CrossRef]
  2. Miller, S.J.; Wardrop, D.H.; Mahaney, W.M.; Brooks, R.P. A plant-based index of biological integrity (IBI) for headwater wetlands in central Pennsylvania. Ecol. Indic. 2006, 6, 290–312. [Google Scholar] [CrossRef]
  3. Padisák, J.; Borics, G.; Grigorszky, I.; Soróczki-Pintér, É. Use of phytoplankton assemblages for monitoring ecological status of lakes within the Water Framework Directive: The assemblage index. Hydrobiologia 2006, 553, 1–14. [Google Scholar] [CrossRef]
  4. Zalack, J.T.; Smucker, N.J.; Vis, M.L. Development of a diatom index of biotic integrity for acid mine drainage impacted streams. Ecol. Indic. 2010, 10, 287–295. [Google Scholar] [CrossRef]
  5. Wu, N.C.; Schmalz, B.; Fohrer, N. Development and testing of a phytoplankton index of biotic integrity (P-IBI) for a German lowland river. Ecol. Indic. 2012, 13, 158–167. [Google Scholar] [CrossRef]
  6. Znachor, P.; Nedom, J.; Hejzlar, J.; Se ďa, J.; Kopáček, J.; Kolář, V.; Mrkvička, T.; Boukal, D.S. Changing environmental conditions underpin long-term patterns of phytoplankton in a freshwater reservoir. Sci. Total Environ. 2020, 710, 135626. [Google Scholar] [CrossRef]
  7. Chao, C.X.; Lv, T.; Wang, L.G.; Han, C.; Yu, W.C.; Yan, Z.W.; Ma, X.W.; Zhao, H.C.; Zuo, Z.J.; Zhang, C.; et al. The spatiotemporal characteristics of water quality and phytoplankton community in a shallow eutrophic lake: Implications for submerged vegetation restoration. Sci. Total Environ. 2022, 821, 153460. [Google Scholar] [CrossRef]
  8. Havens, K.E.; Ji, G.; Beaver, J.R.; Fulton, R.S.; Teacher, C.E. Dynamics of cyanobacteria blooms are linked to the hydrology of shallow Florida lakes and provide insight into possible impacts of climate change. Hydrobiologia 2019, 829, 43–59. [Google Scholar] [CrossRef]
  9. Brookes, J.D.; Carey, C.C. Resilience to blooms. Science 2011, 334, 46–47. [Google Scholar] [CrossRef]
  10. Paerl, H.W.; Huisman, J. Climate Blooms like it hot. Science 2008, 320, 57–58. [Google Scholar] [CrossRef] [Green Version]
  11. Räike, A.; Pietiläinen, O.P.; Rekolainen, S.; Kauppila, P.; Pitkänen, H.; Niemi, J.; Raateland, A.; Vuorenmaa, J. Trends of phosphorus, nitrogen and chlorophyll a concentrations in Finnish rivers and lakes in 1975–2000. Sci. Total Environ. 2003, 310, 47. [Google Scholar] [CrossRef]
  12. Yang, Z.; Zhang, M.; Shi, X.L.; Kong, F.X.; Ma, R.H.; Yu, Y. Nutrient reduction magnifies the impact of extreme weather on cyanobacterial bloom formation in large shallow Lake Taihu (China). Water Res. 2016, 302, 302–310. [Google Scholar] [CrossRef] [PubMed]
  13. Muhid, P.; Davis, T.W.; Bunn, S.E.; Burford, M.A. Effects of inorganic nutrientsin recycled water on freshwater phytoplankton biomass and composition. Water Res. 2013, 47, 384–394. [Google Scholar] [CrossRef]
  14. Ren, Y.; Pei, H.Y.; Hu, W.R.; Tian, C.; Hao, D.P.; Wei, J.L.; Feng, Y.W. Spatiotemporal distribution pattern of cyanobacteria community and its relationship with the environmental factors in Hongze Lake, China. Environ. Monit. Assess. 2014, 186, 6919–6933. [Google Scholar] [CrossRef]
  15. Zhao, H.J.; Wang, Y.; Yang, L.L.; Yuan, L.W.; Peng, D.C. Relationship between phytoplankton and environmental factors inlandscape water supplemented with reclaimed water. Ecol. Indic. 2015, 58, 113–121. [Google Scholar] [CrossRef]
  16. Shan, K.; Song, L.R.; Chen, W.; Li, L.; Liu, L.M.; Wu, Y.L.; Jia, Y.L.; Zhou, L.P. Analysis of environmental drivers influencing interspecific variations and associations among bloom-forming cyanobacteria in large, shallow eutrophic lakes. Harmful Algae 2019, 84, 84–94. [Google Scholar] [CrossRef] [PubMed]
  17. Navas-Parejoa, J.C.C.; Corzoa, A.; Papaspyroua, S. Seasonal cycles of phytoplankton biomass and primary production in a tropical temporarily open-closed estuarine lagoon—The effect of an extreme climatic event. Sci. Total Environ. 2020, 723, 138014. [Google Scholar] [CrossRef]
  18. Peng, X.; Zhang, L.; Li, Y.; Lin, Q.W.; He, C.; Huang, S.Z.; Li, H.; Zhang, X.Y.; Liu, B.Y.; Ge, F.J.; et al. The changing characteristics of phytoplankton community and biomass in subtropical shallow lakes: Coupling effects of land use patterns and lake morphology. Water Res. 2021, 200, 117235. [Google Scholar] [CrossRef]
  19. Tian, C.; Pei, H.Y.; Hu, W.R.; Xie, J. Phytoplankton variation and its relationship with the environmental factors in Nansi Lake, China. Environ. Monit. Assess. 2013, 185, 295–310. [Google Scholar] [CrossRef]
  20. Yang, W.; Zheng, Z.; Zheng, C.; Lu, K.; Ding, D.; Zhu, J. Temporal variations in a phytoplankton community in a subtropical reservoir: An interplay of extrinsic and intrinsic community effects. Sci. Total Environ. 2017, 612, 720–727. [Google Scholar] [CrossRef]
  21. Stockwell, J.D.; Doubek, J.P.; Adrian, R.; Anneville, O.; Carey, C.C.; Carvalho, L.; De Senerpont, D.L.N.; Dur, G.; Frassl, M.A.; Grossart, H.P.; et al. Storm impacts on phytoplankton community dynamics in lakes. Glob. Chang. Biol. 2020, 26, 2756–2784. [Google Scholar] [CrossRef] [PubMed] [Green Version]
  22. Mao, Z.G.; Gu, X.; Cao, Y.; Luo, J.; Zeng, Q.; Chen, H.; Jeppesen, E. Pelagic energy flow supports the food web of a shallow lake following a dramatic regime shift driven by water level changes. Sci. Total Environ. 2021, 756, 143642. [Google Scholar] [CrossRef] [PubMed]
  23. Zhang, Y.C.; Hu, M.Q.; Shi, K.; Zhang, M.; Han, T.; Lai, L.; Zhan, P.F. Sensitivity of phytoplankton to climatic factors in a large shallow lake revealed by column-integrated algal biomass from long-term satellite observations. Water Res. 2021, 207, 117786. [Google Scholar] [CrossRef] [PubMed]
  24. Noori, R.; Ansari, E.; Bhattarai, R.; Tang, Q.H.; Aradpour, S.; Maghrebi, M.; Haghighi, A.T.; Bengtsson, L.; Kløve, B. Complex dynamics of water quality mixing in a warm mono-mictic reservoir. Sci. Total Environ. 2021, 777, 146097. [Google Scholar] [CrossRef]
  25. Noori, R.; Ansari, E.; Jeong, Y.-W.; Aradpour, S.; Maghrebi, M.; Hosseinzadeh, M.; Bateni, S.M. Hyper-Nutrient Enrichment Status in the Sabalan Lake, Iran. Water 2021, 13, 2874. [Google Scholar] [CrossRef]
  26. Paerl, H.W.; Paul, V.J. Climate change: Links to global expansion of harmful cyanobacteria. Water Res. 2012, 46, 1349–1363. [Google Scholar] [CrossRef]
  27. Reichwaldt, E.S.; Ghadouani, A. Effects of rainfall patterns on toxic cyanobacterial blooms in a changing climate: Between simplistic scenarios and complexdynamics. Water Res. 2012, 46, 1372–1393. [Google Scholar] [CrossRef]
  28. Du, Y.; Cai, S.; Zhang, X.Y.; Zhao, Y. Interpretation of the environmental change of Dongting Lake, middle reach of Yangtze River, China, by 210Pb measurement and satellite image analysis. Geomorphology 2001, 41, 171–181. [Google Scholar] [CrossRef]
  29. Yuan, Y.; Zeng, G.M.; Liang, J.; Huang, L.; Hua, S.S.; Li, F.; Zhu, Y.; Wu, H.P.; Liu, J.Y.; He, X.X.; et al. Variation of water level in Dongting Lake over a 50-year period: Implications for the impacts of anthropogenic and climatic factors. J. Hydrol. 2015, 525, 450–456. [Google Scholar] [CrossRef]
  30. Li, Y.S.; Raso, G.; Zhao, Z.Y.; He, Y.K.; Ellis, M.K.; McManus, D.P. Large water management projects and schistosomiasis control, Dongting Lake Region, China. Emerg. Infect. Dis. 2007, 13, 973–979. [Google Scholar] [CrossRef]
  31. Han, Q.Q.; Zhang, S.H.; Huang, G.X.; Zhang, R. Analysis of Long-Term Water Level Variation in Dongting Lake, China. Water 2016, 8, 306. [Google Scholar] [CrossRef] [Green Version]
  32. Dai, Y.Z.; Tang, S.Y.; Zhang, J.B. The distribution of zoobenthos species and bioassessment of water quality in Dongting Lake. Acta Ecol. Sin. 2000, 20, 277–282. [Google Scholar]
  33. Zhang, T.; Li, D.L.; Xu, B.H.; Chen, K.J.; Xiao, T.Y.; Yang, C.Z.; Liu, Y.C. Investigation on phytoplankton and water quality assessment of aquacultural waterbodies in west Dongting Lake area. J. Hydroecol. 2009, 2, 12–18. [Google Scholar]
  34. Li, Q. Hygrophilous ecological environment succession and countermeasure of the Dongting Lake. Res. Soil Water Conserv. 2005, 12, 98–100. [Google Scholar]
  35. Wang, X.; Zheng, B.H.; Liu, L.S.; Wang, L.J.; Li, L.Q.; Huang, D.Z. Correlation analysis of macroinvertebrate composition and environmental factors of typical sections in Dongting Lake. China Environ. Sci. 2012, 32, 2237–2244. [Google Scholar]
  36. Xie, Z.C.; Zhang, J.Q.; Chen, J.; Ma, K.; Liu, R.Q.; Wang, Y.P.; Cai, Q.H. Spatial distributional pattern of macrozoobenthos and pollution evaluation in East Lake Dongting Reserve. J. Lake Sci. 2007, 19, 289–298. [Google Scholar]
  37. Zhong, Z.Y.; Chen, C. Water quality and eutrophication analysis in Lake Dongting. Environ. Sci. Manag. 2011, 36, 169–173. [Google Scholar]
  38. Ministry of Ecological Environment of the People’s Republic of China. Methods for the Monitoring and Analysis of Water and Wastewater, 4th ed.; Chinese Environmental Science Press: Beijing, China, 2002.
  39. Hu, H.J.; Wei, Y.X. The Freshwater Algae of CHINA: Systematics, Taxonomy and Ecology; Science Press: Beijing, China, 2006. (In Chinese) [Google Scholar]
  40. Shannon, C.E.; Wiener, W. The Mathematical Theory of Communication; University of Illinois Press: Urbana, IL, USA, 1949. [Google Scholar]
  41. Margalef, R. Information theory in ecology. Gen. Syst. 1958, 3, 36–71. [Google Scholar]
  42. Pielou, E.C. Species-diversity and pattern-diversity in the study of ecological succession. J. Theor. Biol. 1966, 10, 370–383. [Google Scholar] [CrossRef]
  43. Aksnes, D.L.; Wassmann, P. Modeling the significance of zooplankton grazing for export production. Limnol. Oceanogr. 1993, 38, 978–985. [Google Scholar] [CrossRef]
  44. Lampitt, R.S.; Wishner, K.F.; Turley, C.M.; Angel, M.V. Marine snow studies in the Northeast Atlantic Ocean: Distribution, composition and role as a food source for migrating plankton. Mar. Biol. 1993, 116, 689–702. [Google Scholar] [CrossRef]
  45. Ter Braak, C.J.F. Canonical correspondence analysis: A new eigenvector technique for multivariate direct gradient analysis. Ecology 1986, 67, 1167–1179. [Google Scholar] [CrossRef] [Green Version]
  46. Peng, S.T.; Qin, X.B.; Shi, H.H.; Zhou, R.; Dai, M.X.; Ding, D.W. Distribution and controlling factors of phytoplankton assemblages in a semi-enclosed bay during spring and summer. Mar. Pollut. Bull. 2012, 64, 941–948. [Google Scholar] [CrossRef] [PubMed]
  47. Modabberi, A.; Noori, R.; Madani, K.; Ehsani, A.H.; Mehr, A.D.; Hooshyaripor, F.; Kløve, B. Caspian Sea is eutrophying: The alarming message of satellite Data. Environ. Res. Lett. 2020, 15, 124047. [Google Scholar] [CrossRef]
  48. Tolotti, M.; Thies, H.; Nickus, U.; Psenner, R. Temperature modulated effects of nutrients on phytoplankton changes in a mountain lake. Hydrobiologia 2012, 698, 61–75. [Google Scholar] [CrossRef]
  49. Paerl, H.W.; Hall, N.S.; Calandrino, E.S. Controlling harmful cyanobacterial blooms in a world experiencing anthropogenic and climatic-induced change. Sci. Total Environ. 2011, 409, 1739–1745. [Google Scholar] [CrossRef]
  50. Alam, M.G.M.; Jahan, N.; Thalib, L.; Wei, B.; Maekawa, T. Effects of environmental factors on the seasonally change of phytoplankton populations in a closed freshwater pond. Environ. Int. 2001, 27, 363–371. [Google Scholar] [CrossRef]
  51. Poste, A.E.; Hecky, R.E.; Guildford, S.J. Phosphorus enrichment and carbon depletion contribute to high Microcystis biomass and microcystin concentrations in Ugandan lakes. Limnol. Oceanogr. 2013, 58, 1075–1088. [Google Scholar] [CrossRef]
  52. Abirhire North, R.L.; Hunter, K.; Vandergucht, D.M.; Sereda, J.; Hudson, J.J. Environmental factors influencing phytoplankton communities in Lake Diefenbaker, Saskatchewan, Canada. J. Great Lakes Res. 2015, 41, 118–128. [Google Scholar] [CrossRef]
  53. Varol, M. Phytoplankton functional groups in a monomictic reservoir: Seasonal succession, ecological preferences, and relationships with environmental variables. Environ. Sci. Pollut. Res. 2019, 26, 20439–20453. [Google Scholar] [CrossRef]
  54. Cui, G.Y.; Wang, B.L.; Xiao, J.; Qiu, X.L.; Liu, C.Q.; Li, X.D. Water column stability driving the succession of phytoplankton functional groups in karst hydroelectric reservoirs. J. Hydrol. 2021, 592, 125607. [Google Scholar] [CrossRef]
  55. Ferreira, K.N.; Iverson, T.M.; Maghlaoui, K.; Barber, J.; Iwata, S. Architecture of the photosynthetic oxygen-evolving center. Science 2004, 303, 1831–1838. [Google Scholar] [CrossRef] [PubMed] [Green Version]
  56. Wang, Y.F.; Zhou, C.T.; Zhao, Z.H.; Lin, Z.H. Seasonal dynamics of phytoplankton and its relationship with the environmental factors in subtropical reservoirs. Acta Ecol. Sin. 2021, 41, 4010–4022. [Google Scholar]
  57. He, X.R.; Li, G.G. Community structure of phytoplankon and its relation with water quality in Xixi Wetland for the frist project aera, Hangzhou. J. Lake Sci. 2009, 21, 795–800. [Google Scholar]
  58. Arhonditsis, G.B.; Winder, M.; Brett, M.T.; Schindler, D.E. Patterns and mechanisms of phytoplankton variability in Lake Washington (USA). Water Res. 2004, 38, 4013–4027. [Google Scholar] [CrossRef] [PubMed]
  59. Wang, X.; Liu, L.S.; Li, L.; Zhou, J.; Wang, Y.; Xia, F.; Xia, Y. Correlation analysis of algae composition and environmental factors in Jingpo Lake. China Environ. Sci. 2015, 35, 3403–3413. [Google Scholar]
  60. Wilkinson, C.R.; Fay, P. Nitrogen fixation in coral reef sponges with symbiotic cyanobacteria. Nature 1979, 279, 527–529. [Google Scholar] [CrossRef]
  61. Mitsui, A.; Kumazawa, S.; Takahashi, A.; Ikemoto, H.; Cao, S.; Arai, T. Strategy by which nitrogen-fixing unicellular cyanobacteria grow photoautotrophically. Nature 1986, 323, 720–722. [Google Scholar] [CrossRef]
  62. Bohme, H. Regulation of nitrogen fixation in heterocyst-forming cyanobacteria. Trends Plant Sci. 1998, 3, 346–351. [Google Scholar] [CrossRef]
  63. Moore, L.R.; Post, A.F.; Rocap, G.; Chisholm, S.W. Utilization of different nitrogen sources by the marine cyanobacteria Prochlorococcus and Synechococcus. Limnol. Oceanogr. 2002, 47, 989–996. [Google Scholar] [CrossRef]
  64. Vahtera, E.; Conley, D.J.; Gustafsson, B.G.; Kuosa, H.; Pitkänen, H.; Savchuk, O.P.; Tamminen, T.; Viitasalo, M.; Voss, M.; Wasmund, N.; et al. Internal ecosystem feedbacks enhance nitrogen-fixing cyanobacteria blooms and complicate management in the Baltic Sea. AMBIO A J. Hum. Environ. 2007, 36, 186–194. [Google Scholar] [CrossRef]
  65. Redfield, A.C. The biological control of the chemical factors in the environment. Am. Sci. 1958, 46, 205–221. [Google Scholar]
  66. Vollenweider, R.A. Scientific Fundamentals of the Eutrophication of Lakes and Flowing Waters, with Particular References to Nitrogen and Phosphorus as Factors in Eutrophication; Organization for Economic Co-Operation and Development, Directorate for Scientific Affairs: Paris, France, 1968; pp. 1–183. [Google Scholar]
  67. Dillon, P.L.; Rigler, F.H. A simple method for predicting the capacity of a lake for development based on lake trophic status. J. Fish. Board Can. 1975, 32, 1519–1531. [Google Scholar] [CrossRef]
  68. Armstrong, R.A. An optimization-based model of iron-lightammonium co-limitation of nitrate uptake and phytoplankton growth. Limnol. Oceanogr. 1999, 44, 1436–1446. [Google Scholar] [CrossRef]
  69. Ernst, A.; Deicher, M.; Herman, P.M.J.; Wollenzien, U.I.A. Nitrate and phosphate affect cultivability of cyanobacteria from environments with low nutrient levels. Appl. Environ. Microb. 2005, 71, 3379–3383. [Google Scholar] [CrossRef] [Green Version]
  70. Liu, X.; Qian, K.M.; Chen, Y.W.; Gao, J.F. A comparison of factors influencing the summer phytoplankton biomass in China’s three largest freshwater lakes: Poyang, Dongting, and Taihu. Hydrobiologia 2017, 792, 283–302. [Google Scholar] [CrossRef]
  71. Haande, S.; Rohrlack, T.; Semyalo, R.P.; Brettum, P.; Edvardsen, B.; Lyche-Solheim, A.; Sørensen, K.; Larsson, P. Phytoplankton dynamics and cyanobacterial dominance in Murchison Bay of Lake Victoria (Uganda) in relation to environmental conditions. Limnologica 2011, 41, 20–29. [Google Scholar] [CrossRef] [Green Version]
  72. Cao, J.; Hou, Z.Y.; Li, Z.K.; Chu, Z.S.; Yang, P.P.; Zheng, B.H. Succession of phytoplankton functional groups and their driving factors in a subtropical plateau lake. Sci. Total Environ. 2018, 631–632, 1127–1137. [Google Scholar] [CrossRef]
  73. Wang, L.J.; Wang, X.; Liu, L.S.; Zheng, B.H.; Li, L.Q.; Huang, D.Z.; Tian, Q. Multivariate analysis of water factors in Dongting Lake. Res. Environ. Sci. 2013, 26, 1–7. [Google Scholar]
Figure 1. Sampling sites in Dongting Lake. S1: Shahekou; S2: Nanzui; S3: Potou; S4: Jiangjiazui; S5: Xiaohezui; S6: Wanzi Lake; S7: Wanjiazui; S8: Hengling Lake; S9: Yugongmiao; S10: Zhangshugang; S11: Lujiao; S12: East-Dongting Lake; S13: Big-small West Lake; S14: Yueyanglou; S15: Dongting Lake outlet.
Water 14 01674 g001
Figure 2. Temporal and spatial variation characteristics of phytoplankton density in Dongting Lake.
Water 14 01674 g002
Figure 3. Interannual variation of phytoplankton composition in Dongting Lake.
Water 14 01674 g003
Figure 4. Dominant species of phytoplankton and their interannual variation in Dongting Lake.
Water 14 01674 g004
Figure 5. Driving diagram of environmental factors to phytoplankton community. Note: The correlation between the physicochemical indicators and the phytoplankton indicators. Density, species, Scheme 0.1< R < 0.4) and significance (p < 0.05); the dashed line ”– –– –” indicates the correlation coefficient (0.4 < R < 0.7) and significance (p < 0.05), and the solid line “——” indicates the correlation coefficient (R > 0.7) and significance (p < 0.01).
Water 14 01674 g005
Figure 6. Economic development trend of Dongting Lake (left) and industrial structure composition in different areas of Dongting Lake during 2017–2019 (right). The primary output is agriculture, the secondary output is industry, and the tertiary output is service industry; WD: Western Dongting Lake; SD: Southern Dongting Lake; ED: Eastern Dongting Lake.
Water 14 01674 g006
Table 1. Variation characteristics of significant water quality factors of Dongting Lake from 2017 to 2019.
WT (°C)pHCond (ms/m)DO (mg/L)CODMn (mg/L)BOD5 (mg/L)CODCr (mg/L)NH4–N (mg/L)TN (mg/L)TP (mg/L)
Mean ± SD
March 201712.864 ± 0.7677.619 ± 0.14626.033 ± 5.0519.298 ± 0.4532.133 ± 0.8912.176 ± 1.0279.200 ± 4.9700.279 ± 0.1281.983 ± 0.3830.068 ± 0.018
June 201724.021 ± 0.9297.507 ± 0.12223.080 ± 4.6206.965 ± 0.5822.411 ± 0.7261.857 ± 0.5489.789 ± 3.5910.160 ± 0.2231.878 ± 0.2910.070 ± 0.020
September 201726.586 ± 1.0417.528 ± 0.12023.913 ± 4.9256.771 ± 0.5392.438 ± 1.0191.803 ± 0.77810.077 ± 5.7290.147 ± 0.1271.560 ± 0.3110.089 ± 0.021
December 201712.586 ± 1.4737.539 ± 0.11426.267 ± 4.3989.037 ± 1.1382.169 ± 0.7641.620 ± 0.93611.174 ± 4.2250.288 ± 0.1301.911 ± 0.3330.078 ± 0.026
March 201812.629 ± 3.4117.809 ± 0.39825.013 ± 6.8379.460 ± 0.8932.060 ± 0.9381.283 ± 0.5818.607 ± 4.0290.303 ± 0.1931.762 ± 0.6490.073 ± 0.020
June 201823.171 ± 2.1527.583 ± 0.35723.933 ± 4.1207.125 ± 0.5452.347 ± 0.8031.049 ± 0.6549.633 ± 4.0640.080 ± 0.0561.956 ± 0.4320.067 ± 0.016
September 201829.564 ± 1.8747.509 ± 0.33024.873 ± 5.1876.646 ± 0.8082.313 ± 0.4341.225 ± 0.8148.520 ± 3.3090.095 ± 0.0651.464 ± 0.2890.063 ± 0.009
December 201815.121 ± 2.3467.406 ± 0.54925.447 ± 7.4628.879 ± 1.1442.120 ± 0.8851.419 ± 0.8027.867 ± 4.8090.143 ± 0.1141.663 ± 0.2660.070 ± 0.029
March 201910.293 ± 1.5327.439 ± 0.52823.953 ± 4.36710.854 ± 1.2362.173 ± 0.6261.547 ± 0.8847.867 ± 3.6810.245 ± 0.1731.947 ± 0.3670.063 ± 0.015
June 201923.879 ± 2.0647.638 ± 0.22121.380 ± 5.8057.647 ± 0.6812.373 ± 1.2091.453 ± 1.1358.800 ± 7.2920.078 ± 0.0601.549 ± 0.2220.066 ± 0.018
September 201928.100 ± 2.6447.593 ± 0.52025.033 ± 6.0396.883 ± 0.6522.487 ± 1.1411.440 ± 1.04110.000 ± 7.6350.090 ± 0.0861.650 ± 0.3410.065 ± 0.027
December 201912.714 ± 1.6717.751 ± 0.33727.693 ± 6.3289.069 ± 1.0312.100 ± 0.6371.713 ± 0.6108.333 ± 5.2050.165 ± 0.1171.629 ± 0.3460.068 ± 0.017
Publisher’s Note: MDPI stays neutral with regard to jurisdictional claims in published maps and institutional affiliations.

