
Can Water Vapor Transport over the Himalayas above 8000 m asl?—A Case Study on Mt. Everest


1
State Key Laboratory of Cryospheric Science, Northwest Institute of Eco-Environment and Resources, Chinese Academy of Sciences, Lanzhou 730000, China
2
University of Chinese Academy of Sciences, Beijing 100049, China
*
Author to whom correspondence should be addressed.
Water 2022, 14(11), 1671; https://doi.org/10.3390/w14111671
Submission received: 11 April 2022
/
Revised: 17 May 2022
/
Accepted: 18 May 2022
/
Published: 24 May 2022
(This article belongs to the Section Water and Climate Change)
Abstract
:Due to the extreme, harsh natural environment in the Himalayas higher than 8000 m above sea level (asl) long-term and continuous meteorological observation is still a great challenge, and little is known about water vapor transport in this extremely high region. Based on the Automatic Weather Stations (AWSs) at 3810 m, 5315 m, 6464 m, 7945 m and 8430 m asl on the southern slope of Mt. Everest, this study investigates the meteorological characteristics and water vapor transport in the Mt. Everest region from June 2019 to June 2021. The results show that (1) with the increase of altitude, the temperature lapse rate becomes deeper from −4.7 °C km−1 to −8.1 °C km−1; (2) the relative humidity increases significantly in summer, and precipitation during the monsoon period accounts for more than 70% of the annual total; and (3) during the monsoon in 2020, the number of days with negative daily water vapor divergence in the whole layer accounted for 31% at the height from ground to 350 hPa, and the moisture amount transported through water vapor convergence was about 122 mm. The study indicates that, with sufficient moisture supply, strong water vapor convergence and a relatively large vertical velocity, a small amount of water vapor can climb to an extreme height and be transported from the southern to the northern slope of the Himalayas.
1. Introduction
The Tibetan Plateau (TP), with an average altitude of more than 4000 m asl and an area of 2.5 million km2—has a variety of underlying surfaces including glaciers, snow and frozen soil—stores ice third only to the Antarctic and the Arctic, and is called the “The Third Pole” [1,2,3,4]. As the Asian water tower, the TP provides essential water resources for nearly 40% of the world’s population [5,6]. Over the past few decades, the TP has warmed almost twice as fast as the global average, which is called Tibetan amplification (TA), which is significantly higher than other regions at the same latitude [7,8,9]. As one of the most ecologically fragile regions in the world [10,11], the TA has exacerbated the cryospheric changes, and further affects the regional hydrological cycle [6,12,13,14,15].
The Himalayas, the most majestic mountain range on earth, are located on the southern edge of the TP, with an east–west length of about 2400 km and a north–south width of about 200–300 km [16]. The ridges, with an average altitude of over 6000 m, occupy 30% to 50% of the troposphere, which is mainly influenced by the Indian monsoon and the tropical easterly wind belt from June to September, and controlled by the Asian Westerly Jet in the upper troposphere from October to May [17,18,19,20]. Due to the high altitude and long east–west span, the Himalayas serve as a natural barrier to prevent the Indian monsoon from transporting water vapor northward to the TP interior. Therefore, the climate varies significantly between the northern and southern slopes of the Himalayas [17,21]. The highest mountain in the world, Mt. Everest with the height of 8848.86 m, is located in the central Himalayas [22]. Due to the harsh natural environment, there is still a lack of long-term continuous systematic observation data for meteorological elements and little research on water vapor transport on Mt. Everest.
Previous researchers have studied the moisture content, precipitation characteristics and moisture transport characteristics over the TP using different types of data, including observations, reanalysis datasets, remote sensing data and some proxy indicators [20,23,24,25]. Some researchers have also analyzed the isotopic composition of TP precipitation using observed and simulated stable oxygen and hydrogen isotopes to analyze the source area of water vapor [26,27,28]. In addition, there are researchers who have used high-resolution satellite data and WRF models to build a model of up-and-over transport and to quantify the relationship of precipitation between central-eastern India and southwestern TP [29,30]. For the Mt. Everest region, despite the limitations of the harsh environment, the scarcity of meteorological stations and the low altitude where the stations are located, some scholars have analyzed the variation of meteorological elements such as relative humidity and specific humidity with altitude in their regions using the measured data from automatic weather stations (AWSs), so as to discuss the vertical distribution characteristics of water vapor in the Mt. Everest region [18,31,32,33,34,35,36,37].
Due to the lack of AWS observations in the extremely high-altitude regions, fewer studies have been conducted on water vapor transport in the Mt. Everest region, especially quantifying the water vapor transport across the extremely high Himalayas. From the perspective of weather, climate and glacier health, little is still known about Mt. Everest in its highest reaches [38]. To further explore water vapor transport in the Mt. Everest region, we analyzed the meteorological data from the AWSs deployed by National Geographic and Rolex’s Perpetual on the Nepalese side of Mt. Everest in April 2019 [39,40]. Based on the temporal and spatial characteristics of temperature and humidity on the southern slope of Mt. Everest, and combined with ERA5 reanalysis data from the European Centre for Medium-Range Weather Forecasts (ECMWF), this study aims to quantify the moisture content on the southern slope of Mt. Everest and its surrounding region.
2. Data and Methods
2.1. Observational Data
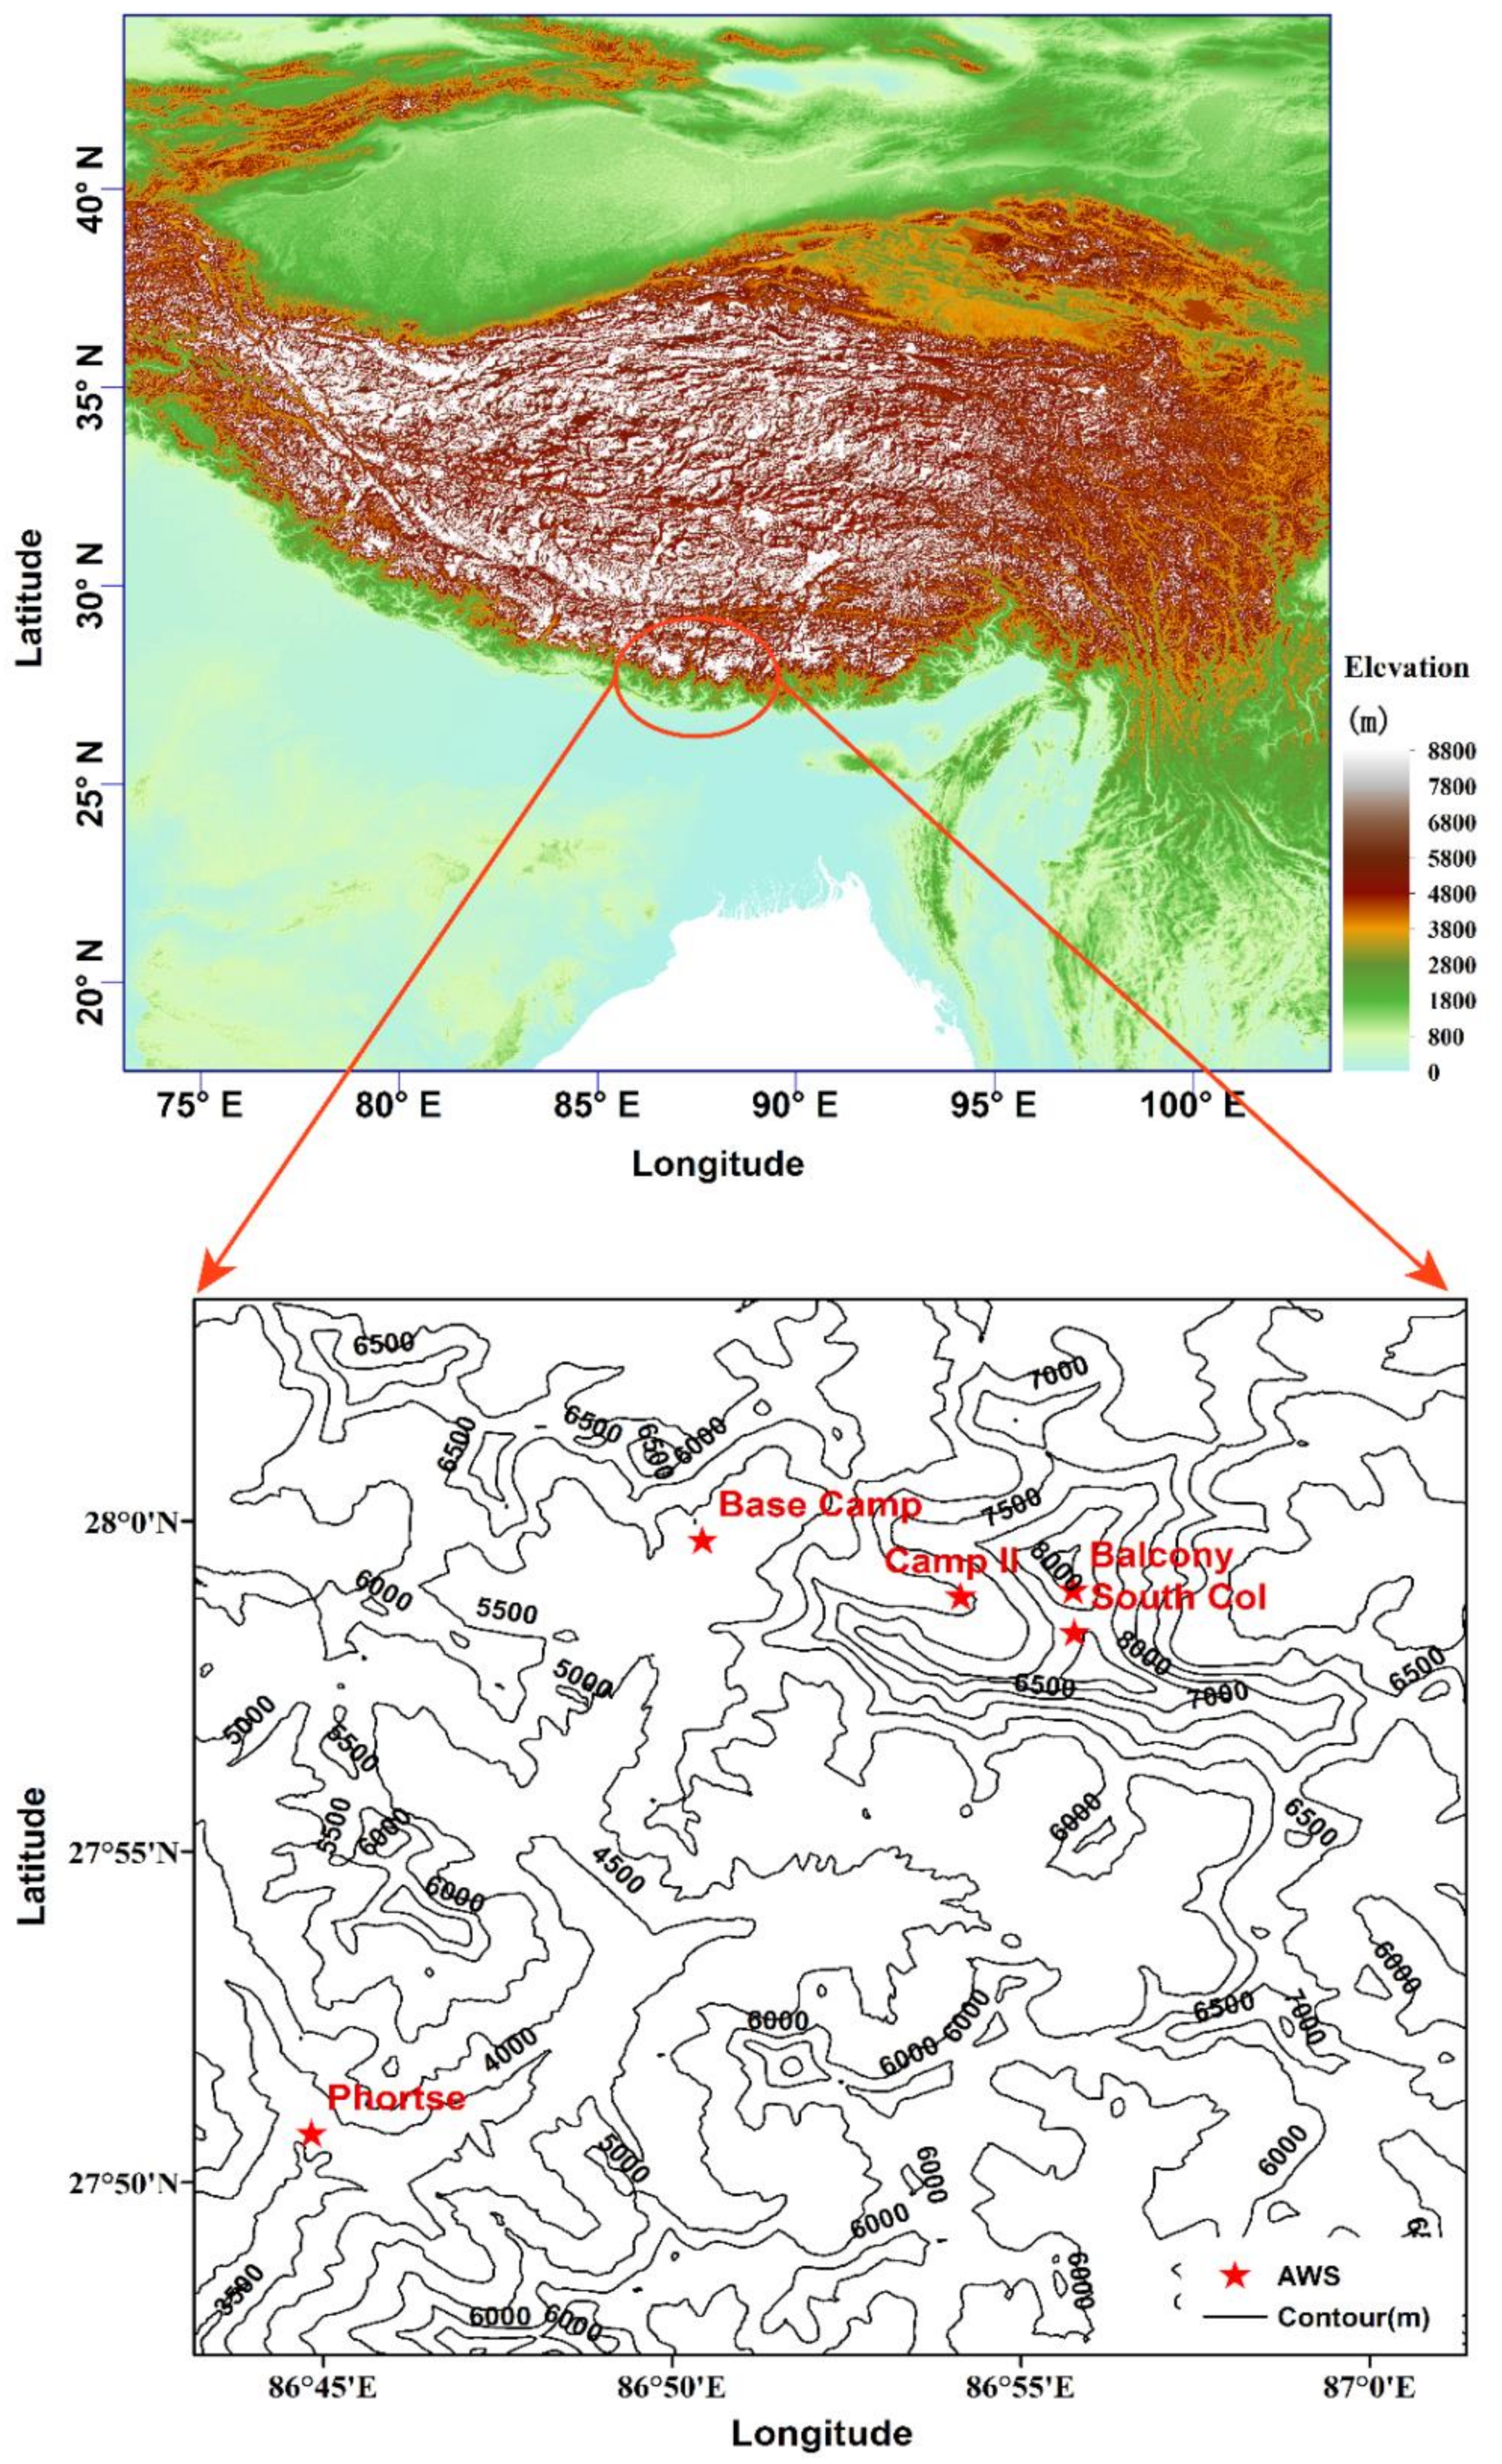
We used the observational hourly meteorological data from the AWSs on the southern slope of Mt. Everest, including the two highest AWSs at 7945 m on South Col and 8430 m on Balcony (Figure 1 and Table 1). Temperature refers to the 2 m air temperature at Phortse, Base Camp and Camp II, and 1.5 m air temperature at South Col and Balcony, respectively. As an initial quality control, missing measurements (−999) and unreasonable values (e.g., temperature < −60 °C) in the AWSs data were removed.
The data are available from the website, https://www.nationalgeographic.com/environment/topic/perpetual-planet (accessed on 1 September 2021) [41].
2.2. ERA5 Reanalysis Dataset
As the fifth generation of the ECMWF weather datasets, based on the 4D-Var assimilation method, ERA5 reanalysis is the latest global weather and climate dataset from 1950 to present [42]. Compared to the ERA-Interim, ERA5 assimilates more observations and satellite data to estimate atmospheric conditions more accurately, and has an enhanced temporal resolution, with the horizontal resolution of 31 km grid spacing, compared with 79 km in ERA-Interim [43]. ERA5 includes two types of data sets: on pressure levels and on single levels. The former contains 16 atmospheric quantities on 37 pressure levels from 1000 hPa (surface) to 1 hPa (around the top of the stratosphere), while the latter is available for a number of atmospheric, ocean-wave and land surface quantities.
To further research the circulation situation and water vapor transport characteristics on the southern slope of Mt. Everest and its surrounding area, this study analyzes the ERA5 hourly different pressure levels datasets of temperature, relative humidity, specific humidity, u-component of wind, v-component of wind and vertical velocity. The data are available free from the website https://cds.climate.copernicus.eu/#!/search?text=ERA5&type=dataset (accessed on 1 September 2021) [44].
2.3. Methodology
Temperature lapse rate is an important component of mountain meteorological observation and research. It reflects the change of temperature with height and provides certain feedback on the arrival of the monsoon period [45]. There are two ways to calculate temperature lapse rates. One is to use the temperature at a lower altitude minus the temperature at the higher altitude [46]. Another method is to use the temperature and its corresponding altitude and use the linear correlation method [45,47]. With the observational data at different altitudes, we chose the first method to calculate the temperature lapse rates based on the temperature differences between two adjacent stations. The temperature lapse rate (TLR, °C km−1) can be written as:
where T2 and Z2 are the temperature and altitude of the AWS at the lower altitude between two adjacent stations, and T1 and Z1 are at the higher altitude. We calculated the water vapor flux and water vapor flux divergence to determine the direction of moisture transport, moisture content and the convergence and divergence characteristics of the circulation background in and around the southern slope of Mt. Everest. Water vapor flux is defined as the amount of water vapor (gram) flowing through the unit area perpendicular to the horizontal wind direction in unit time. Water vapor flux is a vector, the wind direction is its direction, its unit is g/(s·cm·hPa), and 1 hPa refers to 103 g/(cm·s2). According to Trenberth [48], vertical integration of water vapor flux is calculated as follows:
where q is specific humidity, u is eastward wind, v is northward wind and g is gravitational acceleration. Since water vapor is mainly distributed in the lower troposphere, the atmospheric top pressure Pt is taken as 300 hPa here, and the Ps is surface pressure.
Water vapor flux divergence is calculated as follows:
where is horizontal wind vector, A < 0, indicates water vapor flux convergence and A > 0 indicates water vapor divergence.
3. Results
3.1. Spatial and Temporal Variation of Meteorological Characteristics during 2019–2021
Due to the harsh environment of Mt. Everest and the limitation of detection technology, there are very few AWSs above 5000 m. We know very little about the weather and climate change in very high-altitude areas. In this study, we analyzed the spatial and temporal characteristics of temperature, relative humidity, temperature lapse rates and precipitation from June 2019 to June 2021 using data from five newly established AWSs on the southern slope of Mt. Everest (see Table 1 for details).
As shown in Figure 2 and Table 2, the daily mean, daily maximum and daily minimum temperatures on the southern slopes of Mt. Everest decreased with increasing altitude. The average daily maximum temperatures all appeared in summer (JJA), with values of 12.4 °C, 5.4 °C, −1.5 °C, −8.8 °C and −11.7 °C for each station from low to high, while the average daily minimum temperatures all appeared in winter (DJF), with values of −8.7 °C, −17.0 °C, −25.5 °C, −38.6 °C and −40.2 °C.
The range of temperature lapse rate is generally from 9.8 °C km−1 (dry adiabatic decrement) to 4.0 °C km−1 (saturated adiabatic decrement). When there is not a high accuracy requirement, the average temperature lapse rate used is generally 5.5 °C km−1, 6.0 °C km−1 or 6.5 °C km−1 [46]. However, due to the complex topography and extremely high elevation in the Mt. Everest region, the conventional temperature lapse rate may not be applicable, so we calculated the temperature lapse rate between two adjacent stations using Equation (1) to determine the gradient of temperature with altitude. As shown in Figure 2, the temperature lapse rates increase with increasing altitude, and the average temperature lapse rates during the observation period for Phortse-Base Camp, Base Camp-Camp II, Camp II-South Col, and South Col-Balcony were −4.7 °C km−1, −6.3 °C km−1, −7.7 °C km−1 and −8.1 °C km−1, respectively. In addition, temperature lapse rates varied significantly with the season. In summer, the water vapor supply is sufficient, and the water vapor converges in the Mt. Everest area; the relative humidity is large, so the temperature lapse rate becomes shallow. It is important to note that the Balcony station had a shorter time period for the data, so the difference between the calculated decreasing temperature rate and the other three stations is not only influenced by altitude, but also by seasonal factors.
In terms of water vapor content, as shown in Figure 2 and Table 3, the variation of relative humidity with altitude on the southern slope of Mt. Everest is not obvious. However, the relative humidity has obvious seasonal characteristics. In summer, influenced by the Indian monsoon, the warm and humid airflow carries moisture and gathers on the southern slope of Everest, resulting in a significant increase in relative humidity. The average relative humidity in summer at the five stations from low to high altitude was 92.9%, 92.9%, 80.7%, 77.2% and 70.5%, respectively. It can be seen that the relative humidity decreases with height in summer.
The southern slope of Mt. Everest is located in the low latitude area, with large annual and seasonal changes in precipitation. Due to the influence of the Indian Monsoon, the study area has an obvious monsoon climate, that is a rainy season and a dry season as shown in Figure 2.
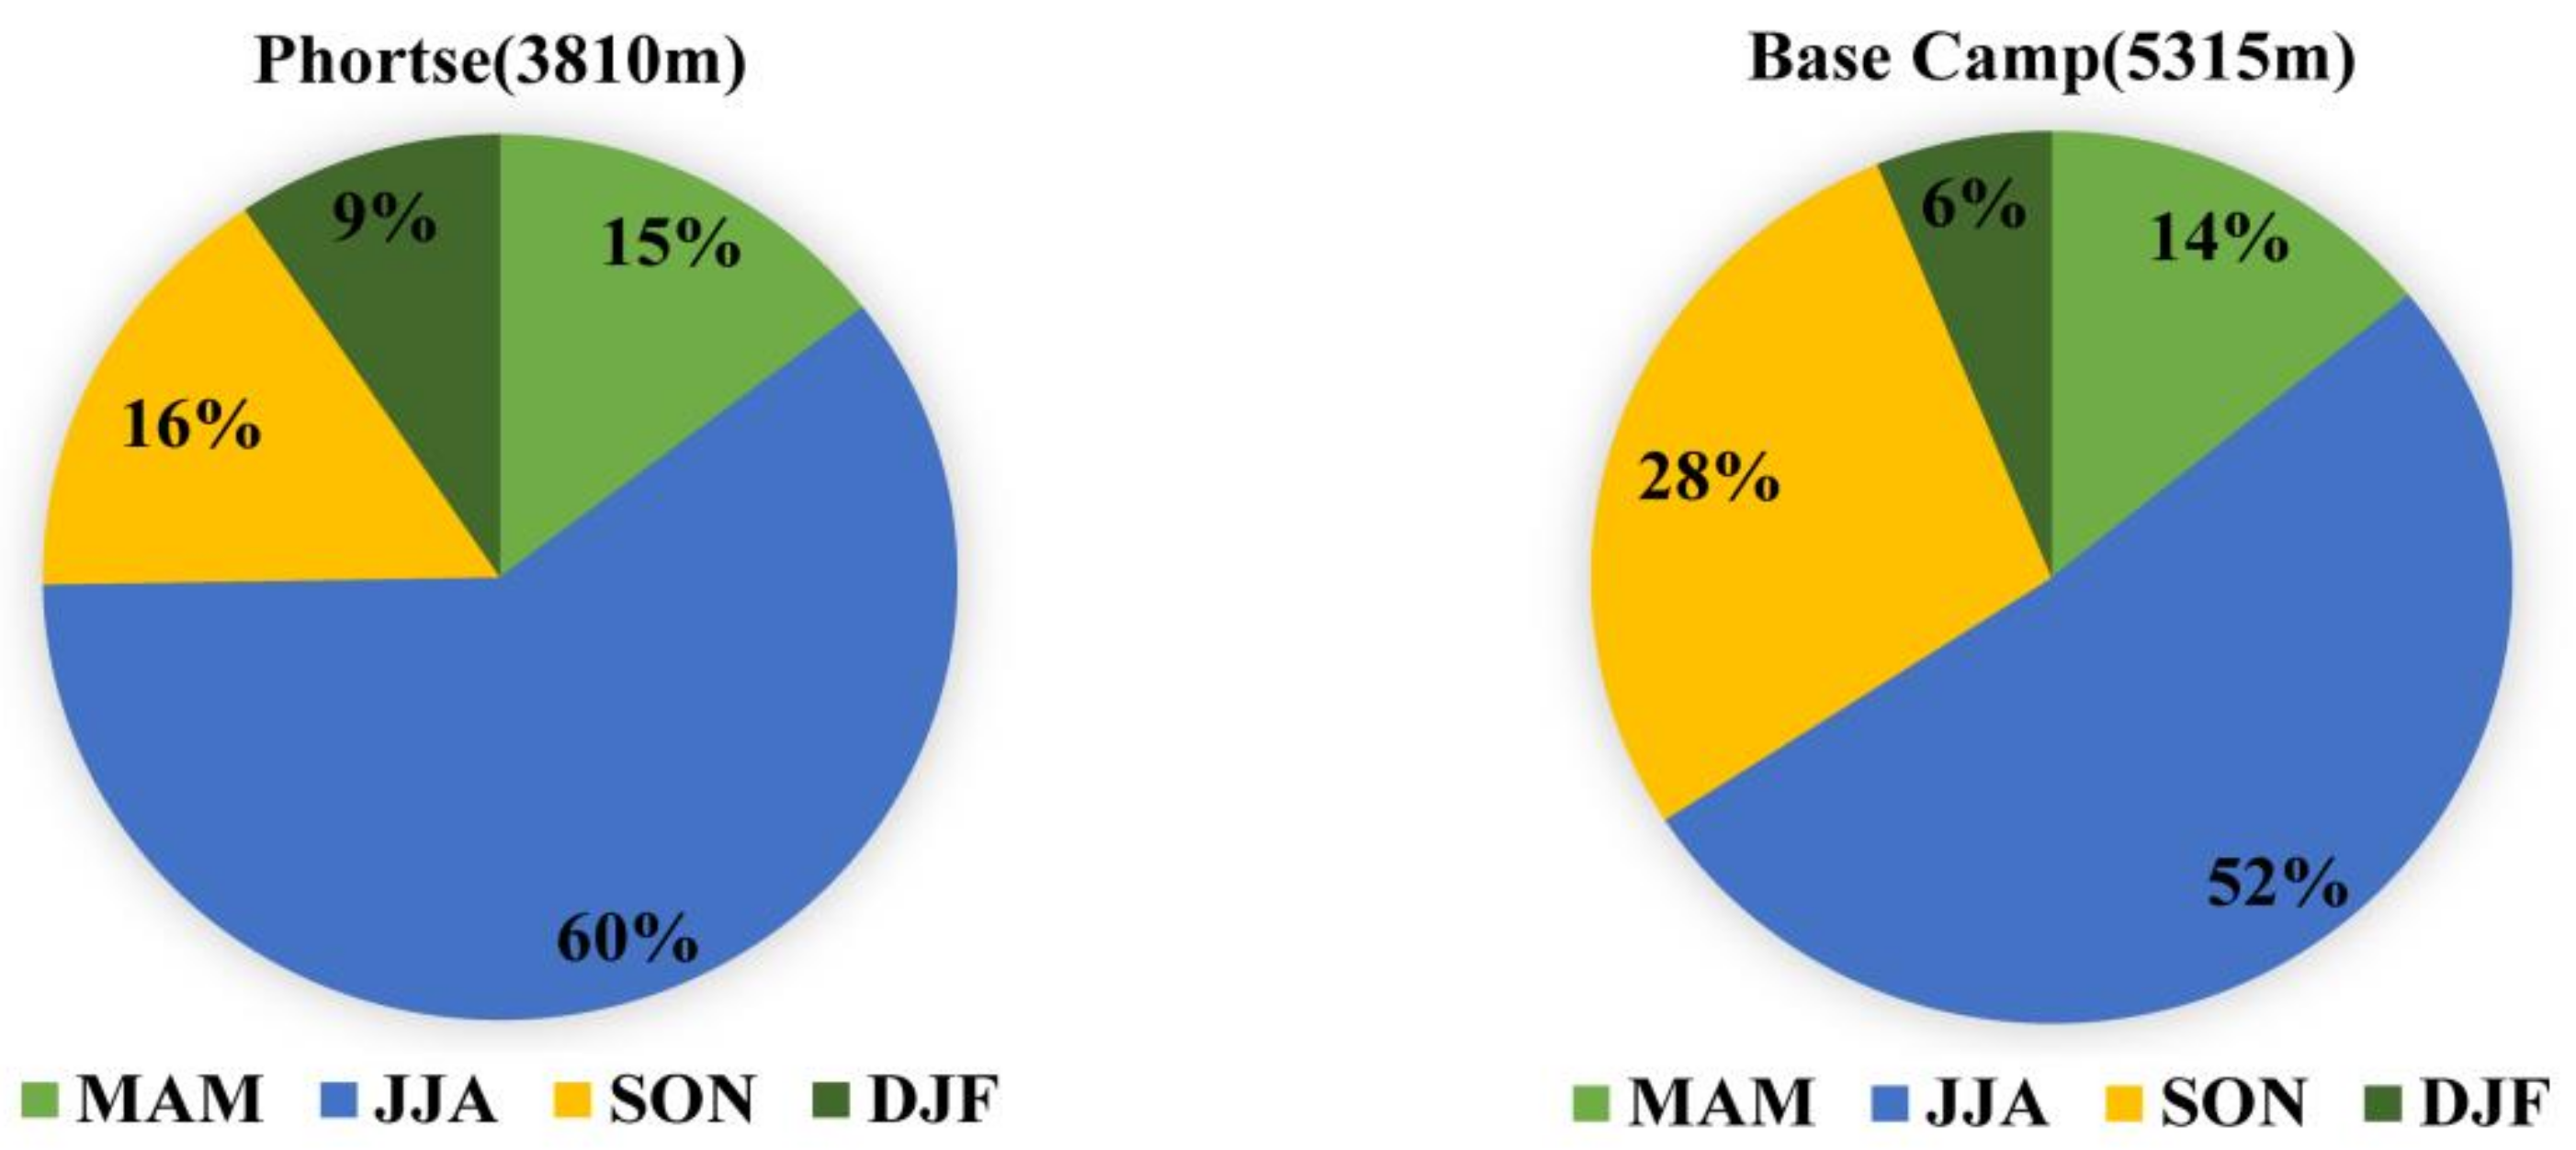
There is a clear seasonal variation in precipitation on the southern slopes of Mt. Everest, with a significant increase in precipitation in summer, such as the maximum monthly precipitation of 231 mm in Phortse in July 2020 and 189 mm in Base Camp in August 2020. In contrast, the precipitation in winter is extremely low, such as 0 in Base Camp in December 2019. As seen in Figure 3, the seasonal distribution of precipitation in Phortse and Base Camp has the same characteristics, with summer precipitation accounting for 60% and 52%, respectively, of the annual precipitation and winter precipitation the least, accounting for only 9% and 6%, respectively.
3.2. Atmospheric Circulation Background
The main factors affecting atmospheric water vapor content are geographical location, altitude and atmospheric circulation. For the study area of this paper—Mt. Everest—the geographical location and altitude were determined. Therefore, we will analyze the horizontal transport characteristics of water vapor on the plateau from the perspective of atmospheric circulation.
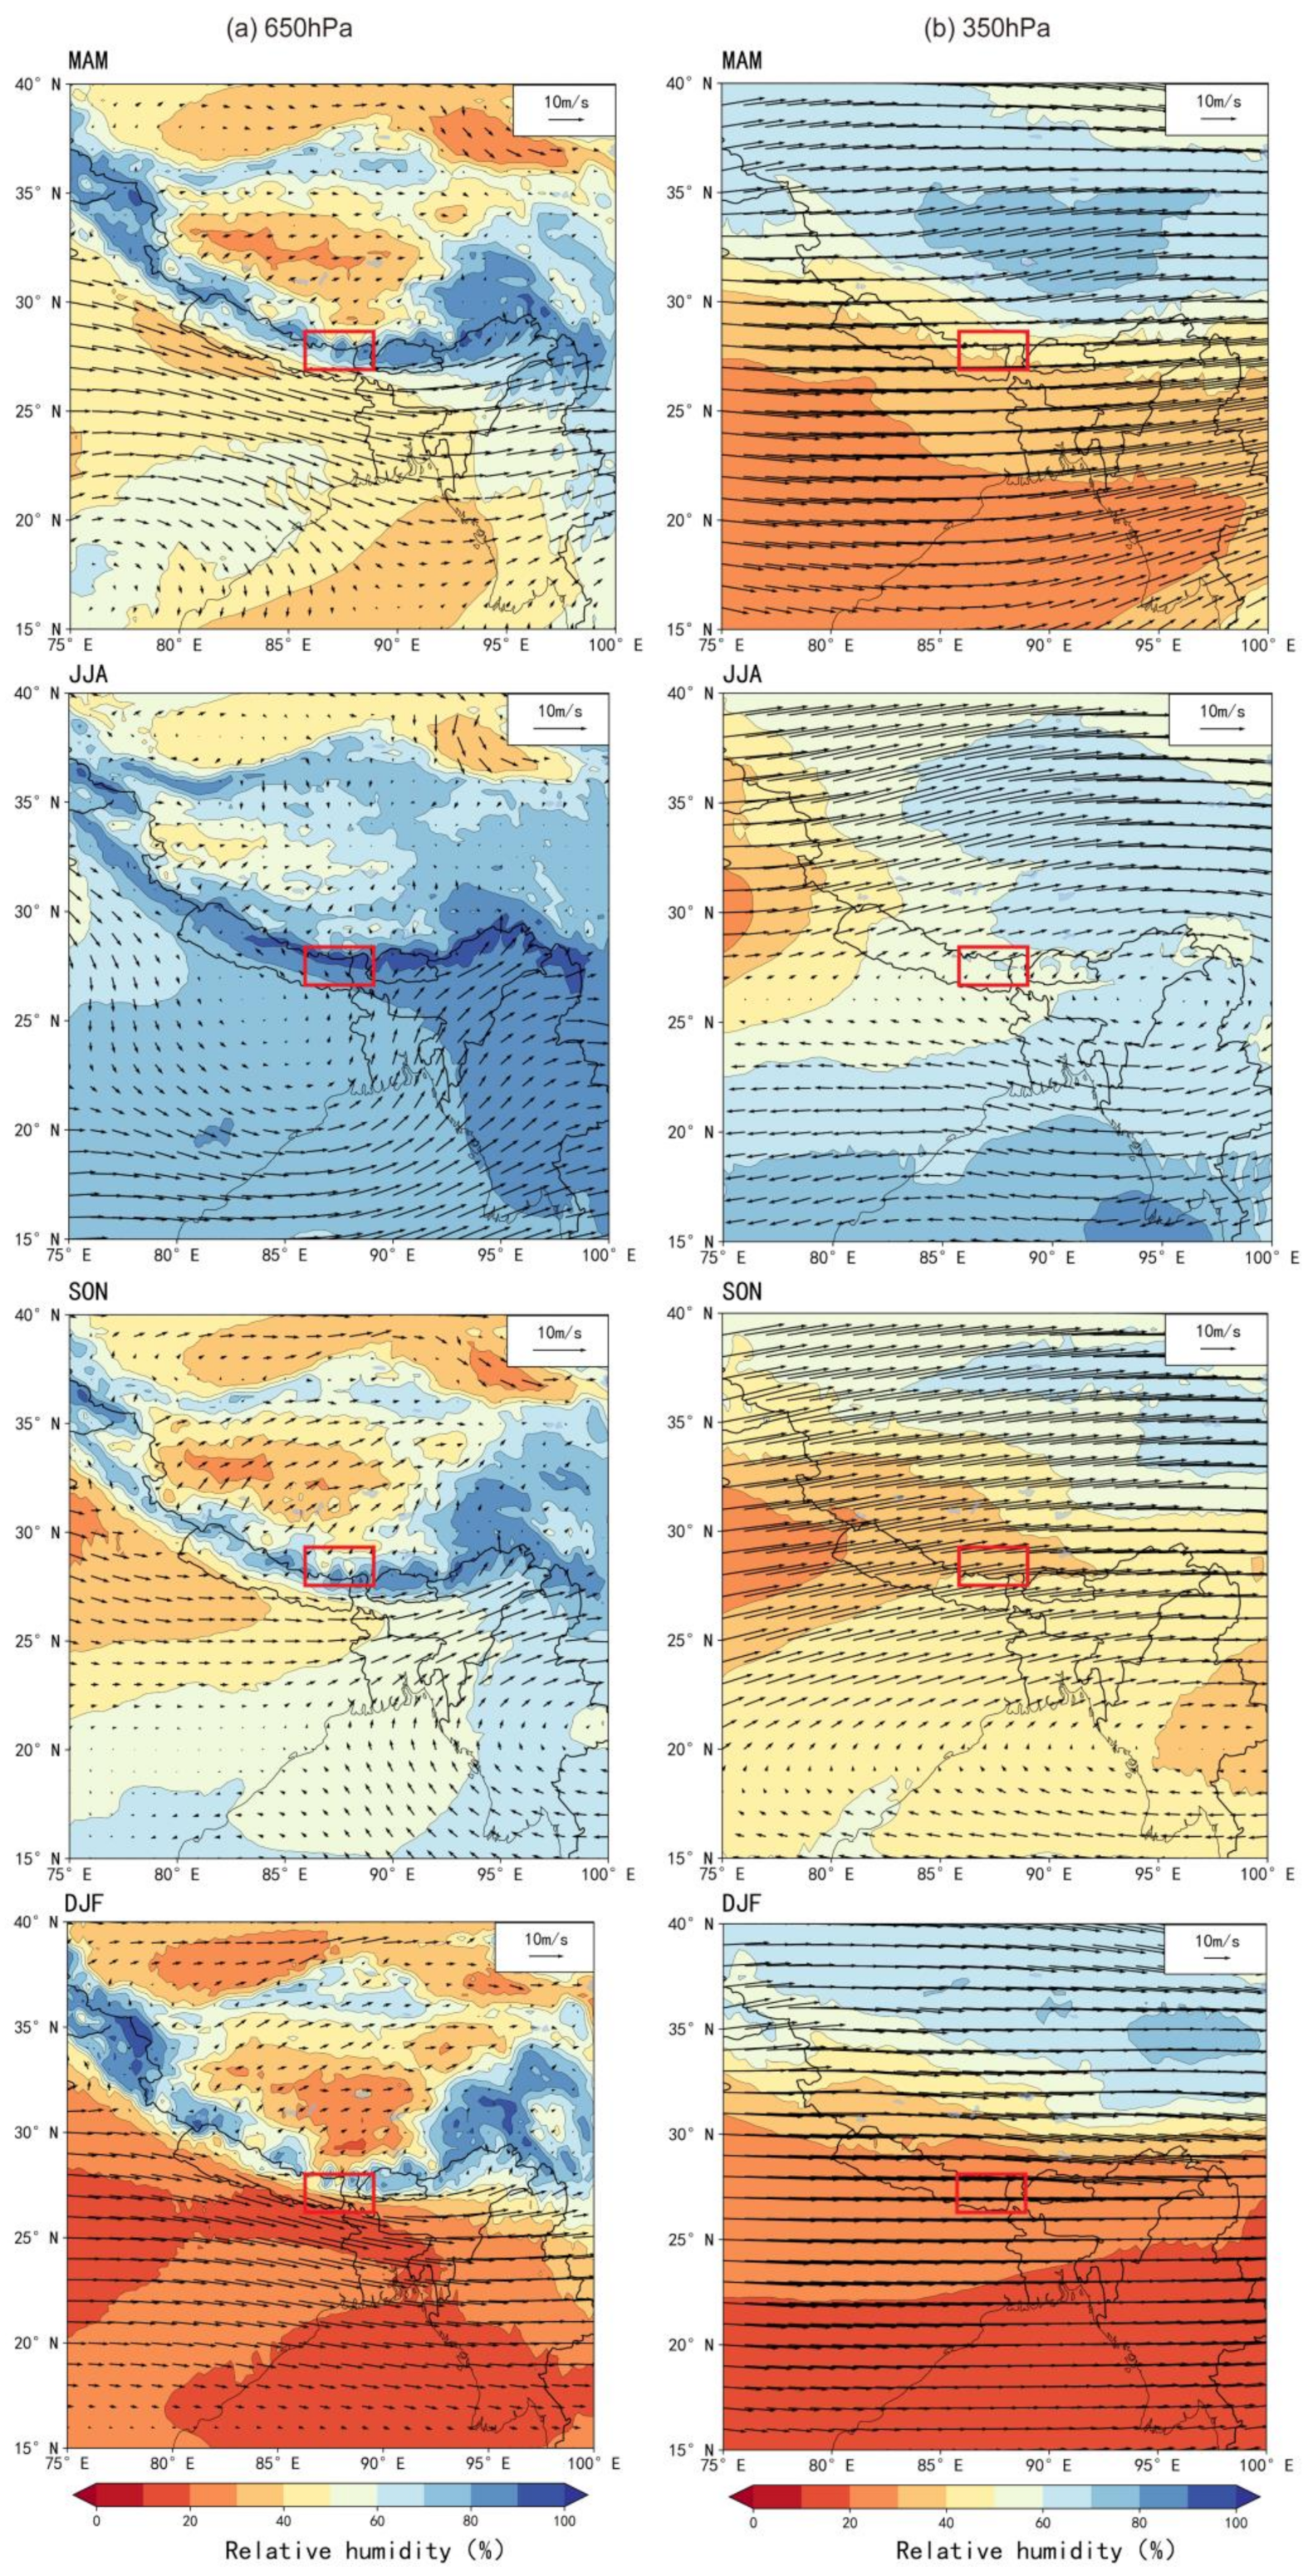
The annual mean pressure at Phortse station is 646 hPa, which is very close to 650 hPa, and the annual mean pressure at Balcony station is 353 hPa, which is very close to 350 hPa. Therefore, Figure 4 shows the pattern of relative humidity and wind at 650 hPa and 350 hPa, for the Mt. Everest region in spring (MAM, March to May), summer (JJA, June to August), autumn (SON, September to November) and winter (DJF, December to February) from June 2019 to June 2021.
At 650 hPa altitude in summer, the source of moisture in this area is mainly the warm and humid airflow from the southwest, and the relative humidity is above 60%. As the high-altitude Mt. Everest plays a role in blocking the airflow, water vapor has a cyclonic circulation in the southwestern Himalayas, and the convergence is obvious. Between the Tibetan Plateau and the Indian plains, there is a mountainous water vapor zone with high relative humidity, which can reach 100% and is very favorable for the formation of precipitation. Some of the air flows cross the Himalayas, bringing precipitation to the southwestern part of the TP. In winter, the circulation situation is relatively homogeneous and the whole plateau is mainly controlled by westerly air flows, with relative humidity mostly reduced to below 60%. When the airflow passes through the Himalayas, a small amount crosses the mountain range and enters the hinterland of the plateau, while most of the wind flow continues to move eastward.
At the altitude of 350 hPa, the relative humidity in the region is around 50% in summer, significantly less than the water vapor content at 650 hPa. The warm humid moisture from the southeast Bay of Bengal partly crosses the Himalayas into the TP, and partly converges westward with the warm humid cyclonic airflow from India. Except for summer, straight west airflows prevail in all seasons. Compared with 650 hPa, the water vapor gradient is greater in both the north–south and east–west directions.
3.3. Characteristics of Water Vapor Transport during the Monsoon Period
From Figure 4, we can see that except for summer, the Mt. Everest region is mostly controlled by dry and cold westerly winds with low relative humidity, and very little water vapor crosses the Himalayas to reach the interior of the Tibetan Plateau. To further determine whether the water vapor in the Mt. Everest region can climb from the southern slope to a sufficient height to be transported to the interior of the TP, we focused on the monsoon period when water vapor content is sufficient. To ensure consistent and continuous precipitation data, we chose meteorological elements for the whole year of 2020 for analysis.
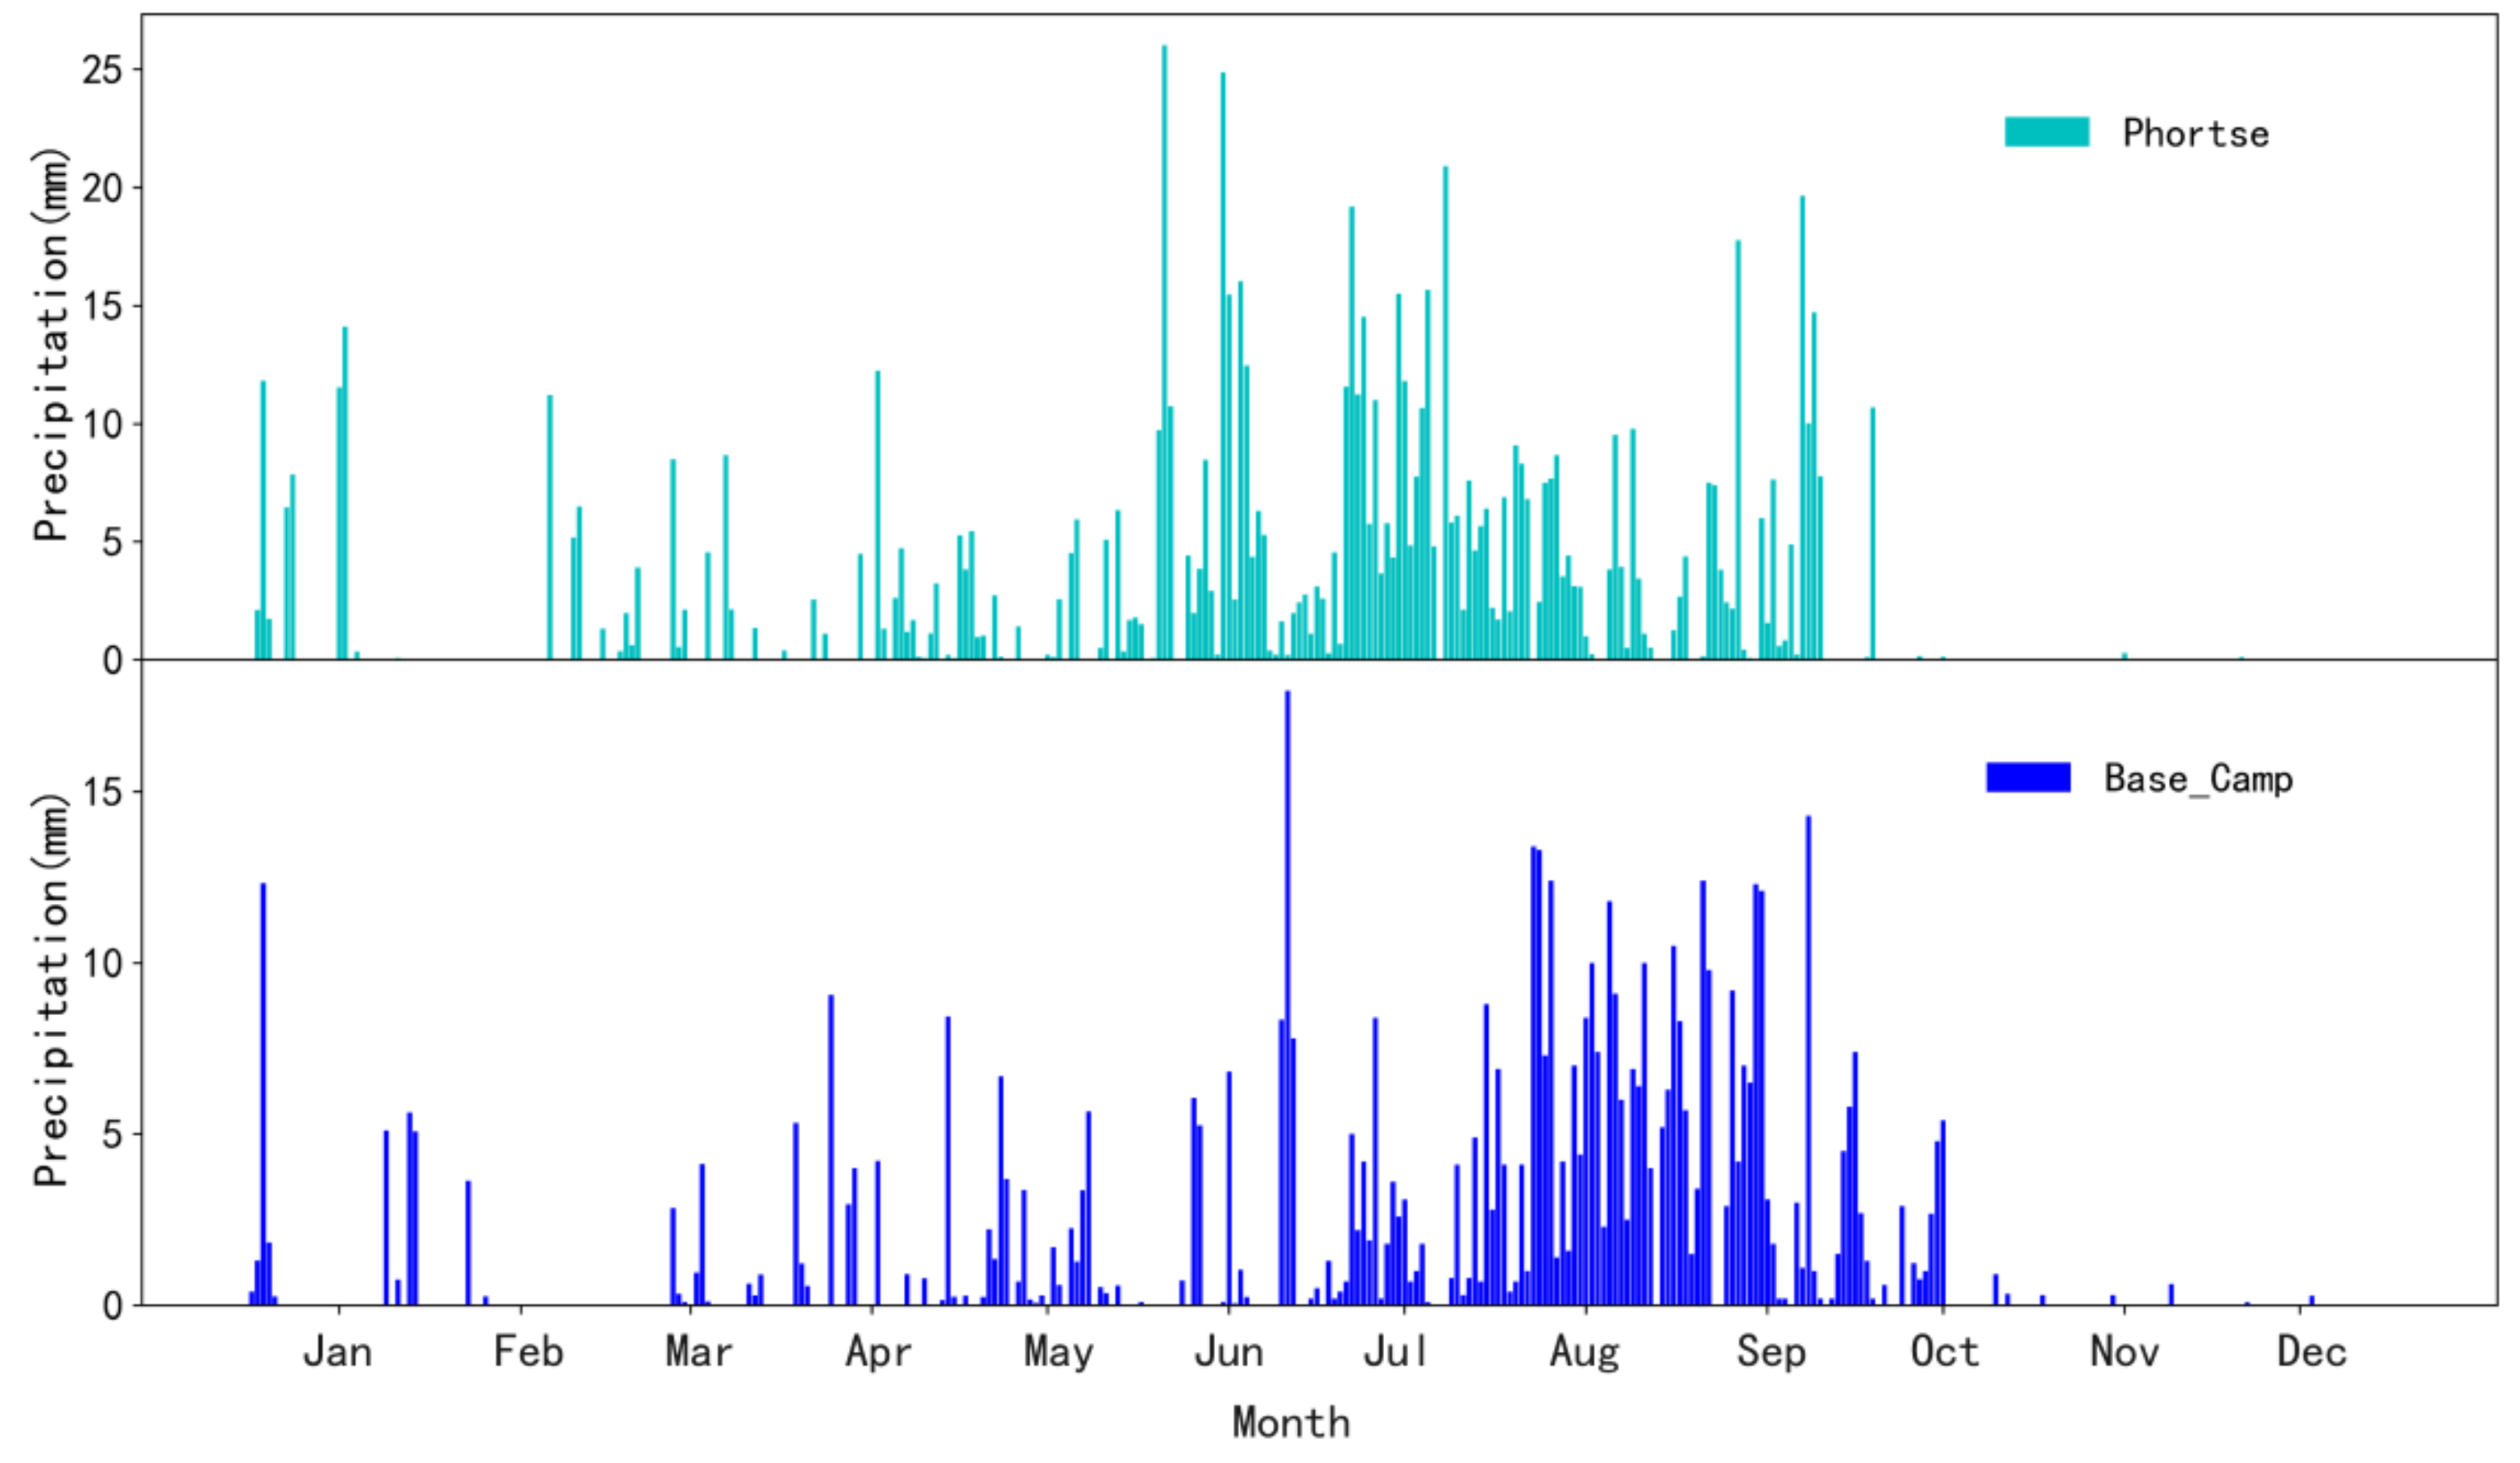
According to the “2020 Southwest Monsoon End of Season Report” from the Indian Meteorological Department (IMD), the monsoon arrived over Kerala on its normal date on 1 June 2020 and began to retreat on 28 September 2020, so IMD set June to September in 2020 as the monsoon period [49]. Figure 5 shows the daily precipitation variation of Phortse and Base Camp during 2020, which both had stable precipitation almost every day during the monsoon period. For Phortse, the cumulative precipitation for the whole year of 2020 was 846.2 mm, and the precipitation during the monsoon period was 632.3 mm, accounting for 74.7%. The precipitation during the monsoon period for Base Camp was 438.8 mm, accounting for 74.0% of the annual precipitation (592.7 mm).
The total water vapor flux divergence can be divided into steady and transient components [48,50]. Previous studies have shown that water vapor transport in East Asia is dominated by the steady component, and the transient component can be ignored. Therefore, the study of water vapor flux divergence in this paper mainly discusses the steady component of water vapor flux divergence [23,51,52]. Figure 6 shows the monthly water vapor flux (vector) and water vapor flux divergence (color filling) from the surface to 350 hPa during the monsoon period.
As shown in Figure 6, in the Mt. Everest region, the distributions of water vapor flux and water vapor flux divergence for all months during the monsoon period were very similar. In June and July, the water vapor in the Mt. Everest region mainly comes from the Indian summer monsoon. Water vapor flux is basically less than 10 kg/(m·s), and the water vapor flux divergence of the whole layer is mostly between 0 and 2 kg/(m2·s). In August and September, the water vapor from the Bay of Bengal is transported westward along the southern side of the TP and converges with the Indian monsoon to form a cyclone, while a limited amount of water vapor is transported across the Himalayas to the inner side of the plateau. It can be seen that water vapor is convergent in most areas of the TP, especially near the northern slopes of the Himalayas on the southern side of the TP. In contrast, the south side of Mt. Everest is irradiated, and the very high altitude of Mt. Everest has an obvious effect by blocking the airflow.
3.4. Daily Water Vapor Flux Divergence and the Height at Which Water Vapor Can Climb
Through the previous analysis of the water vapor circulation background and the water vapor flux divergence in the monsoon period in Mt. Everest, we determined that Mt. Everest has a strong blocking effect on water vapor due to its extremely high altitude. Under the conditions of seasonal and monthly averages, only a small amount of water vapor can climb directly to the height of Mt. Everest’s summit and from the southern slope to the northern slope. It was important to establish if water vapor can only pass through Mt. Everest by bypass, or also by the “up-and-over” route of Indian deep convection. To determine whether water vapor can climb to a sufficient height on the southern slope of Mt. Everest to be transported to the Tibetan Plateau, we selected the monsoon period with high water vapor content as the object of our study. We calculated the daily water vapor flux divergence in the monsoon period and observed the distribution of vertical velocity and relative humidity with pressure and the way of water vapor transport.
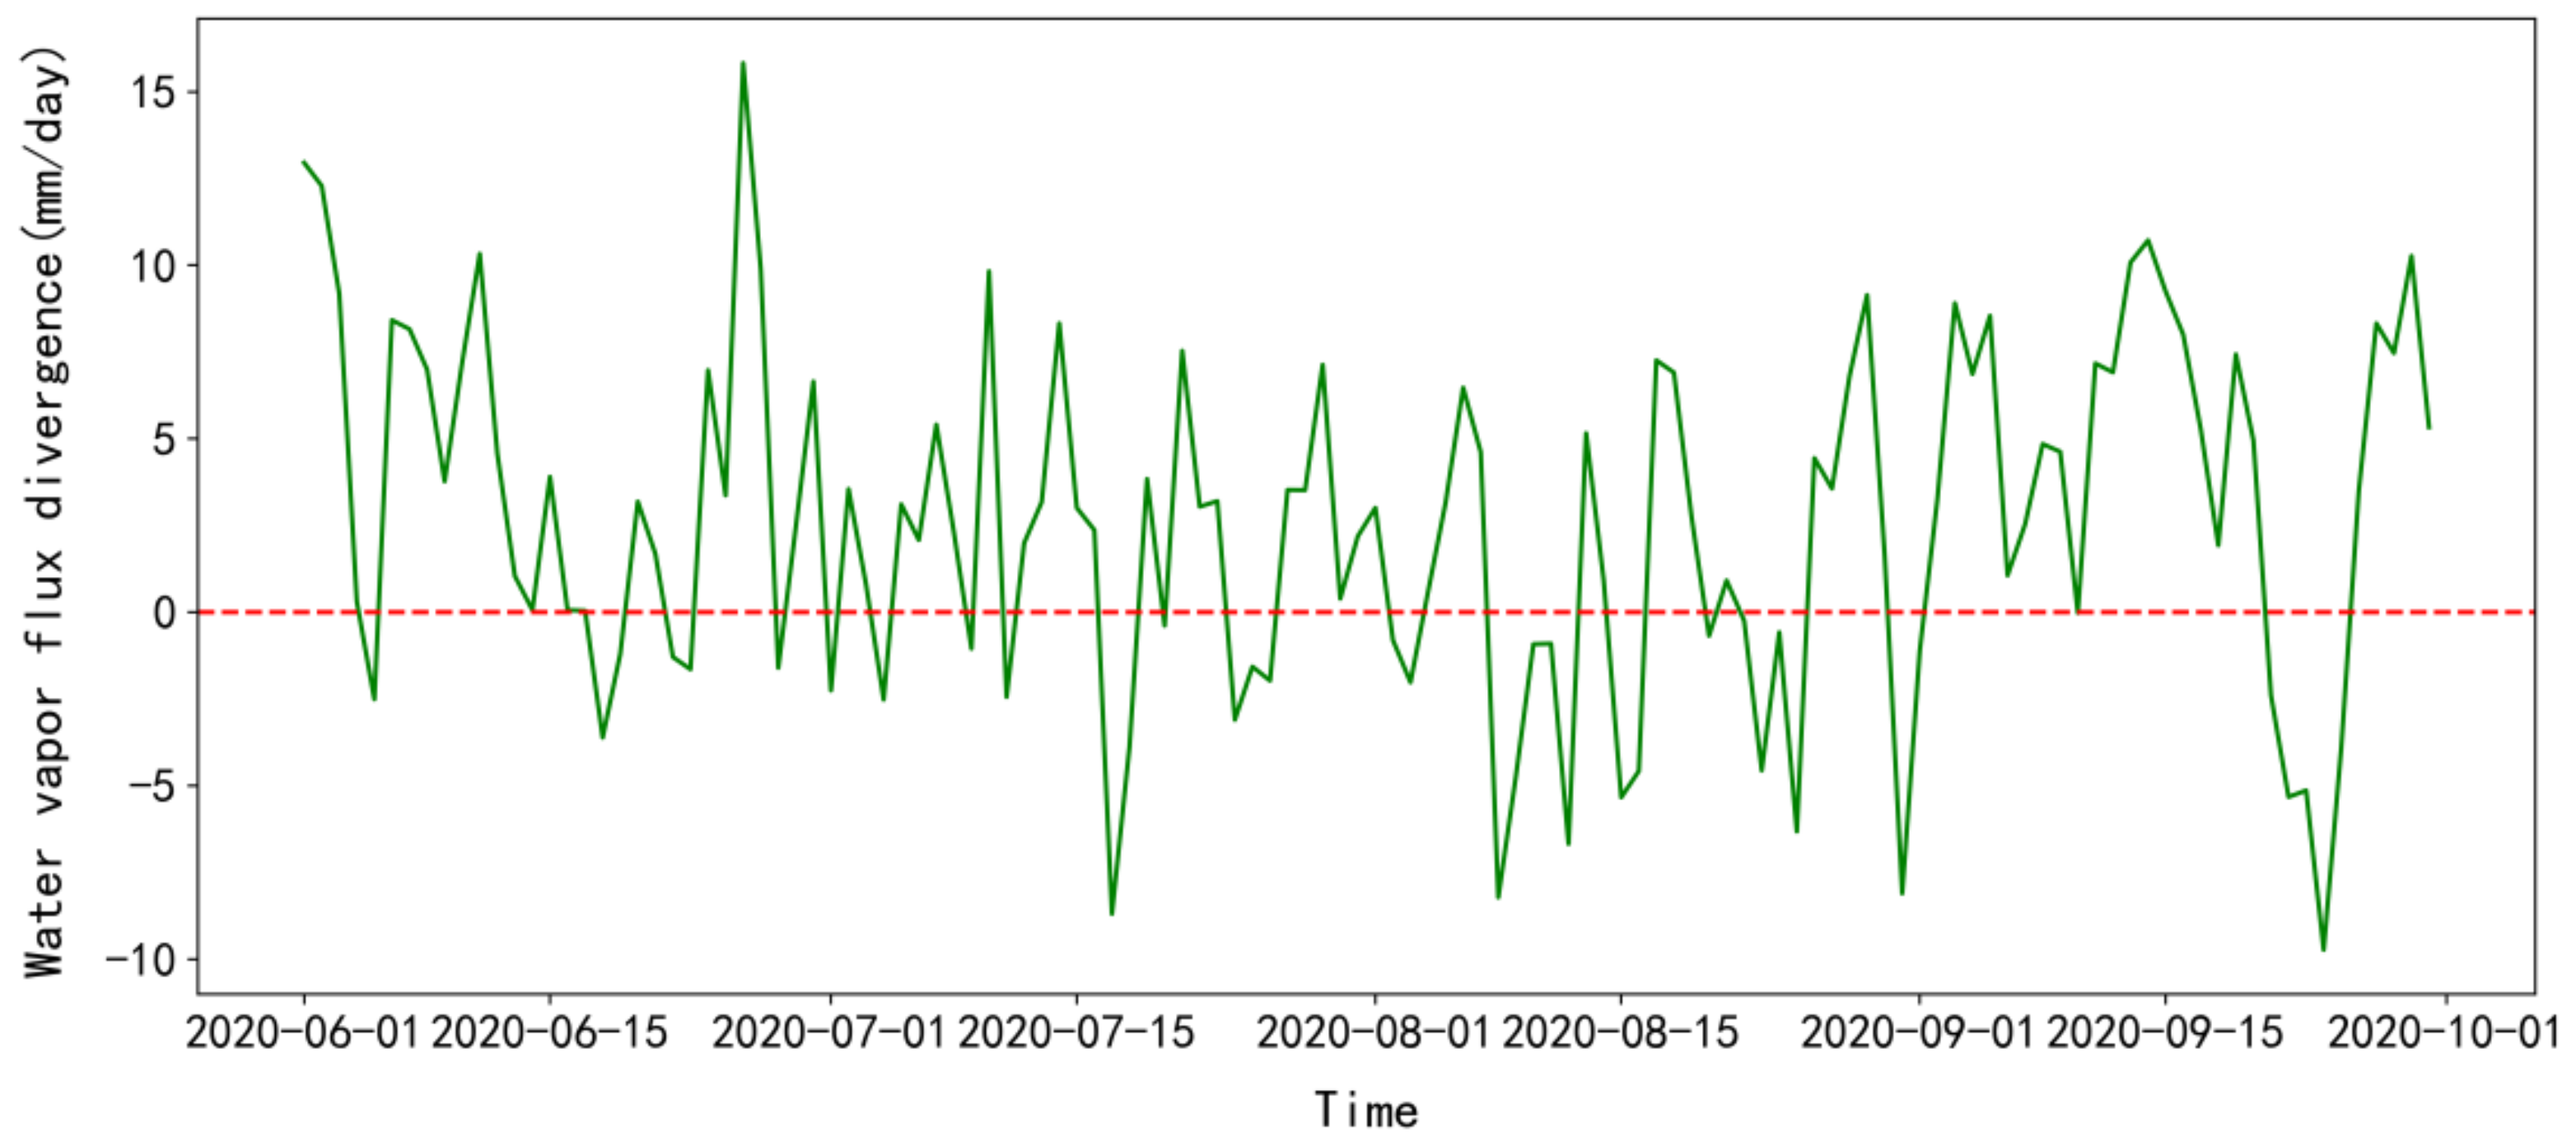
The average elevation of the Tibetan Plateau is greater than 4000 m, therefore we considered whether water vapor can be transported to the height of Mt. Everest (refer to Balcony’s annual average pressure of 353 hPa) and thus cross the Himalayas. We used the hourly data in ERA5 to calculate the magnitude of the daily whole-layer water vapor flux dispersion between the surface and 350 hPa in the range of longitude 86–89° E and latitude 27–29° N, and the results are shown in Figure 7. A water vapor flux divergence less than 0 indicates that the convergence of water vapor flux in the whole layer and the water vapor can climb to a sufficient height.
The vertical transport of moisture has an important relationship with the atmospheric vertical velocity. The vertical velocity directly determines the maximum height of moisture transport, and directly affects the magnitude of water vapor vertical transport. As seen in Figure 7, the number of days with A < 0 during the monsoon period (June–September) is 38 days, accounting for 31% of the total number of days. From them, we selected several days with large convergence to observe the vertical velocity, relative humidity and wind transport.
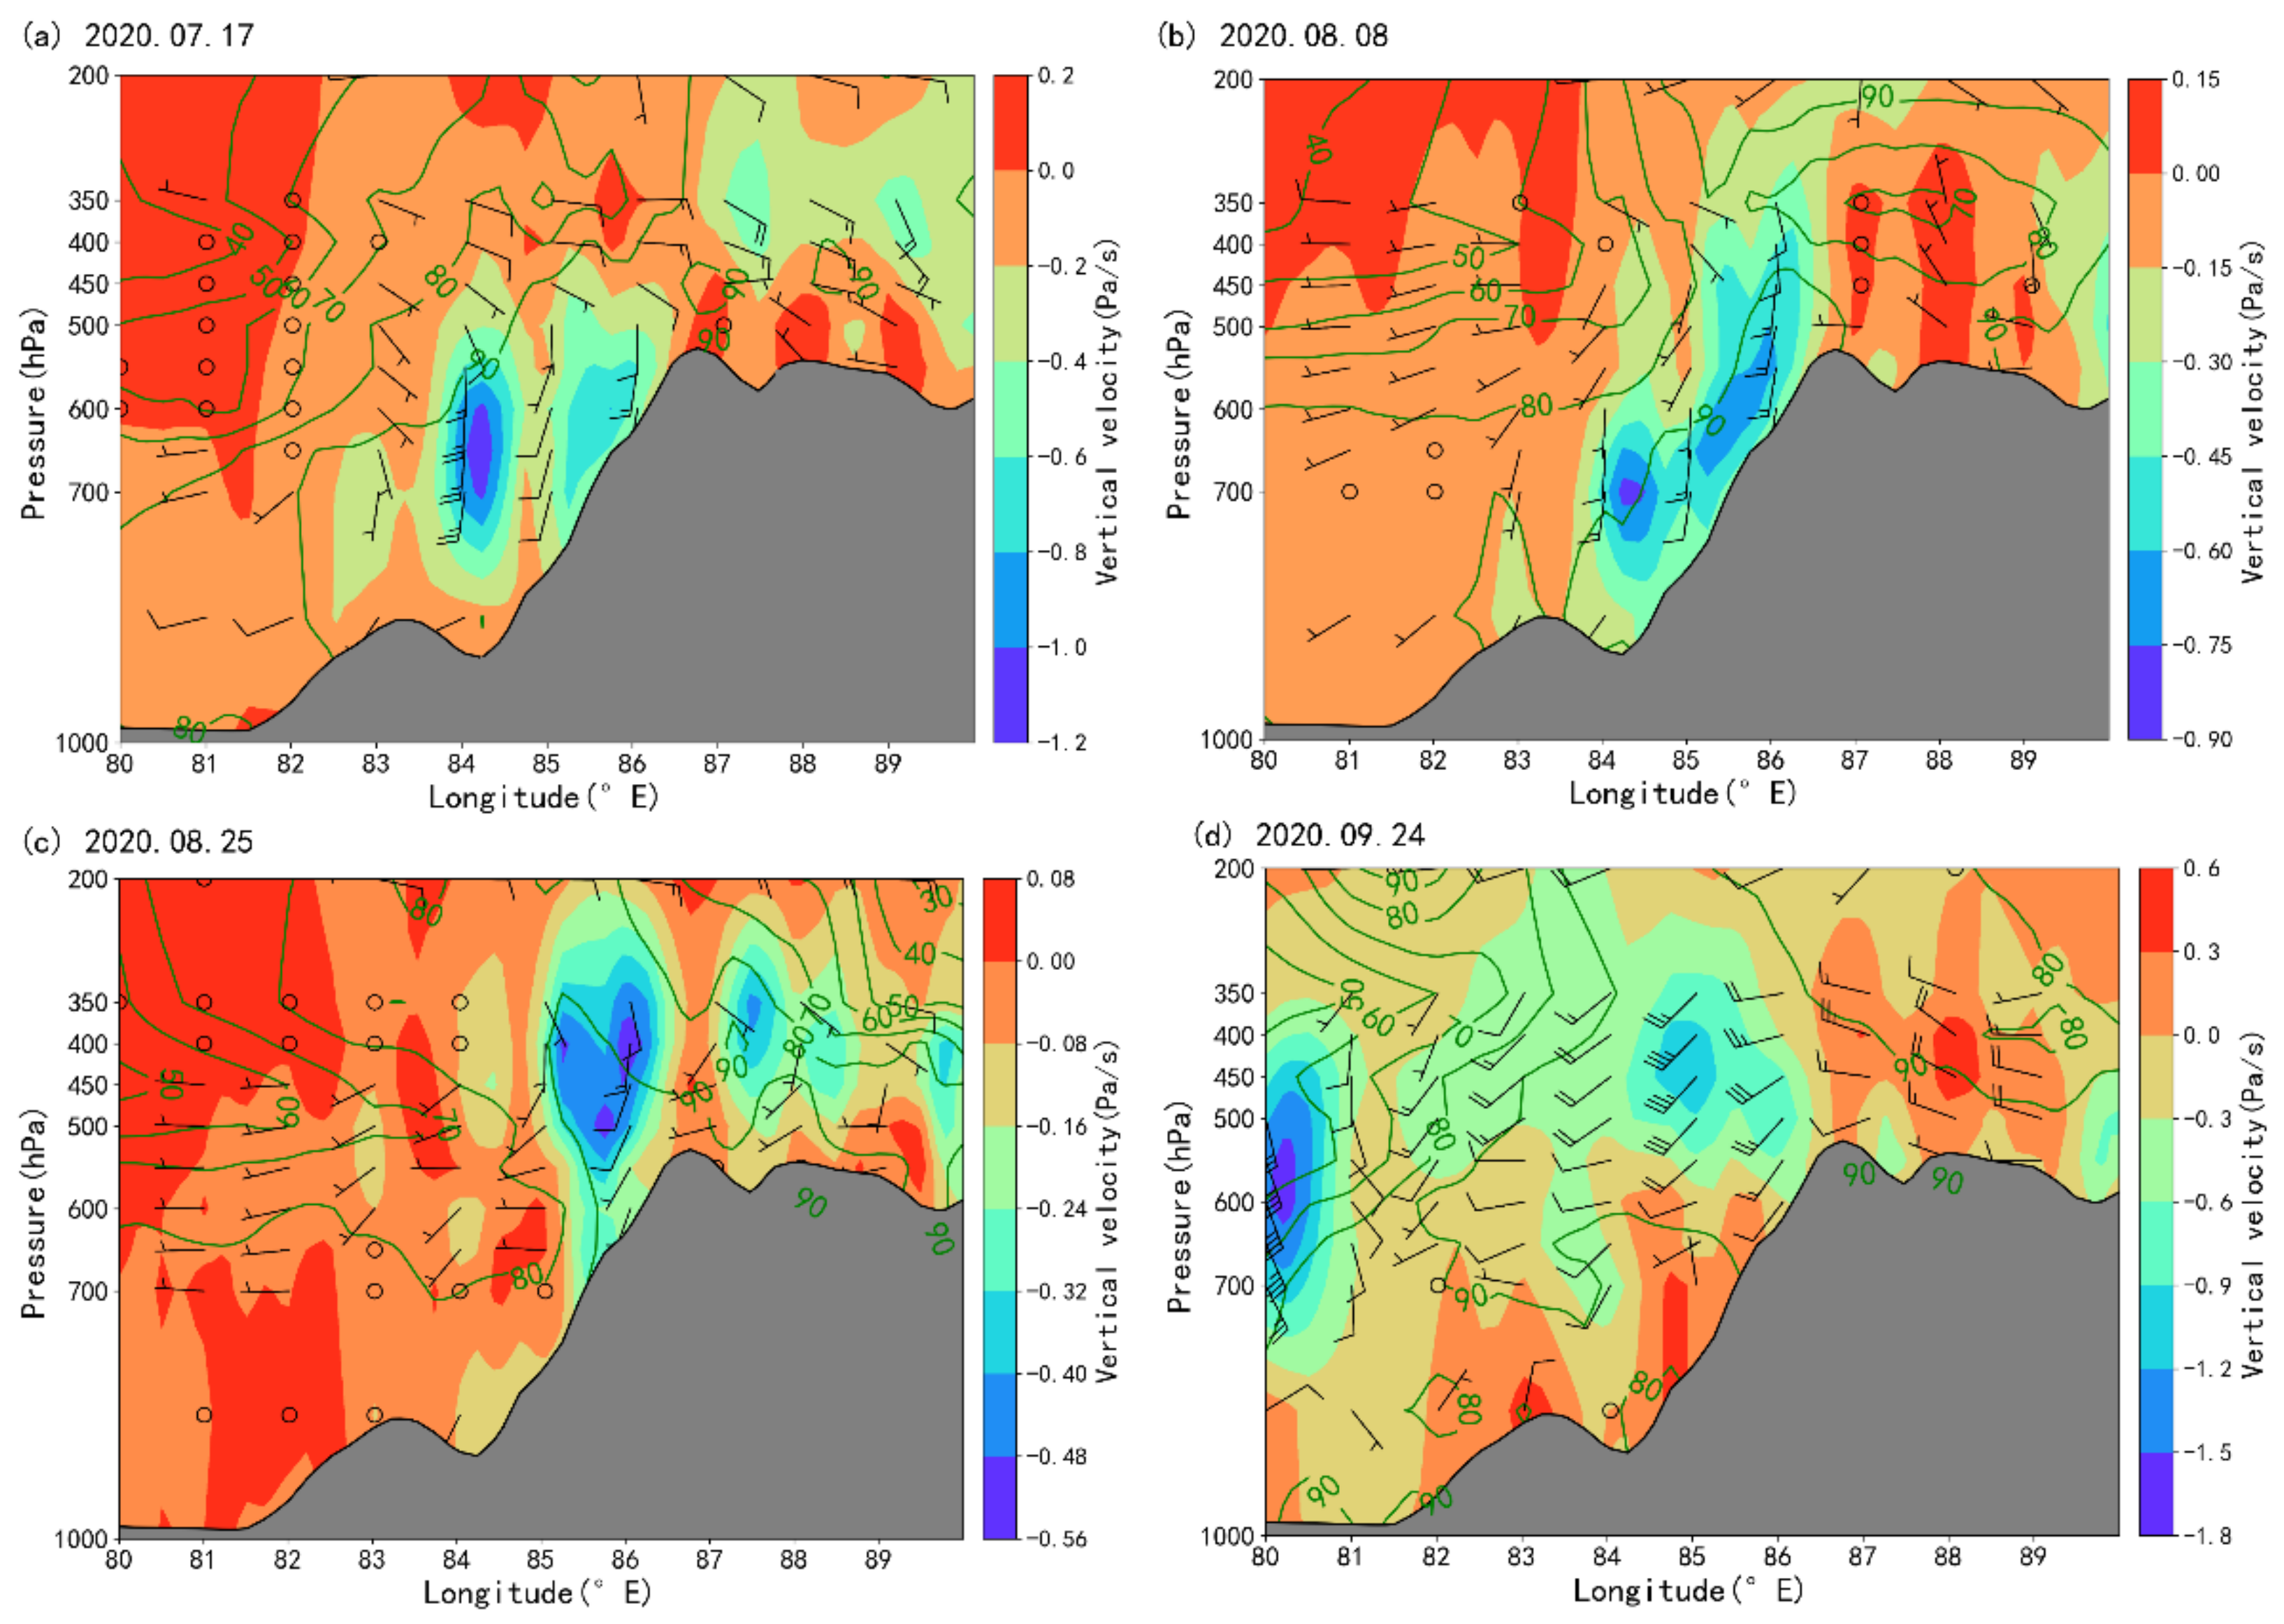
Most of the water vapor in the southern Himalayas comes from the southwest outside of the TP and it is clearly influenced by the Indian summer monsoon. The monsoon vigorously develops and transports abundant moisture from the Indian Ocean to the Himalayas, and the water vapor is forced to lift up on the southern slope of Mt. Everest due to its high topography. Thus the water vapor flux divergence of the whole layer on the southern side of Everest is negative, and the water vapor converges and is transported upward. According to the longitude profile of the vertical velocity in Figure 8, the vertical velocity of the whole layer is basically negative, and the water vapor transported upward can reach the upper of the troposphere height. Moreover, there is strong downward transport over the plateau from about 220 hPa, and the large value center is about 400 hPa. It is consistent with a previous conclusion that there is a low water vapor center at 215 hPa over the plateau [51].
Table 4 shows the monthly average value of water vapor flux divergence on the southern slope of Mt. Everest and its surroundings (86–89° E, 27–29° N) during the monsoon period, the days when the water vapor flux in the whole layer is negative, and the amount of water vapor transported on the days when the water vapor flux is negative (mm). The calculation shows that in the 2020 monsoon period (June–September), the sum of the daily water vapor flux convergence with negative water vapor flux divergence is 122 mm.
4. Discussion
Meteorological observations in the Mt. Everest region, for which information is relatively scarce, are important for studying climate change in the region and its impact on glacier changes. Using the newly established network of automatic weather stations in 2019, we analyzed the meteorological elements on the southern slope region of Mt. Everest, which gave us a better understanding of its weather conditions.
We compared the differences in meteorological elements between the southern and northern slope regions of Mt. Everest in combination with the study on the characteristics of meteorological elements on the northern slope of Mt. Everest by Yang et al. [36]. Yang calculated the average temperature and temperature lapse rate of seven meteorological stations on the northern slope of Mt. Everest from 5207 m to 7028 m, from May 2007 to August 2008, and obtained the average temperature of each station from low to high during the study period as 0.2 °C, −1.9 °C, −4.4 °C, −5.4 °C, −8.3 °C, −15.4 °C and −8.7 °C, respectively. It can be seen that the temperature on the northern slope decreases with increasing height, which is the same trend as that on the southern slope. The temperature lapse rates on the northern slope increased from 6.2 °C km−1 at station I to 9.8 °C km−1 at station VI, and the trend of deepening with increasing height is also the same as that on the southern slope, however, the temperature lapse rates on the northern slope are obviously larger than that on the southern slope. This difference should take into account the difference in observation periods, the impact of current global warming trends, differences in observation equipment and the difference in solar radiation received by the location of the station.
For precipitation, in this study, we calculated the cumulative precipitation at Phortse station on the southern slope of Mt. Everest region in 2020 as 846.2 mm, which is much lower than the average annual precipitation of 942 mm at nearby long-term climate stations between 3000 and 4000 m [35]. It is consistent with the trend of a significant decrease in precipitation in the Himalayan region with climate warming [53]. The annual precipitation at Base Camp (5315 m) is 592.7 mm, which is close to the 587 mm precipitation at Pyramid (5035 m) in 2019–2020. Precipitation in the monsoon period accounts for 70% of annual precipitation, which is consistent with the results of previous studies. This result is basically consistent with the results of previous studies [54,55,56].
The study on the temporal and spatial characteristics of water vapor distribution and transport is very important for the understanding of meteorological, hydrological and glacial processes in the Himalayas. In order to understand the water vapor transport process in the Himalayas, we must deeply understand the changes of wind convergence and divergence [57]. For vertical water vapor transport in the Mt. Everest region, it is widely believed that due to the high altitude of the Himalayas, it is difficult for water transport by upslope. Through the analysis of high-resolution satellite data, Lin et al. found that the deep convection system on the Indian plain provides the main source of summer precipitation on the Tibetan Plateau. This connection is achieved through an up-and-over water vapor channel, where convective systems on the Indian plains carry water vapor and hydrate to the mid-altitude, which is then transported to the southwestern Tibetan Plateau by the southwest airflow from the mid-altitude, and eventually forms precipitation [29,30].
To determine whether the water vapor at the foot of the southern slope of Mt. Everest can be transported to the northern slope by climbing to a sufficient height, we calculated the whole-layer water vapor flux divergence from a selected range of the southern slope of Mt. Everest and verified the water vapor circulation background and vertical velocity to demonstrate that with sufficient water vapor supply, strong convection and large vertical velocity, the water vapor can be lifted to a certain height and thus cross the Himalayas to the TP.
Although we have proved that water vapor can be transported over the Himalayas by climbing flow under certain conditions, and have calculated the amount of water vapor transported by water vapor convergence, it is still difficult to determine the proportion of moisture reaching the peak height compared to the initial water vapor, and the proportion of water vapor being transported from the southern slope to the plateau and forming precipitation. There is still a long way to go to study the vertical transport characteristics of water vapor in the Mt. Everest region.
5. Conclusions
Based on the hourly AWS observations from 2019 to 2020 on the southern slope of Mt. Everest and ERA5 reanalysis data, this study identifies moisture transport over Mt. Everest area, and provides the main conclusions of this paper as follows:
(1) The meteorological characteristics showed obvious seasonal variations during the observational period. In summer, when temperature rises and the water vapor supply is sufficient, relative humidity increases, precipitation increases and the temperature lapse rate becomes shallow. In winter, controlled by the dry and cold westerly air flow, the temperature and relative humidity in the Mt. Everest area decrease, the temperature lapse rate becomes deeper, and the precipitation is very little. (2) In the vertical direction, the temperature on the southern slope of Mt. Everest decreases with an increase in height. The annual average temperature of each station is: 4.2 °C at Phortse, −3.2 °C at Base Camp, −10.3 °C at Camp II, −22.0 °C at South Col and −25.4 °C at Balcony. With an increase in altitude, the temperature lapse rate becomes deeper. During the observation period, the average temperature lapse rates during the observation period for Phortse–Base Camp, Base Camp–Camp II, Camp II–South Col, and South Col–Balcony are: −4.7 °C km−1, −6.3 °C km−1, −7.7 °C km−1 −8.1 °C km−1, respectively. The change of relative humidity with height is not obvious, while the precipitation decreases with an increase in height. For Phortse, the cumulative precipitation for the whole year of 2020 was 846.24 mm, and the annual precipitation was 592.74 mm for Base Camp. (3) In summer, the water vapor in the area of Mt. Everest mainly comes from the Indian summer monsoon in the southwest. The high altitude of Mt. Everest prevents the water vapor from transporting to the East. There is an obvious cyclone flow field to the south of Mt. Everest. The water vapor converges and rises as a heat source, and the relative humidity is high. In winter, the circulation situation is relatively simple. The whole plateau is mainly controlled by a westerly air flow, and the relative humidity is usually lower than 60%. (4) The research shows that under certain conditions it is feasible for water vapor to climb up from the southern slope of Mt. Everest and cross the Himalayas to the northern slope. In the monsoon period of 2020, at the height of the surface to 350 hPa, the number of days of negative water vapor divergence in the whole layer accounted for 31%, and the amount of water transported through water vapor convergence was 122 mm.
Author Contributions
Conceptualization, B.X. and A.X.; methodology, B.X. and A.X.; software, B.X.; validation, A.X.; formal analysis, B.X. and A.X.; resources, B.X.; data curation, J.Z.; writing—original draft preparation, B.X. and A.X.; writing—review and editing, A.X.; visualization, B.X.; project administration, A.X. All authors have read and agreed to the published version of the manuscript.
Funding
This research was funded by the National Natural Science Foundation of China, grant number 41671073 and 41476164.
Institutional Review Board Statement
Not applicable.
Informed Consent Statement
Not applicable.
Data Availability Statement
The automatic weather station data presented in this study are available at https://www.nationalgeographic.com/environment/topic/perpetual-planet (accessed on 1 September 2021), the ERA5 presented in this study are available at https://cds.climate.copernicus.eu/#!/search?text=ERA5&type=dataset (accessed on 1 September 2021).
Acknowledgments
The observation data in this study are from the automatic weather stations established by National Geographic and Rolex’s Perpetual Planet Everest expedition on the southern slope of Everest in 2019.We appreciate the efforts of all mountaineers and technical support personnel in the plan and the support of all relevant institutions of the government of Nepal (Ministry of hydrology and meteorology, Ministry of energy, water resources and irrigation, Ministry of national parks and wildlife protection, Ministry of forests and environment, Ministry of culture, tourism and civil aviation, Ministry of investigation). Thanks to S.C. Kang, Tom Matthews and Baker Perry for their theoretical help and improvement suggestions for this article.
Conflicts of Interest
The authors declare no conflict of interest. We declare that we have no financial or personal relationships with people or organizations that can inappropriately influence our work.
References
- Qiu, J. The third pole. Nature 2008, 454, 393–396. [Google Scholar] [CrossRef] [Green Version]
- Kang, S.; Xu, Y.; You, Q.; Flügel, W.-A.; Pepin, N.; Yao, T. Review of climate and cryospheric change in the Tibetan Plateau. Environ. Res. Lett. 2010, 5, 15101. [Google Scholar] [CrossRef]
- Yao, T.; Thompson, L.G.; Mosbrugger, V.; Zhang, F.; Ma, Y.; Luo, T.; Xu, B.; Yang, X.; Joswiak, D.R.; Wang, W.; et al. Third Pole Environment (TPE). Environ. Dev. 2012, 3, 52–64. [Google Scholar] [CrossRef]
- Yao, T.; Thompson, L.; Yang, W.; Yu, W.; Gao, Y.; Guo, X.; Yang, X.; Duan, K.; Zhao, H.; Xu, B.; et al. Different glacier status with atmospheric circulations in Tibetan Plateau and surroundings. Nat. Clim. Chang. 2012, 2, 663–667. [Google Scholar] [CrossRef]
- Xu, X.; Lu, C.; Shi, X.; Gao, S. World water tower: An atmospheric perspective. Geophys. Res. Lett. 2008, 35, L20815. [Google Scholar] [CrossRef]
- Yao, T.; Xue, Y.; Chen, D.; Chen, F.; Thompson, L.; Cui, P.; Koike, T.; Lau, W.K.M.; Lettenmaier, D.; Mosbrugger, V.; et al. Recent Third Pole’s Rapid Warming Accompanies Cryospheric Melt and Water Cycle Intensification and Interactions between Monsoon and Environment: Multidisciplinary Approach with Observations, Modeling, and Analysis. Bull. Am. Meteorol. Soc. 2019, 100, 423–444. [Google Scholar] [CrossRef]
- You, Q.; Cai, Z.; Pepin, N.; Chen, D.; Ahrens, B.; Jiang, Z.; Wu, F.; Kang, S.; Zhang, R.; Wu, T.; et al. Warming amplification over the Arctic Pole and Third Pole: Trends, mechanisms and consequences. Earth-Sci. Rev. 2021, 217, 103625. [Google Scholar] [CrossRef]
- You, Q.; Jiang, Z.; Moore, G.W.K.; Bao, Y.; Kong, L.; Kang, S. Revisiting the Relationship between Observed Warming and Surface Pressure in the Tibetan Plateau. J. Clim. 2017, 30, 1721–1737. [Google Scholar] [CrossRef]
- You, Q.; Kang, S.; Aguilar, E.; Yan, Y. Changes in daily climate extremes in the eastern and central Tibetan Plateau during 1961–2005. J. Geophys. Res. 2008, 113, D07101. [Google Scholar] [CrossRef] [Green Version]
- Immerzeel, W.W.; Lutz, A.F.; Andrade, M.; Bahl, A.; Biemans, H.; Bolch, T.; Hyde, S.; Brumby, S.; Davies, B.J.; Elmore, A.C.; et al. Importance and vulnerability of the world’s water towers. Nature 2020, 577, 364–369. [Google Scholar] [CrossRef]
- Immerzeel, W.W.; van Beek, L.P.H.; Bierkens, M.F.P. Climate Change Will Affect the Asian Water Towers. Science 2010, 328, 1382–1385. [Google Scholar] [CrossRef] [PubMed]
- Zhao, Q.; Ding, Y.; Wang, J.; Gao, H.; Zhang, S.; Zhao, C.; Xu, J.; Han, H.; Shangguan, D. Projecting climate change impacts on hydrological processes on the Tibetan Plateau with model calibration against the glacier inventory data and observed streamflow. J. Hydrol. 2019, 573, 60–81. [Google Scholar] [CrossRef]
- Kuang, X.X.; Jiao, J.J. Review on climate change on the Tibetan Plateau during the last half century. J. Geophys. Res.-Atmos. 2016, 121, 3979–4007. [Google Scholar] [CrossRef]
- Gao, J.; Yao, T.D.; Masson-Delmotte, V.; Steen-Larsen, H.C.; Wang, W.C. Collapsing glaciers threaten Asia’s water supplies. Nature 2019, 565, 19–21. [Google Scholar] [CrossRef] [Green Version]
- You, Q.; Wu, F.; Wang, H.; Jiang, Z.; Pepin, N.; Kang, S. Projected Changes in Snow Water Equivalent over the Tibetan Plateau under Global Warming of 1.5 degrees and 2 degrees C. J. Clim. 2020, 33, 5141–5154. [Google Scholar] [CrossRef]
- Yang, X.G.; Zhang, T.J.; Qin, D.H.; Kang, S.C.; Qin, X.A. Characteristics and Changes in Air Temperature and Glacier’s Response on the North Slope of Mt. Qomolangma (Mt. Everest). Arct. Antarct. Alp. Res. 2011, 43, 147–160. [Google Scholar] [CrossRef] [Green Version]
- Barry, R.G. Mountain Weather and Climate, 3rd ed.; Geographical Controls of Mountain Meteorological Elements; Cambridge University Press: Cambridge, UK, 2008; pp. 24–124. [Google Scholar] [CrossRef]
- Liu, W.G.; Zhang, D.Q.; Qin, X.; van den Broeke, M.R.; Jiang, Y.Y.; Yang, D.Y.; Ding, M.H. Monsoon Clouds Control the Summer Surface Energy Balance on East Rongbuk Glacier (6523 m Above Sea Level), the Northern of Mt. Qomolangma (Everest). J. Geophys. Res.-Atmos. 2021, 126, e2020JD033998. [Google Scholar] [CrossRef]
- Yang, K.; Guyennon, N.; Ouyang, L.; Tian, L.; Tartari, G.; Salerno, F. Impact of summer monsoon on the elevation-dependence of meteorological variables in the south of central Himalaya. Int. J. Climatol. 2018, 38, 1748–1759. [Google Scholar] [CrossRef]
- Zhang, C.; Tang, Q.H.; Chen, D.L. Recent Changes in the Moisture Source of Precipitation over the Tibetan Plateau. J. Clim. 2017, 30, 1807–1819. [Google Scholar] [CrossRef]
- Kattel, D.B.; Yao, T.; Yang, W.; Gao, Y.; Tian, L. Comparison of temperature lapse rates from the northern to the southern slopes of the Himalayas. Int. J. Climatol. 2015, 35, 4431–4443. [Google Scholar] [CrossRef]
- Dang, Y.; Guo, C.; Jiang, T.; Zhang, Q.; Chen, B.; Jiang, G. 2020 height measurement and determination of Mount Qomolangma. Acta Geod. Cartogr. Sin. 2021, 50, 556–561. [Google Scholar] [CrossRef]
- Feng, L.; Zhou, T. Water vapor transport for summer precipitation over the Tibetan Plateau: Multidata set analysis. J. Geophys. Res.-Atmos. 2012, 117, D20114. [Google Scholar] [CrossRef] [Green Version]
- Curio, J.; Maussion, F.; Scherer, D. A 12-year high-resolution climatology of atmospheric water transport over the Tibetan Plateau. Earth Syst. Dyn. 2015, 6, 109–124. [Google Scholar] [CrossRef] [Green Version]
- Xu, K.P.; Zhong, L.; Ma, Y.N.; Zou, M.J.; Huang, Z.Y. A study on the water vapor transport trend and water vapor source of the Tibetan Plateau. Theor. Appl. Climatol. 2020, 140, 1031–1042. [Google Scholar] [CrossRef]
- Yang, X.X.; Yao, T.D. Seasonality of moisture supplies to precipitation over the Third Pole: A stable water isotopic perspective. Sci. Rep. 2020, 10, 15020. [Google Scholar] [CrossRef]
- Lone, S.A.; Jeelani, G.; Deshpande, R.D.; Mukherjee, A. Stable isotope (delta O-18 and delta D) dynamics of precipitation in a high altitude Himalayan cold desert and its surroundings in Indus river basin, Ladakh. Atmos. Res. 2019, 221, 46–57. [Google Scholar] [CrossRef]
- Acharya, S.; Yang, X.X.; Yao, T.D.; Shrestha, D. Stable isotopes of precipitation in Nepal Himalaya highlight the topographic influence on moisture transport. Quat. Int. 2020, 565, 22–30. [Google Scholar] [CrossRef]
- Dong, W.H.; Lin, Y.L.; Wright, J.S.; Xie, Y.Y.; Xu, F.H.; Xu, W.Q.; Wang, Y. Indian Monsoon Low-Pressure Systems Feed Up-and-Over Moisture Transport to the Southwestern Tibetan Plateau. J. Geophys. Res.-Atmos. 2017, 122, 12140–12151. [Google Scholar] [CrossRef]
- Dong, W.H.; Lin, Y.L.; Wright, J.S.; Ming, Y.; Xie, Y.Y.; Wang, B.; Luo, Y.; Huang, W.Y.; Huang, J.B.; Wang, L.; et al. Summer rainfall over the southwestern Tibetan Plateau controlled by deep convection over the Indian subcontinent. Nat. Commun. 2016, 7, 10925. [Google Scholar] [CrossRef]
- Moore, G.W.K.; Semple, J.L. High Himalayan meteorology: Weather at the South Col of Mount Everest. Geophys. Res. Lett. 2004, 31, L18109. [Google Scholar] [CrossRef]
- Xie, A.; Rne, J.; Qin, X.; Jiang, Y. Meteorological Features at 6 523 m a.s.l. on the North Slope of Mt. Qomolangma from May 1 to July 22 in 2005. J. Glaciol. Geocryol. 2006, 28, 909–917. [Google Scholar]
- Qi, W.; Zhang, Y.; Gao, J.; Yang, X.; Liu, L.; Khanal, N.R. Climate change on the southern slope of Mt. Qomolangma (Everest) Region in Nepal since 1971. J. Geogr. Sci. 2013, 23, 595–611. [Google Scholar] [CrossRef]
- Khadka, A.; Matthews, T.; Perry, L.B.; Koch, I.; Wagnon, P.; Shrestha, D.; Sherpa, T.C.; Aryal, D.; Tait, A.; Sherpa, T.G.; et al. Weather on Mount Everest during the 2019 summer monsoon. Weather 2021, 76, 205–207. [Google Scholar] [CrossRef]
- Perry, L.B.; Matthews, T.; Guy, H.; Koch, I.; Khadka, A.; Elmore, A.C.; Shrestha, D.; Tuladhar, S.; Baidya, S.K.; Maharjan, S.; et al. Precipitation Characteristics and Moisture Source Regions on Mt. Everest in the Khumbu, Nepal. One Earth 2020, 3, 594–607. [Google Scholar] [CrossRef]
- Yang, X.; Qin, D.; Zhang, T.; Kang, S.; Qin, X. Characteristics of the air temperature and humidity on the north slope of Mt Qomolangma. Acta Meteorol. Sin. 2012, 70, 855–866. [Google Scholar]
- Xie, A.H.; Dahe, Q.; Ren, J.W.; Xiang, Q.; Xiao, C.D.; Hou, S.G.; Kang, S.C.; Yang, X.G.; Jiang, Y.Y. Meteorological observations on Mount Everest in 2005. Prog. Nat. Sci. 2007, 17, 828–837. [Google Scholar]
- Potocki, M.; Mayewski, P.A.; Matthews, T.; Perry, L.B.; Schwikowski, M.; Tait, A.M.; Korotkikh, E.; Clifford, H.; Kang, S.C.; Sherpa, T.C.; et al. Mt. Everest’s highest glacier is a sentinel for accelerating ice loss. Npj Clim. Atmos. Sci. 2022, 5, 1–87. [Google Scholar] [CrossRef]
- Matthews, T.; Perry, L.B.; Koch, I.; Aryal, D.; Khadka, A.; Shrestha, D.; Abernathy, K.; Elmore, A.C.; Seimon, A.; Tait, A.; et al. Going to Extremes Installing the World’s Highest Weather Stations on Mount Everest. Bull. Am. Meteorol. Soc. 2020, 101, E1870–E1890. [Google Scholar] [CrossRef]
- Mayewski, P.A.; Gajurel, A.P.; Elvin, S.; Athans, P.; Dinley, T.; Sherpa, P.; Elmore, A.C.; Ghimire, J.; Perry, L.B.; Matthews, T.; et al. Pushing Climate Change Science to the Roof of the World. One Earth 2020, 3, 556–560. [Google Scholar] [CrossRef]
- Available online: https://www.nationalgeographic.com/environment/topic/perpetual-planet (accessed on 1 September 2021).
- Hersbach, H.; Bell, B.; Berrisford, P.; Hirahara, S.; Horanyi, A.; Munoz-Sabater, J.; Nicolas, J.; Peubey, C.; Radu, R.; Schepers, D.; et al. The ERA5 global reanalysis. Q. J. R. Meteorol. Soc. 2020, 146, 1999–2049. [Google Scholar] [CrossRef]
- Dee, D.P.; Uppala, S.M.; Simmons, A.J.; Berrisford, P.; Poli, P.; Kobayashi, S.; Andrae, U.; Balmaseda, M.A.; Balsamo, G.; Bauer, P.; et al. The ERA-Interim reanalysis: Configuration and performance of the data assimilation system. Q. J. R. Meteorol. Soc. 2011, 137, 553–597. [Google Scholar] [CrossRef]
- ERA5 Hourly Data on Pressure Levels from 1979 to Present. Available online: https://cds.climate.copernicus.eu/#!/search?text=ERA5&type=dataset (accessed on 1 September 2021).
- Immerzeel, W.W.; Petersen, L.; Ragettli, S.; Pellicciotti, F. The importance of observed gradients of air temperature and precipitation for modeling runoff from a glacierized watershed in the Nepalese Himalayas. Water Resour. Res. 2014, 50, 2212–2226. [Google Scholar] [CrossRef] [Green Version]
- Rolland, C. Spatial and seasonal variations of air temperature lapse rates in Alpine regions. J. Clim. 2003, 16, 1032–1046. [Google Scholar] [CrossRef] [Green Version]
- Tang, Z.; Fang, J. Temperature variation along the northern and southern slopes of Mt. Taibai, China. Agric. For. Meteorol. 2006, 139, 200–207. [Google Scholar] [CrossRef]
- Trenberth, K.E. Climate diagnostics from global analyses-conservation of mass in ecmwf analyses. J. Clim. 1991, 4, 707–722. [Google Scholar] [CrossRef] [Green Version]
- Department, I.M. End of Season Monsoon Report. Available online: https://mausam.imd.gov.in/imd_latest/contents/season_report.php (accessed on 1 September 2021).
- Simmonds, I.; Bi, D.H.; Hope, P. Atmospheric water vapor flux and its association with rainfall over China in summer. J. Clim. 1999, 12, 1353–1367. [Google Scholar] [CrossRef]
- Gao, Y.H.; Cuo, L.; Zhang, Y.X. Changes in Moisture Flux over the Tibetan Plateau during 1979–2011 and Possible Mechanisms. J. Clim. 2014, 27, 1876–1893. [Google Scholar] [CrossRef]
- Zhou, T.J.; Yu, R.C. Atmospheric water vapor transport associated with typical anomalous summer rainfall patterns in China. J. Geophys. Res.-Atmos. 2005, 110, D08104. [Google Scholar] [CrossRef] [Green Version]
- Salerno, F.; Guyennon, N.; Thakuri, S.; Viviano, G.; Romano, E.; Vuillermoz, E.; Cristofanelli, P.; Stocchi, P.; Agrillo, G.; Ma, Y.; et al. Weak precipitation, warm winters and springs impact glaciers of south slopes of Mt. Everest (central Himalaya) in the last 2 decades (1994–2013). Cryosphere 2015, 9, 1229–1247. [Google Scholar] [CrossRef] [Green Version]
- Bookhagen, B.; Burbank, D.W. Toward a complete Himalayan hydrological budget: Spatiotemporal distribution of snowmelt and rainfall and their impact on river discharge. J. Geophys. Res. -Earth Surf. 2010, 115, F03019. [Google Scholar] [CrossRef] [Green Version]
- Wagnon, P.; Vincent, C.; Arnaud, Y.; Berthier, E.; Vuillermoz, E.; Gruber, S.; Menegoz, M.; Gilbert, A.; Dumont, M.; Shea, J.M.; et al. Seasonal and annual mass balances of Mera and Pokalde glaciers (Nepal Himalaya) since 2007. Cryosphere 2013, 7, 1769–1786. [Google Scholar] [CrossRef] [Green Version]
- Shea, J.M.; Wagnon, P.; Immerzeel, W.W.; Biron, R.; Brun, F.; Pellicciotti, F. A comparative high-altitude meteorological analysis from three catchments in the Nepalese Himalaya. Int. J. Water Resour. Dev. 2015, 31, 174–200. [Google Scholar] [CrossRef] [Green Version]
- Houze, R.A., Jr. Orographic Effects on precipitating clouds. Rev. Geophys. 2012, 50, RG1001. [Google Scholar] [CrossRef]
Figure 1.
The topography of Mt. Everest and its surroundings. The selected meteorological stations are shown with red symbols.
Figure 1.
The topography of Mt. Everest and its surroundings. The selected meteorological stations are shown with red symbols.

Figure 2.
Mean daily temperature, relative humidity, temperature lapse rate (TLR) and monthly precipitation from June 2019 to June 2021.
Figure 2.
Mean daily temperature, relative humidity, temperature lapse rate (TLR) and monthly precipitation from June 2019 to June 2021.

Figure 3.
Seasonal variations of proportion of precipitation.

Figure 4.
Seasonal spatial variation of relative humidity and wind vector (U, V) at different pressure levels from June 2019 to June 2021.
Figure 4.
Seasonal spatial variation of relative humidity and wind vector (U, V) at different pressure levels from June 2019 to June 2021.

Figure 5.
Total daily precipitation at Phortse and Base Camp in 2020.

Figure 6.
Water vapor flux (vector) and water vapor flux divergence (color) during monsoon period in 2020.
Figure 6.
Water vapor flux (vector) and water vapor flux divergence (color) during monsoon period in 2020.

Figure 7.
Daily moisture flux divergence during monsoon period in 2020.

Figure 8.
Pattern of vertical velocity (coloring), relative humidity (green line) and wind vector varying with pressure during monsoon period (June–September) along 28° N and 80–90° E. The filled gray region represents the mountain topography.
Figure 8.
Pattern of vertical velocity (coloring), relative humidity (green line) and wind vector varying with pressure during monsoon period (June–September) along 28° N and 80–90° E. The filled gray region represents the mountain topography.


Table 1.
The detailed information about the AWSs used in this study.
| Station Name | Latitude (° N) | Longitude (° E) | Elevation (m) | Observed Period | Elements |
|---|---|---|---|---|---|
| Phortse | 27.8456 | 86.7472 | 3810 | 1 June 2019–30 June 2021 | T, RH, prep, press |
| Base Camp | 27.9952 | 86.8406 | 5315 | 1 November 2019–30 June 2021 | T, RH, prep, press |
| Camp II | 27.9810 | 86.9023 | 6464 | 1 June 2019–30 June 2021 | T, RH, press |
| South Col | 27.9719 | 86.9295 | 7945 | 1 June 2019–30 June 2021 | T, RH, press |
| Balcony | 27.9826 | 86.9292 | 8430 | 1 June 2019–20 January 2020 | T, RH, press |
Note: T refers to air temperature; RH refers to relative humidity; prep refers to precipitation and press for pressure.
Table 2.
Maximum, mean and minimum temperature for each season and the annual average temperature.
| Temperature (°C) | Phortse (3810 m) | Base Camp (5315 m) | Camp II (6464 m) | South Col (7945 m) | Balcony (8430 m) | |
|---|---|---|---|---|---|---|
| MAM | Max | 9.4 | 1.9 | −2.7 | −12.9 | / |
| Mean | 2.9 | −5.2 | −12.6 | −24.9 | / | |
| Min | −3.9 | −12.7 | −20.5 | −33.6 | / | |
| JJA | Max | 12.4 | 5.4 | −1.5 | −8.8 | −11.7 |
| Mean | 10.0 | 2.8 | −3.6 | −12.5 | −16.5 | |
| Min | 6.1 | −1.7 | −10.0 | −19.4 | −22.9 | |
| SON | Max | 11.0 | 3.7 | −2.8 | −10.6 | −14.3 |
| Mean | 5.8 | −2.2 | −8.8 | −21.5 | −24.5 | |
| Min | −2.6 | −9.8 | −19.1 | −31.7 | −35.7 | |
| DJF | Max | 4.5 | 2.6 | −4.0 | −15.2 | −28.4 |
| Mean | −2.1 | −8.0 | −16.0 | −29.1 | −35.3 | |
| Min | −8.7 | −17.0 | −25.5 | −38.6 | −40.2 | |
| Annual | Mean | 4.2 | −3.2 | −10.3 | −22.0 | −25.4 |
Note: Spring refers to MAM (March to May); summer refers to JJA (June to August); autumn refers to SON (September to November); winter refers to DJF (December to February). The minimum and average values for each station are calculated based on the observations listed in Table 1 and are not annual observations.
Table 3.
Minimum and mean relative humidity of each season and the annual average.
| Relative Humidity (%) | Phortse (3810 m) | Base Camp (5315 m) | Camp II (6464 m) | South Col (7945 m) | Balcony (8430 m) | |
|---|---|---|---|---|---|---|
| MAM | Mean | 78.5 | 63.1 | 45.0 | 53.5 | / |
| Min | 44.1 | 12.8 | 8.7 | 9.5 | / | |
| JJA | Mean | 92.9 | 92.9 | 80.7 | 77.2 | 70.5 |
| Min | 72.4 | 58.9 | 22.3 | 17.2 | 24.1 | |
| SON | Mean | 77.9 | 56.2 | 44.4 | 48.0 | 71.3 |
| Min | 24.2 | 7.4 | 8.5 | 9.5 | 36.8 | |
| DJF | Mean | 60.6 | 26.7 | 24.5 | 37.0 | / |
| Min | 20.1 | 2.9 | 7.2 | 7.1 | / | |
| Annual | Mean | 78.0 | 56.9 | 50.8 | 57.2 | / |
Table 4.
The average value of water vapor flux divergence, the number of days with negative water vapor flux and sum of moisture convergence.
Table 4.
The average value of water vapor flux divergence, the number of days with negative water vapor flux and sum of moisture convergence.
| Water Vapor Flux Divergence | June | July | August | September |
|---|---|---|---|---|
| Mean (mm/day) | 4.2 | 1.7 | 0.4 | 4.0 |
| Number of days | 6 | 10 | 15 | 7 |
| Moisture convergence (mm) | −11.9 | −27.9 | −54.7 | −27.6 |
Publisher’s Note: MDPI stays neutral with regard to jurisdictional claims in published maps and institutional affiliations. |
© 2022 by the authors. Licensee MDPI, Basel, Switzerland. This article is an open access article distributed under the terms and conditions of the Creative Commons Attribution (CC BY) license (https://creativecommons.org/licenses/by/4.0/).
Share and Cite
MDPI and ACS Style
Xu, B.; Xie, A.; Zhu, J. Can Water Vapor Transport over the Himalayas above 8000 m asl?—A Case Study on Mt. Everest. Water 2022, 14, 1671. https://doi.org/10.3390/w14111671
AMA Style
Xu B, Xie A, Zhu J. Can Water Vapor Transport over the Himalayas above 8000 m asl?—A Case Study on Mt. Everest. Water. 2022; 14(11):1671. https://doi.org/10.3390/w14111671
Chicago/Turabian StyleXu, Bing, Aihong Xie, and Jiangping Zhu. 2022. "Can Water Vapor Transport over the Himalayas above 8000 m asl?—A Case Study on Mt. Everest" Water 14, no. 11: 1671. https://doi.org/10.3390/w14111671
Note that from the first issue of 2016, this journal uses article numbers instead of page numbers. See further details here.