Article

Comparison of NCEP-CFSR and CMADS for Hydrological Modelling Using SWAT in the Muda River Basin, Malaysia

1
Geoinformatic Unit, Geography Section, School of Humanities, Universiti Sains Malaysia, Pulau Pinang 11800 USM, Malaysia
2
River Engineering and Urban Drainage Research Centre (REDAC), Universiti Sains Malaysia, Engineering Campus, Nibong Tebal 14300, Malaysia
3
Department of Agricultural Extension and Information System, Sher-e-Bangla Agricultural University, Dhaka 1207, Bangladesh
*
Author to whom correspondence should be addressed.
Water 2020, 12(11), 3288; https://doi.org/10.3390/w12113288
Submission received: 10 October 2020 / Revised: 18 November 2020 / Accepted: 19 November 2020 / Published: 23 November 2020
(This article belongs to the Section Hydrology)

Abstract

:
Identification of reliable alternative climate input data for hydrological modelling is important to manage water resources and reduce water-related hazards in ungauged or poorly gauged basins. This study aims to evaluate the capability of the National Centers for Environmental Prediction Climate Forecast System Reanalysis (NCEP-CFSR) and China Meteorological Assimilation Driving Dataset for the Soil and Water Assessment Tool (SWAT) model (CMADS) for simulating streamflow in the Muda River Basin (MRB), Malaysia. The capability was evaluated in two perspectives: (1) the climate aspect—validation of precipitation, maximum and minimum temperatures from 2008 to 2014; and (2) the hydrology aspect—comparison of the accuracy of SWAT modelling by the gauge station, NCEP-CFSR and CMADS products. The results show that CMADS had a better performance than NCEP-CFSR in the climate aspect, especially for the temperature data and daily precipitation detection capability. For the hydrological aspect, the gauge station had a “very good” performance in a monthly streamflow simulation, followed by CMADS and NCEP-CFSR. In detail, CMADS showed an acceptable performance in SWAT modelling, but some improvements such as bias correction and further SWAT calibration are needed. In contrast, NCEP-CFRS had an unacceptable performance in validation as it dramatically overestimated the low flows of MRB and contains time lag in peak flows estimation.

1. Introduction

The water cycle is a complex system that involves the movement of water between the atmosphere, earth and ocean. Understanding of the water cycle for a particular river basin is essential to manage water resources and reduce water-related hazards. The hydrological model is commonly used to quantify the changes of the water cycle components so that a better river basin management plan can be developed. The Soil and Water Assessment Tool (SWAT) is one of the most widely used hydrological models as indicated with more than 4000 publications [1,2,3]. The model is mainly applied by water scientists to understand the impact of land use and climate changes on water quantity and quality [4]. Besides that, SWAT is also frequently used to determine the best management practices for maximizing agricultural productivity while protecting the environment and reducing water pollution.
Climate data are regarded as among the most important data in setting up the SWAT model. Hence, reliable climate data are required to improve the accuracy of the model. Conventionally, the gauge station is the primary source to obtain climate data from, such as precipitation, maximum and minimum temperatures, for SWAT [5]. However, the gauge station contains several major issues including uneven distribution, large missing values, a costly maintenance fee and discontinued service due to the war time or financial problems [6,7]. Although, some satellite or reanalysis gridded products used gauge stations as inputs for calibration or as assimilated data to improve their accuracy. Unfortunately, in certain regions, gauge station data are not freely available and sometimes are restricted for public to assess due to the data sensitive policy. In this case, many gauge stations were actually excluded in the gridded data development and calibration. Hence, evaluation of the reliability of the commonly used gridded climate data in SWAT modelling has become a popular topic recently, especially in developing and less developed countries [8,9,10,11].
Several gridded climate data are available in the SWAT webpage such as the National Centers for Environmental Prediction (NCEP) Climate Forecast System Reanalysis (CFSR) [12] for global, National Oceanic and Atmospheric Administration (NOAA) climate data for the US, China Meteorological Assimilation Driving Dataset for the SWAT model (CMADS) for East Asia [13] and Indian Meteorological Department (IMD) climate data for India. As shown in the SWAT literature database [14], assessment of the capability of NCEP-CFSR in SWAT modelling has been conducted the most since it was available since 2014. Among the earliest NCEP-CFSR assessment studies have been conducted in Three Gorges Reservoir of China [11], Upper Blue Nile basin [15] and five watersheds of the US [16]. These studies showed that NCEP-CFSR is able to simulate streamflow satisfactorily using SWAT. Since then, more similar studies were performed in different parts of the world, with some reporting unsatisfactory performance of NCEP-CFSR, particularly in tropical and sub-tropical regions [17,18,19].
CMADS is a new reanalysis climate data for SWAT modelling, which was designed for the East Asia region. CMADS is a climate reanalysis gridded dataset that assimilated with gauge stations/satellite every 6 h and stacks together. Meanwhile, NCEP-CFSR is a seasonal forecast of 2–6 weeks lead time, with the monthly scale up to nine months. In short, CMADS is standard reanalysis data, whereas NCEP-CFSR is forecast reanalysis data. CMADS provides daily climate freely from 2008 to 2016 between latitudes of 0° N–65° N and longitudes of 60° N–160° N, with the spatial of 0.25° [20]. Studies on the assessment of CMADS for SWAT modelling are mainly found in river basins in China such as the Hunhe River Basin [20], Qujiang River Basin [21], Fuhe River Basin [22], Jinhua River Basin [23], etc. Basically, CMADS performed well in SWAT-based streamflow simulations in most of the studies in China. A SWAT-based CMADS assessment study outside of China was conducted by Vu, et al. [24] in the Han River Basin in the Korean Peninsula. They found that CMADS performed moderately in simulating streamflow in this basin. Very little is currently known about the CMADS performance in other East Asia counties, including Malaysia.
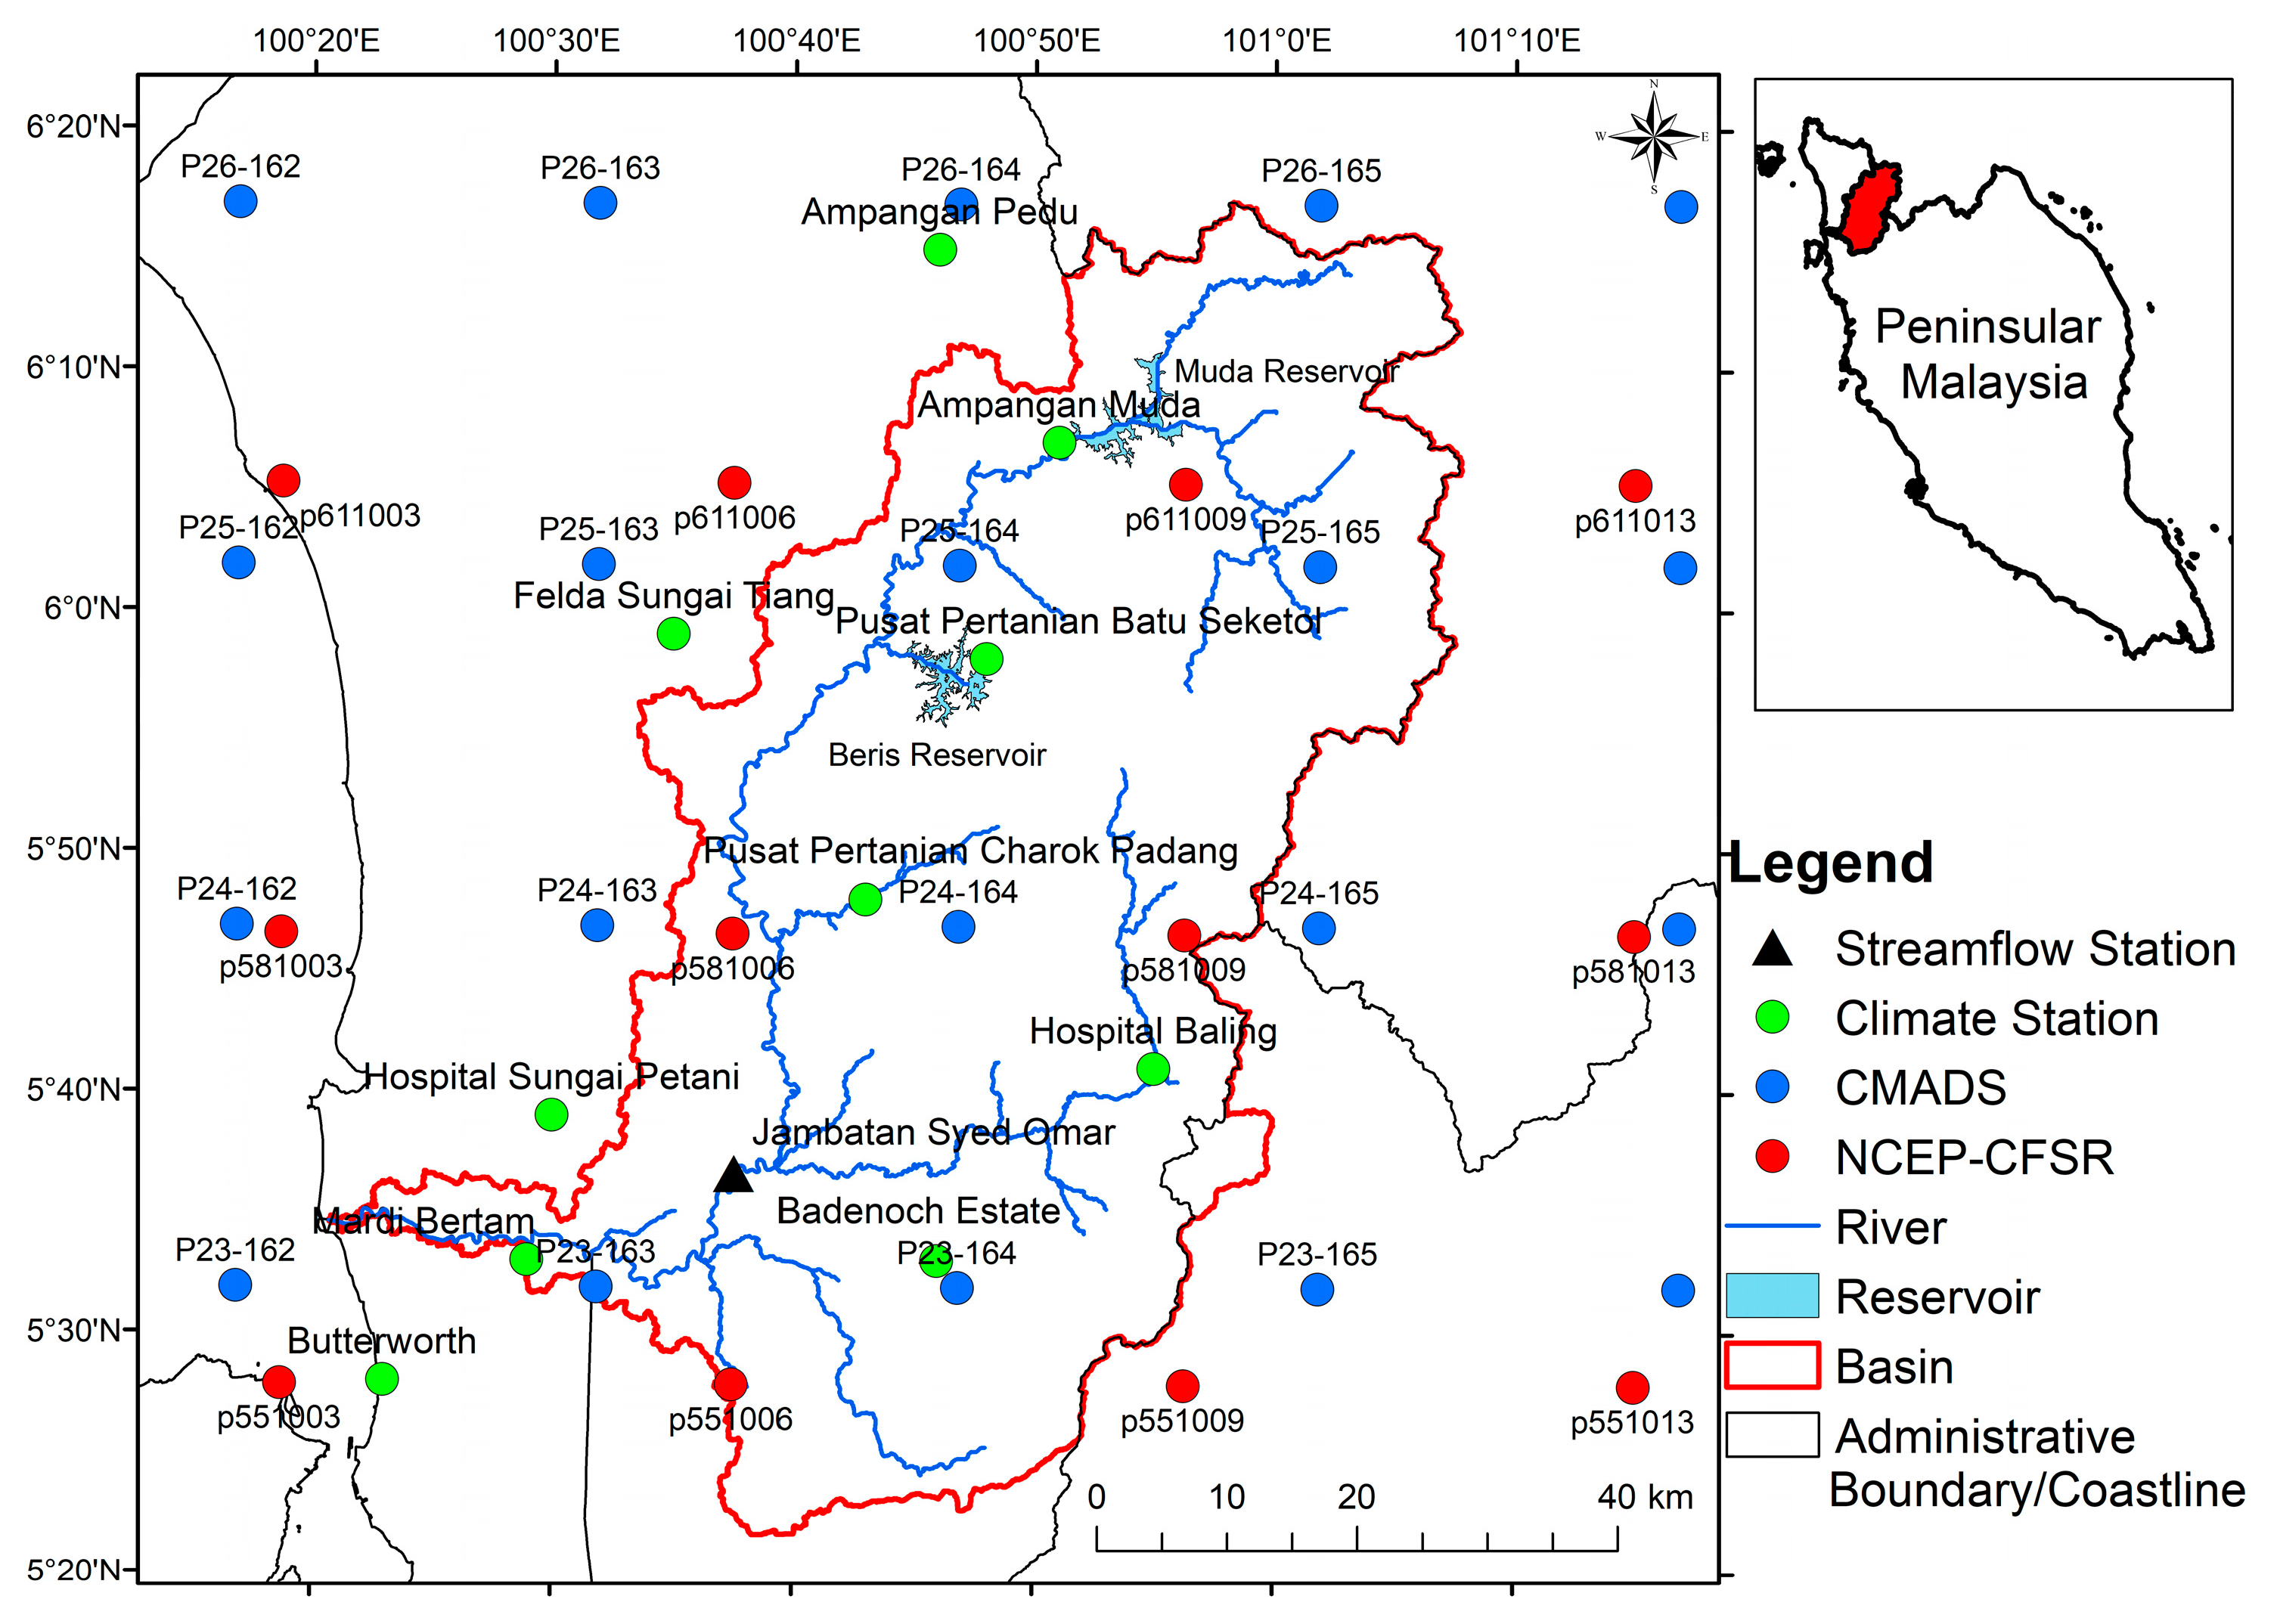
The Muda River Basin (MRB) is a typical tropical river basin that is located in the northern part of Peninsular Malaysia. It is an extremely important river basin that supplies freshwater for three northern states of Peninsular Malaysia, namely Kedah, Penang and Perlis [25]. Freshwater in this basin is vital for agricultural purposes in Kedah and the industry sector in Penang as well as for domestic usage. Based on a review of SWAT studies in Southeast Asia [1], only 12 SWAT-related studies have been reported in Malaysia and none of these studies were actually conducted in the Muda River Basin (MRB). A similar result was found after further searching was conducted through the SWAT literature database [14] on 2 October 2020. Therefore, it is important to construct a hydrological model in this basin to understand the water cycle changes, so that the freshwater within this basin can be managed in a more appropriate way. Moreover, little is known on both the CMADS and SWAT applications in MRB. Hence, this study aims (1) to validate the NCEP-CFSR and CMADS daily precipitation, maximum and minimum temperatures in MRB; (2) to evaluate the performance of SWAT modelling in MRB; and (3) to assess the capability of the gauge station, NCEP-CFSR, CMADS in simulating streamflow using SWAT in MRB. The findings help to understand the performance of CMADS and SWAT in this tropical basin.

2. Materials and Methods

2.1. Study Area

MRB is located between the latitudes of 5°20′ N–6°20′ N and longitudes of 100°20′ E–101°20′ E, as shown in Figure 1. As a tropical basin, MRB receives a very high amount of annual precipitation (up to 3000 mm/year), particularly during the inter-monsoon period between September and October [25]. MRB is covered by the Titingwangsa range and is close to the mountain ranges in Sumatra, Indonesia that dramatically reduced the heavy precipitation that brought by the northeast monsoon (November to mid-March) and southeast monsoon (May to August), respectively. Therefore, a high amount of monthly precipitation of MRB is normally found during the inter-monsoon seasons, i.e., April and October. The dry season of MRB is commonly occurred in January to March. Sometime, due to the El Nino effect, the dry season may continue for a longer period. In 2020, the dry season in this region lasts until June and causes many reservoirs to hit their lowest water level. Local authorities spent more than MYR one hundred thousand for cloud seeding to increase the effective capacity of the dams within or around MRB.
Muda River is the longest river of the Kedah state with a total length of ~180 km and a basin size of ~4111 km2. The 30 km downstream part of MRB covers both the Kedah and Penang states. Figure 1 shows that there are two major reservoirs that are located in the upper part of MRB. The Muda Reservoir was constructed in 1969 under the Muda Irrigation Scheme for irrigating about 96,000 hectares of paddy field, which also known as the “rice bowl” of Malaysia [25]. Water from the Muda Reservoir (160 × 106 m3) is transferred to the Pedu Reservoir (1073 × 106 m3) that located out of MRB using a 6.8 km tunnel [26]. The Beris Reservoir (122.4 × 10⁶ m3) is the second water supply reservoir that located in the southern part of the Muda Reservoir. It was constructed by Department of Irrigation and Drainage (DID) in 2004 with a total cost of ~RM 360 million (~USD 86.68 millions) [27].

2.2. Observations

Observed daily precipitation, maximum and minimum temperature data from 2008 to 2014 at nine climate stations as listed in Table 1 were collected from Malaysian Meteorological Department (MMD). Most of these stations are generally known as good quality stations with less missing value and free from inhomogeneous condition [25]. The missing values were filled with the data from nearest station before applying into SWAT. As shown in Figure 1, the stations distributed quite well which cover both the upper and lower parts of MRB. Besides that, monthly streamflow measured from the average daily flows at the Jambatan Syed Omar discharge gauge was collected from DID for SWAT calibration and validation. The comparison between the observed and SWAT-simulated streamflow is further explained in Section 2.6. The Jambatan Syed Omar station was selected because it has extremely low missing values during the evaluation period and is located in the downstream part (Figure 1) that able to capture the streamflow pattern of major river networks within MRB.

2.3. NCEP-CFSR

NCEP-CFSR is the third-generation global coupling seasonal forecast reanalysis data with a spatial resolution of 0.3125° (~38 km). NCEP-CFSR was created to understand the interaction between ocean, atmosphere and land of the Earth as a coupled atmosphere–ocean–land surface-sea ice model [12,28]. To promote the usage of SWAT, a set of daily NCEP-CFSR climate variables from 1979 to 2014 including precipitation, wind, relative humidity, solar, maximum and minimum temperatures were converted to SWAT climate input format. The SWAT-based NCEP-CFSR is free of charge where users can download the climate data based their study area from the global weather data for the SWAT webpage [29].

2.4. CMADS

CMADS was developed to provide a set of high-quality climate data for meteorology and hydrology studies in East Asia [13]. It contains climate variables of precipitation, relative humidity, specific humidity, average wind, solar radiation, average atmospheric pressure, soil temperature, soil moisture, average temperature, maximum temperature and minimum temperature at a daily scale. Similar to NCEP-CFSR, CMADS was converted to SWAT format to allow modeler to utilize the data directly. The capability of CMADS has been widely used in China for hydrology applications [20,23,30,31,32], but such studies are relatively few in other East Asian countries. In this study, daily precipitation, maximum and minimum data of CMADS v1.1 from 2008 to 2016 at 0.25° × 0.25° spatial resolution for MRB region (Figure 1) were collected from the CMADS webpage [33]

2.5. SWAT Model

SWAT is a semi-distributed hydrological model that was designed for studying the best management practices on streamflow and water quality of a specific river basin [34]. SWAT has been proven to be a reliable model for simulating the water cycle in various parts of the world [1,2,4,18,34,35,36,37,38]. Most importantly, SWAT is a public domain model with a series of tutorials available on the SWAT main webpage. SWAT includes three major sub-modules under the hydrological, soil erosion and pollution load applications. Among them, the hydrological module is the most basic sub-module. SWAT version 2012 (Revision 635) with the interface of the ArcSWAT version 2012.10_216 was applied in this study.
This study described the hydrological module since the evaluation involves the hydrological aspect. In the model setup, SWAT first divides a main basin into several sub-basins and then smaller hydrological response units (HRUs) according to the different types of land use, soil and slope. The flow is firstly calculated at the HRU level, then aggregated to the correspond sub-basin and, lastly, to the basin outlet. The hydrological cycle within SWAT is calculated based on the water balance equation [39] as follows:
SW t = SW 0 + i = 1 t ( R day   Q surf   E a   w seep   Q gw )
where SWt is the soil water content (mm) at the end of day t, SW0 is the initial soil water content (mm) on day i, t is time (day), Rday is the precipitation (mm) on day i, Qsurf is the surface runoff (mm) on day i, Ea is the evapotranspiration (mm) on day I, wseep is the amount of water entering the saturated zone from the soil (mm) on day i and Qgw is the underground runoff (mm) on day i. For detailed theoretical formulas within SWAT one can refer to the SWAT theoretical manual that was prepared by Neitsch et al. [39].
Muda and Beris Reservoirs that are located in the upper part of MRB were added in the SWAT model development. Basic information of Muda Reservoir was extracted from the MADA webpage [26]. Whereas, monthly average water usage for freshwater supply and irrigation purposes was extracted from the official website of National Water Balance Management System (NAWABS) [40] as input into SWAT to improve the capability in the monthly streamflow simulation. The Hargreaves method [41] within SWAT was applied to measure the potential evapotranspiration since it requires only the temperature data for the calculation.
Selection of a set of appropriate parameters for SWAT calibration can be conducted easily and effectively through the sensitivity analysis, thus greatly improving the efficiency of SWAT modelling. Sensitivity analysis can provide guidance in determining which parameters to adjust in SWAT calibration. Therefore, sensitivity analysis of parameters is essential before the calibration of the model. In this study, the global sensitivity analysis method was used to conduct sensitivity analysis of parameters. The parameters’ sensitivity was ranked based on the t-stat values, where the higher the value, the higher the sensitivity. The model was then calibrated based on a sensitivity analysis of 13 parameters.

2.6. Statistical Measures

The evaluation of NCEP-CFSR and CMADS was divided into two main parts: (1) the climate aspect—validation of precipitation, maximum and minimum temperature data with climate gauge; and (2) the hydrological aspect—comparison of the monthly streamflow simulated by SWAT using a gauge station, NCEP-CFSR and CMADS with an observed streamflow. In general, gridded products provide areal climate information for each respective grid, while the gauge station measures the climate variable at a specific point. Grid-to-grid and point-to-grid are two commonly used approaches to do comparisons between gridded products and gauges. The grid-to-grid approach requires a high density of gauges within a specific grid for a robust comparison. In fact, lack of gauge stations is a major issue in different parts of the world [7,42], including MRB. Besides that, some uncertainties may arise during the interpolation of multiple gauge stations into gridded-based observed data. Hence, the climate aspect comparison was conducted using the point-to-grid approach [43], where the gauge stations were directly compared to their respective grids’ values. The assessment is limited to the grids that contain at least one gauge as shown in Figure 1.
The capability of NCEP-CFSR and CMADS in estimating precipitation, maximum and minimum temperatures from 2008 to 2014 at daily and monthly scales was evaluated using three widely applied statistical measures such as Correlation Coefficient (CC), Root Mean Square Error (RMSE) and Relative Bias (RB). CC, RMSE and RB are commonly used to evaluate the level of agreement, average error magnitude and systematic bias, respectively, between the gridded and gauge station data. A reliable gridded product can be declared if CC value more than 0.7 and RB value from −10% to 10% [6,44]. Categorical statistic measures such as Probability of Detection (POD), False Alarm Ratio (FAR) and Critical Success Index (CSI) are mainly used to detect the daily precipitation detection capability of NCEP-CFSR and CMADS. The formula of these statistical measures is listed in Table 2. POD and FAR show the ratio of correctly and falsely detected precipitation to the total precipitation, respectively [6,45]. Meanwhile, CSI indicates the overall ratio of precipitation and non-precipitation days detected by the gridded data.
The hydrological aspect involved the comparison of streamflow simulated by the observed climate data, NCEP-CFSR and CMADS. Uncertainty in Sequential Uncertainty Fitting (SUFI-2) algorithm that available in the SWAT-CUP tool was used to calibrate and validation the SWAT model. SUFI-2 was selected because it was relatively simple to apply, less time consuming, more efficient and can flexibly select optimization targets [46,47]. Coefficient of Determination (R2), Nash-Sutcliffe Efficiency (NSE) and RB were used to evaluate the performance of SWAT in simulating streamflow at the Jambatan Syed Omar discharge station as shown in Figure 1. Table 3 shows the performance rating to measure the SWAT performance that recommended by Moriasi, et al. [48], which is widely applied in SWAT studies. The streamflow comparison only focused on the monthly scale assessment due to the difficulty in obtaining reservoir management data for both the reservoirs. A similar situation was actually found in other river basins of Malaysia as well [49,50], where the reservoir management data is considered as highly sensitive data to public in Malaysia.

3. Results

3.1. Climate Aspect

Three major climate variables (pcp, tmax and tmin) extracted from NCEP-CFSR and CMADS over MRB from 2008 to 2014 were compared with climate gauge for both the daily (Figure 2) and monthly (Figure 3) scales. This study focused solely on the assessment of daily and monthly data due to the relatively short annual series as NCEP-CFSR only available until July 2014. Besides that, daily and monthly are the major time scales for hydrological studies and model accuracy assessment [1,2].

3.1.1. Daily Climate Assessment

In general, CMADS outperformed NCEP-CFSR in daily precipitation, maximum temperature and minimum temperature estimations over the MRB for the period of 2008 to 2014 as shown in Figure 2. CMADS had a stronger correlation with observed daily precipitation with CC values ranging from 0.29 to 0.56 (average CC = 0.45) compared to NCEP-CFSR of 0.24 to 0.35 (average CC = 0.30). The average RMSE values of CMADS and NCEP-CFSR are 13.38 mm/day and 15.27 mm/day, respectively. This is in the agreement with the findings of Vu, Li and Jun [24] who found the RMSE values of CMADS over the Han River Basin in Korean Peninsula varying from 2.05 mm/day to 17.47 mm/day. Interestingly, NCEP-CFSR overestimated the daily precipitation by 11.84%, whereas a significant underestimation of 27.64% was found for CMADS. For the precipitation detection capability assessment, NCEP-CFSR has a better average POD value of 0.92, but a poorer average FAR value of 0.50. On the other hand, the average POD and FAR values of CMADS are 0.74 and 0.34, respectively. With respect to CSI, CMADS shows a slightly better performance with an average value of 0.55 compared to NCEP-CFSR (average CSI = 0.48). This finding was also reported by Tan [17] in another two river basins in Malaysia, where NCEP-CFSR correctly estimated around 50% of the precipitation and non-precipitation days. The outstanding performance of NCEP-CFSR in POD can be explained by the fact that the data only detected about 8% of non-precipitation days (0 mm/day) over MRB, but actually there are around 45.42% to 65.93% non-precipitation days were detected by the precipitation gauges. Therefore, NCEP-CFSR overestimated the observed daily precipitation data in this basin.
The results of the statistical analysis for daily maximum and minimum temperatures variables are presented in Figure 2. Similarly, CMADS shows a better performance compared to NCEP-CFSR in the measurement of daily maximum and minimum temperatures over MRB. CMADS shows a good correlation with observed data in daily maximum temperature measurement with an average CC value of 0.84, whereas NCEP-CFSR (average CC = 0.57) only correlated moderately with observed data. The average RMSE values of daily maximum temperature for CMADS and NCEP-CFSR are 1.74 °C and 2.62 °C, respectively, showing the difference between the reanalysis and temperature gauge estimated maximum temperature is around 2 °C. Both the CMADS and NCEP-CFSR products tended to underestimate the daily temperature by 4.25 and 5.01%, respectively. Similarly, CMADS shows a better correlation (average CC = 0.71) and a smaller bias (average RMSE = 1.01 °C) in daily minimum temperature estimation. By contrast, NCEP-CFSR had a much lower average CC value (0.43) and a higher average RMSE value (1.89 °C) compared to CMADS, which indicates CMADS is a better alternative data for temperature analysis in Muda River Basin. An underestimation of daily minimum temperature was found for NCEP-CFSR at the rate of 3%, whereas CMADS slightly overestimated by 0.76%.

3.1.2. Monthly Climate Assessment

Figure 3 shows the statistical results of NCEP-CFSR and CMADS against observed data in monthly precipitation, maximum and minimum temperatures estimations over Muda River Basin from 2008 to 2014. Monthly maximum and minimum temperatures are averaging from daily maximum and minimum temperatures, respectively, for a specific month. From the figure, it can be seen that both the NCEP-CFSR and CMADS products had a better performance in temperature estimation as compared to precipitation. The average CC value for both the NCEP-CFSR and CMADS products is 0.67, showing a good correlation between gridded and observed data in monthly precipitation estimation. NCEP-CFSR and CMADS showed average RMSE values of 110.72 and 108.81 mm/month, respectively, which is consistent with the findings reported in other river basins of Malaysia [9,17]. Interestingly, NCEP-CFSR overestimated the monthly precipitation by 11.84%, while CMADS had an opposite direction of 27.64%.
Overall, CMADS outperformed NCEP-CFSR in monthly temperature estimations in MRB, where CMADS correlated well with the observed monthly maximum and minimum temperatures, with the average CC values of 0.90 and 0.91, respectively. This finding was also reported by Liu et al. [31] in the Qinghai-Tibet Plateau, where the CC values of CMADS in maximum and minimum temperatures validation are close to 1. Besides that, CMADS also has a smaller RMSE value compared to NCEP-CFSR as shown in Figure 3. NCEP-CFSR underestimated the monthly maximum and minimum temperatures by 4.99 and 2.99%, respectively. Similarly, CMADS underestimated the monthly maximum temperature by 4.25%, but an overestimation of 0.76% was found in monthly minimum temperature estimation.

3.2. Hydrological Aspect

Table 4 shows the sensitivity of 13 parameters used for SWAT modelling of MRB under various climate inputs. Similar to many other Malaysian SWAT studies [50,51,52], SCS runoff curve number f (CN2) is the most sensitive parameter for SWAT modelling in MRB as shown by all the gauge station, NCEP-CFSR and CMADS products. Soil evaporation compensation factor (ESCO) is the second most sensitive parameter as simulated by all the three products. By contrast, groundwater delay (GW_Delay) and available water capacity of the soil layer (SOL_AWC) are among the less sensitive parameters, and, therefore, they can be considered to exclude future SWAT modelling in this basin.
In general, MRB was divided into 52 sub-basins and 318 HRUs. The year 2008 was used for reaching steady state condition, while the Jan 2009 to December 2011 and Jan 2012 to July 2014 periods were set as the calibration and validation periods, respectively. Table 5 indicates the range of parameters and their optimal value for each evaluated product. The R2, NSE and RB values as simulated by climate gauge for calibration are 0.82, 0.81 and 3.6%, respectively, as listed in Table 6. This indicates that the SWAT model is a reliable tool to simulate monthly streamflow in MRB, which can be used for further studies the climate or land use impact assessment on water balance in this basin.
According to Table 6, CMADS had a satisfactory performance compared to NCEP-CFSR during the calibration period. The R2, NSE and RB values for CMADS are 0.60, 0.59 and −3.7%, respectively. The R2 and NSE values of NCEP-CFSR are 0.58 and 0.21, respectively, which are slightly lower than NCEP-CFSR. Interestingly, NCEP-CFSR dramatically overestimated the monthly streamflow by 40%, indicating NCEP-CFSR overestimated the precipitation amount in this basin. During the validation period, CMADS outperformed NCEP-CFSR in monthly streamflow simulation, with the R2, NSE and RB values of 0.39, 0.21 and −13.1%, respectively. By contrast, the performance of NCEP-CFSR is considered as unacceptable for the validation period due to the negative NSE (−0.23) and extremely high RB (44.7%) values. A similar finding has been reported by Tan [17] where NCEP-CFSR also performed poorly in another two Malaysian river basins, called Kelantan River Basin and Johor River Basin. Therefore, Tan [17] suggested to use a combination of Asian Precipitation—Highly-Resolved Observational Data Integration towards Evaluation (APHRODITE) precipitation and NCEP-CFSR temperature data for SWAT modelling in Malaysia.

4. Discussion

In general, CMADS had an acceptable performance for monthly streamflow in MRB using SWAT. However, when compared to other similar studies as shown in Table 7 that were mainly conducted in China, CMADS had a poorer performance in this tropical basin. The R2 and NSE values of more than 0.8 were mainly reported in Jing River and Bo River Basins [53], Fuhe River Basin [22], Xiang River Basin [32] and Lijiang River Basin [54]. Meanwhile, Zhang et al. [30] found CMADS performed moderately at the Shenyang station in the Hunhe River Basin, with the NSE values of 0.63 and 0.54 during the calibration and validation periods, respectively. However, the reported RB values of MRB are slightly better than in the Fuhe River Basin [22] and Hun River Basin [55] that show systematic bias up to 23%. A possible explanation for the poorer performance of CMADS in MRB might be that the precipitation gauges for calibrating or assimilation CMADS are mainly located within China [56]. For regions out of China, the Climate Prediction Center Morphing Technique (CMORPH)’s integrated precipitation products were mainly used as precipitation inputs [24,56]. In fact, CMORPH underestimated monthly precipitation over Malaysia by ~13% [45], which match with the underestimation of precipitation and streamflow as simulated by CMADS in this study.
Figure 4 shows the monthly observed and SWAT-simulated streamflow at the Jambatan Syed Omar discharge station from 2009 to 2014. As can be seen from the figure, the climate gauge simulated matches the observed streamflow, except for in November 2010. As reported by DID, a big flood occurred in November 2010, which inundated this region for two to five days. A total of 188 flood evacuation was operated to accommodate local people that affected by this second worst flood for the past 20 years. It can be found that NCEP-CFSR overestimated the low flow for most of the time. Meanwhile, CMADS had a better performance in low flow estimation as compared to NCEP-CFSR. A lag peak flow simulation was also found for NCEP-CFSR in several time periods, e.g., August–October 2009 and May–July 2013. Whereas, CMADS underestimated peak flows in August 2009, November 2012 and October 2013. Besides that, an overestimation of peak flows of CMADS can be found in April 2012 and May 2014. Hence, improvement of CMADS for the region out of China, particularly peak flows simulations, is an important issue for future research.
CMADS was found to be reliable in temperature data estimation for MRB, especially minimum temperature. The superior performance of CMADS temperature data compared to NCEP-CFSR, shows it is applicable to study the temperature in tropical regions such as Malaysia. For example, the CMADS temperature may be used to study the relationship between temperature and paddy yield within and nearby MRB. Besides that, temperature is important for data to calculate the evapotranspiration process within SWAT. Therefore, the reanalysis products’ temperature data, particularly maximum temperature may contain a consideration impact on the evapotranspiration calculation. The poorer performance of NCEP-CFSR in the maximum temperature estimation than CMADS might be one of the reasons that contributed to the lower performance in streamflow simulation. Future research should be undertaken to investigate the performance of the reanalysis products in more aspects including the calculation of the extreme value, trend and evapotranspiration.
As mentioned by Tan [42], more than 20% missing values in climate data may significantly affect hydrological modelling in tropical region. Therefore, most of the gauge stations used in this study contain no or less than 3% missing values, except for the Pusat Pertanian Charok Padang (8.53%) and Pusat Pertanian Batu Seketol (10.13%) stations. Moreover, the Butterworth station is classified as a principal station that receives more attention by MMD, with no missing values for all the three climate variables. Since most of the stations contain no missing values, so the impact of the nearest station filling approach on hydrological modelling is expected to be minimal. However, a more comprehensive comparison of different imputation techniques on tropical streamflow simulation is needed in the future, including the impact of filling missing with reanalysis products.
Calibration of different parameters to better represent the local conditions is essential for proper hydrological modelling. Deterministic approaches, e.g., trial and error, were applied in the calibration process of earlier studies [58]. However, the deterministic approaches resulted in only a single set of parameters that were insufficient to characterize the errors and uncertainties in modelling [59]. Recently, stochastic algorithms such as SUFI-2, parallel solution (ParaSol), Markov chain Monte Carlo (MCMC), generalized likelihood uncertainty estimation (GLUE) and Particle Swarm Optimization (PSO) have been developed to capture the parameter uncertainties [59]. In future investigations, it might be possible to test how the selection of different stochastic algorithms could impact on the model calibration and accuracy as simulated by various gridded products such as NCEP-CFSR and CMADS.

5. Conclusions

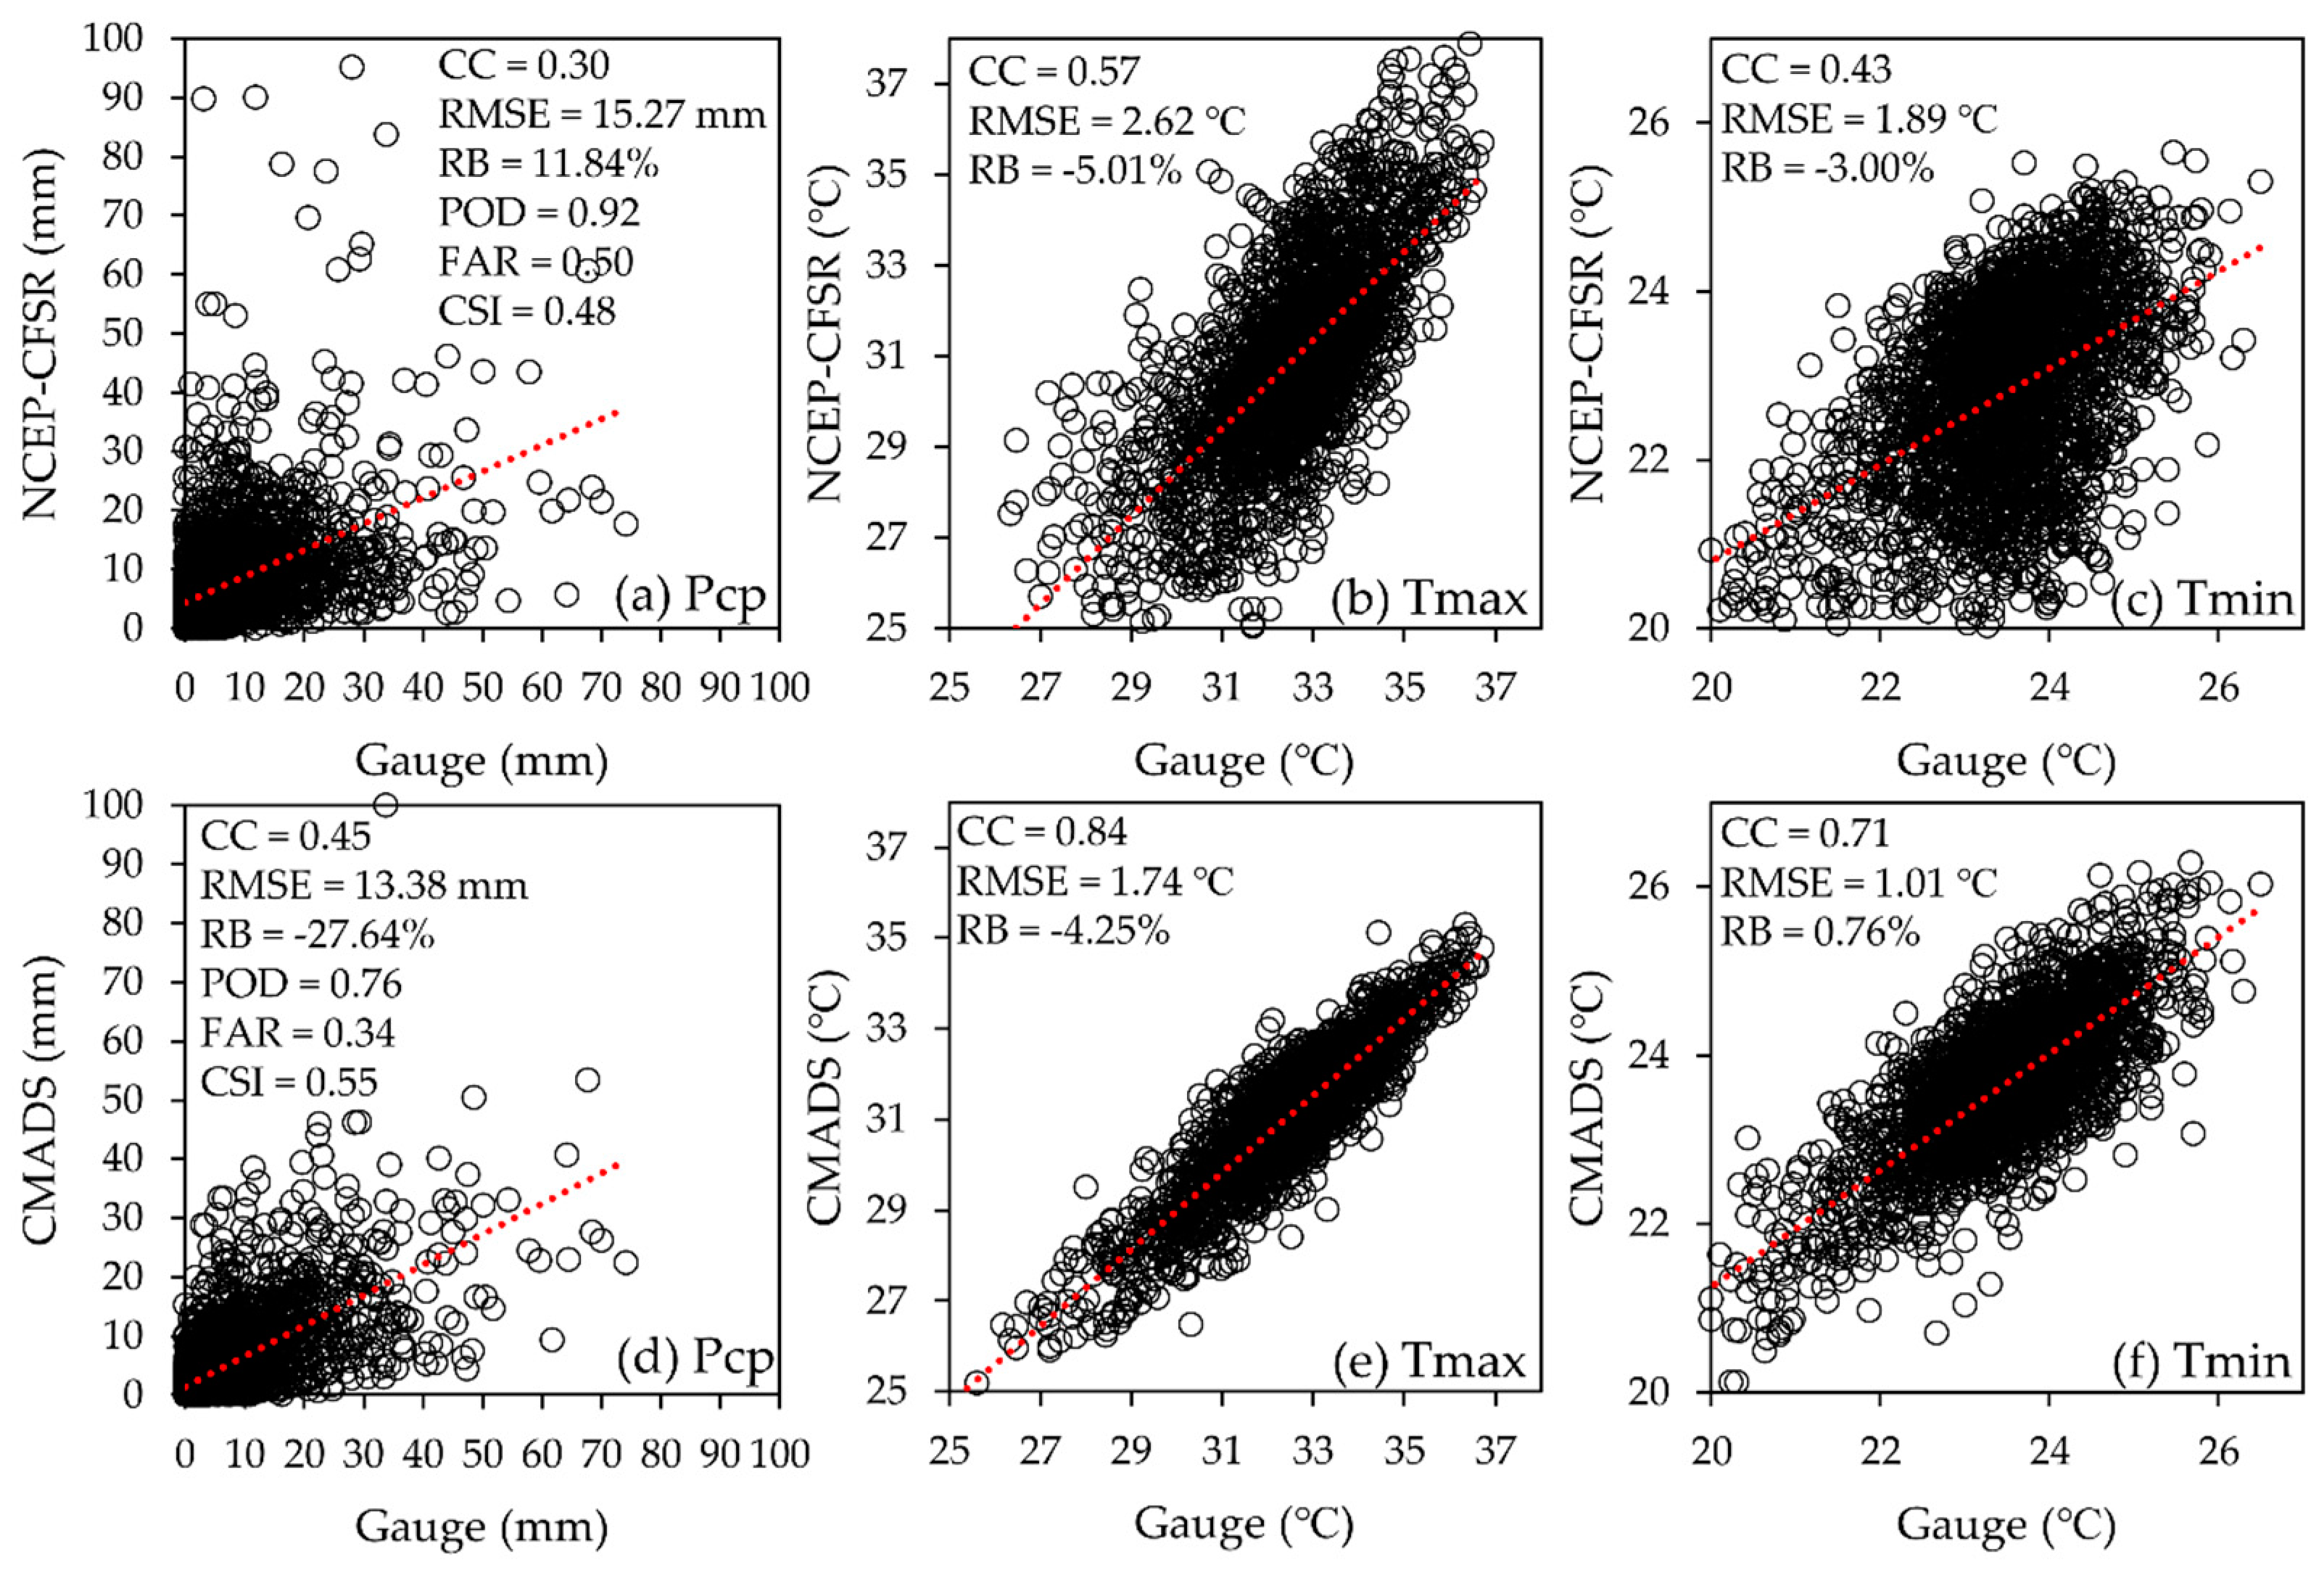
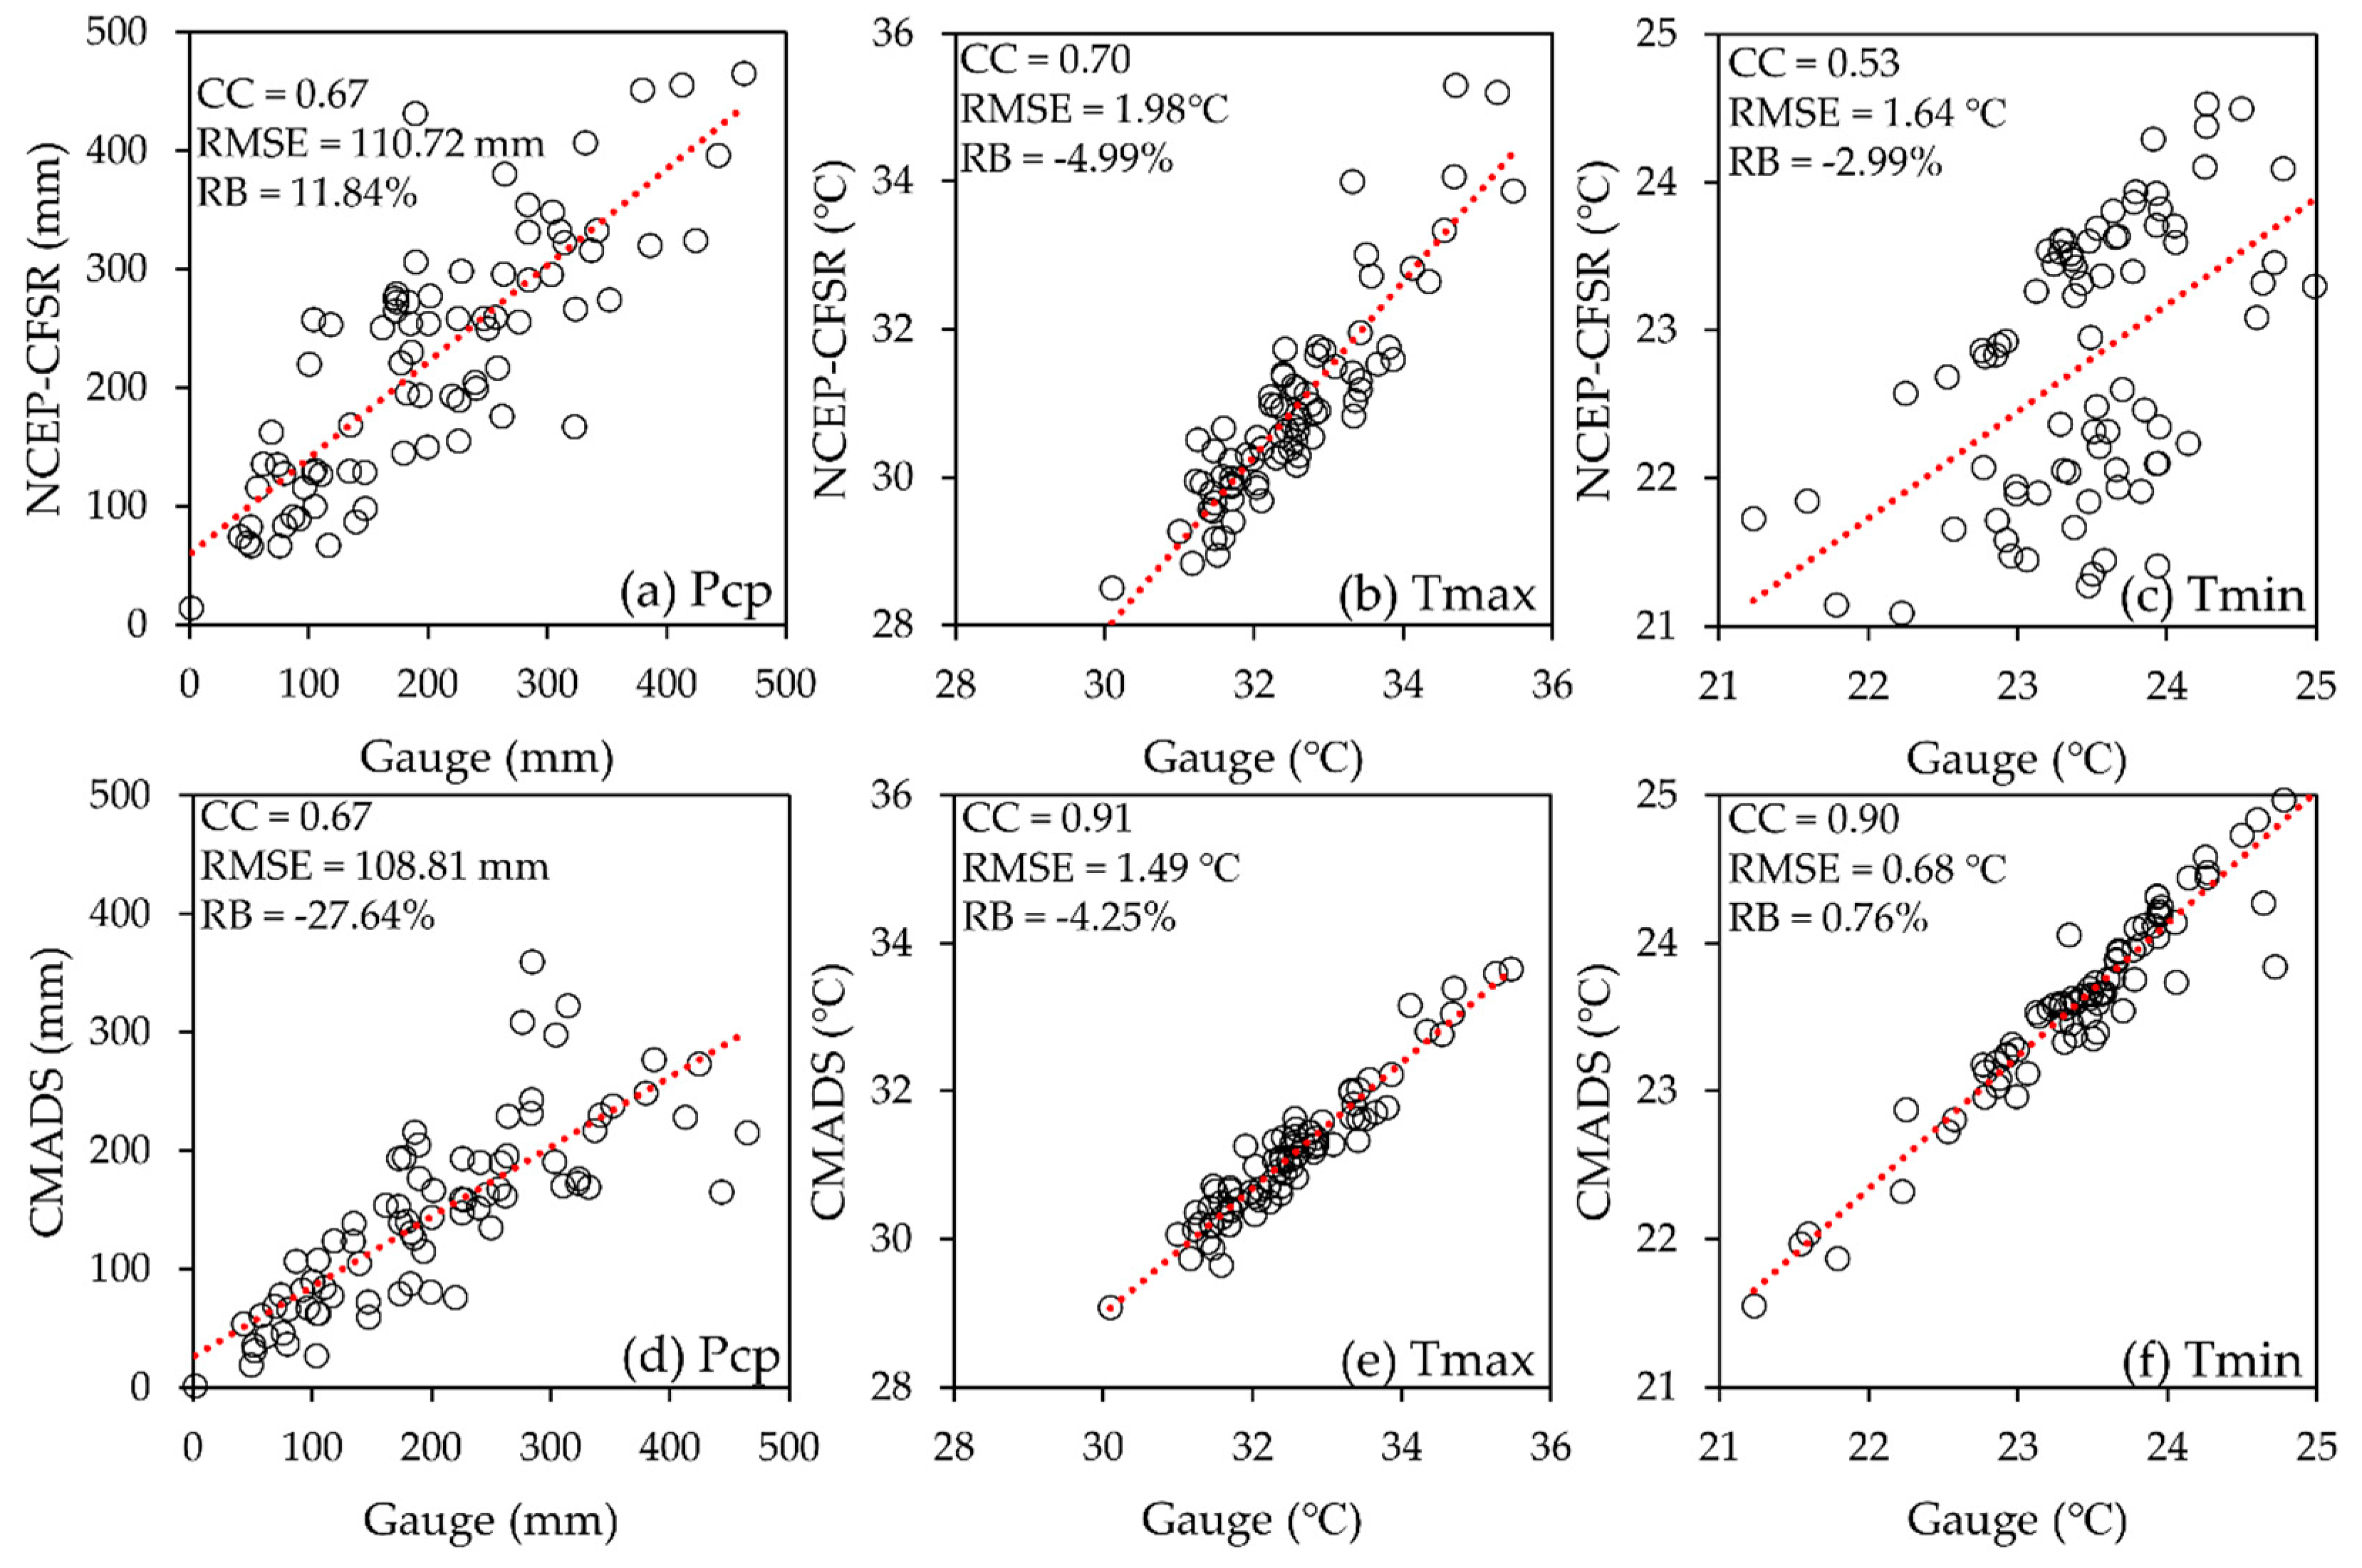
NCEP-CFSR and CMADS are potentially good to be used for hydrological modelling in ungauged or poorly gauged river basins. This study compared the reliability of NCEP-CFSR and CMADS that were freely available on the SWAT webpage in simulating streamflow in a tropical river basin that is located in the north-eastern part of Peninsular Malaysia. The evaluation was divided into the climate and hydrological aspects from 2008 to 2014. In general, CMADS performed better than NCEP-CFSR in the daily and monthly climate variables estimations. NCEP-CFSR overestimated the daily precipitation, while an underestimation was found for CMADS. The differences between observed and NCEP-CFSR or CMADS in temperature estimation is about 2 °C. Both the CMADS and NCEP-CFSR products tended to underestimate the daily maximum temperature by 4.25 and 5.01%, respectively.
The gauge station, NCEP-CFSR and CMADS products were incorporated into SWAT for the hydrological aspect assessment. Parameter sensitivity analysis shows that CN2 and ESCO are among the most sensitive parameters in the SWAT calibration of MRB, while GW_Delay and SOL_AWC are less sensitive than other parameters. The performance of gauge station in SWAT-based streamflow simulation can be considered as “very good” based on the performance rating that recommended by Moriasi [48], showing that SWAT can be a reliable tool to study the water balance in MRB. Basically, CMADS underestimated the monthly streamflow simulation, while NCEP-CFSR showed a significant overestimation. The performance of CMADS in monthly streamflow simulation is acceptable, but more improvement is needed before applying the model for further impact assessment. In contrast, NCEP-CFSR is not suitable to be applied for SWAT modelling in MRB due to the fact that it is unable to capture the streamflow pattern effectively.

Author Contributions

Conceptualization, M.L.T.; methodology, M.L.T. and D.Z.; software M.L.T. and D.Z.; validation, D.Z., M.A.M. and Y.L.T.; formal analysis, M.L.T.; data curation, M.L.T. and D.Z.; writing—original draft preparation, M.L.T. and D.Z.; writing—review and editing, M.L.T., S.R.S.D., N.S., C.K.C. and R.R.; supervision, M.L.T.; project administration, M.L.T.; funding acquisition, M.L.T. All authors have read and agreed to the published version of the manuscript.

Funding

This research was funded by the Ministry of Higher Education Malaysia under Fundamental Research Grant Scheme, grant number 203.PHUMANITI.6711695. This research was supported in part with Kurita Asia Research Grant (20Pmy024-K19) provided by Kurita Water and Environment Foundation.

Acknowledgments

Thanks to the Malaysian Meteorological Department, Department of Irrigation and Drainage Malaysia, Ministry of Agriculture and Agro-based Industry Malaysia for providing the hydro-climatic and geospatial data. Special thanks to the NCEP-CFSR, CMADS and SWAT developers for distributing their data and tool freely to the public.

Conflicts of Interest

The authors declare no conflict of interest.

References

  1. Tan, M.L.; Gassman, P.W.; Srinivasan, R.; Arnold, J.G.; Yang, X. A Review of SWAT Studies in Southeast Asia: Applications, Challenges and Future Directions. Water 2019, 11, 914. [Google Scholar] [CrossRef] [Green Version]
  2. Tan, M.L.; Gassman, P.; Yang, X.; Haywood, J. A Review of SWAT Applications, Performance and Future Needs for Simulation of Hydro-Climatic Extremes. Adv. Water Resour. 2020, 143, 103662. [Google Scholar] [CrossRef]
  3. Mannschatz, T.; Wolf, T.; Hülsmann, S. Nexus Tools Platform: Web-based comparison of modelling tools for analysis of water-soil-waste nexus. Environ. Model. Softw. 2016, 76, 137–153. [Google Scholar] [CrossRef]
  4. Gassman, P.W.; Sadeghi, A.M.; Srinivasan, R. Applications of the SWAT Model Special Section: Overview and Insights. J. Environ. Qual. 2014, 43, 1–8. [Google Scholar] [CrossRef]
  5. Zhu, Q.; Xuan, W.; Liu, L.; Xu, Y.-P. Evaluation and hydrological application of precipitation estimates derived from PERSIANN-CDR, TRMM 3B42V7, and NCEP-CFSR over humid regions in China. Hydrol. Process. 2016, 30, 3061–3083. [Google Scholar] [CrossRef]
  6. Tan, M.L.; Santo, H. Comparison of GPM IMERG, TMPA 3B42 and PERSIANN-CDR satellite precipitation products over Malaysia. Atmos. Res. 2018, 202, 63–76. [Google Scholar] [CrossRef]
  7. Maggioni, V.; Massari, C. On the performance of satellite precipitation products in riverine flood modeling: A review. J. Hydrol. 2018, 558, 214–224. [Google Scholar] [CrossRef]
  8. Mohammed, I.N.; Bolten, J.D.; Srinivasan, R.; Lakshmi, V. Satellite observations and modeling to understand the Lower Mekong River Basin streamflow variability. J. Hydrol. 2018, 564, 559–573. [Google Scholar] [CrossRef]
  9. Tan, M.L.; Samat, N.; Chan, N.W.; Roy, R. Hydro-Meteorological Assessment of Three GPM Satellite Precipitation Products in the Kelantan River Basin, Malaysia. Remote Sens. 2018, 10, 1011. [Google Scholar] [CrossRef] [Green Version]
  10. Li, D.; Christakos, G.; Ding, X.; Wu, J. Adequacy of TRMM satellite rainfall data in driving the SWAT modeling of Tiaoxi catchment (Taihu lake basin, China). J. Hydrol. 2018, 556, 1139–1152. [Google Scholar] [CrossRef]
  11. Yang, Y.; Wang, G.; Wang, L.; Yu, J.; Xu, Z. Evaluation of Gridded Precipitation Data for Driving SWAT Model in Area Upstream of Three Gorges Reservoir. PLoS ONE 2014, 9, e112725. [Google Scholar] [CrossRef]
  12. Saha, S.; Moorthi, S.; Pan, H.-L.; Wu, X.; Wang, J.; Nadiga, S.; Tripp, P.; Kistler, R.; Woollen, J.; Behringer, D.; et al. The NCEP Climate Forecast System Reanalysis. Bull. Am. Meteorol. Soc. 2010, 91, 1015–1058. [Google Scholar] [CrossRef]
  13. Meng, X.; Wang, H. Significance of the China Meteorological Assimilation Driving Datasets for the SWAT Model (CMADS) of East Asia. Water 2017, 9, 765. [Google Scholar] [CrossRef]
  14. CARD. SWAT Literature Database for Peer-Reviewed Journal Articles; Center for Agricultural and Rural Development, Iowa State University: Ames, IA, USA; Available online: https://www.card.iastate.edu/swat_articles/ (accessed on 30 October 2020).
  15. Dile, Y.T.; Srinivasan, R. Evaluation of CFSR climate data for hydrologic prediction in data-scarce watersheds: An application in the Blue Nile River Basin. JAWRA J. Am. Water Resour. Assoc. 2014, 50, 1226–1241. [Google Scholar] [CrossRef]
  16. Fuka, D.R.; Walter, M.T.; MacAlister, C.; Degaetano, A.T.; Steenhuis, T.S.; Easton, Z.M. Using the Climate Forecast System Reanalysis as weather input data for watershed models. Hydrol. Process. 2014, 28, 5613–5623. [Google Scholar] [CrossRef]
  17. Tan, M.L.; Gassman, P.W.; Cracknell, A.P. Assessment of Three Long-Term Gridded Climate Products for Hydro-Climatic Simulations in Tropical River Basins. Water 2017, 9, 229. [Google Scholar] [CrossRef] [Green Version]
  18. Bressiani, D.A.; Gassman, P.W.; Fernandes, J.G.; Garbossa, L.H.P.; Srinivasan, R.; Bonumá, N.B.; Mendiondo, E.M. Review of Soil and Water Assessment Tool (SWAT) applications in Brazil: Challenges and prospects. Int. J. Agric. Biol. Eng. 2015, 8, 9–35. [Google Scholar] [CrossRef]
  19. Monteiro, J.A.F.; Strauch, M.; Srinivasan, R.; Abbaspour, K.; Gücker, B. Accuracy of grid precipitation data for Brazil: Application in river discharge modelling of the Tocantins catchment. Hydrol. Process. 2016, 30, 1419–1430. [Google Scholar] [CrossRef]
  20. Meng, X.; Wang, H.; Shi, C.; Wu, Y.; Ji, X. Establishment and Evaluation of the China Meteorological Assimilation Driving Datasets for the SWAT Model (CMADS). Water 2018, 10, 1555. [Google Scholar] [CrossRef] [Green Version]
  21. Song, Y.; Zhang, J.; Meng, X.; Zhou, Y.; Lai, Y.; Cao, Y. Comparison Study of Multiple Precipitation Forcing Data on Hydrological Modeling and Projection in the Qujiang River Basin. Water 2020, 12, 2626. [Google Scholar] [CrossRef]
  22. Lu, J.; Liu, Z.; Liu, W.; Chen, X.; Zhang, L. Assessment of CFSR and CMADS Weather Data for Capturing Extreme Hydrologic Events in the Fuhe River Basin of the Poyang Lake. JAWRA J. Am. Water Resour. Assoc. 2020, 56, 917–934. [Google Scholar] [CrossRef]
  23. Zhou, Z.; Gao, X.; Yang, Z.; Feng, J.; Meng, C.; Xu, Z. Evaluation of Hydrological Application of CMADS in Jinhua River Basin, China. Water 2019, 11, 138. [Google Scholar] [CrossRef] [Green Version]
  24. Vu, T.T.; Li, L.; Jun, K.S. Evaluation of Multi-Satellite Precipitation Products for Streamflow Simulations: A Case Study for the Han River Basin in the Korean Peninsula, East Asia. Water 2018, 10, 642. [Google Scholar] [CrossRef] [Green Version]
  25. Tan, M.L.; Samat, N.; Chan, N.W.; Lee, A.J.; Li, C. Analysis of Precipitation and Temperature Extremes over the Muda River Basin, Malaysia. Water 2019, 11, 283. [Google Scholar] [CrossRef] [Green Version]
  26. MADA. Information of MADA’s Dams. Available online: http://www.mada.gov.my/?page_id=4241&lang=en (accessed on 6 October 2020).
  27. DID. Introduction to Beris Dam. Available online: https://www.water.gov.my/index.php/pages/view/1257 (accessed on 7 October 2020).
  28. Tan, M.L.; Chua, V.P.; Tan, K.C.; Brindha, K. Evaluation of TMPA 3B43 and NCEP-CFSR precipitation products in drought monitoring over Singapore. Int. J. Remote Sens. 2018, 39, 2089–2104. [Google Scholar] [CrossRef]
  29. SWAT. Global Weather Data for SWAT. Available online: https://globalweather.tamu.edu/ (accessed on 1 September 2020).
  30. Zhang, L.; Meng, X.; Wang, H.; Yang, M.; Cai, S. Investigate the Applicability of CMADS and CFSR Reanalysis in Northeast China. Water 2020, 12, 996. [Google Scholar] [CrossRef] [Green Version]
  31. Liu, J.; Shanguan, D.; Liu, S.; Ding, Y. Evaluation and Hydrological Simulation of CMADS and CFSR Reanalysis Datasets in the Qinghai-Tibet Plateau. Water 2018, 10, 513. [Google Scholar] [CrossRef] [Green Version]
  32. Gao, X.; Zhu, Q.; Yang, Z.; Wang, H. Evaluation and Hydrological Application of CMADS against TRMM 3B42V7, PERSIANN-CDR, NCEP-CFSR, and Gauge-Based Datasets in Xiang River Basin of China. Water 2018, 10, 1225. [Google Scholar] [CrossRef] [Green Version]
  33. CMADS. The China Meteorological Assimilation Driving Datasets for the SWAT Model v1.1. Available online: http://www.cmads.org/ (accessed on 1 September 2020).
  34. Arnold, J.G.; Srinivasan, R.; Muttiah, R.S.; Williams, J.R. Large area hydrologic modeling and assessment part I: Model development. JAWRA J. Am. Water Resour. Assoc. 1998, 34, 73–89. [Google Scholar] [CrossRef]
  35. Arnold, J.; Moriasi, D.; Gassman, P.C.; Abbaspour, K.; White, M.; Srinivasan, R.; Santhi, C.D.; Harmel, R.; van Griensven, A.; Van Liew, M.; et al. SWAT: Model use, calibration, and validation. Trans. ASABE 2012, 55, 1491–1508. [Google Scholar] [CrossRef]
  36. Arnold, J.G.; Fohrer, N. SWAT2000: Current capabilities and research opportunities in applied watershed modelling. Hydrol. Process. 2005, 19, 563–572. [Google Scholar] [CrossRef]
  37. Tan, M.L.; Juneng, L.; Tangang, F.T.; Samat, N.; Chan, N.W.; Yusop, Z.; Ngai, S.T. SouthEast Asia HydrO-meteorological droughT (SEA-HOT) framework: A case study in the Kelantan River Basin, Malaysia. Atmos. Res. 2020, 246, 105155. [Google Scholar] [CrossRef]
  38. Yaduvanshi, A.; Sharma, R.K.; Kar, S.C.; Sinha, A.K. Rainfall–runoff simulations of extreme monsoon rainfall events in a tropical river basin of India. Nat. Hazards 2018, 90, 843–861. [Google Scholar] [CrossRef]
  39. Neitsch, S.L.; Arnold, J.G.; Kiniry, J.R.; Grassland, J.R.W. Soil and Water Assessment Tool Theoretical Documentation Version 2009; Agricultural Research Service Blackland Research Center: Temple, TX, USA, 2011. [Google Scholar]
  40. DID. National Water Balance Management System. Available online: http://nawabs.water.gov.my/ (accessed on 1 September 2020).
  41. Hargreaves, G.H. Moisture Availability and Crop Production. Trans. ASAE 1975, 18, 980–0984. [Google Scholar] [CrossRef]
  42. Tan, M.L.; Yang, X. Effect of rainfall station density, distribution and missing values on SWAT outputs in tropical region. J. Hydrol. 2020, 584, 124660. [Google Scholar] [CrossRef]
  43. Tan, M.; Duan, Z. Assessment of GPM and TRMM Precipitation Products over Singapore. Remote Sens. 2017, 9, 720. [Google Scholar] [CrossRef] [Green Version]
  44. Condom, T.; Rau, P.; Espinoza, J.C. Correction of TRMM 3B43 monthly precipitation data over the mountainous areas of Peru during the period 1998–2007. Hydrol. Process. 2011, 25, 1924–1933. [Google Scholar] [CrossRef]
  45. Tan, M.L.; Ibrahim, A.; Duan, Z.; Cracknell, A.; Chaplot, V. Evaluation of Six High-Resolution Satellite and Ground-Based Precipitation Products over Malaysia. Remote Sens. 2015, 7, 1504. [Google Scholar] [CrossRef] [Green Version]
  46. Yang, J.; Reichert, P.; Abbaspour, K.C.; Xia, J.; Yang, H. Comparing uncertainty analysis techniques for a SWAT application to the Chaohe Basin in China. J. Hydrol. 2008, 358, 1–23. [Google Scholar] [CrossRef]
  47. Abbaspour, K.C.; Vaghefi, S.A.; Srinivasan, R. A Guideline for Successful Calibration and Uncertainty Analysis for Soil and Water Assessment: A Review of Papers from the 2016 International SWAT Conference. Water 2018, 10, 6. [Google Scholar] [CrossRef] [Green Version]
  48. Moriasi, D.N.; Gitau, M.W.; Pai, N.; Daggupati, P. Hydrologic and water quality models: Performance measures and evaluation criteria. Trans. ASABE 2015, 58, 1763–1785. [Google Scholar] [CrossRef] [Green Version]
  49. Tan, M.L.; Juneng, L.; Tangang, F.T.; Chan, N.W.; Ngai, S.T. Future hydro-meteorological drought of the Johor River Basin, Malaysia, based on CORDEX-SEA projections. Hydrol. Sci. J. 2019, 64, 921–933. [Google Scholar] [CrossRef]
  50. Tan, M.L.; Ficklin, D.; Ibrahim, A.L.; Yusop, Z. Impacts and uncertainties of climate change on streamflow of the Johor River Basin, Malaysia using a CMIP5 General Circulation Model ensemble. J. Water Climate Change 2014, 5, 676–695. [Google Scholar] [CrossRef]
  51. Tan, M.L.; Ibrahim, A.L.; Yusop, Z.; Duan, Z.; Ling, L. Impacts of land-use and climate variability on hydrological components in the Johor River basin, Malaysia. Hydrol. Sci. J. 2015, 60, 873–889. [Google Scholar] [CrossRef]
  52. Dlamini, N.S.; Kamal, M.R.; Soom, M.A.B.M.; Mohd, M.S.F.b.; Abdullah, A.F.B.; Hin, L.S. Modeling Potential Impacts of Climate Change on Streamflow Using Projections of the 5th Assessment Report for the Bernam River Basin, Malaysia. Water 2017, 9, 226. [Google Scholar] [CrossRef] [Green Version]
  53. Wang, Y.; Yang, G.; Gu, X.; He, X.; Gao, Y.; Tian, L.; Liao, N. Application of SWAT model with CMADS data for hydrological simulation in western China. J. Water Climate Change 2020. [Google Scholar] [CrossRef]
  54. Cao, Y.; Zhang, J.; Yang, M.; Lei, X.; Guo, B.; Yang, L.; Zeng, Z.; Qu, J. Application of SWAT Model with CMADS Data to Estimate Hydrological Elements and Parameter Uncertainty Based on SUFI-2 Algorithm in the Lijiang River Basin, China. Water 2018, 10, 742. [Google Scholar] [CrossRef] [Green Version]
  55. Zhang, L.; Meng, X.; Wang, H.; Yang, M. Simulated Runoff and Sediment Yield Responses to Land-Use Change Using the SWAT Model in Northeast China. Water 2019, 11, 915. [Google Scholar] [CrossRef] [Green Version]
  56. Meng, X.; Wang, H. China Meteorological Assimilation Datasets for the SWAT model Version 1.1 User Guide (in Chinese). Available online: https://pan.baidu.com/s/10v9jhcvKXWLfFcLj8rksdw#list/path=%2Fsharelink3691329061-606819072012486%2FCMADSV1.1&parentPath=%2Fsharelink3691329061-606819072012486 (accessed on 10 November 2020).
  57. Li, Y.; Wang, Y.; Zheng, J.; Yang, M. Investigating Spatial and Temporal Variation of Hydrological Processes in Western China Driven by CMADS. Water 2019, 11, 435. [Google Scholar] [CrossRef] [Green Version]
  58. Shivhare, N.; Dikshit, P.K.S.; Dwivedi, S.B. A Comparison of SWAT Model Calibration Techniques for Hydrological Modeling in the Ganga River Watershed. Engineering 2018, 4, 643–652. [Google Scholar] [CrossRef]
  59. Abbaspour, K.C.; Vejdani, M.; Haghighat, S. SWAT-CUP calibration and uncertainty programs for SWAT. Modsim Int. Congr. Model. Simul. Land Water Environ. Manag. Integr. Syst. Sustain. 2007, 364, 1603–1609. [Google Scholar]
Figure 1. Muda River basin.
Water 12 03288 g001
Figure 2. Scatter plots of gauge stations with (ac) NCEP-CFSR and (df) CMADS in daily precipitation (Pcp), daily maximum temperature (Tmax) and daily minimum temperature (Tmin) estimations.
Water 12 03288 g002
Figure 3. Scatter plots of gauge stations with (ac) NCEP-CFSR and (df) CMADS in monthly precipitation (Pcp), monthly maximum temperature (Tmax) and monthly minimum temperature (Tmin) estimations.
Water 12 03288 g003
Figure 4. Observed monthly runoff and SWAT model simulations at the hydrological stations during the calibration period (2009–2011) and validation period (2012–2014).
Water 12 03288 g004
Table 1. Information of the climate stations within and surrounding Muda River Basin.
NameIDLatitudeLongitudeElevationVariables
Ampangan Muda416386.12100.85110.00Pcp, Tmax, Tmin
Ampangan Pedu416196.25100.7758.60Pcp
Badenoch Estate415265.55100.7651.00Pcp
Butterworth486025.47100.402.80Pcp, Tmax, Tmin
Felda Sungai Tiang415595.99100.6038.00Pcp
Hospital Baling415455.68100.9352.00Pcp
Hospital Sungai Petani415435.65100.508.00Pcp
Pusat Pertanian Charok Padang415485.80100.7231.00Pcp, Tmax, Tmin
Pusat Pertanian Batu Seketol415495.97100.8071.00Pcp
Table 2. Statistical measures for the National Centers for Environmental Prediction Climate Forecast System Reanalysis (NCEP-CFSR) and China Meteorological Assimilation Driving Dataset for the Soil and Water Assessment Tool (SWAT) model (CMADS) assessment.
NameFormulaValue RangeIdeal Value
Correlation Coefficient (CC) CC = i = 1 n ( o i   o ¯ ) ( r i   r ¯ ) i = 1 n ( o i o ¯ ) 2 i = 1 n ( r i r ) 2 −1 to 11
Root Mean Square Error (RMSE) RMSE = 1 n i = 1 n ( r i o i ) 2 0 to ∞0
Relative Bias (RB) RB = i = 1 n ( r i o i ) i = 1 n o i ( 100 ) −∞ to ∞ 0
Probability of Detection (POD) POD = H i t s H i t s + M i s s e s 0 to 11
False Alarm Ratio (FAR) FAR = F a l s e A l a r m H i t s + F a l s e A l a r m 0 to 10
Critical Success Index (CSI) CSI = H i t s H i t s + F a l s e A l a r m + M i s s e s 0 to 11
Coefficient of Determination (R2) R 2 = ( i 1 n ( o i o ¯ ) ( r i r ¯ ) i = 1 n ( o i o ¯ ) 2 i = 1 n ( r i r ¯ ) 2 ) 2 ) 2 0 to 11
Nash-Sutcliffe Efficiency (NSE) NSE = 1 i = 1 n ( r i o i ) 2 i = 1 n ( o i o ¯ ) 2 0 to 11
* o = observed data, r = reanalysis data, n = number of samples, Hits = number of observed precipitation days correctly detected by NCEP-CFSR or CMADS, FalseAlarm = number of observed non-precipitation days but detected as precipitation days by NCEP-CFSR or CMADS and Misses = number of observed precipitation days not detected by NCEP-CFSR or CMADS.
Table 3. SWAT performance rating for streamflow simulations recommended by Moriasi [48].
Statistic MetricVery GoodGoodSatisfactoryNot Satisfactory
R2>0.850.75 ≤ R2 ≤ 0.850.60 < R2 < 0.75≤0.60
NSE>0.800.65 ≤ NSE ≤ 0.800.40 < NSE < 0.65≤0.40
RB>±5.00±5.00 ≤ RB ≤ ±10.00±10.00 < RB < ±15.00>±15.00
Table 4. Global sensitivity analysis of parameters and their rank (1—most sensitive) for SWAT monthly streamflow simulations in Muda River Basin under three different climate sources.
NoParameterNameGaugeNCEP-CFSRCMADS
1R__SOL_BD(..).solMoist bulk density435
2V__ESCO.hruSoil evaporation compensation factor222
3R__SOL_K(..).solSaturated hydraulic conductivity1084
4R__SOL_AWC(..).solAvailable water capacity of the soil layer111012
5V__CANMX.hruMaximum canopy storage998
6V__RCHRG_DP.gwDeep aquifer percolation fraction.846
7V__GW_DELAY.gwGroundwater delay (days)121310
8R__HRU_SLP.hruAverage slope steepness763
9R__SLSUBBSN.hruAverage slope length559
10R__SOL_Z(..).solDepth from soil surface to bottom of layer6711
11R__CN2.mgtSCS runoff curve number f111
12V__CH_N2.rteManning’s “n” value for the main channel13117
13V__GW_REVAP.gwGroundwater “revap” coefficient31213
Table 5. Optimal calibration parameters for Muda River Basin using three different climate sources.
Fitted Value
ParametersMinMaxGaugeNCEP-CFSRCMADS
1R__SOL_BD(..).sol−0.50.50.40−0.390.47
2V__ESCO.hru010.150.080.98
3R__SOL_K(..).sol−0.50.50.480.07−0.01
4R__SOL_AWC(..).sol−0.50.50.330.34−0.40
5V__CANMX.hru0109.514.399.49
6V__RCHRG_DP.gw010.760.210.67
7V__GW_DELAY.gw050037.50487.50122.50
8R__HRU_SLP.hru−0.50.50.410.20−0.24
9R__SLSUBBSN.hru−0.50.50.33−0.340.10
10R__SOL_Z(..).sol−0.50.50.150.30−0.50
11R__CN2.mgt−0.50.5−0.11−0.030.11
12V__CH_N2.rte00.30.170.210.29
13V__GW_REVAP.gw0.020.20.030.140.08
R_: Relative change (parameter is multiply with the given factor); V_: Replacement (parameter is replaced by given value).
Table 6. Statistical measures for monthly streamflow simulation at Jambatan Syed Omar.
Calibration (January 2009–December 2011)Validation (January 2012–July 2014)
R2NSERB (%)R2NSERB (%)
Gauge0.820.813.60.890.894.3
NCEP-CFSR0.580.21400.48−0.2344.7
CMADS0.60.59−3.70.390.21−13.1
Table 7. Statistical measures for CMADS SWAT-based monthly streamflow simulation in selected publications.
ReferenceRegionCalibrationValidation
R2NSERB (%)R2NSERB (%)
This StudyMuda River Basin, Malaysia0.600.59−3.70.390.21−13.1
Zhang et al. [30]Hunhe River Basin, China0.88–0.970.86–0.94-0.73–0.960.54–0.95-
Wang et al. [53]Jing River and Bo River Basins, China0.88–0.940.79–0.87-0.91–0.930.82–0.87-
Lu et al. [22]Fuhe River Basin, China0.840.80−2.570.870.82−20.34
Zhang et al. [55]Hun River Basin, China0.80–0.940.78–0.9213.02–21.620.69–0.940.67–0.8916.75–23.72
Li et al. [57]Jing and Bortala River Basin, China0.92–0.940.93-0.66–0.900.91–0.94-
Liu et al. [31]Yellow River Source Basin, China0.910.78-0.860.68-
Gao et al. [32]Xiang River Basin, China-0.92−12.06-0.802.17
Cao et al. [54]Lijiang River Basin, China0.960.967.70−0.960.957.80
Publisher’s Note: MDPI stays neutral with regard to jurisdictional claims in published maps and institutional affiliations.

