Carabus Population Response to Drought in Lowland Oak Hornbeam Forest


1
Department of Environmental Management, Faculty of European Studies and Regional Development, Slovak University of Agriculture in Nitra, Mariánska 10, 949 76 Nitra, Slovakia
2
Department of Planting Design and Maintenance, Faculty of Horticulture and Landscape Engineering, Slovak university of Agriculture in Nitra, Tulipánová 7, 949 76 Nitra, Slovakia
*
Author to whom correspondence should be addressed.
Water 2020, 12(11), 3284; https://doi.org/10.3390/w12113284
Submission received: 15 September 2020
/
Revised: 9 November 2020
/
Accepted: 20 November 2020
/
Published: 23 November 2020
(This article belongs to the Special Issue Impact of Natural Hazards on Forest Ecosystems and Their Surrounding Landscape under Climate Change)
Abstract
:Forest management practices and droughts affect the assemblages of carabid species, and these are the most important factors in terms of influencing short- and long-term population changes. During 2017 and 2018, the occurrences and seasonal dynamics of five carabid species (Carabus coriaceus, C. ulrichii, C. violaceus, C. nemoralis and C. scheidleri) in four oak hornbeam forest stands were evaluated using the method of pitfall trapping. The climate water balance values were cumulatively calculated here as cumulative water balance in monthly steps. The cumulative water balance was used to identify the onset and duration of drought. The number of Carabus species individuals was more than three times higher in 2018 than in 2017. Spring activity was influenced by temperature. The extremely warm April in 2018 accelerated spring population dynamics; however, low night temperatures in April in 2017 slowed the spring activity of nocturnal species. Drought negatively influenced population abundance, and the effect of a drought is likely to be expressed with a two-year delay. In our investigation, a drought in 2015 started in May and lasted eight months; however, the drought was not recorded in 2016, and 2016 was evaluated as a humid year. The meteorological conditions in the year influenced seasonal activity patterns and the timings of peaks of abundance for both spring breeding and autumn breeding Carabus species.
1. Introduction
Ground dwelling invertebrates such as carabid beetles and spiders are often surveyed with respect of ecosystem changes. These invertebrates have strong potential as ecological indicators, as they are readily surveyed in sufficient numbers for meaningful conclusions to be drawn, have a stable taxonomy, and, at least in the case of ground beetles, are readily identified. They are, for example, good local scale indicators of ecosystem disturbance in forested landscapes at both the short- and long-term time scales, responding to clear-cut logging and fire differently [1].
Carabids belong to one of the most frequently used model groups for biological studies. The reasons for this are various, including the relatively stable taxonomy, species richness, occurrence in most terrestrial habitats and geographical areas, availability of simple collection methods, and known sensitivity to environmental changes [2]. The effect of clearcutting on Carabidae is well studied. Clearcutting has a definitive impact on Carabidae, depending on species, and notably in cases with the replacement of large forest species by the usually smaller eurytopic open field species in clearings [3]. Human impacts in forest ecosystems generally cause losses for some relict species and gains for ubiquitous species. Clearcutting leads to a drastic decrease in mean individual biomass. The regeneration of carabid fauna after clearcutting is a very slow process, and typical relict forest species are absent even after several decades of forest regeneration [4]. The impact of a drought on carabid assemblage has been studied in forests damaged by a windstorm in the High Tatra Mountains, focusing on the trends of community differentiation according to the state and management of damaged sites. The revealed trends included reversible quantitative changes recorded on stands with the fallen timber in situ, the disappearance of less tolerant forest species at sites with extracted timber, and temporal invasions of xenocoenous open-landscape species at the sites with extracted timber and additionally burned sites [5].
Phenology, which is the timing of the seasonal activities of animals and plants, is perhaps the simplest process for monitoring changes in the ecology of species in response to climate change. Species responses to climate change can disrupt their interactions with others at the same or adjacent trophic level. If closely cooperating or competing species show different responses or susceptibility to change, the outcome of their interactions may change, as suggested by long term data for terrestrial and marine organisms. Therefore, rapid climate change or extreme climatic events can be expected to change the compositions of organism communities [6]. Phenological changes caused by climate change are slower at higher trophic levels (i.e., secondary consumers) than at lower trophic levels (excluding woody plants), thus higher trophic levels are particularly sensitive to the disruption of phenological connections [7]. Carabidae represent an important food role in many terrestrial ecosystems [8,9]. They are among the most important insect predators of soil fauna, especially in temperate climate regions [10].
Climate change is expected to alter average temperature and precipitation values and increase the variability of precipitation events, which may lead to even more intense and frequent floods and droughts [11], although future projections reveal regionally different occurrences of extreme events. As projected in [12], at a pan-European scale, the regions that are most prone to a rise in flood frequency are located in northern to northeastern Europe, while the southern and southeastern European regions show significant increases in the frequencies of drought. Similarly, significant regional differences have also been projected for extreme events in China and East Africa [13,14].
As pointed out in [15], altitude and topography are strong climate-differentiating factors. The Slovak territory has been divided by [16] into nine altitudinal vegetation stages. The vegetation stages of lower elevations, i.e., oak vegetation (stage 1), are rather arid during the vegetation period (from March to September). Altitudinal analysis of the drought climatology of the Western Carpathians in Slovakia has been carried out by [15,17], and the results point out a significant trend for aridity at the lowest altitudes, which is where the oak vegetation stage occurs. The southern part of the Slovak Republic territory is the region where agricultural landscape is prevailing, and forests are scarce there and mostly occur as isolated enclaves [18]. Apart from altitudinal vegetation stage division, the Slovak Republic territory is traditionally divided into the varying agroclimatic zones, and the climatic water balance is the basis for such regionalization [19]. This practice of regionalization is still under scientific revision with respect to climate change [20] or drought occurrence analysis [21].
The aim of our research here is to determine the impact of drought on Carabus beetles populations in lowland oak hornbeam forest occurring at the driest region of the Slovakia. The influence of different types of forest stands on the Carabus beetles populations is also studied.
2. Materials and Methods
The study was carried out at the locality of Báb (Figure 1), which is situated approximately 15 km from Nitra, Slovakia, and located in the southwest of Slovakia. The forest is a rest of former climax woodland covered lowlands and hill areas of in the Nitrianska pahorkatina region. The locality belongs to the Pannonian Bio-geographical Region. The deciduous oak hornbeam forest of 66 ha is partly preserved as a natural reserve and the rest of the forest area is managed [22]. Báb research site is a part of the national LTER (Long term ecological research) network, which is part of the organizational structure of LTER-Europe (http://www.lter-europe.net/). The site was established in 1967 under the International Biological Program (IBP) framework and research started with the IBP (1967–1970) and UNESCO Man and Biosphere (1971–1974) projects. The research activities were carried out until 1974 [23]. After the complex and intensive ecosystem research in 1967–1974, research continued to a restricted extent with the work of individual researchers [24]. In November 2006, single line and shelterwood logging was carried out and, the area was than cleaned up from brushwood beginning 2007. After tree removal, four clear-cut stands were created at the locality.
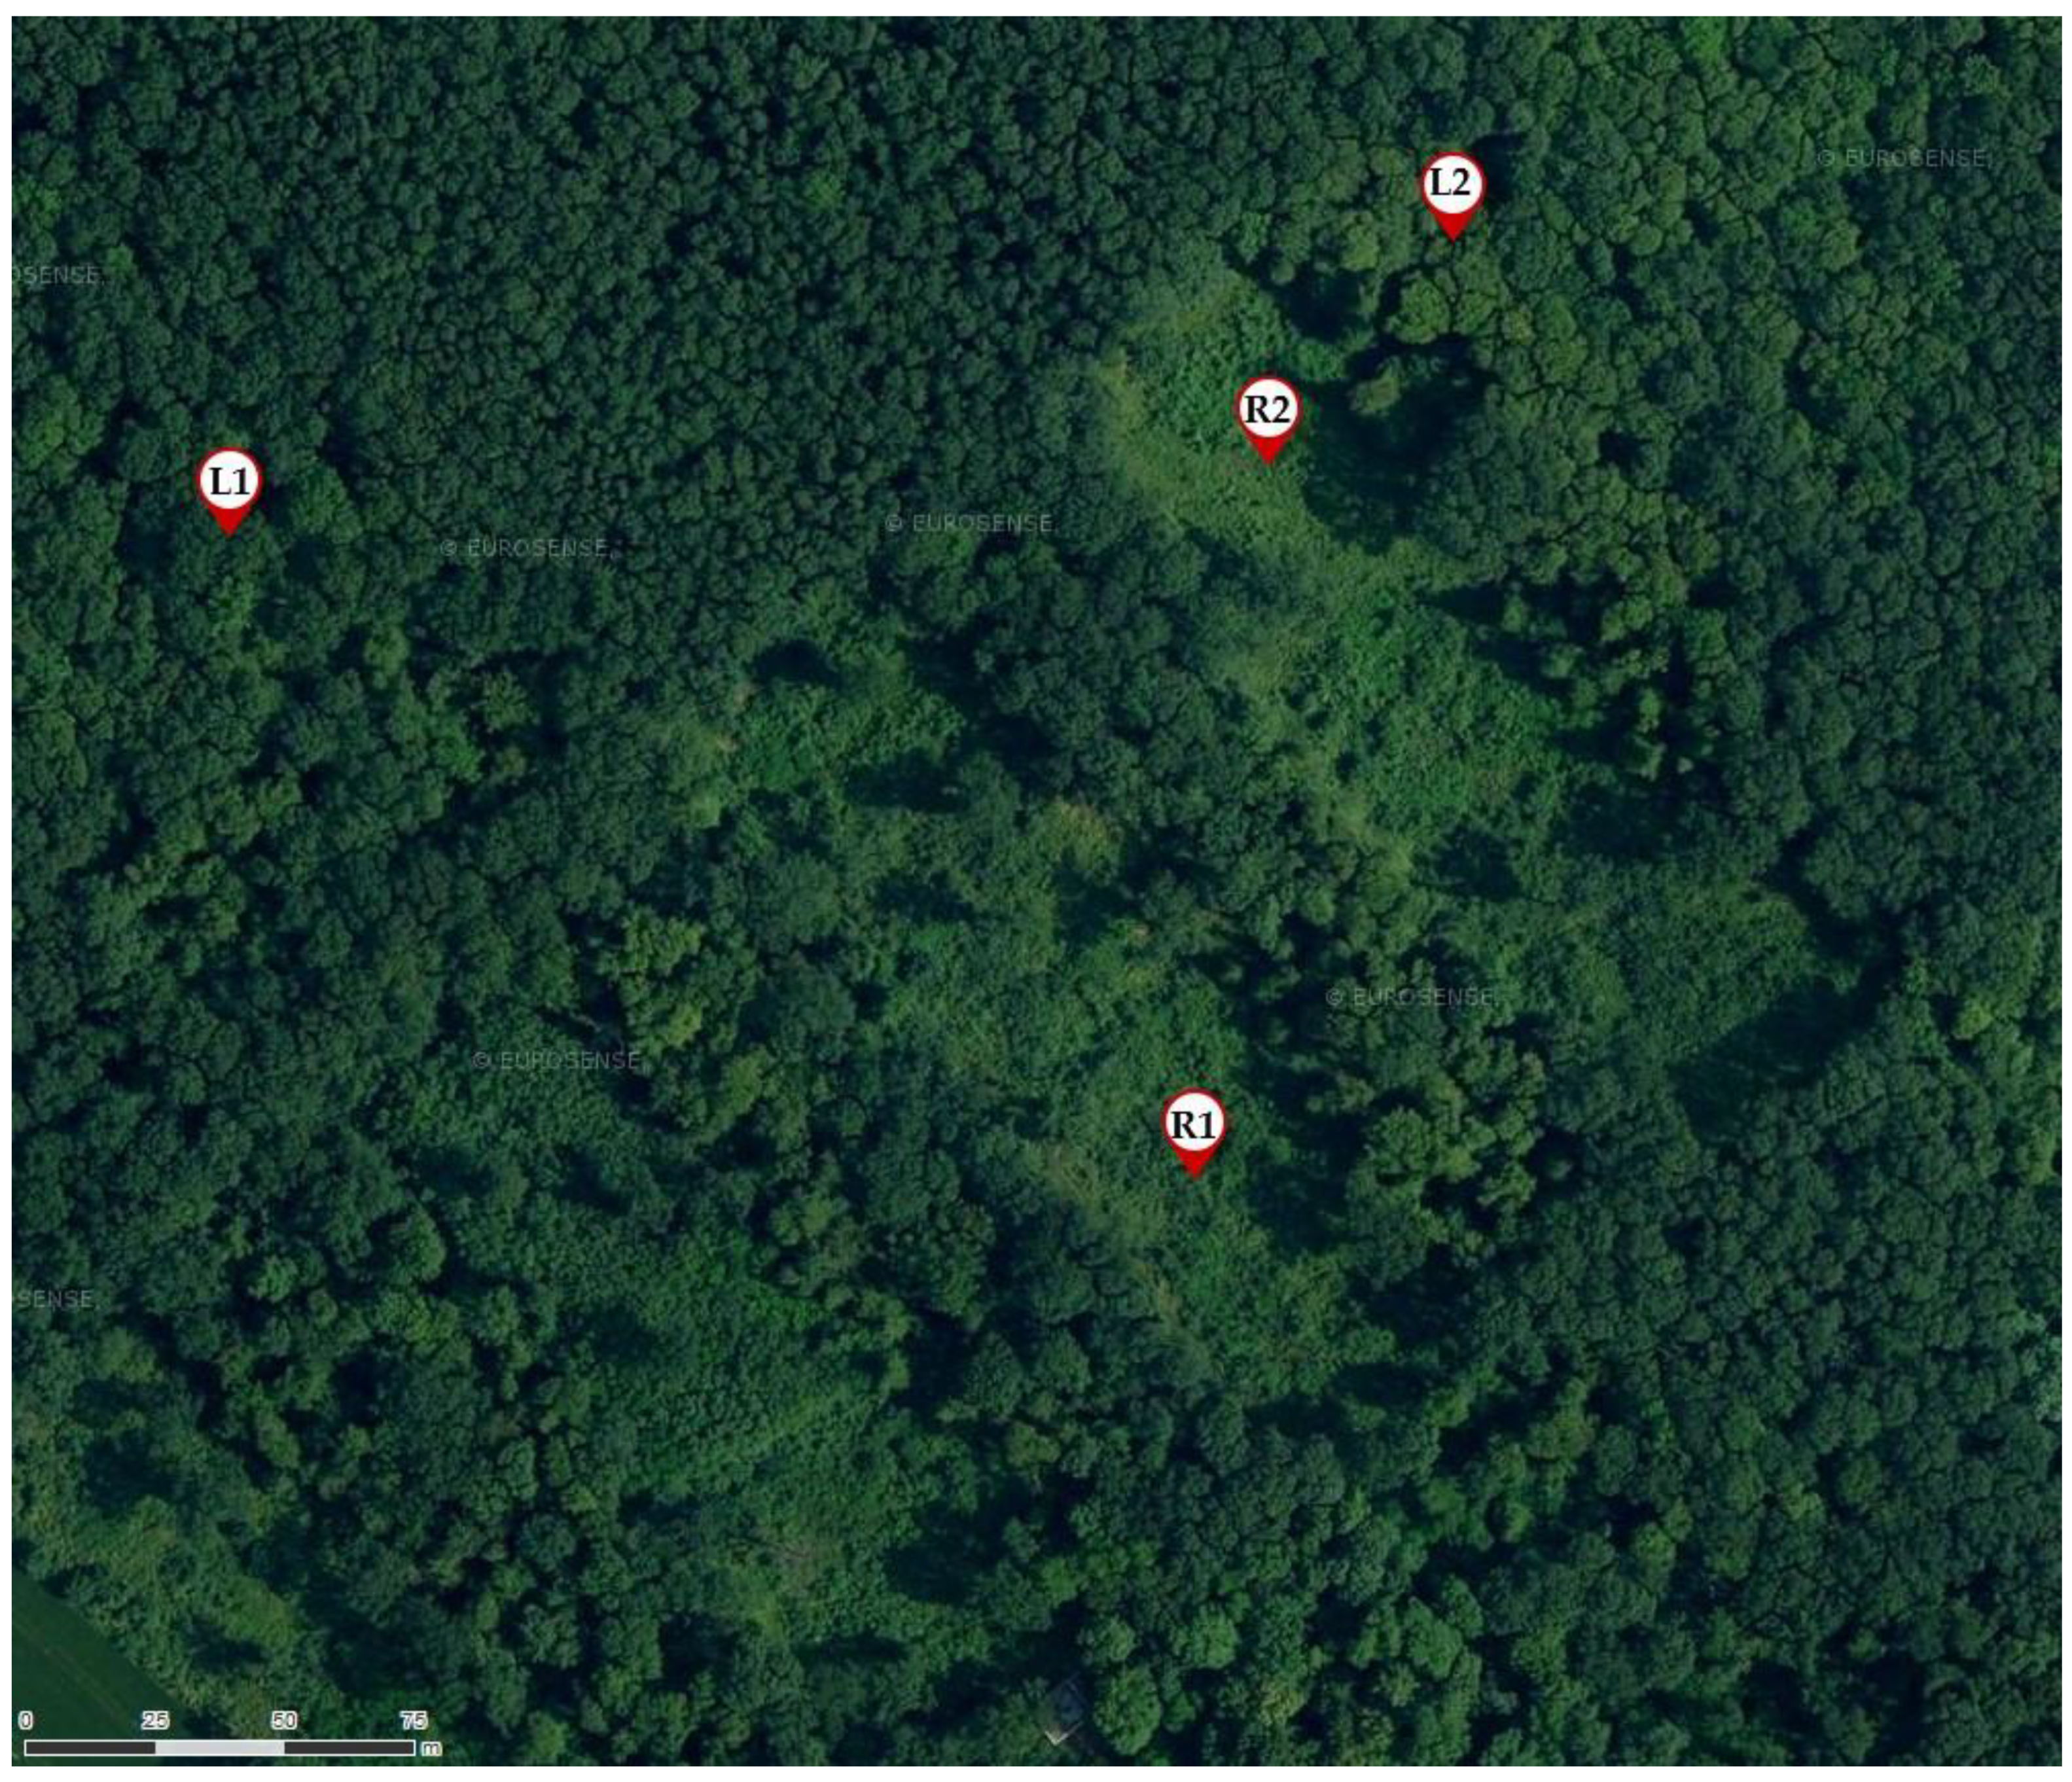
For our study, four 20 × 20 m2 study plots were chosen at the locality. Two plots were chosen to represent forest stands. The first, named L1, represented close-to-nature forest, i.e., where no forest intervention had been carried out since 1962. The characteristic features of the L1 stand are higher wood cover and lower herb cover caused by overshadowing. The characteristics of the second forest stand, named L2, were influenced by logging in the neighborhood. Higher illumination resulted in higher herb cover and lower cover of the shrub layer. The other two plots represented recovering forest after clearcutting 10 years prior. The plot R1 represented a recovering forest stand that had become overgrown with shrubs and young tree vegetation (Acer campestre, Crataegus laevigata, Carpinus betulus, Rosa canina, Quercus cerris, Q. petrea, etc.). The dense canopy closure of the young trees resulted in lower herb cover. A higher presence of fine woody debris was typical for the ground at the R1 study plot. The plot named R2 represented another after recovering stand after logging operations. Compared to R1, the R2 plot was characterized by the dominance of the invasive tree species Ailanthus altissima and the dense herb layer cover that was mostly formed by medium to tall herbs (e.g., Mercurialis annua, Convallaria majalis, Urtica dioica, Ballota nigra). The trees of A. altissima were approximately 2–3-year-old sprout shoots, as single-cut removal of this invasive species was performed in 2015. The localizations of the individual study plots are given in Figure A1.
Carabids were collected using the method of pitfall trapping (180 mL plastic cups buried in the soil and filled with vinegar to kill and preserve samples). Seven pitfall traps were installed at each research plot. Four traps were located at the corners, where the remaining three traps were placed diagonally inside the plots at regular spacings. The samples were removed weekly from the beginning of April to the end of September. The species determination was based on adult beetles morphology, where the classification method of [26] was adopted.
The occasional damage of traps is common in the field. For this reason, it was not possible to use absolute numbers of trapped individuals. The numbers of individuals for each species were evaluated as the number of individuals per trap. Weekly catches, i.e., the number of individuals per trap per week, were used for seasonal activity evaluation. Weekly evaluation allowed comparison of the dynamics of carabid populations between the two years and more precise identification of the peak activity timing. With the monthly catches, number of individuals per trap per month values were calculated for the purpose of the evaluation of the impact of drought on carabid species populations.
We used the index of dominance (Di) to compare the occurrence levels between species and the four forest stands:
where ni is the abundance of individual species and N is the total abundance.
Di = (ni/N) × 100 (%)
The temperature and precipitation data were obtained from the automatic climatic station located in the open area next to the Báb forest (Figure 1). The meteorological conditions in the year were characterized according to the climatological normal and the period of 1961–1990 was used as normal. The monthly values of the precipitation total and the average temperature were compared to the normal values. The cumulative water balance was used for drought episode identification and the duration of the drought. Firstly, the climate water balance calculation, based on the monthly values of atmospheric precipitation and potential evapotranspiration, was derived for every month in the year. The result can be positive, representing a positive water balance in the given month, or negative, representing the water deficit. Then, the climate water balance values were cumulatively calculated as cumulative water balance in monthly steps. The criterion for identifying a drought was the occurrence of a negative cumulative value for a specific month. A polynomial fourth-order trend line described the dynamics of the drought. When the trend line cut the x-axis towards the negative values, this was considered as the onset of a drought, and vice versa, where cutting the x-axis towards positive values represented the end of a drought [20,27].
3. Results
3.1. The Occurrence of the Carabus Species
Five species of the genus Carabus were recorded during the two years of our research: Carabus coriaceus, Carabus nemoralis, Carabus ulrichii, Carabus scheidleri, and Carabus violaceus.
Carabus beetles were active during the whole period of study, i.e., from the beginning of April until the end of September. The considerable difference between the total number of caught beetles was the most obvious aspect between the two compared years, where more than triple the number of individuals were caught in 2018 than in 2017 (583 and 1789 individuals in 2017 and 2018, respectively).
The Carabid occurrence levels, evaluated as the number of individuals per trap caught through the whole research period, were not equal for the four study plots. The highest carabid occurrence was recorded at the forest stand L2, where 7.7 and 22.8 individuals per trap were caught per season in 2017 and 2018, respectively. The results for the close-to-nature forest stand (i.e., the L1 research plot) showed that Carabid occurrence there was the lowest in 2017, but the second best overall in 2018, with 3.4 and 18 individuals per trap per season, respectively. The occurrences recorded at the recovering forest stand R1 were lowest in 2018, but second best in 2017 (12.8 and 6.3 individuals caught per trap per season in 2018 and 2017, respectively). For the R2 recovering forest stand, the numbers of caught individuals per trap and season were 5.5 in 2017 and 15 in 2018.
The differences between the occurrences of the individual species were also recorded, and some specifies that related to stand preference were also recorded.
Carabus ulrichii was the most frequent species for both 2017 and 2018, with approximately 27 and 42% of collected individuals belonging to this species in 2017 and 2018, respectively (Table 1). In 2018, C. ulrichii dominated at all stands, and its dominance was even higher than 50% at the L2 study plot. In 2017, C. ulrichii dominated at the two the closest stands, which were the recovering forest plot R2 and forest plot L2 (Table 2).
The species with the lowest occurrence was Carabus nemoralis. The dominance of this species was slightly higher in 2018 than 2017. The dominance of this species was especially low at the two recovering forest stands (Table 2). In 2018, almost 70% of the individuals of C. nemoralis were caught at the L1 forest stand, and more than 90% of individuals were collected at both forest stands. In 2017, the catch percentages at the forest plots were lower, but still high with values of almost 65%.
Carabus coriaceus and Carabus scheidleri reached dominance percentages of approximately 20% during both survey years (Table 1 and Table 2). Almost 50% of Carabus coriaceus individuals were caught at the R1 recovering forest stand in 2017, where it was also the dominant species (Table 1); however, the dominance of this species was still high at the same study plot in 2018 (Table 2). The same number of individuals were collected at L2. Comparing the dominance of the species Carabus scheidleri in the two years of study and the four studied stands, there was no clear preference for a specific stand. When comparing the absolute numbers of caught individuals, slightly fewer individuals were captured at the L1 forest stand.
The species Carabus violaceus was the only species with lower occurrence in 2018; however, the absolute number decrease was only 31 individuals, where several-fold increases in the numbers of individuals for other species made this species the least represented in 2018 (Table 2).
3.2. The Seasonal Activity of the Carabus Species
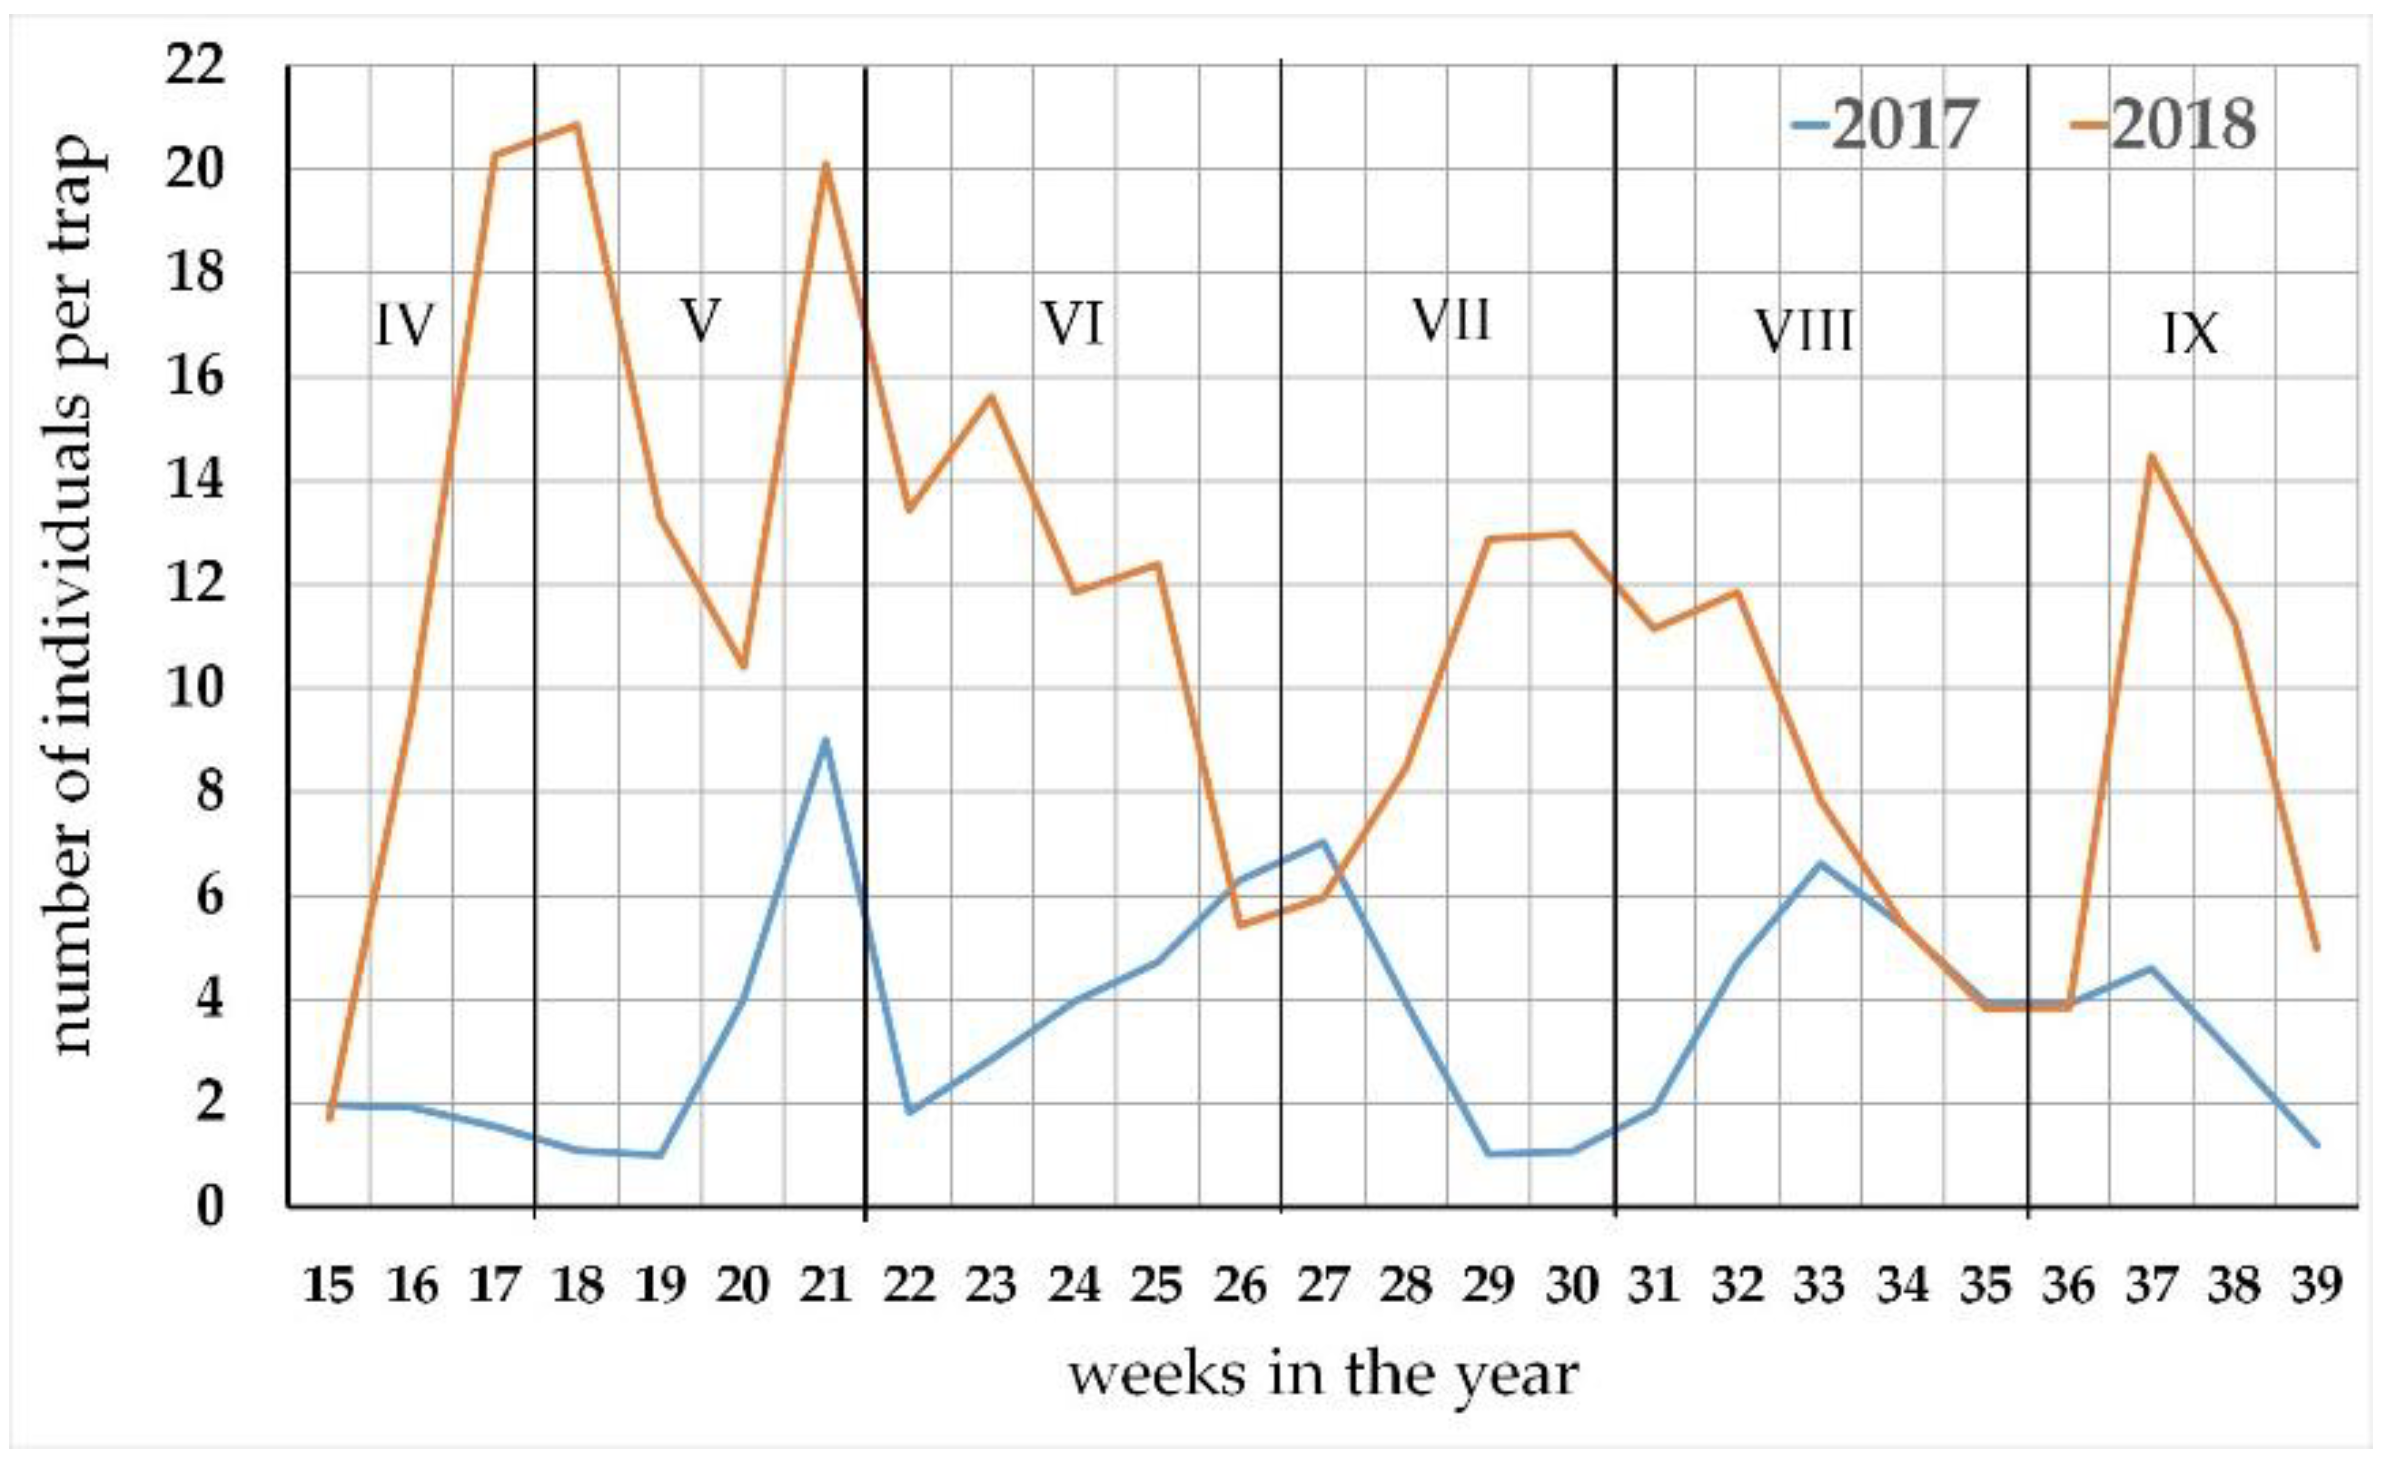
In 2017, Carabus species activity remained low until first ten days of May (Figure 2). Then, the activity raised gradually, reaching a peak by the end of May, followed by a sudden decline in activity in the beginning of June (22nd week). The early summer activity period reached a peak in the beginning of July. After the summer stagnation, Carabids performed late summer–early autumn activity period with the peak of activity recorded in the middle of August.
Besides the higher culmination levels, the difference in timing was another important aspect of the seasonal activity course in 2018 (Figure 2). In 2018, the beginning of Carabid activity was more dynamic when compared to the previous year. From the beginning of April, the activity rapidly increased and the spring peak of activity was recorded at the turn of April to May. After the period of decline in the middle of May, the activity raised again by the end of May and decreased in the end of June. The summer activity period culminated at the turn of July to August. The autumn period of activity culminated in the middle of September (Figure 2).
The observed activity peaks could be divided into seasonal activity for three distinct periods: (1) the spring to early summer activity period, (2) summer activity period, and (3) late summer to autumn activity period.
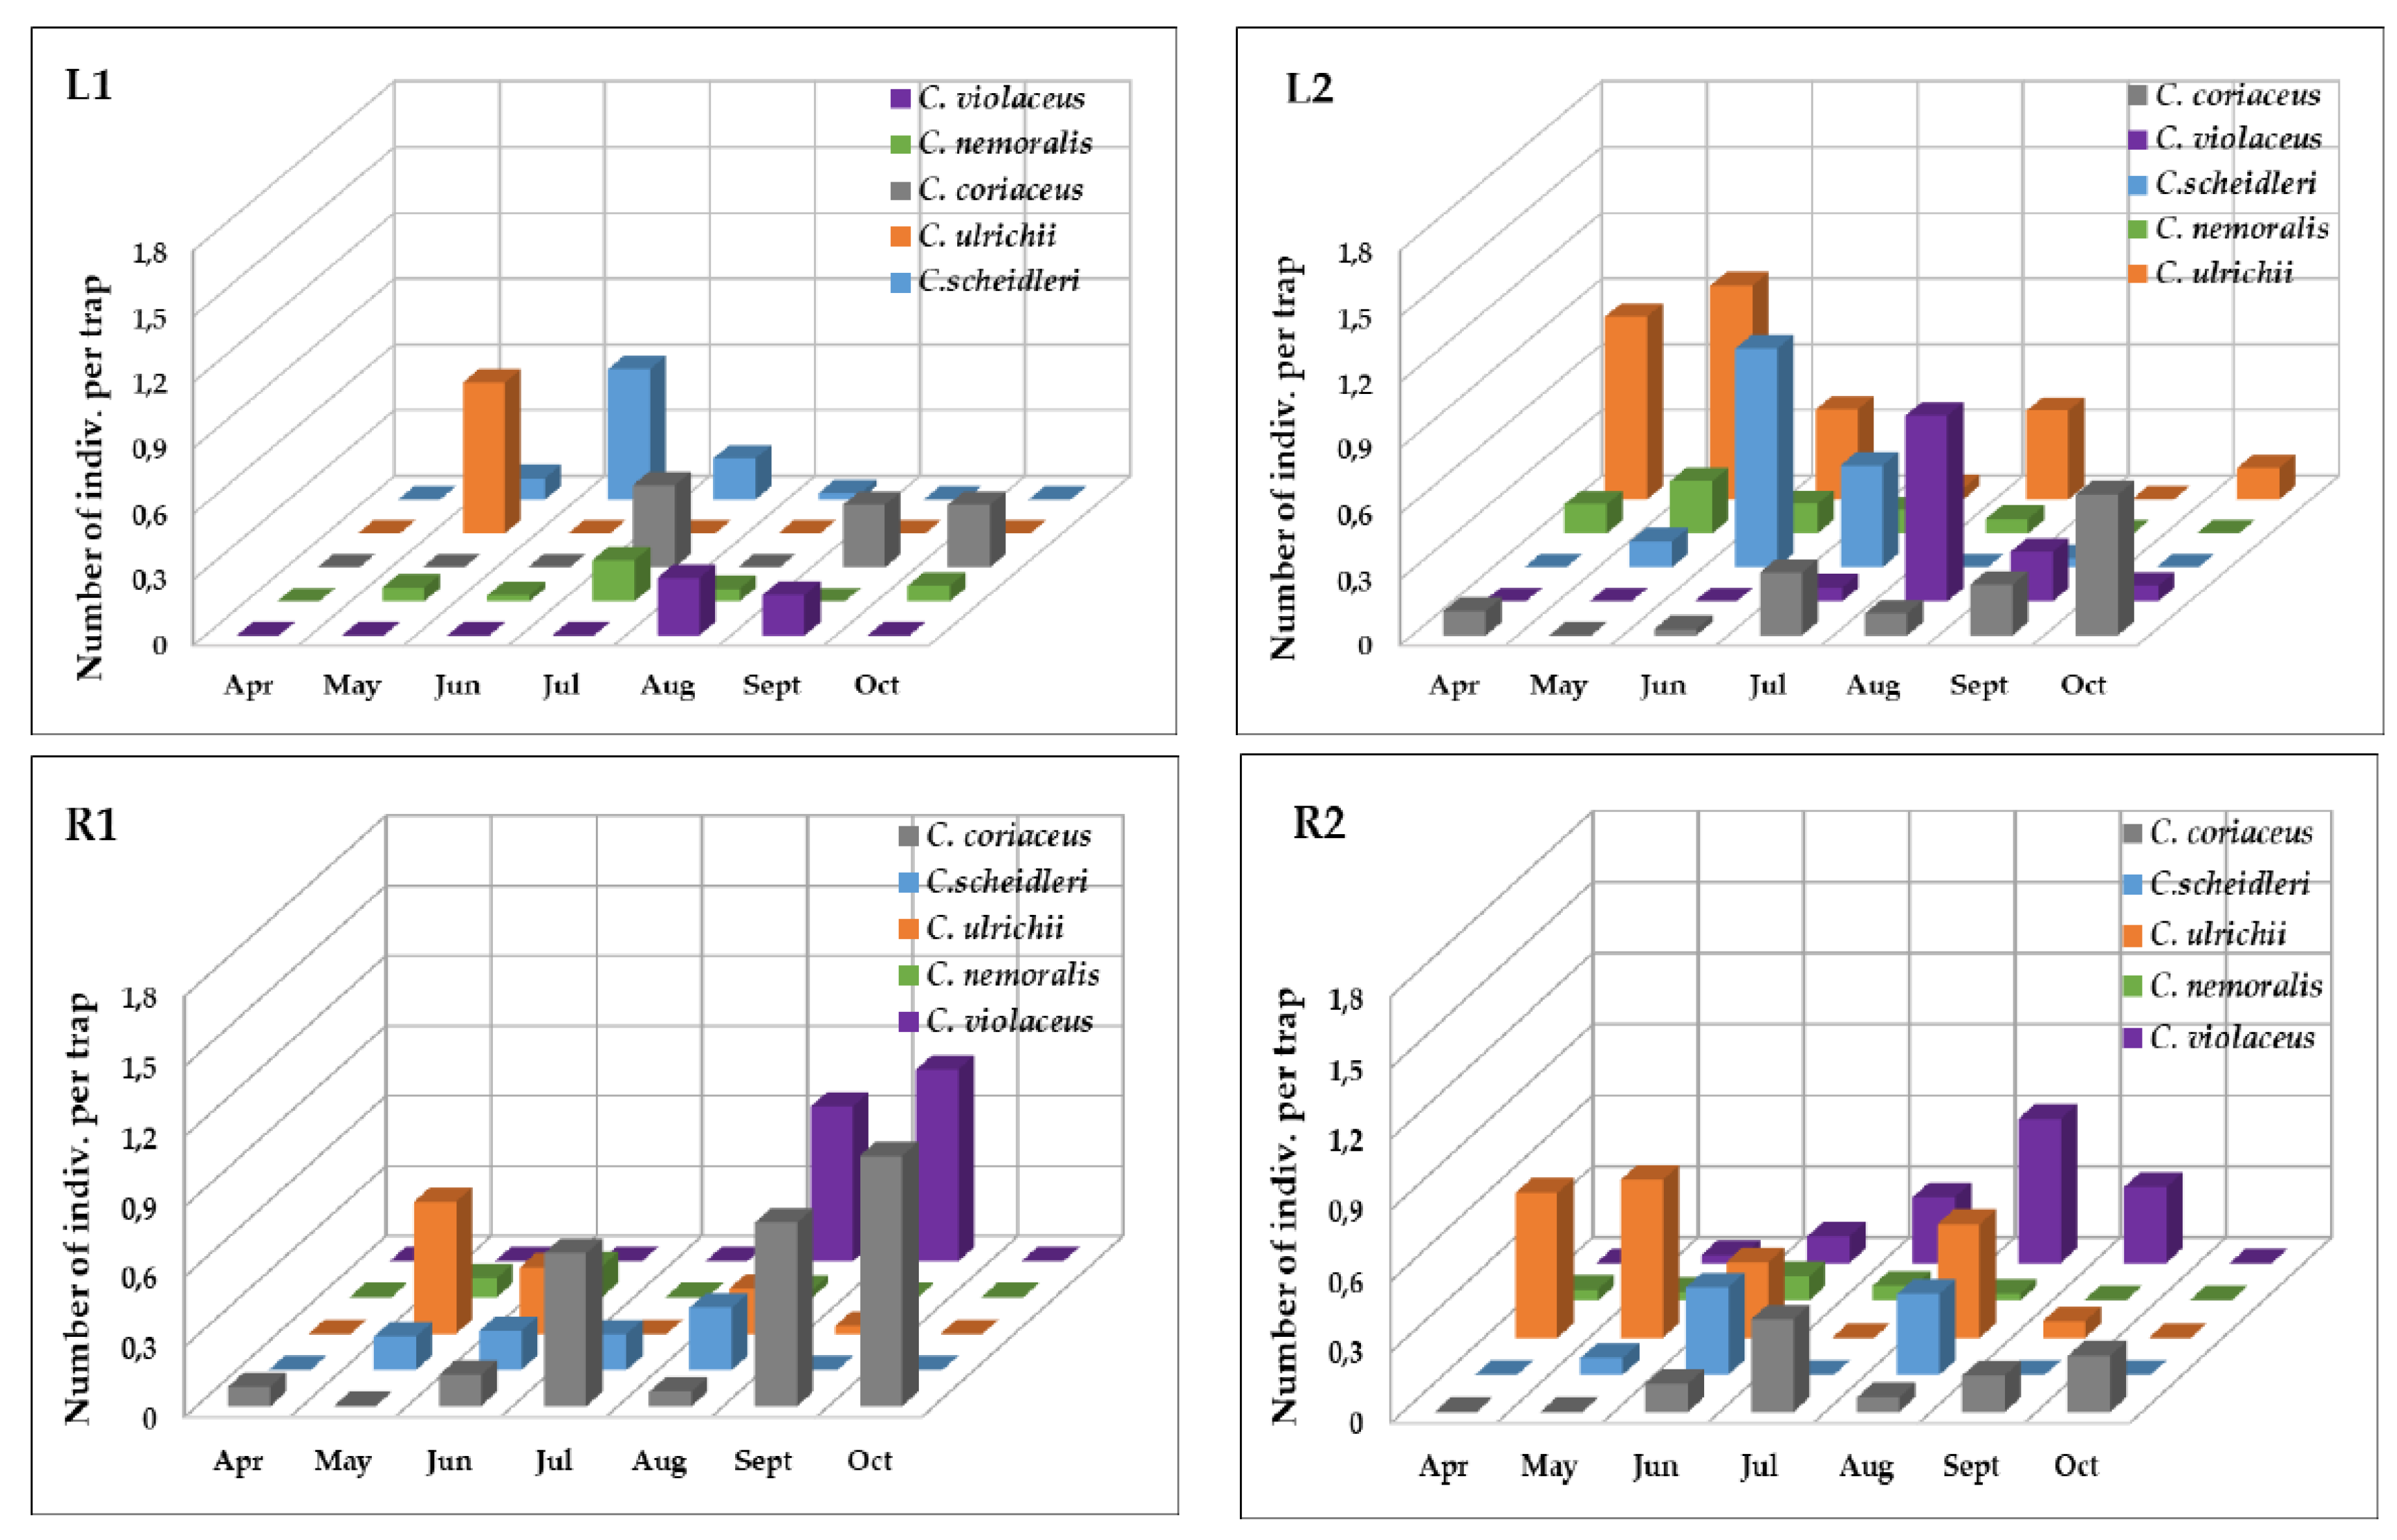
In 2017, the carabid activity through April and May was mostly influenced by the activity of C. ulrichii at all study plots (Figure 3). The peak of activity recorded by the end of May was almost exclusively influenced by this species. C. scheidleri started to activate from the second half of May, and the activity culmination at the turn of June to July was considerably influenced by this species, especially for both forest study plots (Figure 3); however, few individuals of the species C. coriaceus were recorded in April at L2 and R1. The species started its main activity at the end of June, where the maximum activity was recorded during the beginning of July. During the same period, the activity of C. nemoralis peaked at both forest stands (Figure 3). From the second half of July to the first half of August, summer activity stagnation was observed at all research plots. C. violaceus started to activate at the turn of July to August and considerably contributed to activity during middle to late August. The activities of C. ulrichii and C. scheidleri at the two forest recovering stands also significantly contributed to the August activity culmination. The autumn activity period was characterized by C. coriaceus and C. violaceus activity (Figure 3).
The very dynamic start of carabid activity in April in 2018 was affected by C. ulrichii activity. In contrast with the spring activity observed in 2017, the two other species, C. scheidleri and C. nemoralis, were active through April and May. C. nemoralis was especially active at the both forest stands (Figure 4). A sudden decline in activity in the middle of May was recorded for C. ulrichii at all study plots. The decline in activity was also recorded for other spring active species in 2018, with the exception of C. scheidleri activity in the close-to-nature forest stand (L1, Figure 4). Afterwards, the recovery of activity was recorded, and the culmination of the activity at the end of May was affected by the activity of C. ulrichii and C. scheidleri at the two forest stands (Figure 4, L1, L2). The June activity period in 2018 was affected by the three mentioned species, featuring gradual decreases in activity towards the end of June. Similar to 2017, C. coriaceus and C. nemoralis exhibited their typical summer activity period in July. The high activity rate in late summer (July and August) is the most obvious difference in the activity patterns between the two years (Figure 2). Two species were active through this period (C. ulrichii and C. scheidleri), in contrast with the same period in 2017, especially in terms of increased activity in the two forest stands. The late summer to early autumn activity of C. coriaceus and C. violaceus showed the same pattern as in 2017, with much higher occurrence levels in 2018, as in 2017 in the case of C. coriaceus.
3.3. Meteorological Conditions in 2017 and 2018 for the Locality of Báb
The year of 2017 was characterized by the onset of higher air temperatures compared to the climate normal, especially during the months of February and March. The middle of the growing season was very warm in 2017 and the end of the year was normal in terms of the temperature (Table 3). Overall, 2017 was characterized as warm with an average annual air temperature of 10.3 °C. The beginning of the growing season in 2018 was characterized by a sudden transition from cold March to extremely warm April (Table 4). Until the end of the year, the temperature was above the long-term normal. During the growing season, there were up to three extremely warm months (Table 4). Overall, 2018, with an average annual air temperature of 11.5 °C, was assessed as extremely warm in terms of the deviation of the annual air temperature from the climatic normal ΔT of +1.8 °C.
In 2017, dry conditions prevailed in the first half of the year, where two extremely dry months were recorded and May fell into the growing season (Table 3). The second half of the year was slightly richer in terms of precipitation and September was evaluated as extremely wet. Overall, 2017 was extremely dry and seven of the months were evaluated as dry (either very dry or extremely dry), and the annual precipitation total was 69% compared to the normal period 1961–1990. As in the case of temperature, the beginning of the season in 2018 was characterized by a sudden transition from normal precipitation in March to an extremely dry April (Table 4). Four of the months were evaluated as wet, and, as in the previous year, September was assessed as extremely wet (Table 4). With an annual precipitation total of 540 mm, 2018 was evaluated as a year with normal precipitation.
3.4. The Drought Occurrence at the Locality of Báb between 2015 and 2018
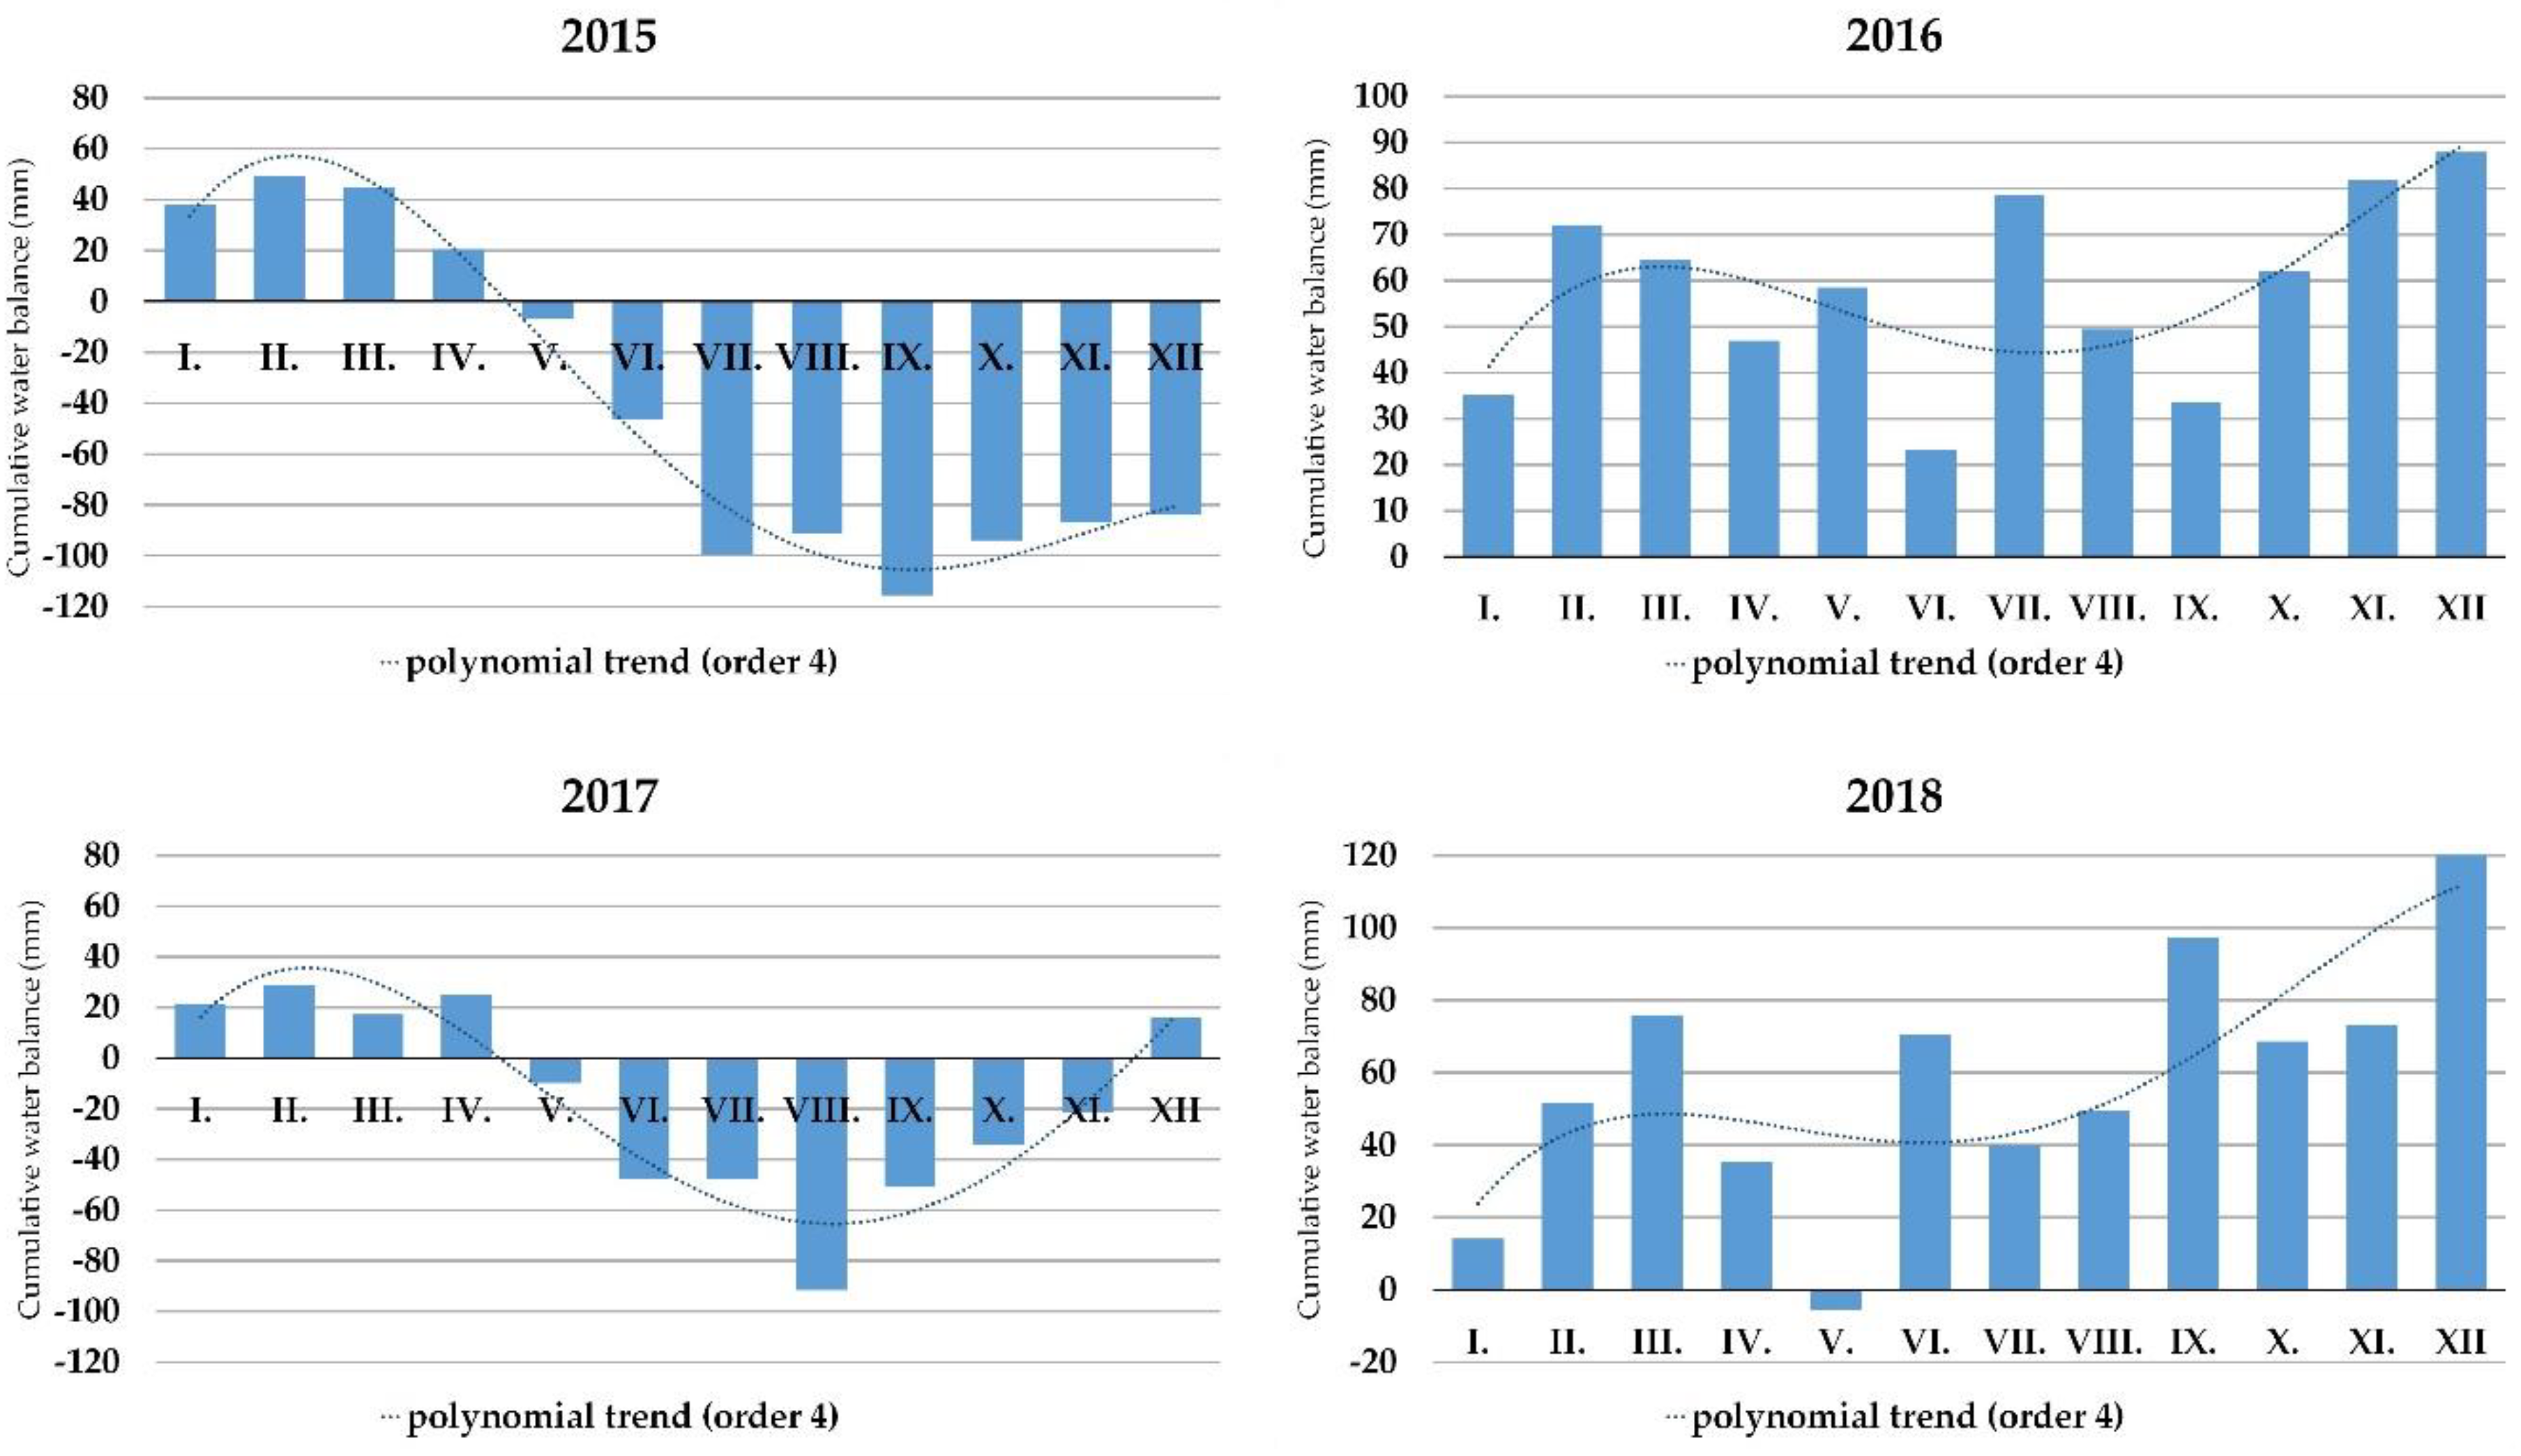
Figure 5 documents the occurrence of drought episodes during the years 2015 to 2018 at the locality of Báb (southwestern Slovakia). According to the cumulative water balance, drought occurrences were recorded in 2015 and 2017. Drought lasted longer in 2015 and was more pronounced in 2017. For both 2016 and 2018, positive water balance was recorded throughout the year and there was only the occurrence of a mild drought in May in 2018 (Figure 5). Comparing the trend line trajectories and the points of x-axis cutting in 2015 and 2017, the onset of drought started earlier in 2017, i.e., by the end of April, and lasted seven months. The drought episode ended in the turn of November to December in 2017; however, the drought onset started a little later in 2015, where the drought lasted until the end of the year.
4. Discussion
In [28], changes in the occurrence of beetle families in the locality of Báb were evaluated in terms of research during the periods of 1968–1969 and 2002–2004. The results were evaluated from the point of view of changing climate parameters in the research area; however, there were no significant changes recorded for the proportions of beetle families, but some aspects of desertification were observed in the research area. The occurrence of six hygrophilous carabid species was not recorded and new thermophilous species were recorded when compared to the results of a survey thirty years ago.
The five monitored carabid species have different phenological characteristics, which has an impact on seasonal activity but also seasonal changes in carabid assemblage compositions.
In Europe and elsewhere within temperate zone, most Carabidae are single-generation [8], although adults may survive for more than one season. They can overwinter either as a larva or as an adult beetle.
Carabus coriaceus has a two-year cycle, where in Central Europe it is mostly reported to reproduce in autumn. The copulation and laying of eggs takes place from the second half of August to November, where individuals overwinter as larva of the first to second instar. The larva of the last instar require a long time to mature, so they pupate only in the following year during June to July. Newly hatched individuals appear in summer and early autumn, where after hibernation they are active in spring but do not reproduce until autumn after aestivation [29]. The work in [30] showed females with developed eggs since the beginning of August. Before this date, the female ovaries were undeveloped. [29] shows that Carabus nemoralis is an active species in early spring, laying eggs from March to May. Adults remain active until about July, then start aestivation during August and September. The work in [31] states that C. nemoralis is a species that reproduces in spring and that its seasonal activity features two peaks. The second maximum of the activity of C. nemoralis occurs in October, which is outside the period of our study. The course of the second maximum is influenced by temperature, where, in warmer years, newly hatched individuals are more active in autumn [31]. This situation occurred in the autumn of 2018, where the species was active at three study plots (both forest stands and the R1 recovering forest stand, Figure 4).
Carabus ulrichii overwinters as an adult [30] and therefore this species showed the earliest activity in both years (Figure 3 and Figure 4). Wintering individuals lay eggs from the second half of April to June. Newly hatched individuals appear during the second half of August, rarely from the end of July, and are active until hibernation [30]. The spring activity of this species is affected by the activity of the overwintering population and the summer activity is affected by the population of newly hatched individuals (Figure 3 and Figure 4). Carabus violaceus, like C. coriaceus, overwinter as larvae [30] and therefore their activity peaks later in the summer months (Figure 3 and Figure 4). C. violaceus lay eggs from the second half of July to early September. The third instar larvae usually overwinter, but part of the adult population also overwinters and reproduces again during the following year [30]. The peak activity of this species was recorded during July to September, and this was the activity of the reproducing population (Figure 3 and Figure 4).
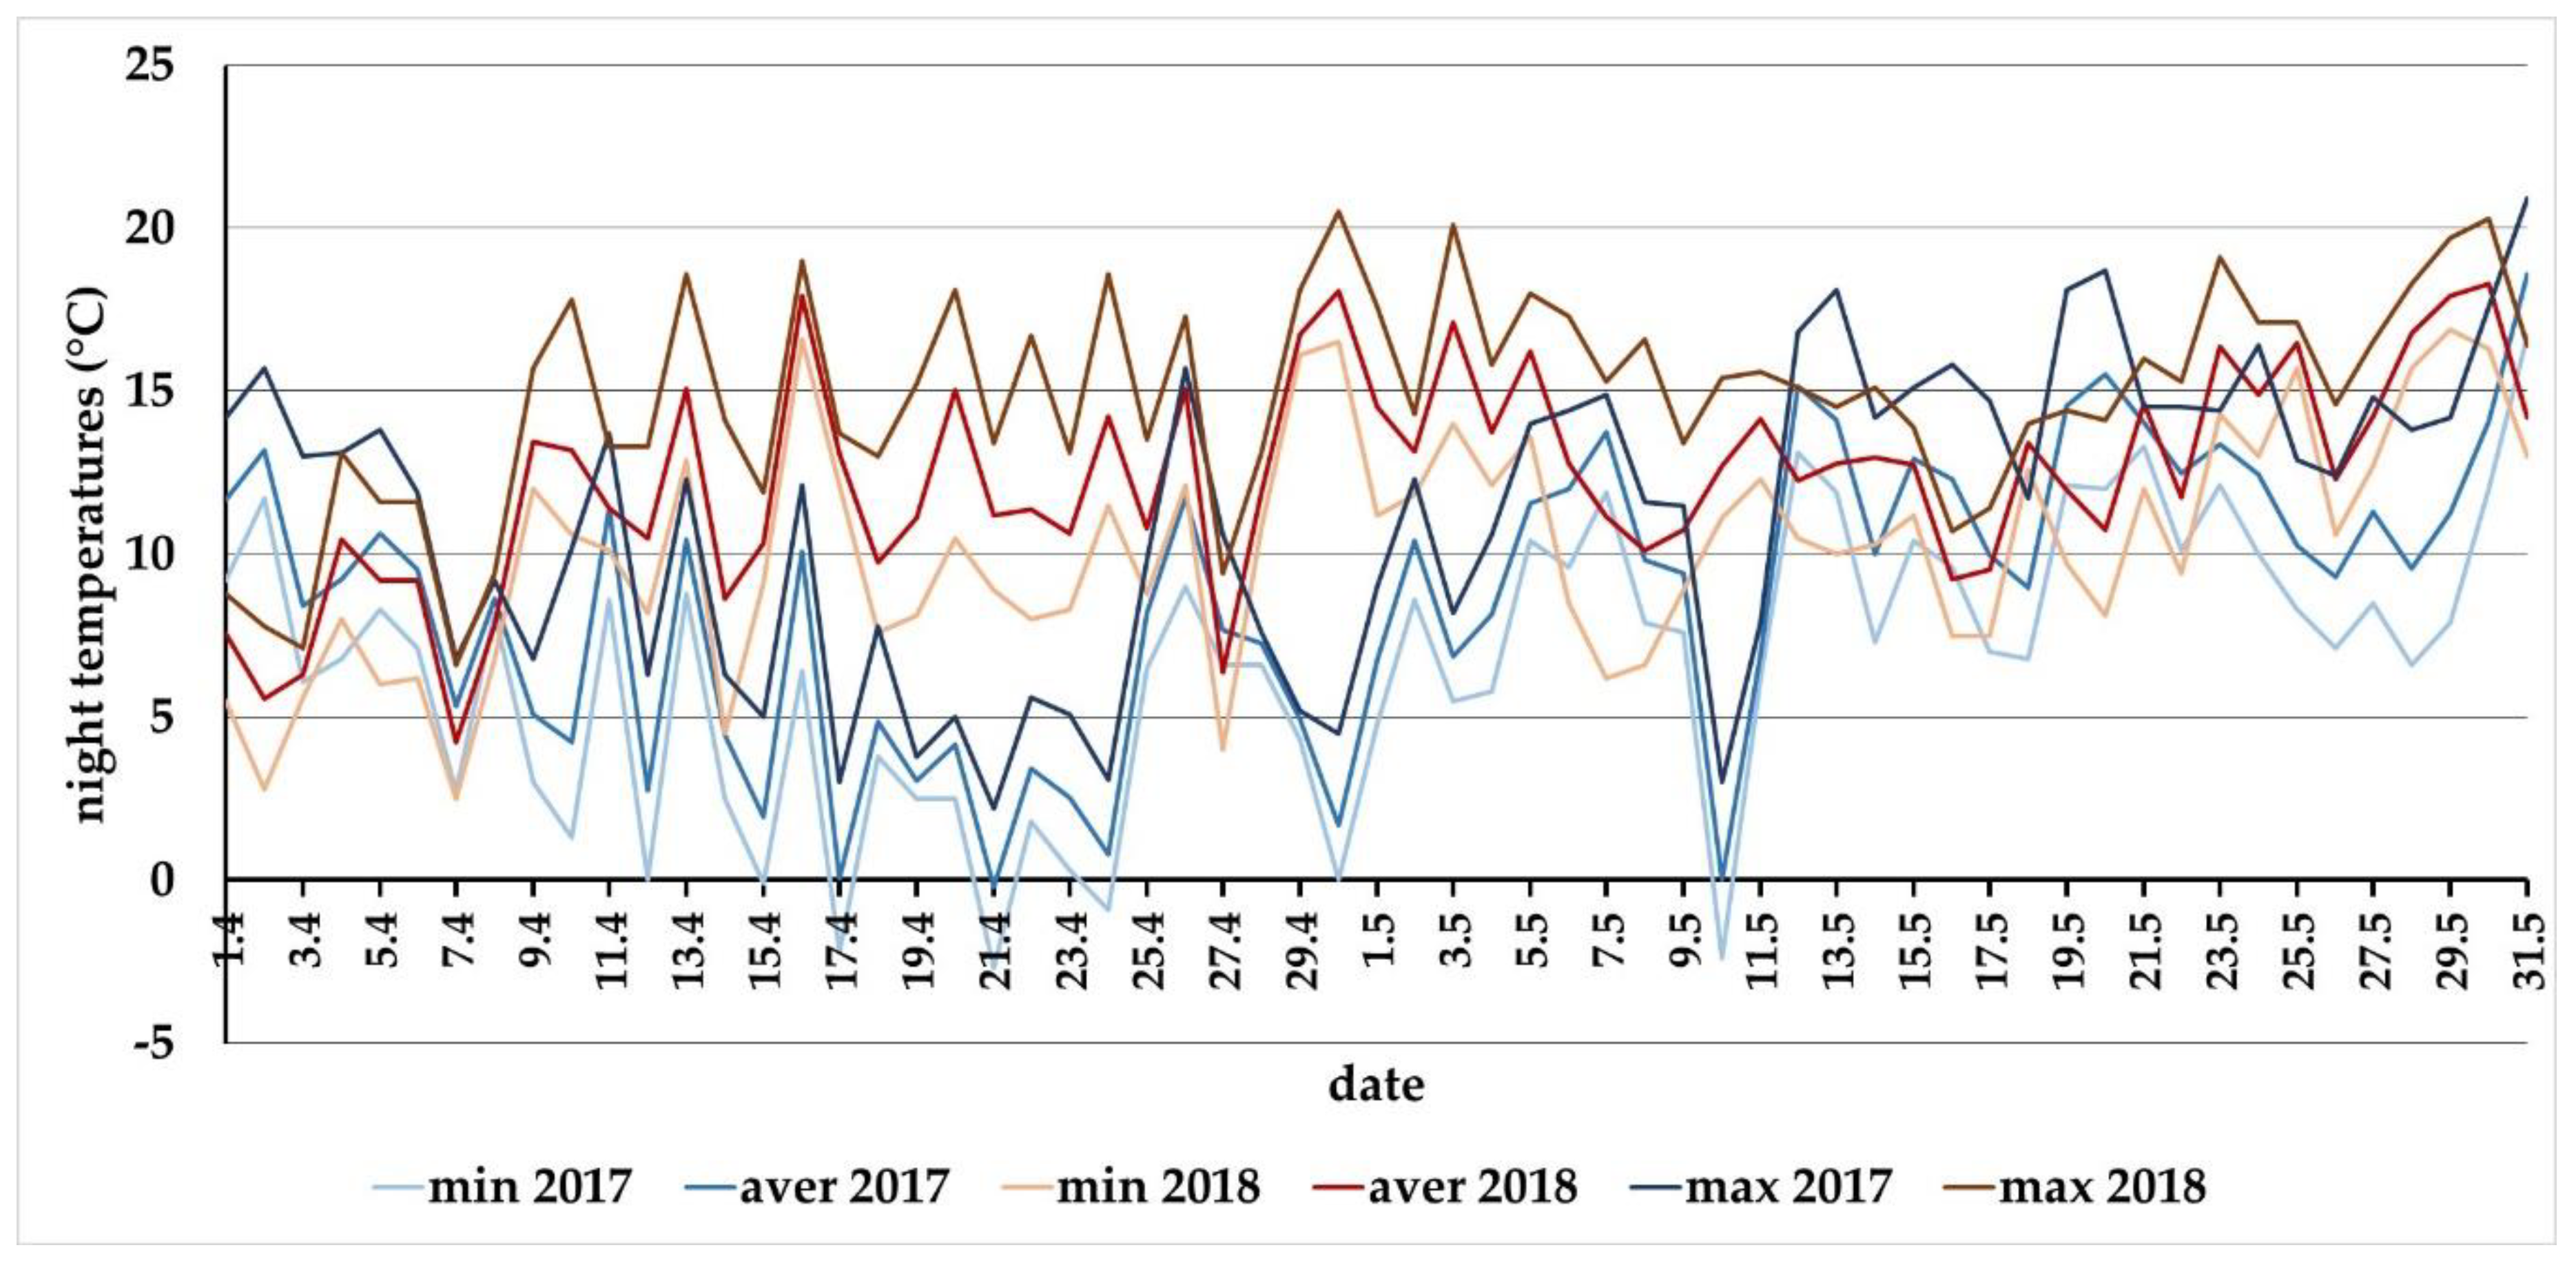
Carabid spring activity is also influenced by the wintering conditions. For most temperate invertebrates, the length of the day is a stimulus for the onset of hibernation, but the end of winter is already controlled by other environmental factors, often in the temperate zone of the frost [32,33]. After the diapause is terminated by a frost, the synchronization of spring development is passively achieved based on the cumulative effect of rising temperatures [34]. The warm February and extremely warm March in 2017 (Table 3) could have promoted the spring activity of carabids. In reality, beetle activity declined throughout April and the first ten days of May (Figure 2). The answer is instead found in the behavioral pattern of the studied carabid species, where the species feature nocturnal activity, with the exception of C. ulrichii. If we take a closer look at the night temperatures (Figure A2), after approximately the 10th of April until the end of April, the night temperatures were mostly below 5 °C, including a few nights with frost. Even during the first ten days of May, the night temperatures did not rise above 10 °C. Warm nights with a temperature above 10 °C occurred regularly since the middle of May in 2017. The only species active in April in 2017, was C. ulrichii, the species having both nocturnal and diurnal activity. Warmer days with a temperature above 15 °C occurred regularly from the middle of March and activated this species early in the season, especially at the L2 and R2 plots, where this species was the most abundant the previous year when compared with its occurrence at the two other stands (Figure 3).
Ref [35] analyzed drought occurrence in the period of 1966–2013 and identified drought trends for the Danubian lowland area. Both a significant difference and trend were observed in April, where they confirmed a significant increase (α = 0.05) in the number of dry periods, i.e., an arid trend. The authors evaluated the significant arid trend in April as the main warning signal. Drought occurrence analysis and future projection within the region where our research locality occurs, is vital because the region is important from an agricultural production point of view. The Danubian lowland is classified as a very dry and hot region, as projected by the climate change scenario in [21]. Cumulative water balance was used for the projection of drought occurrence alongside climate change. According to the RCP 4.5 scenario for time slice 2070–2100, the onset of drought could occur from the 10th of March in the warmest regions, and balanced cumulative water balance are projected to not occur until the end of the year [27].
Humidity significantly affects the activity of the ground beetles. Carabidae are not adapted to low humidity and Central European species are strictly hydrotactic [36]. The work in [37] studied the impact of drought on ground beetle assemblages in Norway spruce forests with different management after windstorm damage. Comparison of the changes in the numbers of individuals and species as a result of drought periods showed that changes in both the numbers of species and individuals mostly occur with an approximate delay of 1–2 years after an incidence of extreme drought or rainy years. However, only five species occurrences were evaluated during our research, similar effect was observed if we take into account the climatic characteristics of the two previous years. The year of 2015 was characterized as dry, where five months were evaluated as extremely dry and three of them (April, June, and July) fall within the main growing season. Moreover, May was evaluated as very dry as well. According to the cumulative water balance, the drought started during the turn of April to May and lasted until the end of the year. In contrast with 2015, the drought did not occur throughout whole year of 2016. Three months of 2016 were evaluated as extremely wet and two of them (July and September) fall within the main growing season. Moreover, none of the months in 2016 were evaluated as extremely warm, which contributed to the positive water balance in 2016. As in the findings of [37], we can suppose, that the two-year delay effect of the meteorological conditions on carabid populations was manifested in our study as well. The cause of such a delay stems from the relationship between the predator and the prey population dynamics. The main food sources for carabids are snails, slugs, earthworms, and other soil arthropods [29], where all are hygrophilous organisms. According to an analysis of carabid gut content, the prey group most frequently detected was earthworms, followed by slugs, especially in the case of large carabids such as Carabus species [38]. The activity of land gastropods is restricted to humid conditions in both time and space [39]. The effect of dry conditions on the terrestrial slug species A. biplicata was delayed reproduction, and a drought that lasted two weeks resulted in lower fertility [40]. A drought could also affect snail mortality where during a drought that lasted 1 month, immediately after arousal from hibernation when snails had to recover from winter fasting, mortality reached up to 70% for H. pomatia in Germany [41]. Regarding earthworms, [42] reported that the monthly abundance of earthworms is significantly related to the amount of rainfall. Earthworms are only active if free water is available in the soil [43]. Epigeic earthworm species living at the soil surface are strongly affected by dry and hot conditions during summer, as these species dwell in and feed on the litter layer and have a limited ability to move down into deeper soil [44]. The work in [45] also revealed strong relationship between carabid and slug population dynamics. The change in the beetle population from year to year was strongly related to both the slug population numbers in the soil and the crop mass of the beetles. This indicated that the slugs influenced the nutritional status of the beetles, and hence their reproductive success. The beetle crop mass was positively correlated with growth in the beetle population, suggesting that the greater the quantity of prey consumed one year, the greater the growth in the beetle population between years. [46] revealed that the egg production of the females of Anchomenus dorsalis (Carabidae) was positively affected by the amount of food, influencing the number of mature eggs in female ovaries, as well as total egg production. Starved females had no mature eggs in their ovaries.
However [47] studied the effect of temperature on the activity of selected Carabidae species. It was found that in addition to temperature, humidity also has a significant effect. The study highlighted the same temperature recorded for higher activity on a moist substrate, e.g., after rain. Both the soil moisture and humidity of the air layer near the ground are extremely important factors for limiting the distribution of the ground beetles, as well as the water balance [8]. However we did not measured the humidity conditions at the individual study plots, two plots, recovering forest stand R2 and forest stand L2, were more humid than the two other study plots. The terrain at the research site gradually decreases towards the Bábsky potok stream, and the forest stand L2 plot was situated at the foot of the slope and study plot R2 was situated within the near vicinity. The slope features a northeastern orientation, and thus study plot R2 was located in the shade of the neighboring forest vegetation for almost half of the day, causing dew to remain longer there; however, this observation is only based on subjective personal experience during field work This aspect is likely to be reflected by a higher abundance of carabids than with the two other study plots in 2017 (Figure 4).
5. Conclusions
The Carabus species populations observed in the oak-hornbeam forest considered here over two years showed large differences in terms of both the abundance and seasonal activity. The meteorological conditions during the year influenced the seasonal activity, and the temperature influenced the peak timings of Carabus species activity. Early spring activity was influenced by temperature, influencing the onset and the dynamics. Warmer spring conditions in 2018 caused a rapid onset of activity. Especially, the effect of warmer spring was observed with C. ulrichii, having both nocturnal and diurnal activity; however, very low night temperatures during April and the beginning of May in 2017 negatively influenced the spring activity of nocturnal species.
Drought negatively influenced the abundance of Carabus species population numbers, and this negative effect was reflected by lower populations with a two-year time delay. By analyzing the observations of other authors in terms of the effects of a drought on earthworm and mollusk populations, being the main food sources for Carabus species, we believe that the low population abundance in 2017 was influenced by the drought that lasted for eight months in 2015. In 2016, a drought was not recorded, and the populations of Carabus species in 2018 were more than three times more numerous than in 2017; however, a more detailed study, including, for example, carabid body mass evaluation, is needed to explain the mechanisms of the impact of drought on forest carabid populations at the studied locality.
The Carabus populations in the oak hornbeam forest, occupying forest enclaves in the intensively used agricultural landscape within Slovakia’s driest region, are experiencing several environmental and anthropogenic pressures. The results of this study could contribute to finding appropriate management schemes for such forest ecosystems.
Author Contributions
Conceptualization, B.Š.; methodology, B.Š. and M.E.; formal analysis, M.E.; investigation, M.E., B.Š. and J.K.; data curation, M.E., J.K.; writing—original draft preparation, M.E.; writing—review and editing B.Š. and J.K.; supervision, B.Š.; project administration, B.Š. and M.E.; funding acquisition, B.Š. All authors have read and agreed to the published version of the manuscript.
Funding
This research was funded by the Grant Agency of the Slovak Republic: VEGA 1/0767/17: Response of ecosystem services of grape growing country to climate change regional impact—change of function to adaptation potential.
Conflicts of Interest
The authors declare no conflict of interest. The funders had no role in the design of the study; in the collection, analyses, or interpretation of data; in the writing of the manuscript, or in the decision to publish the results.
Appendix A
Figure A1.
The forest research area in Báb with the localizations of the research plots. (R1, R2, L1, L2). The picture is a screenshot of an aerial map from the mapy.cz web application. The tool for adding the marks on the map was that used [48].
Figure A1.
The forest research area in Báb with the localizations of the research plots. (R1, R2, L1, L2). The picture is a screenshot of an aerial map from the mapy.cz web application. The tool for adding the marks on the map was that used [48].

Figure A2.
The night temperatures (20:00–05:00) through April and May in 2017 and 2018 at the locality of Báb (southwestern Slovakia).
Figure A2.
The night temperatures (20:00–05:00) through April and May in 2017 and 2018 at the locality of Báb (southwestern Slovakia).

References
- Pearce, J.L.; Venier, L.A. The use of ground beetles (Coleoptera: Carabidae) and spiders (Araneae) as bioindicators of sustainable forest management: A review. Ecol. Indic. 2006, 6, 780–793. [Google Scholar] [CrossRef]
- Kotze, D.J.; Brandmayr, P.; Casale, A.; Dauffy-Richard, E.; Dekoninck, W.; Koivula, M.J.; Lövei, G.L.; Mossakowski, D.; Noordijk, J.; Paarmann, W.; et al. Forty years of carabid beetle research in Europe—From taxonomy, biology, ecology and population studies to bioindication, habitat assessment and conservation. ZooKeys 2011, 100, 55–148. [Google Scholar] [CrossRef]
- Niemelä, J.; Langor, D.; Spence, J.R. Effects of clear-cut harvesting on boreal ground-beetle assemblages (Coleoptera: Carabidae) in Western Canada. Conserv. Biol. 1993, 7, 551–561. [Google Scholar]
- Skłodowski, J. Anthropogenic transformation of ground beetle assemblages (Coleoptera: Carabidae) in Białowieża Forest, Poland: From primeval forests to managed woodlands of various ages. Entomol. Fenn. 2006, 11, 296–314. [Google Scholar] [CrossRef] [Green Version]
- Šustek, Z.; Vido, J. Vegetation state and extreme drought as factors determining differentiation and succession of Carabidae communities in forests damaged by a windstorm in the High Tatra Mts. Biologia 2013, 68, 1198–1210. [Google Scholar] [CrossRef]
- Walther, G.; Post, E.; Convey, P.; Menzel, A.; Parmesan, C.; Beebee, T.J.C.; Fromentin, J.; Hoegh-Guldberg, O.; Bairlein, F. Ecological responses to recent climate change. Nature 2002, 416, 389–395. [Google Scholar] [CrossRef]
- Thackeray, S.J.; Sparks, T.H.; Frederiksen, M.; Burthe, S.; Bacon, P.J.; Bell, J.R.; Botham, M.S.; Brereton, T.M.; Bright, P.W.; Carvalho, L.; et al. Trophic level asynchrony in rates of phenological change for marine, freshwater and terrestrial environments. Glob. Chang. Biol. 2010, 16, 3304–3313. [Google Scholar] [CrossRef] [Green Version]
- Thiele, H.U. Carabid Beetles in Their Environments. In A Study on Habitat Selection by Adaptations in Physiology and Behaviour; Springer: Berlin/Heidelberg, Germany; New York, NY, USA, 1977; p. 369. ISBN 978-3-642-81154-8. [Google Scholar]
- Lovei, G.L.; Sunderland, K.D. Ecology and behavior of ground beetles (Coleoptera: Carabidae). Annu. Rev. Entomol. 1996, 41, 231–256. [Google Scholar]
- Loreau, M. Competition in a carabid beetle community: A field experiment. Oikos 1990, 58, 25–38. [Google Scholar]
- IPCC. Climate Change 2001: Impacts, Adaptation and Vulnerability—Contribution of Working Group II to the Third Assessment Report of the Intergovernmental Panel on Climate Change; Cambridge University Press: Cambridge, UK, 2001. [Google Scholar]
- Lehner, B.; Döll, P.; Alcamo, J.; Henrichs, T.; Kaspar, F. Estimating the impact of globalchange on flood and drought risk in Europe: A continental, integrated analysis. Clim. Chang. 2006, 75, 273–299. [Google Scholar] [CrossRef]
- Duan, W.; Hanasaki, N.; Shiogama, H.; Chen, Y.; Zou, S.; Nover, D.; Zhou, B.; Wang, Y. Evaluation and Future Projection of Chinese Precipitation Extremes Using Large Ensemble High-Resolution Climate Simulations. J. Clim. 2017, 32, 2169–2183. [Google Scholar] [CrossRef]
- Haile, G.G.; Tang, Q.; Hosseini-Moghari, S.M.; Liu, X.; Gebremicael, T.G.; Leng, G.; Kassa, A.K.; Xu, X.; Yun, X. Projected impacts of climate change on drought patterns over East Africa. Earth’s Future 2020, 8, e2020EF001502. [Google Scholar] [CrossRef]
- Škvarenina, J.; Tomlain, J.; Hrvoľ, J.; Škvareninová, J. Occurrence of dry and wet periods in altitudinal vegetation stages of West Carpathians in Slovakia: Time-series analysis 1951–2005. In Bioclimatology and Natural Hazards; Střelcová, K., Ed.; Springer: Dordrecht, The Netherlands, 2019; pp. 97–106. [Google Scholar]
- Zlatník, A. Přehled Skupin Typů Geobiocenů Původne Lesních a Křovinných v ČSSR (Overview of the Groups of the Geobiocen Types Originally Forests and Shrubs in ČSSR); Zprávy geografického ústavu ČSAV (Reports of the Institute of geography of the Czechoslovak academy of science), 13; The Institute of Geography of the Czechoslovak Academy of Science: Brno, Czech Republic, 1976; pp. 55–64. (In Czech) [Google Scholar]
- Škvarenina, J.; Tomlain, J.; Hrvoľ, J.; Škvareninová, J.; Nejedlík, P. Progress in dryness and wetness parameters in altitudinal vegetation stages of West Carpathians: Time-series analysis 1951–2007. Idojárás 2009, 113, 47–54. [Google Scholar]
- Atlas Krajiny Slovenskej Republiky (Atlas of the Slovak Republic Landscape). Available online: https://app.sazp.sk/atlassr/ (accessed on 20 October 2020).
- Kurpelová, M.; Coufal, L.; Čulík, J. Agroklimatické podmienky ČSSR (Agroclimatic conditions CSSR); Príroda: Bratislava, Slovakia, 1975; p. 270. [Google Scholar]
- Šiška, B.; Špánik, F. Agroclimatic regionalization of slovak territory in condition of changing climate. Meteorol. Časopis 2008, 11, 61–64. [Google Scholar]
- Šiška, B.; Takáč, J. Drought analyse of agricultural regions as influenced by climatic conditions in the Slovak Republic. Időjárás 2009, 113, 135–143. [Google Scholar]
- Eliáš, P. Species pool of alien plants in the vicinity of Bab’s Forest Research Site, south-west Slovakia. Rosalia 2010, 21, 57–74. [Google Scholar]
- Biskupský, V. (Ed.) Research Project Báb IBP Progress Report II. IBP Report No. 5; Publishing House of the Slovak Academy of Sciences: Bratislava, Slovakia, 1975; p. 526. [Google Scholar]
- Eliáš, P.; Oszlányi, J.; Matušicová, N.; Gerhátová, K.; Halada, L. Oak-Hornbeam Forest in Báb (South-Western Slovakia)—The Former Research Site of International Biological Programme in Slovakia. Životné prostredie 2016, 50, 10–17. [Google Scholar]
- Bab—Slovakia. Available online: https://deims.org/79e10639-dd60-4f30-9c43-7b2bae0f359a (accessed on 5 November 2020).
- Hůrka, K. Střevlíkovití České a Slovenské Republiky, Carabid Beetles of the Czech and Slovak Republic, 1st ed.; Kabourek: Zlín, Czech Republic, 1996; p. 565. ISBN 80-901466-2-7. (In Czech and English). [Google Scholar]
- Šiška, B.; Žilinský, M.; Zuzulová, V. Drought and growing season on Slovakia in climate change conditions. In Hospodaření s Vodou v Krajině, Proceedings of the Conference Hospodaření s Vodou v Krajině, Třeboň, Czech Republic, 13–14 June 2019; Rožnovský, J., Litschmann, T., Eds.; ČHMU: Praha, Czech Republic, 2019; ISBN 978-80-87577-88-2. [Google Scholar]
- Cunev, J.; Šiška, B. Chrobáky (Coleoptera) NPR Bábsky les pri Nitre v podmienkach meniacej sa klímy (Beetles (Coleoptera) NNR Bábsky les near Nitra in the conditions of the changing climate). Rosalia 2006, 18, 155–168, (In Slovak, abstract in English). [Google Scholar]
- Turin, H.; Penev, L.; Casale, A. (Eds.) The Genus Carabus in Europe. A Synthesis; Pensoft Publishers, Sofia-Moscow & European Invertebrate Survey: Leiden, The Netherlands, 2003; p. 512. [Google Scholar]
- Kádár, F.; Fazekas, J.P.; Sárospataki, M.; LÖvei, G. Seasonal dynamics, age structure and reproduction of four Carabus species (Coleoptera: Carabidae) living in forested landscapes in Hungary. Acta Zool. Acad. Sci. Hung. 2015, 61, 57–72. [Google Scholar] [CrossRef]
- Elek, Z.; Howe, A.G.; Enggaard, M.K.; Lovei, G.L. Seasonal dynamics of common ground beetles (Coleoptera: Carabidae) along urbanization gradient near Soro, Zealand, Danmark. Entomol. Fenn. 2017, 28, 27–40. [Google Scholar] [CrossRef] [Green Version]
- Tauber, M.J.; Tauber, C.A.; Masaki, S. Seasonal Adaptations of Insects; Oxford University Press: New York, NY, USA, 1986; ISBN 9780195036350. [Google Scholar]
- Leather, S.R.; Walters, K.F.A.; Bale, J.S. The Ecology of Insect Overwintering; Cambridge University Press: Cambridge, UK, 1993; p. 268. [Google Scholar]
- Danks, H.V. Insect Dormancy: An Ecological Perspective; Biological Survey of Canada (Terrestrial Arthropods): Ottawa, QC, Canada, 1987; p. 439. [Google Scholar]
- Vido, J.; Nalevanková, P.; Valach, J.; Šustek, Z.; Tadesse, T. Drought analyses of the Horné Požitavie region (Slovakia) in the period 1966–2013. Adv. Meteorol. 2019. [Google Scholar] [CrossRef]
- Weber, F. Vergleichende Untersuchungen über das Verhalten von Carabus-Arten in Luftfeuchtigkeitsgefallen. Z. Morph. Okol. 1965, 54, 551–565. [Google Scholar]
- Šustek, Z.; Vido, J.; Škvareninová, J.; Škvarenina, J.; Šurda, P. Drought impact on ground beetle assemblages (Coleoptera, Carabidae) in Norway spruce forests with different management after windstorm damage—A case study from Tatra Mts. (Slovakia). J. Hydrol. Hydromech. 2017, 65, 333–342. [Google Scholar] [CrossRef] [Green Version]
- Šerić Jelaska, L.; Franjević, D.; Jelaska, S.D.; Symondson, W.O.C. Prey detection in carabid beetles (Coleoptera: Carabidae) in woodland ecosystems by PCR analysis of gut contents. Eur. J. Entomol. 2014, 111. [Google Scholar] [CrossRef] [Green Version]
- Cook, A. Behavioural ecology: On doing the right thing, in the right place, at the right time. In The Biology of Terrestrial Molluscs, 1st ed.; Barker, G.M., Ed.; CABI Publishing: Wallingford, CT, USA, 2001; pp. 447–487. [Google Scholar]
- Sulikowska-Drozd, A.; Maltz, T.K. Experimental drought affects the reproduction of the brooding clausiliid Alinda biplicata (Montagu, 1803). J. Molluscan Stud. 2014, 80, 265–271. [Google Scholar] [CrossRef]
- Nicolai, A.; Filser, J.; Lenz, R.; Bertrand, C.; Charrier, M. Adjustment of metabolite composition in the haemolymph to seasonal variations in the land snail Helix pomatia. J. Comp. Physiol. B 2011, 181, 457–466. [Google Scholar]
- Tondoh, J.E. Seasonal changes in earthworm diversity and community structure in Central Côte d’Ivoire. Eur. J. Soil Biol. 2006, 42, S334–S340. [Google Scholar] [CrossRef]
- Lee, K.E. Earthworm Their Ecology and Relationship with Soils and Land Use; Academic Press: Sydney, Australia, 1985; p. 411. [Google Scholar]
- Eggleton, P.; Inward, K.; Smith, J.; Jones, D.T.; Sherlock, M. A six year study of earthworm (Lumbricidae) populations in pasture woodland in southern England shows their responses to soil temperature and soil moisture. Soil Biol. Biochem. 2009, 41, 1857–1865. [Google Scholar]
- Symondson, W.O.C.; Glen, D.; Ives, A.R.; Langdon, C.J. Dynamics of the relationship between a generalist predator and slugs over five years. Ecology 2002, 83, 137–147. [Google Scholar]
- Knapp, M.; Uhnavá, K. Body Size and Nutrition Intake Effects on Fecundity and Overwintering Success in Anchomenus dorsalis (Coleoptera: Carabidae). J. Insect Sci. 2014, 14, 1–6. [Google Scholar] [CrossRef] [Green Version]
- Honěk, A. The effect of temperature on the activity of Carabidae (Coleoptera) in a fallow field. Eur. J. Entomol. 1997, 94, 97–104. [Google Scholar]
- Mapy.cz. Available online: https://sk.mapy.cz/zakladni?x=17.8924454&y=48.3030312&z=18&l=0&base=ophoto (accessed on 4 November 2020).
Figure 1.
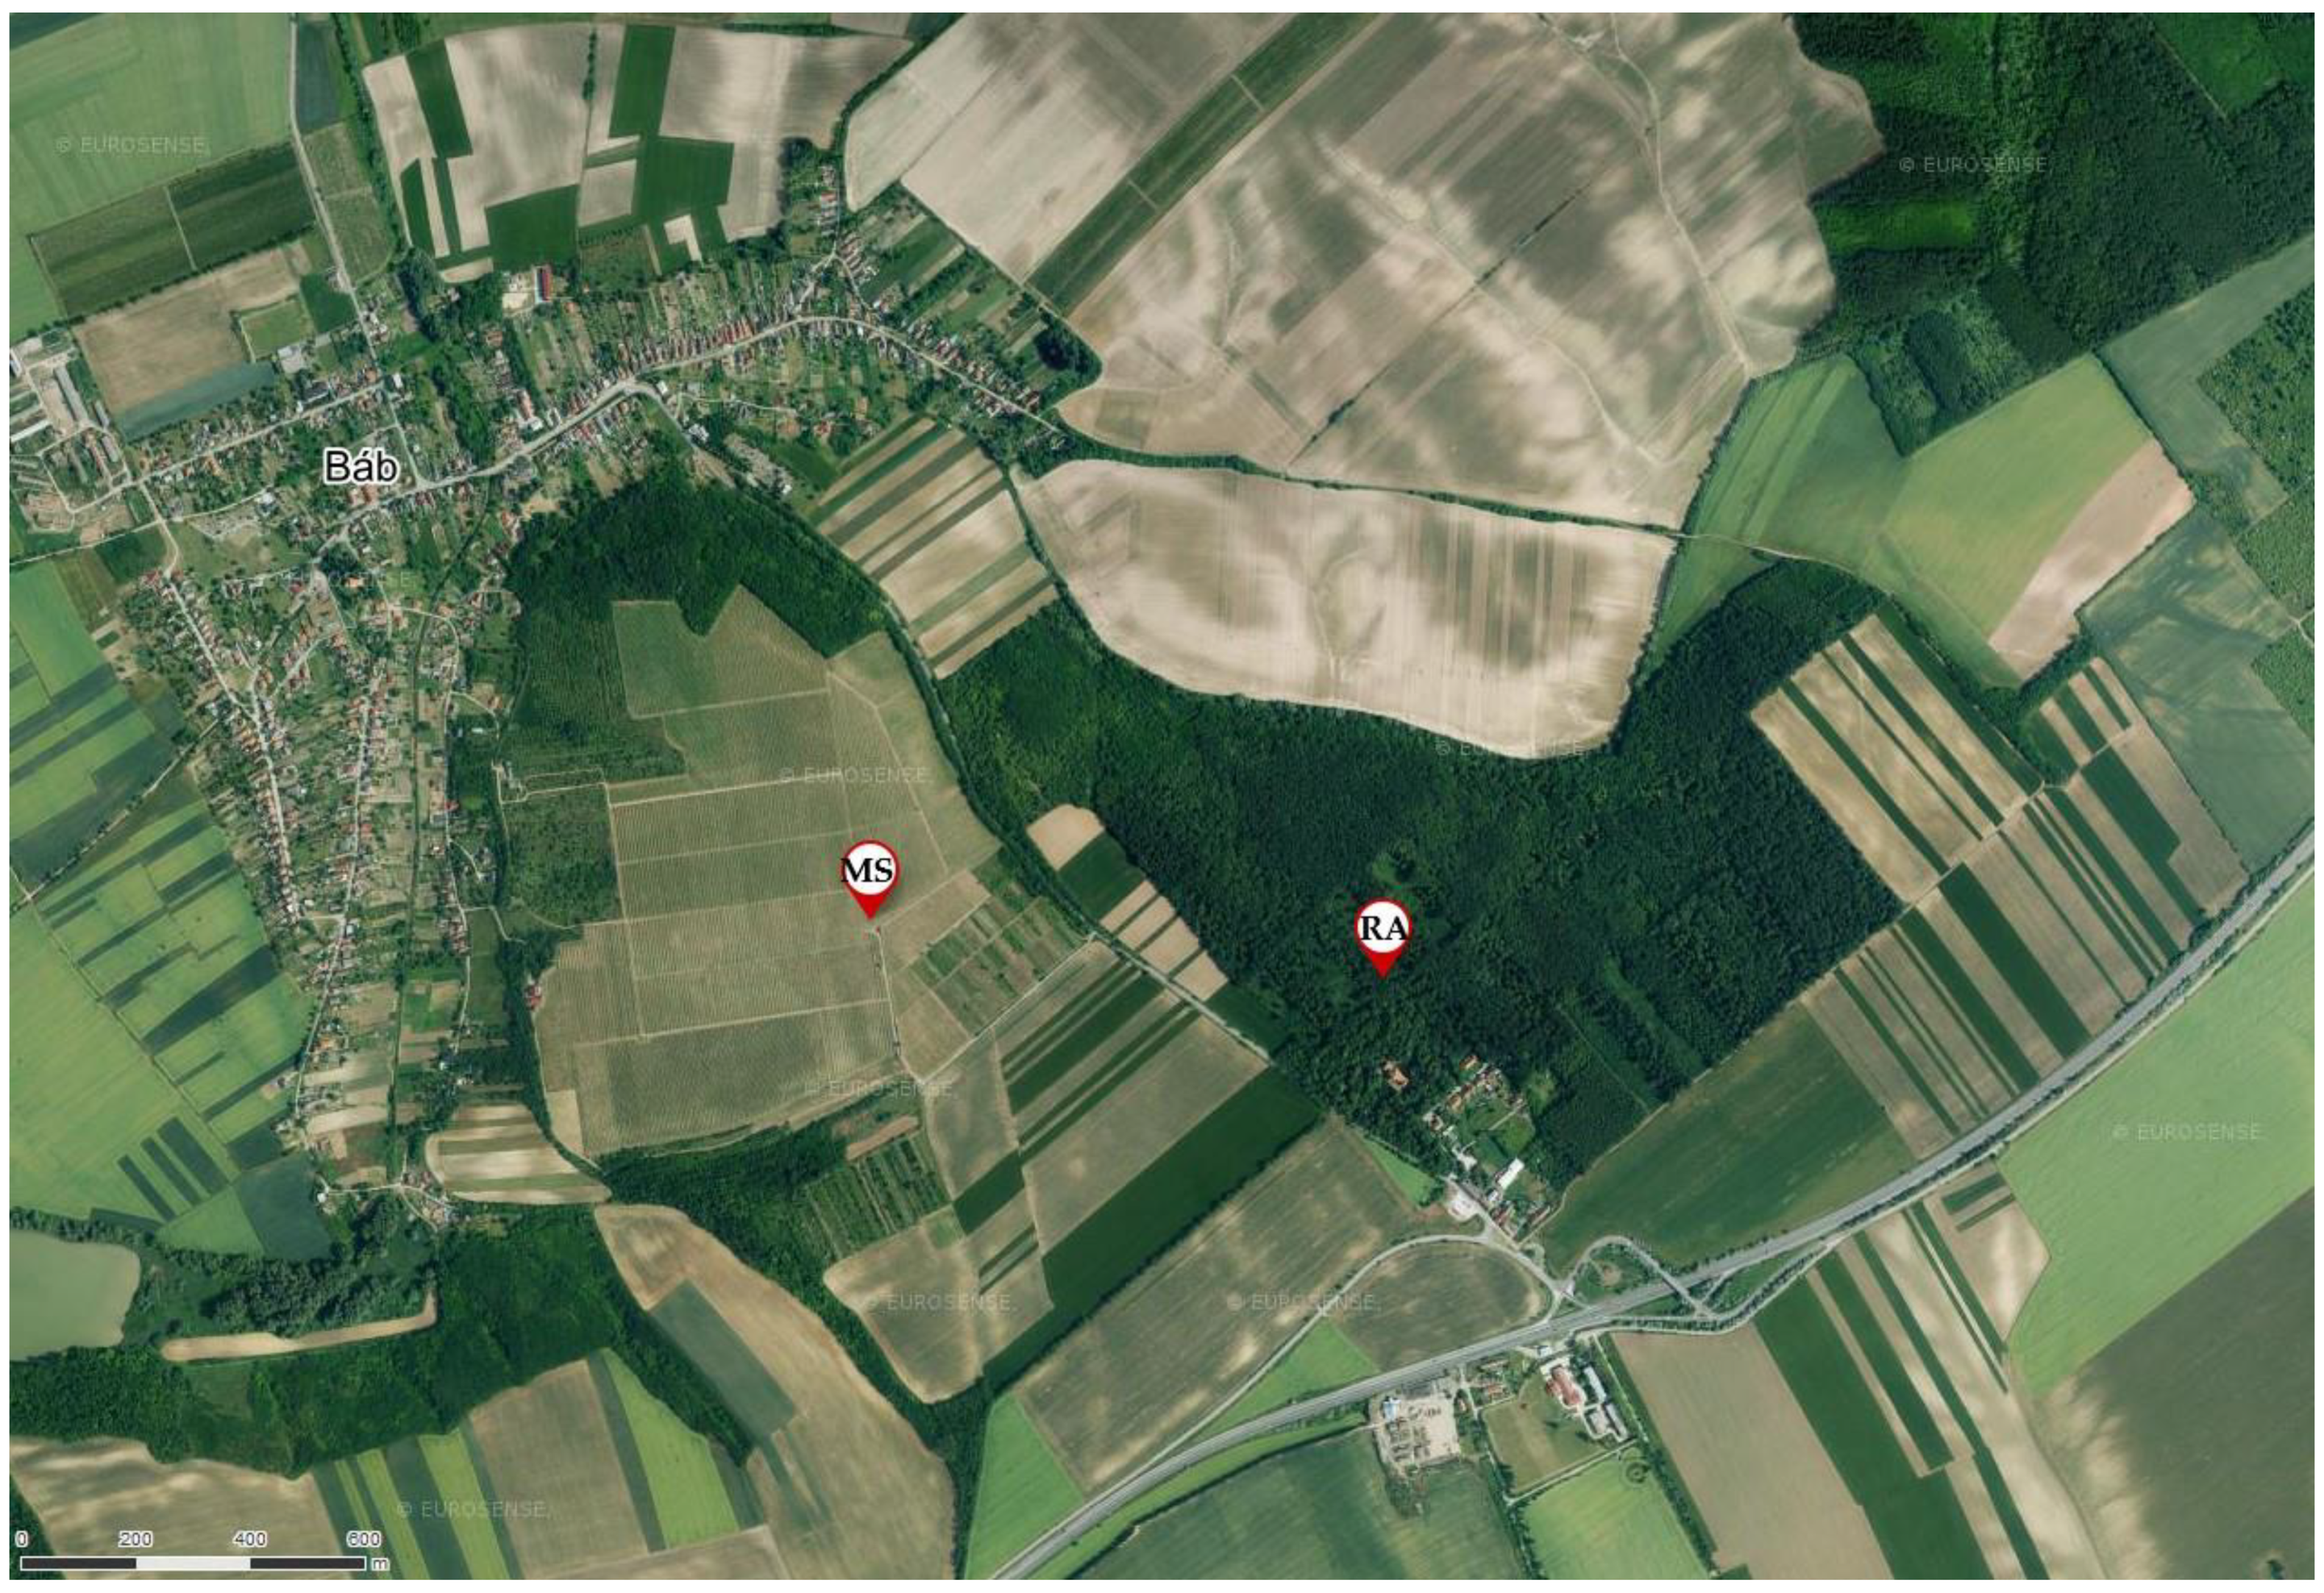
The localization of the Báb research area (RA) and meteorological station (MS) where the meteorological data were derived. The coordinates for the RA are 17.886, 48.3033, with an average elevation of 190 m a.s.l. (minimum of 170 m a.s.l, maximum of 210 m a.s.l.). The coordinates for the MS are 17.87881, 48.30331, with an elevation of 207 m a.s.l. The data were obtained from the DEIMS-SDR (Dynamic Ecological Information Management System-Site and dataset registry) database [25].
Figure 1.
The localization of the Báb research area (RA) and meteorological station (MS) where the meteorological data were derived. The coordinates for the RA are 17.886, 48.3033, with an average elevation of 190 m a.s.l. (minimum of 170 m a.s.l, maximum of 210 m a.s.l.). The coordinates for the MS are 17.87881, 48.30331, with an elevation of 207 m a.s.l. The data were obtained from the DEIMS-SDR (Dynamic Ecological Information Management System-Site and dataset registry) database [25].

Figure 2.
The seasonal activity of Carabus species in the oak hornbeam forest at the locality of Báb (southwestern Slovakia) during 2017 and 2018.
Figure 2.
The seasonal activity of Carabus species in the oak hornbeam forest at the locality of Báb (southwestern Slovakia) during 2017 and 2018.

Figure 3.
The monthly activity of five carabid species at Báb forest stands with four different study plots in 2017. Two forest stands: L1—close-to-nature forest plot; L2—managed forest plot. Two stands after logging operations 10 years ago: R1—recovering indigenous tree species plot; R2—alien Ailanthus altissima dominance.

Figure 4.
The monthly activity of five carabid species at Báb forest stands with four different study plots in 2018. Two forest stands: L1—close-to-nature forest plot; L2—managed forest plot. Two stands after logging operations 10 years ago: R1—recovering indigenous tree species plot; R2—alien Ailanthus altissima dominance.

Figure 5.
The cumulative water balance for the locality of Báb (southwestern Slovakia) in 2015, 2016, 2017 and 2018.
Figure 5.
The cumulative water balance for the locality of Báb (southwestern Slovakia) in 2015, 2016, 2017 and 2018.


Table 1.
The index of dominance calculated for Carabus species at four different forest stands (L1 and L2 are forest plots and R1 and R2 are recovering forest plots) at the locality of Báb (southwestern Slovakia) in 2017.
Table 1.
The index of dominance calculated for Carabus species at four different forest stands (L1 and L2 are forest plots and R1 and R2 are recovering forest plots) at the locality of Báb (southwestern Slovakia) in 2017.
| Index of Dominance (%) | |||||
|---|---|---|---|---|---|
| Species | Total | L1 | L2 | R1 | R2 |
| C. coriaceus | 20.8 | 24.2 | 15.1 | 30.8 | 13.9 |
| C. scheidleri | 23.3 | 24.2 | 26.0 | 25.4 | 16.7 |
| C. ulrichii | 27.4 | 17.7 | 32.3 | 16.2 | 39.6 |
| C. nemoralis | 6.3 | 11.3 | 8.9 | 3.2 | 4.9 |
| C. violaceus | 22.1 | 22.6 | 17.7 | 24.3 | 25.0 |
Table 2.
The index of dominance calculated for Carabus species at four different forest stands (L1 and L2 are forest plots and R1 and R2 are recovering forest plots) at the locality of Báb (southwestern Slovakia) in 2018.
Table 2.
The index of dominance calculated for Carabus species at four different forest stands (L1 and L2 are forest plots and R1 and R2 are recovering forest plots) at the locality of Báb (southwestern Slovakia) in 2018.
| Index of Dominance (%) | |||||
|---|---|---|---|---|---|
| Species | Total | L1 | L2 | R1 | R2 |
| C. coriaceus | 22.1 | 14.4 | 11.8 | 30.3 | 21.9 |
| C. scheidleri | 23.4 | 34.6 | 15.9 | 26.2 | 29.6 |
| C. ulrichii | 41.5 | 25.8 | 53.2 | 34.5 | 37.4 |
| C. nemoralis | 7.5 | 23.5 | 15.1 | 4.4 | 2.0 |
| C. violaceus | 5.5 | 1.7 | 4.1 | 4.7 | 9.1 |
Table 3.
The comparison of monthly precipitation totals and the average monthly temperature in 2017 with the climatological normal (period 1961–1990) for the locality of Báb (southwestern Slovakia).
Table 3.
The comparison of monthly precipitation totals and the average monthly temperature in 2017 with the climatological normal (period 1961–1990) for the locality of Báb (southwestern Slovakia).
| Month | Average Monthly Temperature (T, °C) | Thermal Characteristic | Monthly Precipitation (P, mm) | Precipitation Characteristics | ||||
|---|---|---|---|---|---|---|---|---|
| 2017 | 1961–1990 | ΔT (°C) | 2017 | 1961–1990 | ΔP (%) | |||
| I. | −7.1 | −1.7 | −5.4 | Extremely cold | 0 | 31 | 0 | Extremely dry |
| II. | 1.9 | 0.5 | 1.4 | Warm | 13.2 | 32 | 41 | Very dry |
| III. | 8.4 | 4.7 | 3.7 | Extremely warm | 13.8 | 33 | 42 | Very dry |
| IV. | 9.5 | 10.1 | −0.6 | Normal | 36.2 | 43 | 84 | Normal |
| V. | 16.2 | 14.8 | 1.4 | Warm | 13.8 | 55 | 25 | Extremely dry |
| VI. | 20.8 | 18.3 | 2.5 | Very warm | 24.6 | 70 | 35 | Very dry |
| VII. | 21.3 | 19.7 | 1.6 | Warm | 63.6 | 64 | 99 | Normal |
| VIII. | 22.1 | 19.2 | 2.9 | Very warm | 22.6 | 58 | 39 | Very dry |
| IX. | 14.3 | 15.4 | −1.1 | Cold | 83.4 | 37 | 225 | Extremely wet |
| X. | 10.5 | 10.1 | 0.4 | Normal | 48.4 | 41 | 118 | Normal |
| XI. | 4.4 | 4.9 | −0.5 | Normal | 25.8 | 54 | 48 | Very dry |
| XII. | 0.8 | 0.5 | 0.3 | Normal | 40.0 | 43 | 93 | Normal |
Table 4.
The comparison of monthly precipitation totals and the average monthly temperature in 2018 with the climatological normal (period 1961–1990) for the locality of Báb (southwestern Slovakia).
Table 4.
The comparison of monthly precipitation totals and the average monthly temperature in 2018 with the climatological normal (period 1961–1990) for the locality of Báb (southwestern Slovakia).
| Month | Average Monthly Temperature (T, °C) | Thermal Characteristic | Monthly Precipitation (P, mm) | Precipitation Characteristics | ||||
|---|---|---|---|---|---|---|---|---|
| 2018 | 1961–1990 | ΔT (°C) | 2018 | 1961–1990 | ΔP (%) | |||
| I. | 1.6 | −1.7 | 3.3 | Very warm | 19 | 31 | 61 | Dry |
| II. | −1.5 | 0.5 | −2.0 | Cold | 33 | 32 | 103 | Normal |
| III. | 2.9 | 4.7 | −1.8 | Cold | 33 | 33 | 100 | Normal |
| IV. | 15.2 | 10.1 | 5.1 | Extremely warm | 5 | 43 | 13 | Extremely dry |
| V. | 18.6 | 14.8 | 3.8 | Extremely warm | 15 | 55 | 27 | Very dry |
| VI. | 20.0 | 18.3 | 1.7 | Warm | 136 | 70 | 195 | Very wet |
| VII. | 21.6 | 19.7 | 1.9 | Warm | 34 | 64 | 53 | Dry |
| VIII. | 22.8 | 19.2 | 3.6 | Extremely warm | 78 | 58 | 134 | Wet |
| IX. | 17.0 | 15.4 | 1.6 | Warm | 99 | 37 | 267 | Extremely wet |
| X. | 12.9 | 10.1 | 2.8 | Very warm | 10 | 41 | 25 | Very dry |
| XI. | 6.5 | 4.9 | 1.6 | Warm | 24 | 54 | 44 | Very dry |
| XII. | 0.4 | 0.5 | −0.1 | Normal | 54 | 43 | 125 | Wet |
Publisher’s Note: MDPI stays neutral with regard to jurisdictional claims in published maps and institutional affiliations. |
© 2020 by the authors. Licensee MDPI, Basel, Switzerland. This article is an open access article distributed under the terms and conditions of the Creative Commons Attribution (CC BY) license (http://creativecommons.org/licenses/by/4.0/).
Share and Cite
MDPI and ACS Style
Šiška, B.; Eliašová, M.; Kollár, J. Carabus Population Response to Drought in Lowland Oak Hornbeam Forest. Water 2020, 12, 3284. https://doi.org/10.3390/w12113284
AMA Style
Šiška B, Eliašová M, Kollár J. Carabus Population Response to Drought in Lowland Oak Hornbeam Forest. Water. 2020; 12(11):3284. https://doi.org/10.3390/w12113284
Chicago/Turabian StyleŠiška, Bernard, Mariana Eliašová, and Ján Kollár. 2020. "Carabus Population Response to Drought in Lowland Oak Hornbeam Forest" Water 12, no. 11: 3284. https://doi.org/10.3390/w12113284
Note that from the first issue of 2016, this journal uses article numbers instead of page numbers. See further details here.