Article

Net Primary Production Predicted by the Proportion of C:N:P Stoichiometric Ratio in the Leaf-Stem and Root of Cynodon Dactylon (Linn.) in the Riparian Zone of the Three Gorges Reservoir

1
Department of Agricultural and Forestry Science and Technology, Chongqing Three Gorges Vocation College, Chongqing 404000, China
2
Key Laboratory of Water Environment Evolution and Pollution Control in Three Gorges Reservoir, Chongqing Three Gorges University, Wanzhou 404100, China
3
School of Hydrology and Water Resources, Nanjing University of Information Science and Technology, Nanjing 210044, China
*
Authors to whom correspondence should be addressed.
Water 2020, 12(11), 3279; https://doi.org/10.3390/w12113279
Submission received: 11 October 2020 / Revised: 18 November 2020 / Accepted: 19 November 2020 / Published: 22 November 2020

Abstract

:
Net primary production (NPP) is closely related to the proportion of carbon (C), nitrogen (N) and phosphorus (P) in the leaf-stem and root of perennial herbs. However, the relationship of NPP with the C:N:P stoichiometric ratio in above- and below-ground plant tissues remains unknown under the periodic flooding stresses in the riparian zone ecosystem. In this study, the leaf-stem and root C, N, P content and biomass of Cynodon dactylon (Linn.) Pers. (C. dactylon) were investigated at the riparian zone altitudes of 145–155, 155–165, and 165–175 m above sea level (masl) of in a Three Gorges Reservoir (TGR) tributary–Pengxi River. The results showed that the NPP and biomass of C. dactylon had a similar decreasing trend with a riparian zone altitudes decrease. The root of C. dactylon showed relatively lower N and P content, but much higher N and P use efficiency with higher C:N and C:P ratio than that of a leaf-stem under N limitation conditions. NPP was positively correlated to C:N in the stem-leaf to root ratio (C:Nstem-leaf/root) and C:P ratio in the root (C:Proot ratio). Hydrological and C:N:P stoichiometric variables could predict 68% of the NPP variance, and thus could be regarded as the main predictor of NPP in the riparian zone of the TGR.

1. Introduction

The Three Gorges Reservoir (TGR) operates an anti-seasonal water regulation regime for flood control, agricultural irrigation and electricity generation. The water level rises to the highest altitude of 175 masl in winter and declines to the lowest altitude of 145 masl during summer, producing an extensive riparian zone of approximately 349 km2 [1]. Thus, it is believed to be the most fragile ecological zone along the Yangtze River [2]. Periodic flooding also causes various adverse consequences for the riparian habitat, such as a lower plant richness and diversity, due to scarce revegetation of non-annual plants through seed banks [3,4]. Thus, the dominant riparian perennial herbs have to rapidly recover from its unique root system during the limited growing season [5].
Net primary production (NPP) is closely related to plant nutrition allocation strategy in the above- and below-ground biomass under environmental stress [6]. A plant can relocate C, N and P between leaf-stem and root to regulate physiological rhythms and finish its life cycle during a limited growing duration [7]. The growth rate hypothesis proposes that NPP increases with higher P, lower C:P and N:P ratios [8]. Recent observation showed that riparian plants take a quiescent strategy to adjust leaf C:N:P stoichiometric ratio during growing seasons responding to flood intensity [9]. The highest biomass of C. malaccensis was associated with high root N:P ratios in subtropical estuarine wetlands [10]. Moreover, plant growth is accompanied by high C:N:P stoichiometry variation in plant tissues at different physiological periods responding to distinct environmental conditions [11]. Thus, plants may take a corresponding survival strategy by mediating C, N and P stoichiometry to cope with variable environmental stresses.
Cynodon dactylon (L.) Pers (C. dactylon) is a widespread perennial herb found in the riparian zone of TGR, which can survive due to the vitality in dormancy state under periodic submergence [12,13,14]. Moreover, about 90% of C. dactylon can quickly recover and grow fast from a deep root system in spring [15]. Many studies have focused on the physiological responses, seedlings, adaptability, submergence tolerance, and growth restoration of C. dactylon in the riparian zone of the TGR [16,17]. However, the relationship of the NPP with the C:N:P stoichiometric allocation between above- and below-ground of C. dactylon remains unclear under the effect of periodic changes of hydrological regime.
In this study, the variability of NPP and C:N:P stoichiometric ratios in leaf-stem and roots of C. dactylon was analyzed by collecting vegetation samples in 18 plots, in the riparian zone of a TGR tributary. The relationship of flooding time, C:N:P stoichiometric ratio in the leaf-stem, root, and leaf-stem to root ratio was examined in regulating the variation of NPP. The current study hypothesizes that (Ⅰ) NPP declined with the decrease of riparian zone altitudes; (Ⅱ) C:N ratio in the leaf-stem to root ratio and C:P ratio in root can be regarded as the main predictors of NPP variation. Specifically, it aims to answer the following two questions: (Ⅰ) How NPP varies along with the riparian zone altitudes under distinct flooding duration? (Ⅱ) What is the relationship between NPP and C:N:P stoichiometric ratio in plant tissues?

2. Materials and Methods
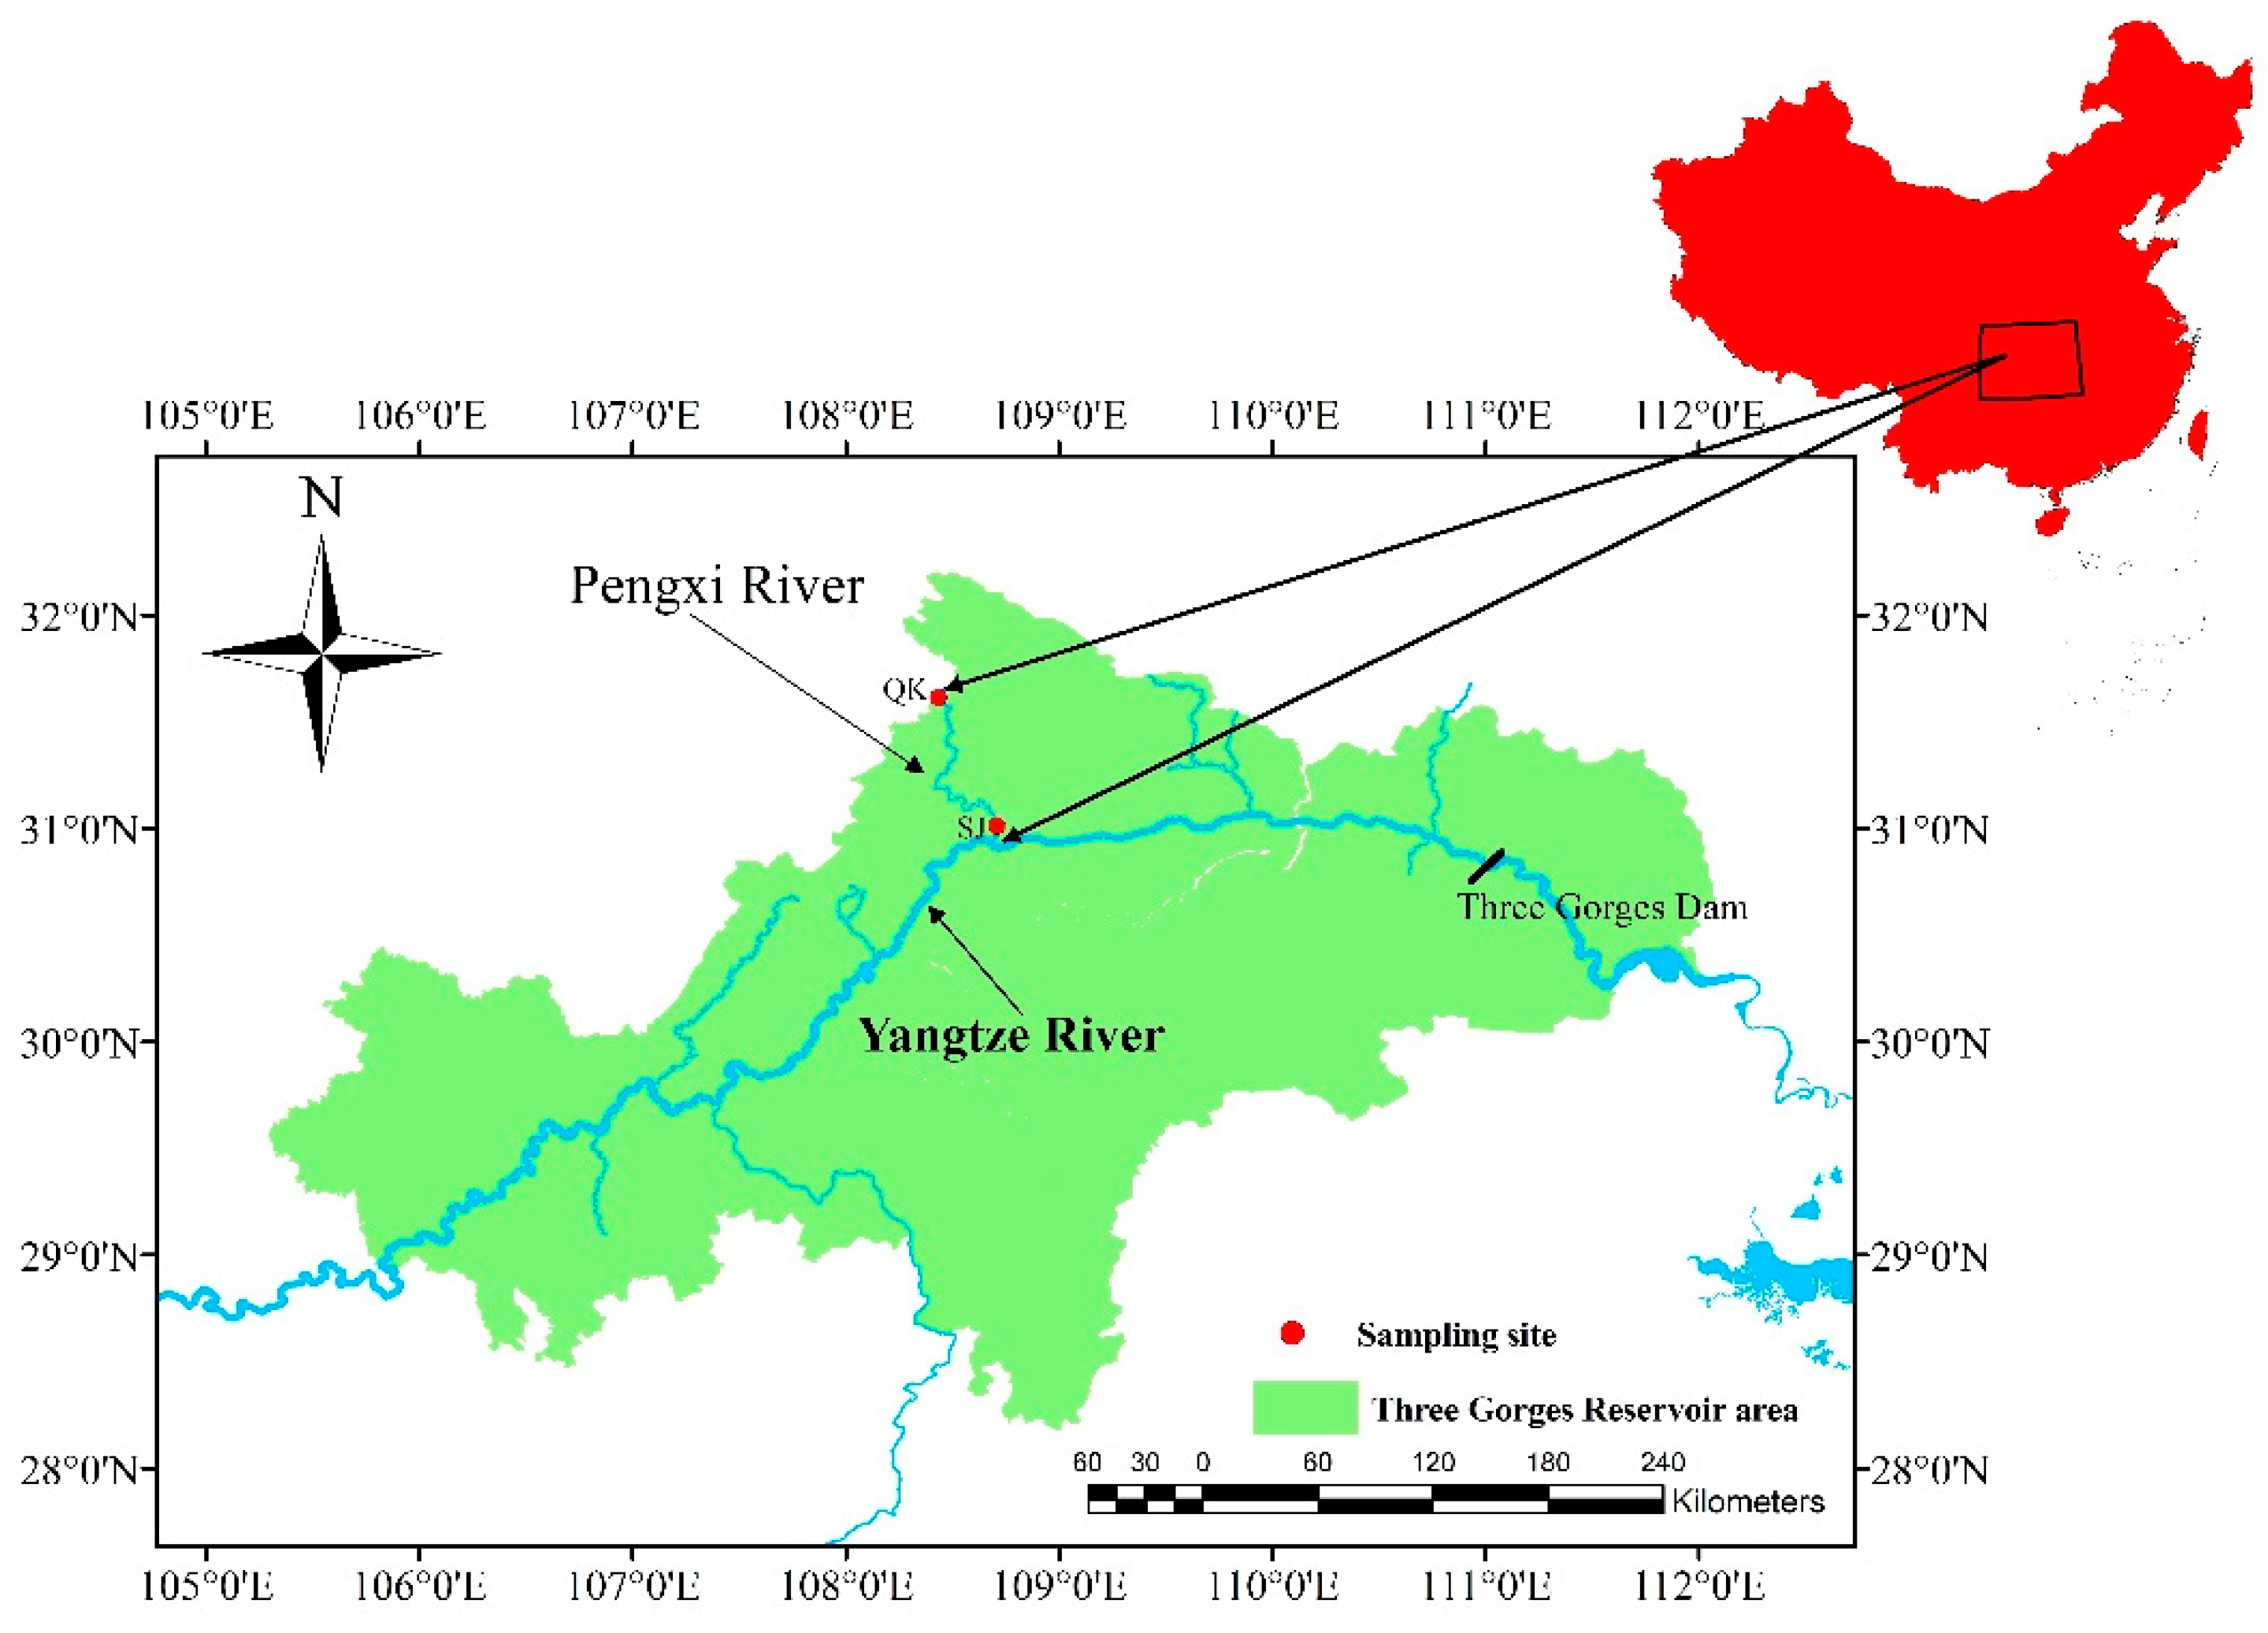
2.1. Study Areas

Pengxi River is located between 30°49′–31°42′ N, 107°56′–108°54′ E in the eastern edge of Sichuan Basin (Figure 1), and is the largest tributary with a total length of 182 km on the north bank of the TGR area, China [18]. The riparian zone area is about 48.02 km2 in the Pengxi River, accounting for 15.9% of the total riparian zone area of TGR, and its slope gradient is <15° [19]. The annual average rainfall in this region is about 1200 mm [20]. The mean humidity was 65.58–95.11%, while the mean temperature was 22.16–30.52 °C on a daily basis in the sampling period in July 2017.

2.2. Sampling

The distribution of C. dactylon on the riparian zone at two hydrological sections of Qukou (QK) and Shuangjiang (SJ) was investigated in Pengxi River, July 2017 (Figure 1). Three sampling plots (1 m × 1 m) were randomly established at 10 m-intervals between 145 masl. and 175 masl. The leaf-stem and root of C. dactylon were collected, bagged separately and brought to the laboratory then oven dried at 65 °C for 48 h, and weighed.

2.3. Laboratory Analyses

The C and N content were analyzed in plants on an Elemental Analyzer (Euro Vector EA3000, Italy) equipped with Callidus software (EuroVector SpA, Milan, Italy). The total phosphorus (TP) was determined in plant samples by the alkali fusion-Mo-Sb anti-spectrophotometric method (HJ 632-2011) on an ultraviolet–visible (UV/VIS) spectrophotometer (T6 new century, Beijing Puxi General Company, Beijing, China).

2.4. Data Processing

Water level information was obtained from Changjiang Water Resources Commission (http://www.cjh.com.cn/swyb_sssq.html). The submerging time was extracted from hydrological data from 2013 to 2018 at Wanzhou Hydrological Station in the Yangtze River by GetData software (GetData Graph Digitizer version V2.20) (Figure 2a). Structure equation modeling (SEM) was used to assess potential causal relationships of flooding stress, C:N:P stoichiometric ratio and NPP. The overall goodness of fitting for the model was tested by chi-square (χ2). The model is satisfying when non-significant χ2 test (p > 0.05), χ2/df within 0–2 and low values of χ2, akaike information criterion (AIC), and root mean square error of approximation (RMSEA) [21], and indicate that there is an acceptable difference between the modeled and observed values. Net primary production was determined from plant biomass (W) change over a given time interval [22]. Plant biomass production per unit of nitrogen uptake can represent N use efficiency, which was indicated by the C:N ratio in plant tissues in this study [23]. All data were tested for normality using the Kolmogorov–Smirnov test, and log-transformed non-normal data (e.g., C:P ratio in root). Structure equation modeling (SEM) was performed by IBM SPSS Amos 24 (IBM Corp., 2016).

2.5. Statistical Analysis

One-way analysis of variance (ANOVA) was used to check the differences in C:N:P stoichiometric ratio among riparian zone altitudes or plant tissues. Linear regression was used to test the relationship between the NPP and C:N:P stoichiometric ratio in leaf-stem, root, and leaf-stem to root ratio. All statistical plots and analyses were performed using SigmaPlot 12.5 (Systat Software, San Jose, CA, USA) and SPSS 20.0 for Windows (IBM Corp., New York, NY, USA), respectively.

3. Results

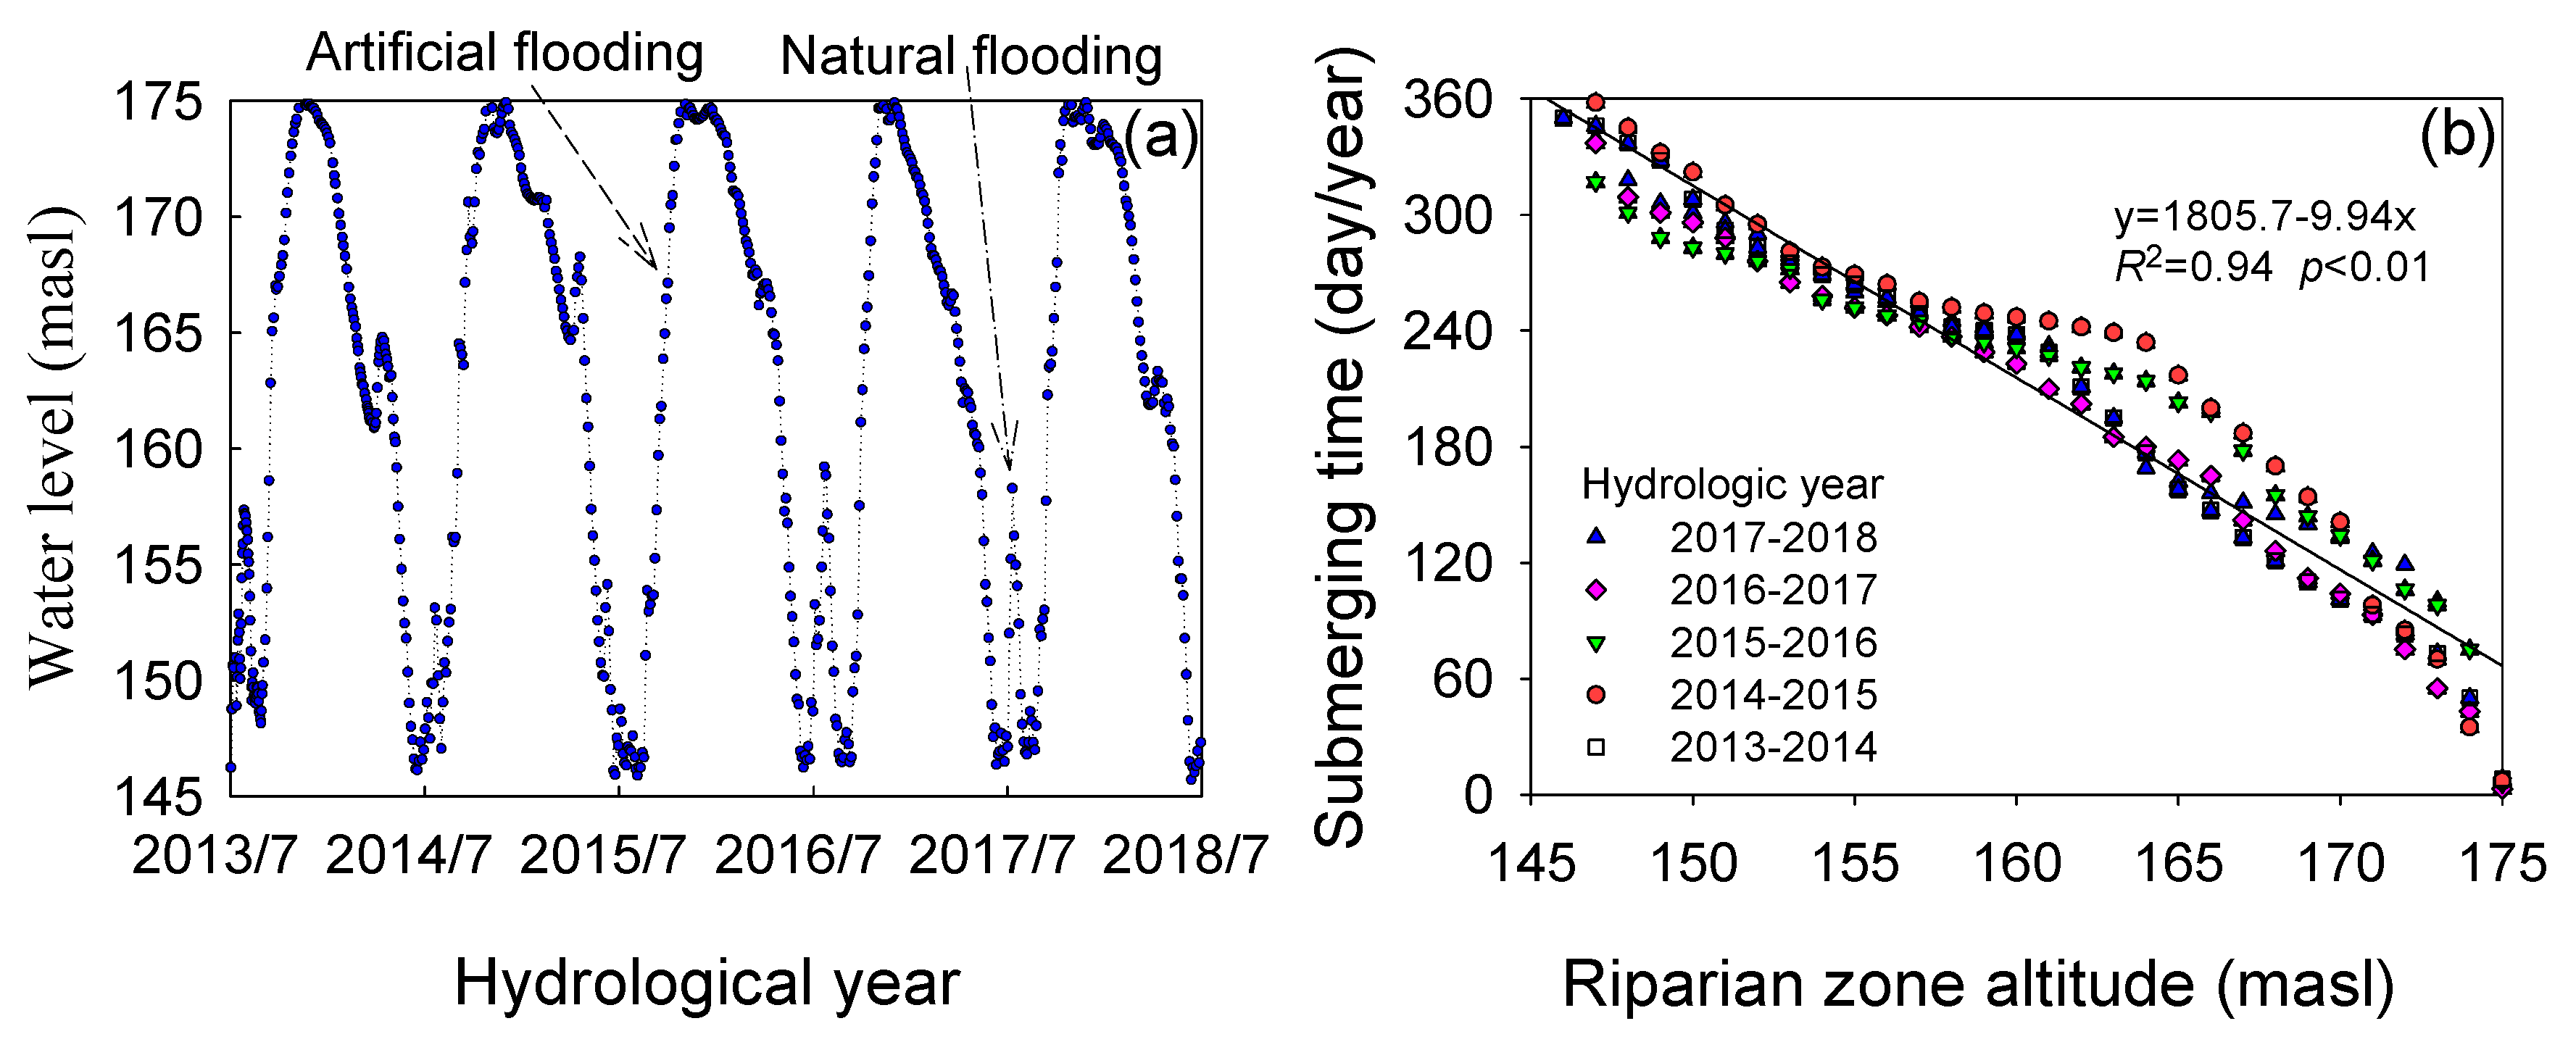
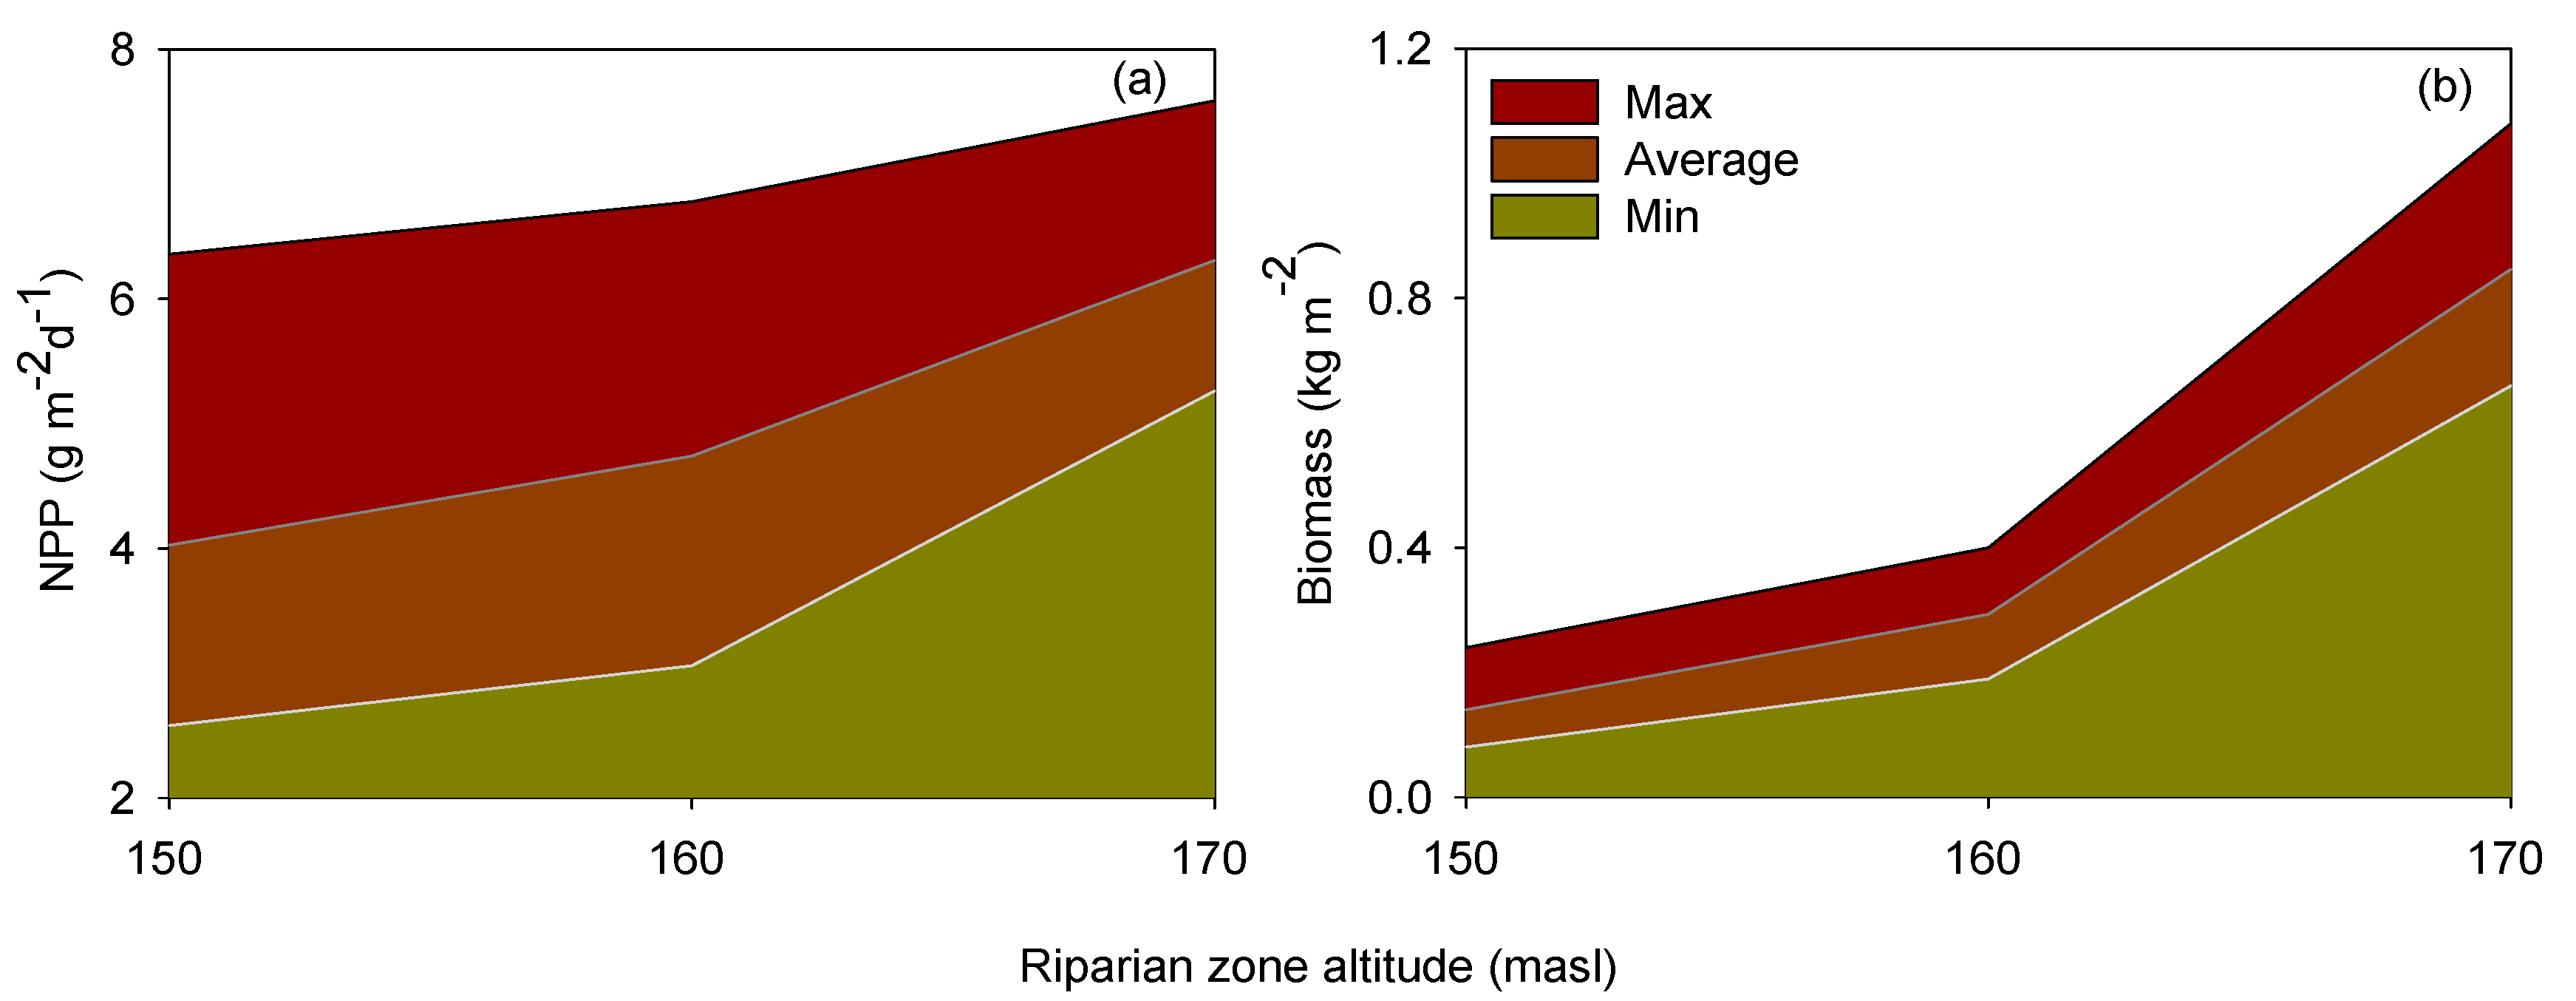
3.1. Flooding Time and Net Primary Production (NPP)

The water level in the TGR showed that an annual periodic fluctuation rose from the lowest water level of 145 masl in June–July to the highest water level of 175 masl in December–January, and then slowly descended to the lowest water level in June–July from 2013 to 2018 (Figure 2a). Flow regulation made the riparian zones at different altitudes undergoing a distinct drying-rewetting process in the TGR. The submerging time was negatively correlated to the riparian zone altitudes, which was average 338, 227, and 116 days per year at the altitudes of 145–155, 155–165, and 165–175 masl, respectively (Figure 2b).

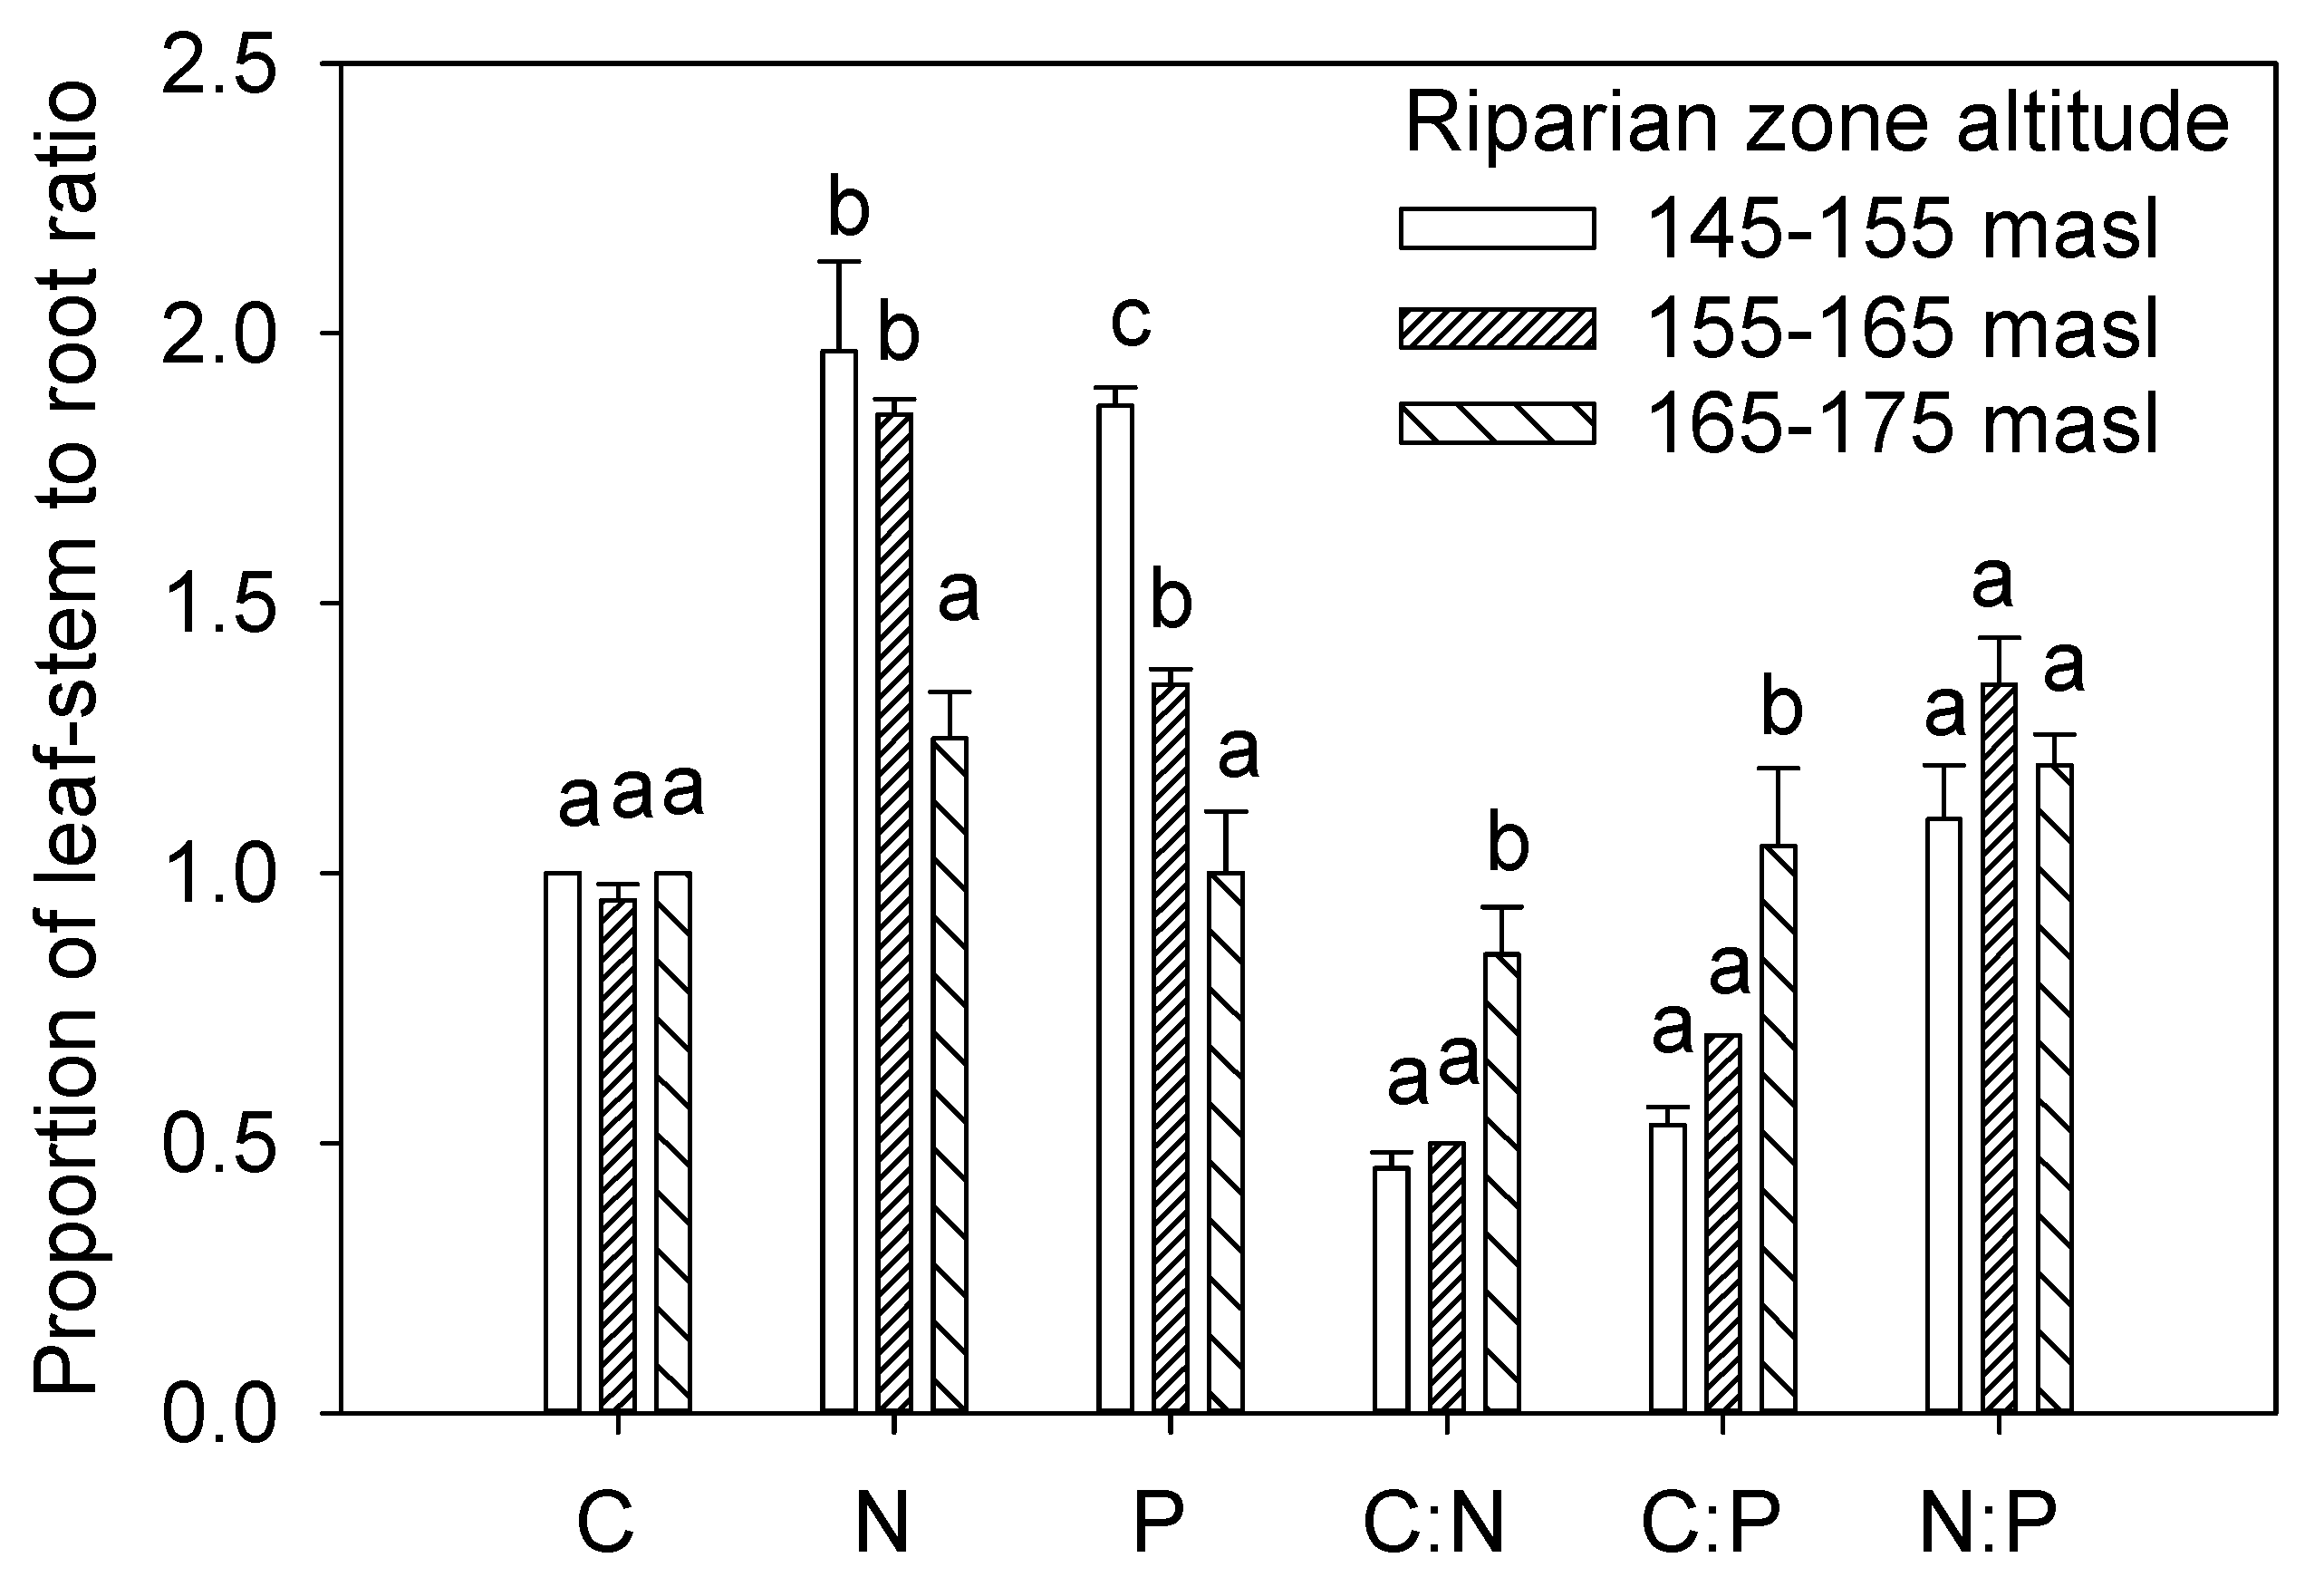
3.2. C, N, and P in Leaf-Stem and Root

The biomass and NPP of C. dactylon simultaneously decreased with the decline of the riparian zone altitudes (Figure 3). The N and P in the leaf-stem were much higher than that in the root. By contrast, the C:N and C:P ratio in the leaf-stem were significantly lower than in the root. No significant differences were found in C content or N:P ratio between leaf-stem and root. Meanwhile, no significant differences of C, N, C:N, C:P, and P were found in the leaf-stem or root among the three altitudes except C:P in leaf-stem (Table 1). Besides, no significant differences in C:N and C:P in the leaf-stem to root ratio were found between 145–155 masl and 155–165 masl (Figure 4).

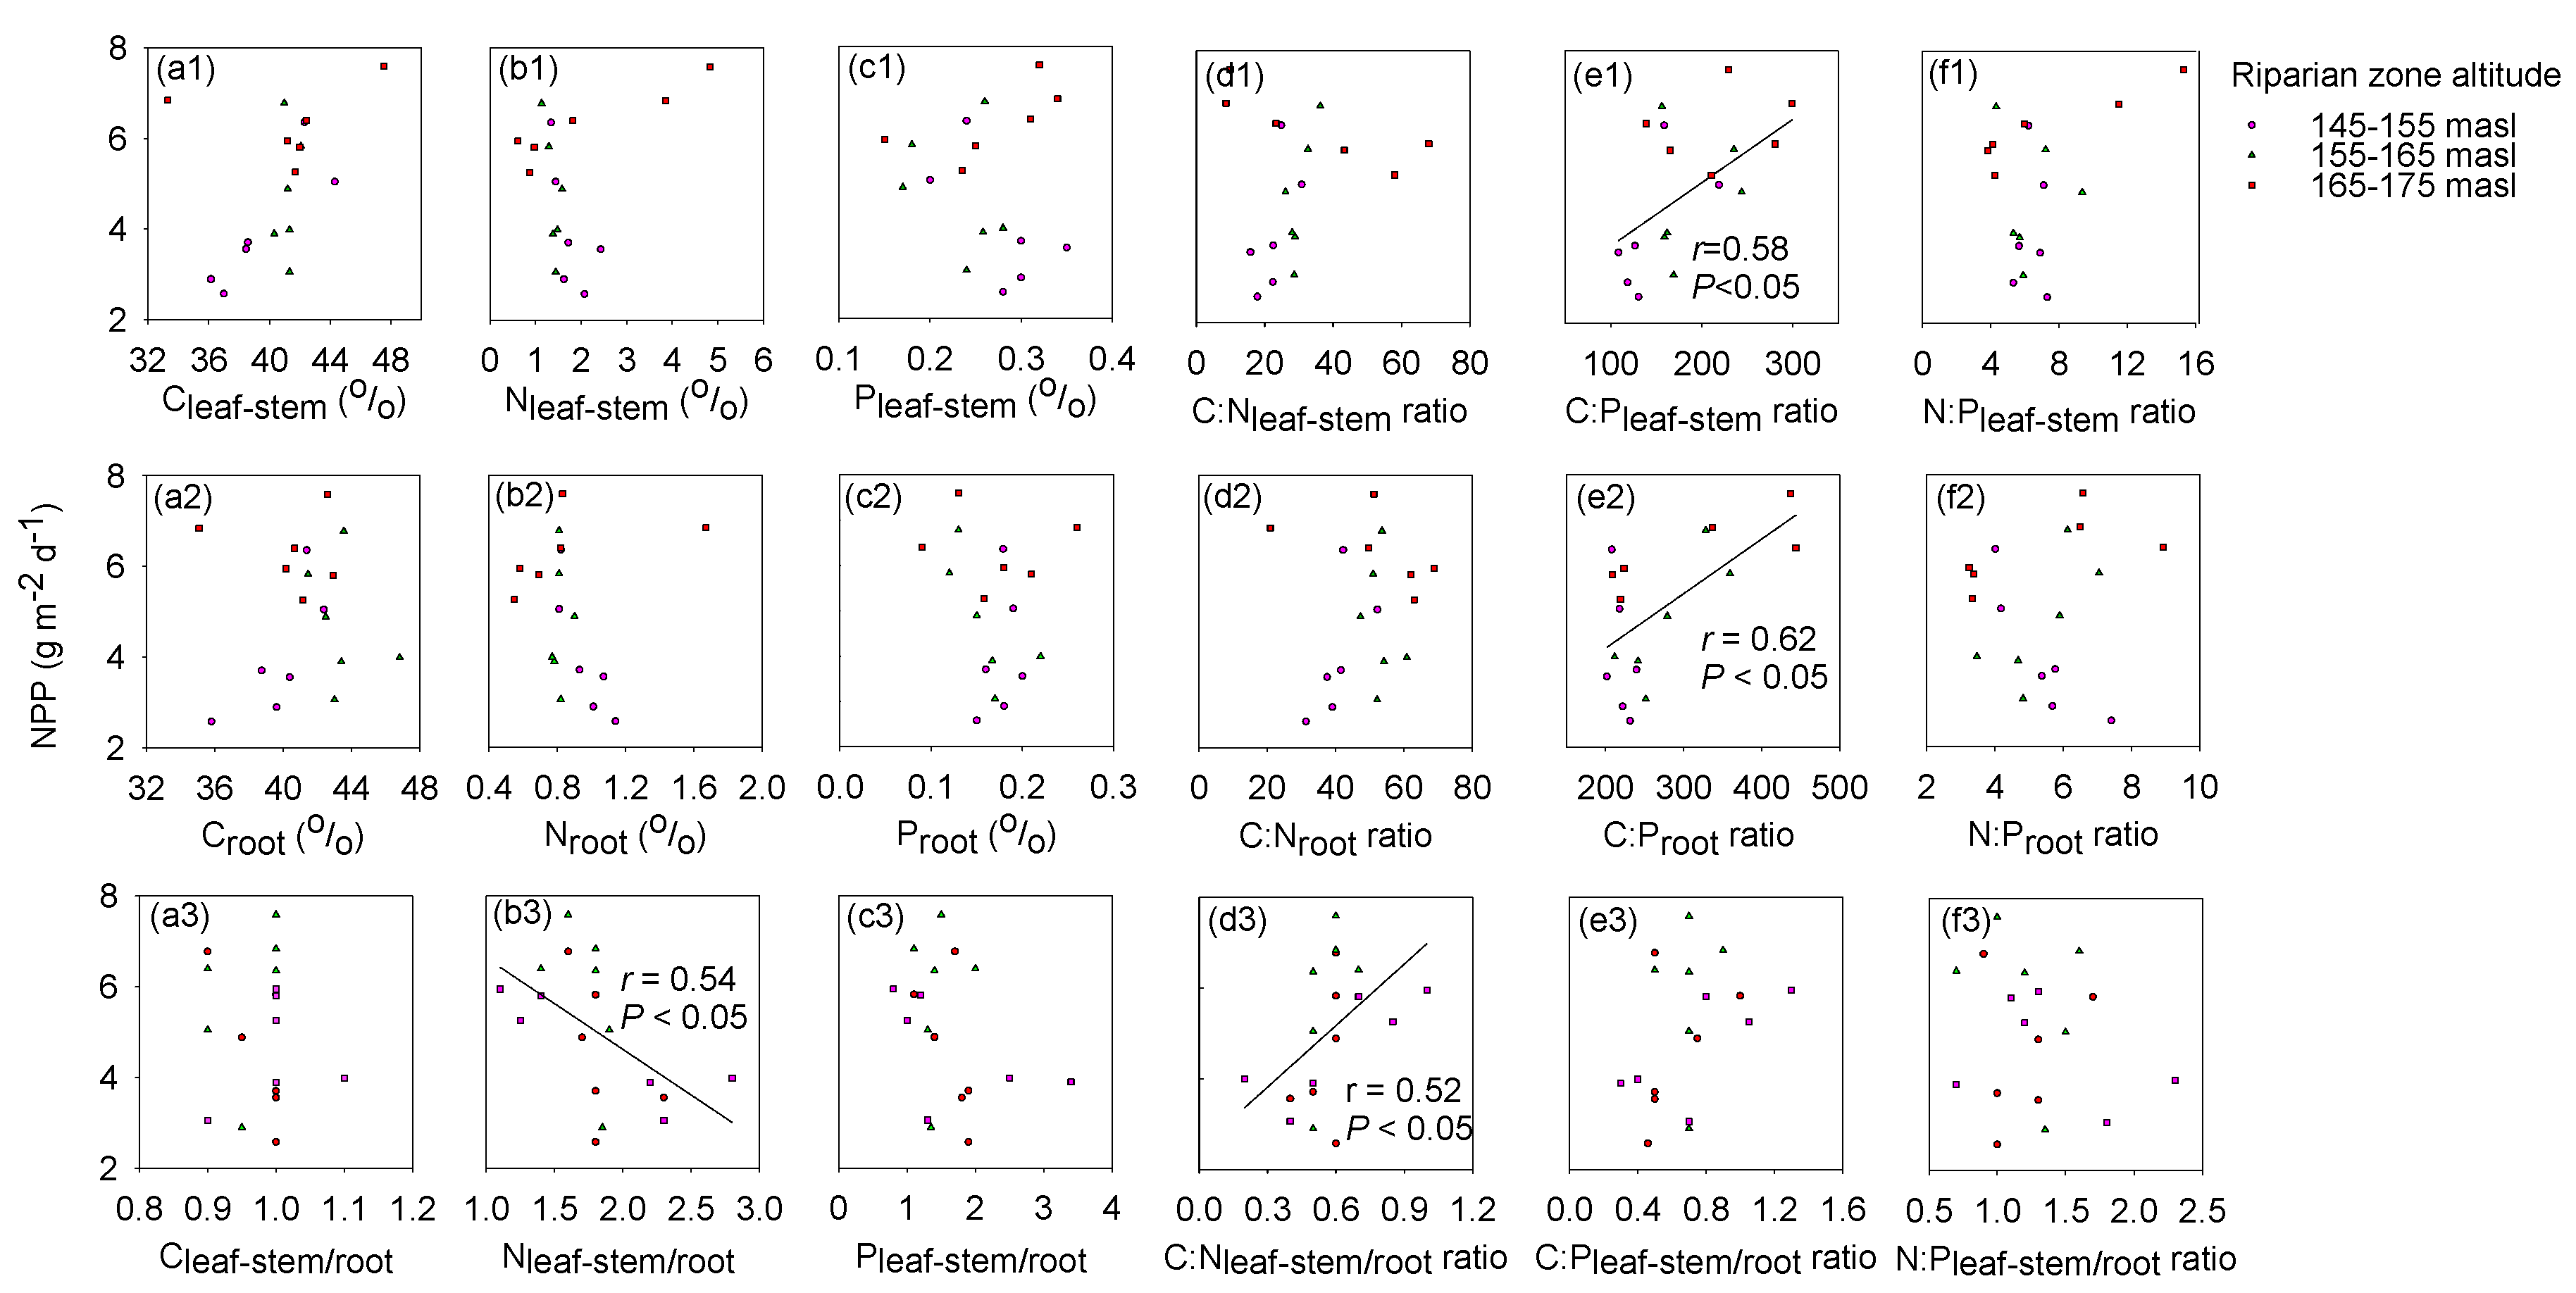
3.3. Leaf-Stem and Root C:N:P Stoichiometry with NPP

The C:P ratio in both leaf-stem and root was positively linearly related to the NPP with r = 0.58 (Figure 5(e1)) and r = 0.62 (Figure 5(e2)) at p < 0.05, respectively, while C, N, P, C:N ratio and N:P ratio in the leaf-stem and root were not correlated to the NPP (Figure 5). Moreover, the NPP was negatively correlated with Nleaf-stem/root (Figure 5(b3)), while positively correlated to C:Nleaf-stem/root (Figure 5d3) at p < 0.05. No significant correlation of the NPP was found with Cleaf-stem/root, Pleaf/root, C:Pleaf/root and N:Pleaf/root (p > 0.05) (Figure 5).

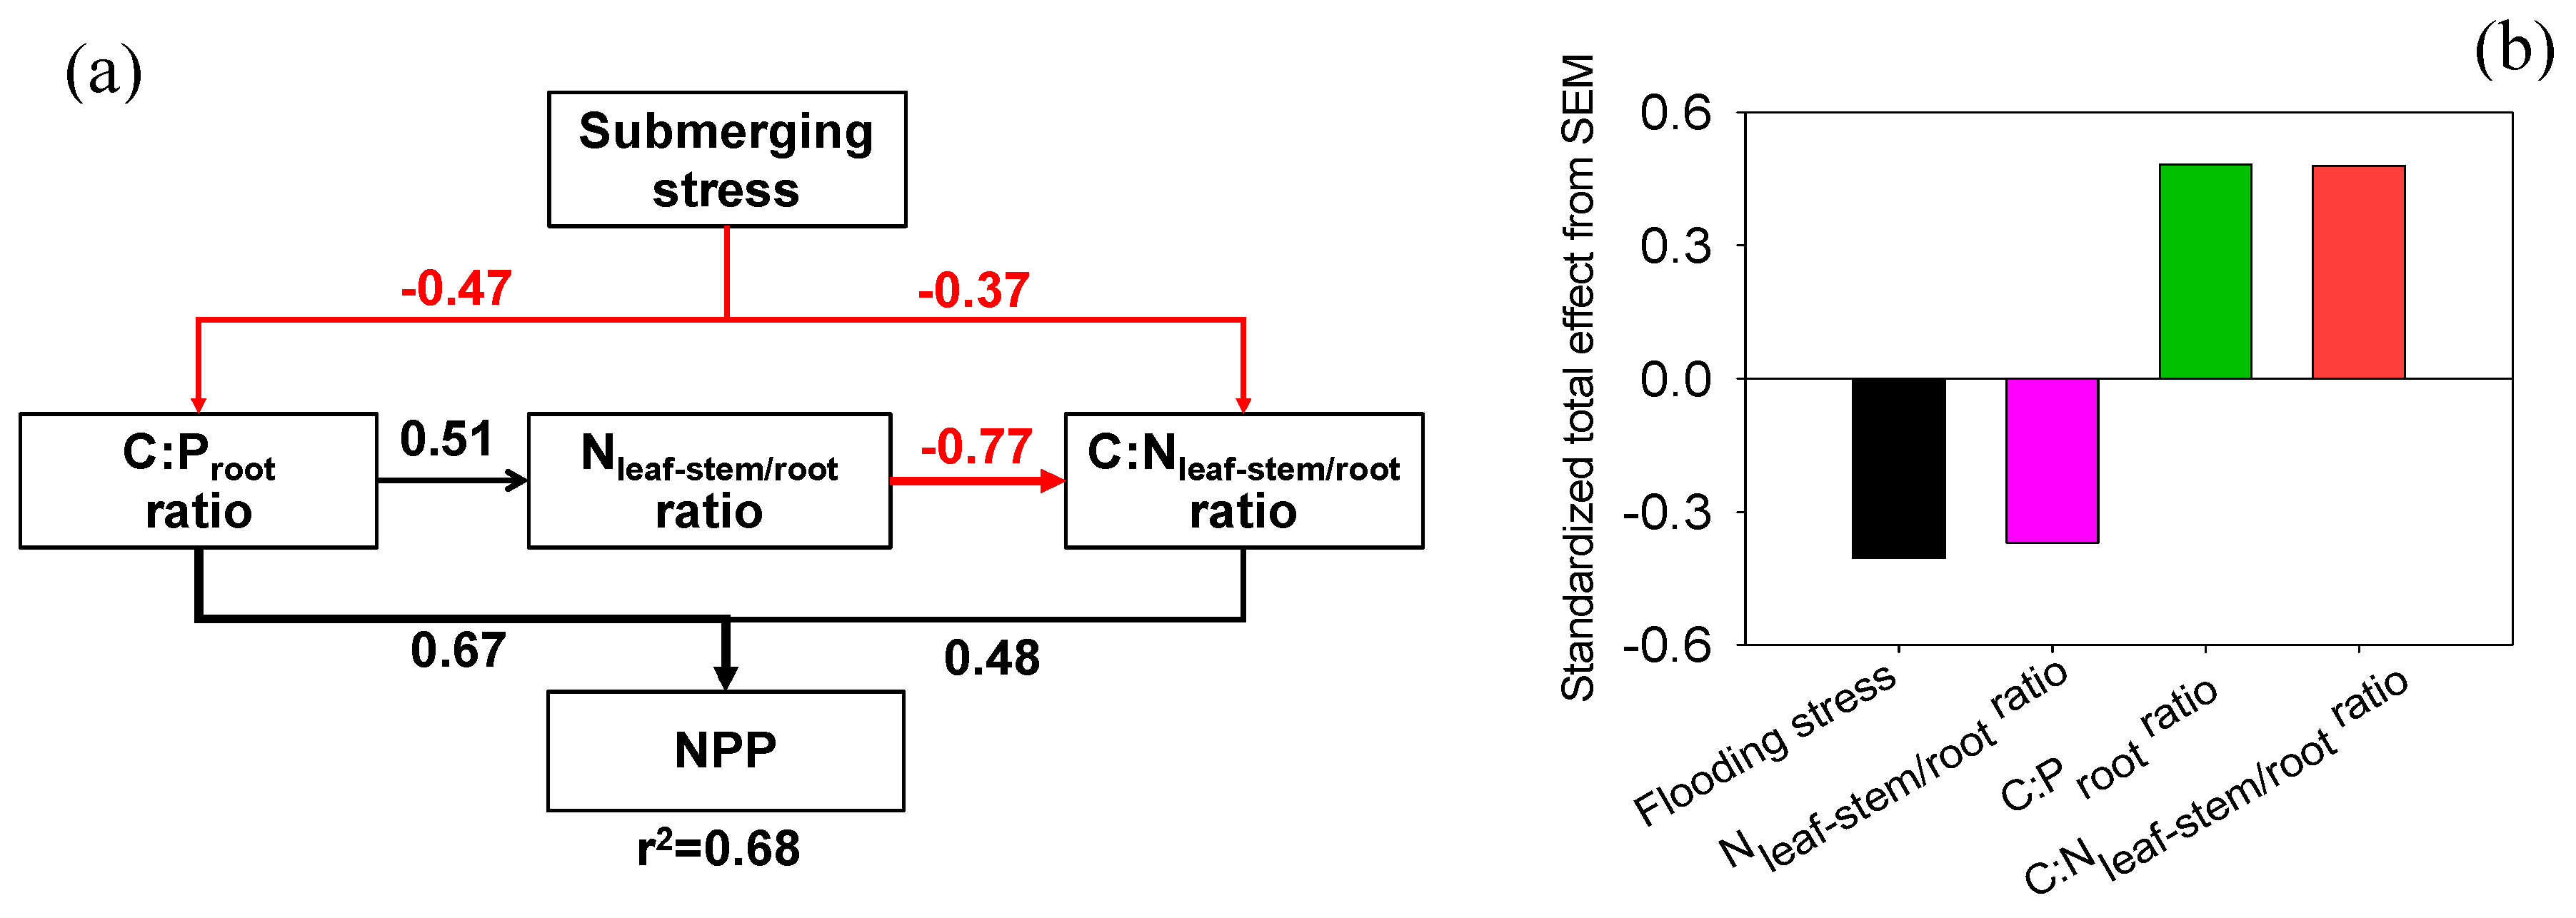
3.4. Exploring the Indicators of NPP

SEM analysis showed that the C:P ratio in the root (C:Proot) and the proportion of C:N ratio in leaf-stem and root (C:Nleaf-stem/root) had a direct effect, while submerging stress and the proportion of N in leaf-stem and root (Nleaf-stem/root) exerted an indirect effect on the NPP. All of these variables predicted 68% of the variance in the NPP (Figure 6a). Specifically, flooding stress had a direct negative effect on the C:Proot ratio and C:Nleaf-stem/root ratio. The C:Proot ratio had a direct positive effect on the NPP or indirectly negatively affected C:Nleaf-stem/root ratio, which further had a direct positive effect on NPP by mediating Nleaf-stem/root ratio. Taking the total effect of direct and indirect effects into account, the C:Nleaf-stem/root and C:Proot ratios could be regarded as the most critical predictors shaping the NPP variation along the riparian zone altitudes (Figure 6b).

4. Discussion

4.1. Flooding Stress and NPP

C.dactylon is a perennial grass widely distributed in the riparian zone with a developed creeping stem and root system [25]. Due to high morphological and physiological plasticity, C.dactylon can endure oxygen deficiency and low temperatures under winter flooding and drought conditions in summer [3]. It thus can adapt to the unique riparian zone of TGR. Flooding stress anti-seasonally operated by the Three Gorges Dam decreased the NPP of C. dactylon at the lower altitude (145–155 masl and 155–165 masl) of the riparian zone compared to the altitude of 165–175 masl (Figure 3). The lower NPP of C. dactylon was mainly driven by the longer flooding duration, which was indirectly negatively related to the NPP (Figure 6).
This supported our first hypothesis that the NPP should decrease when flooding duration increases.
Moreover, a recent observation indicated that total leaf N and P content were relatively higher, while leaf C:N and C:P ratios were much lower under the stronger flooding stress [9]. Leaf nutrient stoichiometry in wetland plants was mainly influenced by flooding duration gradient in a lakeshore meadow of Poyang Lake floodplain [26]. The current study deduced that the NPP variation under the different flooding stresses could be indicated by the nutrition stoichiometric ratio among plant tissues.

4.2. Nutrient Allocation and NPP

Nutrients such as N and P were redistributed between leaf-stem and root to mediate the NPP responding to different flooding stress among riparian zone altitudes. The SEM indicated that the C:Proot ratio and C:Nleaf-stem/root ratio were the most critical indicators of the NPP (Figure 6a), which supported our second hypothesis. The nutrient allocation among plant tissues is essential for regulating plant growth [27,28]. A plant may take different survival strategies by allocating C, N, and P in the above- and below-ground tissues to maintain C:N:P stoichiometric balance [29].
Lin et al. [22] reported that the NPP was positively related to N and P use efficiency in the riparian zone of the TGR, but did not consider the proportion of C:N:P stoichiometric ratio among different tissues. It is indicated that P is one of the limiting factors for plant growth [30] and more susceptible in leaves to environmental gradients than N [31]. The growth-rate hypothesis points out that the fast-growing tissues have relatively high P content because they need more P-rich ribosomal RNA (rRNA) to fuel enhanced protein-synthesis [32]. P content in the leaf-stem of C. dactylon at the altitude of 145–155 masl was higher than that at 155–165 masl (Table 1), while no correlation was found between NPP and P content. However, the C:P ratio in the leaf-stem and root was positive linearly correlated to the NPP (Figure 5e1,e2) and the C:P ratio in the root was positively directly related to the NPP (Figure 6a). Thus, it is deduced that the P use efficiency (C:P ratio) was synchronous with NPP, and the current study suggested that the C:P ratio in the root can be regarded as a predictor of the NPP of C. dactylon in the riparian zone.
The values of leaf N:P ratios of C. dactylon were always less than 14, indicating that the growth and development of C. dactylon are primarily limited by N [30]. More interestingly, the root N:P ratio (<6) of C. dactylon was less than that of the leaf-stem, implying that the root growth was limited by N more than leaf-stem. Thus, the root may be a more sensitive tissue with relatively higher N utilization efficiency (higher C:N ratio, Table 1). N use efficiency is the plant biomass produced per unit of nitrogen uptake, represented by the C:N ratio [23]. Recent research showed that N content could control the NPP of an alpine Kobresia meadow in the northern Qinghai-Tibet Plateau [33]. Furthermore, NPP was negatively correlated with C:N under N limitation in vascular plants [34].
However, the current study found that NPP was negatively correlated with Nstem-leaf/root (proportion of N in stem-leaf and root) (Figure 5b3), but by contrast positively correlated with C:Nleaf-stem/root ratio (proportion of C:N ratio in stem-leaf and root) in the riparian zone (p < 0.05) (Figure 5d3). Thus, C. dactylon might preferentially allocate energy and resources in the aboveground to raise N use efficiency in the leaf-stem (higher C:Nleaf-stem/root ratio) to enhance the NPP under periodic flooding stress [35]. Furthermore, the NPP was tightly coupled with the C:Nleaf-stem/root ratio among riparian zone altitudes (Figure 4). Thus, N is a critical limit factor for NPP of C. dactylon, while the C:Nleaf-stem/root ratio and root C:P ratio can be regarded as the main predictors of the NPP in the riparian zone.

5. Conclusions

This study focused on the variability of NPP and C:N:P stoichiometric ratios in the leaf-stem and roots of C. dactylon in the riparian zone of a TGR tributary. The results reveal that the NPP of C. dactylon was mainly influenced by N limitation in the riparian zone. The C:Nleaf-stem/root ratio and root C:P ratio can be regarded as the main predictors of the NPP in the riparian zone under periodic water level fluctuation. Therefore, this can provide an essential scientific basis for establishing vegetation restoration technology based on C:N:P stoichiometry in the riparian zone ecosystem. Further research needs to pay attention to the coupling relationship between C:N:P stoichiometry and the above- and underground distribution mechanism of NPP in the riparian zone ecosystem.

Author Contributions

J.L., L.H. and Z.L. designed the experiment; Z.Y. and D.L. performed the experiments; D.L., L.H. and J.L. analyzed the data and wrote the manuscript; All authors revised the manuscript. All authors have read and agreed to the published version of the manuscript.

Funding

This work was supported by the Innovative Research Group of Universities in Chongqing (CXQT P19037); the Program of Chongqing Science and Technology Commission (cstc2020jcyj-msxmX0095, cstc2018jcyjAX0813); the Science and Technology Research Program of Chongqing Municipal Education Commission (KJZD-K202001203, KJZD-K202003501, KJZD-K201801201, KJ1710260, KJQN201801233, KJQN201801230).

Conflicts of Interest

The authors declare no competing interests.

Abbreviations

NPP—net primary production; C—carbon; N—nitrogen; P—phosphorus; TGR—Three Gorges Reservoir; C. dactylon—Cynodon dactylon (Linn.) Pers.; C:Proot—C:P ratio in the root; C:Nleaf-stem/root—C:N in the leaf-stem to root ratio; Nleaf-stem/root—N in the leaf-stem to root ratio.

References

  1. Lin, J.; Fu, C.; Zhang, X.; Xie, K.; Yu, Z. Heavy Metal Contamination in the Water-Level Fluctuating Zone of the Yangtze River within Wanzhou Section, China. Biol. Trace Elem. Res. 2012, 145, 268–272. [Google Scholar] [CrossRef]
  2. Wu, J.; Huang, J.; Han, X.; Gao, X.; He, F.; Jiang, M.; Jiang, Z.; Primack, R.B.; Shen, Z. The three gorges dam: An ecological perspective. Front. Ecol. Environ. 2004, 2, 241–248. [Google Scholar] [CrossRef]
  3. Yang, F.; Liu, W.-W.; Wang, J.; Liao, L.; Wang, Y. Riparian vegetation’s responses to the new hydrological regimes from the Three Gorges Project: Clues to revegetation in reservoir water-level-fluctuation zone. Acta Ecol. Sin. 2012, 32, 89–98. [Google Scholar] [CrossRef]
  4. Lu, Z.-J.; Li, L.-F.; Jiang, M.-X.; Huang, H.-D.; Bao, D.-C. Can the soil seed bank contribute to revegetation of the drawdown zone in the Three Gorges Reservoir Region? Plant Ecol. 2010, 209, 153–165. [Google Scholar] [CrossRef]
  5. Ye, C.; Butler, O.M.; Chen, C.; Liu, W.; Du, M.; Zhang, Q. Shifts in characteristics of the plant-soil system associated with flooding and revegetation in the riparian zone of Three Gorges Reservoir, China. Geoderma 2020, 361, 114015. [Google Scholar] [CrossRef]
  6. Li, W.; Cao, T.; Ni, L.; Zhang, X.; Zhu, G.; Xie, P. Effects of water depth on carbon, nitrogen and phosphorus stoichiometry of five submersed macrophytes in an in situ experiment. Ecol. Eng. 2013, 61, 358–365. [Google Scholar] [CrossRef]
  7. Güsewell, S. N: P ratios in terrestrial plants: Variation and functional significance. New Phytol. 2004, 164, 243–266. [Google Scholar] [CrossRef]
  8. Hessen, D.O.; Ågren, G.I.; Anderson, T.R.; Elser, J.J.; De Ruiter, P.C. Carbon sequestration in ecosystems: The role of stoichiometry. Ecology 2004, 85, 1179–1192. [Google Scholar] [CrossRef]
  9. Huang, D.; Wang, D.; Ren, Y. Using leaf nutrient stoichiometry as an indicator of flood tolerance and eutrophication in the riparian zone of the Lijang River. Ecol. Indic. 2019, 98, 821–829. [Google Scholar] [CrossRef]
  10. Wang, W.; Sardans, J.; Wang, C.; Zeng, C.; Tong, C.; Bartrons, M.; Asensio, D.; Peñuelas, J. Shifts in plant and soil C, N and P accumulation and C:N:P stoichiometry associated with flooding intensity in subtropical estuarine wetlands in China. Estuar. Coast. Shelf Sci. 2018, 215, 172–184. [Google Scholar] [CrossRef]
  11. Larmola, T.; Alm, J.; Juutinen, S.; Saarnio, S.; Martikainen, P.J.N.; Silvola, J. Floods can cause large interannual differences in littoral net ecosystem productivity. Limnol. Oceanogr. 2004, 49, 1896–1906. [Google Scholar] [CrossRef]
  12. Liao, J.; Jiang, M.; Li, L. Effects of simulated submergence on survival and recovery growth of three species in water fluctuation zone of the Three Gorges reservoir. Acta Ecol. Sin. 2010, 30, 216–220. [Google Scholar] [CrossRef]
  13. Peng, C.; Zhang, L.; Qin, H.; Li, D. Revegetation in the water level fluctuation zone of a reservoir: An ideal measure to reduce the input of nutrients and sediment. Ecol. Eng. 2014, 71, 574–577. [Google Scholar] [CrossRef] [Green Version]
  14. Chen, X.; Zhang, S.; Liu, D.; Yu, Z.; Zhou, S.; Li, R.; Liu, Z.; Lin, J. Nutrient inputs from the leaf decay of Cynodon dactylon (L.) Pers in the water level fluctuation zone of a Three Gorges tributary. Sci. Total Environ. 2019, 688, 718–723. [Google Scholar] [CrossRef]
  15. Singh, K.; Pandey, V.C.; Singh, R.P. Cynodon dactylon: An efficient perennial grass to revegetate sodic lands. Ecol. Eng. 2013, 54, 32–38. [Google Scholar] [CrossRef]
  16. Zhang, Z.; Wan, C.; Zheng, Z.; Hu, L.; Feng, K.; Chang, J.; Xie, P. Plant community characteristics and their responses to environmental factors in the water level fluctuation zone of the three gorges reservoir in China. Environ. Sci. Pollut. Res. 2013, 20, 7080–7091. [Google Scholar] [CrossRef]
  17. Li, H.; Liu, L.; Lou, Y.; Hu, T.; Fu, J. Genetic diversity of Chinese natural bermudagrass (Cynodon dactylon) germplasm using ISSR markers. Sci. Hortic. 2011, 127, 555–561. [Google Scholar] [CrossRef]
  18. Lin, J.; Tang, Y.; Liu, D.; Zhang, S.; Lan, B.; He, L.; Yu, Z.; Zhou, S.; Chen, X.; Qu, Y. Characteristics of organic nitrogen fractions in sediments of the water level fluctuation zone in the tributary of the Yangtze River. Sci. Total Environ. 2019, 653, 327–333. [Google Scholar] [CrossRef]
  19. Shi, Y.; Xu, G.; Wang, Y.; Engel, B.A.; Peng, H.; Zhang, W.; Cheng, M.; Dai, M. Modelling hydrology and water quality processes in the Pengxi River basin of the Three Gorges Reservoir using the soil and water assessment tool. Agric. Water Manag. 2017, 182, 24–38. [Google Scholar] [CrossRef]
  20. Huang, Y.; Yasarer, L.M.W.; Li, Z.; Sturm, B.S.M.; Zhang, Z.; Guo, J.; Shen, Y. Air–water CO2 and CH4 fluxes along a river–reservoir continuum: Case study in the Pengxi River, a tributary of the Yangtze River in the Three Gorges Reservoir, China. Environ. Monit. Assess. 2017, 189, 223. [Google Scholar] [CrossRef]
  21. Schermelleh-Engel, K.; Moosbrugger, H.; Müller, H. Evaluating the fit of structural equation models: Tests of significance and descriptive goodness-of-fit measures. Methods Psychol. Res. Online 2003, 8, 23–74. [Google Scholar]
  22. Lin, J.; Zhou, S.; Liu, D.; Zhang, S.; Yu, Z.; Yang, X. Relative contribution of environmental and nutritional variables to net primary production of Cynodon dactylon (Linn.) Pers in the riparian zone of a Three Gorges tributary. Ecol. Evol. 2020, 10, 7073–7081. [Google Scholar] [CrossRef]
  23. Zhang, J.; He, N.; Liu, C.; Xu, L.; Chen, Z.; Li, Y.; Wang, R.; Yu, G.; Sun, W.; Xiao, C.; et al. Variation and evolution of C:N ratio among different organs enable plants to adapt to N-limited environments. Glob. Chang. Biol. 2020, 26, 2534–2543. [Google Scholar] [CrossRef]
  24. Colman, B.P.; Schimel, J.P. Drivers of microbial respiration and net N mineralization at the continental scale. Soil Biol. Biochem. 2013, 60, 65–76. [Google Scholar] [CrossRef]
  25. Chen, F.; Zhang, J.; Zhang, M.; Wang, J. Effect of Cynodon dactylon community on the conservation and reinforcement of riparian shallow soil in the Three Gorges Reservoir area. Ecol. Process. 2015, 4, 1–8. [Google Scholar] [CrossRef] [Green Version]
  26. Chen, Y.; Stagg, C.L.; Cai, Y.; Lü, X.; Wang, X.; Shen, R.; Lan, Z. Scaling responses of leaf nutrient stoichiometry to the lakeshore flooding duration gradient across different organizational levels. Sci. Total Environ. 2020, 740, 139740. [Google Scholar] [CrossRef]
  27. Lambert, A.M.; Dudley, T.L.; Robbins, J. Nutrient enrichment and soil conditions drive productivity in the large-statured invasive grass Arundo donax. Aquat. Bot. 2014, 112, 16–22. [Google Scholar] [CrossRef]
  28. Zhao, N.; Yu, G.; He, N.; Xia, F.; Wang, Q.; Wang, R.; Xu, Z.; Jia, Y. Invariant allometric scaling of nitrogen and phosphorus in leaves, stems, and fine roots of woody plants along an altitudinal gradient. J. Plant Res. 2016, 129, 647–657. [Google Scholar] [CrossRef] [Green Version]
  29. Zhang, K.; Su, Y.; Yang, R. Biomass and nutrient allocation strategies in a desert ecosystem in the Hexi Corridor, northwest China. J. Plant Res. 2017, 130, 699–708. [Google Scholar] [CrossRef]
  30. Koerselman, W.; Meuleman, A.F. The vegetation N: P ratio: A new tool to detect the nature of nutrient limitation. J. Appl. Ecol. 1996, 33, 1441–1450. [Google Scholar] [CrossRef]
  31. Gong, H.; Li, Y.; Yu, T.; Zhang, S.; Gao, J.; Zhang, S.; Sun, D. Soil and climate effects on leaf nitrogen and phosphorus stoichiometry along elevational gradients. Glob. Ecol. Conserv. 2020, 23, e01138. [Google Scholar] [CrossRef]
  32. Liu, Z.; Shi, X.; Yuan, Z.; Lock, T.R.; Kallenbach, R.L. Plant nutritional adaptations under differing resource supply for a dryland grass Leymus chinensis. J. Arid Environ. 2020, 172, 104037. [Google Scholar] [CrossRef]
  33. Dai, L.; Ke, X.; Du, Y.; Zhang, F.; Li, Y.; Li, Q.; Lin, L.; Peng, C.; Shu, K.; Cao, G.; et al. Nitrogen controls the net primary production of an alpine Kobresia meadow in the northern Qinghai-Tibet Plateau. Ecol. Evol. 2019, 9, 8865–8875. [Google Scholar] [CrossRef] [Green Version]
  34. Yu, Q.; Wu, H.; He, N.; Lü, X.; Wang, Z.; Elser, J.J.; Wu, J.; Han, X. Testing the Growth Rate Hypothesis in Vascular Plants with Above- and Below-Ground Biomass. PLoS ONE 2012, 7, e32162. [Google Scholar] [CrossRef] [Green Version]
  35. Rana, K.; Kumar, M.; Kumar, A. Assessment of Annual Shoot Biomass and Carbon Storage Potential of Grewia optiva: An Approach to Combat Climate Change in Garhwal Himalaya. Water Air Soil Pollut. 2020, 231, 450. [Google Scholar] [CrossRef]
Figure 1. Sampling sites in the Pengxi River (QK: Qukou; SJ: Shuangjiang).
Water 12 03279 g001
Figure 2. Water level fluctuation (a) and submerging time (b) from 2013 to 2018. The sampling was conducted in July 2017.
Water 12 03279 g002
Figure 3. Net primary production (NPP) (a) and biomass (b) of C. dactylon among the riparian zone altitudes.
Water 12 03279 g003
Figure 4. C:N:P stoichiometry in the leaf-stem to root ratio among the riparian zone altitudes. Different lowercase letters of a, b, c indicate significant differences among riparian zone altitudes at p < 0.05.
Water 12 03279 g004
Figure 5. C:N:P stoichiometry with NPP. Leaf-stem: (a1f1), Root: (a2f2), leaf-stem/root: (a3f3).
Water 12 03279 g005
Figure 6. Structure equation modeling (SEM) with variables (boxes) and potential causal relationships (arrows) for NPP (a) and standardized total effects (direct effect plus indirect effect) on NPP derived from SEM (b). The black-headed arrows indicate that the hypothesized direction of causation is a positive relationship; on the contrary, the red-headed arrows represent a negative relationship. Arrow width is proportional to the strength of path coefficients. Standardized path coefficients (numbers) can reflect the importance of the variables within the model [24]. The model for NPP had χ2 = 2.660, df = 3, p = 0.447, RMSEA = 0.000, AIC = 50.66.
Water 12 03279 g006
Table 1. Leaf-stem and root C:N:P stoichiometric ratio among riparian zone altitudes and results from linear mixed model.
Riparian Zone Altitude (masl) TissueReplicateC (%)N (%)P (%)C:NC:PN:P
145–155 leaf-stem639.46 1.77 0.28 22.37 143.93 6.41
root639.71 0.97 0.18 40.67 220.55 5.41
155–165leaf-stem641.20 1.38 0.23 30.06 187.69 6.30
root643.45 0.82 0.16 53.18 278.87 5.35
165–175leaf-stem641.35 2.16 0.27 35.16 220.61 7.49
root640.43 0.86 0.17 52.62 311.79 5.33
Results from linear mixed models ANOVA P-values
Main effectAltitude 0.076 0.424 0.259 0.064 0.008 0.819
Tissue 0.579 0.002 0.000 0.000 0.000 0.100
Interaction effectAltitude × Tissue0.392 0.495 0.720 0.851 0.945 0.792
Publisher’s Note: MDPI stays neutral with regard to jurisdictional claims in published maps and institutional affiliations.

