Climate Change Impact on Hydropower Resources in Gauged and Ungauged Lithuanian River Catchments

Laboratory of Hydrology, Lithuanian Energy Institute, Breslaujos st. 3, LT–444003 Kaunas, Lithuania
*
Author to whom correspondence should be addressed.
Water 2020, 12(11), 3265; https://doi.org/10.3390/w12113265
Submission received: 21 October 2020
/
Revised: 18 November 2020
/
Accepted: 19 November 2020
/
Published: 21 November 2020
Abstract
:Hydropower (potential and kinetic energy) is one of the most important renewable energy sources in the world. This energy is directly dependent on water resources and the hydrological cycle. Ongoing climate changes are likely to influence the availability/amount of this energy resource. The present study explores the relationship between climate changes and river runoff, projects future runoff in both gauged and ungauged river catchments, and then assesses how these alterations may affect the future hydropower resources in Lithuania. Runoff projections of the gauged rivers were evaluated applying Swedish Department of Climate hydrological model, and runoff of ungauged river catchments were estimated by created isoline maps of specific runoff. According to an ensemble of three climate models and two Representative Concentration Pathway scenarios, runoff and hydroelectric energy projections were evaluated for two future periods (2021–2040, 2081–2100). The results demonstrated a decrease in future river runoff. Especially significant changes are expected according to the most pessimistic RCP8.5 scenario at the end of the century. The projected changes are likely to bring a negative effect on hydropower production in the country. These findings could help understand what kind of benefits and challenges water resource managers may face in the future.
1. Introduction
Growth in the human population and relentless consumption is closely related to an increase in energy demands. However, the destabilized temperature equilibrium of the Earth forces the search for clean energy sources in order to reduce greenhouse gas emissions. Directive (EU) 2018/2001 [1] on the promotion of the use of energy from renewable sources obliges the EU Member States to achieve a 32% share of renewable energy in final energy consumption by 2030. According to Eurostat [2], in 2018, wind and hydropower each contributed around one-third of the total electricity from renewable sources, with wind power (36%) edging hydropower (33%) as the most important sources.
Hydropower (or hydroelectric energy) is the most important and world’s largest source of renewable energy. It may harness the power of moving water (kinetic energy) or the water stored in dams (potential energy) and is often considered a very clean form of electricity generation. However, at present, most hydroelectric energy comes from hydropower plants that generate energy by damming of water. According to the International Energy Agency, hydropower accounts for about 17% of global electricity production. China is the largest producer of hydroelectricity, followed by Brazil, the United States, and Canada [3], while Africa has the highest percentage of untapped technical hydropower potential in the world [4].
Hydropower is a source of energy that changes over time because it is directly dependent on water resources and the hydrological cycle. In countries where the amount of electricity generated by hydropower plants is substantial, projections of hydropower potential are considered as a task of national importance. For example, in the United States, where hydropower is a key contributor to the renewable energy portfolio, the Department of Energy, directed by Congress, has conducted a second five-year assessment [5] examining the potential effects of, and risks from, global climate change associated with water supplies for federal hydroelectric power generation. This report indicated that the most critical climate change effect on hydrology is likely to be the trend toward earlier snowmelt and change in runoff seasonality. Under the projections of increasing winter–spring runoff and decreasing summer–fall runoff, water resource managers may need to consider different water use allocations. Rich in water resources, Canada, where national energy security is mostly dependent on the hydropower, is getting warmer and wetter with more contribution from rainfall than snow [6]. Consequently, under the continuation of climatic trends, production potential is expected to increase. However, the net gain/loss is subject to significant variations across different regions. In Norway, a country almost perfectly made for hydropower, a current concern about the future potential of this energy resource resulted in a report [7] that indicated the river flow increase due to the projected higher amounts of precipitation. The most significant increase in river flow occurs in winter, and at the same time, slightly smaller snowmelt floods are expected. By the end of the century (in 2071–2100), according to the RCP8.5 scenario, the total hydropower production in Norway is going to grow by 8% (compared to 1961–1990). In contrast, hydropower plants in Germany are affected negatively due to declining river discharge [8]. A special report from the German Advisory Council on the Environment [9] assumed that the hydropower potential for electricity generation in Germany is limited to about 28 TWh a−1 for orographic reasons. Thus, the additional development potential of hydropower is rated to be minimal. For the Alpine region, the average annual electricity generation of run-of-river plants in 2031–2050 (relative to 1961–1990) is estimated to decrease slightly for all climate scenarios considered (up to −8%) [10]. Whereas for Austria, two scenarios project a slight increase (not more than +5%), and according to the other two scenarios a slight decrease (not more than −5%) is expected. Most of the studies assess only the potential energy of water because a vast amount of hydropower is generated in large power plants having water storage reservoirs. However, the research of hydrokinetic energy resources remains limited. The potential of these resources on a national level has been previously assessed in Canada and the continental United States [11,12].
Hydroelectric energy potential varies significantly in time and space. Hydropower systems are dependent on water availability and can either increase competition or mitigate water scarcity [13]. In the long run, the success of hydropower generation and development will largely depend not only on the geographical region, economic opportunities, political approach, and environmental constrains, but also on future climate-induced river runoff changes. The National Energy Independence Strategy of Lithuania [14] stipulates to increase the share of electricity consumption from renewable energy sources up to 45% in 2030 and 80% in 2050 compared to the final electricity consumption. In this context, an assessment of the current and future potential of hydroelectric energy in Lithuania is very important. Jablonskis and Lasinskas [15] were the first to evaluate theoretical potential of hydropower in Lithuania. According to them, over 22,000 rivers (watercourses) with a total length about 77,000 km together with the slopes of the earth’s surface produce a total of 688.8 MW of hydropower and about 6.0 billion kWh a−1. However, the exploitation of hydropower resources is severely limited by environmental requirements; after assessing all nature protection restrictions, it is estimated that efficient technical energy will be 159.1 million kWh a−1, which is only 2.6% of the total annual potential [16]. Currently, the total installed capacity of the hydropower plants is 128 MW (15.3% of all RES). This figure indicates the conventional hydropower resources: 101 MW of installed capacity at Kaunas Hydropower Plant (on the Nemunas—the largest Lithuanian river) and the rest at 97 small hydropower plants (on smaller rivers). River hydrokinetic resources, at the state level, have never been assessed. Gailiušis et al. [17] estimated that resources of hydrokinetic energy of Lithuanian small and medium-size rivers amount to 82.1 MW, but due to the specified exclusionary criteria (environmental constrains and weather conditions), the capacity of riverine hydrokinetic energy decreases to 13.6 MW; thus, only 0.7% of the total electric energy demand for the national economy can be met.
Up to now, no projections of future hydroelectric energy resources have been made in Lithuania. This study is designed to project the changes of river runoff and the total hydropower resources in both gauged and ungauged Lithuanian river catchments. The main objective is to assess the impact of climate change on the future of this renewable energy resource potential in Lithuania.
2. Materials and Methods
2.1. Study Area and Data
The object of this study were the following Lithuanian rivers: the Nemunas, Merkys, Šalčia, Ūla, Neris, Šventoji, Žeimena, Nevėžis, Šušvė, Dubysa, Šešupė, Jūra, Akmena, Šešuvis, Minija, Bartuva, Venta, Mūša, and Lėvuo (Table 1). Daily river discharge data from 25 water gauging stations (WGS) and daily air temperature and precipitation data from 15 meteorological stations (MS) were used from 1986 to 2005 (the period selected as a reference according to IPCC AR5 recommendations [18]) (Figure 1).
Kinetic hydropower resources were estimated in all main Lithuanian rivers; the boundaries of their catchments are indicated in Figure 1. Potential hydropower resources were assessed for 98 currently operating hydropower plants installed on 57 rivers. The near (2021–2040) and far future (2081–2100) projections of the kinetic and potential hydropower resources were made using daily step output data (average air temperature, °C; precipitation amount, mm) from ICHEC-EC-EARTH, MOHC-HadGEM2-ES, and MPI-M-MPI-ESM-LR regional climate models (a grid cell of 11 × 11 km). The data of regional climate models were derived from the EURO-CORDEX database (www.euro-cordex.net).
2.2. Methods
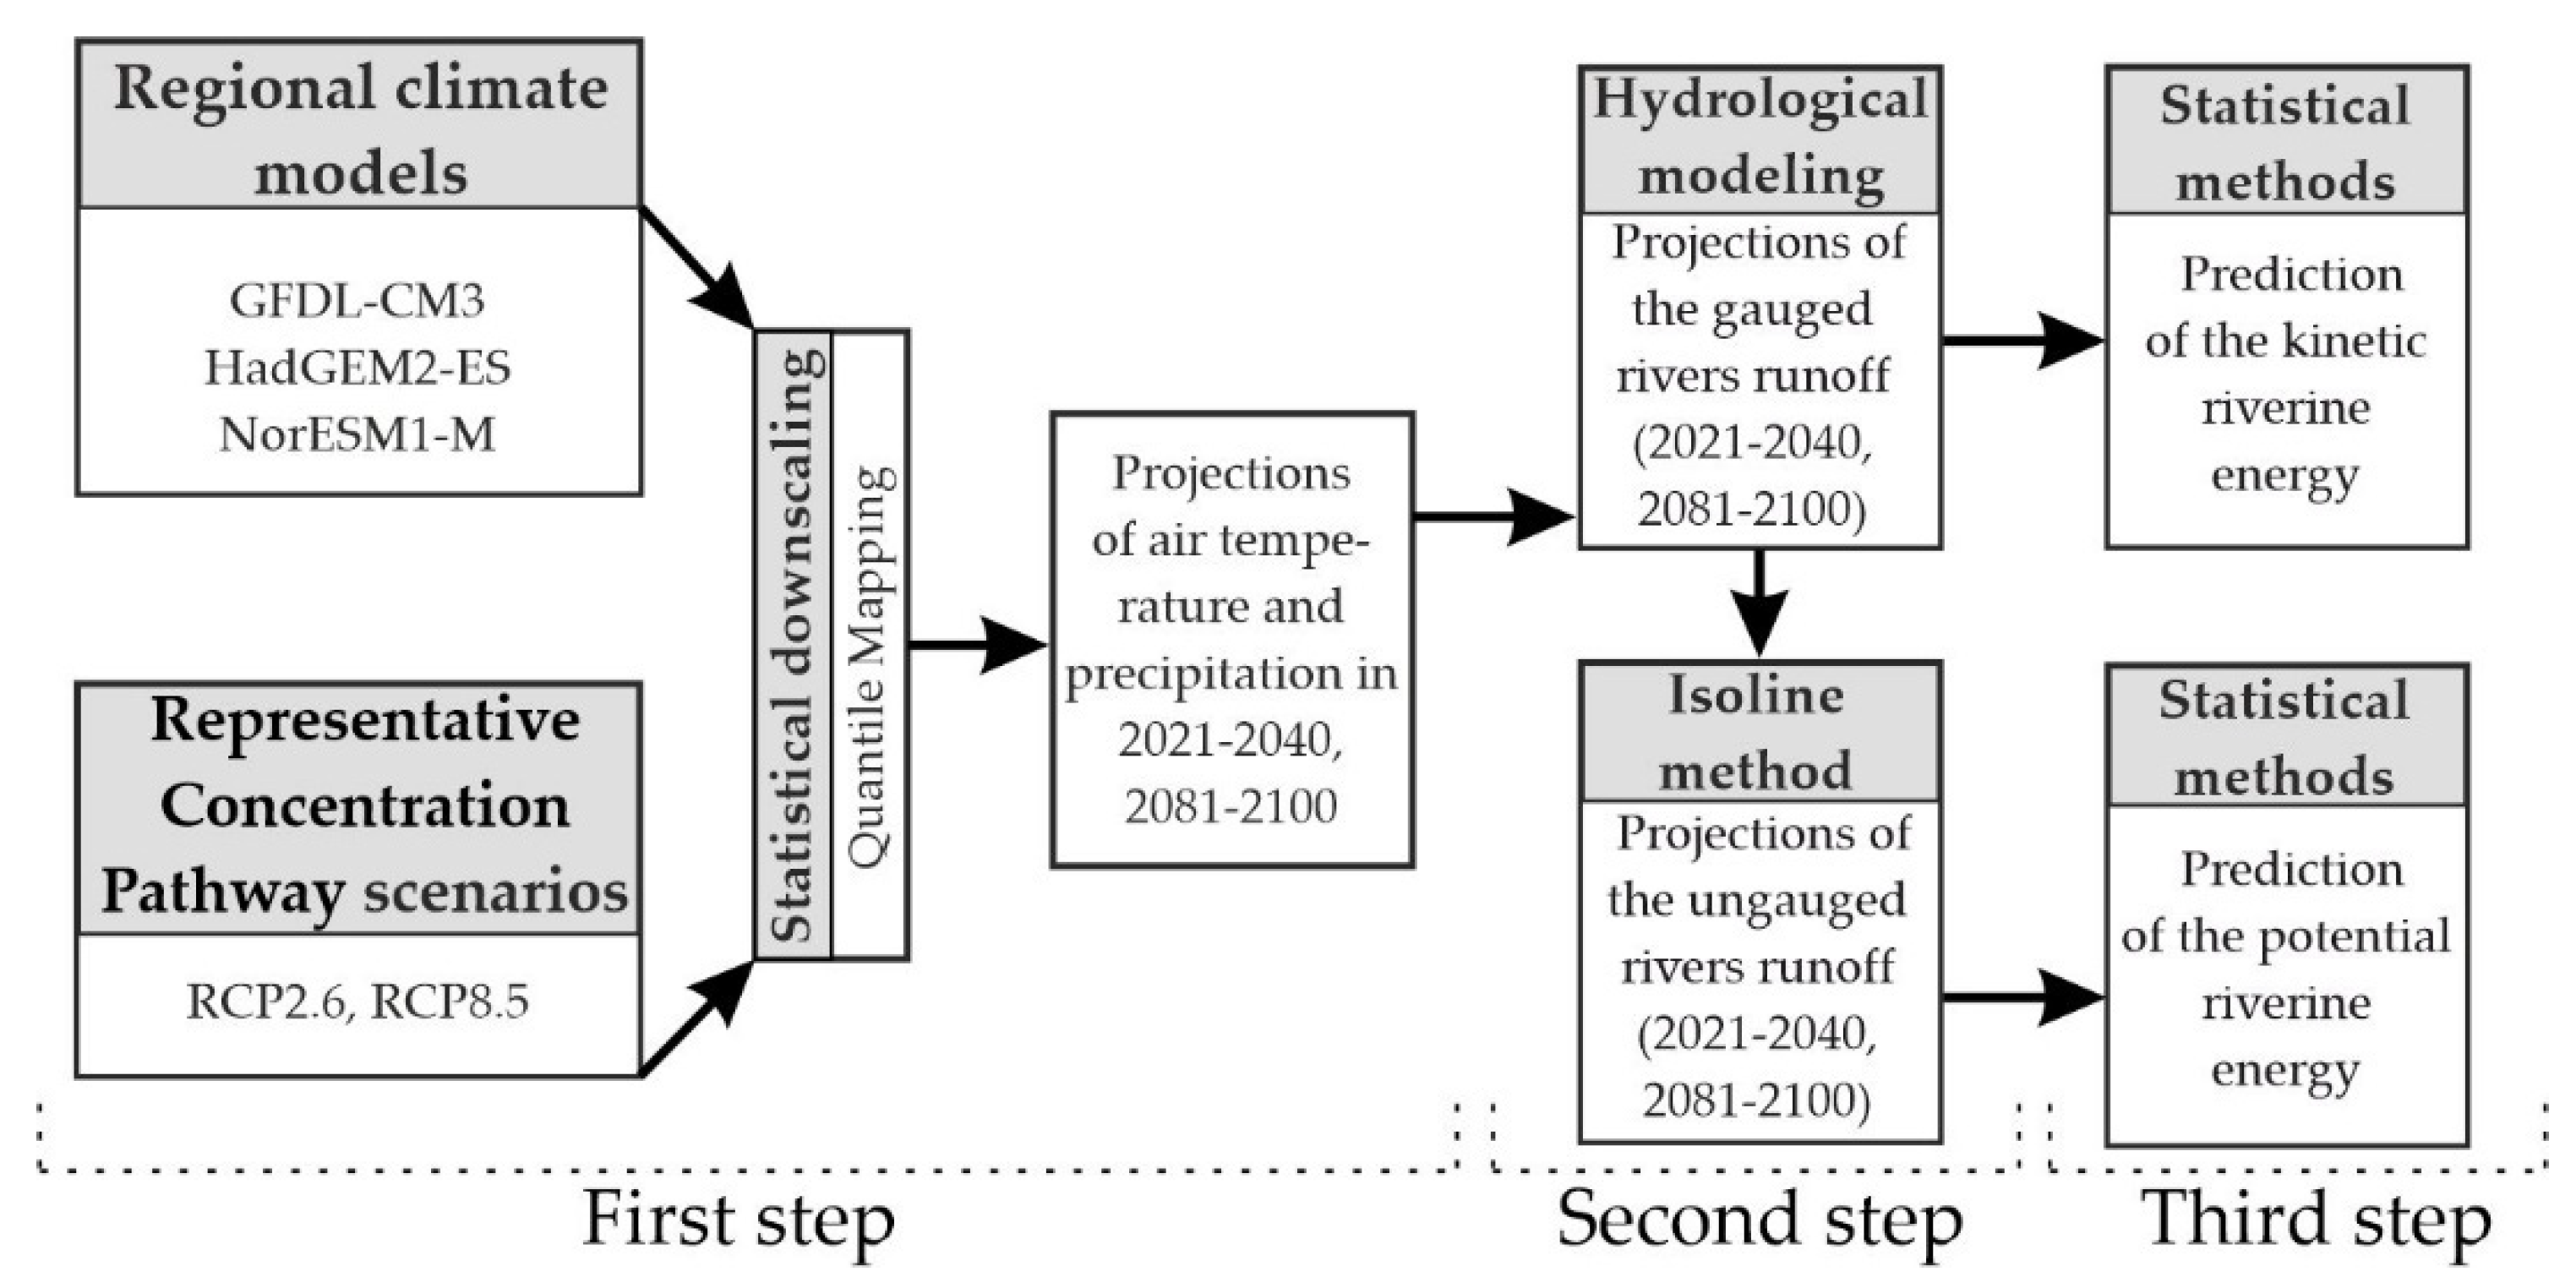
River flow is a key characteristic that is required for the assessment of river kinetic and potential resources. The main steps in the research were as follows (Figure 2): (i) adaptation of climate scenarios data for the Lithuanian territory according to three regional climate models and two RCP scenarios; (ii) evaluation of projections of gauged and ungauged rivers runoff under climate scenarios for two periods of the near (2021–2040) and far future (2081–2100); (iii) evaluation of projections of kinetic and potential riverine energy in the 21st century.
2.2.1. Preparation of Regional Climate Models Data
Air temperature (T, °C) and precipitation (P, mm) data extracted from three regional climate models were used to simulate river runoff and to evaluate its projections in the future. The projections were prepared using two Representative Concentration Pathway scenarios: optimistic (RCP2.6) and pessimistic (RCP8.5) [18]. Adaptation of climate models data (air temperature and precipitation) for the Lithuanian territory was performed using the quantile mapping method. This method eliminates systematic errors in climate model data [20]. The nonparametric empirical quantile method is based on the concept that there is a transformation h, described by the following equation [21,22]:
where StOBS is the observed meteorological parameter, StCM RP is the climate model output for the reference period, ECDFOBS is the empirical cumulative distribution function for the observed period, ECDFCM RP is the empirical cumulative distribution function for the climate model reference period, and StCM Fut is a meteorological parameter, which is modeled by the climate model for the future period. All estimated results were compared with the values of the reference period (1986–2005).
2.2.2. Runoff Projections of the Gauged and Ungauged Rivers Catchments
The HBV model was used to simulate the runoff of gauged Lithuanian rivers. HBV model calculations were performed in three steps, estimating (1) precipitation amount entering the ground, (2) slope runoff, and (3) runoff in the watercourse and runoff transformation. This model has previously been successfully applied in Lithuanian conditions [23,24,25]. HBV is based on a water balance equation [26]:
where P is precipitation, E is evaporation, Q is discharge, SM is soil moisture, SP is snow pack, UZ is upper groundwater zone, LZ is lower groundwater zone, and V is lake or dam volume.
The daily values of Q in the Lithuanian river catchments from 25 water gauging stations (WGS) and of T and P from 15 meteorological stations (MS) (Figure 1) were used to create hydrological models. Information about the modeled catchment area, presence of lakes and forests, mean elevation (above sea level) of the area, and hydrometeorological data from WGS and MS were required as well. Main output data of the HBV model were time series of daily water discharge in the modeled river catchments.
The period from 1986 to 1995 was selected for the model calibration, whereas the period of 1996–2005 was used for validation. The calibration procedure consisted of changing model calibration parameters and comparing calculated discharge values with the measured ones. There are two ways for the evaluation of the calibration results [26]: (1) by visual comparison of hydrographs of computed and measured discharge values and (2) by calculation of correlation (R) between the observed and simulated discharge as well as by the Nash-Sutcliffe efficiency criterion (NSE) and the relative volume error (RE, %). Ideally, the correlation coefficient R should approach 1, but when it reaches 0.7, the model is considered to be properly calibrated [26]. The hydrological model can be regarded as calibrated when the NSE is not less than 0.5 [27].
When assessing the potential energy resources of ungauged Lithuanian rivers, there is a problem of a lack of hydrological data. Therefore, it was not possible to develop hydrological models for the rivers in which observations were carried out only briefly or not at all. For this reason, a method of specific runoff (q, l s-1 km−2) mapping was chosen to project the runoff of ungauged rivers. Using this method, isoline maps of specific runoff of Lithuanian rivers were created in the following order:
(1) Based on the results of hydrological modeling, monthly, seasonal, and average annual runoffs (Q, m3 s−1) were calculated at the studied WGSs for the periods of 1986–2005, 2021–2040, and 2081–2100 under RCP2.6 and RCP8.5 scenarios;
(2) The discharge of the gauged rivers Q (m3 s−1) was converted to specific runoff q (l s-1 km−2) according to [19]:
where q is the specific discharge, l s-1 km−2, Q is the discharge, m3 s−1, and A is the river catchment area in the conversion place, km2;
(3) Using the Spline method of interpolation (in ArcGIS), isoline maps of monthly, seasonal, and annual q were created for the whole territory of Lithuania for the past (1985–2005) and future (2021–2040 and 2081–2100) periods;
(4) In the ungauged river catchments, specific runoff q was calculated from the coordinates of hydropower plant places in the created isoline maps;
In order to assess the reliability of the created map of specific runoff isolines, four rivers (the Akmena, Lėvuo, Šalčia, and Ūla), having discharge observation data of 1986–2005 and which are not used for the mapping, were selected. These rivers belong to different hydrological regions of Lithuania (western, central, and south-eastern), which are characterized by specific conditions of runoff formation (different precipitation amount, slope, soils, etc.) [28]. Therefore, when verifying the isoline map, it was necessary to test whether the calculated values of monthly, seasonal, and annual specific runoff of the selected rivers for 1986–2005 corresponded to the runoff values extracted from the created isoline map of the specific runoff.
2.2.3. Assessment of Hydropower Resources of Lithuanian Rivers
Assessment of Riverine Hydrokinetic Resources
The authors of this article, together with their colleagues, developed a methodology for the assessment of Lithuanian river hydrokinetic resources and assessed these resources based on historical data [17,29]. However, the work performed did not provide a projection of hydrokinetic resources for the 21st century.
The assessment of hydrokinetic resources was accomplished for three periods: the reference period (1986–2005), against which the results of the projections were compared, and future periods (2021–2040 and 2081–2100). Kinetic resources were assessed in the major Lithuanian rivers (the Nemunas and Neris) and separately in the smaller ones. The assessment of technically available resources (the flow technical capacity obtained from a hydrokinetic device) was made using the following equation [17]:
where PTK is the technical hydrokinetic capacity, W, η is the device power coefficient (average value is 0.30 according to [30]), ρ is the fluid density, kg m−3, v is the flow velocity, m s−1, AD is the device swept area, m2, and N is the number of devices.
The technical hydrokinetic capacity of a given river segment depends on the number of devices (N) used for energy production. The number of turbines in a given river segment of length L (m) was calculated according to [17]:
where N is the number of the devices, L is the segment length, m, B is a part of the river channel width, where the depth is greater than the turbine diameter, m, h is the bed depth equal to the device turbine diameter, m, ETK is the hydrokinetic generation, Wh, and tTK refers to the hydrokinetic devices’ working time, hours.
The next stage of this assessment was the estimation of river segments in the investigated rivers in which the production of hydrokinetic energy is possible. River bed depth (h, m), width (B, m), and flow velocity (v, m s−1) are the main characteristics that determine the suitability of a particular segment for hydrokinetic energy production. The assessment of hydrokinetic energy resources was performed in the river segments with a minimum depth of 0.5 m and a minimum flow velocity of 0.4 m s−1.
In order to evaluate bed depth (h), width (B), and flow velocity (v) in a selected river segment, hydromorphological relationships combining the main flow parameters with their forming factors were proposed. Such relationships were created for Lithuanian small and medium-sized rivers using 1540 discharge measurements of 86 rivers [31]:
where h is the average bed depth, m, B is the average bed width, m, v is the average flow velocity in the cross-section, m/s, is the average annual discharge, m3 s−1, I is the bed slope, k is the discharge modular coefficient, and Qi is the discharge.
Assessment of Potential Hydropower Resources
Potential hydropower resources were assessed at existing hydropower plants, without planning for their future growth. Currently, there are 98 operating hydroelectric power plants (HPP) (Figure 1), which have been built on 57 Lithuanian rivers. The projection of potential hydropower resources was performed using discharge rates derived from the specific runoff isoline maps generated for different future periods.
The potential hydropower resources of the selected HPP were evaluated using the formula [32]:
where PP is the hydropotential capacity, kW, EP is the potential generation, kWh, ΔH is the height of the HPP dam head, m, Q is the monthly discharge (m3 s−1), and tP is the HPP working time, hours (in Lithuania, on average, 4000 h a−1, according to [32]).
PP = 7 ΔH Q
EP = PP tP
3. Results
3.1. Calibration and Validation of Hydrological Models of Gauged and Ungauged Rivers
Hydrometeorological information of the period of 1986–2005 (the reference period) was used to create the model. The 1986–1995 was selected for the model calibration, whereas the period of 1996–2005 was used for validation. The calibration process has to be performed until the correlation coefficient R is the greatest, and the total deviation is the least. The R of the selected river catchments ranged from 0.75 to 0.89 during the calibration period and from 0.60 to 0.83 during the validation period (Table 2). NSE and RE (%) are also very important indicators describing the accuracy of calibration and validation. During the calibration period, the NSE varied from 0.60 to 0.80, and during the validation period it varied from 0.50 to 0.75. Meanwhile, the difference between the measured and modeled discharge (RE, %) was mostly positive during the calibration period and negative by a similar amount during the validation period (Table 2). Taking into account these results, it could be stated that the hydrological models of the selected rivers were properly calibrated and could be applied to project Lithuanian river runoff in the near and far future periods according to different climate scenarios.
The isoline mapping verification method was described in more detail in the methodology (Section 2.2.2.). It compares q, which was determined in two ways: (1) exported from a runoff isoline map using ArcGIS; or (2) calculated using real observation data at a particular WGS. Using the isoline method, the average annual q differed only by −7.7%–+3.8% from the calculated q based on observational data (Table 3). The difference in Q varied from −11.5 to +11.5% in individual seasons. Considering that in practice, the discharge is determined with an error of 40%, the result obtained was reliable and suitable for use in further studies [33,34,35,36].
3.2. Projections of River Runoff
3.2.1. Projections of Runoff in Gauged River Catchments
Runoff projections of the gauged rivers were evaluated using the hydrological modeling method. The reference period’s runoff and its projections in the near and far future were modeled according to an ensemble of three climate models and two RCP scenarios. Changes in the average annual discharge in the future were presented as deviations (%) from the discharge of the reference period (Table 4).
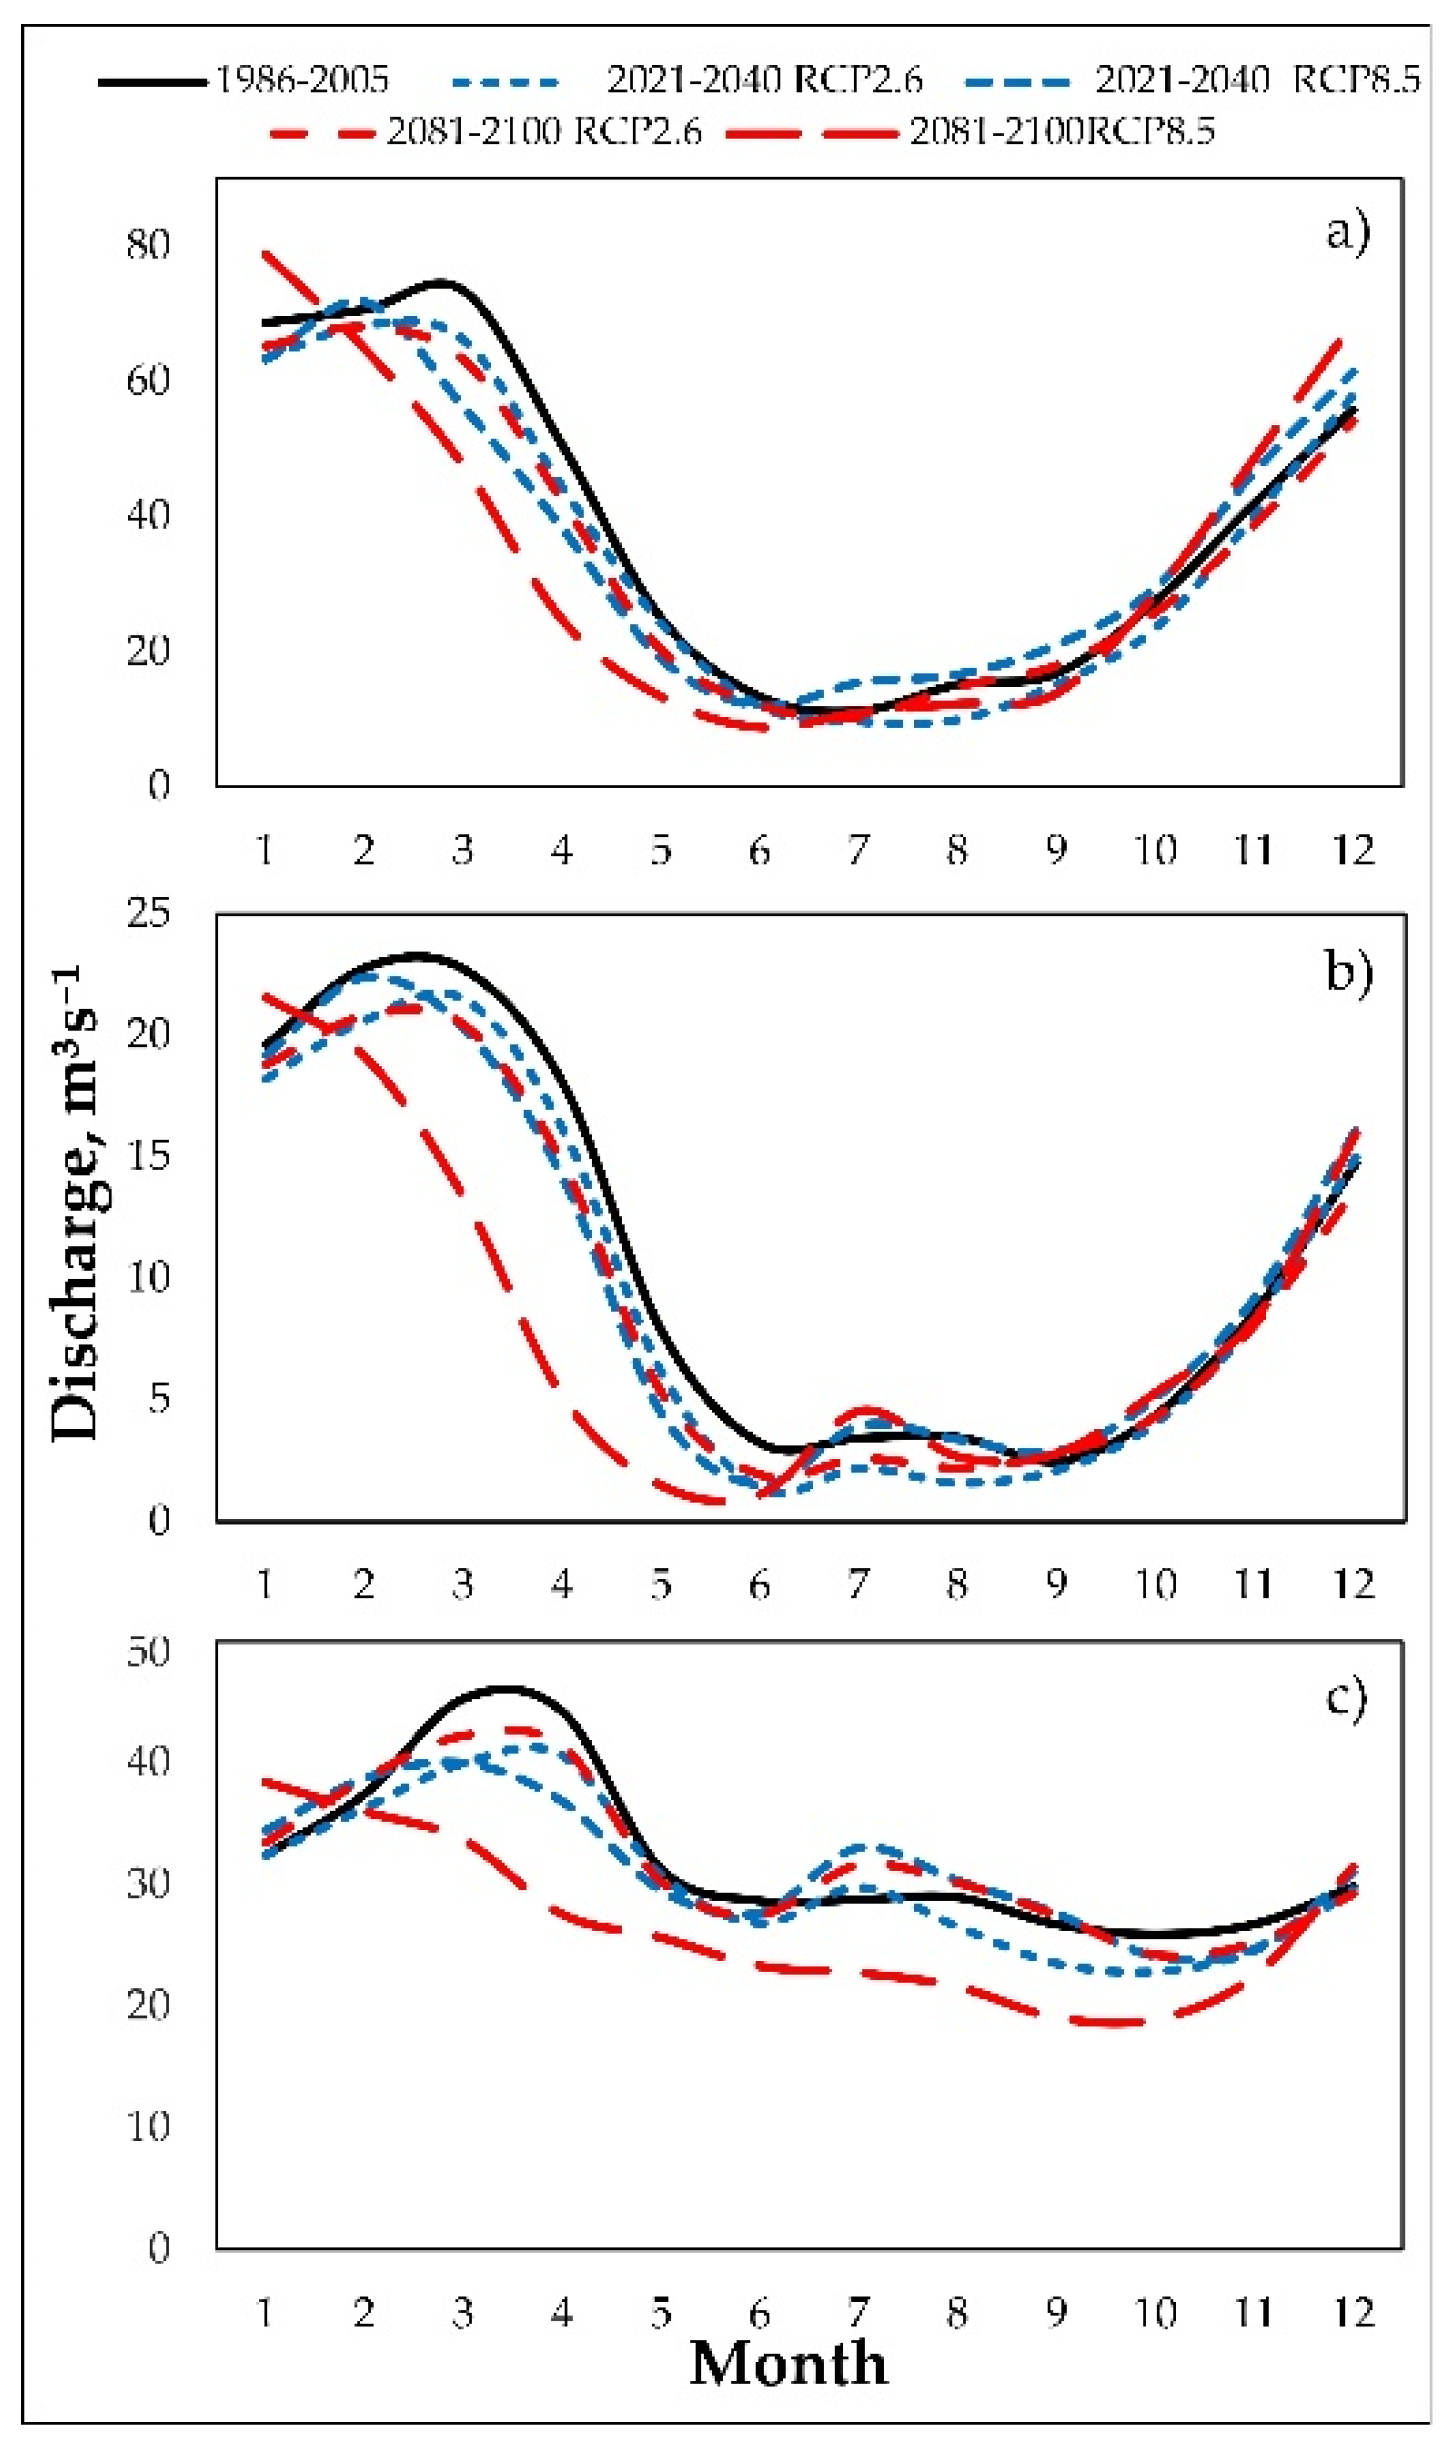
In Lithuania, rivers are divided into three hydrological regions according to their runoff regime: western Lithuania, central Lithuania, and south-eastern Lithuania. Figure 3 shows the rivers’ hydrographs representing these regions: the Jūra from western Lithuania, the Mūša from central Lithuania, and the Merkys from the hydrological region of south-eastern Lithuania.
The hydrological region of western Lithuania receives the highest amount of precipitation in Lithuania (about 850 mm); half of this amount flows into rivers. It rains heavily in autumn and winter; floods in winter are of similar size and, in some cases, even larger than spring floods. The characteristic features of this hydrological region are reflected in the hydrograph of the Jūra River (Figure 3a). As can be seen, this indicates an increased runoff in late autumn and high runoff during the winter season. It also lacks explicit spring floods, while the summer runoff makes up a third of the average annual. The projections showed that, in the near future, the Jūra runoff will decrease from 4.0 to 7.5% as compared to the reference period. Even greater changes are projected in the far future when, according to the RCP2.6 scenario, the Jūra discharge is going to decline by 7.9% and under the RCP8.5 scenario by 10.4%. The largest runoff redistribution is expected in the far future during the spring season, when the expected discharge values may decrease from 15.5% (RCP2.6) to 42.5% (RCP8.5). Significantly smaller changes are likely to occur in the summer season—from 6.2 to 19.3% under the same scenarios. However, in the winter and autumn seasons, the RCP8.5 predicts 8.8% and 5.6% growth, respectively, relative to the reference period.
The hydrological region of central Lithuania is dominated by impermeable clay soils; thus, in winter, almost all the snow melt water runs off into rivers, without being absorbed into the soil, causing severe spring floods. In summer, there is little rainfall, and since the rivers are not fed by groundwater, they are dwindling. All these features are characteristic of the Mūša runoff. In the near future, according to the applied emission scenarios, the Mūša runoff will decrease by 6.6–10.7%, and in the far future, from 11.9% under the RCP2.6 scenario and to 22.7% under the RCP8.5 scenario (Figure 3b). The largest redistribution of the runoff between seasons is likely in the distant future. During the spring season, according to RCP8.5, the discharge is expected to decrease by 59.0%, relative to the reference period. According to the same scenario, the discharge will change slightly (−0.9%) during the winter season, decrease by 17.2% in the summer season, and increase by 6.2% in autumn.
In the hydrological region of south-eastern Lithuania, there are many lakes and forests that naturally regulate river runoff. In addition, the predominant coniferous forests evaporate little water. Rivers flood the least in spring, as water is easily absorbed into the sandy soil. These rivers are abundantly fed by groundwater, so they do not dry up, even in dry summers. Due to the physical-geographical conditions of this hydrological region and the changing climate in the near future, the runoff in the Merkys will be lower from 2.2 to 5.8% compared to the reference period. However, at the end of the century, it will change more significantly and will lower from 1.2 (RCP2.6) to 16.9% (RCP8.5) (Figure 3c). During the same period, significant seasonal runoff changes are expected in the Merkys under the RCP8.5 scenario. In the winter season, the runoff will increase to 6.2%, while in spring, summer, and autumn, it will decrease by 28.1%, 21.7%, and 23.8%, respectively, relative to the reference period.
The regularities of the runoff change in the three studied rivers (Figure 3) are typical for other rivers located in the same hydrological region. According to the available data, the least river runoff will change in western Lithuania: in the far future, according to the most pessimistic scenario, the average river discharge may decrease by 10.4%, relative to the reference period. The most unfavorable situation is possible in the hydrological region of central Lithuania, where the decline of the runoff is projected to be up to 31.2%. Meanwhile, in the hydrological region of south-eastern Lithuania, the most significant decrease of the runoff can be 24.6%. It should be emphasized that this region includes two large rivers, the Nemunas and the Neris, the major parts of which are located in Belarus. Thus, the change in their runoff is influenced by the larger basin area and more diverse physical-geographical conditions.
In runoff projections, uncertainty analysis plays a critical role. The uncertainty of Lithuanian river runoff projections was assessed in our previous study [37]. The evaluation of uncertainty due to different sources of origin, such as climate scenarios (RCPs), global climate models (GCMs), and statistical downscaling (SD) methods, was accomplished for the selected Lithuanian rivers from different hydrological regions (western, central, and south-eastern). The near (2021–2040) and far future (2081–2100) projections were developed according to three RCPs, three GCMs, and three SD methods. In the western hydrological region, GCMs were identified as the most dominant uncertainty source (41.0–44.5%) in the runoff projections. Moreover, the uncertainty of runoff projections from central and south-eastern regions of Lithuania was related to SD methods, and the range of uncertainties fluctuated from 39.4% to 60.9%. The rivers selected for the current study belong to the same hydrological regions. The runoff projections for 2021–2040 and 2081–2100 were created using to the same RCP scenarios and two GCMs as in [37]. Therefore, the tendencies of uncertainty assessment in the projections generated in [37] and the current study projections should be similar.
3.2.2. Projections of Runoff in Ungauged River Catchments
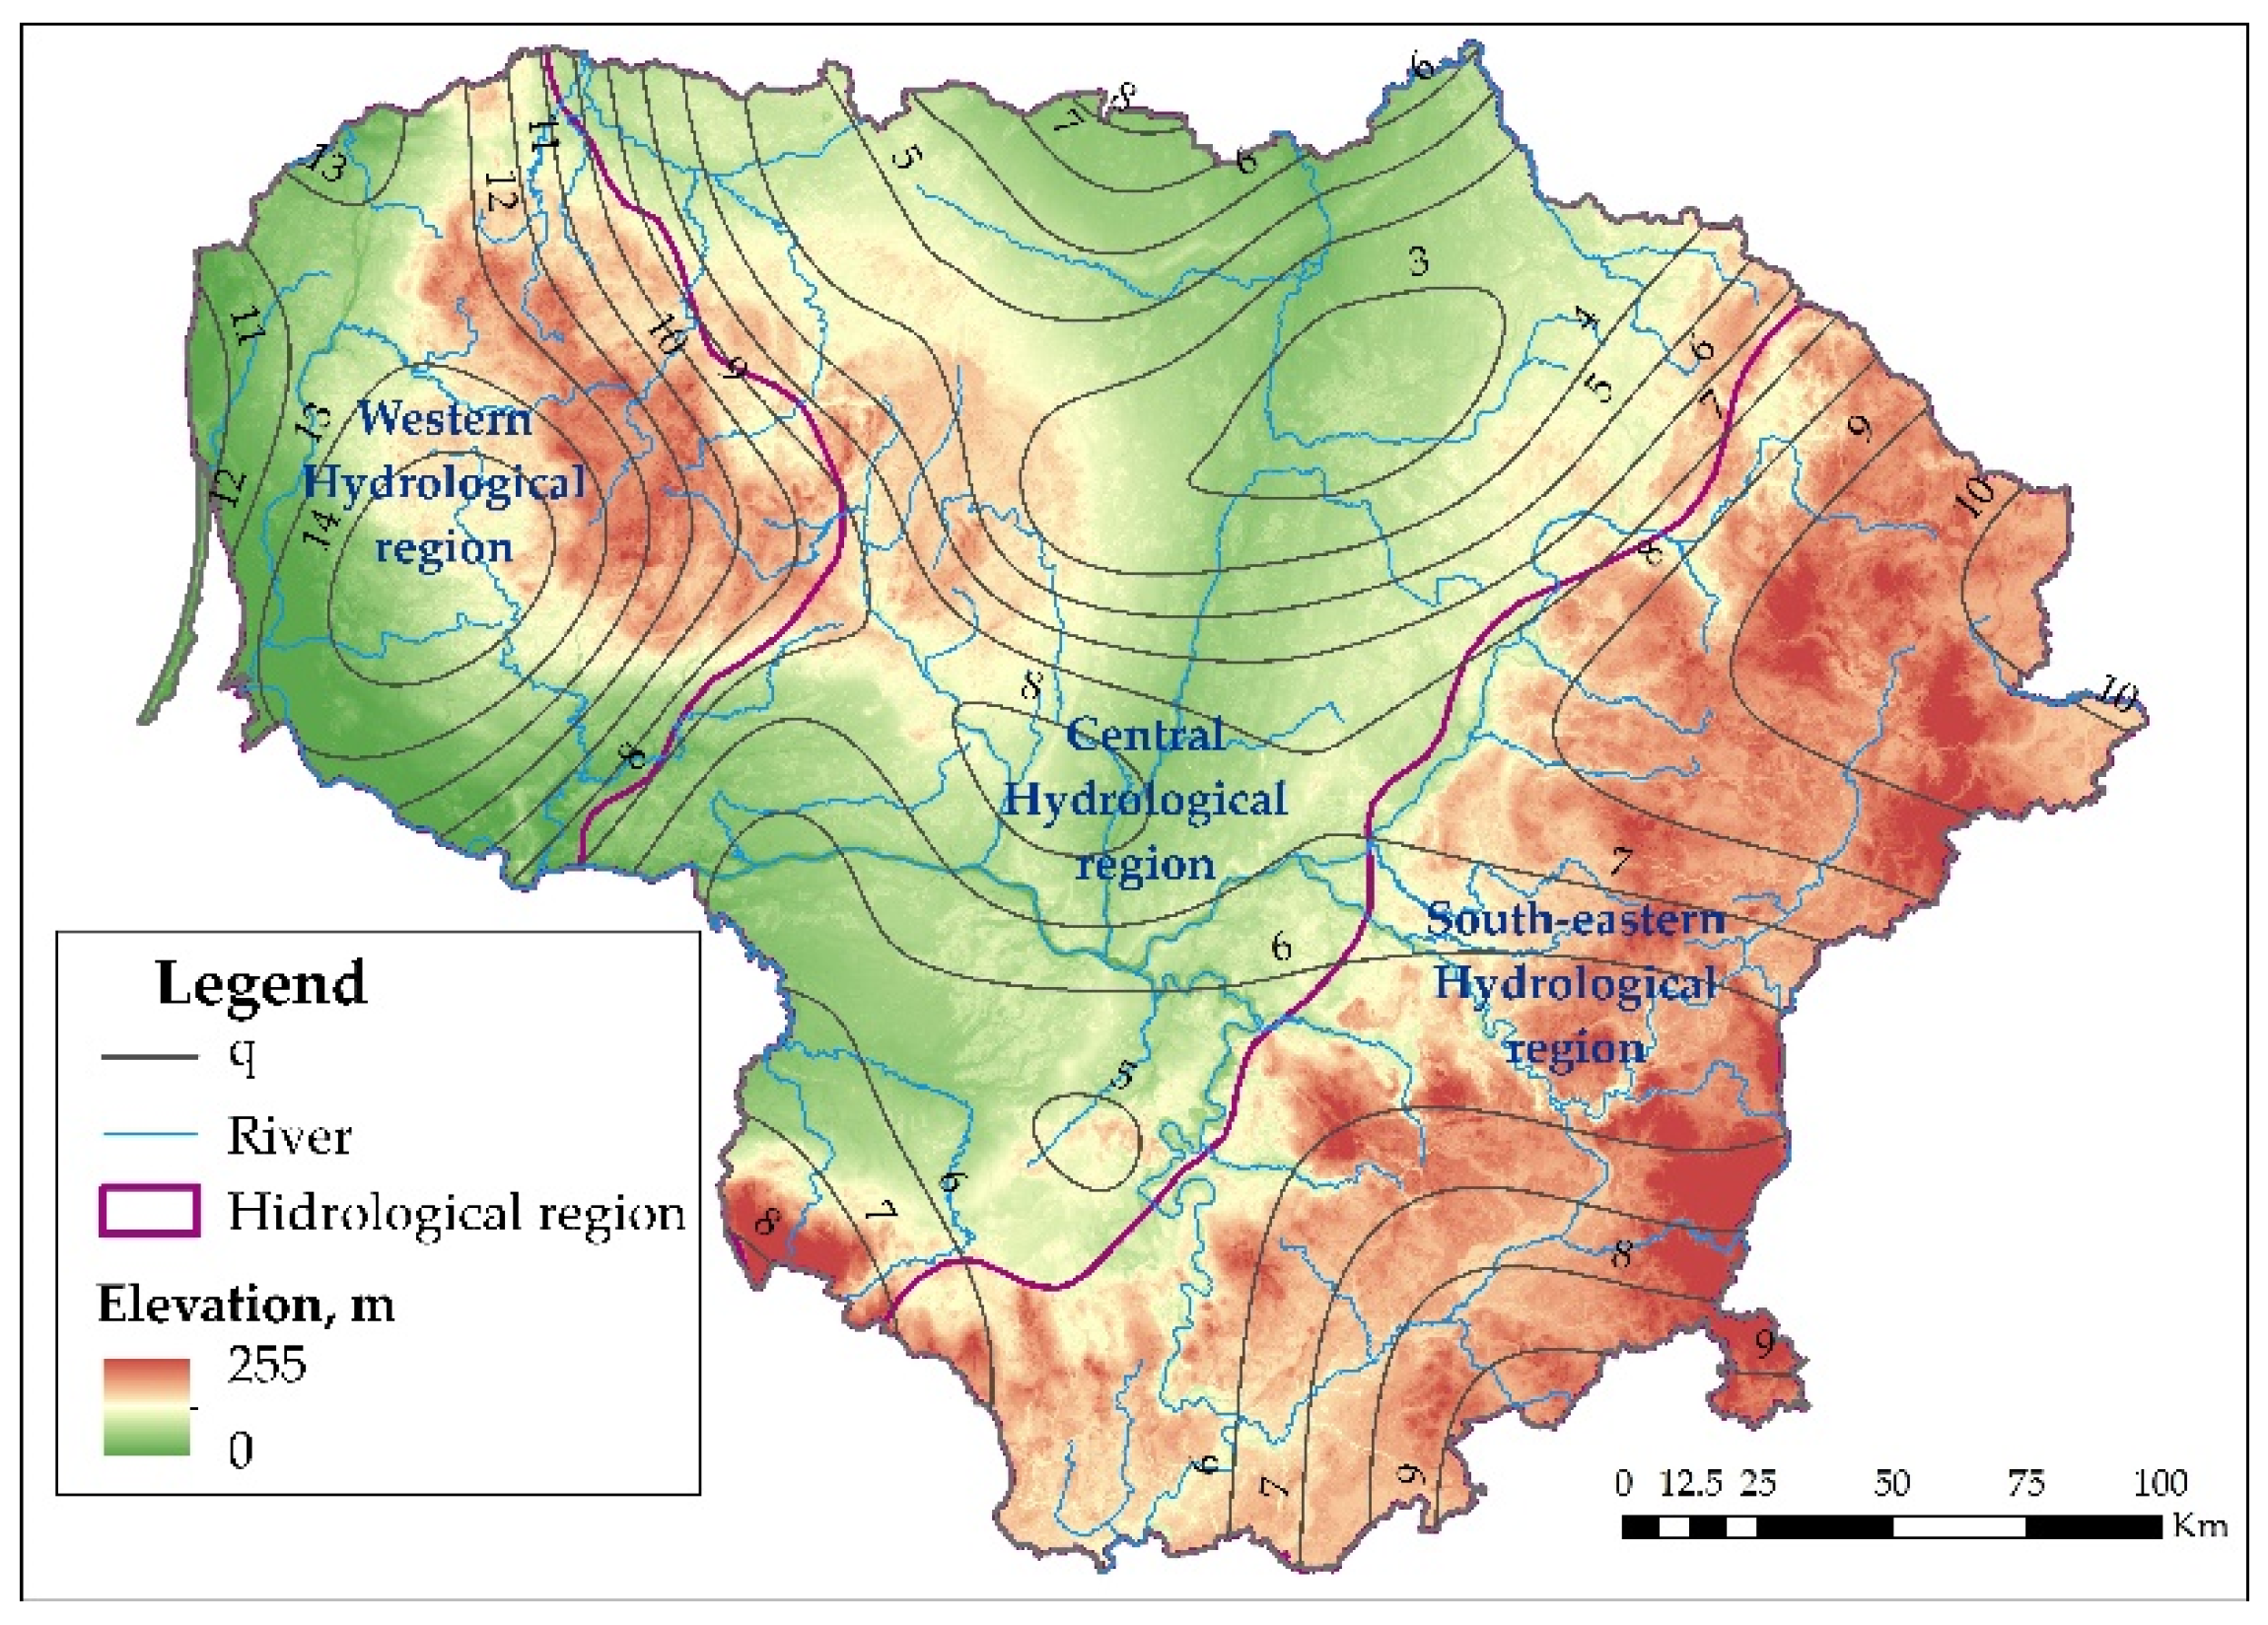
The method of specific runoff (q) mapping was used to project the runoff of ungauged rivers. The average values of q, according to the ensemble of three models in the historic (reference) period (1986–2005), are presented in Figure 4. The distribution of q in the studied area was quite diverse; it varied from 3.0 to 14.0 l s-1 km−2 (Figure 4). The observed differences were determined mainly by physical-geographical conditions. In the hydrological region of western Lithuania, there was more precipitation, high river slopes, and better conditions for fast water drainage; therefore, here, q varied from 8.0 to 14.0 l s-1 km−2. The specific runoff gradually decreased, shifting to the hydrological region of central Lithuania. The slopes of the rivers in this region are small and impermeable soils are widespread, which facilitated more evaporation, so in this region, the range of q ranged from 3.0 to 8.0 l s-1 km−2. Going east (to the south-eastern region), since elevation gets higher and the slopes of the area rise, q gradually increased and varied from 6.0 to 10.0 l s-1 km−2. In this region, the greater values of q were also determined by the higher amount of precipitation (than in the hydrological region of central Lithuania) and abundant underground feeding. Using the q maps, which are given in l s-1 km−2 and Equation (4), we could calculate Q in a specific river of interest.
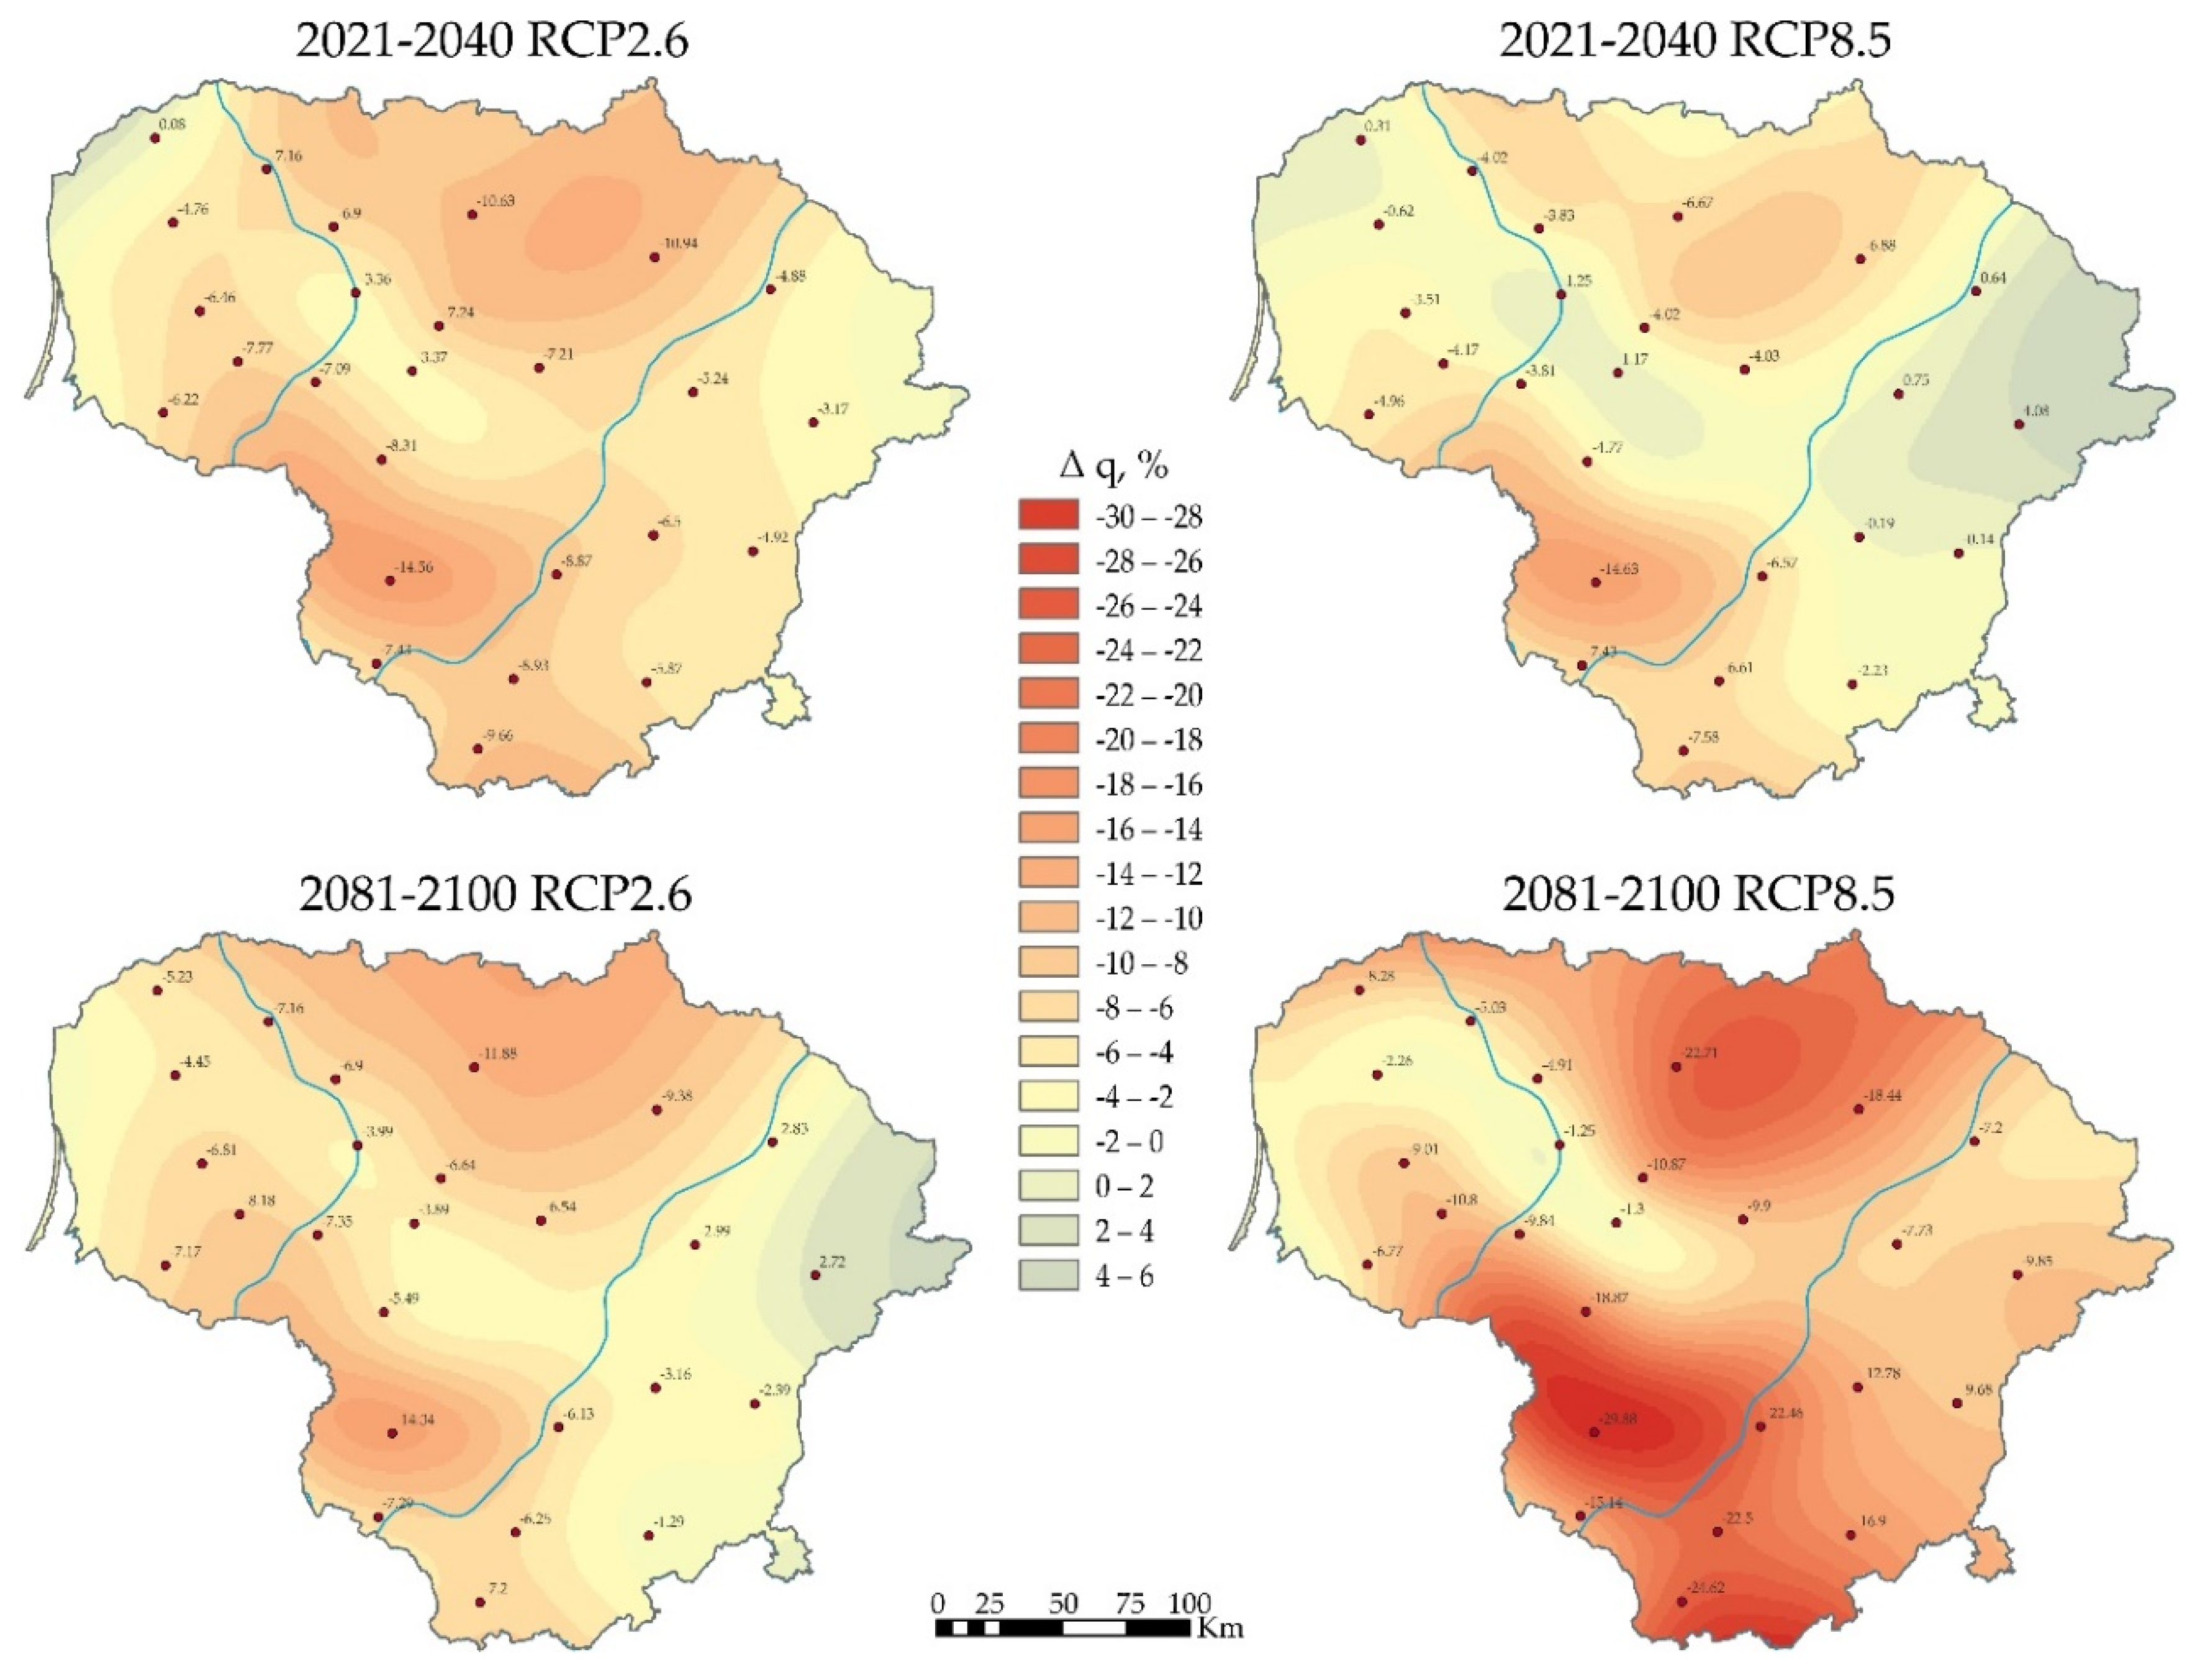
Four maps in Figure 5 show the change (%) in the projections of the average annual specific runoff relative to the reference (1986–2005) period in the three hydrological regions. The smallest changes in q are predicted in the hydrological region of western Lithuania. In the near future, depending on the applied RCP scenario, the average q of the whole region will be 2.2% to 4.5% lower than in the reference period. Small changes in q are likely in the far future as well. Depending on the RCP scenario, the average values of q of the hydrological region will get smaller by 5.5–5.9% according to RCP2.6 and RCP8.5 scenarios, respectively, compared to the reference period. More considerable changes are possible in the hydrological region of south-eastern Lithuania; in this region, in the near future, the average region q will decrease from 0.7% to 5.5% depending on the RCP scenario, and in the far future from 1.8% (under RCP2.6) to 13.3% (under RCP8.5). The biggest changes are projected in the hydrological region of central Lithuania. In the near future, the average q is expected to decline by at least 5.8% to 9.1%, and by the end of the century, from 8.7 (RCP2.6) to 16.6% (RCP8.5) compared to the reference period. Values of the specific runoff (q) differ among rivers in the same hydrological region. This is due not only to local physical and geographical conditions, which are heterogeneous in individual hydrological region, but also to microclimatic features.
3.3. Projections of River Kinetic Energy
The assessment of kinetic energy resources of Lithuanian rivers was performed by applying technical restrictions, according to which the depth of the river bed must be greater than 0.5 m, and the flow velocity must exceed 0.4 m s−1. These two minimum conditions must be met for hydrokinetic turbines (devices that convert the kinetic energy of flowing water into electricity) to be installed in the studied river segments. During this study, the kinetic energy resources of the main Lithuanian rivers (excluding the major rivers Nemunas and Neris) were estimated, which amounted to 242 GWh a−1 in the reference period (Table 5).
In the hydrological region of western Lithuania, the hydrokinetic energy resources are projected to decrease the least (Table 5). In the near future, the Bartuva River resources will hardly change, while in other rivers of this region, they are expected to decline to 9%. In the long run, hydrokinetic resources could decrease by up to 12%.
In central Lithuania, the riverine kinetic resources will shrink the most. Smaller changes in hydropower are projected in the near future (19%); meanwhile, at the end of the century, the resources of the Lėvuo, Mūša, and Šešupė rivers may decrease very significantly—in the case of the RCP8.5 scenario, by 25.9%, 27.4%, and 36.2%, respectively, compared to the reference period.
In the near future, both positive and negative changes in the projections have been identified in the hydrological region of south-eastern Lithuania—from −7.2 to 1.5%. However, in the distant future, in the case of the RCP8.5 scenario, a decrease in this energy from 6.1% (in the Šventoji) to 19.4% (in the Merkys) compared to the reference period is possible.
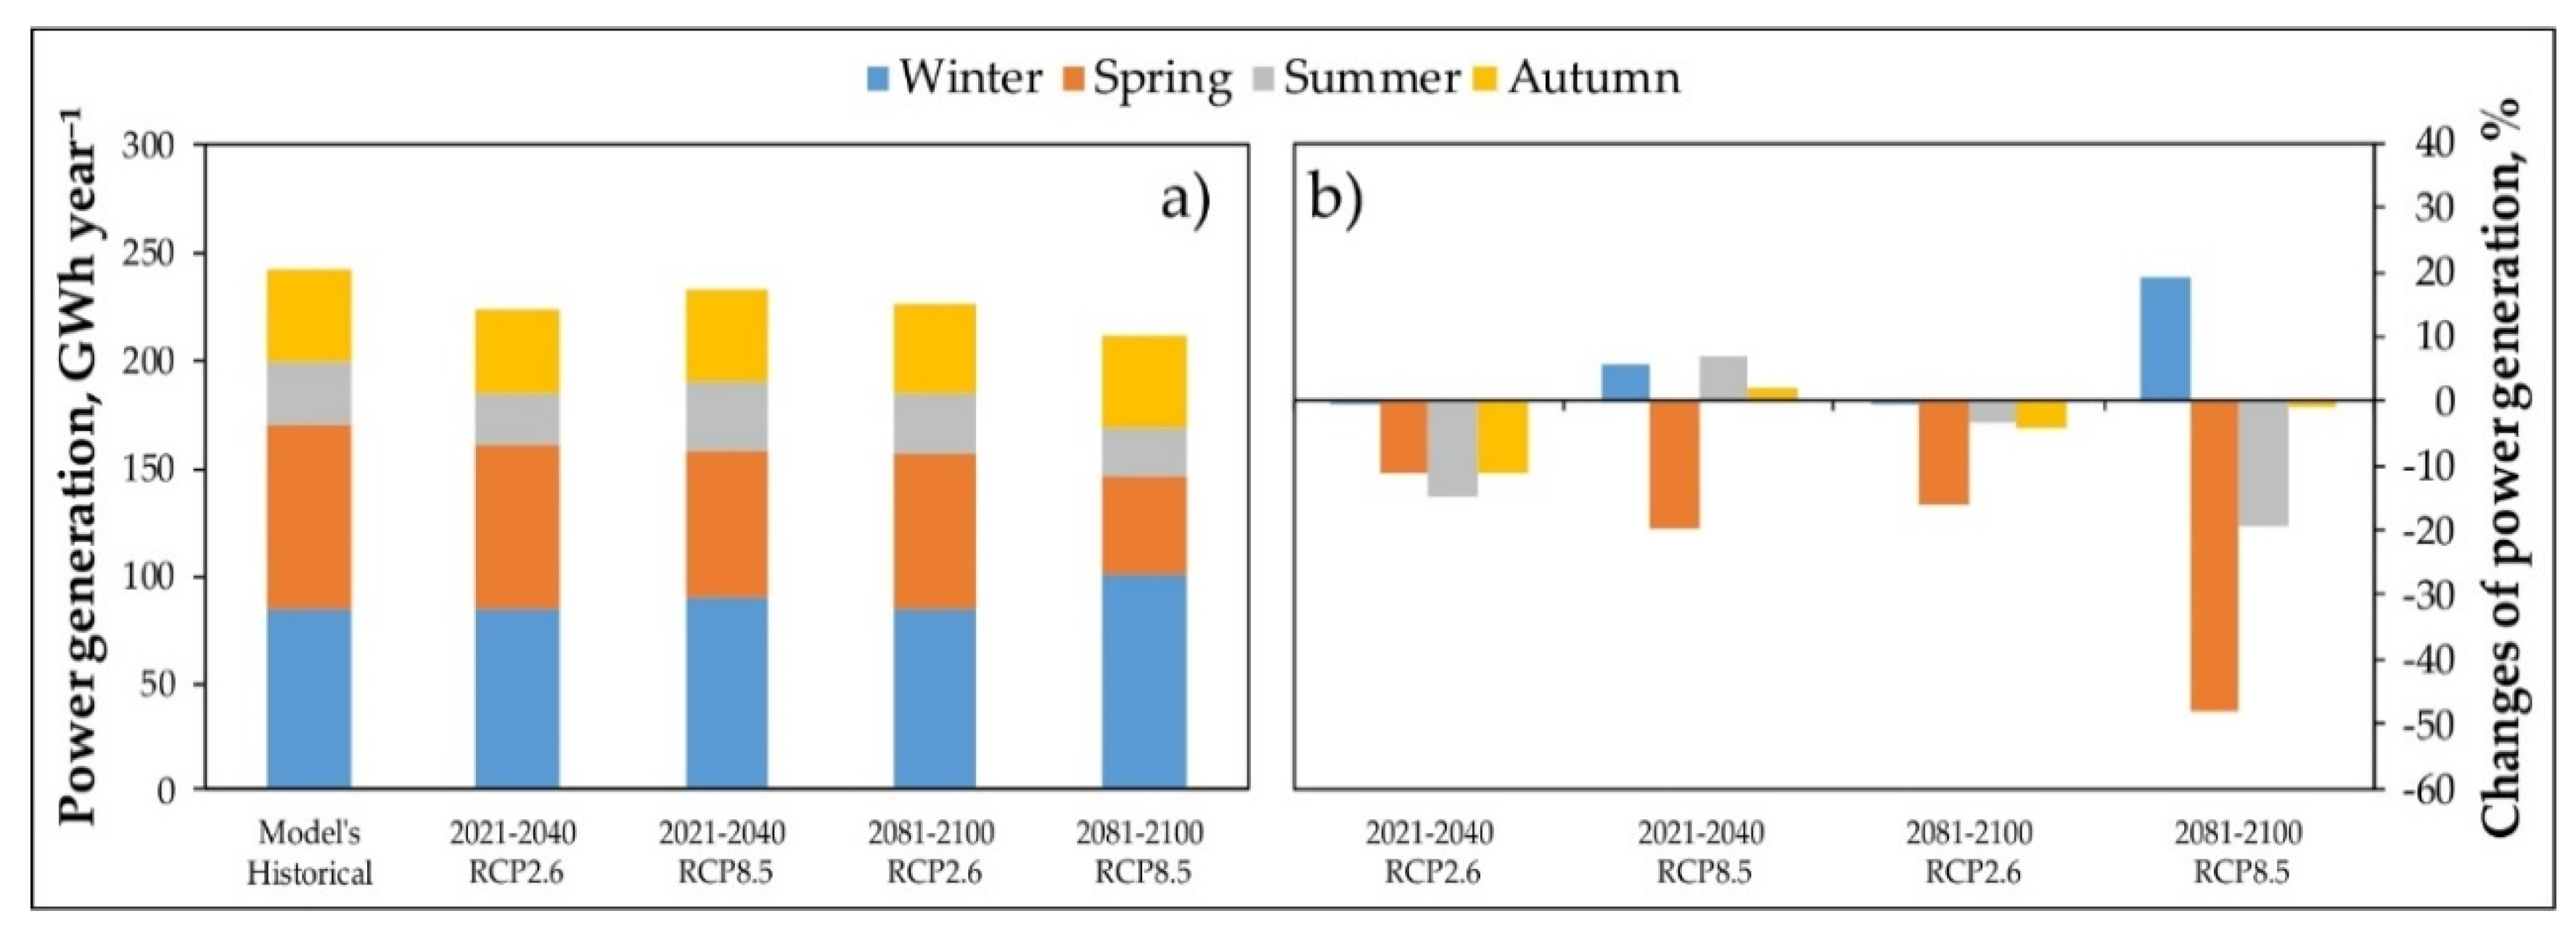
The assessment of the projections of the total kinetic energy resources of Lithuanian rivers (excluding the Nemunas and Neris) indicated a decrease of 3.8–7.9% in the near future and 6.9–12.8% in the far future under the RCP2.6 and RCP8.5 scenarios, respectively, compared to the reference period (Figure 6a). Not only annual but also seasonal changes in kinetic resources are projected.
In both future periods, under both RCP scenarios, hydrokinetic resources will likely decrease (by 11.3–47.9%) during the spring season, but will increase during the winter season (up to 19.1%). The decline of the resources is also expected during the summer season due to reduced river flow rates and depth. These trends in the change of hydrokinetic resources are determined by the projected redistribution of the river runoff between seasons in the future.
The two largest rivers in Lithuania, the Nemunas and Neris, have favorable hydrokinetic energy generation conditions due to a high flow rate and depth. If hydrokinetic turbines were installed along the entire length of these rivers, it would be possible to produce 1109 GWh a−1 (Table 5). In the near future, the Nemunas and Neris rivers’ total kinetic resources are projected to decrease from 5.0 to 7.5%, depending on the chosen RCP scenario. In the long term, the changes will be even more significant from 6.6% (RCP2.6) to 15.1% (RCP8.5) compared to the reference period (Figure 7a). The seasonal variation trends of the Nemunas and Neris rivers’ kinetic resources were similar to those found for smaller rivers (Figure 7b).
3.4. Projections of River Potential Energy
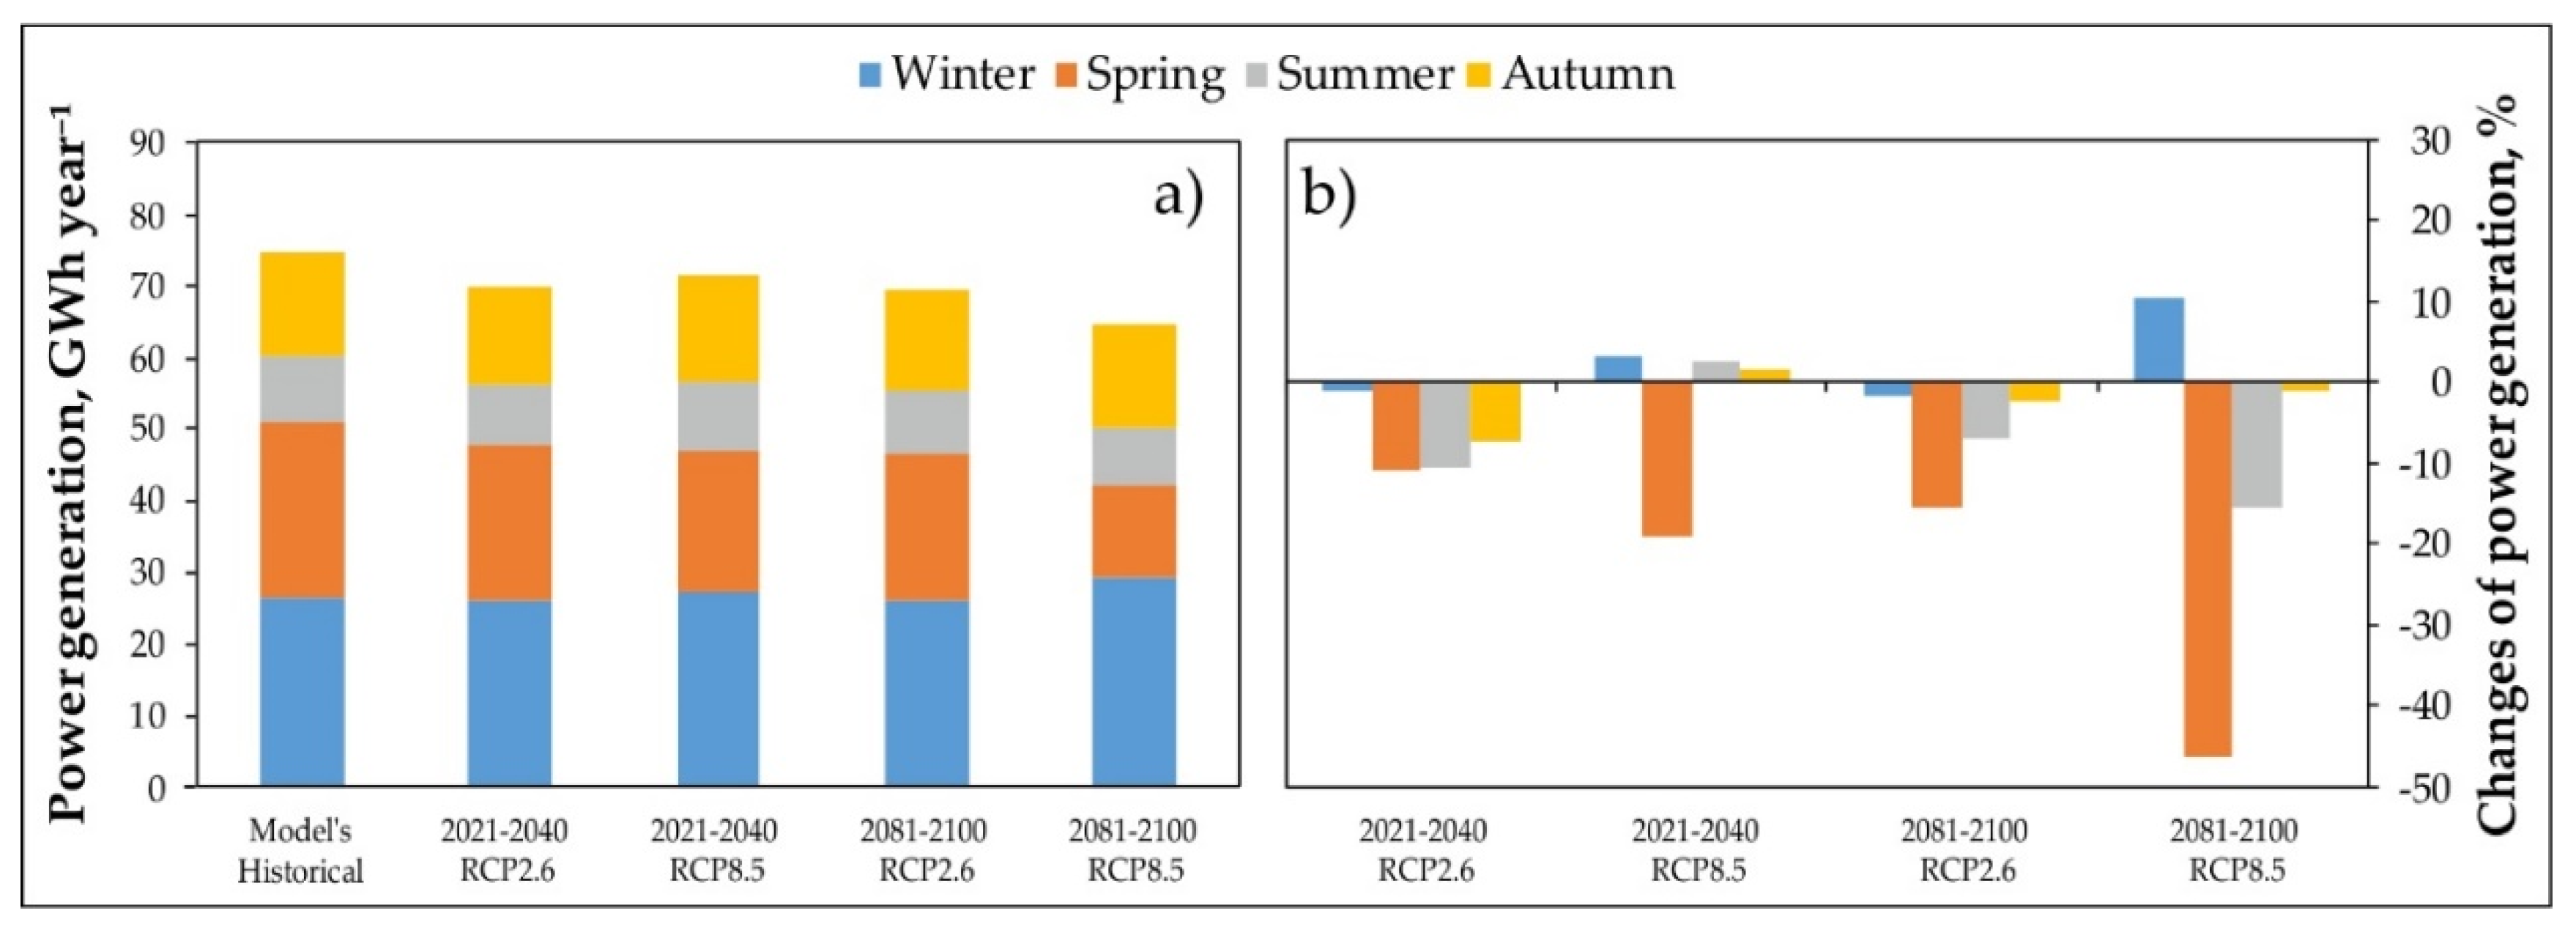
During the reference period, 97 small HPPs generated 75 GWh a−1 of electricity. In 2021–2040, depending on the RCP scenario, the hydropower production of small hydropower plants is projected to decrease from 4.5% to 8.6% compared to the reference period. In 2081–2100, an even larger decrease in hydropower is expected: from 7.1% (RCP2.6) to 13.7% (RCP8.5) (Figure 8a).
An analysis of the seasonal energy production revealed the greatest changes in spring and summer (Figure 8b). According to the applied scenarios, the production will decrease to 19.3% in the spring season and to 10.8% in the summer season in the near future. In the far future, compared to the reference period, the largest changes are possible under the RCP8.5 scenario, which projects an increase of 10.4% during the winter season, a decrease of 46.4% and 15.4% in the spring and summer seasons, respectively, and an only slight change in autumn.
The largest HPP of Lithuania is built on the Nemunas River in Kaunas. It is significant for the Lithuanian energy system because of the amount of electricity produced and as a provider of the system services and contributor, ensuring the system’s stability. This is the only power plant that can restore the power system in an accident (black start). In 1986–2005, Kaunas HPP produced 386 GWh a−1 of electricity. The projections indicated that the hydropower production of Kaunas HPP would decrease from 6.9% (RCP2.6) to 11.4% (RCP8.5) in the near future (Figure 9) and decline from 7.4% to 30.6% under the selected scenario in the far future. As shown in Figure 9, electricity production will gradually decrease during spring (up to 44%) and increase slightly during the winter season (8%). These changes are expected to occur due to the altered runoff in the Nemunas River.
4. Discussion and Conclusions
This study set out to assess the future potential of hydropower resources in the Lithuanian river catchments. Two challenges accompanied the investigation: projection of ungauged river runoff and assessing the total potential of hydroelectric energy according to the new climate scenarios.
The projection of hydropower resources is a complex process. When managing water resources, water specialists often face the problem of insufficient data or a complete lack of data from hydrological observations. For the present assessment of the total potential of hydroelectric energy, it was necessary to include the runoff data of ungauged rivers. Information transfer from gauged to ungauged Lithuanian river catchments was performed using isoline maps created by interpolating specific runoff derived from the hydrological modeling. Such spatial proximity approach is one of the earliest and most widely used regionalization methods [38,39,40]. This method enabled us to get the data of ungauged catchments necessary for the projection described in the paper. The average annual specific runoff differed only by −7.7%–+3.8% from the calculated one, based on observational data using the isoline method. That confirms that the selected regionalization scheme was successful.
The effects of climate change on the hydrological regime of rivers are well studied. Due to changing precipitation and air temperature patterns in the Baltic Sea basin, alterations in the annual and seasonal runoff distribution are observed and they are projected to continue in the future [41,42,43,44,45]. The aforementioned major drivers result in higher winter runoff and lower runoff during other seasons. However, in different regions of the planet, runoff projections may vary due to dissimilarities in natural (primarily climatic) conditions [46,47,48,49,50]. The present study results demonstrate that even among different hydrological regions of Lithuania, river runoff projections may differ. The most significant and intimidating changes are likely to occur under the most pessimistic scenario (RCP8.5) at the end of the 21st century. In the rivers of the hydrological region of western Lithuania, the runoff will decrease from 4.5 (RCP2.6) to 10.4% (RCP8.5), in central Lithuania from 4.0 (RCP2.6) to 31.2% (RCP8.5), and in south-eastern Lithuania from 1.3 (RCP2.6) to 24.6% (RCP8.5) relative to the reference period. The central Lithuanian hydrological region will experience the greatest decline of runoff according to all projections and in both the near and far future periods. This finding corresponds with a previous study [51] that highlighted vulnerability and a high risk of an increasing number of rivers drying up in response to climate change in this particular hydrological region.
Changing climate and runoff patterns provide additional uncertainty for hydropower generation. IPCC Special Report on Renewable Energy Sources and Climate Change Mitigation [13] states that the impacts of climate change on hydropower generation are likely to be small on a global basis. However, still significant regional changes in river flow volumes and timing may pose challenges for planning. Hamududu and Killingtveit [52] assessed that, globally, hydroelectric energy generation is predicted to change very little (by 0.46 TWh, i.e., less than 1% of the 2005 generation level) by the year 2050. According to Turner et al. [53], by the end of the century, depending on the used general circulation model, a change in net global hydropower production of between −8% and +5% under RCP8.5 is projected. Lehner et al. [54] estimated, for the whole of Europe, a decline of the gross hydropower potential by about 6% by the 2070s according to the moderate climate and global change scenario. The present results demonstrate a clear shrink of hydropower potential in Lithuania due to the already discussed decline of river runoff. In 2081–2100, small hydropower plants’ energy production is expected to lower from 7.1% (under RCP2.6) to 13.7% (under RCP8.5), whereas the reduced river runoff in spring will result in a decrease of almost 50%. In the only large Kaunas HPP, a decline from 7.4% to 30.6%, depending on the scenario in the far future, is projected. Such a decrease in Kaunas HPP electricity production is 1.6 times higher than the annual electricity production of all small hydropower plants. Thus, the loss of such energy would be significant for Lithuanian hydropower production. This estimation is also crucial concerning the possibilities of future development of small hydropower. In neighboring Latvia, it has been assumed that a projected decrease of the mean annual river runoff [41] will bring negative changes to hydropower supply as well, whereas in north Estonia, the climate change impact on hydropower potential is likely to be positive [55], likewise in Norway [7].
An object of the vast majority of studies on hydropower resources are conventional power plants that harness the potential energy of dammed water. Hydrokinetic energy is one among promising renewable energy resources; however, it has yet to be proven commercially viable [56]. Although some hydrokinetic power potential assessments have been accomplished and are available publicly, the authors of the present paper could not find any study dedicated to projections of this riverine hydroelectric energy resource. The current findings revealed that future climate alterations would bring runoff modifications and, consequently, changes of hydrokinetic power potential. In the near future, the total kinetic resources of two major Lithuanian rivers are projected to decrease from 5.0 to 7.5%, and in the far future period, from 6.6% to 15.1% depending on the chosen RCP scenario. The hydrokinetic resources of the main Lithuanian rivers (excluding the Nemunas and Neris) will decrease from 4.3 (RCP2.6) to 7.8% (RCP8.5) in the near future, while it will decrease twice as much compared to the reference period in the distant future.
As hydroelectric power plants’ development using river potential (head) energy is limited in Lithuania due to environmental constraints, installing kinetic (non-head) hydroelectric power plants could be a great alternative in the future. In general, the Nemunas and Neris might have considerable potential as they have favorable hydrokinetic energy generation conditions due to a high flow rate and depth. Small conventional hydropower generation in smaller rivers should not be developed. In the projected conditions of limited water availability, finding the balance between human (energy production) and environment (suitable habitat for aquatic species) needs might be very complicated and hardly achievable. The provided projections could help understand what kind of benefits and challenges water resource managers may face in the future and how to transform the country’s electricity sector development into something more sustainable.
Author Contributions
D.J., J.K. and G.A. designed the study; G.A., D.J. and D.Š. contributed to data collection and analysis; D.J. and G.A. did modelling of processes; all authors contributed to the writing and editing of the manuscript. All authors have read and agreed to the published version of the manuscript.
Funding
This research has received funding from the Research Council of Lithuania (LMTLT), agreement No. S-SIT-20-3.
Conflicts of Interest
The authors declare no conflict of interest.
Abbreviations
| HBV | Hydrological model developed by the Swedish Department of Climate; |
| RCP | Representative Concentration Pathway is a greenhouse gas concentration trajectory proposed by the Intergovernmental Panel on Climate Change; |
| RCP2.6, RCP8.5 | Representative Concentration Pathway scenarios; |
| EU | European Union; |
| RES | Renewable energy sources; |
| WGS | Water gauging stations; |
| MS | Meteorological stations; |
| IPCC AR5 | The Fifth Assessment Report of the United Nations Intergovernmental Panel on Climate Change; |
| ICHEC-EC-EARTH | Regional climate in the Great Lakes Water Balance; U.S. Gmodel developer by the Irish Centre for High-End Computing; |
| MOHC-HadGEM2-ES | Regional climate model developer by the Met Office Hadley Centre for Climate Science and Services, United Kingdom; |
| MPI-M-MPI-ESM-LR | Regional climate model developer by the Max Planck Institute for Meteorology, Germany; |
| EURO-CORDEX | The European branch of the CORDEX initiative and will produce data of the climate simulations in the 21st century; |
| ArcGIS | A geographic information system software developed by the Environmental Systems Research Institute, United States of America; |
| HPP | Hydropower plant; |
| R | Correlation coefficient; |
| NSE | Nash–Sutcliffe model efficiency coefficient; |
| RE | Difference between the measured and modeled discharge, %. |
References
- The European Parliament and Council of the European Union. Directive (EU) 2018/2001 on the promotion of the use of energy from renewable sources. Off. J. Eur. Union 2018, L328, 82–209. [Google Scholar]
- Eurostat. Wind and Water Provide Most Renewable Electricity. 2020. Available online: https://ec.europa.eu/eurostat/en/web/products-eurostat-news/-/DDN-20200129-1 (accessed on 20 October 2020).
- IEA. Key World Energy Statistics 2020; OECD Publishing: Paris, France, 2020. [Google Scholar] [CrossRef]
- IHA. Hydropower Status Report. Trends and Insights; International Hydropower Association: London, UK, 2019.
- United States Department of Energy. Effects of Climate Change on Federal Hydropower; The Second Report to Congress; U.S. Department of Energy: Washington, DC, USA, 2017; p. 35. [Google Scholar]
- Jabbari, A.A.; Nazemi, A. Alterations in Canadian hydropower production potential due to continuation of historical trends in climate variables. Resources 2019, 8, 163. [Google Scholar] [CrossRef] [Green Version]
- Koestler, V.; Østenby, A.; Arnesen, F.; Birkeland, C.; Haddeland, I. Climate Change Impact on Norwegian Hydro Power; Report 50-2019; Norwegian Directorate for Water Resources and Energy: Oslo, Norway, 2019; p. 32. (In Norwegian)
- Koch, H.; Vögele, S.; Hattermann, F.F.; Huang, S. The impact of climate change and variability on the generation of electrical power. Meteorol. Z. 2015, 24, 173–188. [Google Scholar] [CrossRef]
- German Advisory Council on the Environment. Pathways towards a 100% Renewable Electricity System; Geschäftsstelle Des Sachverständigenrates Für Umweltfragen (SRU): Berlin, Germany, 2011. Available online: http://www.umweltrat.de/SharedDocs/Downloads/EN/02_Special_Reports/2011_10_Special_Report_Pathways_renewables.pdf?__blob=publicationFile (accessed on 19 October 2020).
- Wagner, T.; Themeßl, M.; Schüppel, A.; Gobiet, A.; Stigler, H.; Birk, S. Impacts of climate change on stream flow and hydro power generation in the Alpine region. Environ. Earth. Sci. 2017, 76, 4. [Google Scholar] [CrossRef] [Green Version]
- Canadian Hydraulics Centre at the NRC. Assessment of Canada’s Hydrokinetic Power Potential: Phase I Report—Methodology and Data Review; Canadian Hydraulics Centre at the NRC: Ottawa, ON, Canada, 2010; p. 72. [Google Scholar]
- Electric Power Research Institute. Assessment and Mapping of the Riverine Hydrokinetic Energy Resource in the Continental United States, Technical Report; EPRI: Palo Alto, CA, USA, 2012; p. 80. [Google Scholar]
- Kumar, A.; Schei, T.; Ahenkorah, A.; Rodriguez, R.C.; Devernay, J.M.; Freitas, M.; Hall, D.; Killingtveit, Å.; Liu, Z. Hydropower. In IPCC Special Report on Renewable Energy Sources and Climate Change Mitigation; Edenhofer, O., Pichs-Madruga, R., Sokona, Y., Seyboth, K., Matschoss, P., Kadner, S., Zwickel, T., Eickemeier, P., Hansen, G., Schlömer, S., et al., Eds.; Cambridge University Press: Cambridge, UK; New York, NY, USA, 2011; pp. 437–496. [Google Scholar] [CrossRef]
- National Energy Independence Strategy of Lithuania, State News, 2012-07-10, No 80-4149. Available online: https://e-seimas.lrs.lt/portal/legalAct/lt/TAD/TAIS.429490/asr (accessed on 20 October 2020).
- Jablonskis, J.; Lasinskas, M. Lithuanian river cadaster (discharges, slopes, capacities). Vilnius Lith. 1962, 3, 640. (In Lithuanian) [Google Scholar]
- Jablonskis, J.; Jurgelėnaitė, A.; Tomkevičienė, A. Hydropower in environment protection context. Power Eng. 2007, 3, 48–56. (In Lithuanian) [Google Scholar]
- Gailiušis, B.; Jakimavičius, D.; Šarauskienė, D.; Jurgelėnaitė, A. Assessment of hydrokinetic resources of small and medium-size rivers: The Lithuanian case. Baltica 2017, 30, 23–30. [Google Scholar] [CrossRef]
- IPCC. Climate Change 2013: The Physical Science Basis. Contribution of Working Group I to the Fifth Assessment Report of the Intergovernmental Panel on Climate Change; Stocker, T.F., Qin, D., Plattner, G.-K., Tignor, M., Allen, S.K., Boschung, J., Nauels, A., Xia, Y., Bex, V., Midgley, P.M., Eds.; Cambridge University Press: Cambridge, UK; New York, NY, USA, 2013; p. 1535. [Google Scholar] [CrossRef] [Green Version]
- Gailiušis, B.; Jablonskis, J.; Kovalenkovienė, M. The Lithuanian rivers. Hydrography and runoff. Lith. Engl. Summ. 2001, 792. (In Lithuanian) [Google Scholar]
- Beyer, R.; Krapp, M.; Manica, A. An empirical evaluation of bias correction methods for palaeoclimate simulations. Clim. Past 2020, 16, 1493–1508. [Google Scholar] [CrossRef]
- Gudmundsson, L.; Bremnes, J.B.; Haugen, J.E.; Engen–Skaugen, T. Technical Note: Downscaling RCM precipitation to the station scale using statistical transformations—A comparison of methods. Hydrol. Earth Syst. Sci. Discuss. 2012, 16, 3383–3390. [Google Scholar] [CrossRef] [Green Version]
- Sunyer, M.A.; Hundecha, Y.; Lawrence, D.; Madsen, H.; Willems, P.; Martinkova, M.; Vormoor, K.; Burger, G.; Hanel, M.; Kriaučiūnienė, J.; et al. Inter–comparison of statistical downscaling methods for projection of extreme precipitation in Europe. Hydrol. Earth Syst. Sci. 2015, 19, 1827–1847. [Google Scholar] [CrossRef] [Green Version]
- Kriauciuniene, J.; Meilutyte-Barauskiene, D.; Rimkus, E.; Kazys, J.; Vincevicius, A. Climate change impact on hydrological processes in Lithuanian Nemunas river basin. Baltica 2008, 21, 51–61. [Google Scholar]
- Jakimavičius, D.; Kriaučiūnienė, J.; Šarauskienė, D. Impact of climate change on the Curonian Lagoon water balance components, salinity and water temperature in the 21st century. Oceanologia 2018, 60, 378–389. [Google Scholar] [CrossRef]
- Akstinas, V.; Meilutytė-Lukauskienė, D.; Kriaučiūnienė, J. Consequence of meteorological factors on flood formation in selected river catchments of Lithuania. Meteorol. Appl. 2019, 26, 232–244. [Google Scholar] [CrossRef] [Green Version]
- SMHI. Integrated Hydrological Modelling System, Manual, Version 5.8; Swedish Meteorological and Hydrological Institute: Norrköping, Sweden, 2005; p. 115.
- Ritter, A.; Muñoz-Carpena, R. Performance evaluation of hydrological models: Statistical significance for reducing subjectivity in goodness-of-fit assessments. J. Hydrol. 2013, 480, 33–45. [Google Scholar] [CrossRef]
- Kriaučiūnienė, J.; Meilutytė-Barauskienė, D.; Reihan, A.; Koltsova, T.; Lizuma, L.; Šarauskienė, D. Variability in temperature, precipitation and river discharge in Baltic States. Boreal Environ. Res. 2012, 17, 150–162. [Google Scholar]
- Jakimavičius, D.; Gailiušis, B.; Šarauskienė, D.; Jurgelėnaitė, A.; Meilutytė-Lukauskienė, D. Assessment of the riverine hydrokinetic energy resources in Lithuania. Baltica 2014, 27, 141–150. [Google Scholar] [CrossRef] [Green Version]
- Lalander, E. Modelling Hydrokinetic Energy Resources for In-Stream Energy Converters. Ph.D. Thesis, Department of Engineering Sciences, Uppsala University, Uppsala, Sweden, 2010; p. 57. [Google Scholar]
- Gailiušis, B. River run-off management in the Lithuanian SSR. Vilnius Lith. 1986, 156. (In Russian) [Google Scholar]
- Punys, P.; Kvaraciejus, A.; Dumbrauskas, A.; Šilinis, L.; Popa, B. An assessment of micro-hydropower potential at historic watermill, weir, and non-powered dam sites in selected EU countries. Renew. Energ. 2019, 133, 1108–1123. [Google Scholar] [CrossRef]
- Winter, T.C. Uncertainties in estimating the water balance of lakes. J. Am. Water Resour. Assoc. 1981, 17, 82–115. [Google Scholar] [CrossRef]
- Sattary, J.; Judeh, W.A.; Warren, S. The impact of measurement uncertainty on the water balance. Water Environ. J. 2002, 16, 218–222. [Google Scholar] [CrossRef]
- Neff, B.P.; Nicholas, J.R. Uncertainty in the Great Lakes Water Balance; U.S. Geological Survey Scientific Investigations Report 2004–5100; U.S. Geological Survey: Reston, VA, USA, 2005; p. 42.
- McMillan, H.K.; Westerberg, I.K.; Krueger, T. Hydrological data uncertainty and its implications. Wiley Interdiscip. Rev. Water 2018, 5, e1319. [Google Scholar] [CrossRef] [Green Version]
- Akstinas, V.; Jakimavičius, D.; Meilutytė-Lukauskienė, D.; Kriaučiūnienė, J.; Šarauskienė, D. Uncertainty of annual runoff projections in Lithuanian rivers under a future climate. Hydrol. Res. 2020, 51, 257–271. [Google Scholar] [CrossRef]
- Oudin, L.; Andre´assian, V.; Perrin, C.; Michel, C.; Le Moine, N. Spatial proximity, physical similarity, regression and ungaged catchments: A comparison of regionalization approaches based on 913 French catchments. Water Resour. Res. 2008, 44, W03413. [Google Scholar] [CrossRef]
- Razavi, T.; Coulibaly, P. Streamflow prediction in ungauged basins: Review of regionalization methods. J. Hydrol. Eng. 2013, 18, 958–975. [Google Scholar] [CrossRef]
- Hong, M.; Zhang, R.; Wang, D.; Qian, L.; Hu, Z. Spatial interpolation of annual runoff in ungauged basins based on the improved information diffusion model using a genetic algorithm. Discrete Dyn. Nat. 2017, 2017, 4293731. [Google Scholar] [CrossRef]
- Apsite, E.; Bakute, A.; Elferts, D.; Kurpniece, L.; Pallo, I. Climate change impacts on river runoff in Latvia. Clim. Res. 2011, 48, 57–71. [Google Scholar] [CrossRef]
- Kayhko, J.; Apsite, E.; Bolek, A.; Filatov, N.; Kondratyev, S.; Korhonen, J.; Kriaučiūnienė, J.; Lindstrom, G.; Nazarova, L.; Pyrh, A.; et al. Recent Change—River Run-off and Ice Cover. Second Assessment of Climate Change for the Baltic Sea Basin; Springer: Heidelberg, Germany, 2015; pp. 99–116. [Google Scholar]
- Stonevičius, E.; Rimkus, E.; Štaras, A.; Kažys, J.; Valiuškevičius, G. Climate change impact on the Nemunas River basin hydrology in the 21st century. Boreal Environ. Res. 2017, 22, 49–65. [Google Scholar]
- Piniewski, M.; Szcześniak, M.; Huang, S.; Kundzewicz, Z.W. Projections of runoff in the Vistula and the Odra river basins with the help of the SWAT model. Hydrol. Res. 2018, 49, 303–317. [Google Scholar] [CrossRef]
- Šarauskienė, D.; Akstinas, V.; Kriaučiūnienė, J.; Jakimavičius, D.; Bukantis, A.; Kažys, J.; Povilaitis, A.; Ložys, L.; Kesminas, V.; Virbickas, T.; et al. Projection of Lithuanian river runoff, temperature and their extremes under climate change. Hydrol. Res. 2018, 49, 344–362. [Google Scholar] [CrossRef]
- Villarini, G. On the seasonality of flooding across the continental United States. Adv. Water Resour. 2016, 87, 80–91. [Google Scholar] [CrossRef] [Green Version]
- Štefunková, Z.; Hlavčová, K.; Lapin, M. Runoff change scenarios based on regional climate change projections in mountainous basins in Slovakia. Contrib. Geophys. Geod. 2013, 43, 327–350. [Google Scholar] [CrossRef] [Green Version]
- Devkota, L.P.; Gyawali, D.R. Impacts of climate change on hydrological regime and water resources management of the Koshi River Basin. Nepal. J. Hydrol. Reg. Stud. 2015, 4, 502–515. [Google Scholar] [CrossRef] [Green Version]
- Gusev, Y.M.; Nasonova, O.N.; Kovalev, E.E.; Ayzel, G.V. Impact of possible climate changes on river runoff under different natural conditions. Proc. Int. Assoc. Hydrol. Sci. 2018, 379, 293–300. [Google Scholar] [CrossRef] [Green Version]
- Champagne, O.; Arain, M.A.; Leduc, M.; Coulibaly, P.; McKenzie, S. Future shift in winter streamflow modulated by the internal variability of climate in southern Ontario. Hydrol. Earth Syst. Sci. 2020, 24, 3077–3096. [Google Scholar] [CrossRef]
- Šarauskienė, D.; Akstinas, V.; Nazarenko, S.; Kriaučiūnienė, J.; Jurgelėnaitė, A. Impact of physico-geographical factors and climate variability on flow intermittency in the rivers of water surplus zone. Hydrol. Process. 2020, 1–13. [Google Scholar] [CrossRef]
- Hamududu, B.; Killingtveit, A. Assessing climate change impacts on global hydropower. Energies 2012, 5, 305–322. [Google Scholar] [CrossRef] [Green Version]
- Turner, S.; Hejazi, M.; Kim, S.; Clarke, L.; Edmonds, J. Climate impacts on hydropower and consequences for global electricity supply investment needs. Energy 2017, 141, 2081–2090. [Google Scholar] [CrossRef]
- Lehner, B.; Czisch, G.; Vassolo, S. The impact of global change on the hydropower potential of Europe: A model-based analysis. Energ. Policy 2005, 33, 839–855. [Google Scholar] [CrossRef]
- Tamm, O.; Luhamaa, A.; Tamm, T. Modeling future changes in the North-Estonian hydropower production by using SWAT. Hydrol. Res. 2016, 47, 835–846. [Google Scholar] [CrossRef]
- Wellinghoff, J.; Pederson, J.; Morenoff, D.L. Facilitating hydrokinetic energy development through regulatory innovation. Energy Law J. 2008, 29, 397–420. [Google Scholar]
Figure 1.
Study area and objects.

Figure 2.
Principal scheme of the study.

Figure 3.
Projected discharge variation in the investigated rivers in the 21st century: (a) Jūra River, (b) Mūša River, and (c) Merkys River.
Figure 3.
Projected discharge variation in the investigated rivers in the 21st century: (a) Jūra River, (b) Mūša River, and (c) Merkys River.

Figure 4.
Spatial distribution of specific runoff (q, l s-1 km−2) in the territory of Lithuania according to the ensemble of three models in the reference period (1986–2005).
Figure 4.
Spatial distribution of specific runoff (q, l s-1 km−2) in the territory of Lithuania according to the ensemble of three models in the reference period (1986–2005).

Figure 5.
Changes (in %) of specific runoff in Lithuanian rivers in the 21st century relative to 1986–2005.
Figure 5.
Changes (in %) of specific runoff in Lithuanian rivers in the 21st century relative to 1986–2005.

Figure 6.
Projections of kinetic resources of the main Lithuanian rivers (except the Nemunas and Neris) in the near and far future in different seasons (a) and resource changes in comparison with 1986–2005 (b).
Figure 6.
Projections of kinetic resources of the main Lithuanian rivers (except the Nemunas and Neris) in the near and far future in different seasons (a) and resource changes in comparison with 1986–2005 (b).

Figure 7.
Projection of seasonal kinetic resources of the Nemunas and Neris revers in the near and far future (a) and their change compared to 1986–2005 (b).
Figure 7.
Projection of seasonal kinetic resources of the Nemunas and Neris revers in the near and far future (a) and their change compared to 1986–2005 (b).

Figure 8.
Projection of seasonal energy production in small Lithuanian hydropower plants in the near and far future (a) and its change compared to 1986–2005 (b).
Figure 8.
Projection of seasonal energy production in small Lithuanian hydropower plants in the near and far future (a) and its change compared to 1986–2005 (b).

Figure 9.
Projection of the seasonal energy production in Kaunas HPP in the near and far future and its change compared to 1986–2005.
Figure 9.
Projection of the seasonal energy production in Kaunas HPP in the near and far future and its change compared to 1986–2005.


Table 1.
Main characteristics of the studied gauging station catchments [19].
Table 1.
Main characteristics of the studied gauging station catchments [19].
| River-WGS | Characteristics | ||||
|---|---|---|---|---|---|
| Average Discharge, m3s−1 | Basin Area, km2 | Lakes, % | Wetlands, % | Woods, % | |
| Nemunas-Druskininkai | 200.2 | 37100 | 1.0 | 24.0 | 16.0 |
| Merkys-Puvočiai | 32.2 | 4220 | 0.9 | 10.0 | 46 |
| Šalčia-Valkininkai | 5.58 | 746 | 0.1 | 5.0 | 34.0 |
| Ūla-Zervynos | 4.77 | 679 | 0.3 | 11.0 | 84.0 |
| Nemunas-Nemajūnai | 246.0 | 42800 | 1.1 | 22.0 | 19.0 |
| Neris-Jonava | 168.0 | 24600 | 2.4 | 10.0 | 28.0 |
| Šventoji-Ukmergė | 44.1 | 5440 | 3.8 | 9.0 | 12.0 |
| Žeimena-Pabradė | 21.6 | 2580 | 7.0 | 10.0 | 37.0 |
| Nevėžis-Dasiūnai | 34.0 | 5530 | 0.2 | 5.0 | 18.0 |
| Šušvė-Josvainiai | 6.06 | 1100 | 0.1 | 14.0 | 21.0 |
| Šušvė-Šiaulėnai | 1.19 | 162 | 0.1 | 22.0 | 16.0 |
| Dubysa-Padubysis | 15.4 | 1900 | 0.6 | 11.0 | 14.0 |
| Dubysa-Lyduvėnai | 8.71 | 1130 | 0.7 | 13.0 | 14.0 |
| Nemunas-Smalininkai | 503.6 | 81200 | 1.5 | 15.0 | 21.0 |
| Šešupė-Kudirkos Naumiestis | 18.9 | 3210 | 2.0 | 11.0 | 17.0 |
| Jūra-Tauragė | 21.8 | 1690 | 0.2 | 6.0 | 20.0 |
| Akmena-Paakmenis | 4.61 | 314 | 0.8 | 11.0 | 5.0 |
| Šešuvis-Skirgailai | 15.5 | 1880 | 0.1 | 4.0 | 17.0 |
| Minija-Kartena | 17.3 | 1230 | 1.4 | 8.0 | 20.0 |
| Bartuva-Skuodas | 7.80 | 612 | 0.2 | 5.0 | 3.0 |
| Venta-Leckava | 30.6 | 4060 | 1.0 | 9.0 | 22.0 |
| Venta-Papilė | 10.4 | 1570 | 0.6 | 7.0 | 27.0 |
| Mūša-Ustukiai | 11.5 | 2280 | 0.8 | 3.0 | 14.0 |
| Lėvuo-Pasvalys | 5.43 | 1560 | 0.4 | 8.0 | 15.0 |
| Lėvuo-Bernatoniai | 3.73 | 1130 | 0.5 | 9.0 | 15.0 |
Table 2.
Results of calibration and validation of hydrological models.
| River-WGS | Calibration | Validation | ||||
|---|---|---|---|---|---|---|
| R | NSE | RE, % | R | NSE | RE, % | |
| Nemunas-Druskininkai | 0.85 | 0.72 | −5.2 | 0.68 | 0.54 | 7.3 |
| Merkys-Puvočiai | 0.77 | 0.60 | −4.3 | 0.65 | 0.52 | 6.3 |
| Nemunas-Nemajūnai | 0.85 | 0.72 | −6.6 | 0.68 | 0.53 | 7.0 |
| Neris-Jonava | 0.87 | 0.76 | −9.2 | 0.60 | 0.59 | 3.9 |
| Šventoji-Ukmergė | 0.75 | 0.64 | 2.6 | 0.68 | 0.64 | 12.9 |
| Žeimena-Pabradė | 0.81 | 0.66 | −5.5 | 0.73 | 0.54 | 7.8 |
| Nevėžis-Dasiūnai | 0.86 | 0.73 | −11.0 | 0.77 | 0.64 | 16.1 |
| Šušvė-Josvainiai | 0.83 | 0.69 | 3.8 | 0.63 | 0.53 | 5.6 |
| Dubysa-Lyduvėnai | 0.87 | 0.76 | −2.9 | 0.73 | 0.61 | 3.1 |
| Nemunas-Smalininkai | 0.89 | 0.80 | −7.3 | 0.65 | 0.50 | 7.8 |
| Šešupė-Žiotys | 0.83 | 0.70 | −9.8 | 0.66 | 0.57 | 12.6 |
| Jūra-Žiotys | 0.82 | 0.67 | −3.6 | 0.75 | 0.60 | 3.3 |
| Minija-Kartena | 0.88 | 0.77 | 3.8 | 0.83 | 0.70 | −1.1 |
| Nemunas-Žiotys | 0.89 | 0.79 | −6.2 | 0.75 | 0.62 | 6.8 |
| Bartuva-Skuodas | 0.77 | 0.60 | −7.3 | 0.75 | 0.54 | 8.7 |
| Venta-Leckava | 0.88 | 0.77 | −2.6 | 0.81 | 0.75 | 3.5 |
| Mūša-Ustukiai | 0.79 | 0.72 | −4.3 | 0.77 | 0.68 | 7.3 |
| Lėvuo-Pasvalys | 0.83 | 0.68 | −6.8 | 0.69 | 0.67 | 14.0 |
Table 3.
Mapping verification.
| River–WGS | Winter | Spring | Summer | Autumn | Annual |
|---|---|---|---|---|---|
| Akmena-Paakmenis | −7.7 | −10.0 | −9.6 | −4.7 | −7.7 |
| Lėvuo-Pasvalys | 7.0 | −6.1 | 3.0 | −11.5 | −1.7 |
| Šalčia-Valkininkai | −2.2 | 4.8 | 11.5 | 3.00 | 3.8 |
| Ūla-Zervynos | −5.3 | −4.9 | 2.7 | 0.5 | −2.4 |
Table 4.
Results of the modeling.
| River-WMS | Q (1986–2005), m3 s−1 | Change (in %) Compared to 1986–2005 | |||
|---|---|---|---|---|---|
| 2021–2040 | 2081–2100 | ||||
| 2.6 | 8.5 | 2.6 | 8.5 | ||
| Hydrological region of western Lithuania | |||||
| Bartuva-Skuodas | 7.83 | 0.1 | 0.4 | −5.2 | −8.2 |
| Minija-Kartena | 15.8 | −4.8 | −0.6 | −4.5 | 2.3 |
| Jūra-Žiotys | 39.2 | −7.5 | −4.0 | −7.9 | −10.4 |
| Nemunas-Žiotys | 677 | −6.2 | −5.0 | −7.2 | −6.8 |
| Hydrological region of central Lithuania | |||||
| Nevėžis-Dasiūnai | 32.2 | −7.2 | −4.0 | −6.5 | −9.9 |
| Šušvė-Josvainiai | 5.79 | −7.2 | −4.0 | −6.6 | −10.9 |
| Dubysa-Lyduvėnai | 8.60 | −3.4 | 1.3 | −4.0 | 1.3 |
| Nemunas-Smalininkai | 487 | −8.3 | −4.8 | −5.5 | −18.9 |
| Venta-Leckava | 30.0 | −7.2 | −4.0 | −7.2 | −5.0 |
| Mūša-Ustukiai | 10.9 | −10.6 | −6.7 | −11.9 | −22.7 |
| Lėvuo-Bernatoniai | 3.61 | −10.8 | −5.5 | −9.3 | −18.1 |
| Šešupė-Žiotys | 35.5 | −15.2 | −15.2 | −14.9 | −31.2 |
| Hydrological region of south-eastern Lithuania | |||||
| Nemunas-Druskininkai | 196 | −9.7 | −7.6 | −7.2 | −24.6 |
| Merkys-Puvočiai | 32.2 | −5.9 | −2.2 | −1.3 | −16.9 |
| Nemunas-Nemajūnai | 239 | −8.9 | −6.6 | −6.3 | −22.5 |
| Neris-Jonava | 159 | −6.5 | −0.2 | −3.2 | −12.8 |
| Šventoji-Ukmergė | 42.9 | −5.2 | 0.8 | −2.9 | −7.7 |
| Žeimena-Pabradė | 22.8 | −3.2 | 4.1 | 2.7 | −9.9 |
Table 5.
Kinetic resources of the main Lithuanian rivers (EKT, GWh a−1) and projection of their changes (in %) in the near and far future relative to 1986–2005.
Table 5.
Kinetic resources of the main Lithuanian rivers (EKT, GWh a−1) and projection of their changes (in %) in the near and far future relative to 1986–2005.
| River | E (1986–2005), GWh a−1 | Change (in %) Compared to 1986–2005 | |||
|---|---|---|---|---|---|
| 2021–2040 | 2081–2100 | ||||
| 2.6 | 8.5 | 2.6 | 8.5 | ||
| Hydrological region of western Lithuania | |||||
| Bartuva | 2.9 | 1.0 | 1.1 | −6.2 | −11.1 |
| Venta | 24.2 | −8.0 | −4.5 | −8.3 | −5.7 |
| Jūra | 24.6 | −9.0 | −4.1 | −8.8 | −12.4 |
| Minija | 26.2 | −6.3 | −0.6 | −5.9 | −2.3 |
| Hydrological region of central Lithuania | |||||
| Lėvuo | 2.7 | −11.4 | −11.5 | −13.7 | −25.9 |
| Šušvė | 7.4 | −9.7 | −9.4 | −11.4 | −17.4 |
| Nevėžis | 8.1 | −9.1 | −6.1 | −10.1 | −18.4 |
| Mūša | 10.1 | −12.7 | −8.0 | −14.9 | −27.4 |
| Dubysa | 17.7 | −3.6 | 1.3 | −4.8 | −1.8 |
| Šešupė | 27.8 | −17.5 | −18.8 | −18.2 | −36.2 |
| Hydrological region of south-eastern Lithuania | |||||
| Žeimena | 14.6 | −4.8 | 4.3 | 2.7 | −12.3 |
| Merkys | 33.1 | −7.2 | −2.7 | −1.7 | −19.4 |
| Šventoji | 42.5 | −4.2 | 1.5 | −2.5 | −6.1 |
| Major rivers | |||||
| Neris | 336.3 | −6.7 | −0.8 | −3.2 | −12.8 |
| Nemunas | 1087 | −7.8 | −6.3 | −7.6 | −15.7 |
| Summary | |||||
| Without Nemunas and Neris | 241.9 | −7.9 | −4.4 | −8.0 | −14.5 |
| Nemunas and Neris | 1108.6 | −7.0 | −3.2 | −5.1 | −14.1 |
| All rivers | 1350.5 | −7.8 | −4.3 | −7.6 | −14.4 |
Publisher’s Note: MDPI stays neutral with regard to jurisdictional claims in published maps and institutional affiliations. |
© 2020 by the authors. Licensee MDPI, Basel, Switzerland. This article is an open access article distributed under the terms and conditions of the Creative Commons Attribution (CC BY) license (http://creativecommons.org/licenses/by/4.0/).
Share and Cite
MDPI and ACS Style
Jakimavičius, D.; Adžgauskas, G.; Šarauskienė, D.; Kriaučiūnienė, J. Climate Change Impact on Hydropower Resources in Gauged and Ungauged Lithuanian River Catchments. Water 2020, 12, 3265. https://doi.org/10.3390/w12113265
AMA Style
Jakimavičius D, Adžgauskas G, Šarauskienė D, Kriaučiūnienė J. Climate Change Impact on Hydropower Resources in Gauged and Ungauged Lithuanian River Catchments. Water. 2020; 12(11):3265. https://doi.org/10.3390/w12113265
Chicago/Turabian StyleJakimavičius, Darius, Gintaras Adžgauskas, Diana Šarauskienė, and Jūratė Kriaučiūnienė. 2020. "Climate Change Impact on Hydropower Resources in Gauged and Ungauged Lithuanian River Catchments" Water 12, no. 11: 3265. https://doi.org/10.3390/w12113265
Note that from the first issue of 2016, this journal uses article numbers instead of page numbers. See further details here.