Effect of Shearing on Non-Darcian Fluid Flow Characteristics through Rough-Walled Fracture


1
Key Laboratory of Ministry of Education for Geomechanics and Embankment Engineering, Hohai University, Nanjing 210098, China
2
Institute of Geotechnical Engineering, Hohai University, Nanjing 210098, China
3
Huadong Engineering Corporation Limited, PowerChina, Hangzhou 310014, China
4
Department of Civil and Environmental Engineering, University of Waterloo, Waterloo, ON N2L 3G1, Canada
*
Author to whom correspondence should be addressed.
Water 2020, 12(11), 3260; https://doi.org/10.3390/w12113260
Submission received: 19 October 2020
/
Revised: 18 November 2020
/
Accepted: 18 November 2020
/
Published: 20 November 2020
(This article belongs to the Special Issue Flow and Chemical/Heat Transport in Fractured Rocks and Karst Formations)
Abstract
:The heterogeneous fracture geometry induced by the presence of roughness and shearing complicates the fracture flow. This paper presents a numerical investigation of the non-Darcian flow characteristics of rough-walled fractures during shear processes. A series of fracture flow simulations were performed on four types of fractures with different joint roughness coefficients (JRCs), and the different shear displacements were imitated by degrees of mismatch on two fracture surfaces. The results show that the disorder of fracture geometries and the increase in flow rate are the main causes for the emergence of an eddy flow region, which can significantly reduce the fracture conductivity and change the fracture flow from linear to nonlinear. The Forchheimer equation provides a good model for the nonlinear relationship between the hydraulic gradient and the flow rate in the fracture flow. When the shear displacement or JRC increased, the linear permeability coefficient decreased, while the nonlinear coefficient increased. A three-parameter equation of was used to examine the inertial effect induced by the fracture roughness JRC and the variation coefficient of aperture distribution . The critical Reynolds number was a combined effect of aperture, viscous permeability, and inertial resistance, assuming the flow becomes non-Darcian when the inertial part is greater than 10%.
1. Introduction
The fluid flow processes in fractured aquifers are of great importance in many engineering practices, such as water flow in dam foundation, underground mining extraction, enhanced geothermal systems, and fluid waste disposal. Natural rock masses commonly comprise matrix blocks with fractures that provide primary migration pathways for fluids. Understanding the fluid flow behaviors in rock fractures is essential for simulation of fluid flow in fractured rock masses.
Most fluid flow models were developed based on the assumption of the linearity of Darcy’s flow, which can only be anticipated for laminar flow by diminishing the inertia effects [1,2,3]. The inertial losses cannot be neglected with regard to viscous forces arising from changes in flow flux or direction and localized eddy formation [4,5]. In this case, the pressure drops more than the proportional increase in the flow velocity; this is known as the non-Darcian fluid flow. To describe such viscous and inertial losses, the Forchheimer equation is widely used [6,7,8].
where is the pressure gradient, is the volumetric flow velocity, and and are the coefficients describing viscous and inertial losses, respectively. To incorporate the Forchheimer equation into the numerical modeling of non-Darcian flow, it is essential to determine the coefficients and .
The nonlinear flow behavior in a rock fracture influenced by shearing has been investigated using numerical simulations [9,10,11,12] and laboratory experiments [13,14,15,16,17]. Geometry alterations related to shearing and surface roughness have resulted in an increase in the overall resistance [12]. Several geometric parameters, such as fractal dimensions [18], the high-order statistical parameters of the roughness height [19], the effective slope [20,21], the roughness decomposition [5], and the joint roughness coefficient (JRC) [22], have been used to represent the wall roughness and to better understand the effect of surface roughness on the fracture flow. However, the surface roughness alone is not sufficient to represent the influence of geometry alteration. Shearing combined with roughness can result in a highly complex geometry alteration and can cause significant change to the fracture channel. The heterogeneity of the fracture channel can block the streamlines and cause backflows or eddies that indirectly increase the resistance of water flow in fractures and reduce the fracture conductivity [23]. The heterogeneous fracture channel eventually changes the two coefficients in the Forchheimer equation that describe energy losses [24]. Thus, the mechanistic understanding and parametric study of non-Darcian flow behavior for rough-walled fractures with shearing remains an open issue.
In this paper, we evaluated the effect of shearing on non-Darcian flow characteristics in rough-walled fractures. A series of numerical simulations of fracture flow were performed on four standard fractures, with different JRCs subject to different shear displacements. The evolution of the geometric characteristics of the fracture during shearing was estimated and discussed quantitatively. Fluent software was adopted to solve the fluid flow problem in these rough-walled fractures, and the occurrence and development of eddies were evaluated to gain microscopic insight into nonlinear flow processes. The relationship between the pressure gradient and flow rate was examined using the Forchheimer equation, and the impacts of shear displacement and JRC on the Forchheimer coefficients and the critical Reynolds number were analyzed.
2. Numerical Study
2.1. Fracture Model
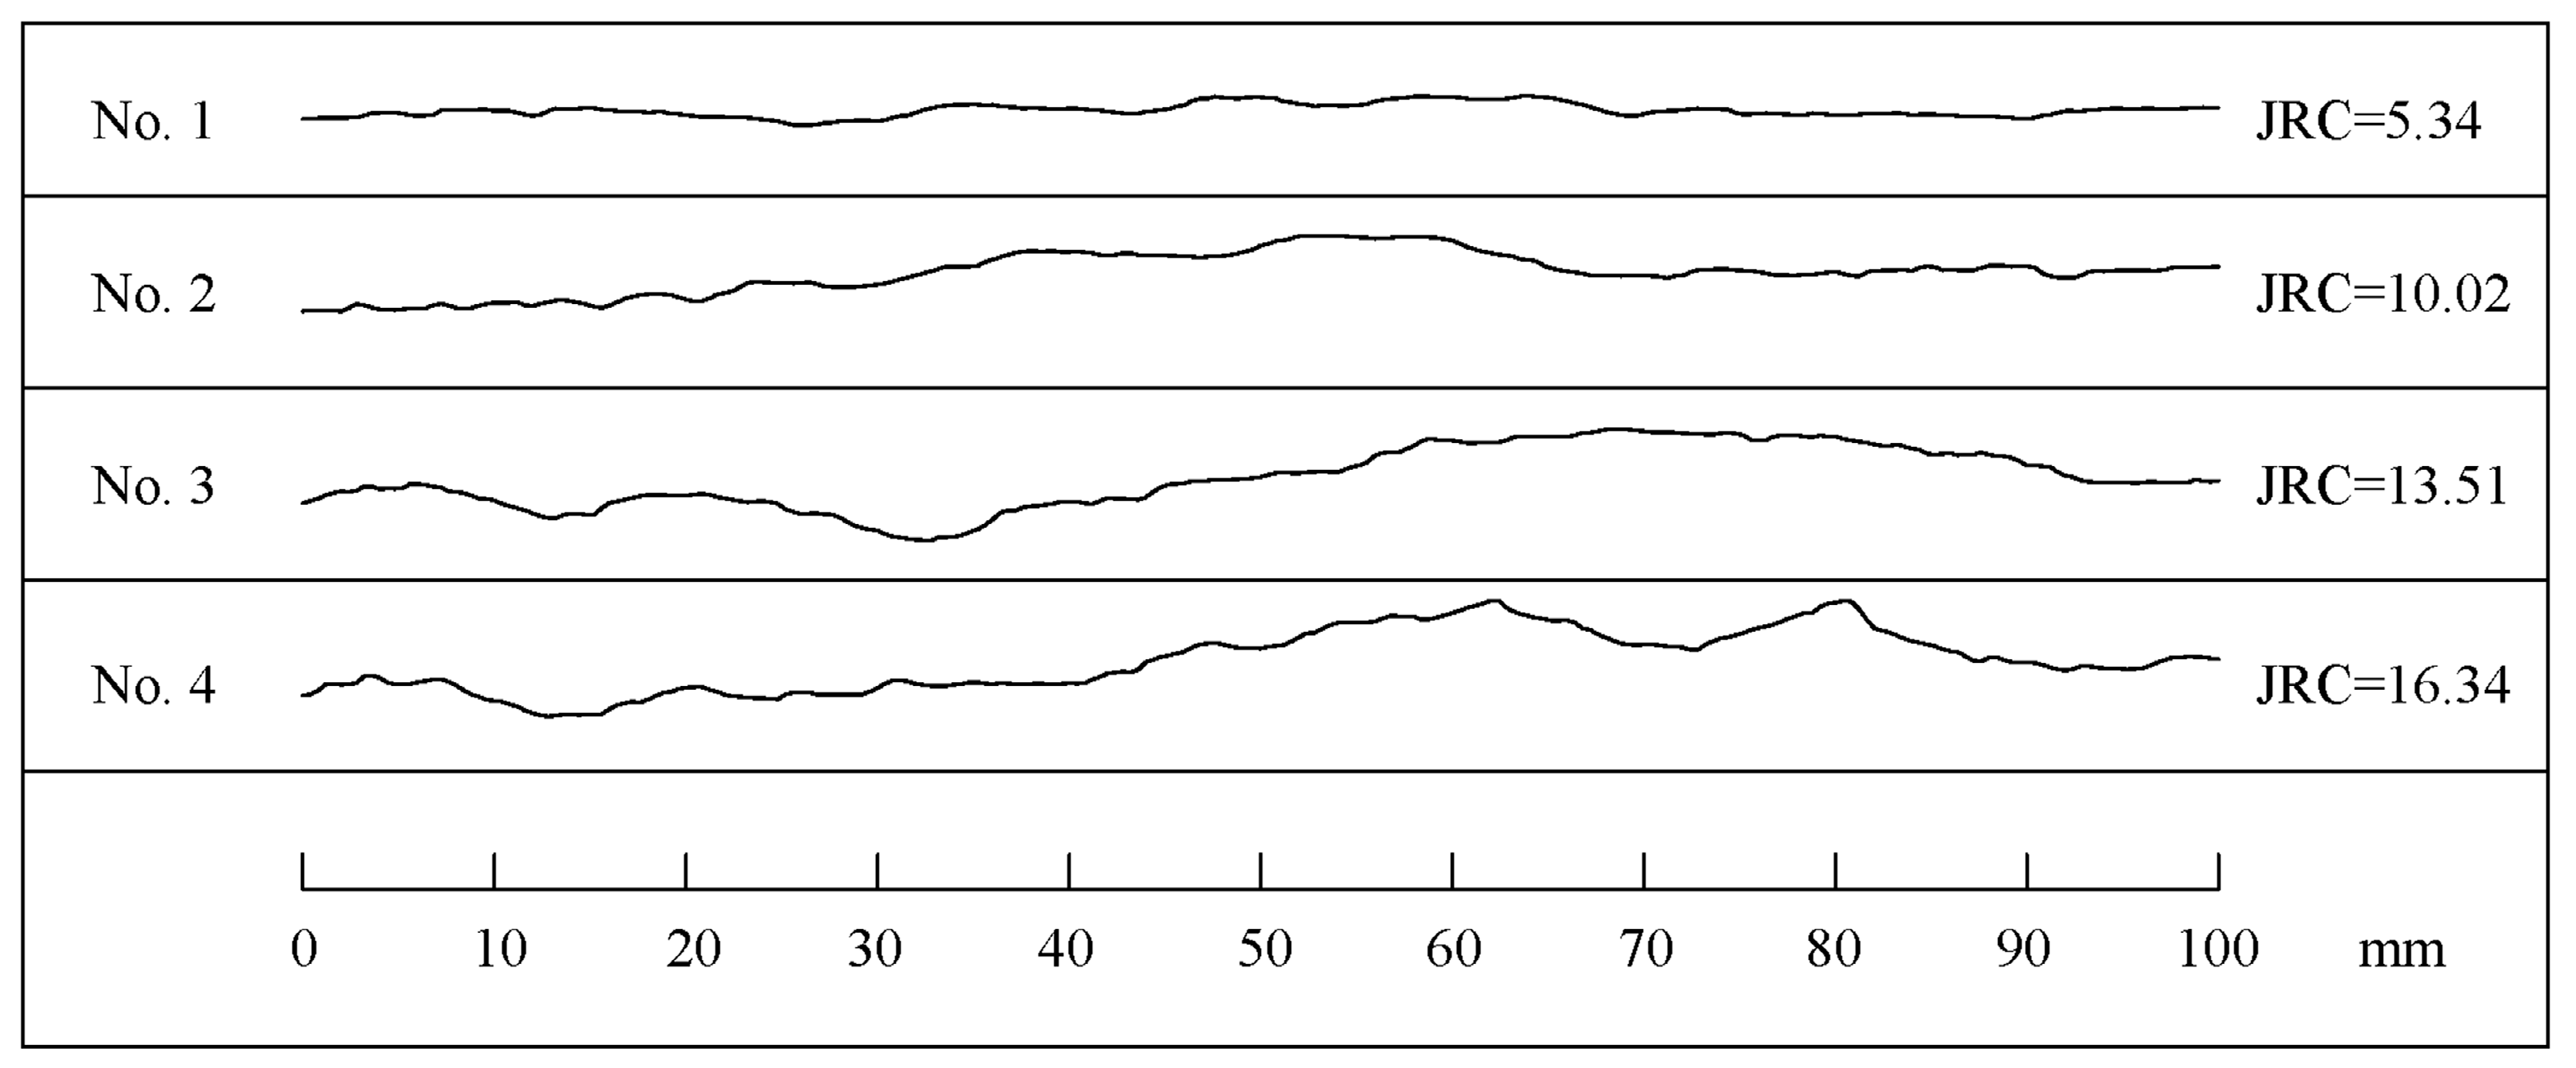
Four fracture profiles from 10 standard fractures with different JRCs [25] were used for the roughness characterization and fluid flow modeling (Figure 1). The length was 100 mm and the JRC values were calculated using Equations (2a) and (2b) [26]. The upper surface was created by lifting up the lower profile for a vertical separation of 1.5 mm, leading to a tiny parallel channel for fluid flow.
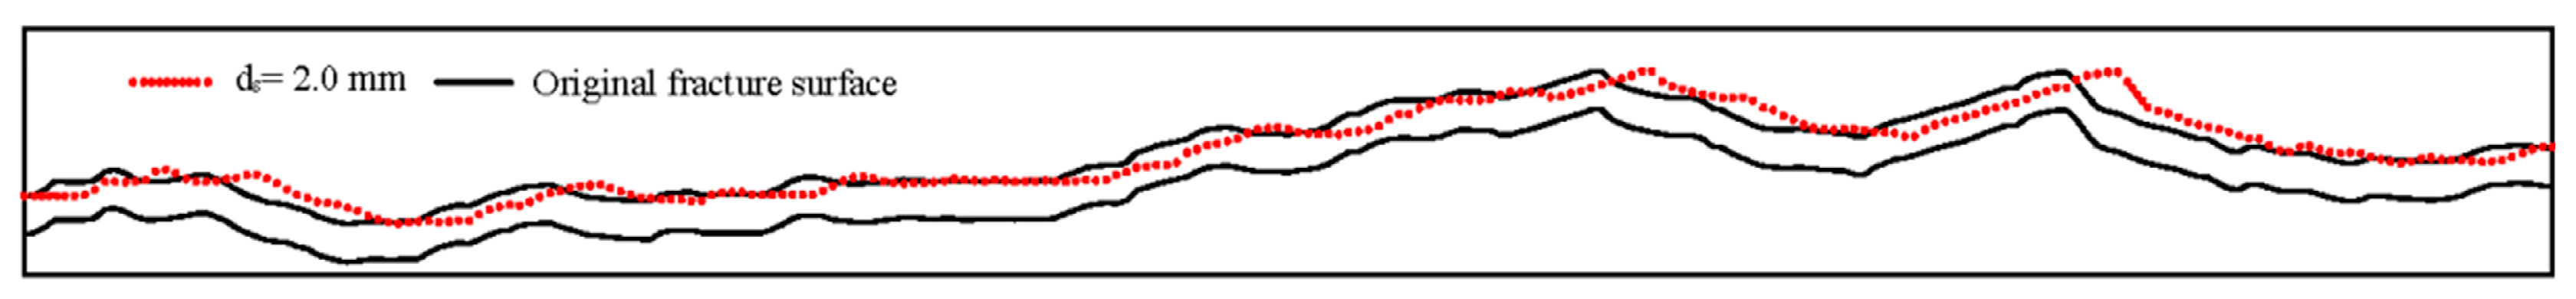
To generate fracture models with different shear displacements, the upper surfaces were shifted in the x direction up to 2.0 mm, with the lower surface fixed. As shown in Figure 2, the red dotted line was the upper surface for the fracture model with shear displacements of 2.0 mm. It should be noted that shear mismatching simulations have been used in many studies [10,12,27,28]. Compared to the initial condition, the values of vertical aperture along the fracture length changed.
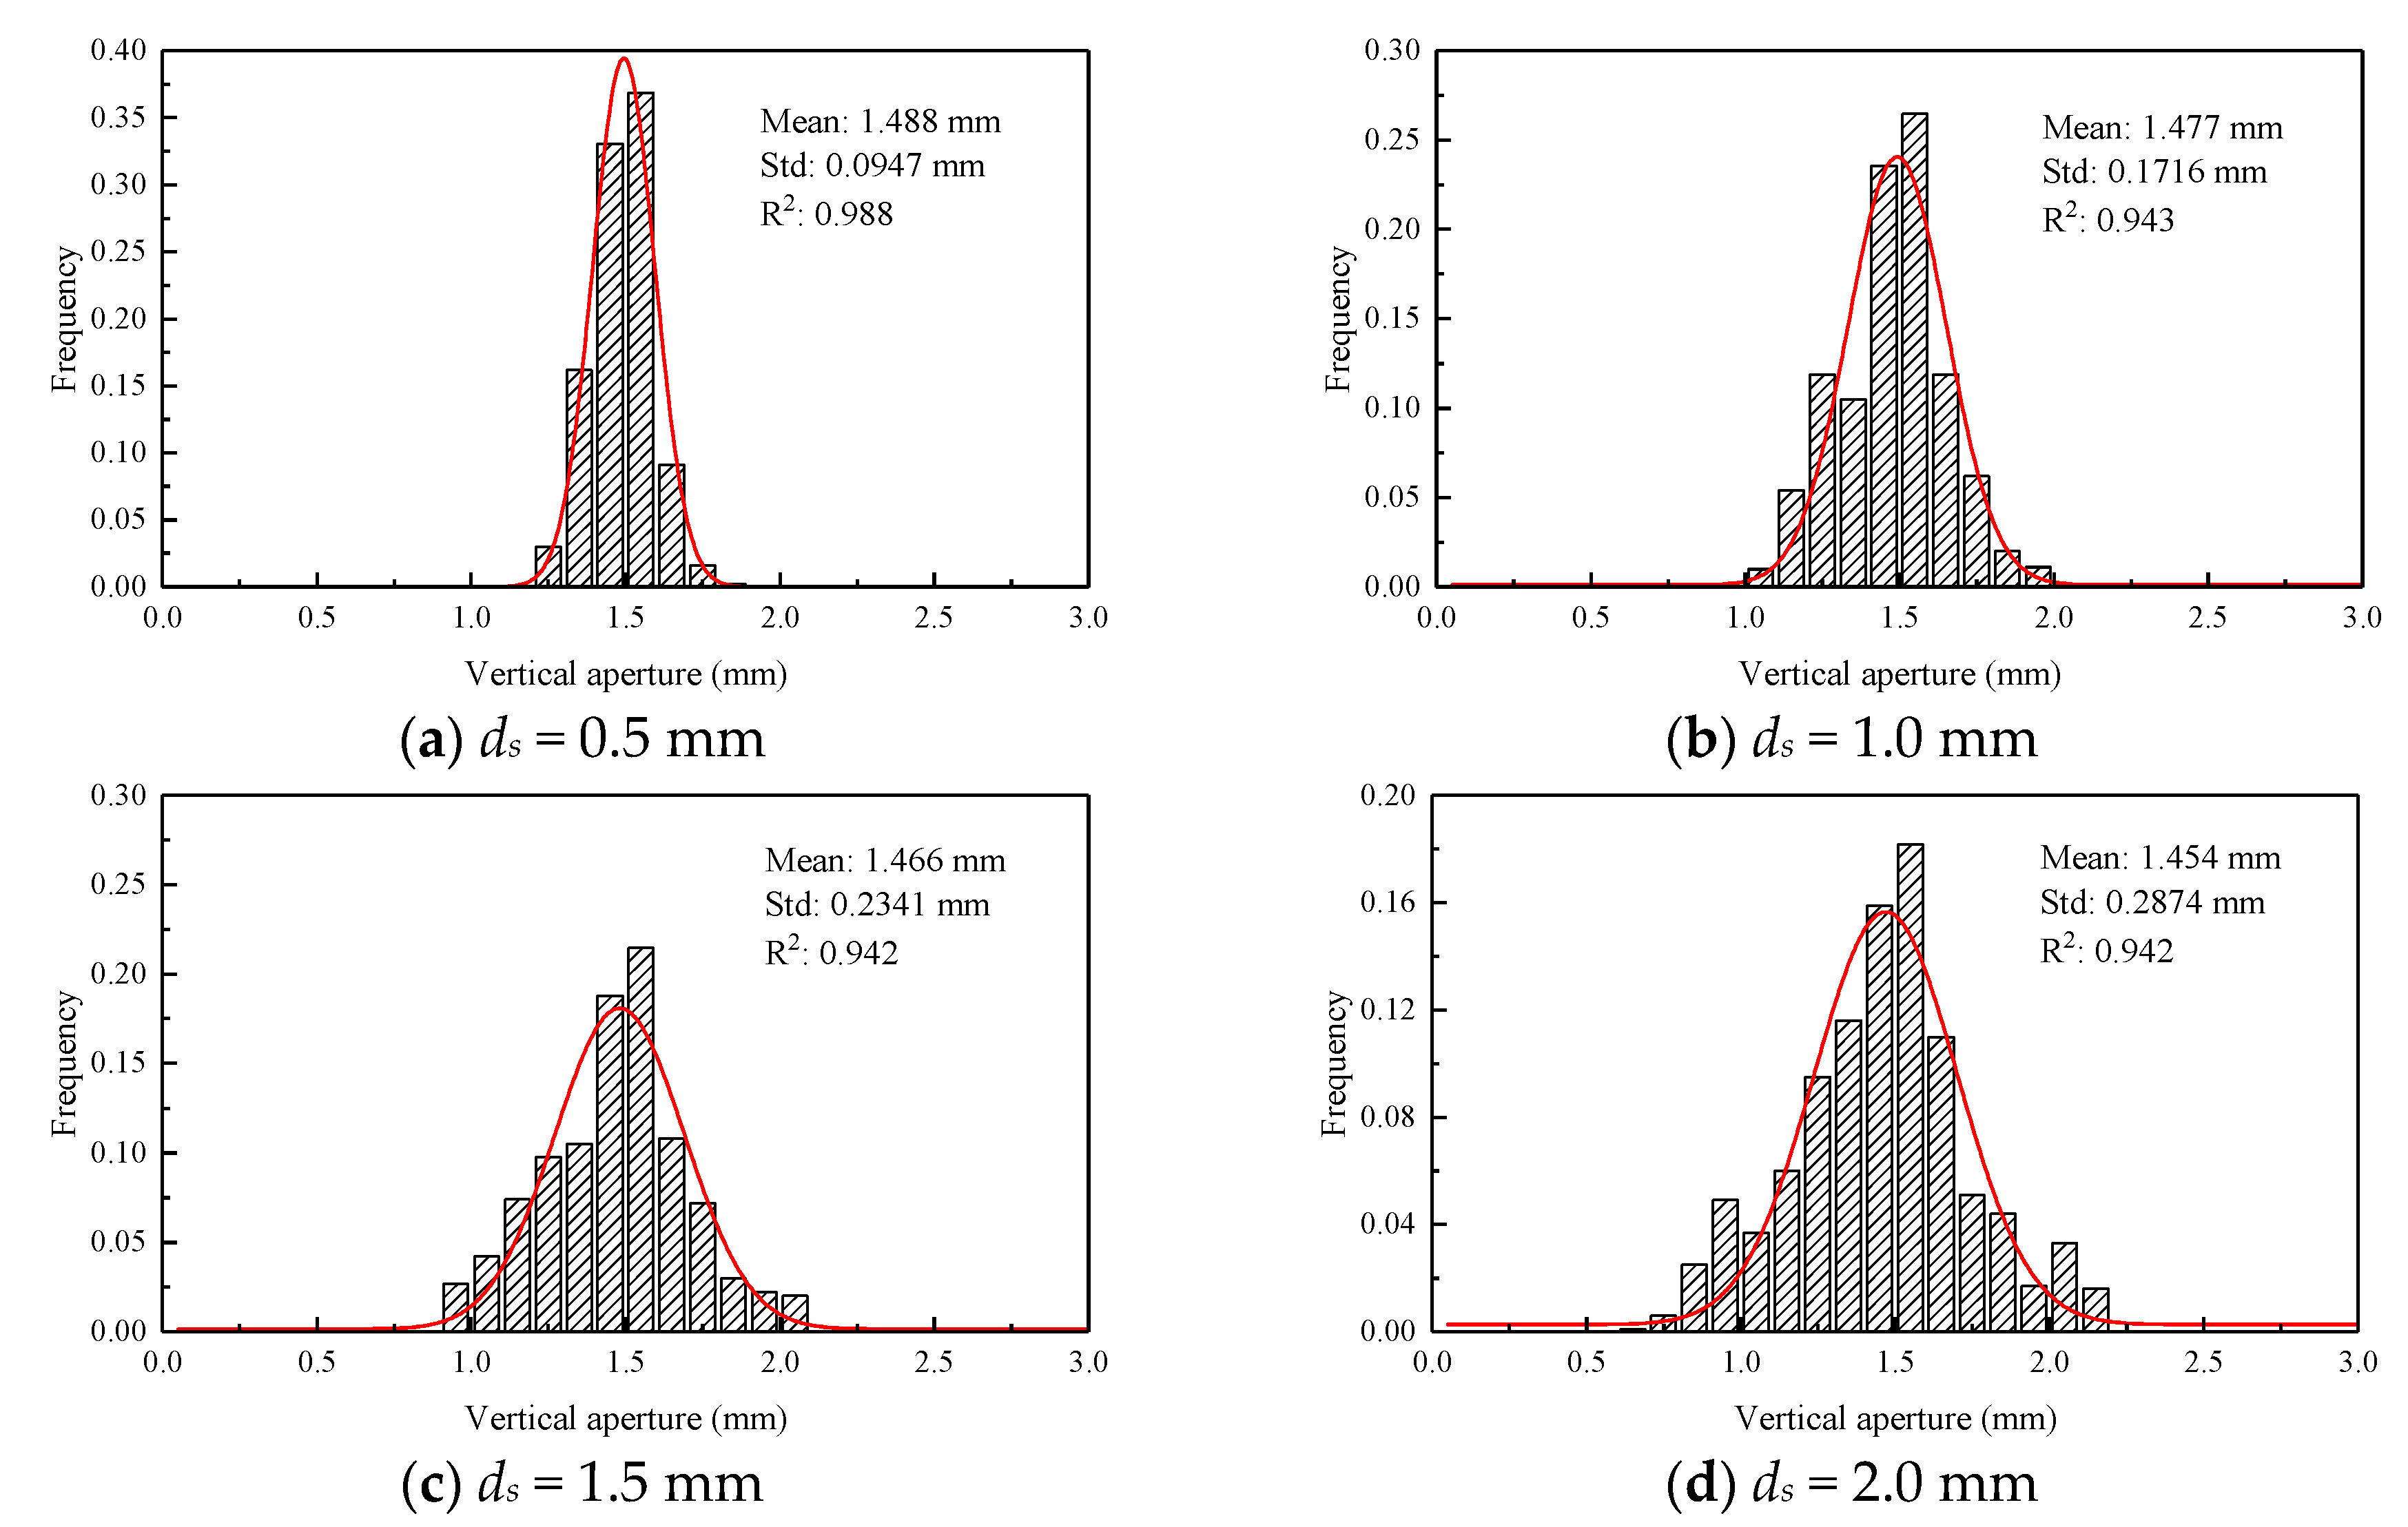
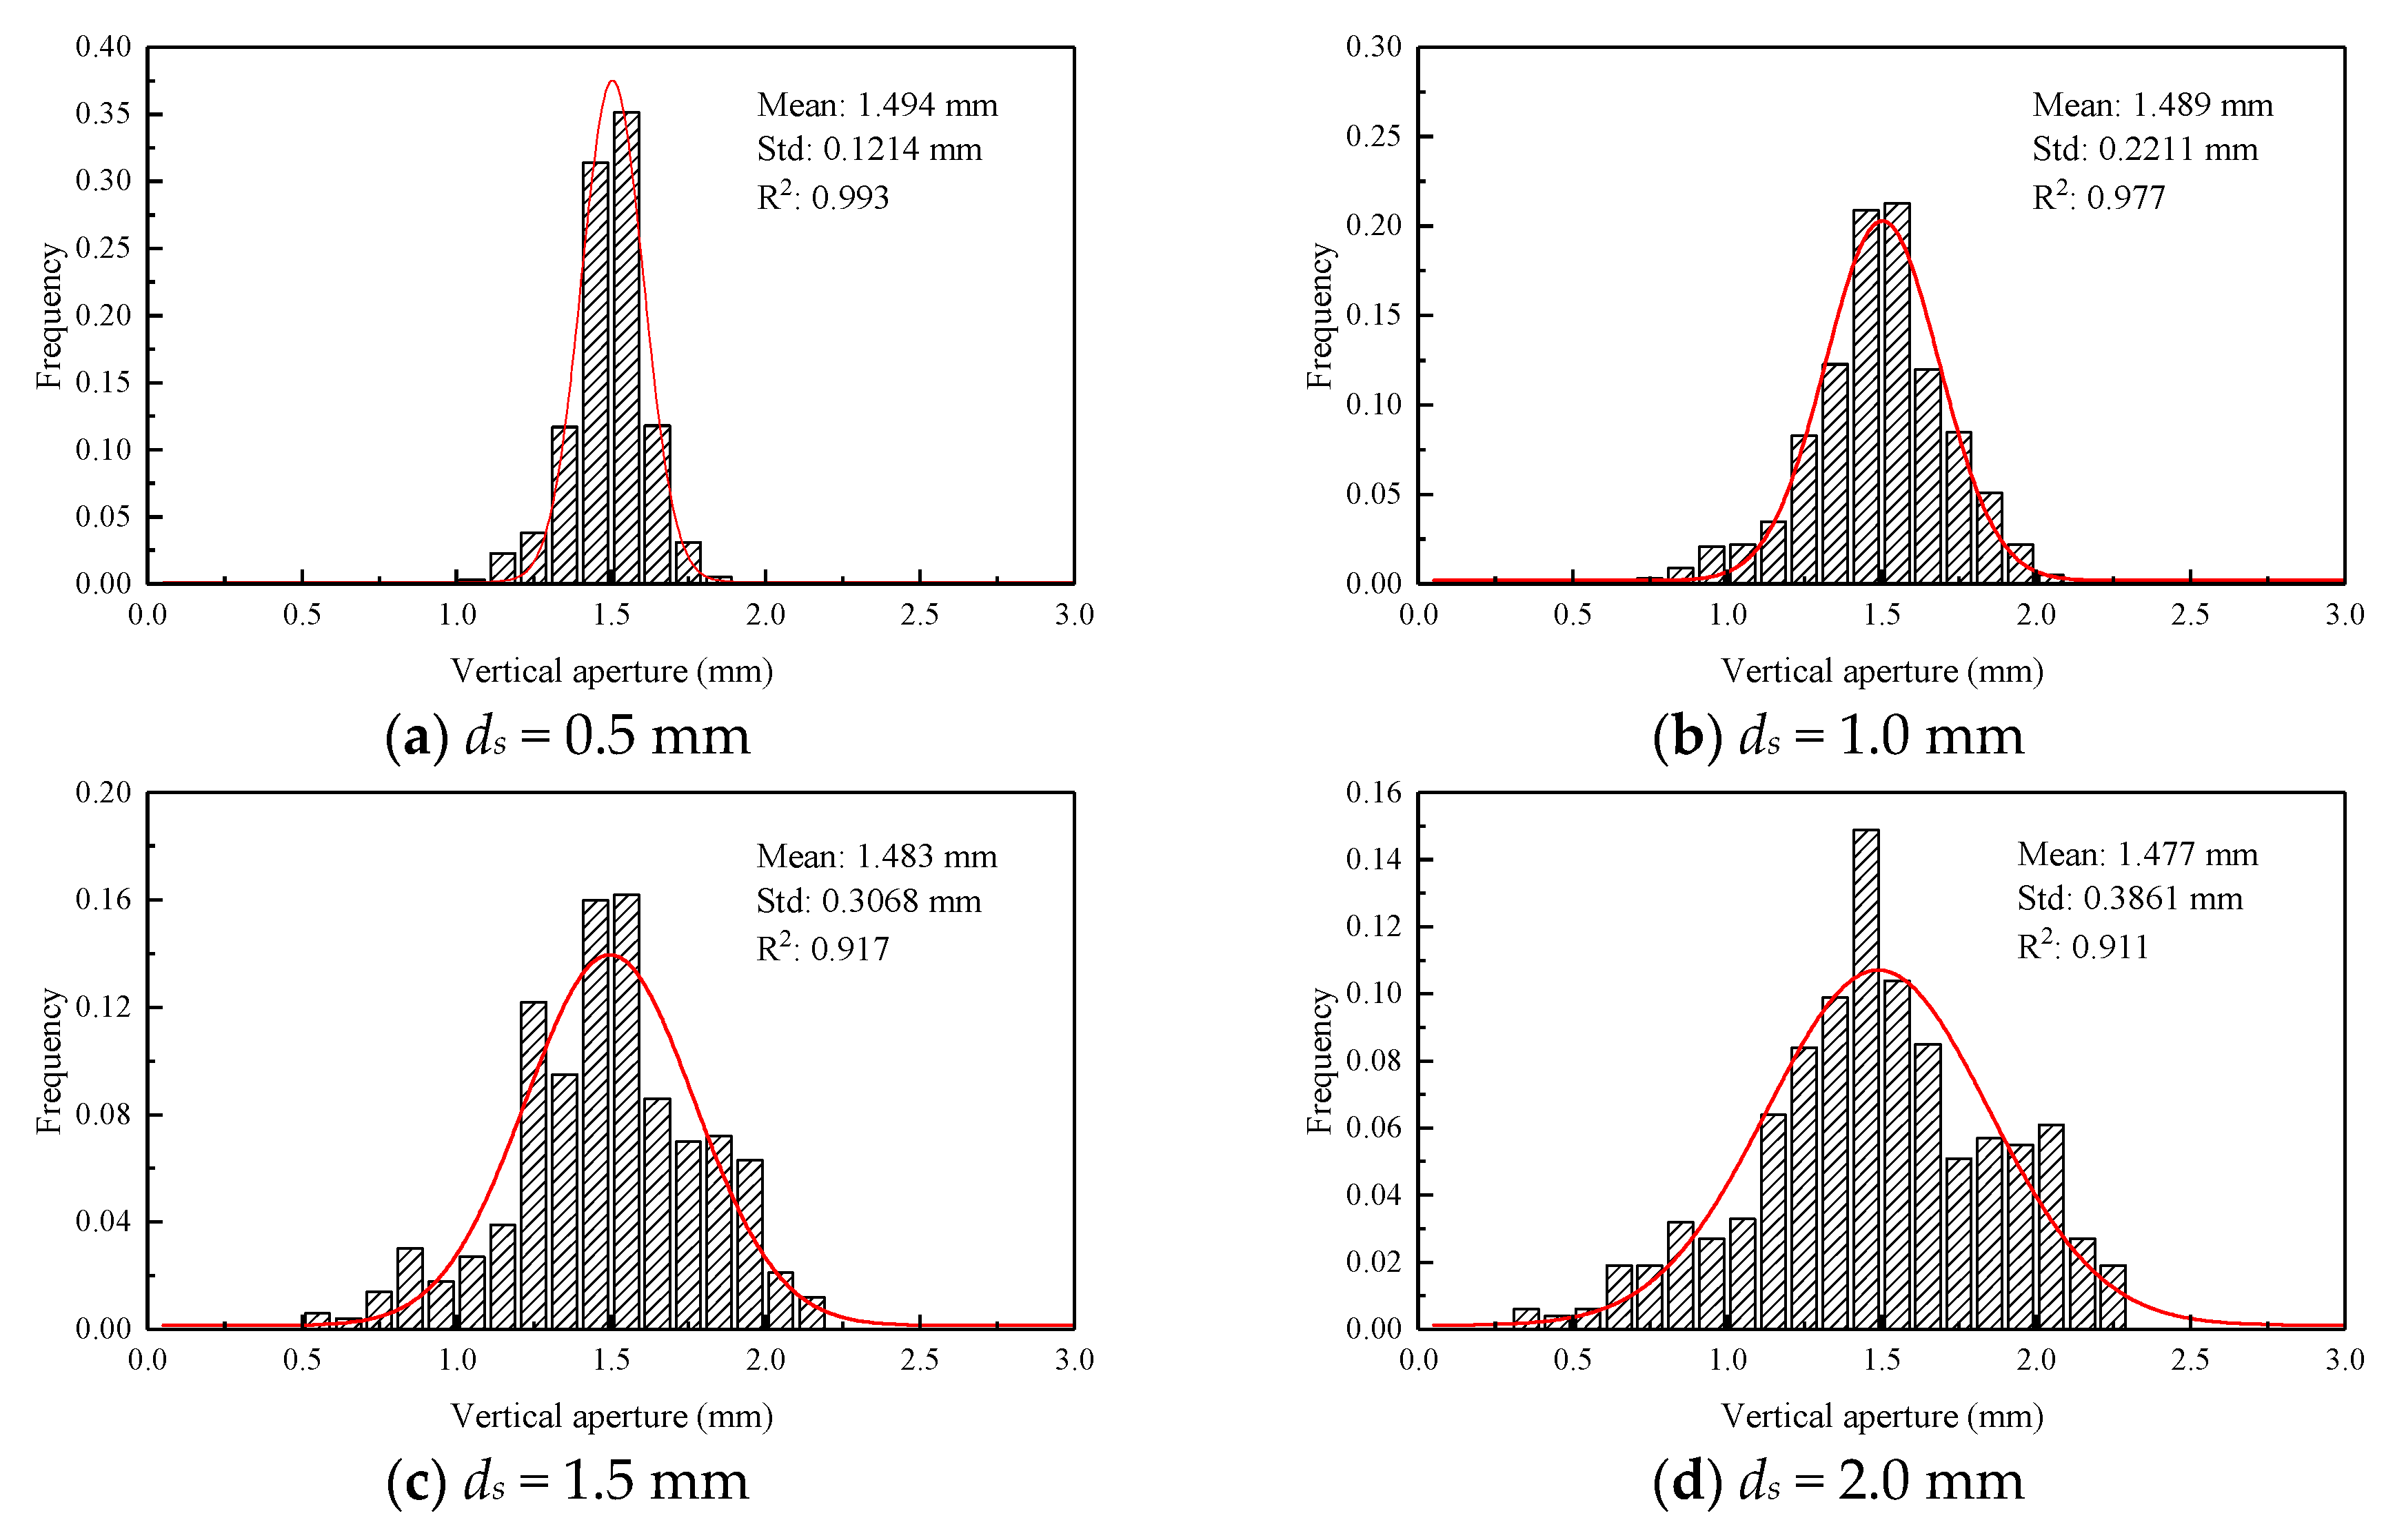
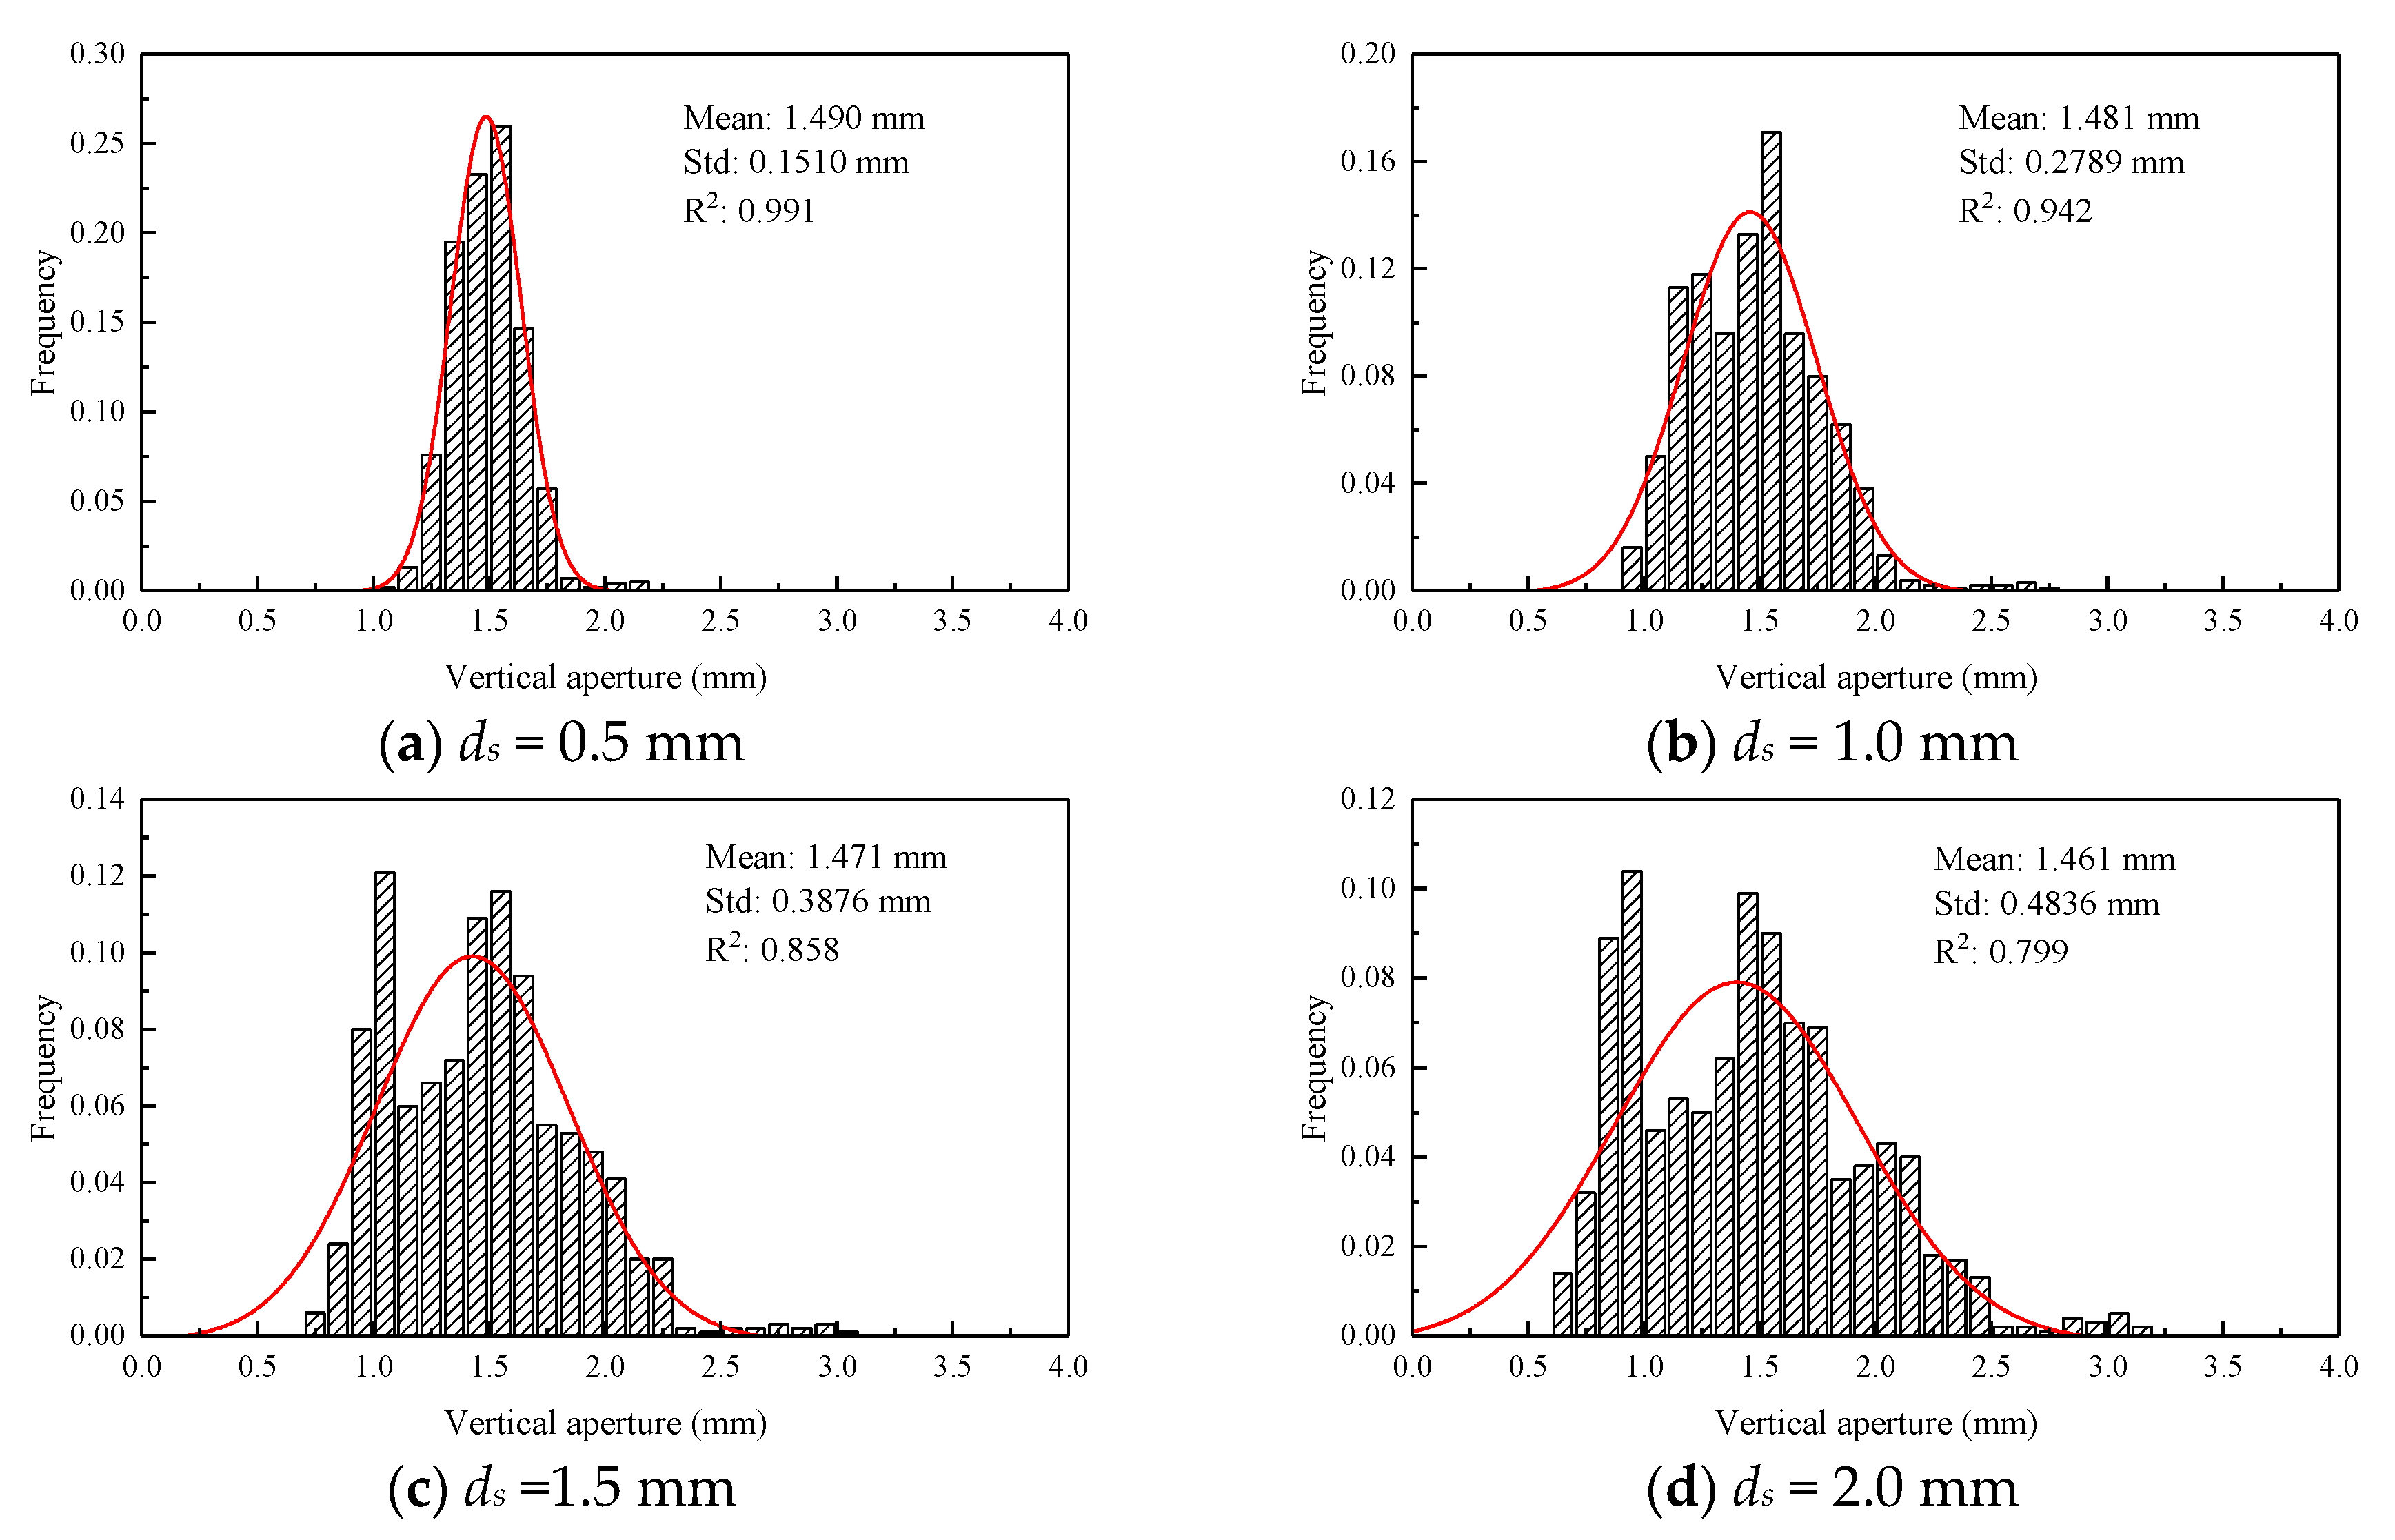
The identification of the geometric profile of the fracture channel was required for quantitative evaluation of fluid flow in rock fractures. Figure 3, Figure 4, Figure 5 and Figure 6 show that Gaussian distributions appeared to be appropriate for describing the frequency of vertical apertures with correlation coefficients of more than 0.8. The detailed statistical information for vertical apertures is listed in Table 1, and the mean vertical aperture and standard deviation for a zero scenario are 1.5 mm and 0 mm, respectively. As shear displacement increased, the mean vertical apertures showed little change, while the standard deviation increased. The increase in JRC also resulted in an increase in standard deviation. The dimensionless variation coefficient contained information on the channel size and the distribution level of oscillation.
2.2. Numerical Method
The flow of the isothermal and incompressible Newtonian fluid in a single fracture is governed by the Navier–Stokes equations, expressed as:
where is time, and are the velocity components, and are the coordinates, is the pressure, is the viscous coefficient, and is the turbulent viscous coefficient. This set of equations can be solved numerically using the commercial CFD software Fluent 6.3. A realizable k-ε model, which has shown good prediction results for phenomena such as rotation, boundary layer with significant backflow, and separation [29], was used to solve the flow problem. The turbulent kinetic energy and dissipation rate equations of the realizable k-ε model are as follows [29]:
where is the turbulent kinetic energy, is the dissipation rate, is the turbulent energy generated by the average velocity gradient, is the kinematic viscosity, is the mean strain rate, is the turbulent Prandtl number of turbulent kinetic energy, and is the turbulent Prandtl number of the dissipation rate. In Fluent, , , and were set as default constants, where , and [30].
The momentum turbulent kinetic energy and turbulent dissipation rate were solved using second-order upwind schemes, and pressure–velocity coupling was performed using an embedded simple algorithm. The upper and lower fracture surfaces were set as walls with no slip and no flow. A constant velocity inlet with a uniform velocity profile was applied on the left boundary. The opposite end of the channel was modeled as a constant pressure outlet under atmospheric conditions. The density of the water was 998.2 kg/m3, and the dynamic viscosity coefficient was 1.003 × 10³ Pa·s (at 20 °C). The water flow in each fracture was modeled at five different shear displacements (0, 0.5, 1.0, 1.5, and 2.0 mm) and nine different injection velocities (0.001, 0.005, 0.01, 0.05, 0.1, 0.25, 0.5, 0.75, and 1.0 m/s). A total of 180 simulations were performed.
3. Results and Discussion
3.1. Emergence of Eddies
The Reynolds number () provides a ratio of inertial forces to viscous forces. It is defined as follows for flow in fractures [7]:
where is the characteristic dimension of the flow system that is equal to the mean aperture of the fracture, and is the characteristic flow velocity that is approximately equal to the inlet velocity.
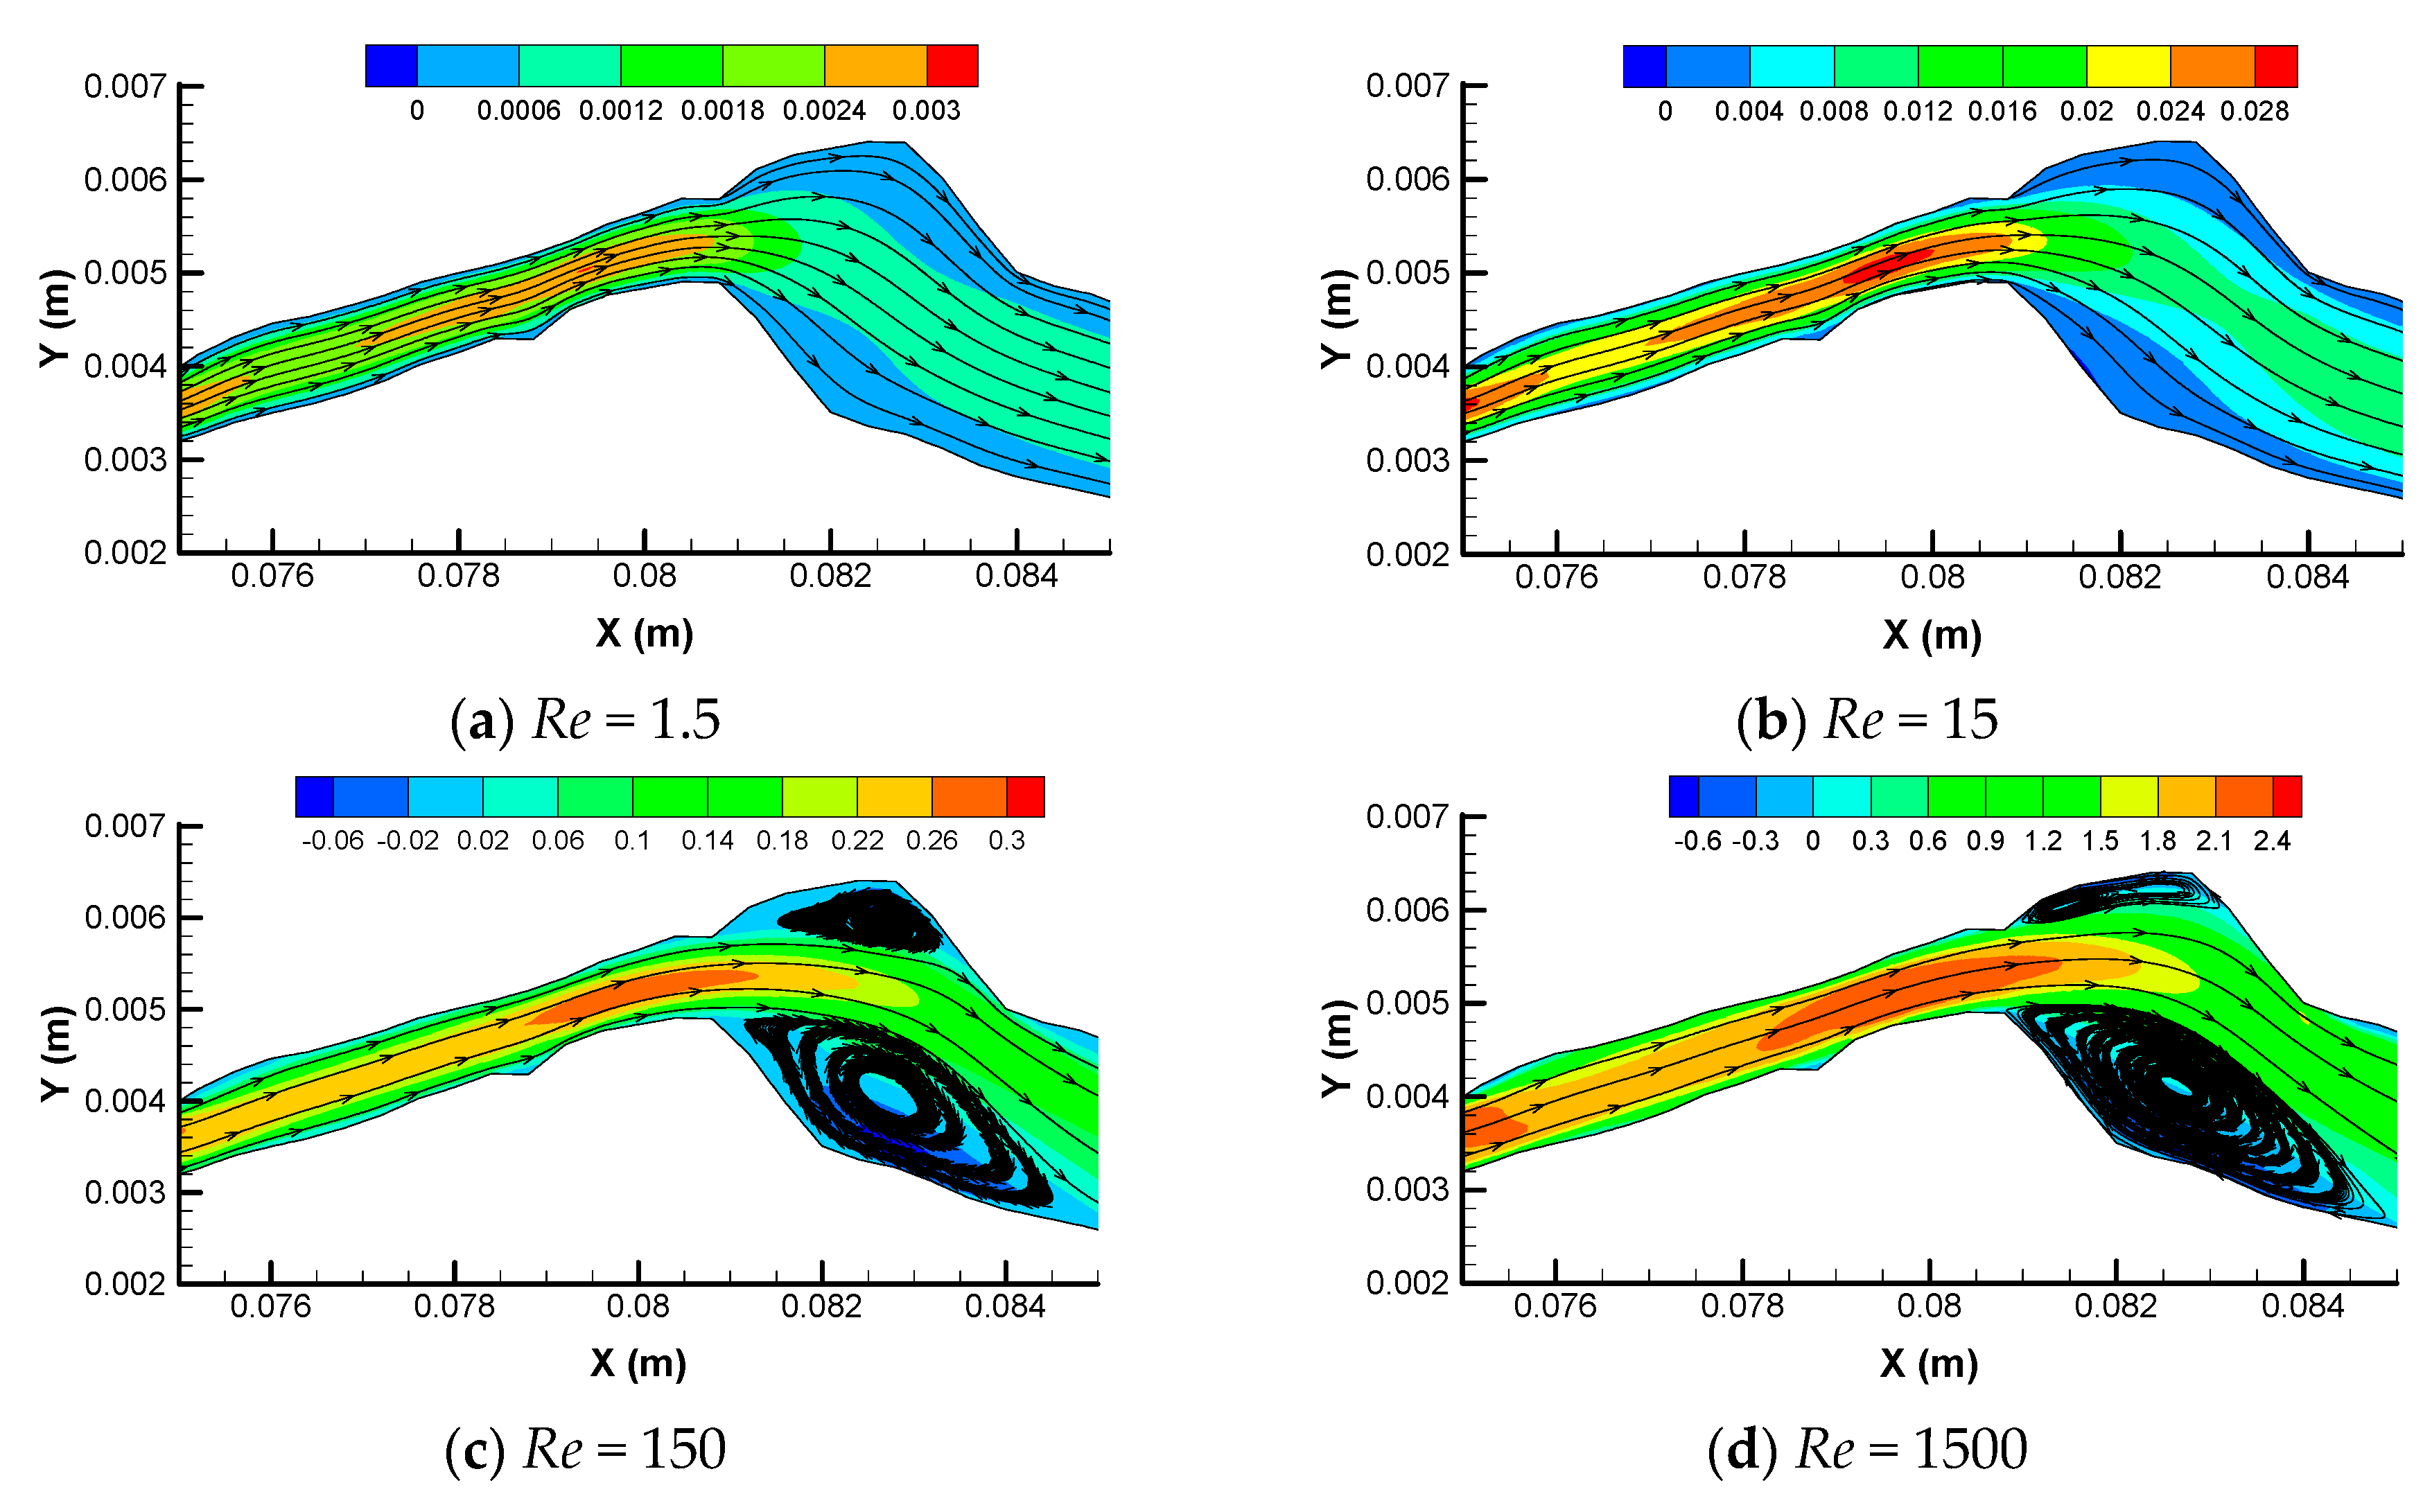
Figure 7 shows the x-velocity distribution (x-velocity is the velocity component along the flow direction) and local eddy development at x = [75 mm, 85 mm] with inlet velocities of 0.001, 0.01, 0.1, and 1.0 m/s, corresponding to the Reynolds numbers of 1.5, 15, 150, and 1500, respectively. For a given fracture, eddy flow occurred with an increase in the Reynolds number due to the local effects of sharp-cornered asperities, which enhanced the tortuosity by changing local flow direction. The locations and sizes of the eddies were identified by checking the direction of streamlines. The fluid flowed slowly and backward near the margin of the local wider zones due to the inertial effect of fluid flow. Eddies were developed in local narrow-to-wide regions in the fracture channel, which is consistent with previous experimental observations [12]. When the Reynolds number was small, the pattern of streamlines indicated that the overall fluid flow was close to laminar flow in the fracture channel. With increasing Reynolds numbers, the size, number, and shape of eddies increased dramatically.
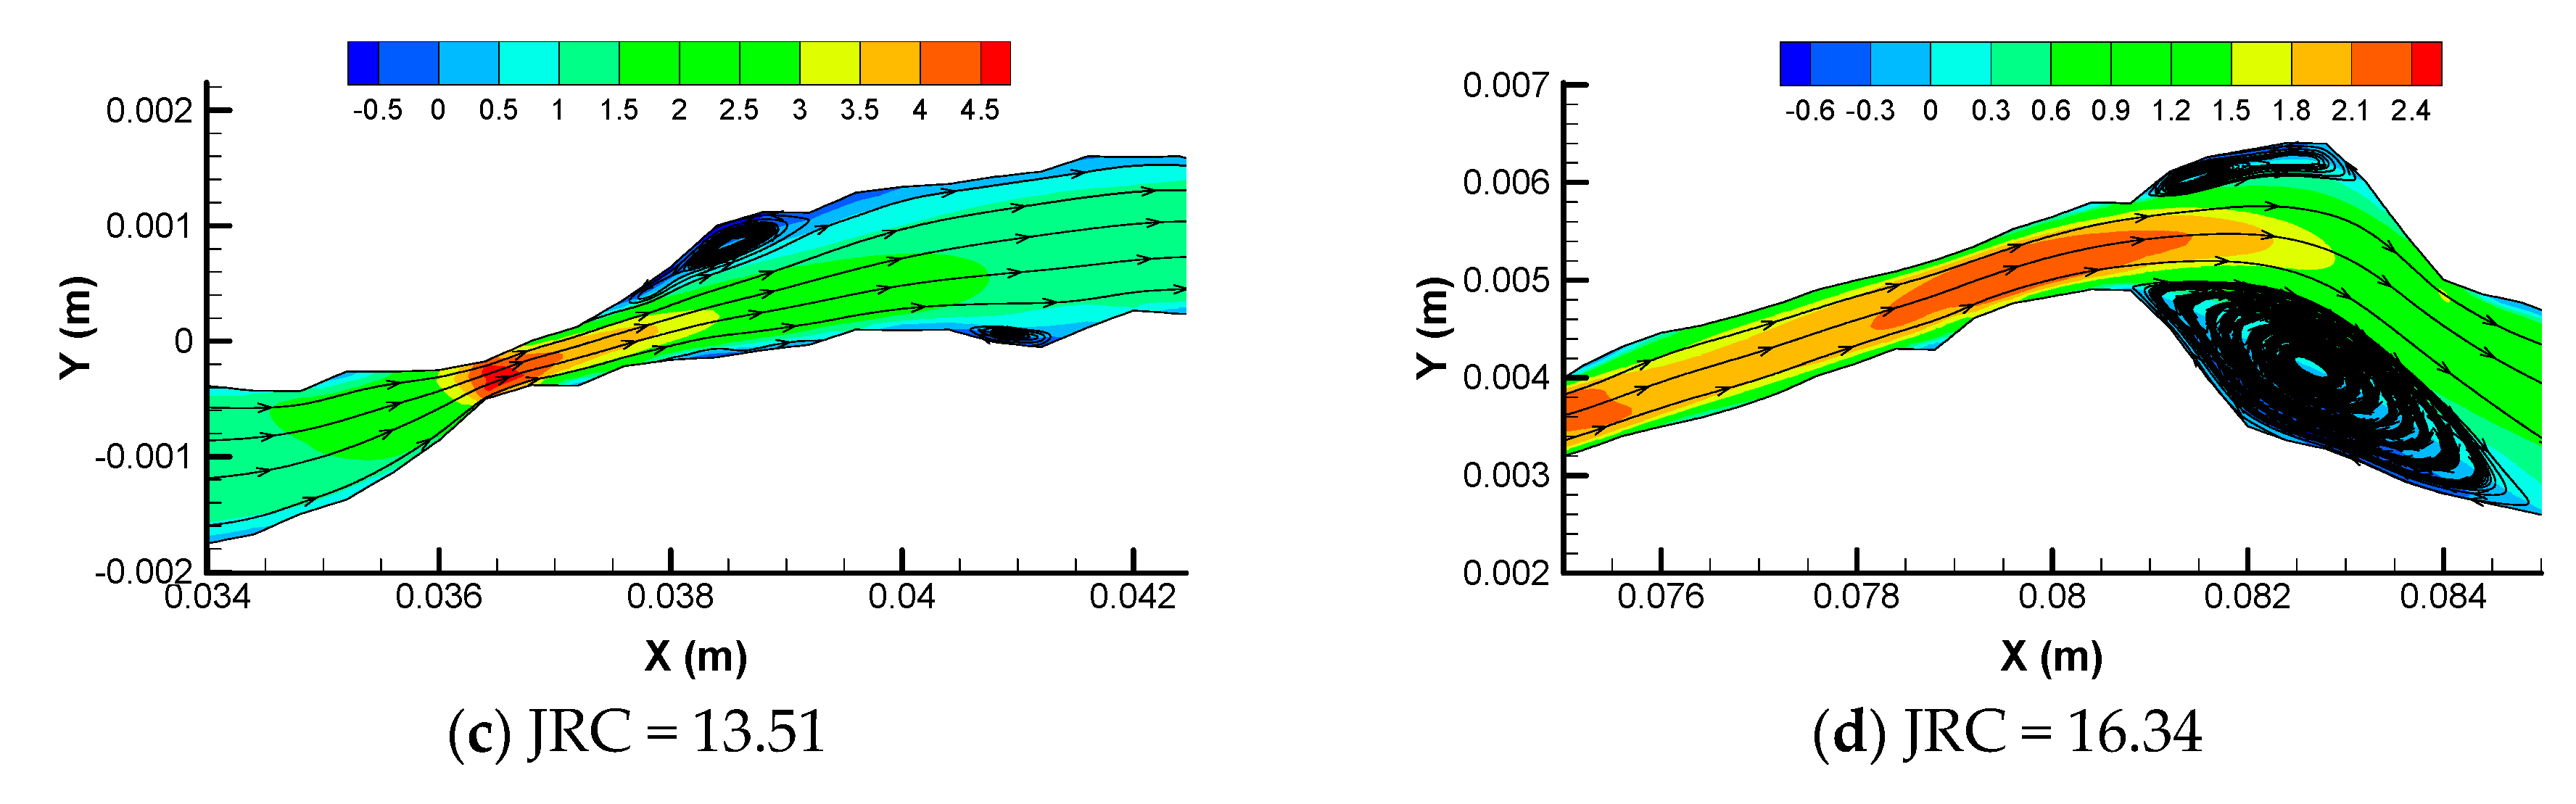
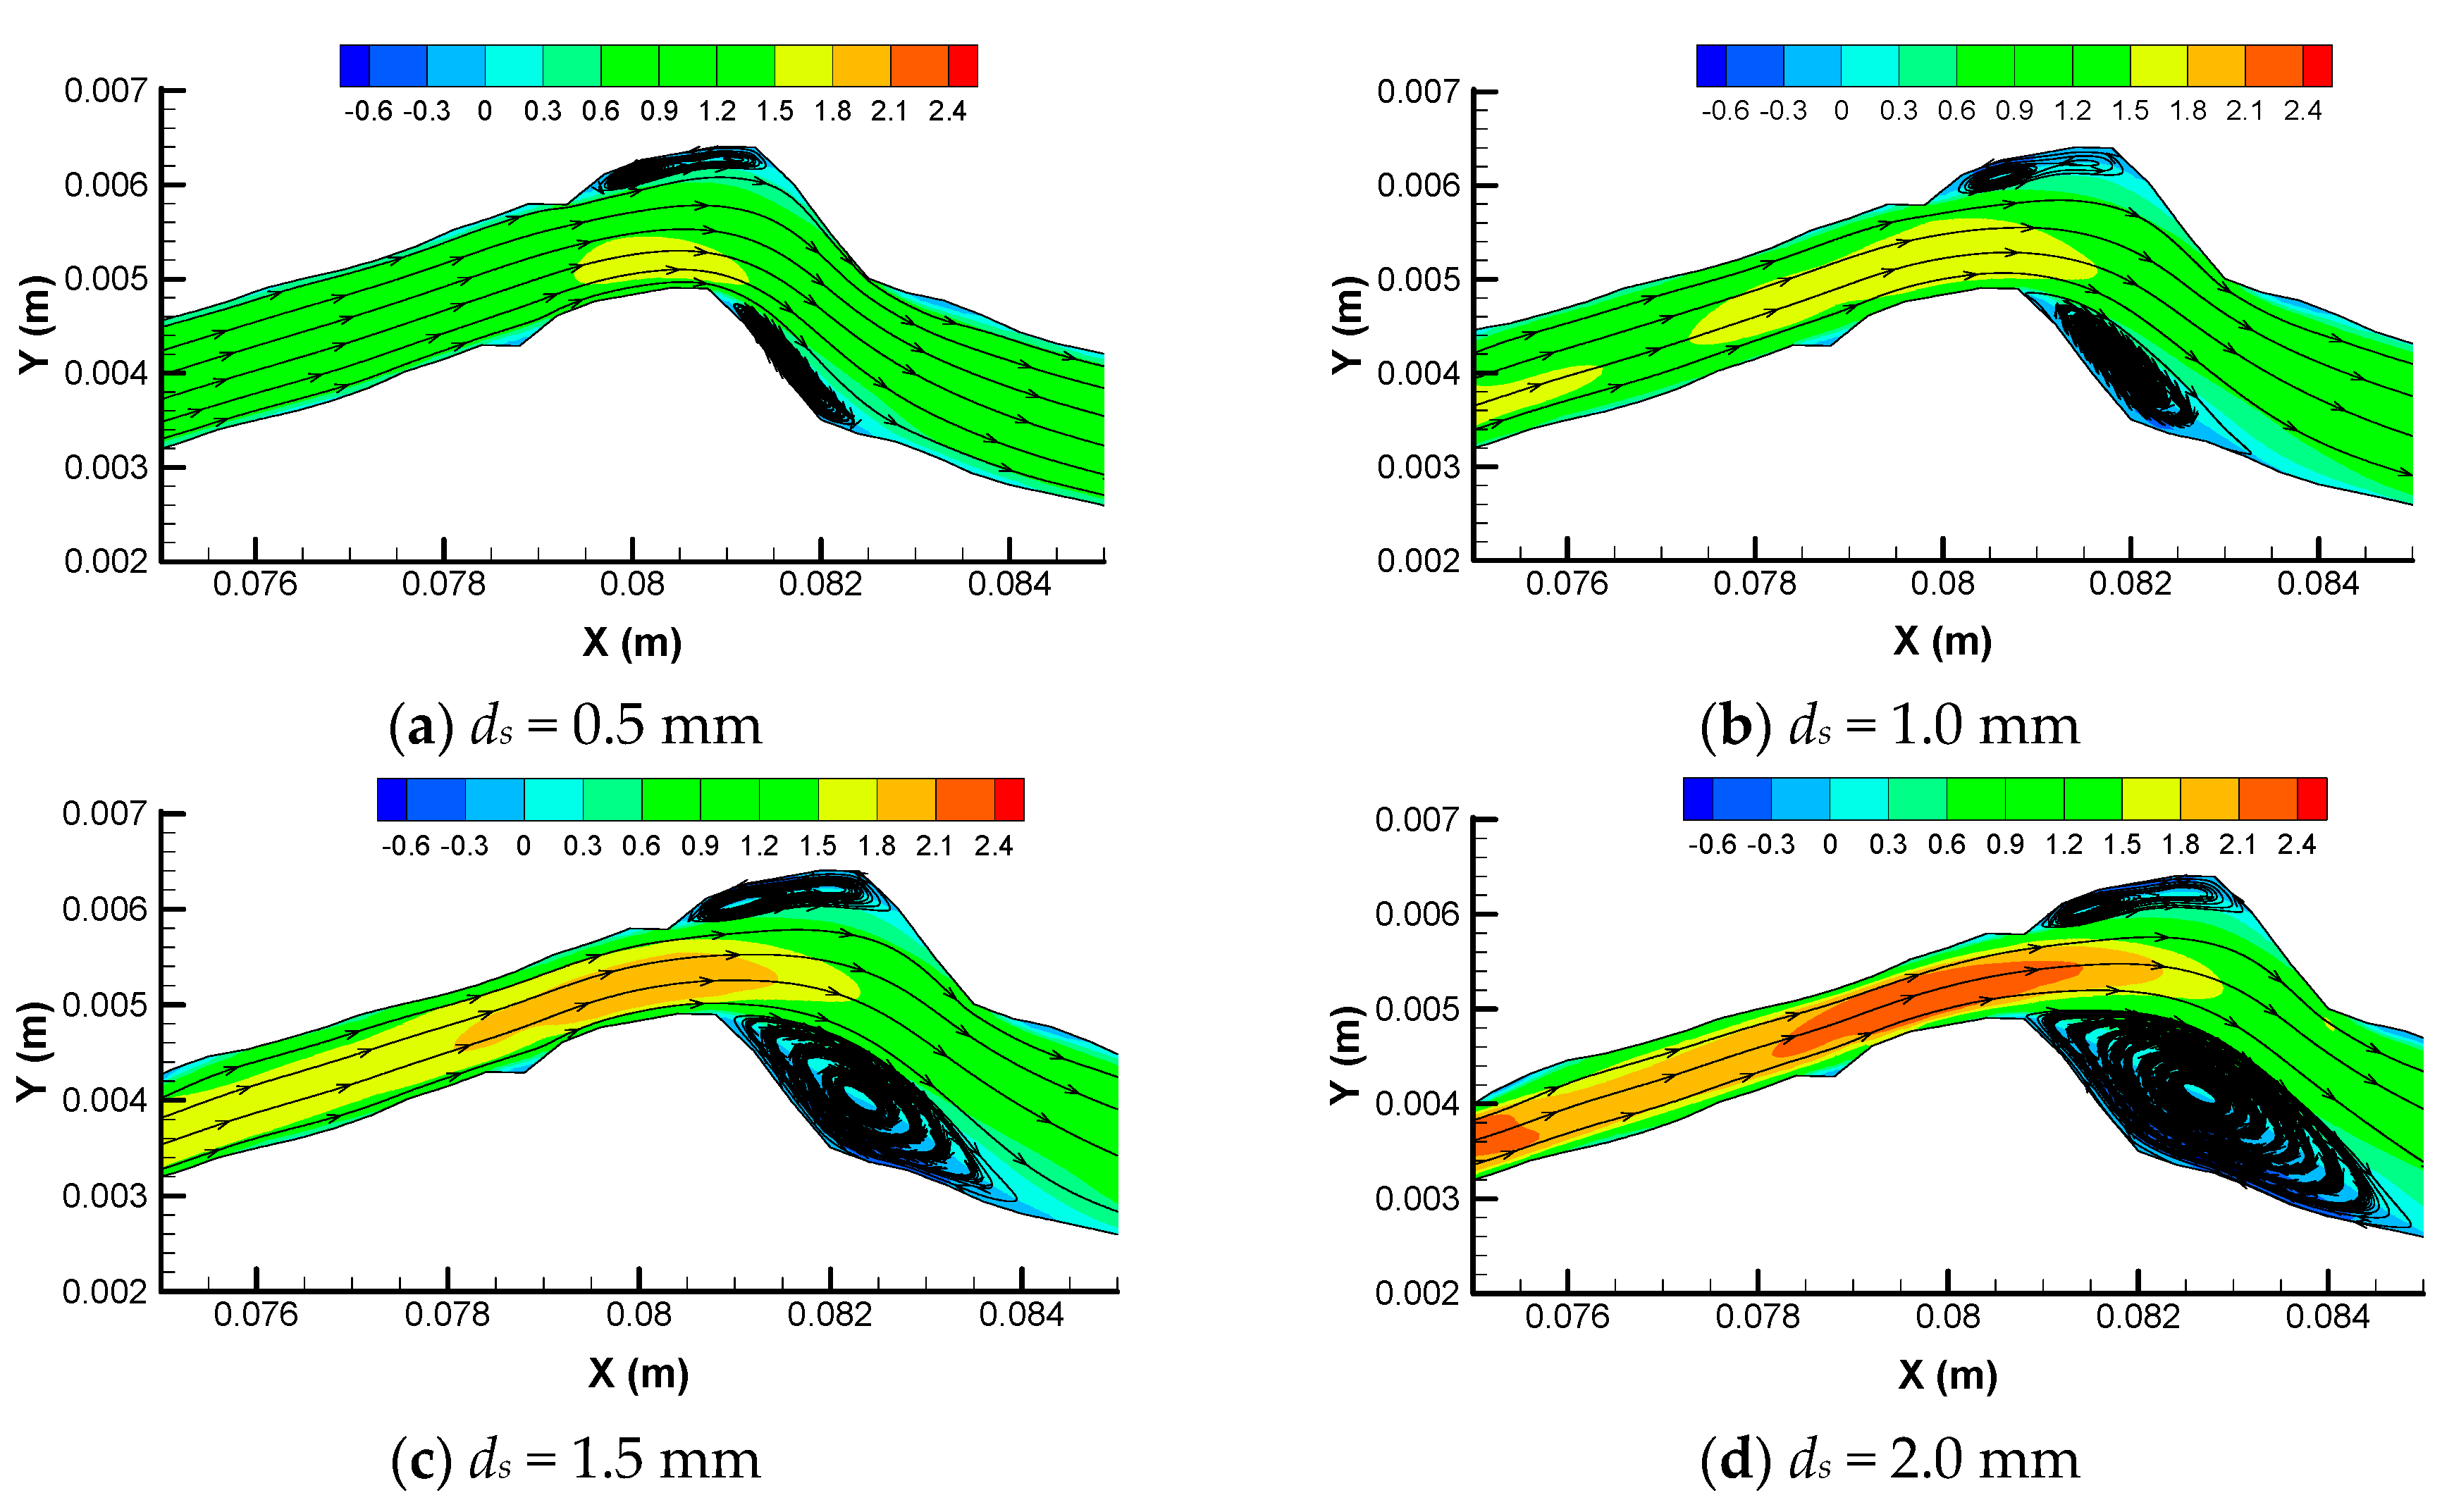
The temporal and spatial distribution of these eddy flow regions also changed with different JRCs and shear displacements. Figure 8 and Figure 9 describe the local eddy development with increasing JRCs and shear displacements, respectively. Because increasing the JRC and shear displacement drove the fracture to a high level of mismatch, the local regions changed from a relatively narrow channel to a wide region and thus produced more and larger eddies. In fractures with larger JRCs and shear displacements, eddy flow phenomena increased and the overall fluid flow became nonlinear, with more complex velocity distribution. The further occurrence and expansion of eddies significantly narrowed the effective flow channel, reduced the fracture permeability, and changed the fracture flow from linear to nonlinear.
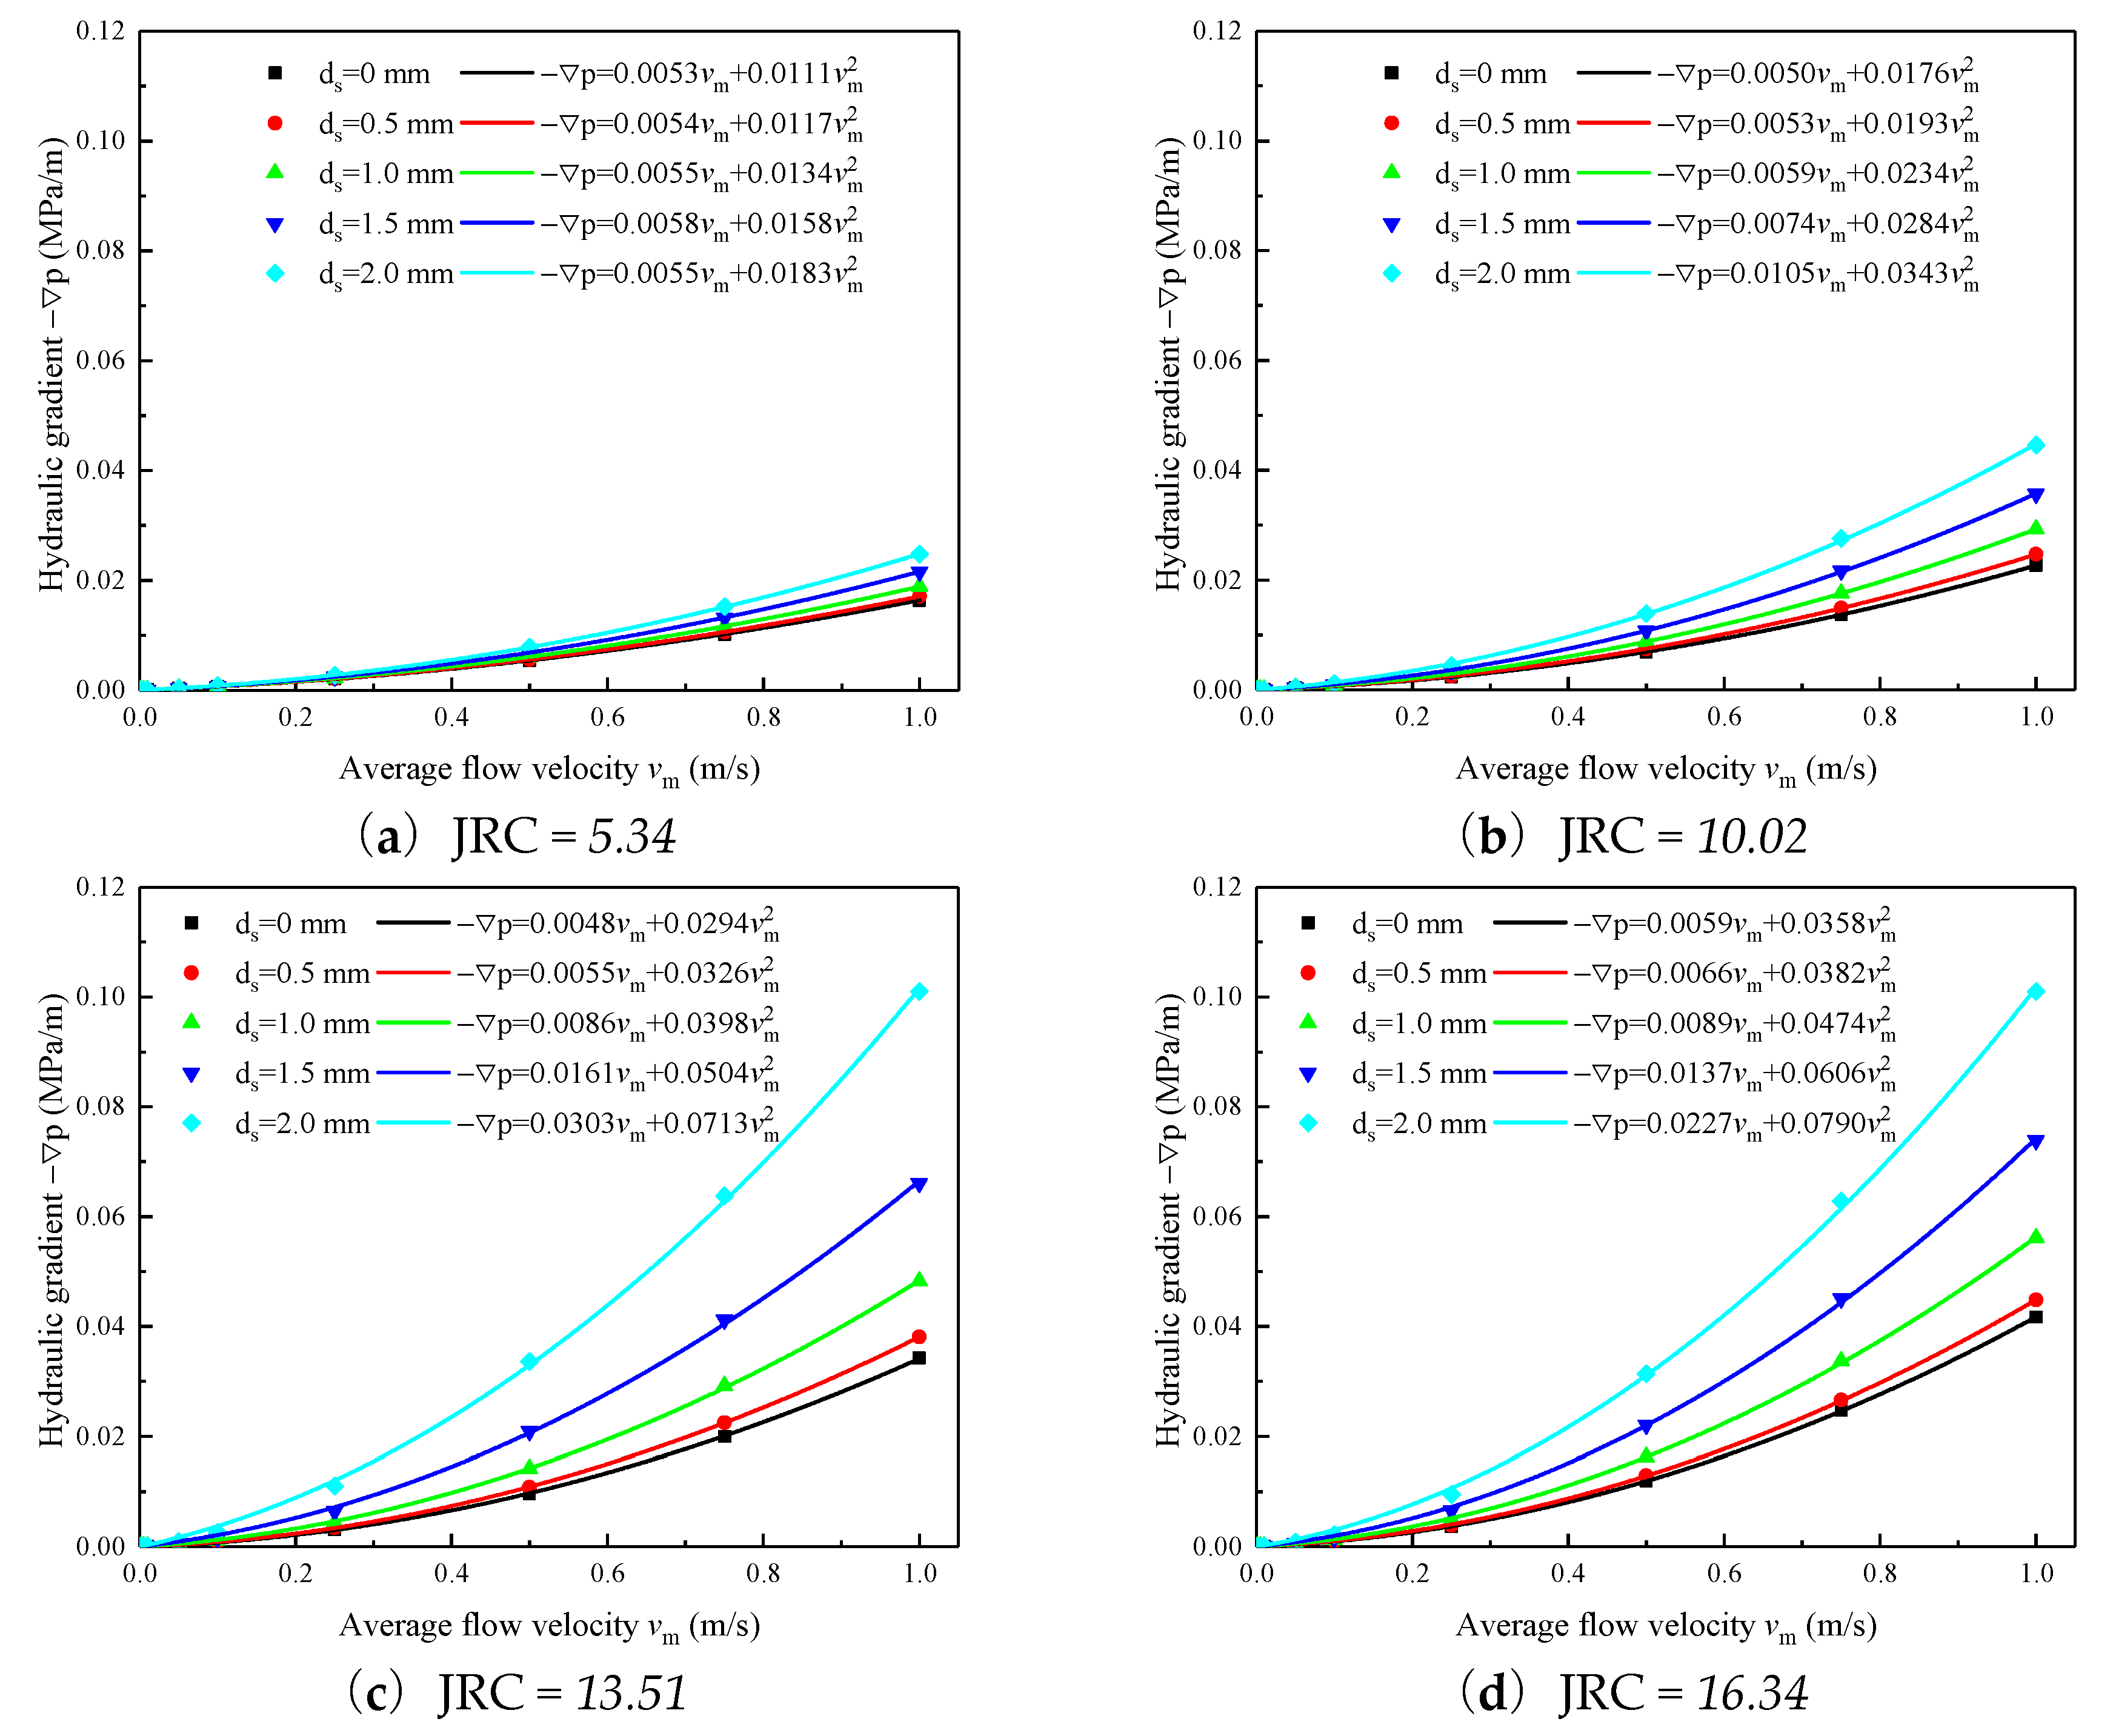
3.2. Correlation between Inlet Flow Velocity and Hydraulic Gradient
The correlation of the average flow velocity to the hydraulic gradient between the inlet and outlet boundaries is important to describe the macroscopic fluid flow behavior. Figure 10 shows the fitting curve of the hydraulic gradient based on Equation (1) as a function of average flow velocity. The hydraulic gradients varied nonlinearly with average flow velocity, and the relationship was represented using the Forchheimer equation with a correlation coefficient greater than 0.999. A higher JRC or shear displacement resulted in a greater degree of mismatching and stronger nonlinearity. When the JRC value was small, there was less effect of shearing on the non-linearity of the pressure drop. It should be noted that the term “nonlinearity” of flow does not mean that the flow regime was turbulent. The small difference between the curves of JRC = 13.51 and JRC = 16.34 at large shear displacement may have been due to the non-stationary nature of fracture profiles with large JRCs, where the vertical aperture did not strictly obey the Gaussian distribution [5].
3.3. Forchheimer Coefficients
The Forchheimer equation (Equation (1)) proved to be adequate for the macroscopic description of water flow in rock fractures. The coefficients A and B are commonly written as:
where is the non-Darcian coefficient or inertial resistance coefficient, is the intrinsic permeability or viscous permeability, is the fluid density, and is the fluid dynamic viscosity.
Based on the best correlation between the flow flux and the hydraulic gradient using the Forchheimer equation, the coefficients and were calculated. Figure 11 and Figure 12 show the correlation of and , respectively, to shear displacement with different JRCs. With an increase of shear displacement, the linear coefficient decreased but the nonlinear coefficient increased, further confirming the presence of nonlinear pressure drops. The greater the value of the JRC, the stronger the effect of change of shear displacement on .
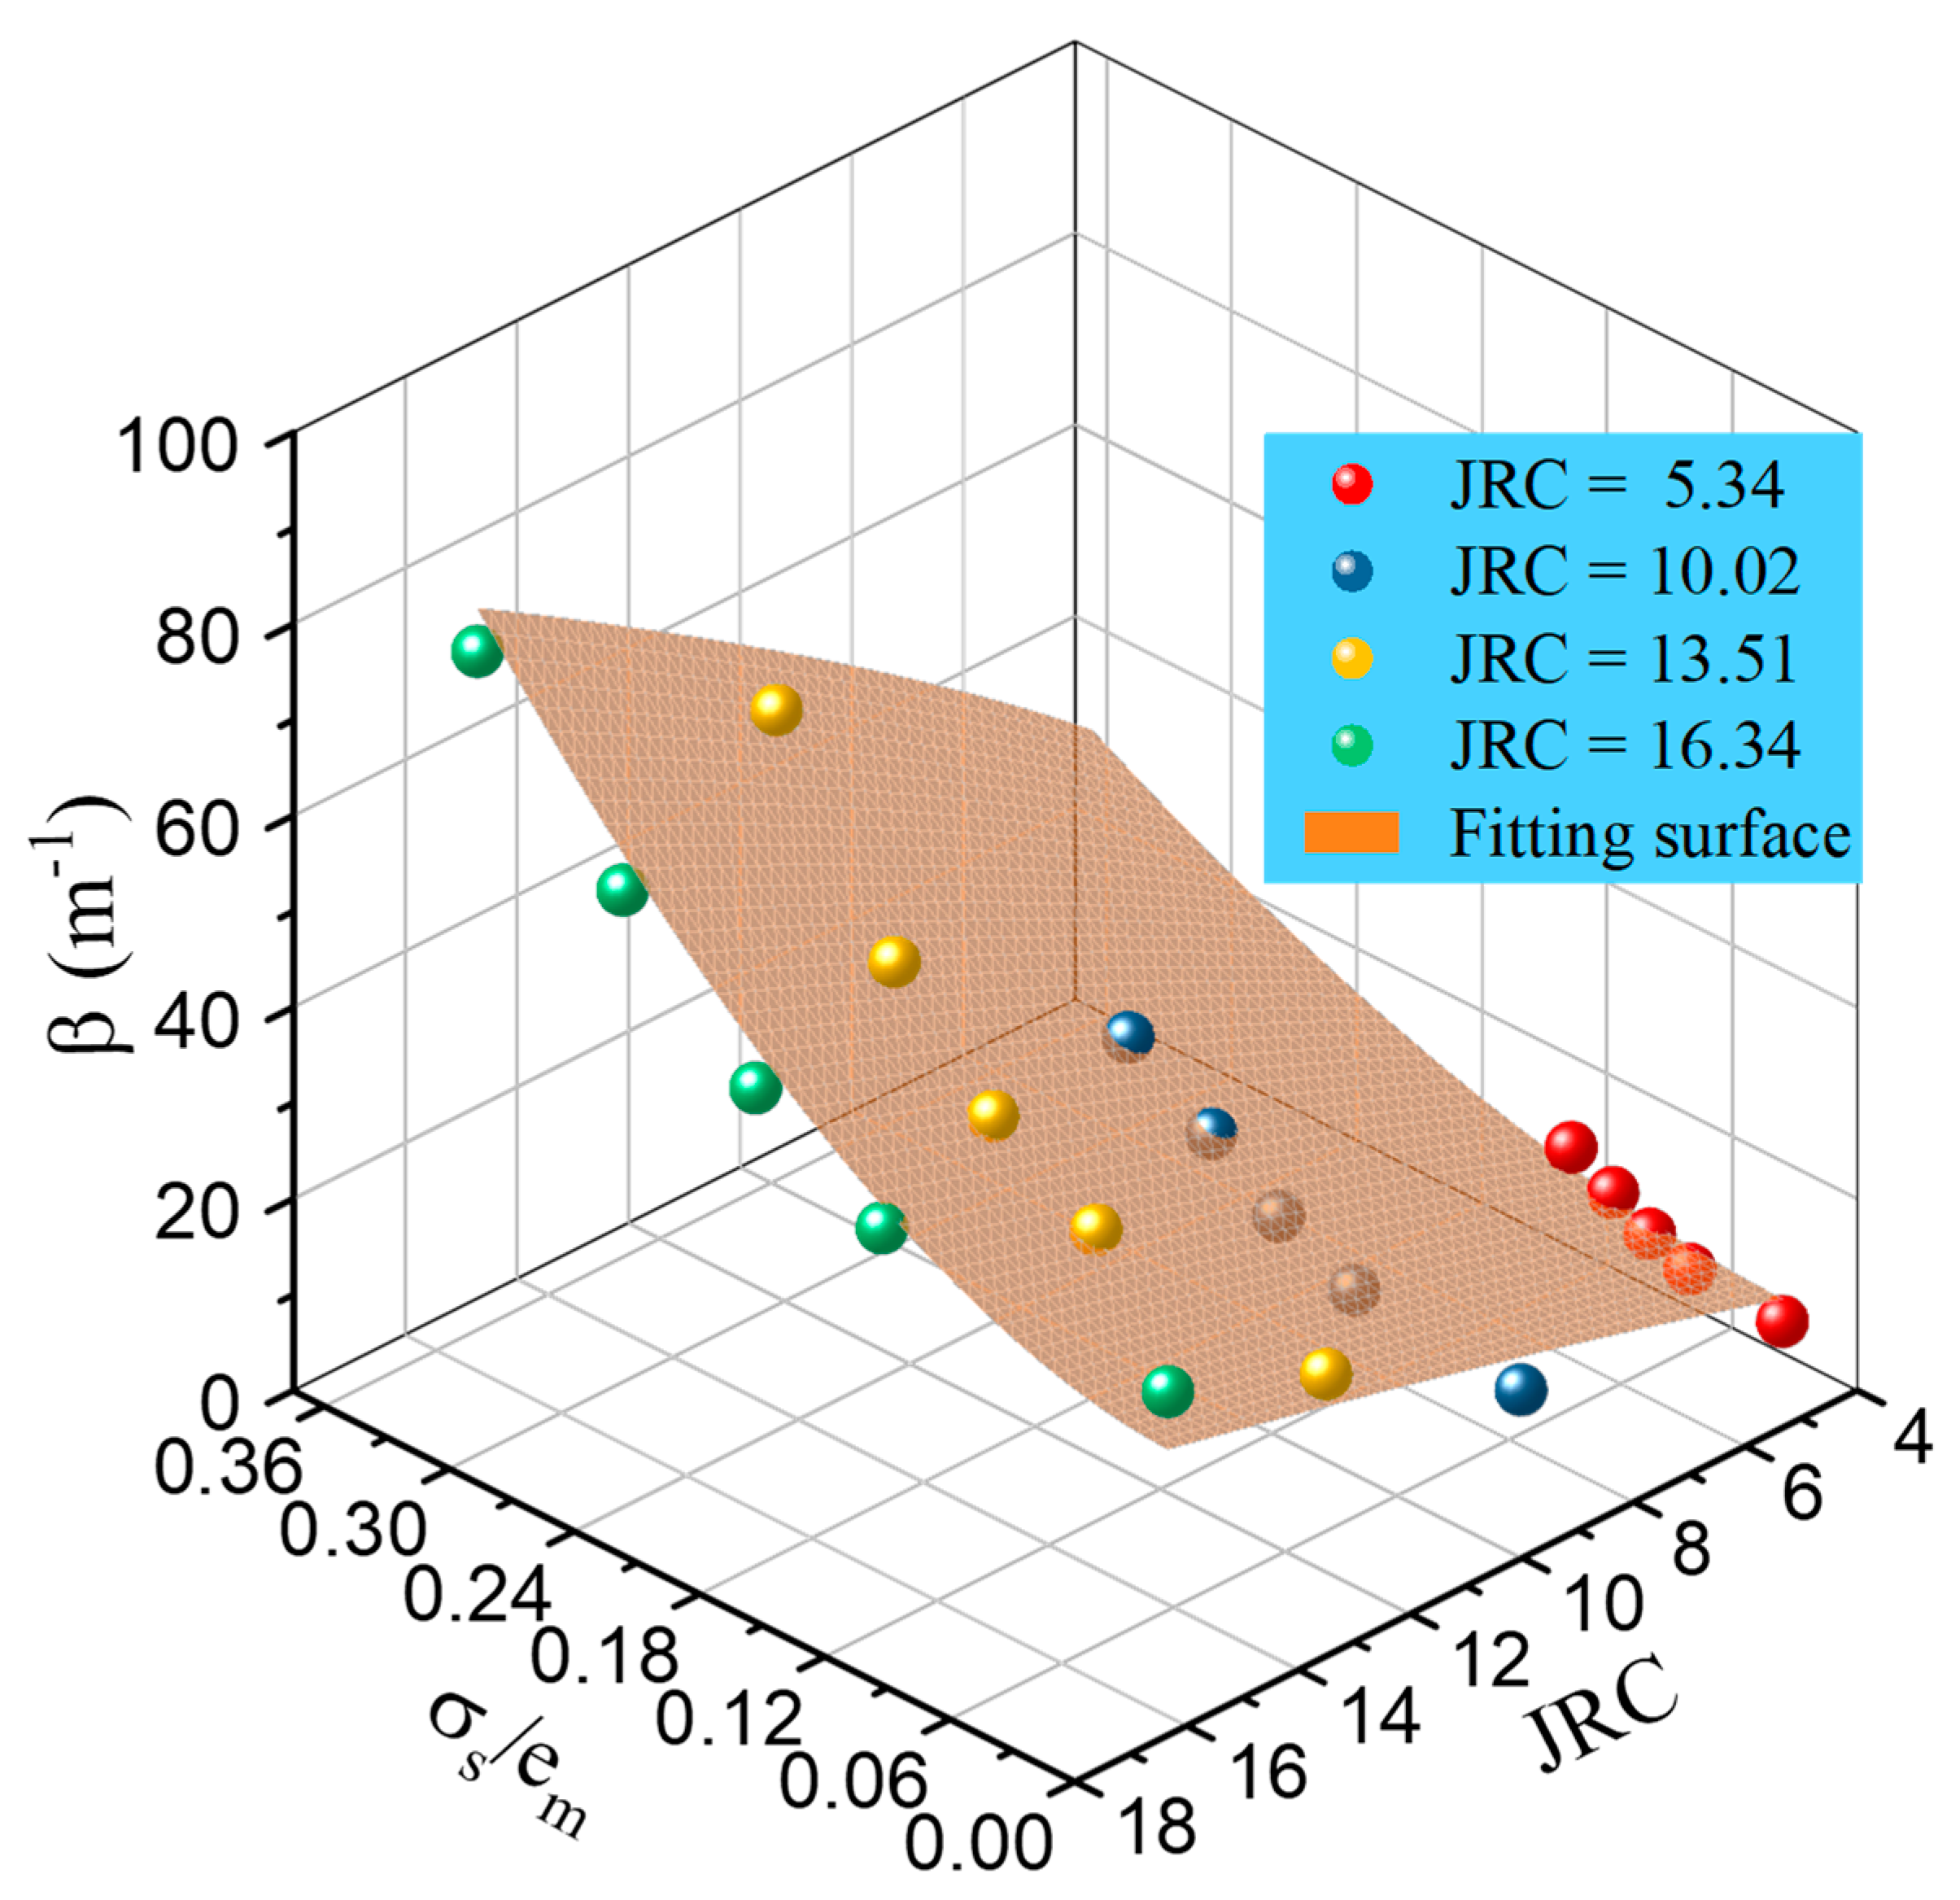
The emergence of nonlinear flow in rough-walled fractures during the shear process was strongly related to the degree of mismatch in the two fracture surfaces [8] and can be characterized as a dimensionless variation coefficient of mean aperture . Because the non-Darcian coefficient was measured using L−1 and mean aperture measured using L, the following equation was used to measure the variation of :
where , , , and are dimensionless parameters that can be determined by the numerical data for , as shown in Figure 12. The most accurate values of the four coefficients were obtained using the Levenberg-Marquardt (LM) optimization algorithm as follows: , , , and . Figure 13 shows a comparison between the prediction using Equation (7) and the numerical data, indicating a reasonable agreement. The correlation coefficient of 0.944 is high as the four coefficients are globally optimized for the data of four JRCs. The equation for can quantify the inertial effect induced by the fracture roughness and spatial heterogeneities of aperture, and provide some insight into the non-Darcian flow behaviors in rough-walled fractures.
3.4. Critical Reynolds Number
The critical Reynolds number is defined as the critical state in which the flow changes to a non-Darcian zone, where the inertial pressure drop reaches percentage of the overall pressure drop. is given as:
The critical Reynolds number can be determined by choosing a proper value of . Considering that is usually taken as 10% [7,31], the critical Reynolds number can be written as:
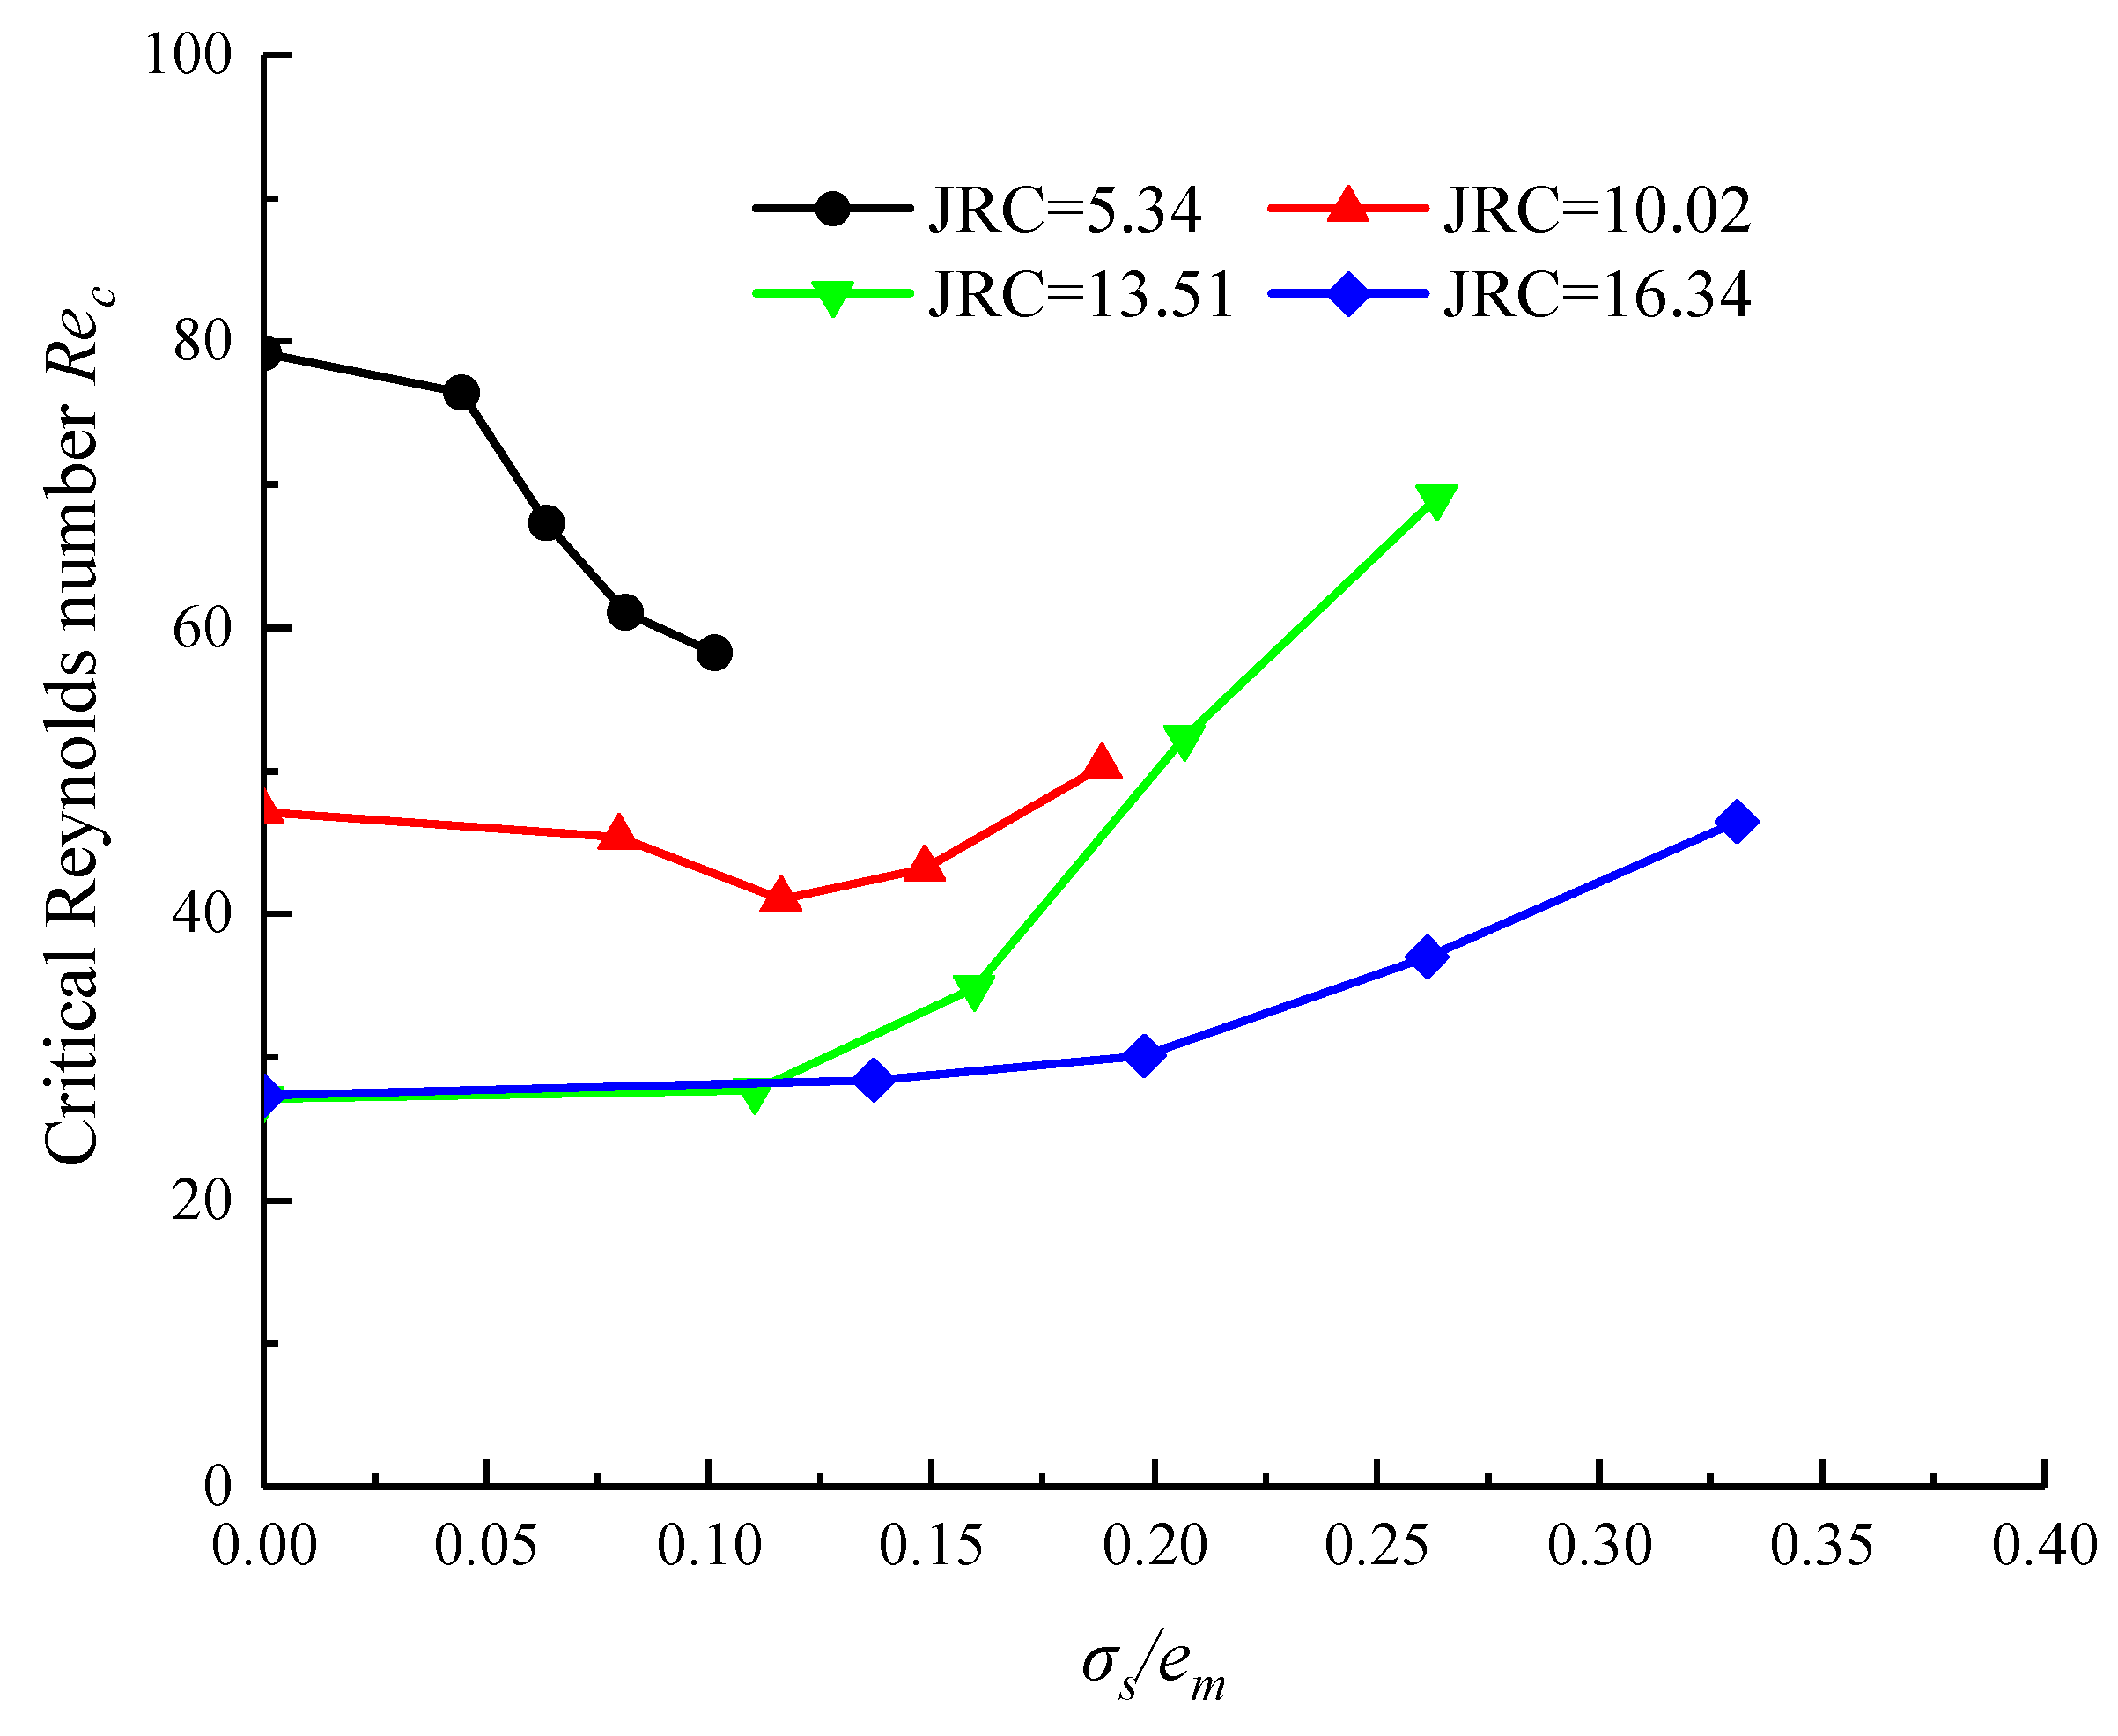
Equation (9) indicates that the transit of fracture flow from linear to nonlinear is a combined effect of aperture, viscous permeability, and inertial resistance. The critical Reynolds number as a function of the variation coefficient and JRCs is plotted in Figure 14. The fluid flow is easier to change into the nonlinear flow regime with a smaller critical Reynolds number. With an increase in the variation coefficient , the critical Reynolds number decreased at first and then increased. The fracture with higher JRCs led to the enhancement of flow nonlinearity and earlier onset of nonlinear laminar flow during shearing. Due to changes in the variation coefficients governed by the shear process and JRCs, significant variations in the coefficients and and the critical Reynolds number were observed. It is clear that surface roughness and mismatching played important roles in the variation of the critical Reynolds numbers and the nonlinearity of the fluid flow through rough-walled rock fracture. It should be noted that the increase in the critical Reynolds number in accordance with increasing heterogeneities of aperture may be due to a significant reduction in fracture conductivity [15].
4. Conclusions
We performed a series of numerical simulations on four standard fractures with different shear displacements to examine the influence of shearing and fracture roughness on non-Darcian flow characteristics. The results showed that increasing the JRC and shear displacement resulted in a high degree of mismatch in the fracture, and eddy flow occurred and expanded, causing a reduction in fracture conductivity and an enhancement of the local complexity of nonlinear fracture water flow. The relationship between the pressure gradient and average flow velocity revealed that the Forchheimer equation offers a good description for the non-Darcian flow behavior in rough-walled fractures with shearing. The effect of shearing and the JRC on the Forchheimer coefficients was examined. A three-parameter equation as a function of the JRC and the variation coefficient of aperture distribution was developed for empirical parameterization of the non-Darcian coefficient . The equation has the advantage of dimensional consistency and fits well with the numerical results. Based on the Forchheimer equation and taking 10% of the nonlinear effect as a critical state to distinguish between linear and nonlinear flow, the critical Reynolds number for the specific flow cases was estimated by the combined effect of aperture, viscous permeability, and inertial resistance at the macroscopic level.
Author Contributions
Conceptualization, B.L., W.X., and L.Y.; methodology and software, B.L., L.Y., and M.H.; resources, W.X., J.X., and M.H.; supervision, W.X. and W.-C.X.; writing, original draft, B.L. and W.-C.X.; writing, review and editing, W.X., J.X. and W.-C.X.; funding acquisition, W.X. and L.Y. All authors have read and agreed to the published version of the manuscript.
Funding
This work was financially supported by the National Key R&D Program of China (Grant No. 2018YFC0407004), the China Postdoctoral Science Foundation (2019M661711), the Fundamental Research Funds for the Central Universities (B200202083), and the National Natural Science Foundation of China (Grant No. 51939004, 11772118).
Conflicts of Interest
The authors declare no conflict of interest.
References
- Long, J.C.S.; Remer, J.S.; Wilson, C.R.; Witherspoon, P.A. Porous media equivalents for networks of discontinuous fractures. Water Resour. Res. 1982, 18, 645–658. [Google Scholar] [CrossRef] [Green Version]
- Brush, D.J.; Thomson, N.R. Fluid flow in synthetic rough-walled fractures: Navier-Stokes, Stokes, and local cubic law simulations. Water Resour. Res. 2003, 39. [Google Scholar] [CrossRef]
- Min, K.-B.; Rutqvist, J.; Tsang, C.-F.; Jing, L. Stress-dependent permeability of fractured rock masses: A numerical study. Int. J. Rock Mech. Min. Sci. 2004, 41, 1191–1210. [Google Scholar] [CrossRef] [Green Version]
- Qian, J.; Zhan, H.; Luo, S.; Zhao, W. Experimental evidence of scale-dependent hydraulic conductivity for fully developed turbulent flow in a single fracture. J. Hydrol. 2007, 339, 206–215. [Google Scholar] [CrossRef]
- Zou, L.; Jing, L.; Cvetkovic, V. Roughness decomposition and nonlinear fluid flow in a single rock fracture. Int. J. Rock Mech. Min. Sci. 2015, 75, 102–118. [Google Scholar] [CrossRef]
- Chen, Y.F.; Zhou, J.Q.; Hu, S.-H.; Hu, R.; Zhou, C.B. Evaluation of Forchheimer equation coefficients for non-Darcy flow in deformable rough-walled fractures. J. Hydrol. 2015, 529, 993–1006. [Google Scholar] [CrossRef]
- Zimmerman, R.W.; Al-Yaarubi, A.; Pain, C.C.; Grattoni, C.A. Non-linear regimes of fluid flow in rock fractures. Int. J. Rock Mech. Min. Sci. 2004, 41, 1–7. [Google Scholar] [CrossRef]
- Zhang, Z.; Nemcik, J. Fluid flow regimes and nonlinear flow characteristics in deformable rock fractures. J. Hydrol. 2013, 477, 139–151. [Google Scholar] [CrossRef]
- Koyama, T.; Neretnieks, I.; Jing, L. A numerical study on differences in using Navier–Stokes and Reynolds equations for modeling the fluid flow and particle transport in single rock fractures with shear. Int. J. Rock Mech. Min. Sci. 2008, 45, 1082–1101. [Google Scholar] [CrossRef] [Green Version]
- Xie, L.Z.; Gao, C.; Ren, L.; Li, C.B. Numerical investigation of geometrical and hydraulic properties in a single rock fracture during shear displacement with the Navier–Stokes equations. Environ. Earth Sci. 2015, 73, 7061–7074. [Google Scholar] [CrossRef]
- Zou, L.; Jing, L.; Cvetkovic, V. Shear-enhanced nonlinear flow in rough-walled rock fractures. Int. J. Rock Mech. Min. Sci. 2017, 97, 33–45. [Google Scholar] [CrossRef] [Green Version]
- Zhou, J.-Q.; Wang, M.; Wang, L.; Chen, Y.-F.; Zhou, C.-B. Emergence of Nonlinear Laminar Flow in Fractures During Shear. Rock Mech. Rock Eng. 2018, 51, 3635–3643. [Google Scholar] [CrossRef]
- Rong, G.; Yang, J.; Cheng, L.; Zhou, C. Laboratory investigation of nonlinear flow characteristics in rough fractures during shear process. J. Hydrol. 2016, 541, 1385–1394. [Google Scholar] [CrossRef]
- Xiong, X.; Li, B.; Jiang, Y.; Koyama, T.; Zhang, C. Experimental and numerical study of the geometrical and hydraulic characteristics of a single rock fracture during shear. Int. J. Rock Mech. Min. Sci. 2011, 48, 1292–1302. [Google Scholar] [CrossRef]
- Javadi, M.; Sharifzadeh, M.; Shahriar, K.; Mitani, Y. Critical Reynolds number for nonlinear flow through rough-walled fractures: The role of shear processes. Water Resour. Res. 2014, 50, 1789–1804. [Google Scholar] [CrossRef] [Green Version]
- Wang, C.; Jiang, Y.; Luan, H.; Sugimoto, S. Effect of shearing on hydraulic properties of rough-walled fractures under different boundary conditions. Energy Sci. Eng. 2020, 8, 865–879. [Google Scholar] [CrossRef]
- Rong, G.; Yang, J.; Cheng, L.; Tan, J.; Peng, J.; Zhou, C. A Forchheimer Equation-Based Flow Model for Fluid Flow Through Rock Fracture During Shear. Rock Mech. Rock Eng. 2018, 51, 2777–2790. [Google Scholar] [CrossRef]
- Xie, H.; Wang, J.-A.; Xie, W.-H. Fractal effects of surface roughness on the mechanical behavior of rock joints. Chaos Solitons Fractals 1997, 8, 221–252. [Google Scholar] [CrossRef]
- Jelly, T.O.; Busse, A. Reynolds and dispersive shear stress contributions above highly skewed roughness. J. Fluid Mech. 2018, 852, 710–724. [Google Scholar] [CrossRef] [Green Version]
- De Marchis, M. Large eddy simulations of roughened channel flows: Estimation of the energy losses using the slope of the roughness. Comput. Fluids 2016, 140, 148–157. [Google Scholar] [CrossRef]
- De Marchis, M.; Saccone, D.; Milici, B.; Napoli, E. Large Eddy Simulations of Rough Turbulent Channel Flows Bounded by Irregular Roughness: Advances Toward a Universal Roughness Correlation. Flow Turbul. Combust. 2020, 105, 627–648. [Google Scholar] [CrossRef]
- Zoorabadi, M.; Saydam, S.; Timms, W.; Hebblewhite, B. Non-linear flow behaviour of rough fractures having standard JRC profiles. Int. J. Rock Mech. Min. Sci. 2015, 76, 192–199. [Google Scholar] [CrossRef]
- Dou, Z.; Chen, Z.; Zhou, Z.; Wang, J.; Huang, Y. Influence of eddies on conservative solute transport through a 2D single self-affine fracture. Int. J. Heat Mass Transf. 2018, 121, 597–606. [Google Scholar] [CrossRef]
- Chen, Y.; Lian, H.; Liang, W.; Yang, J.; Nguyen, V.P.; Bordas, S.P.A. The influence of fracture geometry variation on non-Darcy flow in fractures under confining stresses. Int. J. Rock Mech. Min. Sci. 2019, 113, 59–71. [Google Scholar] [CrossRef]
- Barton, N.; Choubey, V. The shear strength of rock joints in theory and practice. Rock Mech. 1977, 10, 1–54. [Google Scholar] [CrossRef]
- Tse, R.; Cruden, D.M. Estimating joint roughness coefficients. Int. J. Rock Mech. Min. Sci. Geomech. Abstr. 1979, 16, 303–307. [Google Scholar] [CrossRef]
- Yeo, I.W.; de Freitas, M.H.; Zimmerman, R.W. Effect of shear displacement on the aperture and permeability of a rock fracture. Int. J. Rock Mech. Min. Sci. 1998, 35, 1051–1070. [Google Scholar] [CrossRef]
- Huang, N.; Liu, R.; Jiang, Y.; Li, B.; Yu, L. Effects of fracture surface roughness and shear displacement on geometrical and hydraulic properties of three-dimensional crossed rock fracture models. Adv. Water Resour. 2018, 113, 30–41. [Google Scholar] [CrossRef]
- Zhang, Q.; Luo, S.; Ma, H.; Wang, X.; Qian, J. Simulation on the water flow affected by the shape and density of roughness elements in a single rough fracture. J. Hydrol. 2019, 573, 456–468. [Google Scholar] [CrossRef]
- Shih, T.-H.; Liou, W.W.; Shabbir, A.; Yang, Z.; Zhu, J. A new k-ϵ eddy viscosity model for high Reynolds number turbulent flows. Comput. Fluids 1995, 24, 227–238. [Google Scholar] [CrossRef]
- Zeng, Z.; Grigg, R. A Criterion for Non-Darcy Flow in Porous Media. Transp. Porous Media 2006, 63, 57–69. [Google Scholar] [CrossRef]
Figure 1.
Standard profiles of fracture surfaces with different joint roughness coefficients (JRCs).
Figure 1.
Standard profiles of fracture surfaces with different joint roughness coefficients (JRCs).

Figure 2.
Two-dimensional fracture simulating shear process.

Figure 3.
Gaussian distribution and vertical apertures for different shear displacements when JRC = 5.34.
Figure 3.
Gaussian distribution and vertical apertures for different shear displacements when JRC = 5.34.

Figure 4.
Gaussian distribution and vertical apertures for different shear displacements when JRC = 10.02.
Figure 4.
Gaussian distribution and vertical apertures for different shear displacements when JRC = 10.02.

Figure 5.
Gaussian distribution and vertical apertures for different shear displacements when JRC = 13.51.
Figure 5.
Gaussian distribution and vertical apertures for different shear displacements when JRC = 13.51.

Figure 6.
Gaussian distribution and vertical apertures for different shear displacements when JRC = 16.34.
Figure 6.
Gaussian distribution and vertical apertures for different shear displacements when JRC = 16.34.

Figure 7.
Eddy evolution resulting from different injection velocities, where JRC = 16.34 and ds = 2.0 mm. Re, Reynolds number.
Figure 7.
Eddy evolution resulting from different injection velocities, where JRC = 16.34 and ds = 2.0 mm. Re, Reynolds number.

Figure 8.
Eddy evolution with different JRCs, where Re = 1500 and ds = 2.0 mm.


Figure 9.
Eddy evolution with different shear displacements, where Re = 1500 and JRC = 16.34.

Figure 10.
Non-Darcian simulation results and fitting curves using the Forchheimer equation.

Figure 11.
Relationship between intrinsic permeability and shear displacement.

Figure 12.
Relationship between the non-Darcian coefficient and shear displacement.

Figure 13.
Non-Darcian coefficient results and fitting surface as a function of and JRCs.

Figure 14.
Relationship between critical Reynolds numbers and with different JRCs.


Table 1.
Statistical parameters for Gaussian fitting of vertical aperture with different fractures.
| JRC | Shear Displacement ds (mm) | |||
|---|---|---|---|---|
| 5.34 | 0.5 | 1.497 | 0.0665 | 0.0444 |
| 1.0 | 1.494 | 0.1193 | 0.0799 | |
| 1.5 | 1.491 | 0.1644 | 0.1103 | |
| 2.0 | 1.488 | 0.2040 | 0.1371 | |
| 10.02 | 0.5 | 1.488 | 0.0947 | 0.0636 |
| 1.0 | 1.477 | 0.1716 | 0.1162 | |
| 1.5 | 1.466 | 0.2341 | 0.1597 | |
| 2.0 | 1.454 | 0.2874 | 0.1977 | |
| 13.51 | 0.5 | 1.494 | 0.1214 | 0.0813 |
| 1.0 | 1.489 | 0.2211 | 0.1485 | |
| 1.5 | 1.483 | 0.3068 | 0.2069 | |
| 2.0 | 1.477 | 0.3861 | 0.2614 | |
| 16.34 | 0.5 | 1.490 | 0.1510 | 0.1013 |
| 1.0 | 1.481 | 0.2789 | 0.1883 | |
| 1.5 | 1.471 | 0.3876 | 0.2635 | |
| 2.0 | 1.461 | 0.4836 | 0.3310 |
Publisher’s Note: MDPI stays neutral with regard to jurisdictional claims in published maps and institutional affiliations. |
© 2020 by the authors. Licensee MDPI, Basel, Switzerland. This article is an open access article distributed under the terms and conditions of the Creative Commons Attribution (CC BY) license (http://creativecommons.org/licenses/by/4.0/).
Share and Cite
MDPI and ACS Style
Li, B.; Xu, W.; Yan, L.; Xu, J.; He, M.; Xie, W.-C. Effect of Shearing on Non-Darcian Fluid Flow Characteristics through Rough-Walled Fracture. Water 2020, 12, 3260. https://doi.org/10.3390/w12113260
AMA Style
Li B, Xu W, Yan L, Xu J, He M, Xie W-C. Effect of Shearing on Non-Darcian Fluid Flow Characteristics through Rough-Walled Fracture. Water. 2020; 12(11):3260. https://doi.org/10.3390/w12113260
Chicago/Turabian StyleLi, Biao, Weiya Xu, Long Yan, Jianrong Xu, Mingjie He, and Wei-Chau Xie. 2020. "Effect of Shearing on Non-Darcian Fluid Flow Characteristics through Rough-Walled Fracture" Water 12, no. 11: 3260. https://doi.org/10.3390/w12113260
Note that from the first issue of 2016, this journal uses article numbers instead of page numbers. See further details here.