Groundwater Chemistry and Stratification in the Flooded Hard-Coal Mine Shaft “Nowy I” (Nowa Ruda Region, SW Poland)


Faculty of Geoengineering, Mining and Geology, Wrocław University of Science and Technology, Wybrzeże Wyspiańskiego 27, 50370 Wrocław, Poland
*
Author to whom correspondence should be addressed.
Water 2020, 12(11), 3257; https://doi.org/10.3390/w12113257
Submission received: 30 September 2020
/
Revised: 8 November 2020
/
Accepted: 16 November 2020
/
Published: 20 November 2020
(This article belongs to the Special Issue Geochemistry of Groundwater)
Abstract
:The flooding of unprofitable underground mines is one of the methods of their closure. After the drainage of the mine has stopped, the voids left in the rock mass as a result of mining, are filled with inflowing groundwater. In this way, reservoirs of groundwater with specific physicochemical parameters are formed. These parameters depend on the interaction of the water flowing into the workings with the rock formations. It was the economic situation in the 1990s that led to the closure of hard coal mines in the Nowa Ruda Coal Basin, where the flooded “Nowy I” shaft is located. In that shaft, in 2008, hydrogeological research was performed and groundwater samples from five various depths were collected. The aim of the study was to recognize if groundwater stratification occurs in the shaft. In 2015, a sample of the water outflowing through the “Aleksander” adit was taken to check the potential influence of mine flooding on the environment and to confirm the changes in groundwater chemistry over time. These were the first, and so far, the only studies on the chemical composition of water in the flooded mine in that area. The article presents results of the preliminary research, which confirmed the existence of not obvious hydrogeochemical stratification in the shaft. It can be assumed that below the depth of 350 m, the water circulating through mining excavations exhibits the highest electrical conductivity and the highest concentration of Ca, K, SO, Fe. In the depth range of 320–380 m there is a transition zone, in which a decrease of Eh value and a change of reduction and oxidation is recorded. Above this zone, infiltration water inflow, from outside the shaft casing, dominates. The research shows that it would be necessary to perform additional sampling of the water in the shaft at greater depths, as well as to perform isotope analysis and periodical tests for at least several years. This would allow for a more complete characterisation of hydrogeochemical processes taking place in the flooded mine.
1. Introduction
In many European countries, in particular in the UK and Poland, mining closures in the 1980s and 1990s brought about the need for solving unprecedented problems [1,2]. One of the more serious issues is the changing in hydrogeological rock mass conditions, caused by halted drainage and spontaneous flooding of the mines [3,4,5]. The flooding process is usually gradual and has an influence on the natural environment, especially on groundwater and surface water [6], and can cause greenhouse gas emissions [7].
In flooded underground mines, the process of geochemical stratification is common, which means that the water filling abandoned mines does not form a single homogeneous reservoir, rather it exhibits stability in separate layers. According to J. Zeman’s research [8,9], contrary to the homogenizing and mixing effects of temperature gradients and the passage of time, water in the flooded mines remains stratified. This stratification is not even disturbed by the discharge of excess mine water into surface watercourses [8]. It is assumed that the stratification stability is caused by the increased water density at greater depths, resulting from high concentrations of dissolved substances and increased hydrostatic pressure. The phenomenon of water stratification has been observed and described worldwide in many coal, metal ore, and lignite mines. It is worth quoting papers describing stratification in anthracite mines in Pennsylvania (USA) [10,11] or the phenomenon of acid mine drainage (AMD) in flooded open-pit mines [12]. An interesting insight to problems with mine water quality in Scotland can be found in Marsden’s et al., work [13]. Geochemical processes in flooded mines along with water stratification are described in detail by Younger [14,15,16,17,18], Nutatall [19] and Wolkersdorfer [20]. Some papers also present mine water issues in opencast mines [21,22].
The use of deep underground probes for water samples to be taken from flooded excavations is also described from a methodological point of view in [10], which allows for appropriate preparation in field studies. Wolkersdorfer and others [23] published the latest methodological review, which concisely presents the main principles of mine water testing in the field and interpretation of these results.
Moreover, one can find some review papers that summarize the current state of knowledge on stratification in the flooded mine excavations [24,25], which organize the terminology used in some sense. Among other things, we learn from both papers that the nomenclature describing the stratification process is ambiguous. Even with regard to the stratification itself, there are discrepancies in terminology, e.g., Rapantova et al. [26] write about mine water stratification, engineers [27] about mine basin stratification, and Melchers et al. [28] about density stratification. The individual layers in a flooded mine reservoir are also termed differently, as Mugova and Wolkersdorfer briefly describe [24,25].
A well-documented example of mine water stratification is the abandoned Frances Colliery mine, located near Kirkcalda in East Fife (Scotland) and is connected underground to two other abandoned deep mines (Randolph and Michael). The obtained data set allows one to understand the principles of stratification as well as to illustrate the main reasons why stratification is of practical importance [19]. Less mineralized water of shallower circulation accumulates in the upper part, while highly mineralized water accumulates in deeper parts. Deep water contains very high concentrations of sulfates, iron and other ions associated with pyrite oxidation [19,29,30,31,32]. The stability of such a system is disturbed, e.g., when a rebuilding groundwater table meets an old mining excavation site above it. As a result of their filling, water flow rates increase and mixing occurs due to turbulent flow within the shaft. When the filling of excavations at a given level is completed, the geochemical stratification is restored. Mine water stratification also causes a decrease in mineralization of the excess water flowing to the surface and limiting of the water mixing zone range resulting from the flooding rate of individual mining levels. For several years, research has also been carried out worldwide on modelling the stratification phenomenon to forecast hydrogeological changes and minimize the environmental impact of mine closures, and also to establish the best practices in the long-term management of a closed mine [22,33]. Monitoring of the water in a flooded mine in the years following its closure allows for tracking of the flooding process and changes in hydrogeological conditions. The results of these observations can be used not only to model the hydrogeochemical evolution of mine water, but also for analyses of low emission heating systems based on mine water [34,35,36,37].
In Poland, the phenomenon of stratification is documented for the Upper Silesian Coal Basin (USCB) and can be found in the studies of Frolik [38] or Banks et al. [30]. So far, the literature does not describe the stratification in flooded hard coal mines in Lower Silesia. The shaft that allowed for investigation and confirmation such processes in the Lower Silesian Coal Basin (LSCB) is the “Nowy I” shaft of the Nowa Ruda mine, which was closed down in 2002. The results presented in this article are the first undertaking of the topic of mine water stratification in the Nowa Ruda region. They are presented on the background of hydrogeological conditions from the former mining operation. Despite the local character of the research carried out, the results obtained provide interesting comparative material for studies in other foreign coal basins, including the neighbouring Czech Republic and Germany. Moreover, this work is unique because the “Nowy I” shaft is the only place in the LSCB where testing at such depths could be done. At the moment, the technical condition of the shaft is unknown and it is uncertain whether similar tests can be performed in the future.
2. Materials and Methods
2.1. Study Area
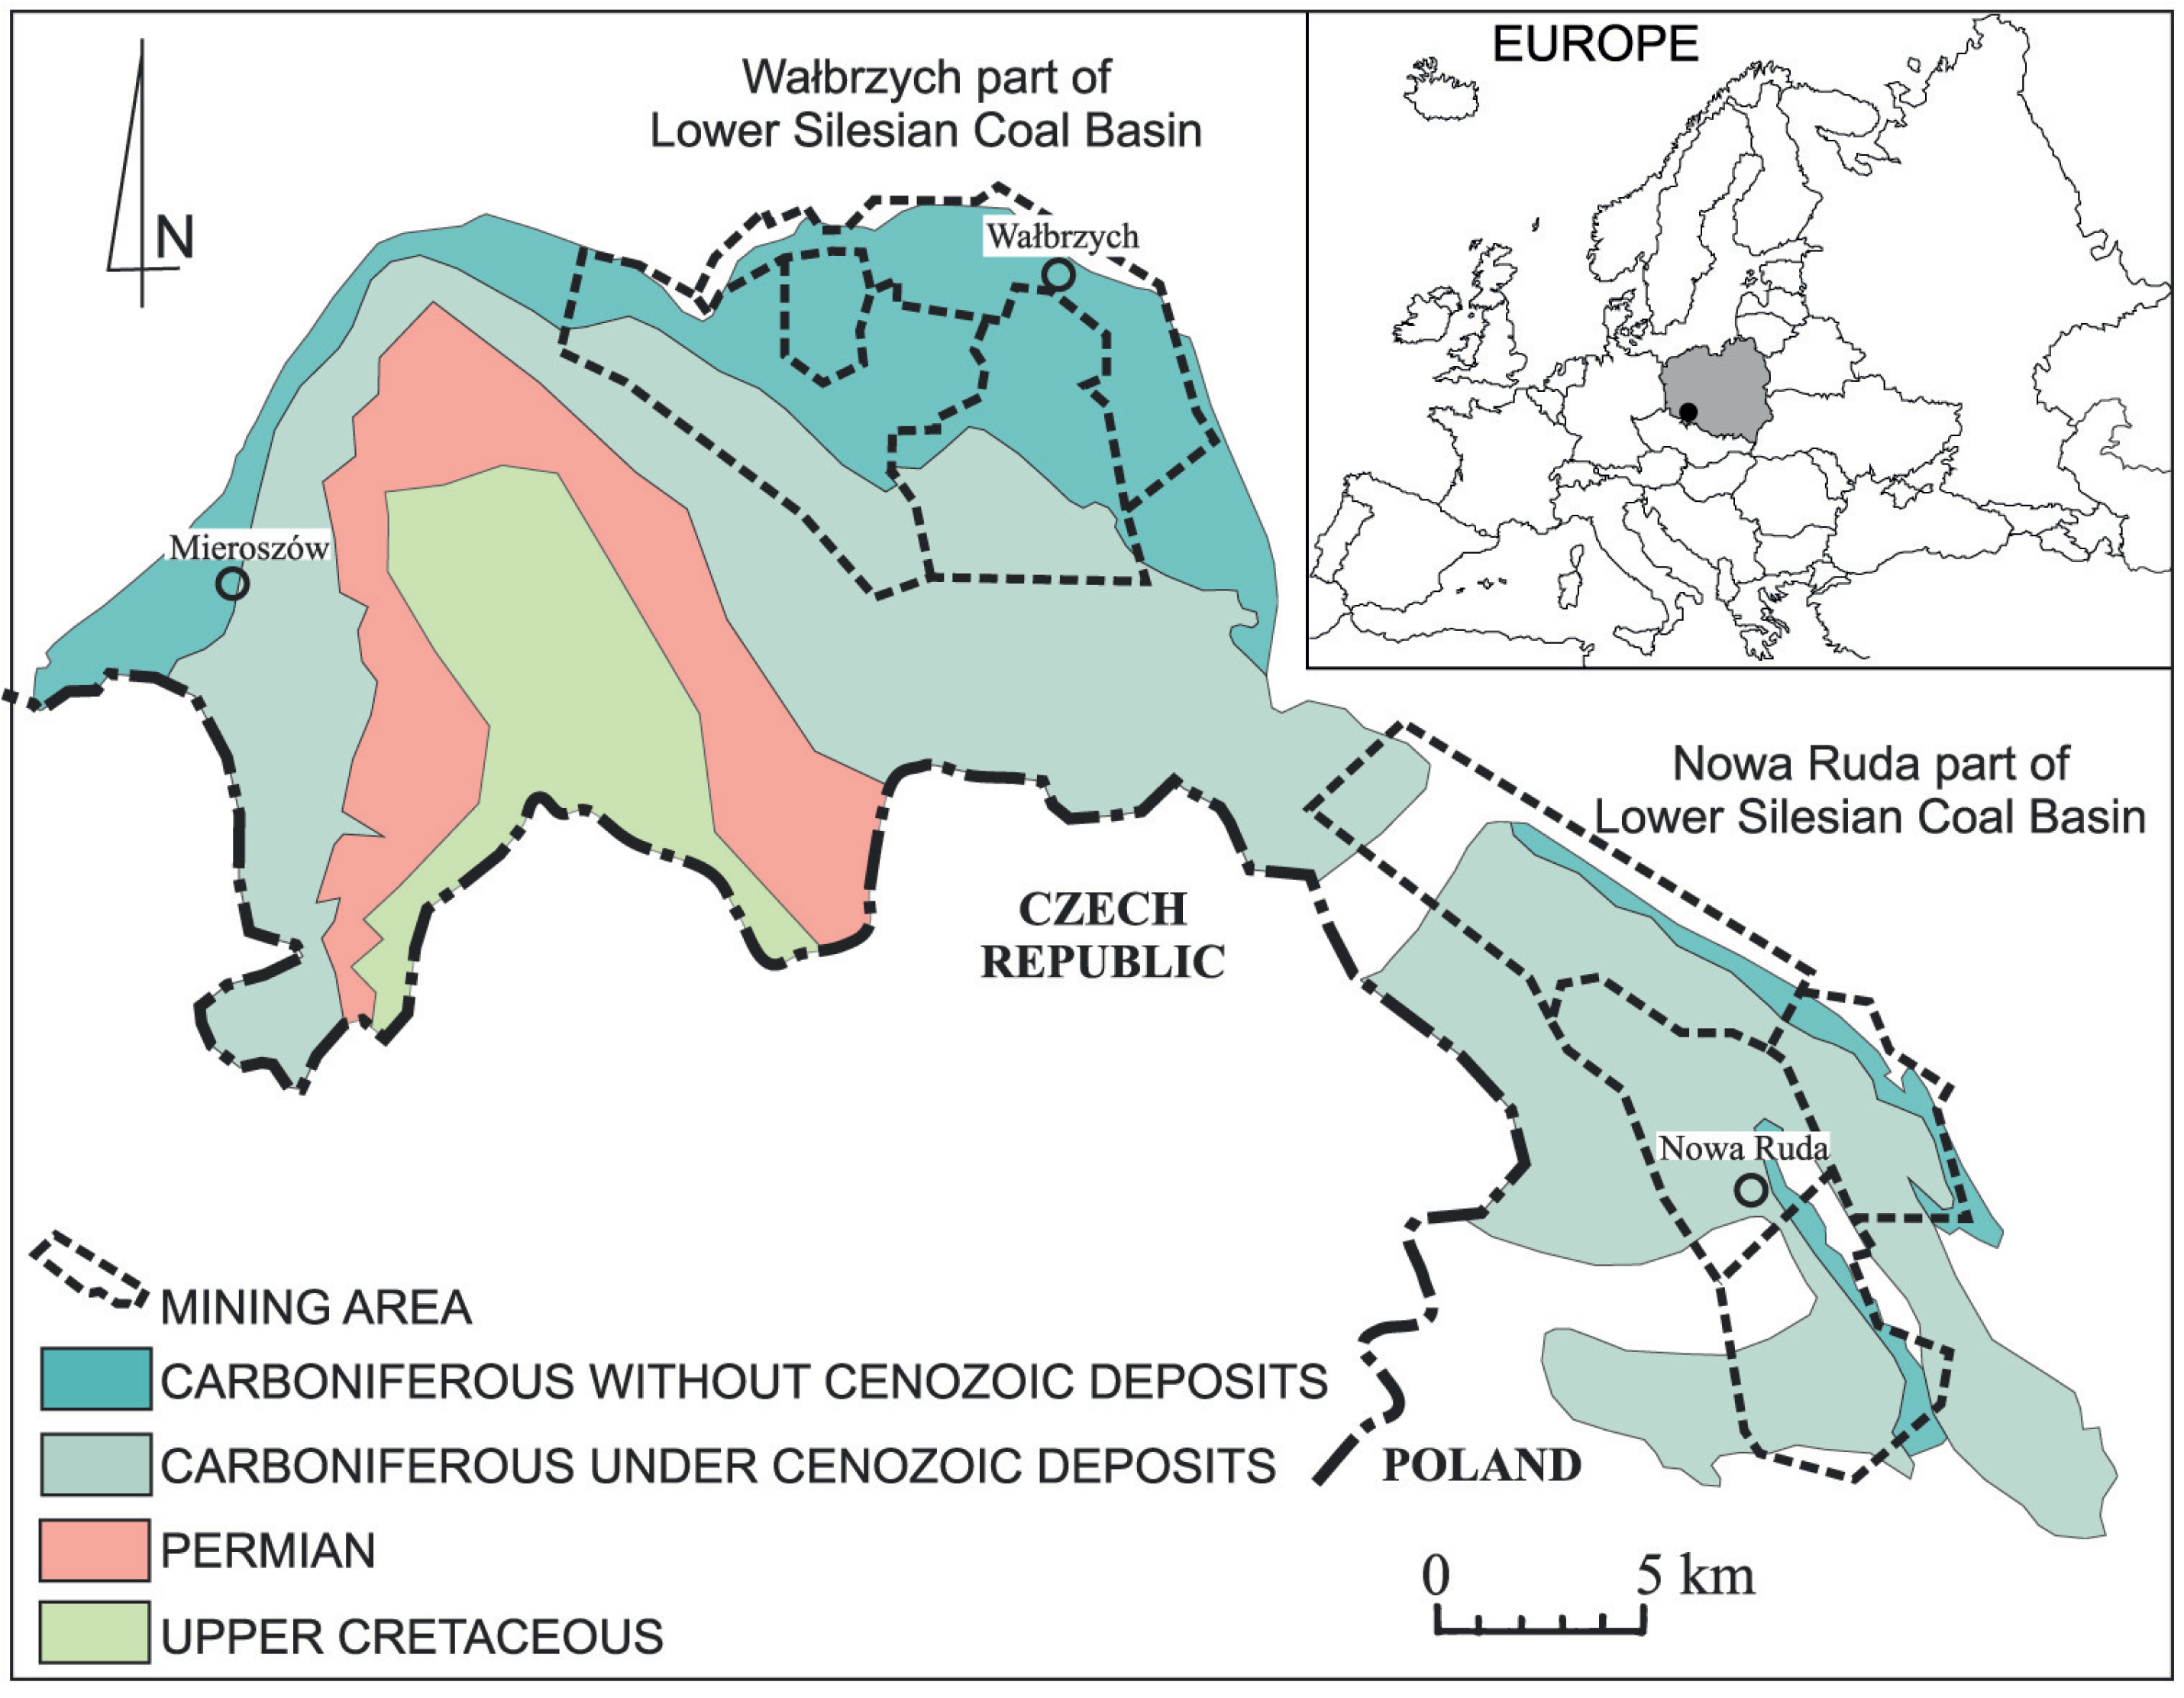
The study area is located in south–western Poland, in Lower Silesia, in the south-eastern part of the city of Nowa Ruda (Słupiec district) (Figure 1). The “Nowy I” shaft is a legacy of the “Nowa Ruda” hard coal mine (KWK “Nowa Ruda”), which was liquidated in 2000 and has been operating since 1945 in the LSCB. This shaft is situated in the Słupiec Basin, in the former “Słupiec” mining area.
The strongly modified morphology of the KWK “Nowa Ruda” area is a result of complicated geological structure and anthropogenic transformations related to the exploitation of coal and other mineral resources. The natural denivelations reach a maximum of 200–300 m [39]. Such morphology favors a rapid outflow of rainwater toward surface watercourses. The closest vicinity is mainly drained by the left-bank tributaries of the Ścinawa River: Bożkowski Stream (in the south) and Dzik Stream in the north-west and west. These streams are characterized by high variability of flows strictly dependent on rainfall [39].
The LSBC was formed in an upper-Devonian crypto-volcanic caldera where limnetic Carboniferous sedimentation has taken place [40]. The following geological units are identified here: the Wolibórz Syncline, the Czerwieńczyce Graben, the Nowa Ruda-Bożkowa gabbro-diabase Massif, the Nowa Ruda Syncline (with the southernmost part called the Słupiec Basin), the Ścinawka Uplift [41,42,43].
The Słupiec Basin, where the “Nowy I” shaft is located, is a structure of about 20 km long and 4–5 km wide with the NW-SE course. It is filled with Carboniferous, Permian and Quaternary deposits, inclining at an angle even up to 90 degrees. These sediments are squeezed between the elevations of the crystalline basement (gabbros and diabases) and the Kłodzko metamorphic rocks (phyllites, slates, conglomerates and amphibolites) [44,45,46].
In the geological structure of the Słupiec basin, several rock series of different ages can be distinguished:
- The Noworudzka sequence of sediments (Namurian-Visean) that is formed by weathered formations, represented by conglomerates and diabase-gabbro breccia, argillites, slates, refractory sandy and clayey shales with coal beds. This layer is formed irregularly and its thickness does not exceed a few meters [43,45,49]. The weathered zone is enriched with carbonates, mainly calcite. It has been identified as a cement and filling of fissures in weathered rocks and conglomerates [50]. Additionally, single calcite crystals have been found in the conglomerates.
- Approximately 12 m thick Żacler Beds are the most fully developed layers within the Słupiec mining area and belong stratigraphically to Westphalian B (ca. 70 m thick, sandy fraction: sandstones, conglomerates with sandy and clayey shales with four coal seams numbered: 301, 302, 303 and 304) and Westphalian A (thickness 40–100 m, clayey fraction: sandy and sandy-loamy shales with 11 coal seams numbered: 405–415) [46]. The coal seams in the Żacler Beds are in the form of clusters, often with interbedded sandy shales layers of several tens of centimeters to several meters thickness. They are enriched in sulfide (pyrite) that amounts up to 0.8% vol. [51]. Within the Upper Carboniferous coal-bearing strata, a significant amount of gases (methane and carbon dioxide) have been identified. Its variability is related to geological structure, tectonics and the gas origin [46].
- Stephanian layers that overlay the Żacler Beds discordantly, are composed mostly of clastic sediments: sandstones and conglomerates with clay–sandy shale bands. Their thickness is 60–90 m [46].
- Permian deposits of the Rotliegend spread the western part of the area and are clearly visible in the morphology as Włodzickie Hills. They consist of sandstones and conglomerates with sandy and clayey shale bands, occasionally melaphyrs. The thickness of these series of rocks is 150–250 m, rising to 600–800 m to the west [46].
- Quaternary sediments are represented mostly by Pleistocene sandy and silty clay, loam, as well as glacial clay with rock debris. The youngest sediments are riverine (Holocene) sands and gravels, occurring along stream valleys [46].
2.2. Hydrogeological Background
In reference to the geological structure, in the area of the “Nowy I” shaft groundwater occurs in fractured crystalline rocks formation and in fractured and fractured/porous Carboniferous and Permian formations. The aquifer in the Paleozoic crystalline fractured rock has not yet been precisely explored.
The Permian aquifer is made up of sandstones and conglomerates of the Rotliegend sequence, 150–300 m thick, interstratified with shale and it is in hydraulic connection with the sub-lying Carboniferous aquifer. Sandstones and conglomerates are characterized by low effective porosity, with water flowing mainly through fractures. Due to the presence of Permian outcrops on the surface, there is a possibility of rainwater infiltration, but the permeability of the Permian aquifer decreases with the depth, which is due to the increasing pressure in the rock mass and the tightening of the fractures. Numerous clay shale beds also significantly reduce vertical permeability of these rocks. According to archival information, during the exploitation of the “Słupiec” mining area, no inflow of water from the Rotliegend formation was found [39].
The Carboniferous aquifer is formed mostly of sandstones and conglomerates, interstratified with clay shale and hard coal seams. Water circulation takes place thanks to a well-developed system of fractures, generated by tectonic movements and mining works. The water-storage capacity is estimated at 30% and the hydraulic conductivity ranges from 5.84 × 10 to 4.6 × 10 m/s (average 2.3–5.7 × 10 m/s) [52]. In the NE part of the Słupiec basin, infiltration of water from the surface through outcrops of the Stephanian and Żacler Beds formations is possible. According to archival data, the Carboniferous aquifer was the main source of water inflow to mine workings [39].
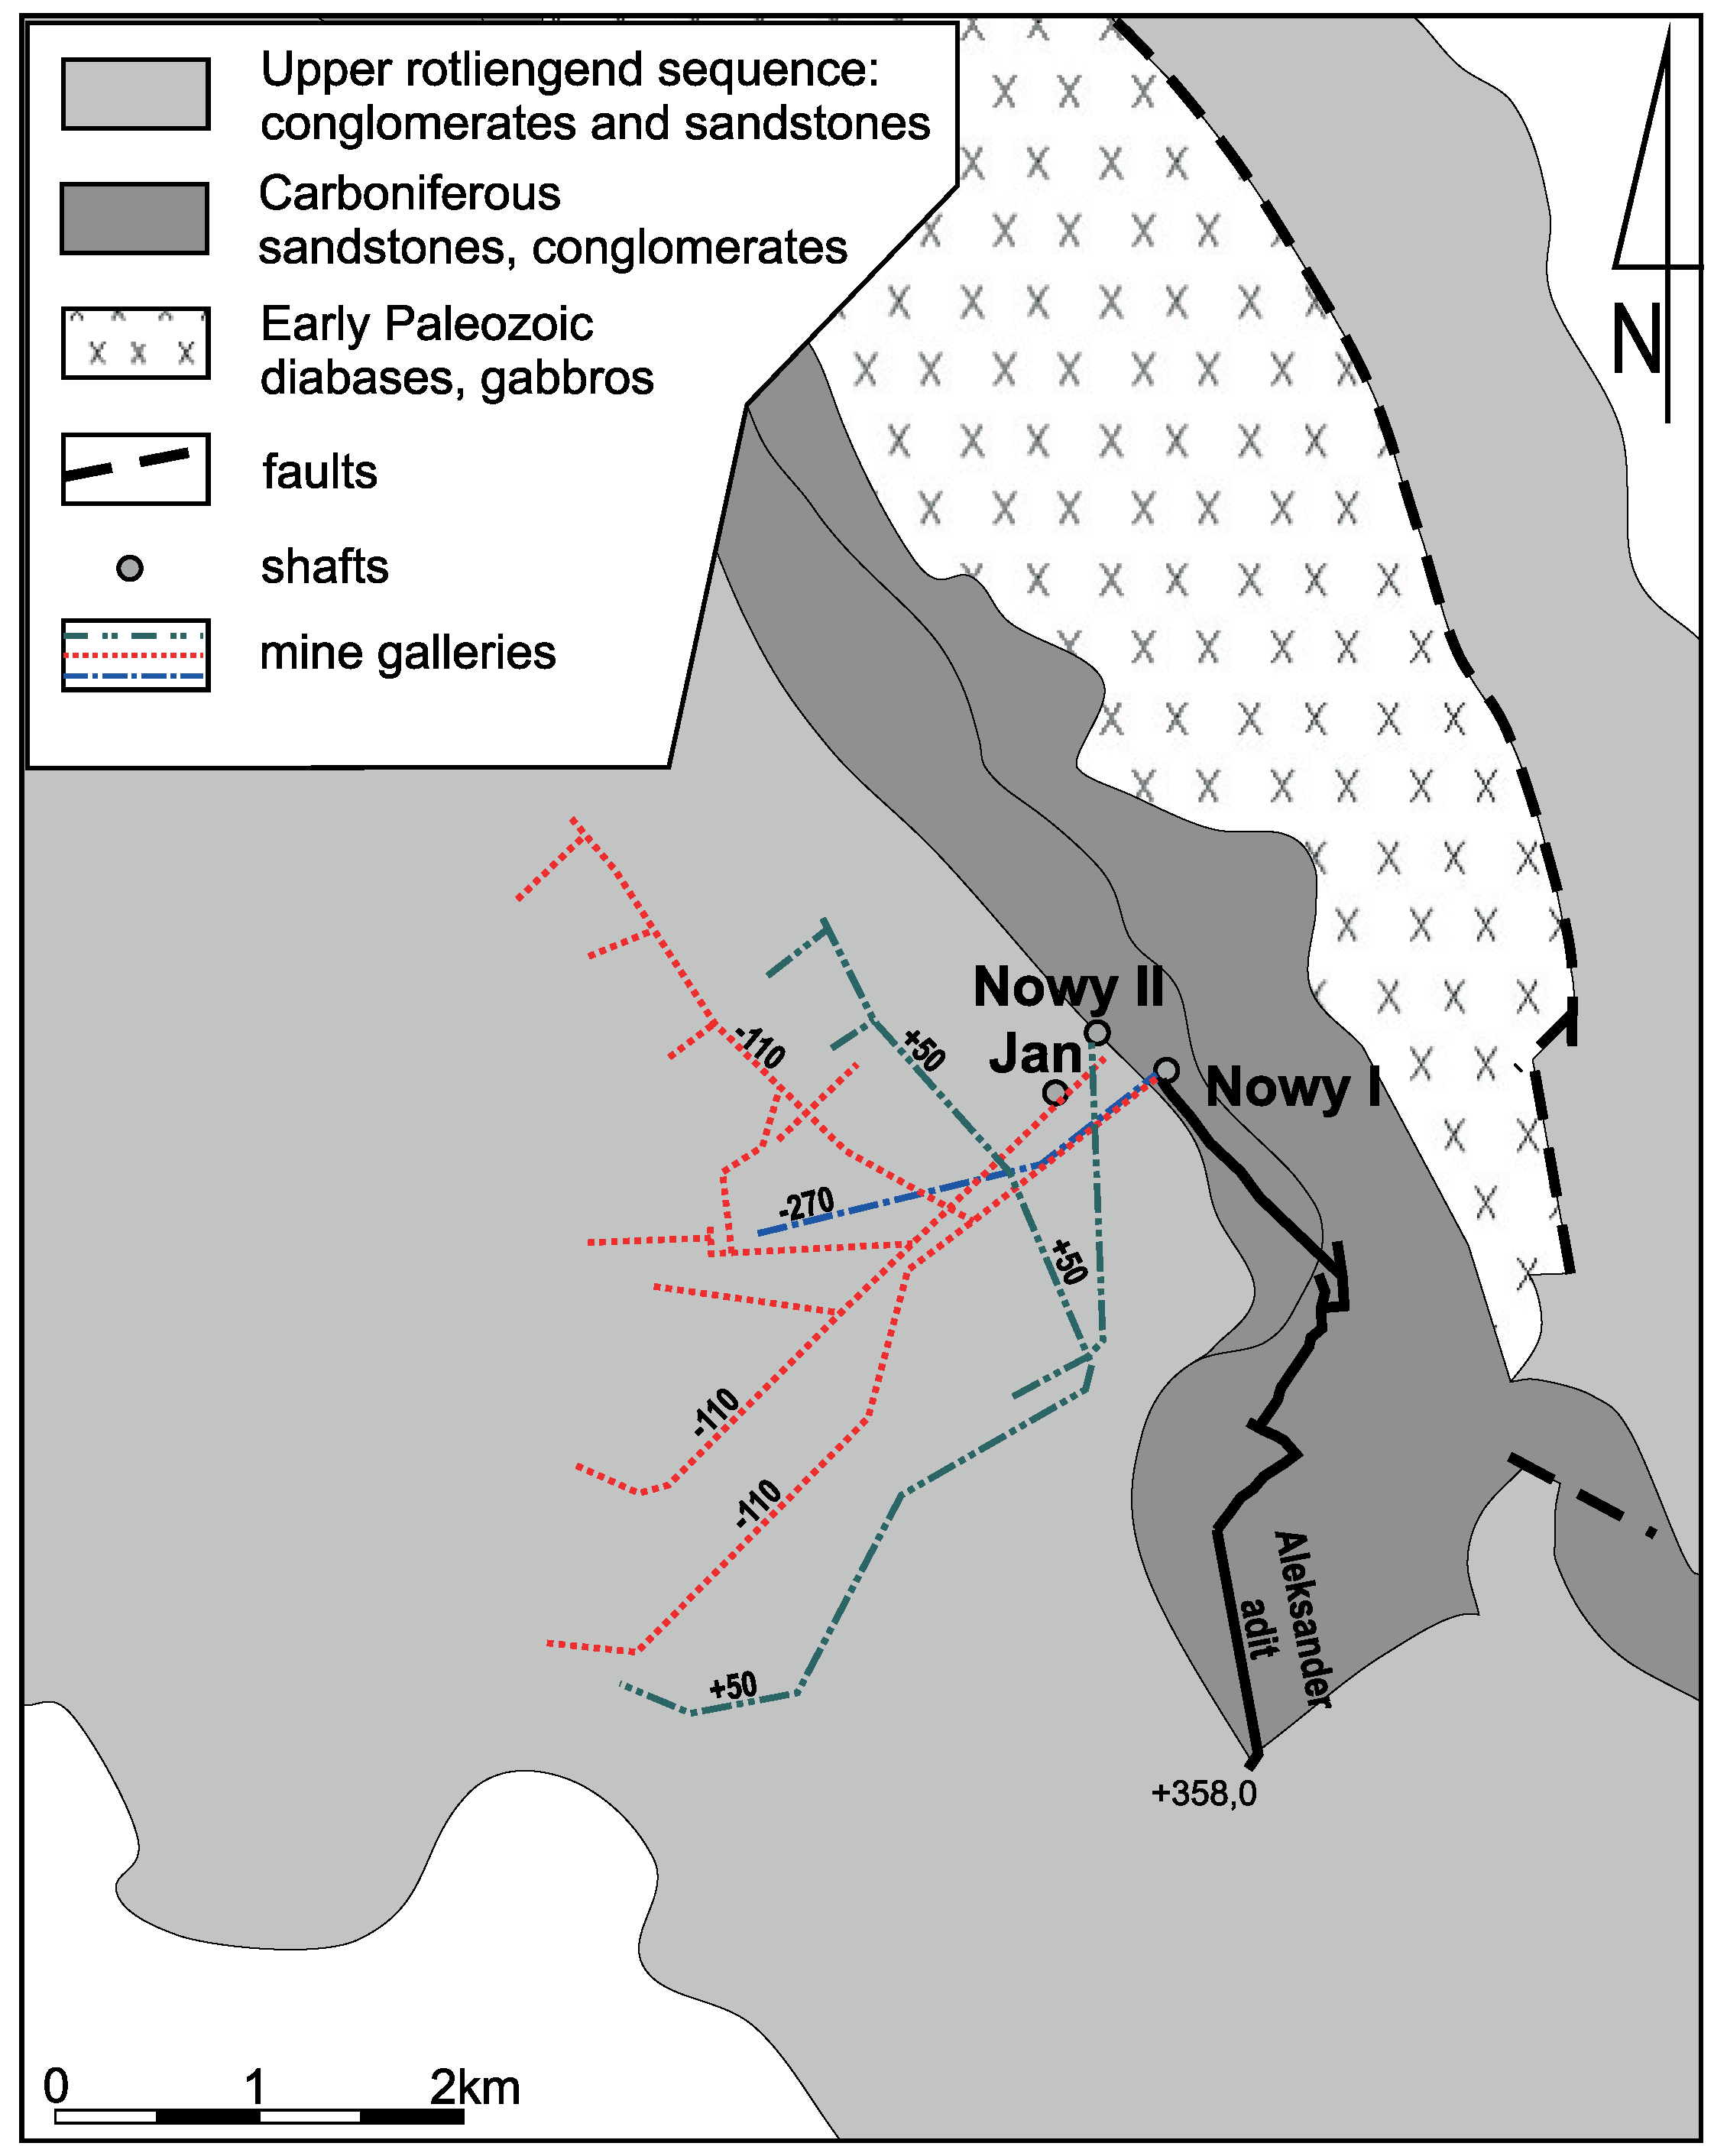
In the Słupiec mining area the exploitation was carried out on levels: +170, +50, −110, −270, −460 and −515 m a.s.l. (since 1998). The pumping stations were located at levels +50 and −110 (Figure 2 and Figure 3), where water was pumped to the surface through the “Jan” and “Nowy I” shafts.
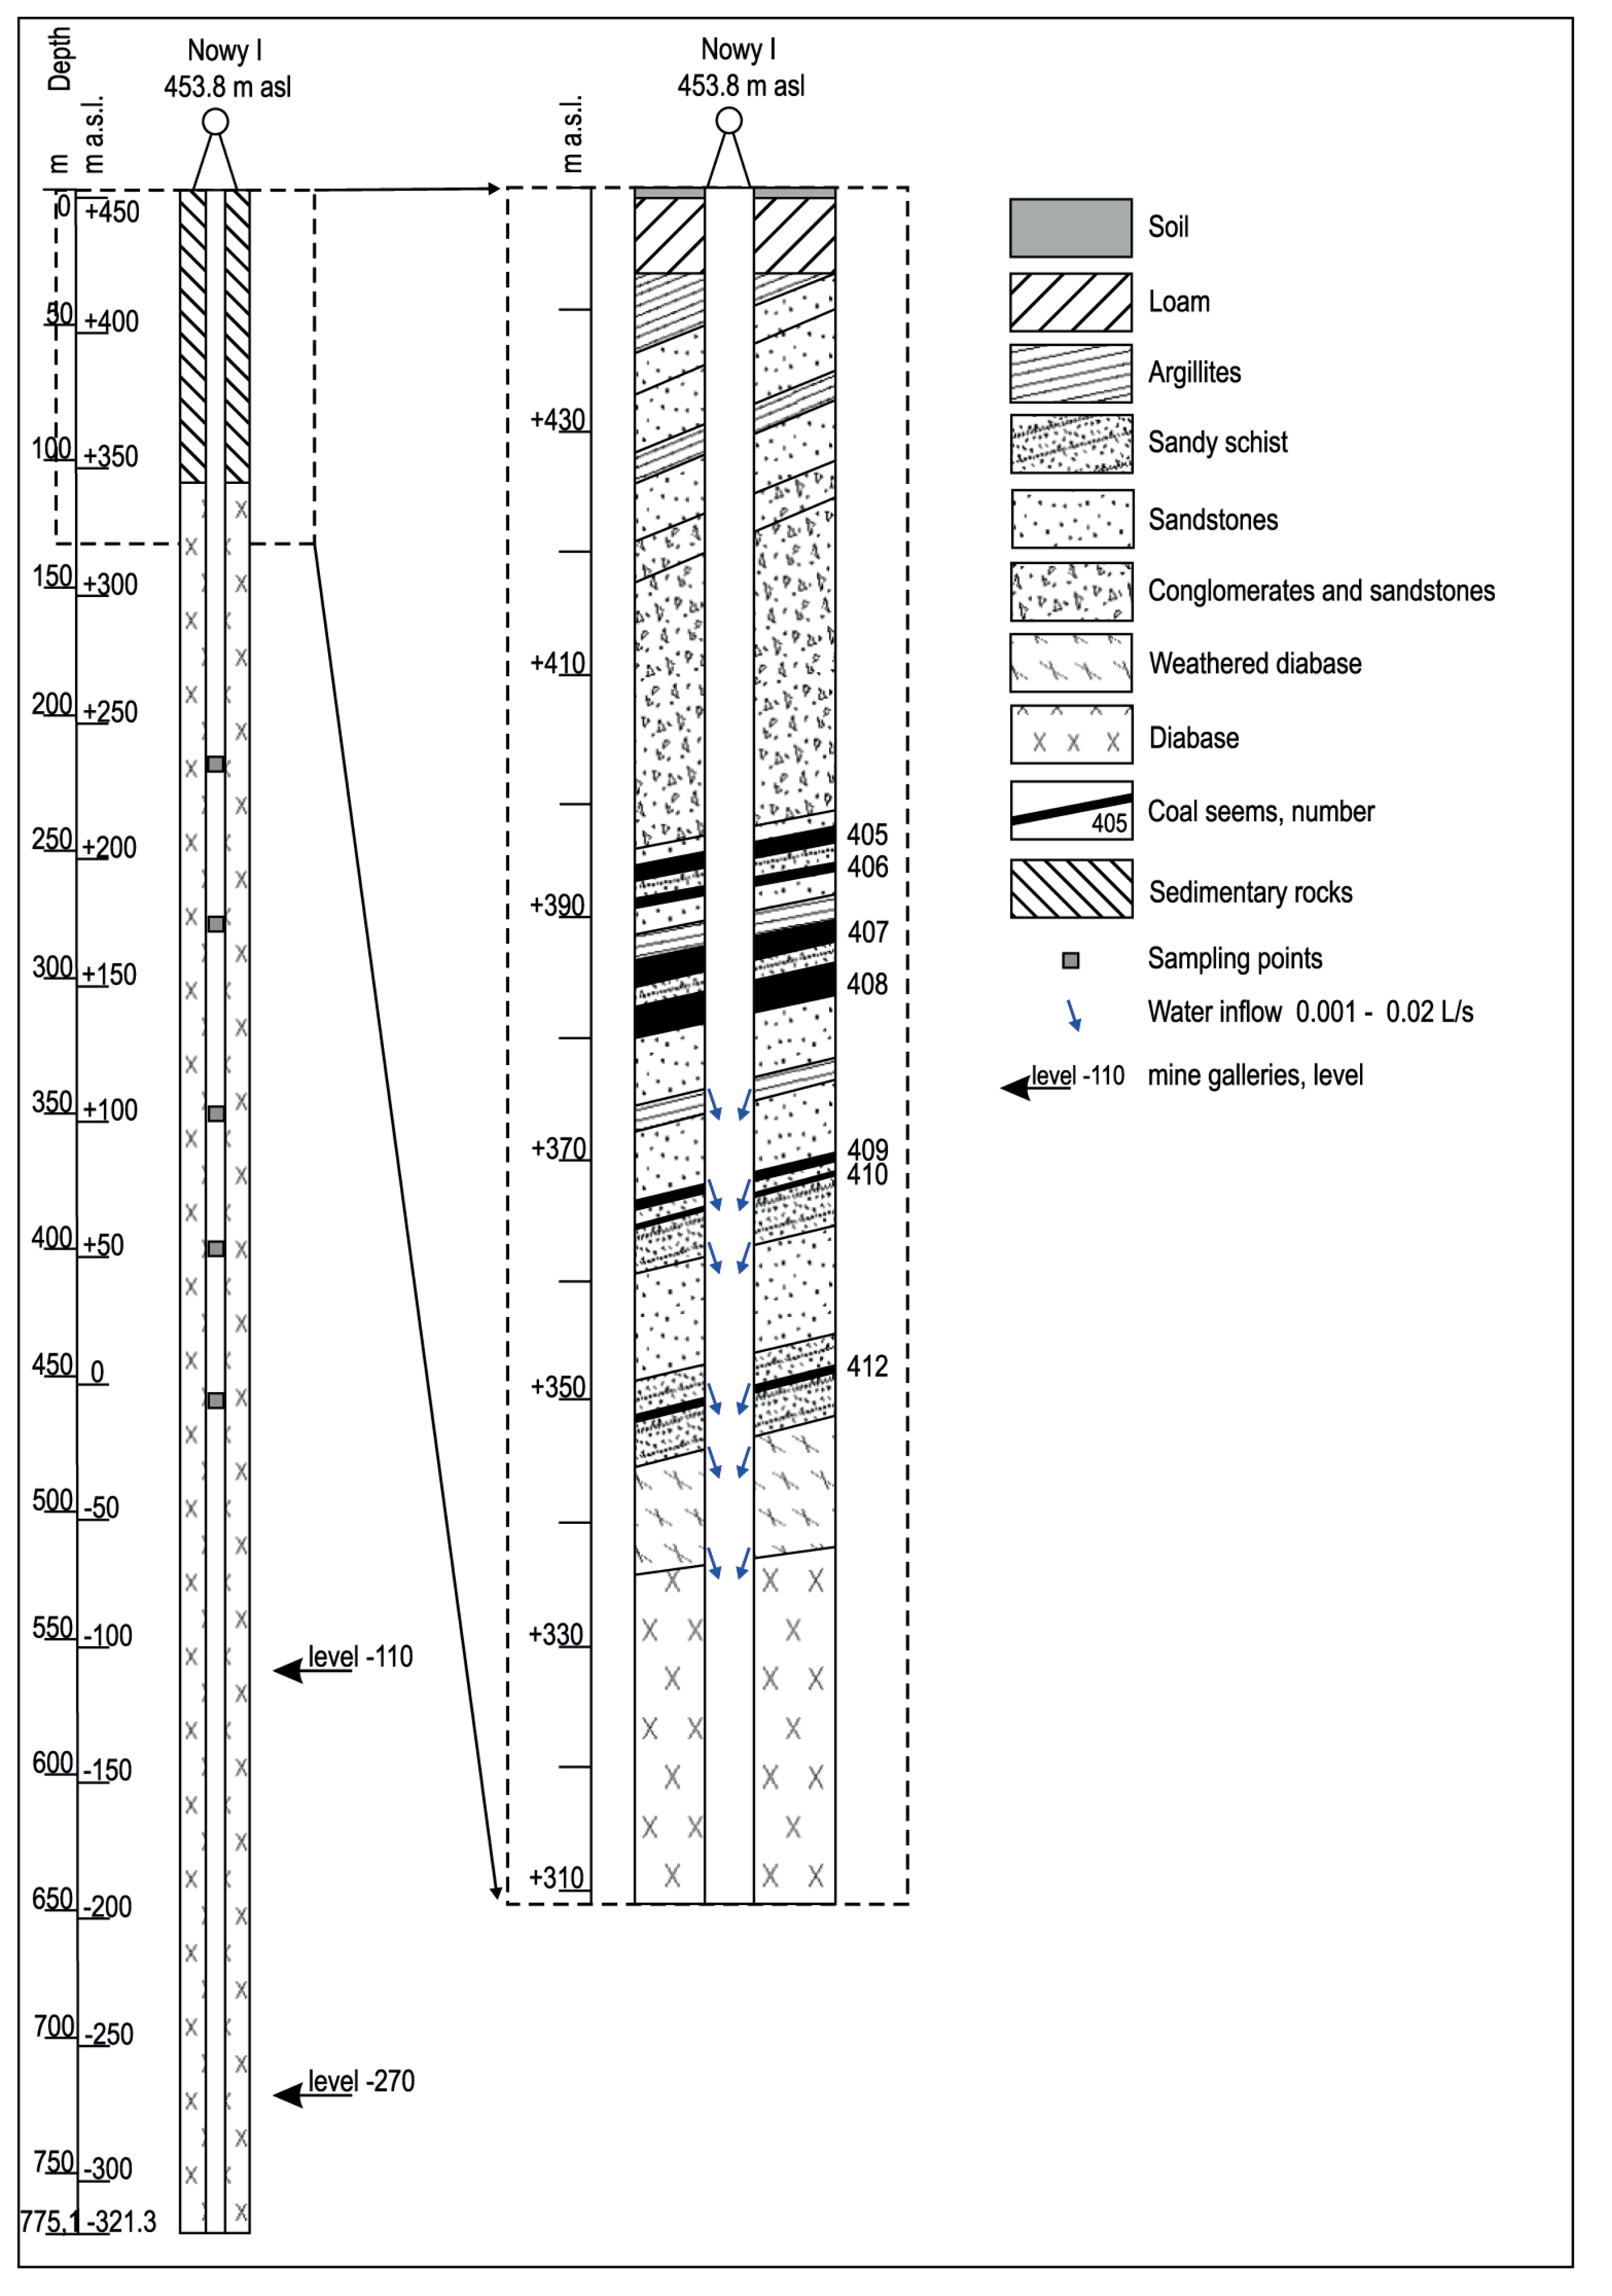
Due to complicated geological and tectonic conditions, the “Nowy I” shaft was constructed in the peripheral part of the mining area, in the outcrops of the Carboniferous formations. The biggest part of the shaft was sunk in diabases, which guaranteed no inflow of water and gases (methane) during the works and very good geomechanical conditions ensuring stability of the shaft walls (Figure 3). During the sinking of the shaft, as well as its subsequent exploitation, the largest inflows to the shaft were recorded in its upper part, to a depth of ca. 120 m b.g.l. (ca. +340 m a.s.l.). They appeared on contacts of Carboniferous sandstones with low permeable layers (e.g., clay shale, coal).
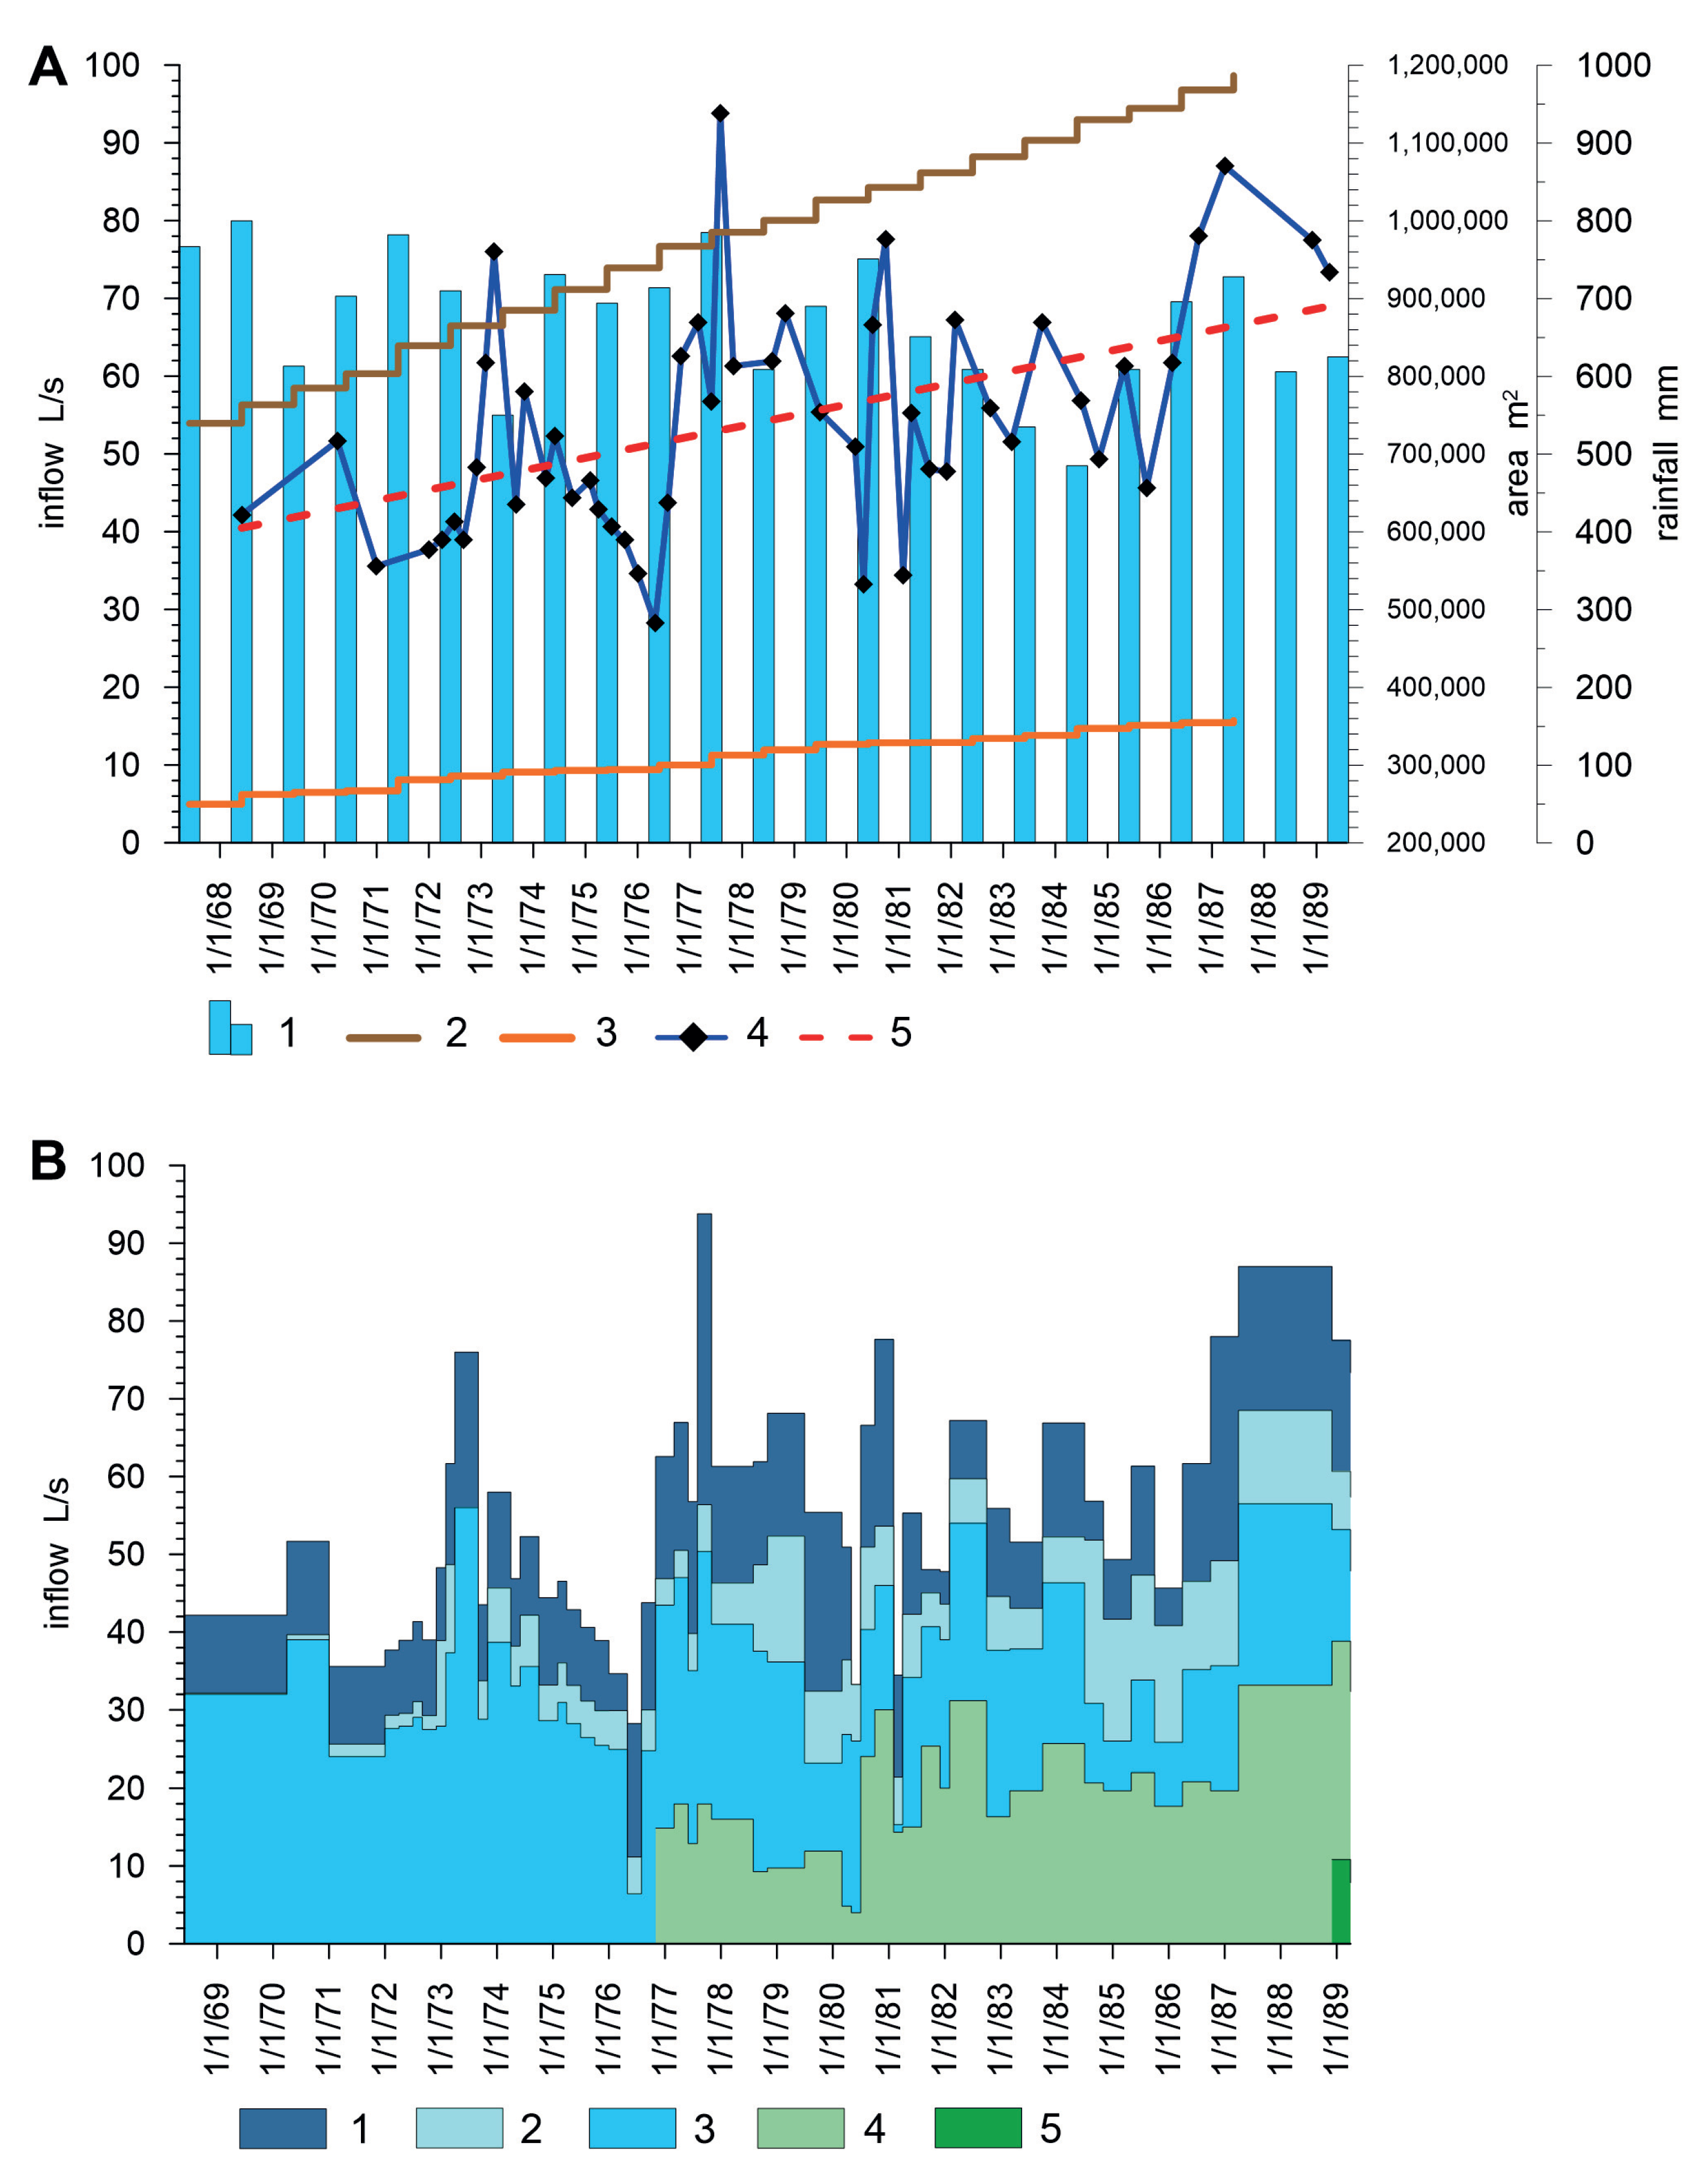
The average inflow to the mine between the years 1968 and 1990 was equal to 51 L/s. [39]. Initially, the inflow reached the quantity of 41.5 L/s to increase to over 75 L/s in 1973 (Figure 4). Then, until mid-1976, the amount of water flowing into the mine was regressive and went down to 28 L/s. The reversal of the trend took place when the lower mining level −270 became the operational. Later, the inflow to the mine was at an average level of 60 L/s (minimum 31.6 L/s–maximum 87 L/s). The most significant inflows of water to the mine workings came from a Carboniferous aquifer and occurred at levels −110 and −270, constituting in total ca. 80% of all the water pumped out.
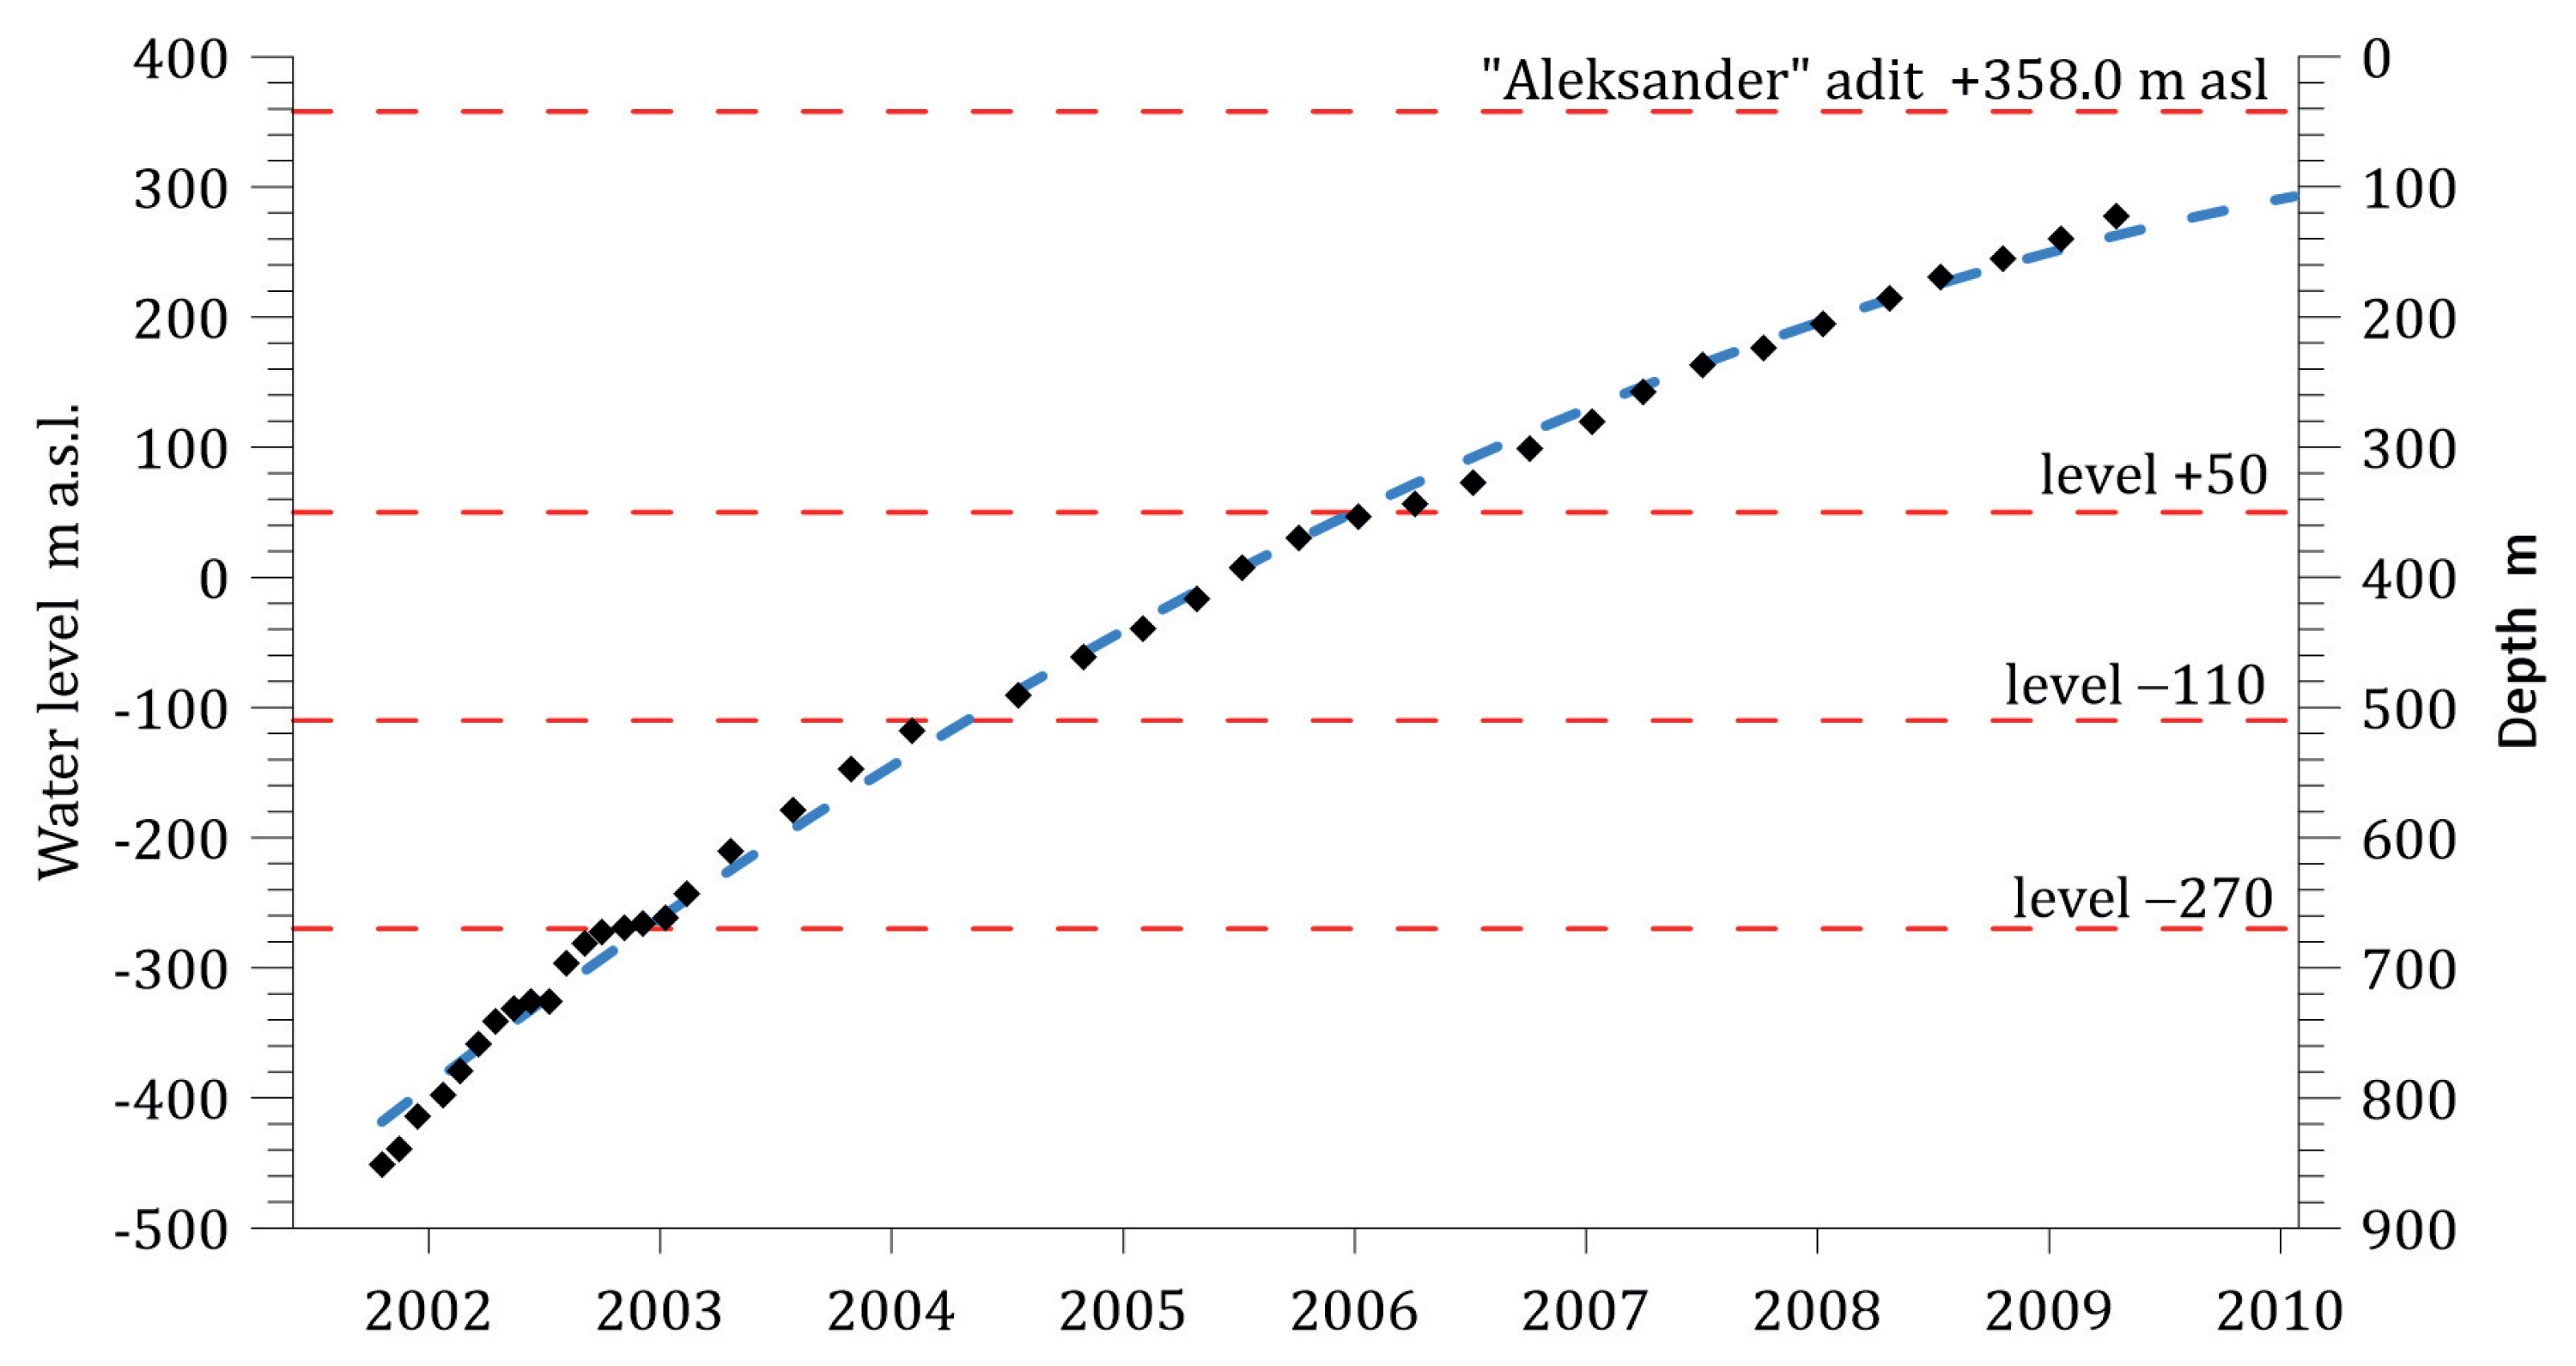
Mining exploitation in the “Nowa Ruda” coal mine lasted for the longest time in the “Słupiec” mining area, where the flooding process began in 2000. The rate of this process is shown in the graph of the water table of the Carboniferous aquifer, the level of which was measured in the “Nowy I” inactive shaft (Figure 5). The output of the “Aleksander” drainage adit, whose role is to discharge the excess mine water from the “Nowy I” shaft into the Bożkowski Stream, is located in Bożków village. In May 2008, when sampling in the “Nowy I” shaft had been conducted, the “Aleksander” adit was dry. The forecast, that had been developed at the stage of closing the mine, indicated years 2006/2007 as the end of flooding the mine. Contrary to that predictions, the water level in the shaft did not rebound until the turn of 2014/2015, when the the first outflow from the adit was observed and sampling was possible. The control sample of the water outflowing from the adit was taken in September 2015.
2.3. Chemistry of Mine Water Inflowing to the Mine During Operation
From the time of the mine’s operation, there is partial information on the chemical composition of the water inflowing to mine workings at the particular levels in the “Słupiec” mining area. From the archival information [53] it is known that:
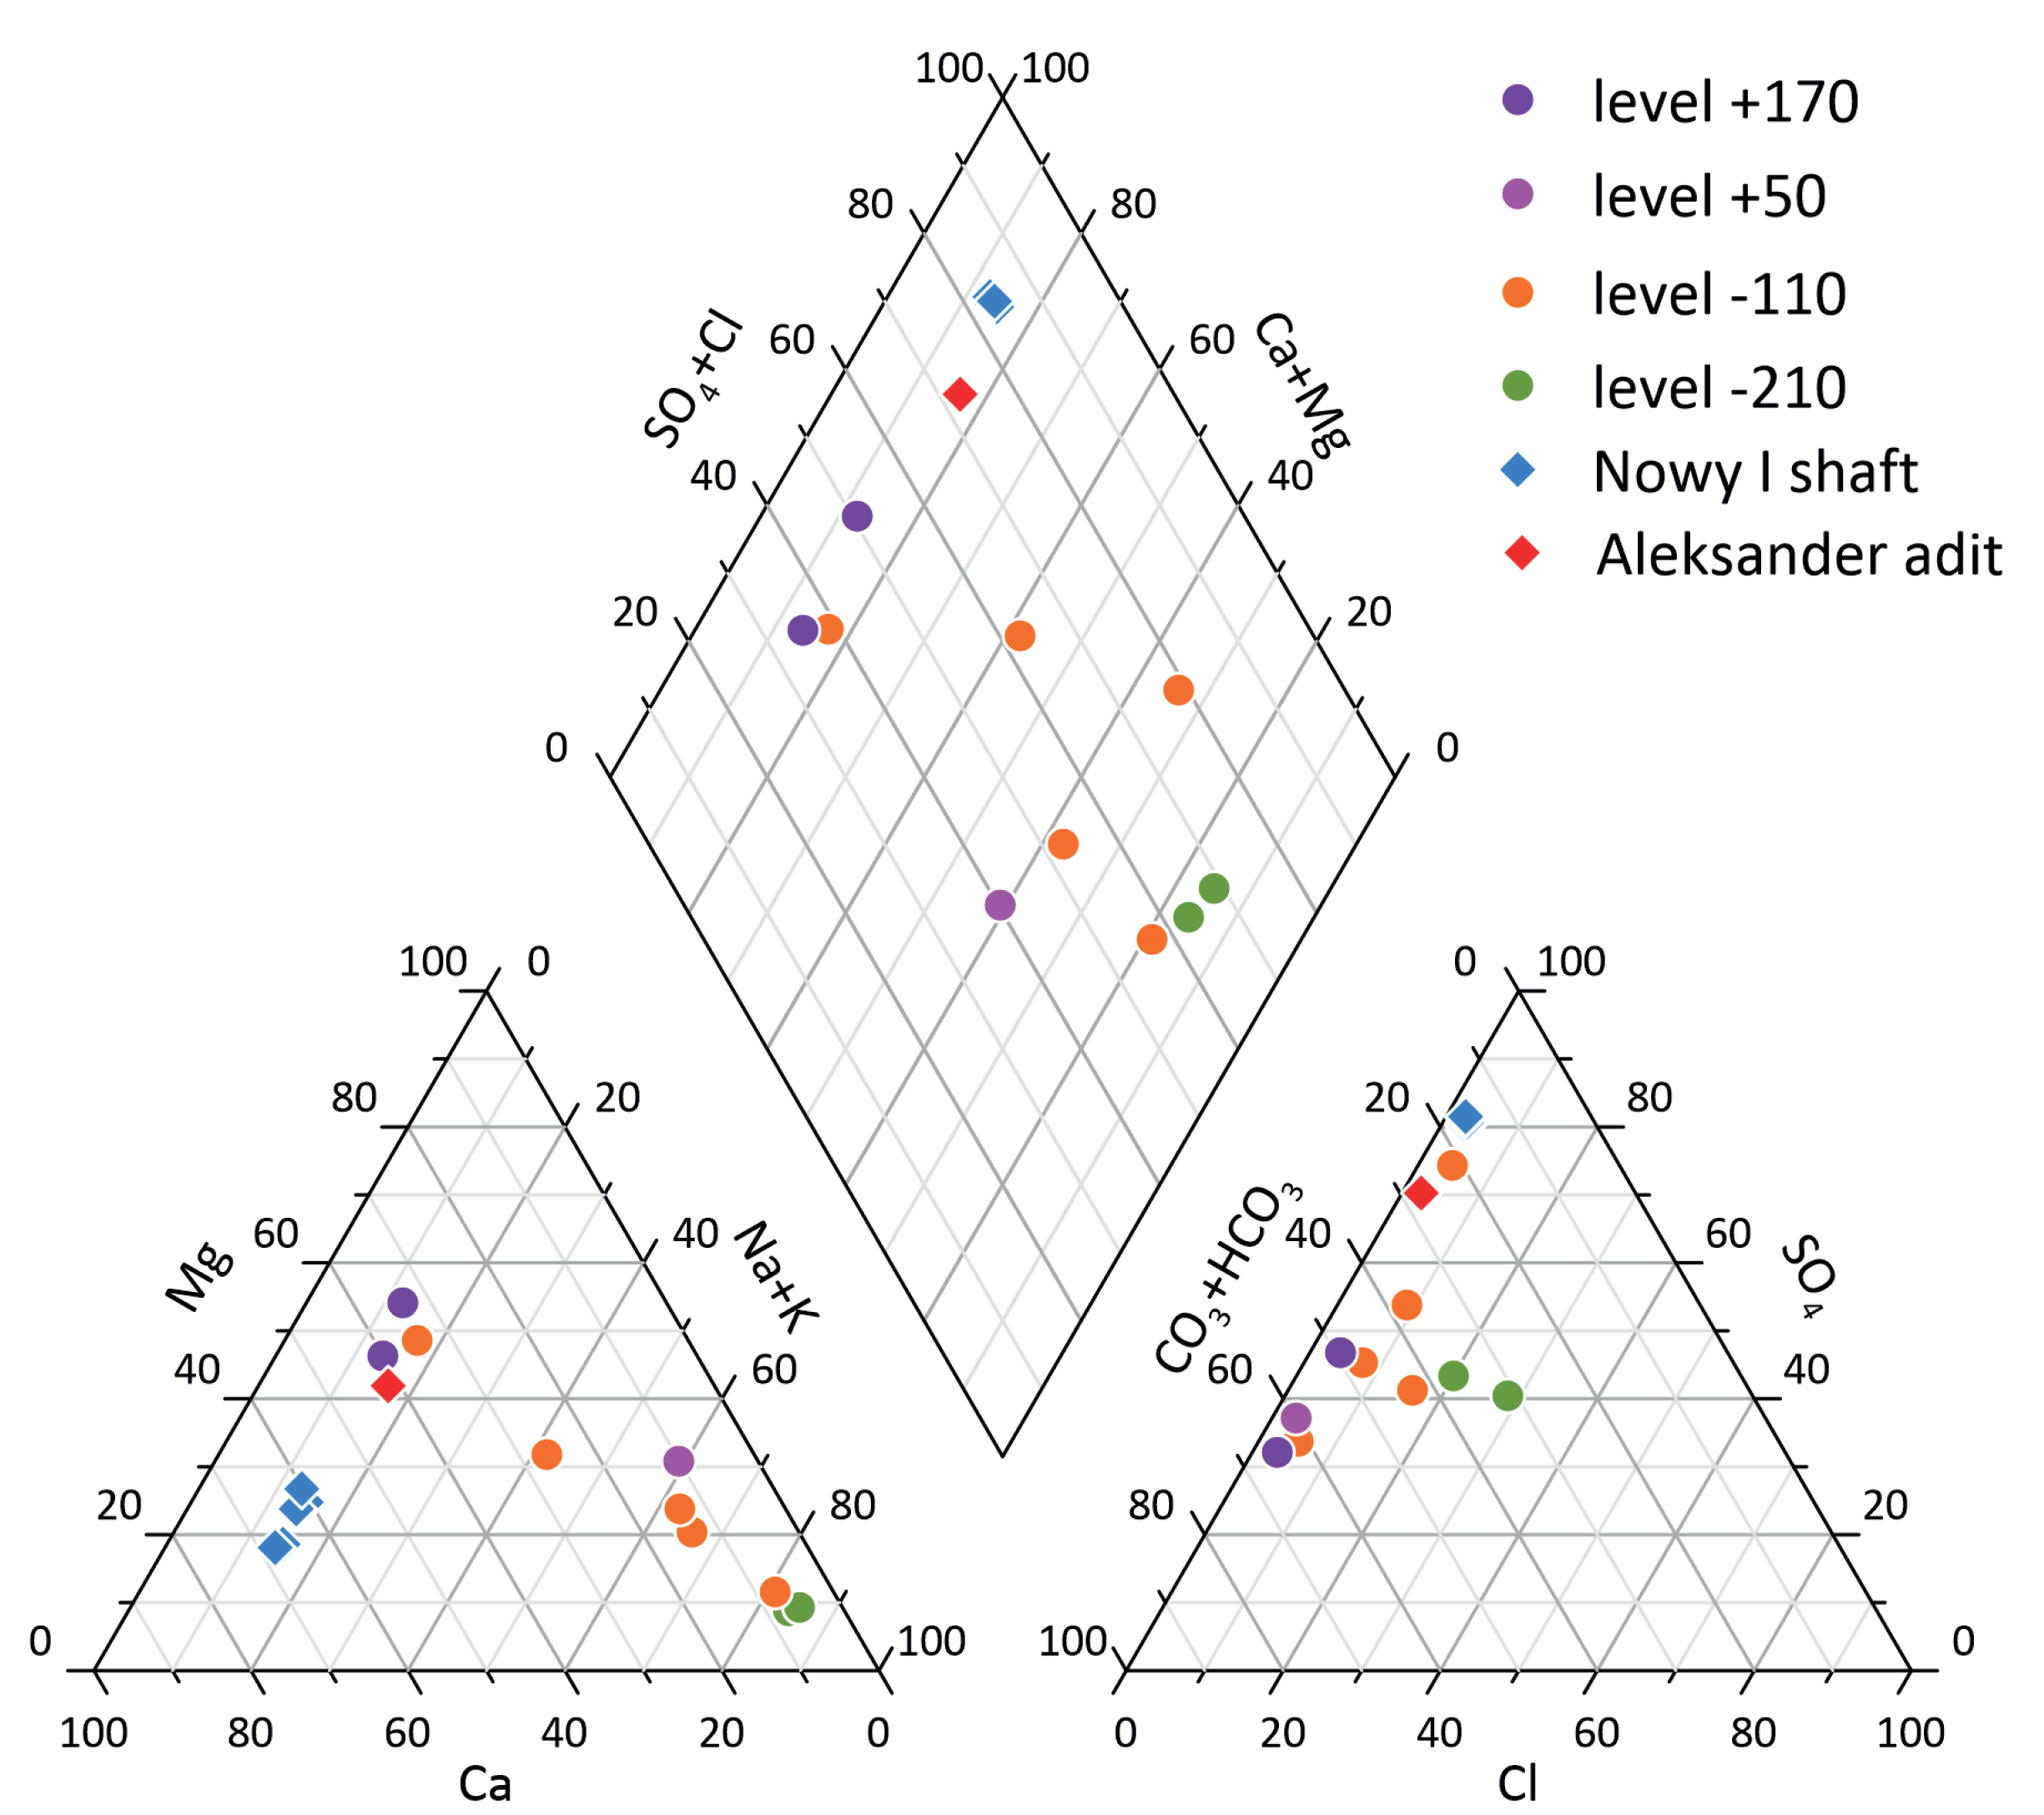
- The water at level +170 m showed TDS in the range of 1050–1442 mg/L and was four-ion of SO–HCO–Mg–Ca–type (Figure 6).
- At the +50 m level the inflowing water showed TDS in the range of 1135–1356 mg/L and was three- and four-ion of SO–HCO–Na or SO–HCO–Na–Mg or HCO–SO–Na–Mg–type. Higher concentrations of Na and lower concentrations of Ca and Mg were observed among cations.
- The water inflowing to workings located at the level −110 m was characterized by low TDS in the range of 324–532 mg/L. It was four-ion water of HCO–SO–Mg–Ca or HCO–SO–Na–Mg–type.
- The water at the −270 m level showed TDS in the range of 844–1450 mg/L and was four-ion of SO–HCO–Cl–Na or SO–HCO–Cl–Na–type.
Archival physicochemical analyses of groundwater did not identify the vertical stratification of mineralization. During the time of exploitation, increased mineralization occurred regardless of the depth, and its range and chemical composition of mine water was steady [53].
2.4. Sampling and Analitycal Methods
Water samples from the “Nowy I” shaft were taken in May 2008 from five depths: 220, 280, 350, 400, 460 m below ground level (respectively +234, +174, +104, +54, and −6 m a.s.l.). Samples were taken from the smallest depth to the greatest in order to minimize the possibility of mixing water at the sampled level. The first sample was taken at a depth of 220 m, 10 m below the present water table in the flooded shaft. The maximum testing depth was limited by the technical possibilities related to the construction of the elevator, the weight of the rope and the sampler and it was 460 m. The testing was carried out using a Ruttner type sampler produced by KC Denmark A/S. A five-litre cylindrical probe made of an acrylic that closed at the desired depth was used. It shuts by dropping the so-called “messenger” on a steel load-bearing wire, which releases the locks and causes the sampler to close tightly. Collection of water from the sampler was done through a dew valve located in its lower sampler. In September 2015, a control sample of water flowing out of the “Aleksander” adit was collected. The water was taken directly from the outflow into a glass container.
Water temperature, pH, Eh and EC (electric conductivity) were measured in the field by means of a WTW Multi340i multi-parameter instrument, and SenTix 81, SenTix ORP and TetraCon 325 electrodes. The major and minor elements contents were analyzed: HCO, Cl, SO using spectrophotometric method, and Na, K, Ca, Mg, Fe (with detection limit 0.01 mg/L), Mn, Zn, Cu, Cd, Co, Al, Ni, Cr, Ba, As, Pb (with detection limit 0.01 g/L) using Atomic Absorption Spectrometry (AAS). Analyses were made at the Chemical Laboratory of Physical Geography Department of the Wroclaw University using spectrophotometer “Avanta ” GBC. Full water chemical analyses generally fall within the range of ±5% Charge Balance Error (CBE).
3. Results
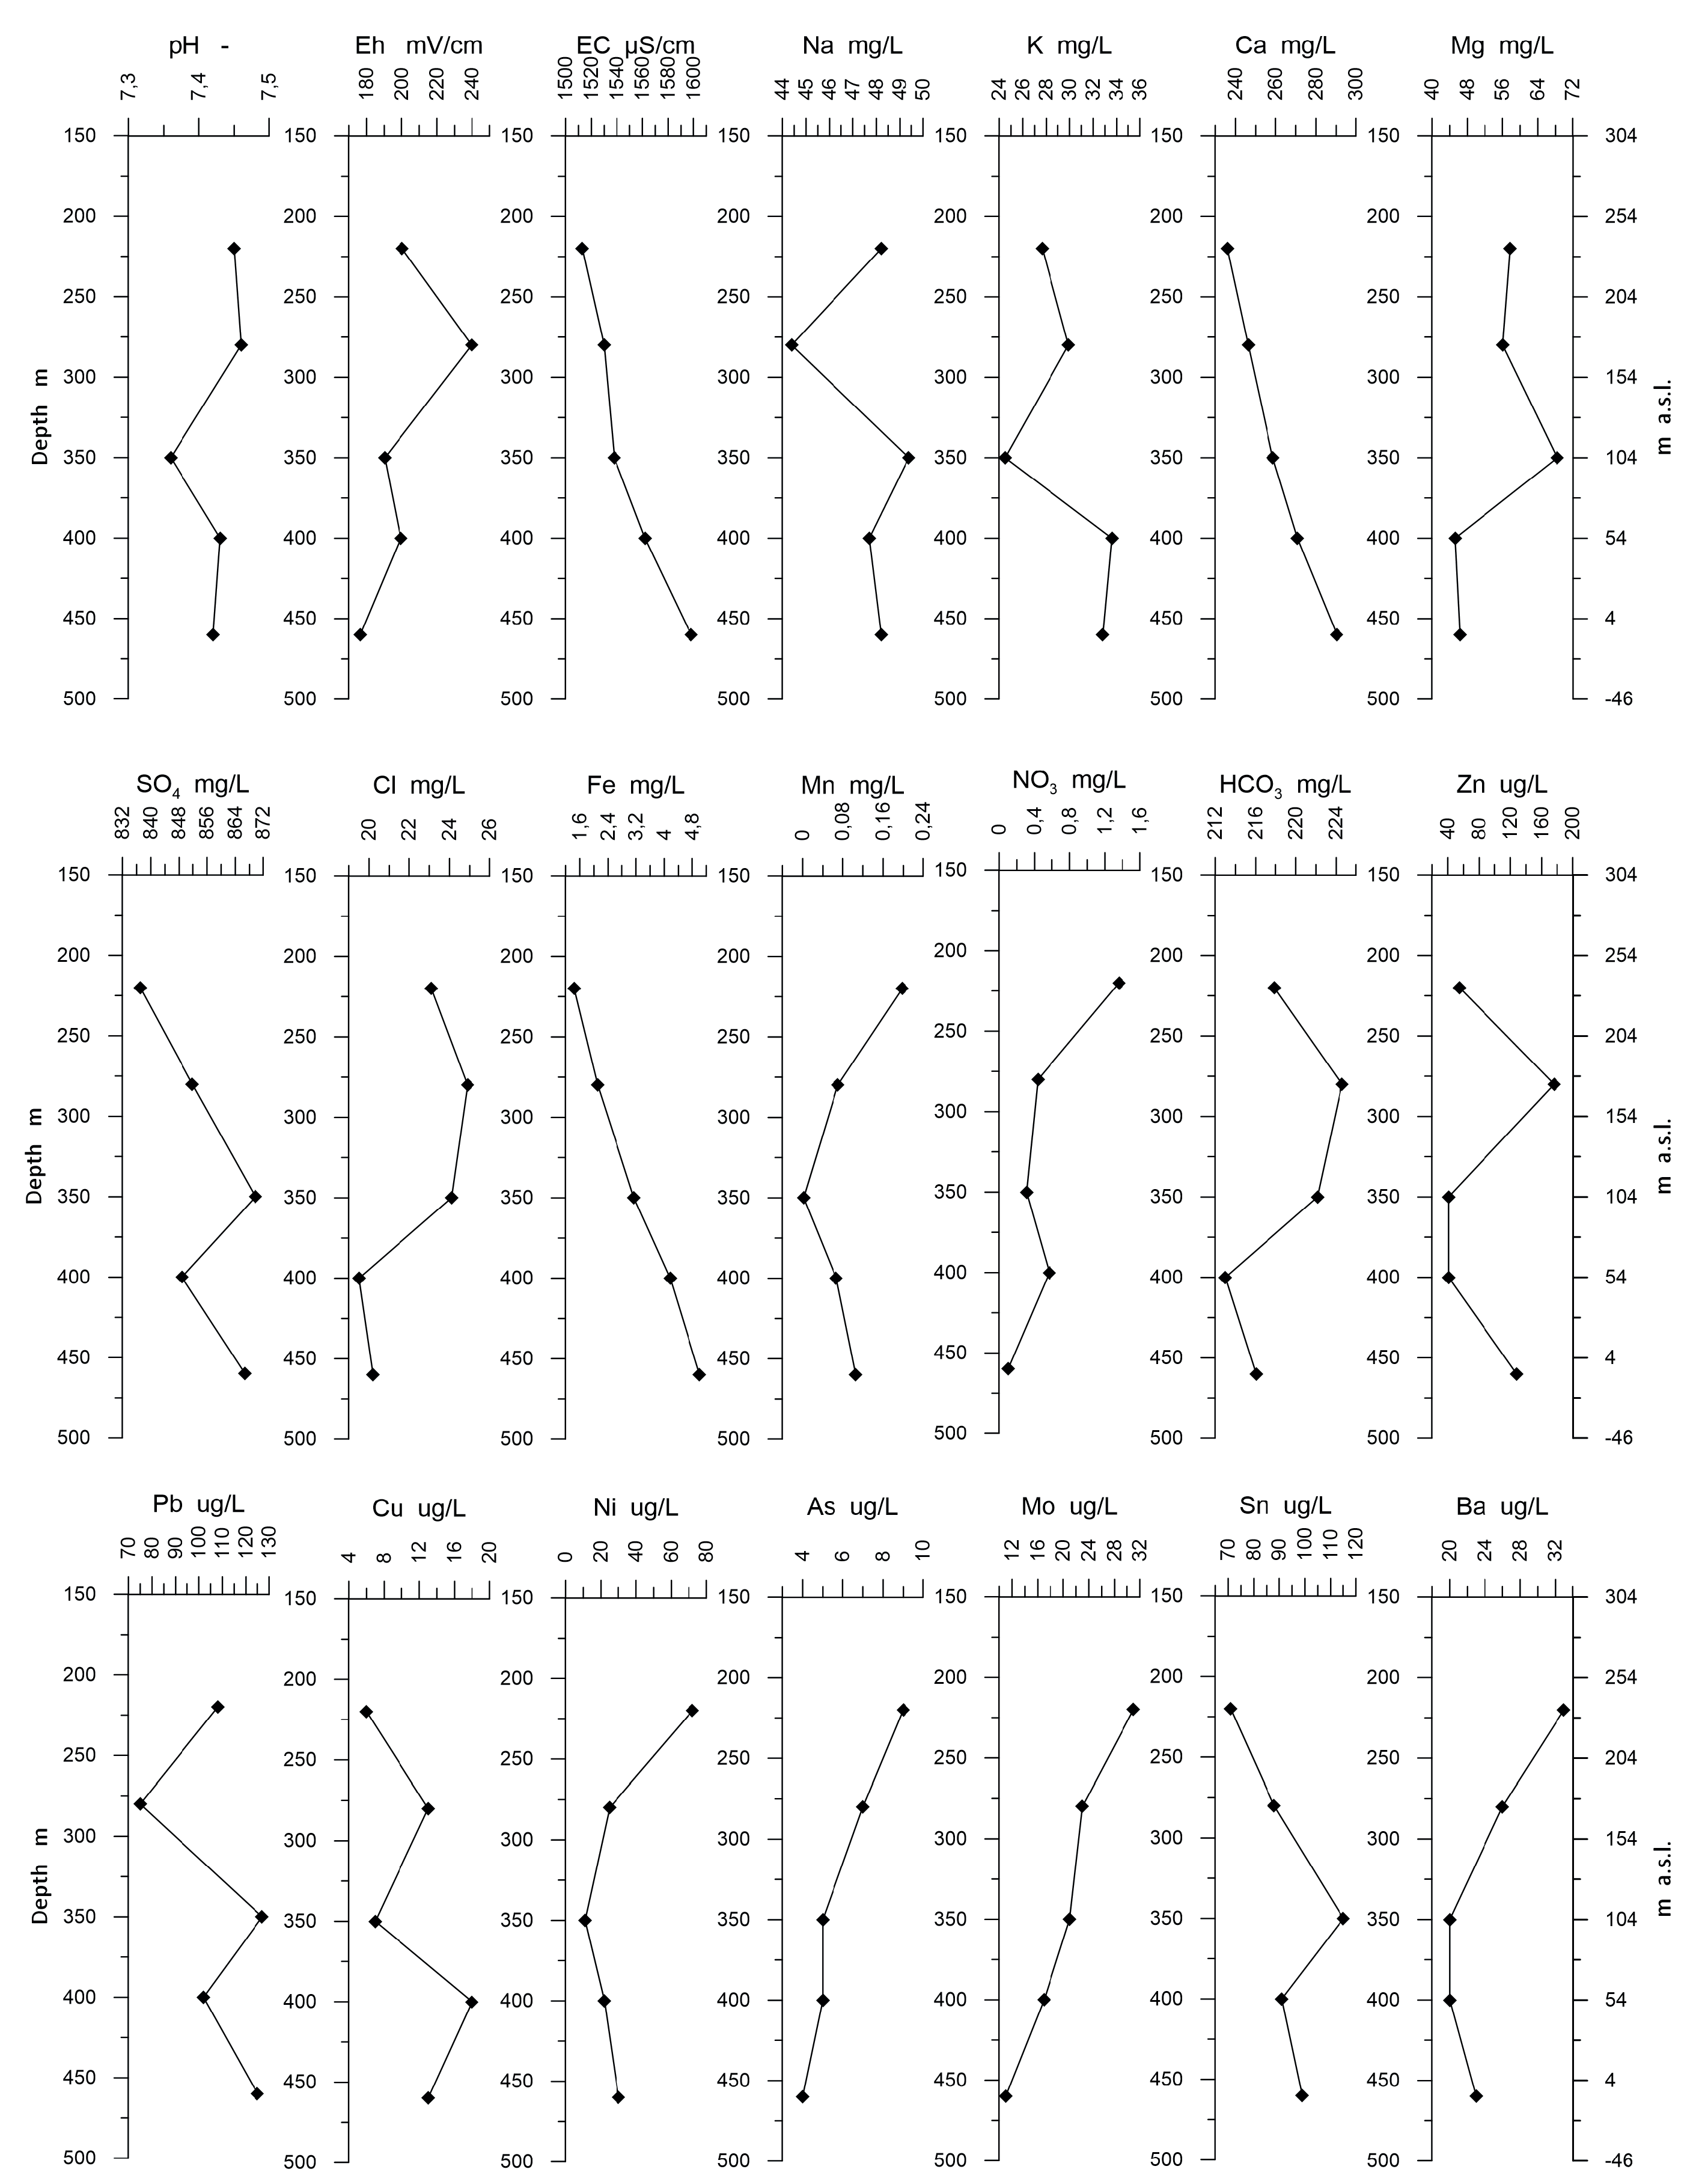
It is evident from the conducted research that the chemical composition of the mine water collected from the “Nowy I” shaft changes as the depth of sampling increases (Table 1 and Table 2). This is three-ion water of SO–Ca–Mg type (Figure 6). In the whole examined vertical profile a slightly alkaline pH was recorded, with low variability from 7.36 to 7.46. The water temperature was constant ranging from 14.2 to 14.7, and Eh values varied from 200 mV/cm in the upper part of the flooded shaft to 176 mV/cm at a depth of 460 m. The reverse tendency was shown by the EC, increasing systematically from 1513 S/cm to 1598 S/cm with depth.
Detailed analysis of the results received allows us to distinguish three groups of variability (Figure 7). The first one is marked by a continuous increase in the recorded values—they include EC, Ca (236.0–290.5 mg/L) and Fe (1.44–5.01 mg/L). The second group shows the opposite tendency, i.e., a continuous decrease in concentrations is observed with depth. This group includes As (9–4 g/L) and Mo (31–11 g/L). The most numerous group of ions are those for which concentrations at a depth of about 350 m show a change of trend observed in the higher parts of the shaft: K (27.67–24.50–32.82 mg/L), Mg (57.56–68.44–46.34 mg/L), HCO (217.8–222.1–216.0 mg/L), Cl (23.1–24.1–20.2 mg/L), SO(837.0–869.8–866.7 mg/L), Mn (0.198–0.002–0.106 mg/L). This scheme does not cover the Na ion with its lowest concentrations recorded at a depth of 280 m (44.39 mg/L), then growing to 49.39 mg/L at a depth of 350 m, and below stabilizing in the range 47.70–48.0 mg/L. Moreover, we observe another dependency for Al, for which the concentration systematically decreases from 8.45 mg/L to 5.24 mg/L from the depth of 280 m.
In order to test the hypothesis of temporary mixing of water in the contact zones of the shafts/adits, a water sample was taken in 2015, after the outflow from the “Aleksander” adit was observed. Water from the adit had a pH of 6, a temperature of 7.8 and an Eh value of 213 mV/cm. In this water an EC value of 2230 S/cm was noticed, higher than that observed in the water in the shaft. The sample taken can be classified as SO-HCO-Ca-Mg type four-ion water, intermediate between the water in the flooded shaft and the water inflowing during the exploitation of the deposit to the uppermost exploitation levels (Figure 6). In comparison with the shaft water, higher concentrations of Na (92 mg/L), Mg (138 mg/L), SO (972 mg/L), Mn (3.34 mg/L ), Ni (278 ug/L) and Ba (198 ug/L) ions are recorded. K (18.19 mg/L), Fe (0.26 mg/L), Al (0.12 mg/L) and SiO (13.84 mg/L) are observed in lower concentrations. Similar concentrations were reported for Ca ions (230 mg/L).
4. Discussion
Stratification of water in varied underground mines has been described in tens of publications [24]. It has been identified at different stages of the mine’s life-cycle. Despite geological and hydrogeological conditions of the KWK Nowa Ruda and the “Nowy I” shaft are specific and completely different than any of the mines presented in the literature, the overall processes being noticed during the mine’s operation and later on during flooding, are similar to those described in other mines already [6,8,25]. Based on archival information we can assume [39] that, during the KWK Nowa Ruda mine’s operation, mining drainage led to the formation of a large-range depression cone, which oxidation of sulphide minerals to well-soluble sulphate took place in. After the mine’s closure, the rising water level cut off the oxygen and caused leaching and solution of the iron, magnesium or calcium sulfate. As a result, the groundwater filling the cone was being enriched with sulfate ions. The reaction rate of these processes depends on the individual features of the mining area and the rate of water level rise [54].
In our case, detailed recognition of hydrogeochemical processes in the operating mine, especially related to water inflowing from the surface to the mine galleries, was impossible due to the lack of archival physicochemical analyses. The presented mining area “Słupiec” could be only described as an analogue to neighbouring mining area “Nowa Ruda” where more precise observations were conducted at that time [53]. Based on analogy, it can be assumed that at the stage of operating mine the following processes had been shaping the chemistry of the water inflowing to the mine [53]: (I) Oxidation of sulfide (pyrite) from coal in depression cone and leaching of sulphate by water infiltrating from the surface through the monoclinal structured Carboniferous aquifer. This porcess was responsible for the high concentration of SO in the mine water. (II) Dissolution of calcite from the weathered diabase zone and gabbro-diabase conglomerates by water infiltrating from the surface. The infiltrating water became enriched in CO that emanated from deep parts of the coal basin [46] and that is why carbonate was being dissolved easily. This process was the cause of increased concentration of HCO in mine water which had been oscillating between 250 and 854 mg/L [53]. (III) Migration of thermocatalitic CO coming from deeper parts of the coal basin [46,55] to undrained parts of the Carboniferous aquifer. That process was responsible for a significant amount of CO in mine water and for dissolution of carbonates at the deepest levels of the mine. Having in mind the coal mines of USCB [4] one could expect the high concentration of Cl at deeper levels of the exploitation. In the case of “Słupiec” mining area, Cl amount was low and oscillated between 25–137 mg/L [39,53], not exceeding typical concentration for freshwater. It is a result of a limnetic genesis of the LSCB in opposite to the periodical marine sedimentation in the USBC.
The mine’s operational data on inflows indicates the maximal ratio of workings/shaft mine as ca. 77% (51 L/s) to 23% (12–15 L/s) [39]. The source of inflow to the shaft was the zone above the diabases of thickness ca. 50 m (Figure 3). The ratio had been increasing to indicated value as new and deeper exploitation levels had been opening.
At the stage of mine’s closure, when the drainage ceased, the water level started rising. This caused gradual changes in conditions in the depression cone. Rebounding water enriched in CO has been washing out SO, Ca and K ions from the oxidation zone, leading to the increase of water mineralization at the deepest and flooded levels of the mine. As the depression cone filled up, the amount of water inflowing through the galleries has been decreasing. When the particular level of exploitation had been reached, the rebound of the water table in the shaft had been temporarily slowing down until the galleries were completely filled up. At that time, as the available literature indicates, the water in the shaft should have been mixing and homogenizing [19].
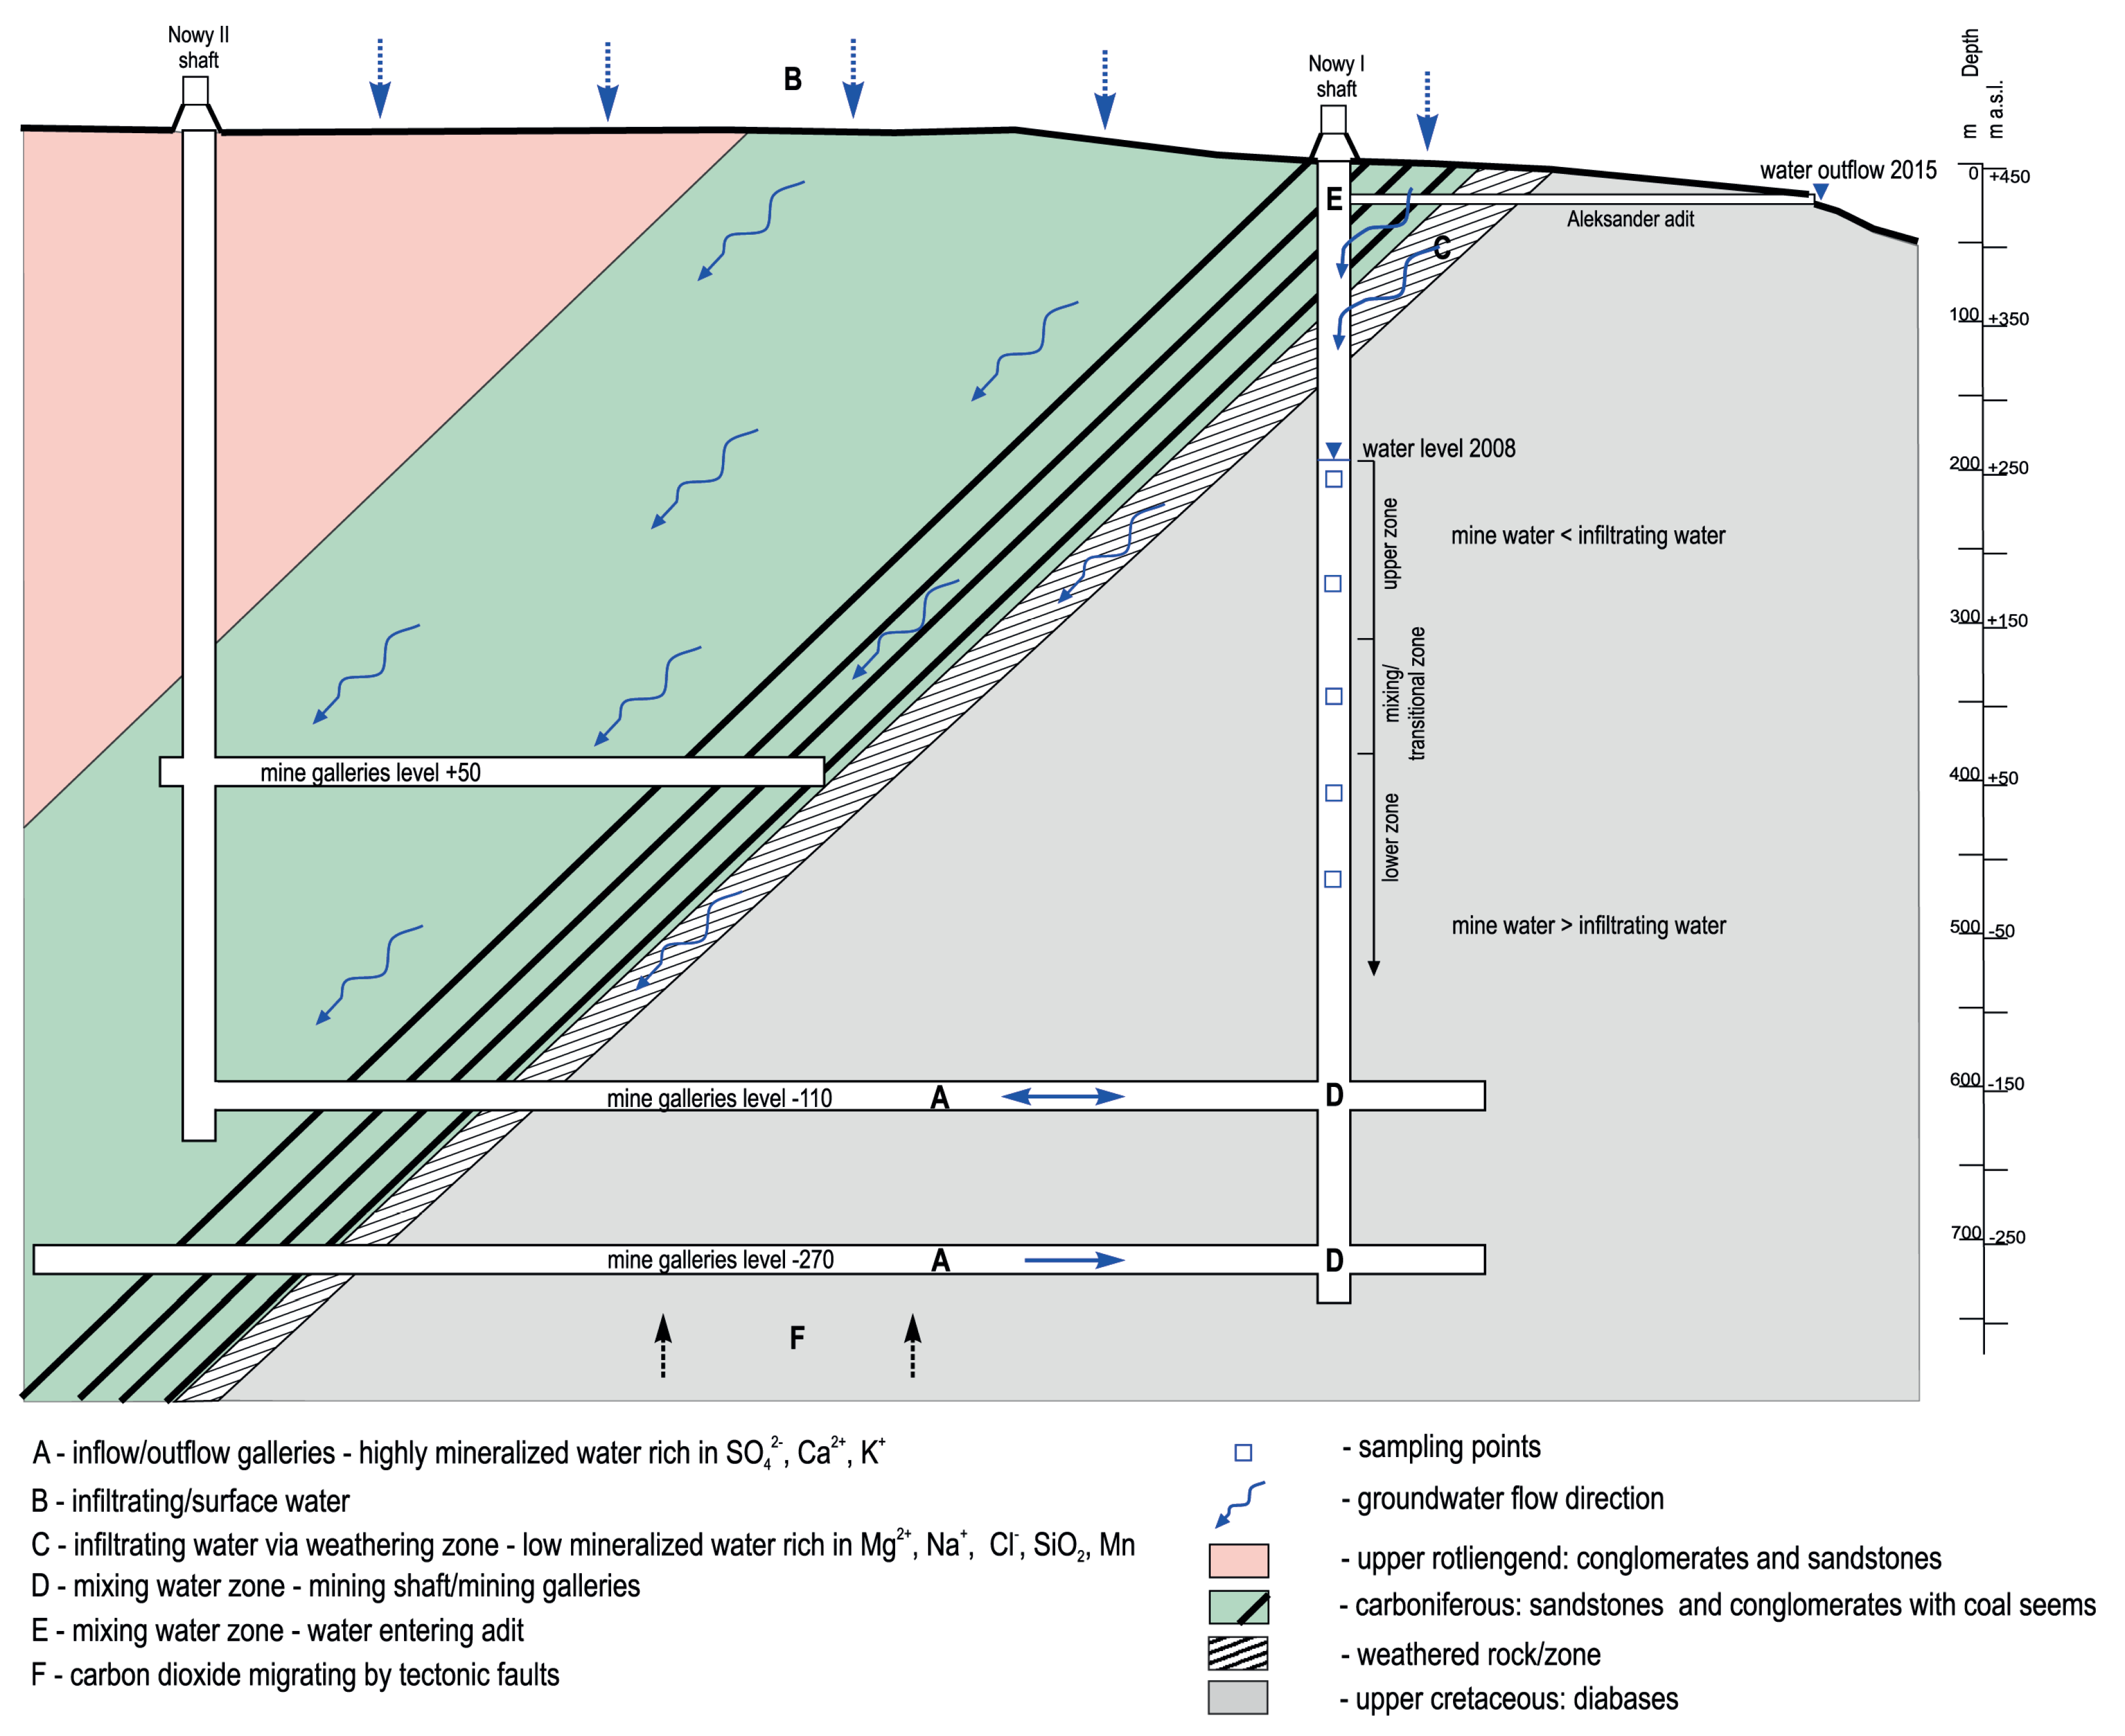
During the mine’s flooding two ways of inflow to the shaft could be noticed: horizontal inflow from the Carboniferous aquifer through the galleries at levels −170 and −110 (A in Figure 8) shaping the chemistry of the water in the deeper part of the shaft (D in Figure 8) and a kind of vertical inflow related to water infiltrating from surface directly to the shaft (B in Figure 8) or through the weathered zone (C in Figure 8). Using analogy to the operating mine, if we assume the same inflow ratio as the operational one at the moment just before opening the level −170 (65% of working’s inflow to 35% of the inflow from behind the shaft lining) [39], we can estimate that ca. 50% of the total water flowing into the shaft in the final stage of flooding was coming from behind its lining. Such a change in the structure of water inflow was reflected in the chemistry of water in the shaft being flooded. It can be concluded that the chemistry of water at the level below +80 m a.s.l. (Figure 8) corresponds to the water coming to the shaft from the galleries—its EC is the highest and the ions Ca, K, SO, Fe reach the highest concentrations, that are related to the processes taking place in the filling-up depression cone of the Carboniferous aquifer. At the level range of +150–+80 m a.s.l. a transitional zone can be observed, where deep-circulation and shallow-circulation water is mixing. It was visible in the drop of Eh values (Figure 7) that slightly changed the reduction-oxidation conditions in the shaft. This process is also visible in the changing concentrations of the majority of the ions analysed (Figure 7). Above this zone, the water of shallow circulation, leaking through the shaft lining, dominates. The water there was characterized by lower EC and its chemistry was shaped by inflow from the surface through weathered rocks. This was indicated by increased concentrations of Mg, Na, Cl, SiO, Mn, As and Ni as a result of weathering of silicates and aluminosilicates [56,57].
Such a system persisted until the water table in the shaft reached the level of the “Aleksander” adit, which is currently discharging mine water to the Bożkowski Stream. In that moment, in the near-surface zone of the flooded shaft, the water was mixing [19,38]. These assumptions are confirmed by the results obtained from the sample of the water flowing out of the “Aleksander” adit, that was taken in 2015. Due to the lack of one-time determination of the chemical composition of water in the full profile of the shaft—up to the outflow of the “Aleksander” adit, it is impossible to characterize the hydrogeochemical processes taking place in the completely flooded shaft in detail. It is a motivation to undertake further research works in order to confirm the assumptions and recognize the stratification phenomenon in the “Nowy I” shaft better. Further regular surveys will also allow us to assess the long-term impact of the mine flooding on the environment.
While the above observations are in line with those in other mines in Poland and worldwide, conclusions about the processes shaping this chemical composition are not always the same as those described for the USCB [38], the area of Scotland [19], or German mines [25]. Considering the above-mentioned examples, it should be stated that the stratification in the discussed shaft is not so obvious and its confirmation would require additional research.
5. Conclusions
To summarize, the research carried out in the “Nowy I” shaft indicates a slow process of shaping the variability of chemical composition of the water as the depth increases. Based on the analysis presented above, we can state that in the “Nowy I” shaft, at the stage of flooding, two water “systems” were formed: (I) the lower one, in which water coming from deeper circulation through the Carboniferous aquifer and galleries at levels −170 and −110 enriched with oxidation products from the depression cone was a dominant inflow to the shaft (A in Figure 8), and (II) the upper one, where the water of shallow circulation is dominant through conglomerates and weathered diabases that inflows from outside the shaft lining (C in Figure 8). The margin between these zones is not evident in the sampled water and occurs at a depth of approximately 320–380 m (transitional zone in Figure 8. It was not possible to determine it precisely, due to technical limitations in testing and its methodology. We can state, based on the results of sampling in the “Aleksander” adit, that the completion of the flooding process have slightly changed the conditions in the upper zone by activation of water-mixing process. The presented research results are the starting point for the next works planned in the future to sample water in the entire shaft profile. This will make it possible to determine the changes that occurred in the shaft after more than 12 years, when the groundwater table has already reached the level determined by the “Aleksander” adit and the conditions of flow and chemistry have stabilized. Further research is also important for the long-term assessment of the environmental impact of mine flooding.
Author Contributions
Conceptualization, K.C. and M.W.-K.; methodology K.C. and A.W.; formal analysis, K.C.; investigation, K.C.; data curation, K.C. and A.W.; writing—original draft preparation, K.C., M.W.-K., A.W.; writing—review and editing, M.W.-K.; visualization, K.C. All authors have read and agreed to the published version of the manuscript.
Funding
The research work was partially founded by Polish Ministry of Science and Higher Education (as grant N520 060 31/2300) and co-founded with the research subsidy of the Polish Ministry of Science and Higher Education granted for Wrocław University of Science and Technology for 2020.
Acknowledgments
This work could not have been done without the priceless help of Michał Rysiukiewicz and Mateusz Pȩdziwol, who did a great job during the fieldwork. Acknowledgements go to Mateusz Góralczyk and Jim Lewandowski for editorial help. The authors also thank the reviewers for their valuable suggestions that helped to improve the quality of the manuscript.
Conflicts of Interest
The authors declare no conflict of interest.
Abbreviations
The following abbreviations are used in this manuscript:
| KWK | hard-coal mine |
| USCB | Upper Silesian Coal Basin |
| LSCB | Lower Silesian Coal Basin |
| a.s.l. | above sea level |
| b.g.l. | below ground level |
| EC | electric conductivity |
References
- Hill, A. Coal: A Chronology for Britain; Monograph of Northern Mine Research Society, 2012; Volume 94, Available online: https://www.nmrs.org.uk/ (accessed on 19 November 2020).
- Gołębiowski, A.; Kozłowski, B. Closing Mines in Wałbrzych; Okręgowy Urząd Górniczy: Wałbrzych, Poland, 1992. [Google Scholar]
- Banks, D.; Younger, P.L.; Arnesen, R.T.; Iversen, E.R.; Banks, S.B. Mine-water chemistry: The good, the bad and the ugly. Environ. Geol. 1997, 32, 157–174. [Google Scholar] [CrossRef]
- Rogoż, M.; Posyłek, E. Hydrogeological problems connected with closure of mines in the Upper Silesian Coal Basin. In Proceedings of the 7th IMWA Congress, Ustroń, Poland, 11–15 September 2000; pp. 319–330. [Google Scholar]
- Mądrala, M.; Worsa-Kozak, M. Groundwater system of Grodziec Syncline in Iwiny region (SW Poland) 10 years after abandonment of dewatering in “Konrad” mine. In Proceedings of the 11th International Mine Water Association Congress—Mine Water—Managing the Challenges (IMWA), Aachen, Germany, 4–11 September 2011; pp. 393–397. [Google Scholar]
- Younger, P. Coalfield closure and the water environment in Europe. Min. Technol. 2002, 111, 201–209. [Google Scholar]
- Sechman, H.; Kotarba, M.; Dzieniewicz, M.; Romanowski, T.; Fiszer, J. Evidence of methane and carbon dioxide migration to the near surface zone in the area of the abandoned coal mines in Wałbrzych District (lower Silesian Coal Basin, SW Poland) based on periodical changes of molecular and isotopic compositions. Int. J. Coal Geol. 2017, 183, 138–160. [Google Scholar]
- Zeman, J.; Cernik, M.; Supikova, I. Mining and Its Environmental Impact II—Stratification of Mine Water After Flooding, Its Causes and Consequences; Ekomonitor: Chrudim, Czech Republic, 2008. [Google Scholar]
- Zeman, J.; Šupíková, I.; Černík, M. Mine Water Stratification at Abandoned Mines and its Geochemical Model. In Proceedings of the 10th International Mine Water Association Congress, Karlsbad, Czech Republic, 2–5 June 2008; pp. 183–186. [Google Scholar]
- Ladwig, K.; Erickson, P.; Kleinmann, R.; Posluszny, E. Stratification in Water Quality in Inundated Anthracite Mines, Eastern Pennsylvania; US Department of the Interior, Bureau of Mines: Avondale, MD, USA, 1984; Volume II, p. 35. [Google Scholar]
- Stuart, W.; Simpson, T. Variations of pH with depth in anthracite mine-water pools in Pennsylvania. U.S. Geol. Surv. Prof. Pap. 1961, 37, 82–84. [Google Scholar]
- Geller, W.; Klapper, H.; Schultze, M. Natural and Anthropogenic Sulfuric Acidification of Lakes. In Acidic Mining Lakes; Springer: Berlin/Heidelberg, Germany, 1998; pp. 3–14. [Google Scholar]
- Marsden, M.; Holloway, D.; Wilbraham, D. The Position in Scotland. In Proceedings of the UK Environment Agency Conference on “Abandoned Mines: Problems and Solutions”; Bird, L., Ed.; University of Sheffield: Sheffield, UK, 1997; pp. 76–84. [Google Scholar]
- Younger, P.L. Coalfield Abandonment: Geochemical Processes and Hydrochemical Products. In Energy and the Environment: Geochemistry of Fossil, Nuclear and Renewable Resources; Society for Environmental Geochemistry and Health, MacGregor Science: Insch, UK, 1998; Volume 1, p. 29. [Google Scholar]
- Younger, P.L. Holistic remedial strategies for short- and long-term water pollution from abandoned mines. Min. Technol. 2000, 109, 210–218. [Google Scholar] [CrossRef]
- Younger, P.L. Predicting temporal changes in total iron concentrations in groundwaters flowing from abandoned deep mines: A first approximation. J. Contam. Hydrol. 2000, 44, 47–69. [Google Scholar]
- Younger, P.L. Mine water pollution in Scotland: Nature, extent and preventative strategies. Sci. Total Environ. 2001, 265, 309–326. [Google Scholar] [CrossRef]
- Younger, P.L. Mine water pollution from Kernow to Kwazulu-Natal: Geochemical remedial options and their selection in practice. Geosci. South-West Engl. 2002, 10, 255–266. [Google Scholar]
- Nuttall, C.A.; Younger, P.L. Hydrochemical stratification in flooded underground mines: An overlooked pitfall. J. Contam. Hydrol. 2004, 69, 101–114. [Google Scholar] [CrossRef]
- Wolkersdorfer, C. Water Management at Abandoned Flooded Underground Mines; Springer: Berlin/Heidelberg, Germany, 2008; pp. 1–465. [Google Scholar] [CrossRef]
- Geller, W.; Schultze, M.; Kleinmann, R.; Wolkersdorfer, C. Acidic Pit Lakes—The Legacy of Coal and Metal Surface Mines; Springer: Berlin/Heidelberg, Germany, 2013. [Google Scholar]
- Huisamen, A.; Wolkersdorfer, C. Modelling the hydrogeochemical evolution of mine water in a decommissioned opencast coal mine. Int. J. Coal Geol. 2016, 164, 3–12. [Google Scholar] [CrossRef] [Green Version]
- Wolkersdorfer, C.; Nordstrom, D.K.; Beckie, R.D.; Cicerone, D.S.; Elliot, T.; Edraki, M.; Valente, T.; França, S.C.A.; Kumar, P.; Lucero, R.A.O.; et al. Guidance for the Integrated Use of Hydrological, Geochemical, and Isotopic Tools in Mining Operations. Mine Water Environ. 2020, 39, 204–228. [Google Scholar]
- Mugova, E.; Wolkersdorfer, C. A Review of Mine Water Stratification. In Altbergbau-Kolloquium—Tagungsband; Meier, G., Ed.; Nossen (Wagner): Wieliczka/Cracov, Poland, 2018; Volume 18, pp. 12–132. [Google Scholar]
- Mugova, E.; Wolkersdorfer, C. Stratification in Flooded Underground Mines—State of Knowledge and Further Research Ideas. In Mine Water—Technological and Ecological Challenges; Khayrulina, E., Wolkersdorfer, C., Polyakova, S., Bogush, A., Eds.; Perm State University: Perm, Russia, 2019; pp. 40–45. [Google Scholar]
- Rapantova, N.; Licbinska, M.; Babka, O.; Grmela, A.; Pospisil, P. Impact of uranium mines closure and abandonment on groundwater quality. Environ. Sci. Pollut. Res. 2013, 20, 7590–7602. [Google Scholar]
- Engineers, S. Mahanoy Creek Mine Drainage Pollution Abatment Project, Project SL 197. In Operation Scarlift Commonwealth of Pennsylvania; Shapp, M.J., Ed.; GDoER Pottstown: Pennsylvania, PA, USA, 1975. [Google Scholar]
- Melchers, C.; Coldewey, W.; Goerke-Mallet, P.; Wesche, D.; Henkel, L. Sanierte Bergbaustandorte im Spannungsfeld zwischen Nachsorge und Nachnutzung: Proceedings des Internationalen Bergbausymposiums WISSYM_2015; Bad Schlema, 31. August bis 3. September 2015; Wismut GmbH: Chemnitz, Germany, 2015; pp. 99–186. [Google Scholar]
- Álvarez, R.; Ordóñez, A.; De Miguel, E.; Loredo, C. Prediction of the flooding of a mining reservoir in NW Spain. J. Environ. Manag. 2016, 184, 219–228. [Google Scholar] [CrossRef]
- Banks, D.; Frolik, A.; Gzyl, G.; Rogoż, M. Modeling and monitoring of mine water rebound in an abandoned coal mine complex: Siersza Mine, Upper Silesian Coal Basin, Poland. Hydrogeol. J. 2010, 18, 519–534. [Google Scholar] [CrossRef]
- Duane, M.J.; Pigozzi, G.; Harris, C. Geochemistry of some deep gold mine waters from the western portion of the Witwatersrand Basin, South Africa. J. Afr. Earth Sci. 1997, 24, 105–123. [Google Scholar] [CrossRef]
- Elliot, T.; Younger, P.L. Hydrochemical and isotopic tracing of mixing dynamics and water quality evolution under pumping conditions in the mine shaft of the abandoned Frances Colliery, Scotland. Appl. Geochem. 2007, 22, 2834–2860. [Google Scholar] [CrossRef]
- Kories, H.; Rtiterkamp, P.; Sippel, M. Field and numerical studies of water stratification in flooded shafts. In Proceedings of the International Mine Water Association Symposium, Newcastle upon Tyne, UK, 20–25 September 2004; Jarvis, A., Dudgeon, B., Younger, P., Eds.; University of Newcastle: Newcastle upon Tyne, UK, 2004; pp. 1–17. [Google Scholar]
- Younger, P.L. Abandoned Coal Mines: From Environmental Liabilities to Low-Carbon Energy Assets. Int. J. Coal Geol. 2016, 164, 1–2. [Google Scholar] [CrossRef] [Green Version]
- Bao, T.; Liu, Z.L. Geothermal energy from flooded mines: Modeling of transient energy recovery with thermohaline stratification. Energy Convers. Manag. 2019, 199, 111956. [Google Scholar] [CrossRef]
- Bao, T.; Liu, Z.L. Thermohaline stratification modeling in mine water via double-diffusive convection for geothermal energy recovery from flooded mines. Appl. Energy 2019, 237, 566–580. [Google Scholar]
- Bao, T.; Meldrum, J.; Green, C.; Vitton, S.; Liu, Z.; Bird, K. Geothermal energy recovery from deep flooded copper mines for heating. Energy Convers. Manag. 2019, 183, 604–616. [Google Scholar] [CrossRef]
- Frolik, A. Stratyfikacja hydrogeochemiczna wód w zatopionych podziemnych wyrobiskach górniczych kopalń wȩgla kamiennego. Przegla̧d Górniczy 2009, 65, 84–90. [Google Scholar]
- Chudy, K. Zmiany Warunków Hydrogeologicznych w Rejonie Niecki Nowej Rudy w Zwia̧zku z Likwidacja̧ Kopalń Wȩgla Kamiennego; Wydawnictwo Uniwesytetu Wrocławskiego: Wroclaw, Poland, 2008; p. 134. [Google Scholar]
- Kazimierz, D. Sedymentacja i peleogeografia utworów górnokarbońskich w niecce śródsudeckiej. Geol. Sudet. 1971, 5, 7–75. [Google Scholar]
- Jeleńska, M.; Kαdzialko-Hofmokl, M.; Edel, J.B.; Jamrozik, L.; Petersen, N.; Soffel, H. Palaeomagnetic investigations of the Palaeozoic circum-Sowie Góry Mountains ophiolitic belt in the Sudetes, Poland. Geophys. J. Int. 1995, 122, 658–674. [Google Scholar] [CrossRef] [Green Version]
- Kadziałko-Hofmokl, M.; Mazur, S.; Werner, T.; Kruczyk, J. Relationships between magnetic and structural fabrics revealed by Variscan basement rocks subjected to heterogeneous deformation—A case study from the Kłodzko Metamorphic Complex, Central Sudetes, Poland. Geol. Soc. Spec. Publ. 2004, 238, 475–491. [Google Scholar] [CrossRef]
- Pin, C.; Majerowicz, A.; Wojciechowska, I. Upper Paleozoic oceanic crust in the Polish Sudetes: NdSr isotope and trace element evidence. LITHOS 1988, 21, 195–209. [Google Scholar] [CrossRef]
- Augustyniak, K. Atlas Geologiczny Dolnośla̧skiego Zagłȩbia Wȩglowego cz. II; Instytut Geologiczny: Warszawa, Poland, 1970. [Google Scholar]
- Bossowski, A.; Ihnatowicz, A. Atlas Geologiczny Dolnośla̧skiego Zgłȩbia Wȩglowego; Instytut Geologiczny Warszawa: Warszawa, Poland, 2006. [Google Scholar]
- Gogolewska, A.; Winiarska, A. Variability of carbon dioxide content distribution within the upper carboniferous coal-bearing strata in the nowa ruda coal basin (Lower Silesia, Poland). In Prace Naukowe Instytutu Gornictwa Politechniki Wroclawskiej; Oficyna Wydawnicza Politechniki Wrocławskiej: Wrocław, Poland, 2004. [Google Scholar]
- Kapuscinski, T.; Pozzi, M. Contribution to the Knowledge of Differentiation of the Gabbro-Diabase Massif in the Slupiec Area; Kwartalnik Geologiczny: Warszawa, Poland, 1981. [Google Scholar]
- Kapuscinski, T. Petrographic study of diabase and gabbro alterations in the basement of Carboniferous sediments in the “Nowa Ruda” mine, Lower Silesia. Miner. Pol. 1991, 22, 39–48. [Google Scholar]
- Nowak, G.J. Thermal maturity of coals from the Lower Silesian Coal Basin on the background of their petrography and genesis. Biul. Panstw. Inst. Geol. 2000, 391, 89–146. [Google Scholar]
- Kapuś>ciński, T. Osady Chemicznego Wietrzenia Skał Magmowych i Kaolinitowe łupki Wȩglowe (Tonsztajny) w Polu Górniczycm Kopalni Słupic. Studium Mineralogiczno-Chemiczne; Zeszyty Naukowe Nr 367; Politechnika Śla̧ska: Gliwice, Poland, 1973; p. 82. [Google Scholar]
- Nowak, G.J.; Górecka-Nowak, A. Peat-forming environments of Westphalian A coal seams from the Lower Silesian Coal Basin of SW Poland based on petrographic and palynologic data. Int. J. Coal Geol. 1999, 40, 327–351. [Google Scholar] [CrossRef]
- Malinowski, J. Budowa Geologiczna Polski T. VII—Hydrogeologia; Wydawnictwa Geologiczne: Warszawa, Poland, 1991. [Google Scholar]
- Chudy, K.; Ma̧drala, M. Formowanie chemizmu wód podziemnych na obszarze objȩtym drenażem OG Nowa Ruda (KWK “Nowa Ruda”). Biul. Panstw. Inst. Geol. 2010, 440, 55–64. [Google Scholar]
- Motyka, J.; Czop, M.; Jończyk, W.; Stachowicz, Z.; Jończyk, I.; Martyniak, R. Wpływ głębokiej eksploatacji węgla brunatnego na zmiany środowiska wodnego w rejonie Kopalni“ Bełchatów”. Górnictwo I Geoinżynieria 2007, 31, 477–487. [Google Scholar]
- Gogolewska, A. Analysis of gas and rock outburst hazard in coal deposit within Wałbrzych coal basin using GIS tools. Min. Sci. 2011, 133, 49–73. [Google Scholar]
- Elango, L.; Kannan, R. Chapter 11 Rock—Water Interaction and Its Control on Chemical Composition of Groundwater; Elsevier Science: Amsterdam, The Netherlands, 2007; pp. 229–243. [Google Scholar] [CrossRef]
- Senior, L.A.; Sloto, R.A. Arsenic, Boron, and Fluoride Concentrations in Ground Water in and Near Diabase Intrusions, Newark Basin, Southeastern Pennsylvania; Technical Report; U.S. Geological Survey: Reston, VA, USA, 2006. [Google Scholar]
Figure 1.
Location of the Lower Silesian Coal Basin on the background of Carboniferous deposits.

Figure 2.
Scheme of excavations, by which water was delivered to the central pumping stations at levels +50 and −110 located at the “Jan” and “Nowy I” shafts.
Figure 2.
Scheme of excavations, by which water was delivered to the central pumping stations at levels +50 and −110 located at the “Jan” and “Nowy I” shafts.

Figure 3.
Construction scheme, geological profile and sampling points of the “Nowy I” shaft (authors’ concept based on unpublished archival materials).
Figure 3.
Construction scheme, geological profile and sampling points of the “Nowy I” shaft (authors’ concept based on unpublished archival materials).

Figure 4.
The inflow to the mine workings of the “Słupiec” mining area (Adapted from Chudy [39]): (A) on the background of selected elements: 1—precipitation (Nowa Ruda Słupiec monitoring station); 2—developing of accumulated mining area; 3—developing of mining area; 4—total inflow to mine workings; 5—trend line of water inflows to mine workings; (B) to the excavation on the particular mining levels: 1. +170; 2. +50; 3. −110; 4. −270; 5. −460.

Figure 5.
Water table rebound in “Nowy I” shaft (Adapted from Chudy [39]).
Figure 5.
Water table rebound in “Nowy I” shaft (Adapted from Chudy [39]).

Figure 6.
Hydrogeochemical types of water inflowing to excavations on particular exploitation levels [53] in comparison with water from the flooded shaft “Nowy I”.
Figure 6.
Hydrogeochemical types of water inflowing to excavations on particular exploitation levels [53] in comparison with water from the flooded shaft “Nowy I”.

Figure 7.
Vertical variability of physicochemical parameters and concentrations of specific ions in water samples from the “Nowy I” shaft.
Figure 7.
Vertical variability of physicochemical parameters and concentrations of specific ions in water samples from the “Nowy I” shaft.

Figure 8.
Conceptual scheme of water stratification in the flooded shaft “Nowy I”.


Table 1.
Physicochemical analyses of water samples from the flooded “Nowy I” shaft—major constituents.
Table 1.
Physicochemical analyses of water samples from the flooded “Nowy I” shaft—major constituents.
| Sample Depth | pH | Eh | EC | HCO | Na | K | Mg | Ca | SO | Cl | NO | NH | Fe | Mn | Al | SiO | |
|---|---|---|---|---|---|---|---|---|---|---|---|---|---|---|---|---|---|
| m b.g.l. | m a.s.l. | mV/cm | S/cm | mg/L | mg/L | mg/L | mg/L | mg/L | mg/L | mg/L | mg/L | mg/L | mg/L | mg/L | mg/L | mg/L | |
| 220 | 233.8 | 7.45 | 200 | 1513 | 217.8 | 48.21 | 27.67 | 57.76 | 236.0 | 837.0 | 23.1 | 1.36 | 0.18 | 1.44 | 0.198 | 5.62 | 22.32 |
| 280 | 173.8 | 7.46 | 240 | 1530 | 224.5 | 44.39 | 29.90 | 56.04 | 246.4 | 851.8 | 24.9 | 0.44 | 0.09 | 2.11 | 0.070 | 8.45 | 18.36 |
| 350 | 103.8 | 7.36 | 190 | 1538 | 222.1 | 49.38 | 24.50 | 68.44 | 258.6 | 869.8 | 24.1 | 0.31 | 0.18 | 3.14 | 0.002 | 7.18 | 20.58 |
| 400 | 53.8 | 7.43 | 199 | 1562 | 212.9 | 47.70 | 33.59 | 45.20 | 270.9 | 848.9 | 19.5 | 0.57 | 0.06 | 4.17 | 0.067 | 6.19 | 19.47 |
| 460 | −6.2 | 7.42 | 176 | 1598 | 216.0 | 48.21 | 32.82 | 46.34 | 290.5 | 866.7 | 20.2 | 0.10 | 0.10 | 5.01 | 0.106 | 5.24 | 18.83 |
| “Aleksander” adit | 6.42 | 213 | 2230 | 479.0 | 92.03 | 18.19 | 138.56 | 230.3 | 972.1 | 25.1 | 0.33 | 0.01 | 0.26 | 3.345 | 0.12 | 13.84 | |
Table 2.
Physicochemical analyses of water samples from the flooded “Nowy I” shaft—minor constituents.
Table 2.
Physicochemical analyses of water samples from the flooded “Nowy I” shaft—minor constituents.
| Sample Depth | Pb | Cd | Cu | Ni | Zn | Cr | As | Mo | Sn | Ba | Co | |
|---|---|---|---|---|---|---|---|---|---|---|---|---|
| m b.g.l. | m a.s.l. | g/L | g/L | g/L | g/L | g/L | g/L | g/L | g/L | g/L | g/L | g/L |
| 220 | 233.8 | 108 | 3 | 6 | 72 | 55 | 39 | 9 | 31 | 71 | 33 | 1 |
| 280 | 173.8 | 75 | 1 | 13 | 25 | 176 | 46 | 7 | 23 | 88 | 26 | 1 |
| 350 | 103.8 | 127 | 1 | 7 | 11 | 41 | 45 | 5 | 21 | 115 | 20 | 2 |
| 400 | 53.8 | 102 | 2 | 18 | 22 | 41 | 37 | 5 | 17 | 91 | 20 | 5 |
| 460 | −6.2 | 125 | 6 | 13 | 30 | 128 | 39 | 4 | 11 | 99 | 23 | 1 |
| “Aleksander” adit | 33 | 4 | 4 | 278 | 39 | - | - | - | - | 198 | 39 | |
Sample Availability: Samples of the compounds are not available. | |
Publisher’s Note: MDPI stays neutral with regard to jurisdictional claims in published maps and institutional affiliations. |
© 2020 by the authors. Licensee MDPI, Basel, Switzerland. This article is an open access article distributed under the terms and conditions of the Creative Commons Attribution (CC BY) license (http://creativecommons.org/licenses/by/4.0/).
Share and Cite
MDPI and ACS Style
Chudy, K.; Worsa-Kozak, M.; Wójcik, A. Groundwater Chemistry and Stratification in the Flooded Hard-Coal Mine Shaft “Nowy I” (Nowa Ruda Region, SW Poland). Water 2020, 12, 3257. https://doi.org/10.3390/w12113257
AMA Style
Chudy K, Worsa-Kozak M, Wójcik A. Groundwater Chemistry and Stratification in the Flooded Hard-Coal Mine Shaft “Nowy I” (Nowa Ruda Region, SW Poland). Water. 2020; 12(11):3257. https://doi.org/10.3390/w12113257
Chicago/Turabian StyleChudy, Krzysztof, Magdalena Worsa-Kozak, and Agnieszka Wójcik. 2020. "Groundwater Chemistry and Stratification in the Flooded Hard-Coal Mine Shaft “Nowy I” (Nowa Ruda Region, SW Poland)" Water 12, no. 11: 3257. https://doi.org/10.3390/w12113257
Note that from the first issue of 2016, this journal uses article numbers instead of page numbers. See further details here.