Impact of Relative Sea-Level Rise on Low-Lying Coastal Areas of Catalonia, NW Mediterranean, Spain


Laboratori d’Enginyeria Marítima, Universitat Politècnica de Catalunya·BarcelonaTech, c/Jordi Girona 1-3, Campus Nord ed D1, 08034 Barcelona, Spain
*
Author to whom correspondence should be addressed.
Water 2020, 12(11), 3252; https://doi.org/10.3390/w12113252
Submission received: 14 October 2020
/
Revised: 16 November 2020
/
Accepted: 17 November 2020
/
Published: 19 November 2020
(This article belongs to the Section Oceans and Coastal Zones)
Abstract
:Low-lying coastal areas are high-risk areas regarding sea-level rise (SLR) due to the combination of low elevation, subsidence and currently low sediment supply, on the one hand, and their high natural and socio-economic values, on the other. Because of this, there is a growing need to assess the integrated impact of SLR taking into account the interactions between physical and ecological factors to make more informed decisions for the design of adaptation strategies. This study presents a methodology for improved SLR-induced flood-damage assessments in natural areas which is composed of (i) a pseudo-dynamic method coupling equilibrium-based coastal response and classical bathtub modeling approaches and (ii) a simple method to account for habitat conversion following inundation. This methodology is applied to low-lying coastal areas of Catalonia under different SLR scenarios, which show very different sensitivities depending on the configuration of the water-land border, topography, geomorphology, and degree of human impact on the floodplain. In terms of potential impact, natural habitats will be the most benefited from the likely conversion at the expense of agriculture lands. This can help coastal managers to adopt adaptation strategies where considering the inherent capacity of some coastal landscapes to adapt opens up new alternatives.
1. Introduction
Sea-level rise (SLR) will significantly alter coastal landscapes through inundation, erosion and salt-water intrusion of low-lying areas worldwide. Considering that 10% of the world’s population inhabits areas less than 10 m above sea level [1], the occupation of which has led to the widespread conversion of natural areas into economically productive regions [2], the most dramatic and immediate effects of SLR will be the inundation of coastal lowland areas [3]. In these areas, such as deltas, where accelerated rates of SLR are exacerbated by natural subsidence due to sediment compaction, inundation is likely by the end of the century [4]. Therefore, SLR coupled with subsidence rates (called relative sea-level rise (RSLR)) will increase the vulnerability of coastal communities and economic sectors to flooding in the near future, causing both environmental and socioeconomic changes [5,6].
Within this context, the Mediterranean coast is especially vulnerable to the impact of RSLR due to the high concentration of sensitive low-lying areas, anthropogenic pressures, and natural hazards [7,8,9]. Moreover, impacts related to climate and environmental changes will be more severe than the expected global mean, with temperatures already reaching +1.5 °C above pre-industrial times [10]. As a consequence, there exist a large number of risk assessments to RSLR for low-lying environments in this region, such as for the Po delta and other Italian plains [11,12,13], the French Mediterranean coastline [14], and the Egyptian coast [15] among others.
Within this region, the Catalan coast can be considered a good example of the NW Mediterranean coastline, where, despite being largely urbanized, low-lying areas of high environmental value still exist [16,17] that are highly vulnerable to SLR (e.g., [18,19]).
Generally, low-lying coasts are highly dynamic and ecologically and economically valuable systems. Due to their proximity to water bodies, coastal habitats are highly vulnerable to the impacts of SLR, meaning that determining their physical and ecological responses to future change is a difficult task. Although inundation is one of the most important SLR impacts on coastal zones, together with erosion and enhanced storm-induced flooding [20], there is a growing need to integrate dynamic interactions between physical and ecological factors to better predict the impacts of SLR on low-lying coasts [21].
One of the most widely used methods to assess SLR-induced inundation is the “bathtub” approach in which areas below a target water level and hydraulically connected to the sea are delineated as being flooded [22,23]. This method is suitable for armored, rocky, and passive coasts where the wave action is limited and the sedimentary supply is low [24]. However, active sedimentary coasts have more dynamic effects than inundation alone, and processes driving coastal evolution are expected to occur as sea level rises [3,25]. In light of this, coastal fringes can be considered a natural barrier to counteract RSLR [19], and therefore, the dynamic responses of shorelines must be included in comprehensive assessments of future SLR-inundation, especially where the only form of protection is afforded from natural landforms such as beaches.
Another important challenge is relating the inundated area to the resulting damage. One approach is to consider the loss of function/habitat occupying the inundated area, e.g., [26]. However, this often overestimates damage, especially from an environmental standpoint, as the capacity of adaptation of natural areas is not considered [27,28]. Despite some uncertainty of how coastal habitats respond to changing conditions, considering the natural capacity of coastal areas to adapt to projected SLR is important for meaningful damage estimates [29]. As an example, [28] found that 70% of the coastal landscape projected to experience future flooding has some capacity to respond dynamically to SLR, which significantly reshape the coastal landscape. Therefore, the use of static inundation models will likely overpredict the expected impact, leading to greater uncertainty for coastal managers. Therefore, to properly assess the impacts of future climate change, it is important to consider and quantify expected habitat changes [30]. As an example, the Sea Level Affecting Marsh Model (SLAMM) was specifically developed to characterize wetland resilience to SLR [31,32,33,34]. This well-known model was broadly applied along the coast of the United States [35] but rarely adapted to microtidal areas, such as the Mediterranean coast [36]. Quantifying the dynamic effects of SLR is also challenging because of the complex interactions between coastal processes acting at different temporal and spatial scales [37]. In this study, we developed a simple Geographical Information System (GIS)-based methodology to assess the potential future damage to coastal habitats. Similar to the decision tree used in the SLAMM, we use transition/evolution rules to represent shifts between coastal habitats to obtain preliminary estimates of potential changes and associated damage from SLR inundation.
The two main aims of the study are to (i) develop a method of assessing RSLR-related inundation of low-lying areas that accounts for dynamic coastal responses and (ii) apply the method to the low-lying areas along the Catalan coast in the NW Mediterranean, Spain. In doing so, we sought to shift the perspectives of coastal managers from considering RSLR solely as a threat to also considering it as an environmental opportunity. At the same time, we aimed to build on previous analyses on the impact of SLR-induced erosion along the Catalan coast [38,39]. These previous studies show that, due to its topography and except for low-lying areas, the Catalan coast has a very low sensitivity to inundation [40]. Therefore, we focus on the most sensitive areas of the Catalan coast based on future SLR scenarios.
2. Study Area and Data
2.1. Study Area
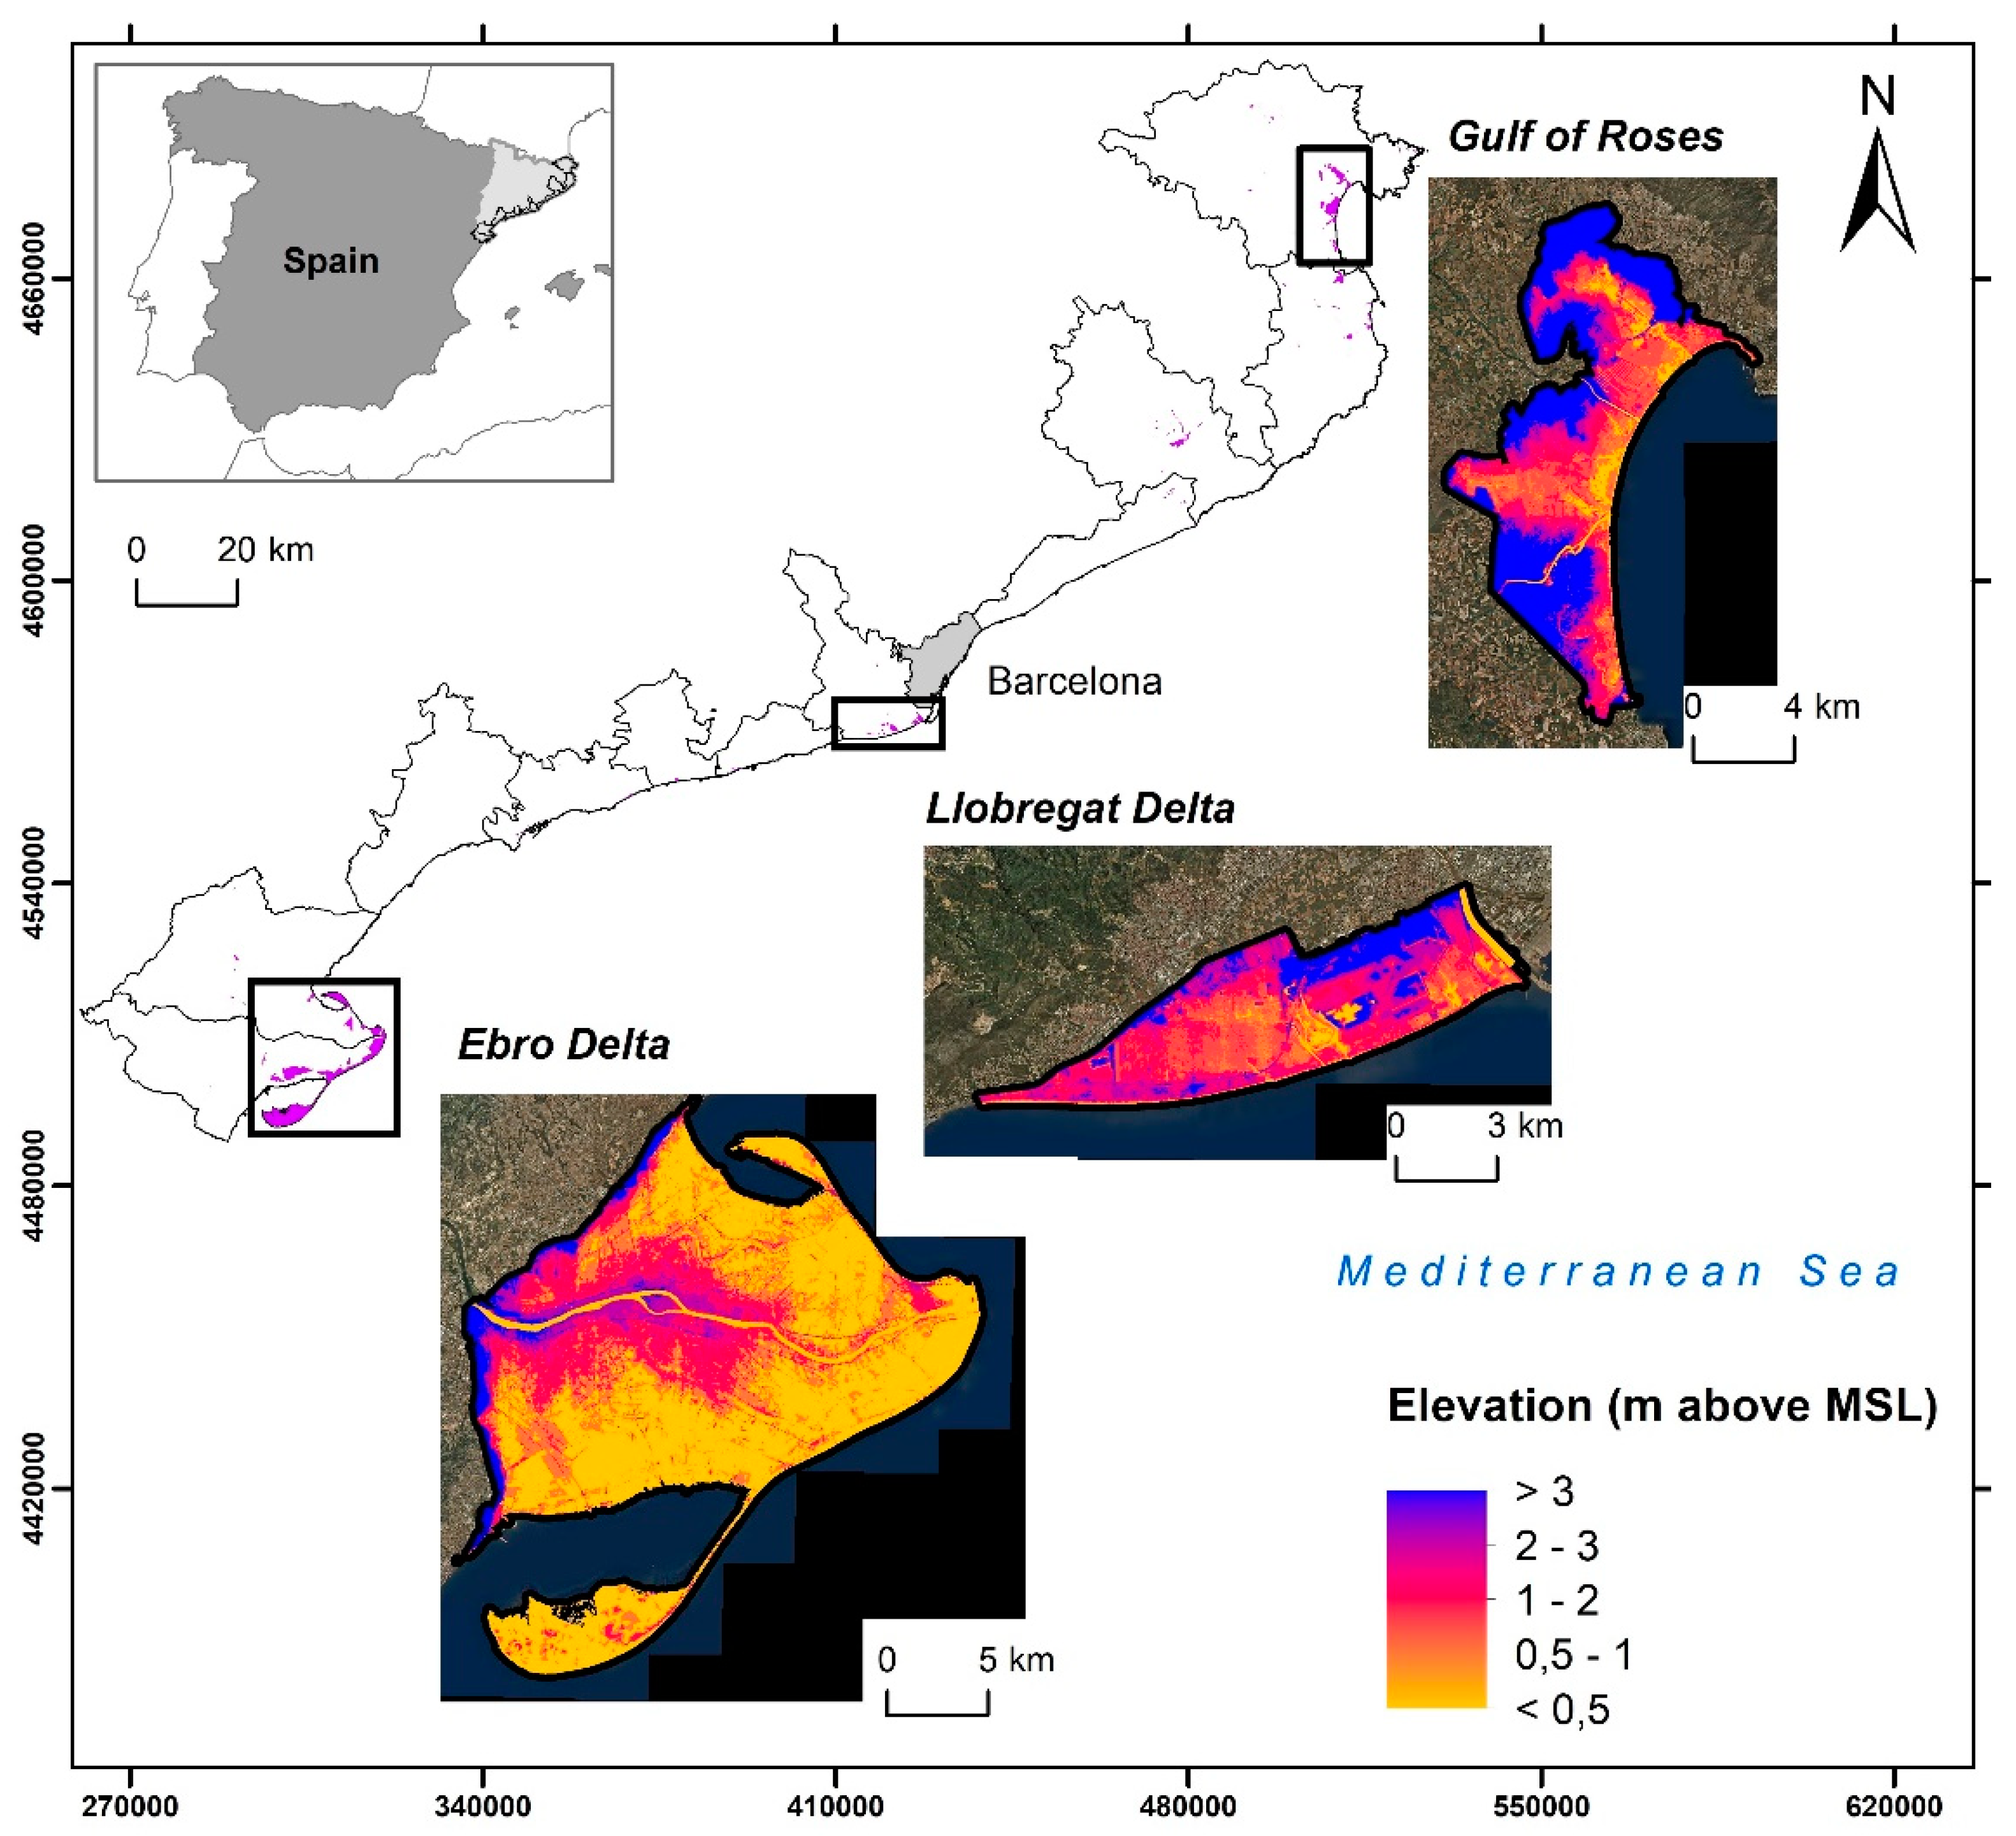
The Catalan coast is located in the northeast Mediterranean region, Spain (Figure 1), and has an approximate coastline length of 600 km comprising cliffs, low-lying deltaic areas, and approximately 270 km of beaches. As of 2019, 63% of the total population in Catalonia (4.82 million people [41]) are concentrated in coastal comarcas (administrative units equivalent to a county), representing 23% of the total territory.
Low-lying areas along the coast have high environmental value due to habitats that provide high ecosystem service values (e.g., [17]) including a very large percentage of environmentally protected areas [42]; 47% of all the designated wetlands in Catalonia are located in the three selected study areas of the Gulf of Roses, the Llobregat Delta, and the Ebro Delta (hereinafter GR, LD, and ED, respectively) (Figure 1) [43]. An overview of the main geomorphologic and socioeconomic characteristics of these areas is given in Table 1. These areas include salt, brackish, and freshwater marshes; coastal lagoons; beaches; and sandy dune habitat, which are protected under different legislative provisions including RAMSAR sites, the Natura 2000 Network, and Natural Parks. The ED is one of the largest deltas in the Mediterranean, of which approximately 7800 ha are protected as a Natural Park. In GR, the Aiguamolls de l’Empordà National Park encompasses 4730 ha in two discontinuous regions separated by the Empuriabrava marina, where human activities are strictly regulated. In contrast, Baix Llobregat Agricultural Park is dominated by peri-urban agriculture [44], containing 2900 ha of fruit and vegetable crops with the objective of promoting the integration of agricultural activities with the natural environment.
In the ED, approximately 210 km2 of the coastal plain are devoted to rice production, generating approximately 98% and 13% of the total yield in Catalonia and Spain, respectively [45]. The land is cultivated under continuous paddy inundation, which requires a constant water supply from the Ebro River distributed via an extensive network of irrigation channels. In the LD area, the main crops are vegetables and fruits, most of which are consumed in the metropolitan area of Barcelona. Agricultural production in the GR is mainly cereals, fruit trees, vines, and olives.
The main factor controlling the inundation of these low-lying areas is their topography (Table 1). Thus, ED is most vulnerable to SLR as approximately 53% of its land area is less than 0.5 m above the mean sea level (MSL) [18]. Anthropogenic influences also modulate the natural inundation of these areas. For example, the dense network of irrigation and drainage channels that crisscross the ED plain acts to extend the area of inundation across the deltaic plain [26].
The configuration of the coastline is also important since, given an absence of flood protection infrastructure, natural landforms serve as a natural barrier to inundation. The LD and GR have a coastal fringe formed by sandy beaches, with coastal dunes of moderate height [46] and some inlets and creeks. These areas are fronted by active shorelines able to respond to SLR and maintain some level of protection assuming they have enough accommodation space. On the other hand, the ED has an active sandy outer coastline with small areas of dunes and a passive muddy coastline along two semi-enclosed bays.
2.2. Data
2.2.1. Low-Lying Areas
The topography of the study sites was characterized using a digital elevation model (DEM) with a grid resolution of 2 × 2 m obtained from Light Detection and Ranging (LiDAR) data from the Cartographic and Geologic Institute of Catalonia [47]. Land use and habitats were characterized using two databases: (i) a land-cover map of Catalonia developed by the Ecological and Forestry Applications Research Centre (4th version) and (ii) the habitat distribution maps produced by the Department of Environment of the Catalan Government (2nd version). The former is a high-resolution thematic map obtained by photo-interpretation analysis with a scale of 1:2500 and a pixel resolution of 0.25 m [48]. The latter details habitats in general including those of interest at a European Union (EU) level compiled from aerial orthophotos (1:5000) between 2008 and 2012 based on the interpretation and adaptation of the EU CORINE classification [49,50]. The official Catalonia Wetland Inventory [51] was also used.
2.2.2. Sea-Level Rise
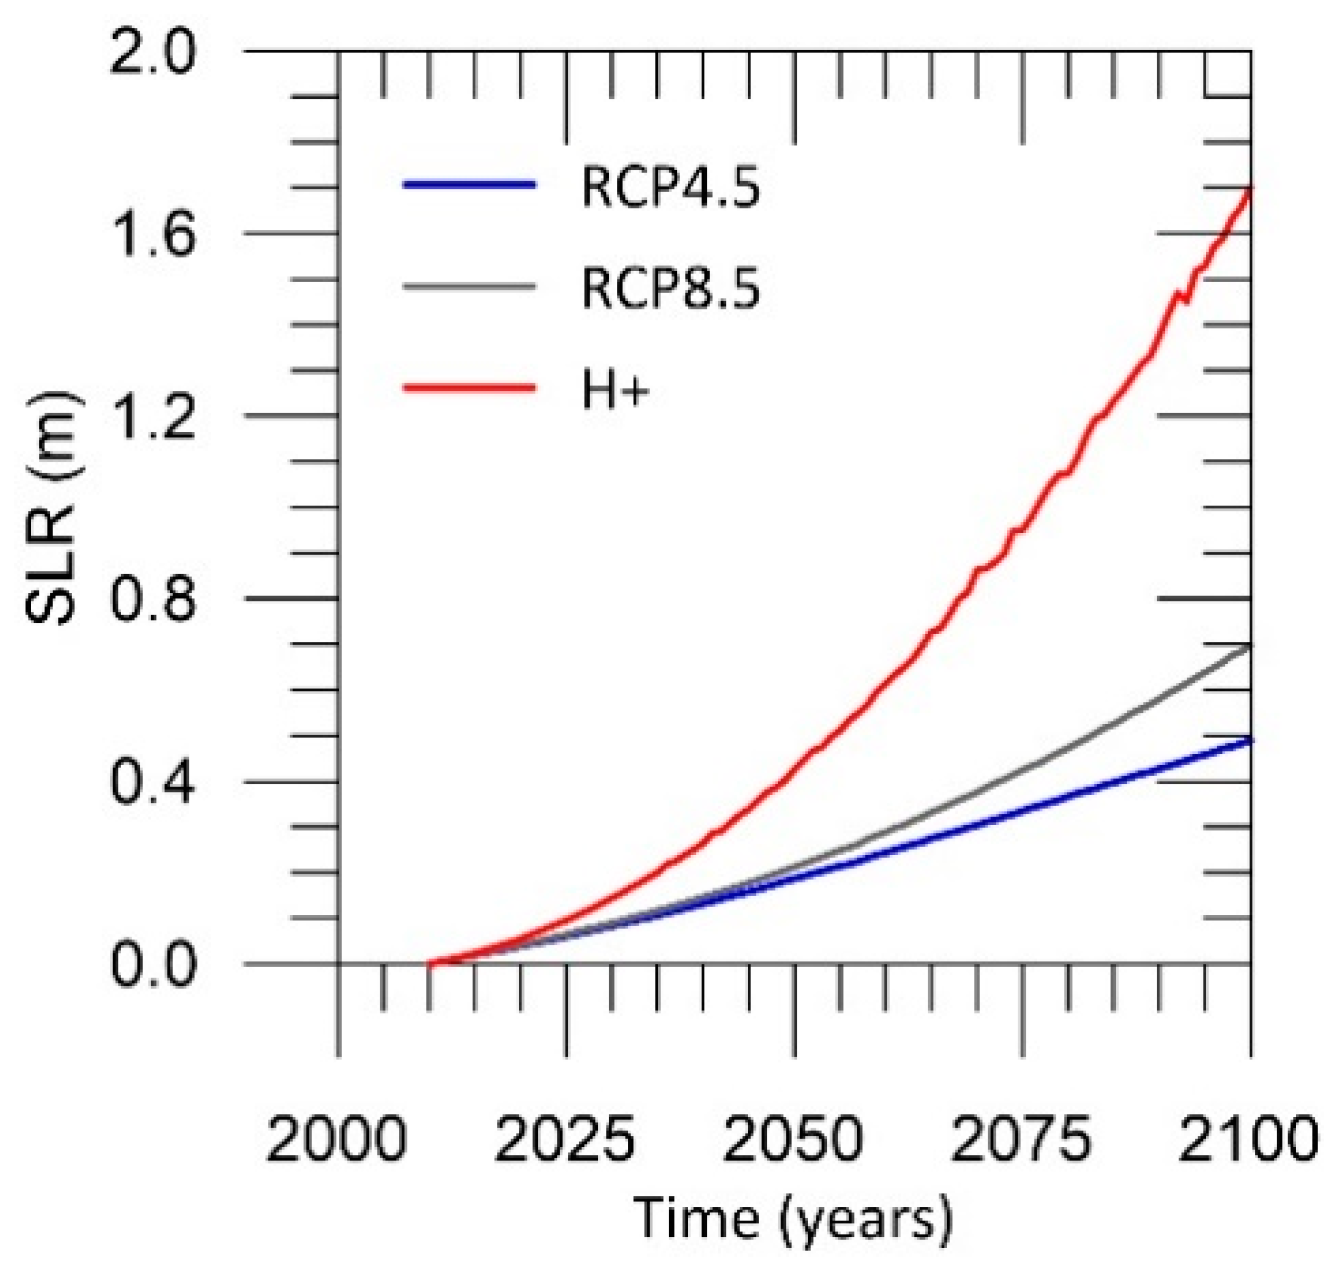
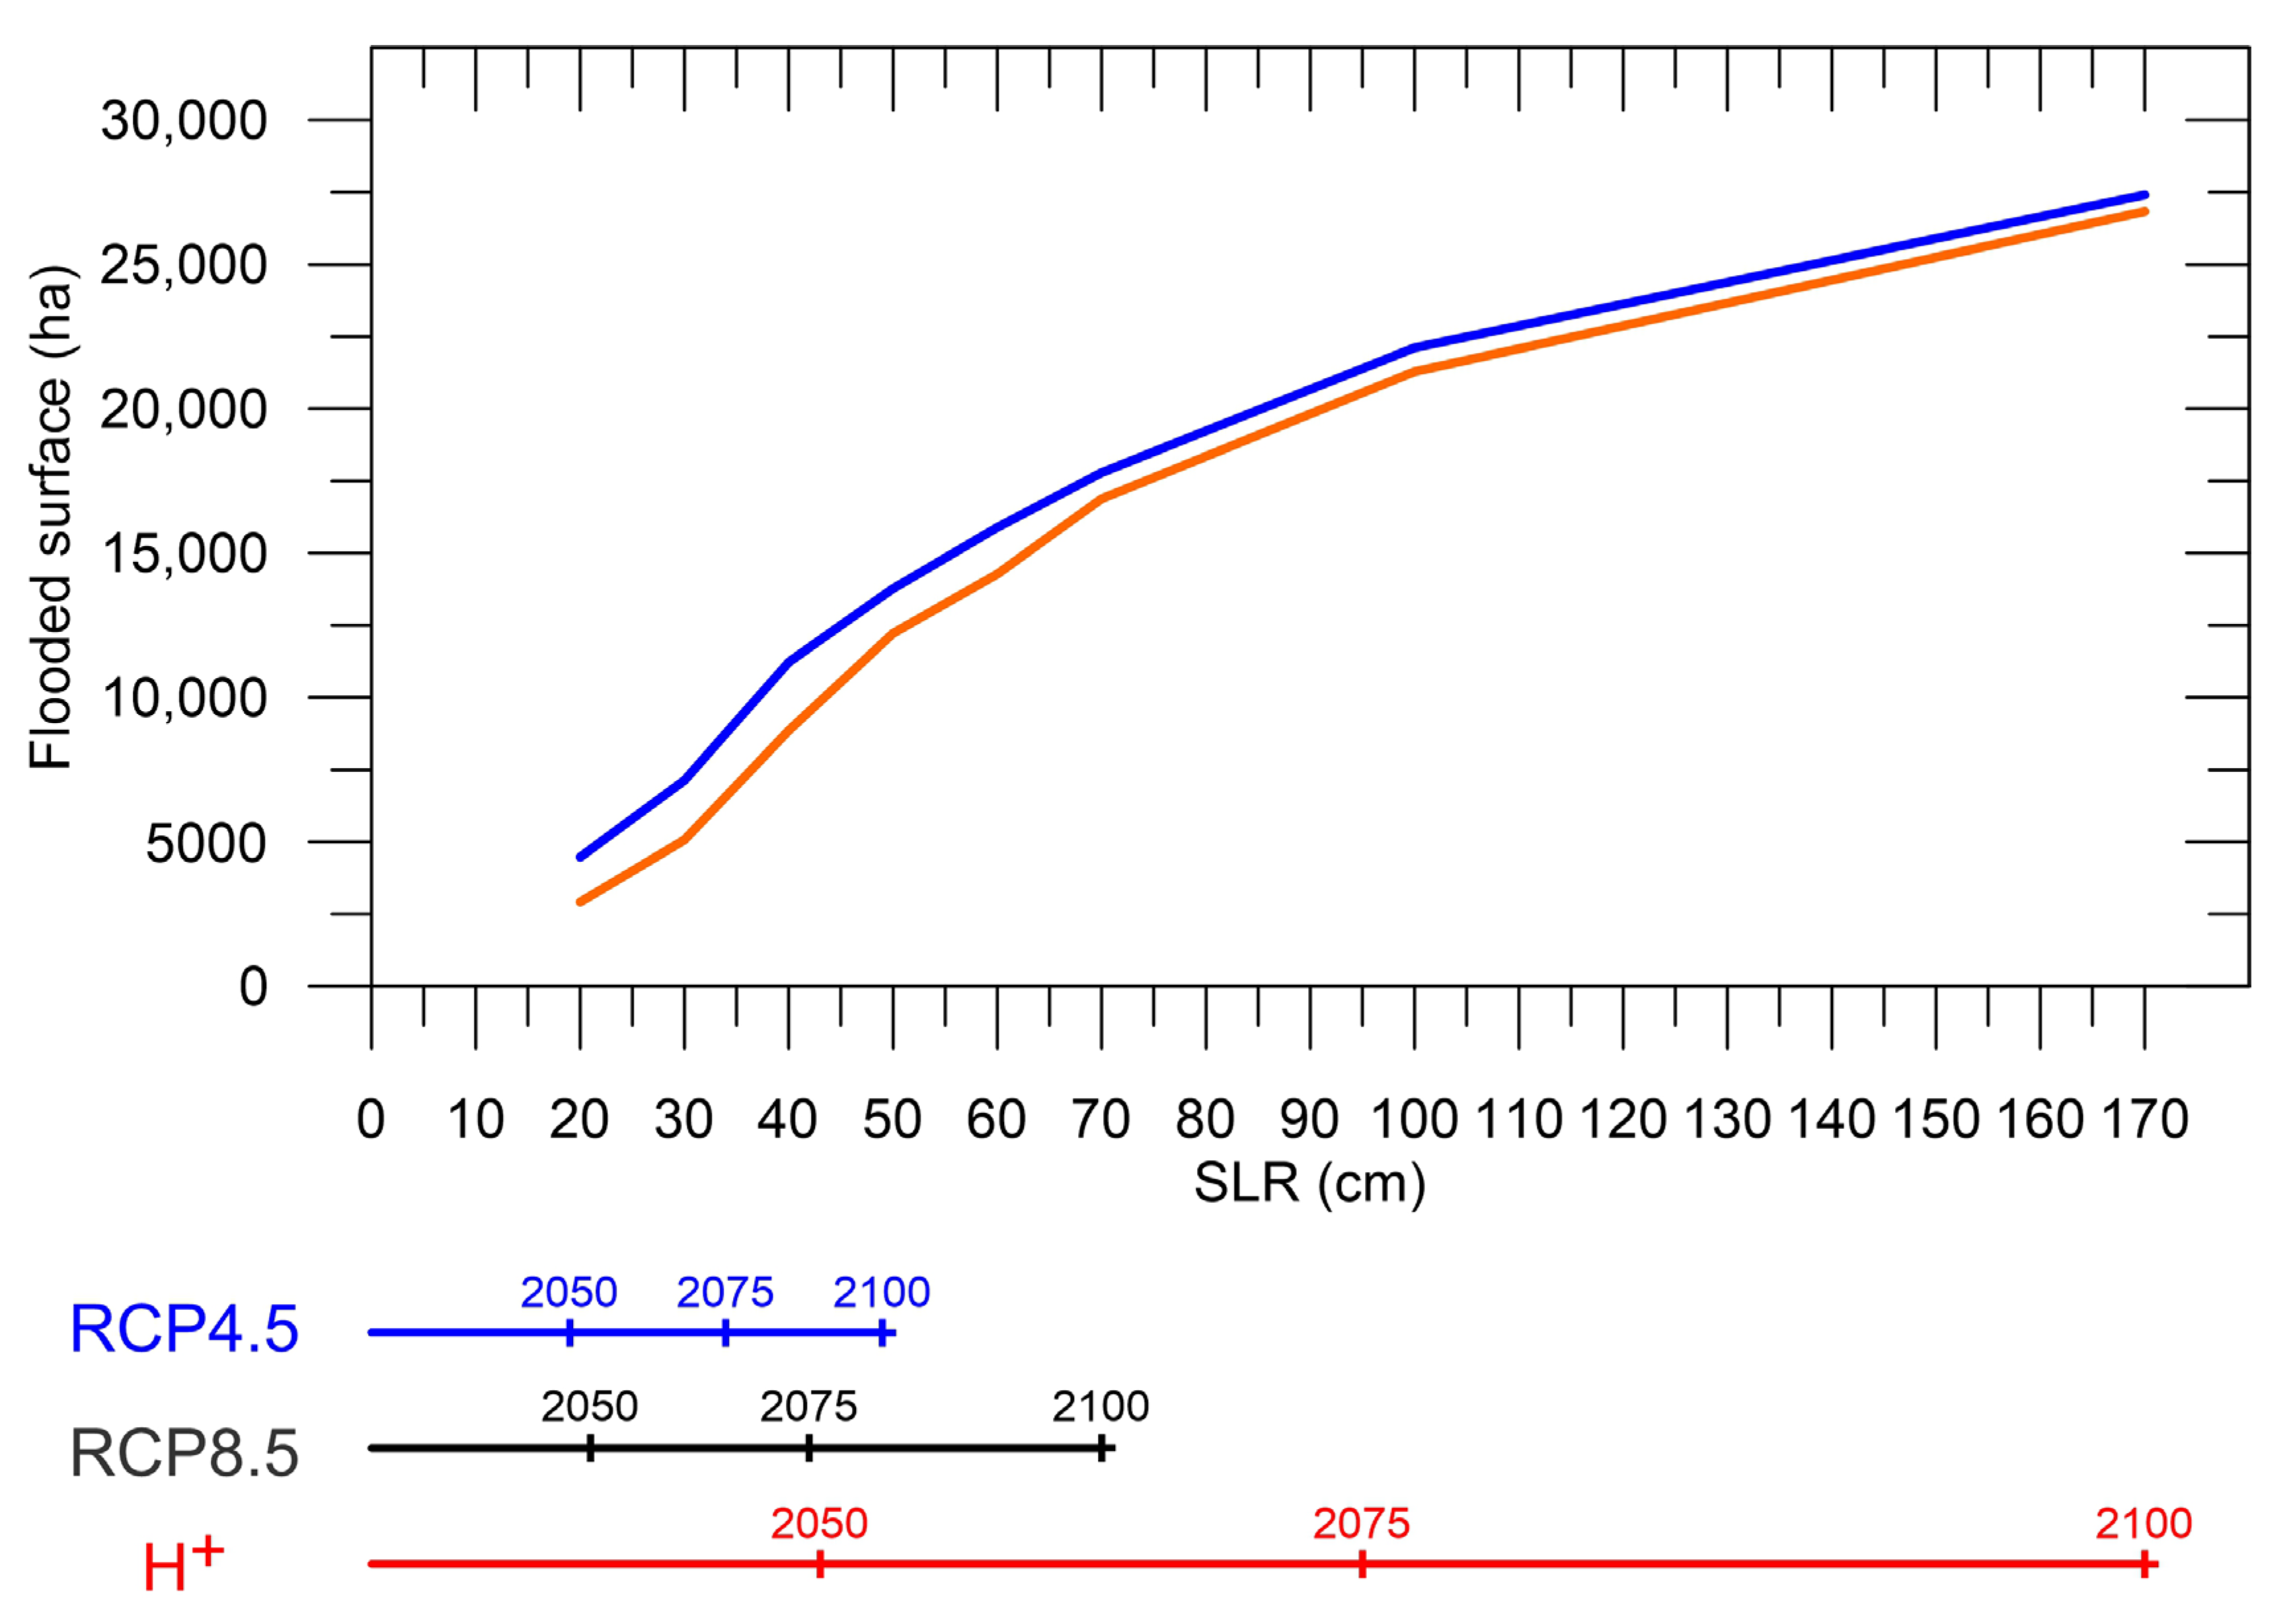
Sea-level rise projections were based on the Intergovernmental Panel on Climate Change (IPCC) AR5 RCP4.5 and RCP8.5 scenarios (50% probability level) [52], with used values representative of regional estimates as showed in [53]. In addition to this, we have also included a high-impact (H+) scenario to take into account the uncertainties associated with polar ice-sheet processes, which is given by the projection of sea level at 95% probability of the RCP8.5 steric component [54]. The inclusion of this scenario has been done from a risk management perspective to include very adverse conditions with a potentially high impact despite their low probability [55]. Relative to 2010, these three scenarios yielded 2100 SLR values of 0.49 m, 0.70 m, and 1.70 m, respectively (Figure 2).
The three study sites are among the areas susceptible to subsidence along the Catalan coast [56]. The ED is most affected by subsidence, with reported rates ranging from 1.75 mm/yr [57] to 3 mm/yr [58,59]. The subsidence in ED under current conditions has been analyzed by [60] using DInSAr (Differential Interferometry Synthetic Aperture Radar). They found varying rates across the deltaic plain averaging about 3 mm/yr along the deltaic front, which we have selected as a representative rate. Subsidence rates for the LD and GR are poorly studied but lower than the ED, with reported average values of 1.25 mm/yr [61] and 0.8 mm/yr [62], respectively.
3. Methodology
Our methodology consisted of two steps: (i) the delineation of inundation-prone areas due to RSLR and (ii) the assessment of the impact of inundation on the affected habitats. In both cases, we adopt a pseudo-dynamic methodology that, in the first instance, accounts for the capacity of active shorelines to respond dynamically to RSLR and, in the second instance, considered the capacity for habitat conversion.
3.1. Delineation of Inundation-Prone Areas
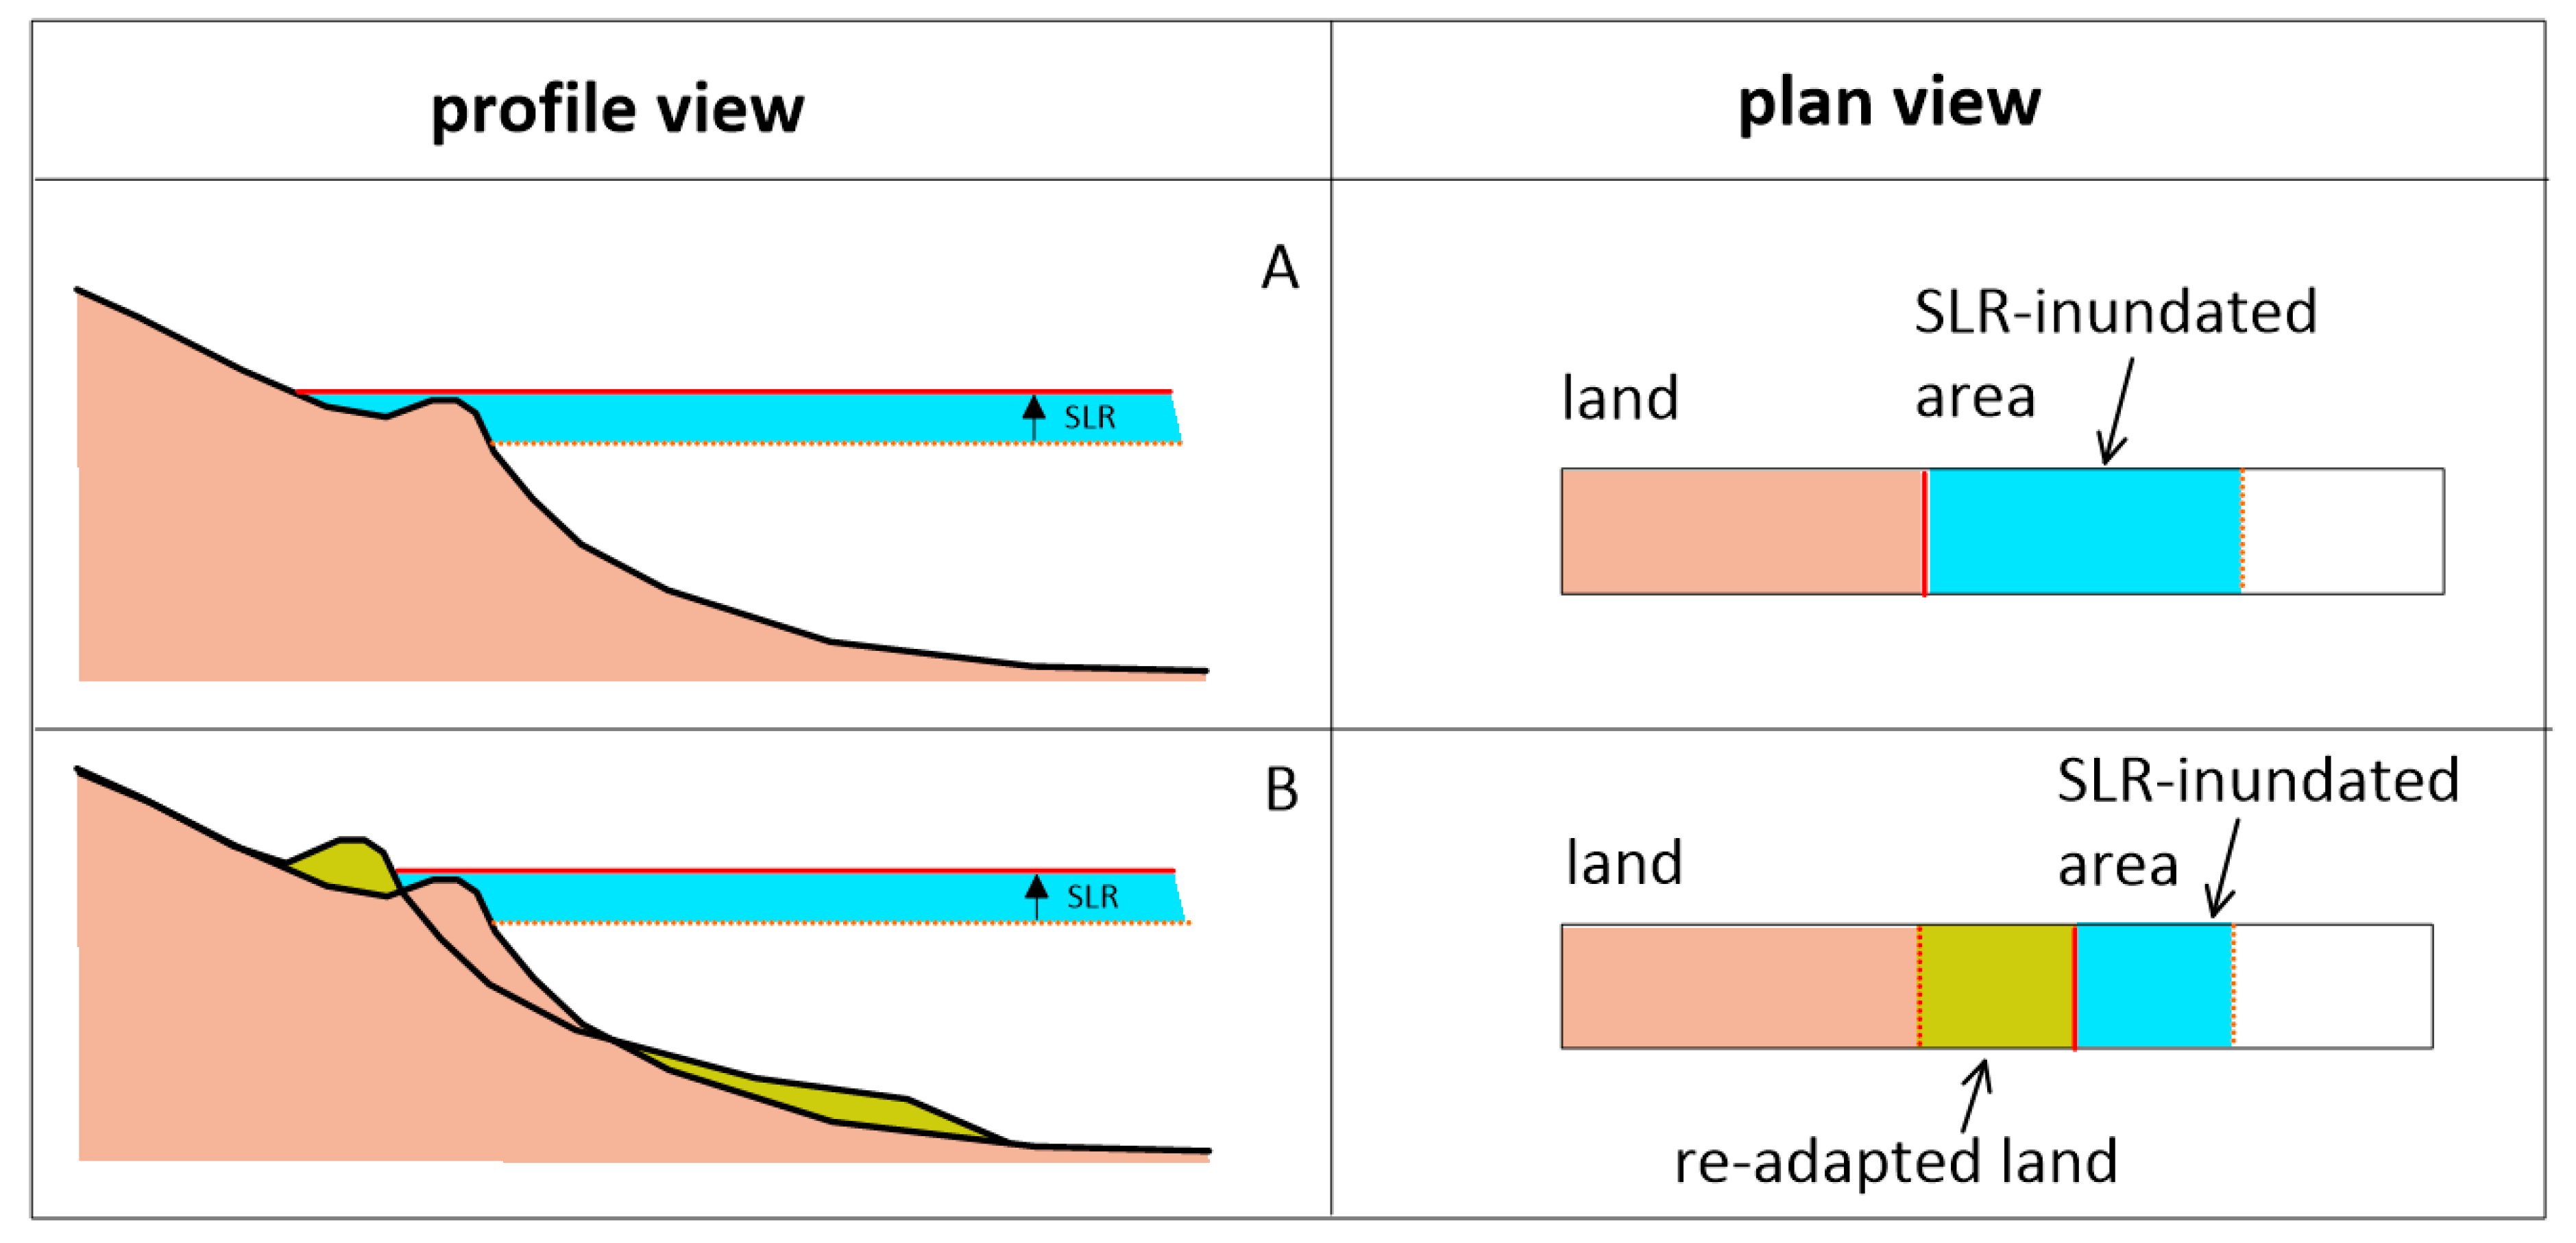
The extent of the area susceptible to inundation under the SLR scenarios was delineated using a pseudo-dynamic bathtub approach. For this, areas below a given water level (i.e., the RSLR of interest) and hydraulically connected to the sea were assumed to be potentially inundated [22,23]. Hydraulic connection was defined using the “eight-side rule”, where the diagonal and cardinal neighbors are used to determine if a model cell is flooded and to remove isolated low-lying inland areas [22]. However, this approach is valid only when the coastal zone is passive, that is, it does not actively respond to RSLR. This includes areas of resistant geology and inner coastlines that do not experience direct wave action. In contrast, exposed low-lying areas fringed by sandy coastlines will react dynamically to changing sea-level conditions (e.g., [3]). Here, we assumed an equilibrium-based response of sandy coastlines to RSLR, as depicted by the Bruun model [63], i.e., an upward and landward translation of the active profile in-pace with rising sea level and maintaining the shape of the equilibrium profile. The validity (and uncertainty) associated to the use of Bruun or, in fact, of any model predicting SLR induced morphological changes has been covered in the literature by different authors [64,65], and it is still an open question [66,67]. In the absence of a universally accepted model, here we have used the Bruun model to assess the magnitude of the RSLR-induced shoreline retreat in the study sites. Thus, we followed the approach of Jiménez et al. [38] when analyzing SLR-induced erosion in Catalonia, whereby the predicted landward response is modulated or prevented by the existence or lack of accommodation space in the hinterland, respectively. Under this assumption, a sandy beach-dune system protecting a low-lying area under current conditions can migrate landwards, while maintaining its relative elevation (and thus protective function) under RSLR provided accommodation space (and sand) is available (Figure 3). Following [38], to reduce the uncertainty in the selection of the closure depth (see [68]), the Bruun rule was applied using the characteristic values of the inner shelf slope for each study site, calculated from the shoreline to 10 m of depth and thus extending deeper than the medium-term closure of depth along the Catalan coast, which is about 7 m [69] (Table 2). This permits to account for the expected increase of the limit of the active profile under increasing time scales as those corresponding to RSLR [70].
The landward extension of the active fringe adapting to RSLR was given as the reach of overwash-induced transport, which depends on the wave and water-level climates, and permits the beach to rebuild landwards while the shoreline erodes. This dynamic adaptation approach has previously been used to simulate the long-term (rollover) behavior of the Trabucador barrier system [71] and to explain the survival of the Tortosa barrier despite experiencing extreme erosion rates (approximately 40 m/year) in the ED [72]. The role of overwash transport in transferring material towards the hinterland is modulated by coastal morphology, particularly dune/beach elevation and beach slope (e.g., [73]).
To estimate the critical width, the extension of overwash deposits was identified and measured using aerial photos to obtain an averaged representative value for each study site (Table 2). Thus, in each case, beach profiles were assumed to adjust to RSLR as predicted by the Bruun rule provided the hinterland is wider than the projected shoreline erosion plus the critical width. If the existing accommodation space is bounded by an inner fixed boundary, this was assumed to be the innermost limit for beach migration. In the latter case, the elevation of the physical boundary controls inundation following the bathtub approach.
3.2. Potential Flood Damage
Once the areas susceptible to inundation under a given RSLR scenario were delineated, the resulting damage was estimated. One common approach is to determine the area of existing land use and habitats and assume they will be lost if inundated (e.g., [26]), which we refer to as the “total damage approach”. However, when an inundated area is composed of natural habitats, some habitats have the capacity to change/adapt to new sea-level conditions, which we call the “conversion approach”. The conversion approach is similar to that used in coastal landscape models where a given habitat affected by inundation has an assumed capacity to change/adapt depending on its properties and the new conditions to which it is exposed [27,28]. The evolution of habitats within an inundated area is evaluated by applying a series of conversion rules linking their current spatial distribution and their expected capacity to respond to each RSLR scenario.
First, coastal habitats were re-classified into generalized types based on their distinctive responses to SLR according to geomorphology, ecology, and level of development. These categories and general summaries of the land-cover types and main habitats found in each study site are provided in Table A1 (in Appendix A). The differences in habitats within a given category correspond to site specificities that depend on local characteristics such as geomorphology, freshwater availability, and land use.
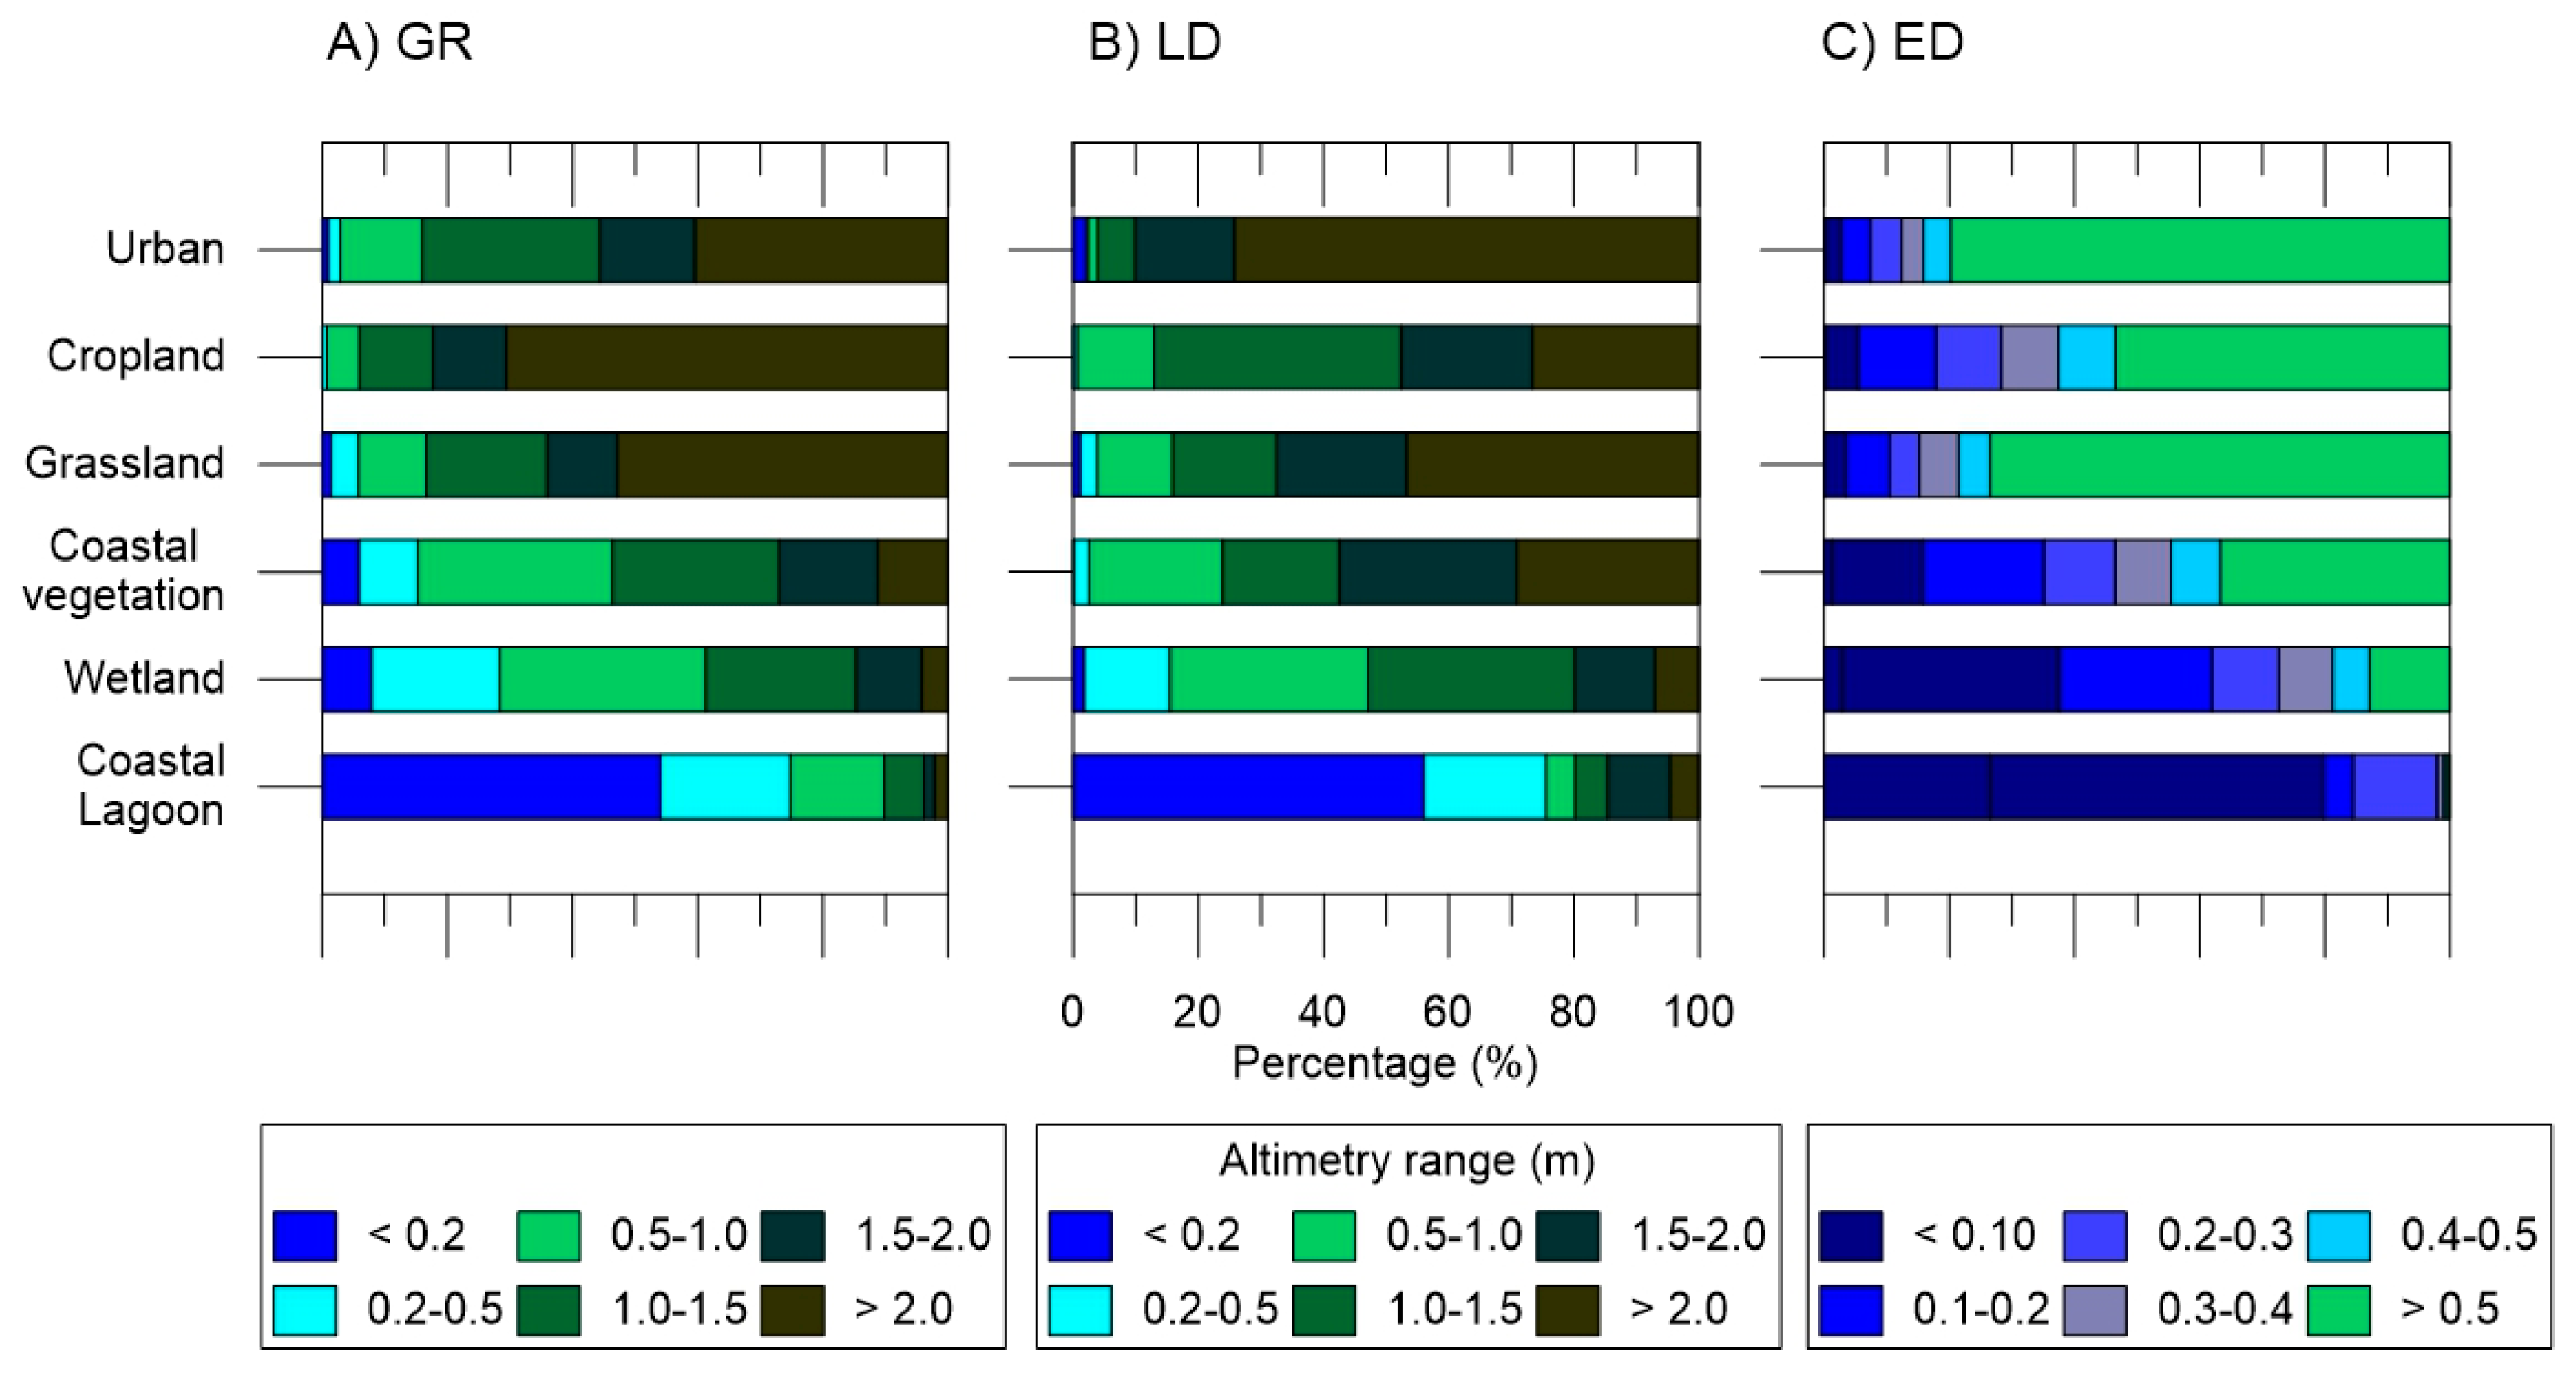
The first variable affecting a habitat’s susceptibility to inundation is vertical distribution and distance with respect to mean sea level. Here, we assumed that specific habitats thrive within a certain elevation range according to their salinity tolerance and resilience to flooding and physical (wave) disturbance. To this end, habitat and topographic data were jointly analyzed to evaluate their vertical distribution, with resulting distribution ranges varying among the study sites (Figure 4), due to their local characteristics, particularly topography and water flux across the coastal plain (see also [74]). Considering the vertical distributions of existing habitats (Figure 4 and Table A1), a series of basic transition rules were applied (Table 3). This followed a simplified version of previously adopted dynamic transitions including the SLAMM [30,31,32,33] and is similar to other simplified approaches [28].
An important aspect to consider in habitat response is the effect of hydraulic connectivity between the affected area and the sea. This was represented by delineating areas of total and partial inundation, which are inextricably linked to vegetation distribution [75]. To this end, we included tidal influences using the following three vertical levels: (i) the mean sea level (MSL), given by the target RSLR; (ii) the high-sea level (HSL); and (iii) the low-sea level (LSL). The HSL and LSL bound the intertidal zone around the future MSL, which corresponds to an average astronomical tidal amplitude of 0.20 m. Thus, when analyzing the inundation extent of each RSLR scenario, the pseudo-dynamic bathtub approach was applied as delimited by the MSL. Two additional inundation simulations were then performed, the first to derive the area below the HSL and the second to derive the area below the LSL. The area below the LSL was taken as the area of permanent inundation, and the intertidal zone between the HSL and LSL was taken as the area of temporary inundation. Importantly, to delineate the area below the HSL, hydraulic connectivity criteria were applied. This meant that areas within this elevation range but which are isolated by the presence of a physical barrier/infrastructure were not inundated. Habitat conversion under a given RSLR scenario was controlled by its location with respect to the MSL (Table 3). The transition rules did not consider the time required for habitats to accommodate new conditions, but as a general rule, the longer they have to reach new conditions, the greater the capacity to change [76]. This time factor is further discussed in Section 5.2.
The conversion rules shown in Table 3 were applied assuming two boundary conditions: (i) no modification to existing structures in the floodplain (e.g., dikes, levees, channels, etc.) and (ii) negligible sediment input to the floodplain. The first condition could be changed to simulate the effect of floodgates or barriers as adaptation measures to RSLR. However, as our primary objective was to assess impact, we chose to evaluate the effect of inundation without anthropogenic influence other than the existing infrastructure. The second condition limits the inherent capacity of wetlands to adapt in response to SLR [75,76]. However, this assumption reflects current conditions in the region and especially in the ED (e.g., [58,77]). Thus, instead of considering vertical accretion rates to control habitat shifts [32,78], the applied rules were based on relative elevation, i.e., sea-level criteria and current vertical distribution of each habitat type.
Finally, the effect of saltwater intrusion on cropland areas was also considered, as this is a major threat to agricultural lands in the region [79,80]. Under this scenario, impacts are expected to differ between the study areas given that their main crop types are not the same (see [81] for the ED, [82] for the GR, and [83] for the LD), meaning variable salinity thresholds with respect to impacts on yield (e.g., [84,85]). Furthermore, local geomorphology dictates the suitability of an area for agriculture and crop type (Figure 4). For example, given the low or very low tolerance of existing crops to saltwater intrusion, croplands are sparse in low-lying areas close to the water level in GR and LD (<1% of the total surface). Therefore, a minimum elevation threshold of 0.5 m with respect to the simulated future water levels was applied for the assumed maintenance of croplands; agricultural land below this level under a given SLR scenario was assumed to be abandoned due to salt intolerance and the likely rapid colonization by other salt-tolerant vegetation (see [86]). Such conversion of abandoned agricultural land to halophytic vegetation communities (or barren land) follows ecosystems connectivity, helping to preserve linkage between them [87,88]. The application of this agricultural transition rule was specific to GR and LD, as agriculture in the ED is devoted to rice production in paddies at all elevations along the delta plain (Figure 4), which are maintained by active freshwater inundation, which productivity also depends on elevation (e.g., [80]).
4. Results
4.1. Flood Analysis and Potentially Inundated Areas
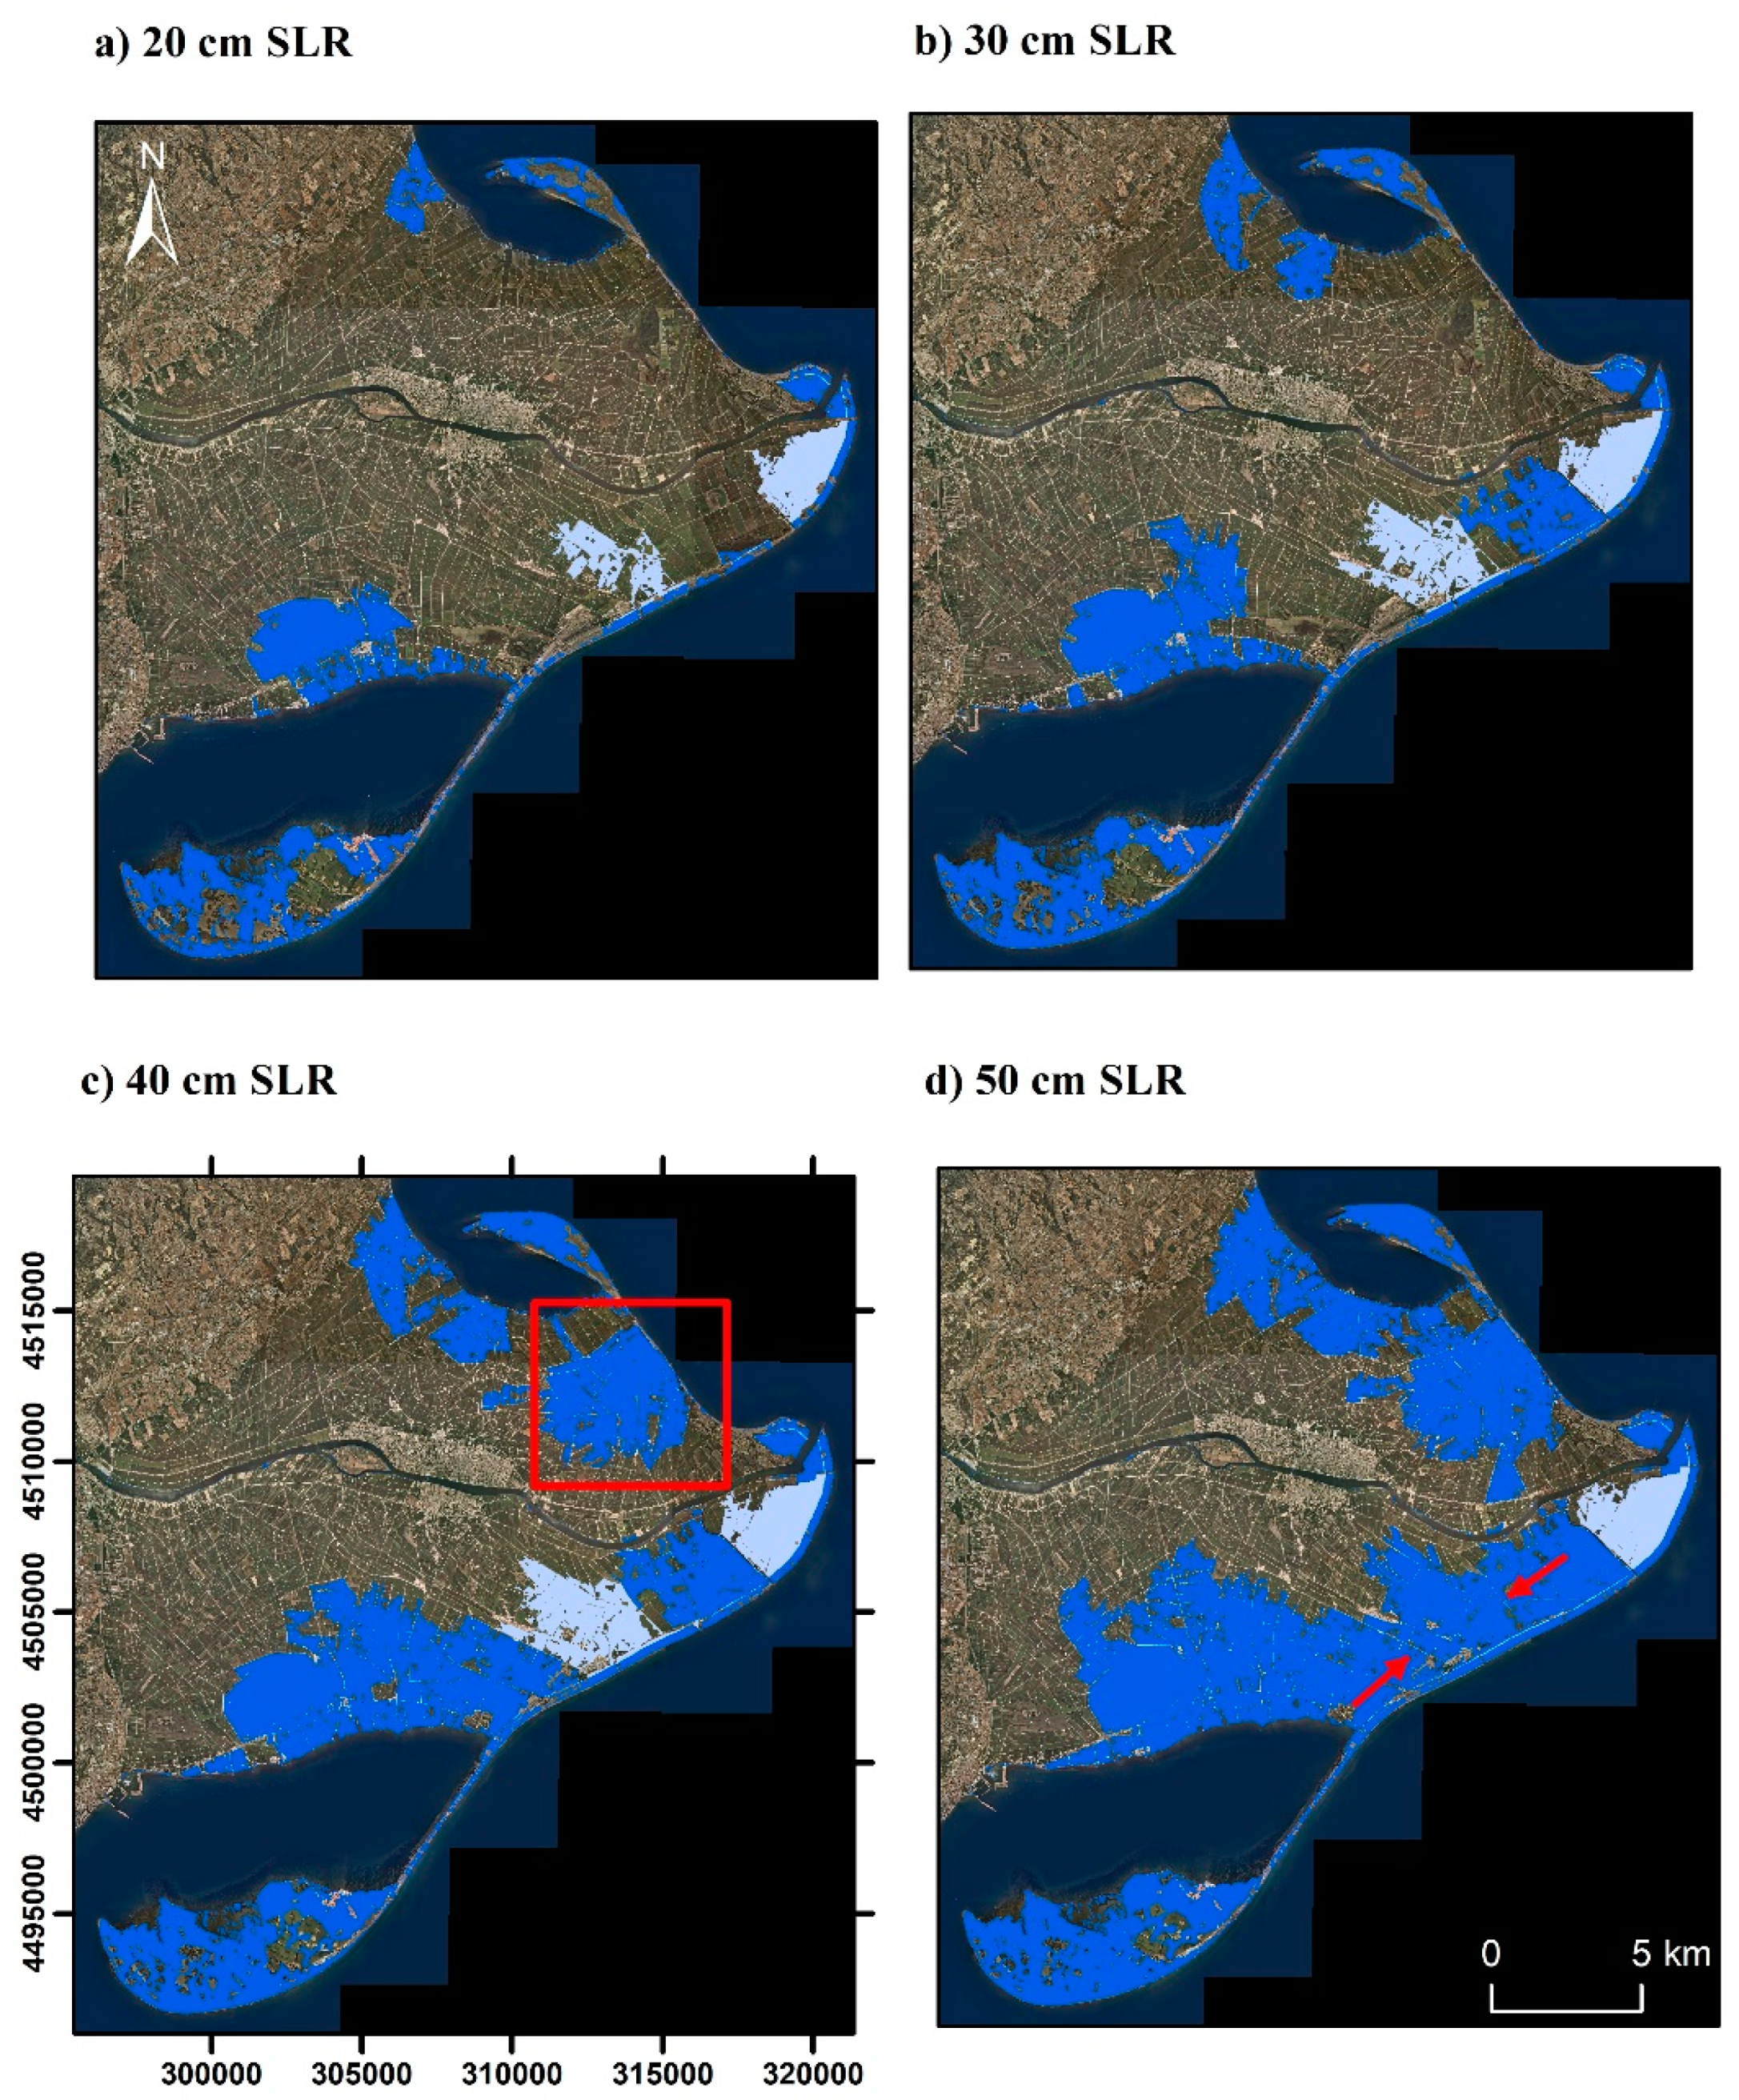
For comparison, Figure 5 shows the ED inundation extent for the entire range of RSLR scenarios based on both the classical (i.e., passive inundation) and pseudo-dynamic bathtub approaches. By 2050, including natural coastline adaptation to SLR decreased the inundated area by approximately 34.7% under RCP4.5 and RCP8.5, and by 21.1% under the H+ scenario. By 2100, the protection provided by the morphodynamic coastal response decreases, with the inundated area being just 11.3%, 5.1%, and 2% lower than that calculated by using the passive bathtub approach for RCP4.5, RCP8.5, and H+ scenarios, respectively.
Therefore, the inclusion of the capacity for active sandy shorelines to respond dynamically to SLR yielded a smaller inundation extent relative to a passive inundation approach, and this effect was most pronounced under the low-medium RSLR scenarios. However, as RSLR increases, the natural protective effect decreased, reflecting site-specific modulation via anthropogenic modification of the deltaic plain (Figure 6). Under lower RSLR conditions, most of the coast is protected by beaches, with inundated areas occurring (i) along the inner bays where there is no beach protection; (ii) in the inner part of the spits; and (iii) in areas with very flat beaches (<RSLR) (indicated by the light-blue areas in Figure 6). However, if a beach can maintain its relative elevation with respect to MSL—as the pseudo-dynamic approach assumed—the hinterland should be protected. This effect can only be detectable provided there are very low sandy stretches (i.e., below the target level); if the entire coast is higher than the simulated RSLR, the computed inundation extent of both methods will be the same.
The capacity for such a dynamic protective response is lost in some locations due to the lack of accommodation space, which is constrained by the existence of infrastructure in the hinterland. In the ED, this was mainly identified in the northern region, where some narrow beaches are backed by levees causing coastal squeeze (see the red square in Figure 6c), with the elevation of this infrastructure (with no adaptation capability to SLR) being the main control on inundation. Accordingly, approximately 1435 ha was flooded assuming 40 cm of SLR primarily as a result of the beach breaching in the absence of active adjustment. The distribution of floodwater across the deltaic plain is another element controlling the magnitude of inundation. This will largely be controlled by the topography of an area, but in the case of the ED, the existing network of channels crisscrossing the area extend the inundation from adjoining areas (Figure 6d).
The computed inundation-prone areas for the three study sites under the considered scenarios are shown in Table 4 and Figure 7. The results reflect the influence of geomorphology and relief, with the ED being the most vulnerable site, and GR and LD only significantly affected under high RSLR conditions due to relatively high beach profiles protecting the hinterland and their higher elevation. This higher topography also implies that differences in the inundation extents determined using the static and modified bathtub approaches will be relatively low in the GR and LD because, as previously noted, this is only detectable when beach/dune heights are lower than the RSLR scenario.
The difference in vulnerability is reflected in the percentage of the affected surface. Thus, by 2050, the inundated surface in the GR and LD represents less than 1% and 2% of the total area under both RCP and H+ scenarios, respectively. In comparison, the proportion of the ED inundated under these scenarios increase by 9% and 27%, respectively (Table 4). Except for the ED, by 2100, the increase in the magnitude of RSLR under RCP4.5 and RCP8.5 did not result in a significant increase in the inundated area. Specifically, the long-term projection of the inundation extent in the GR and LD increased by less than 7% under RCP8.5. In comparison, in the ED, the affected area covered approximately 50% of the deltaic plain under RCP8.5. As expected, the vulnerability of these systems to the H+ scenario significantly increased, with approximately 35% of the GR and LD, and 80% of the ED, being susceptible to inundation.
4.2. Flood Damage Analysis
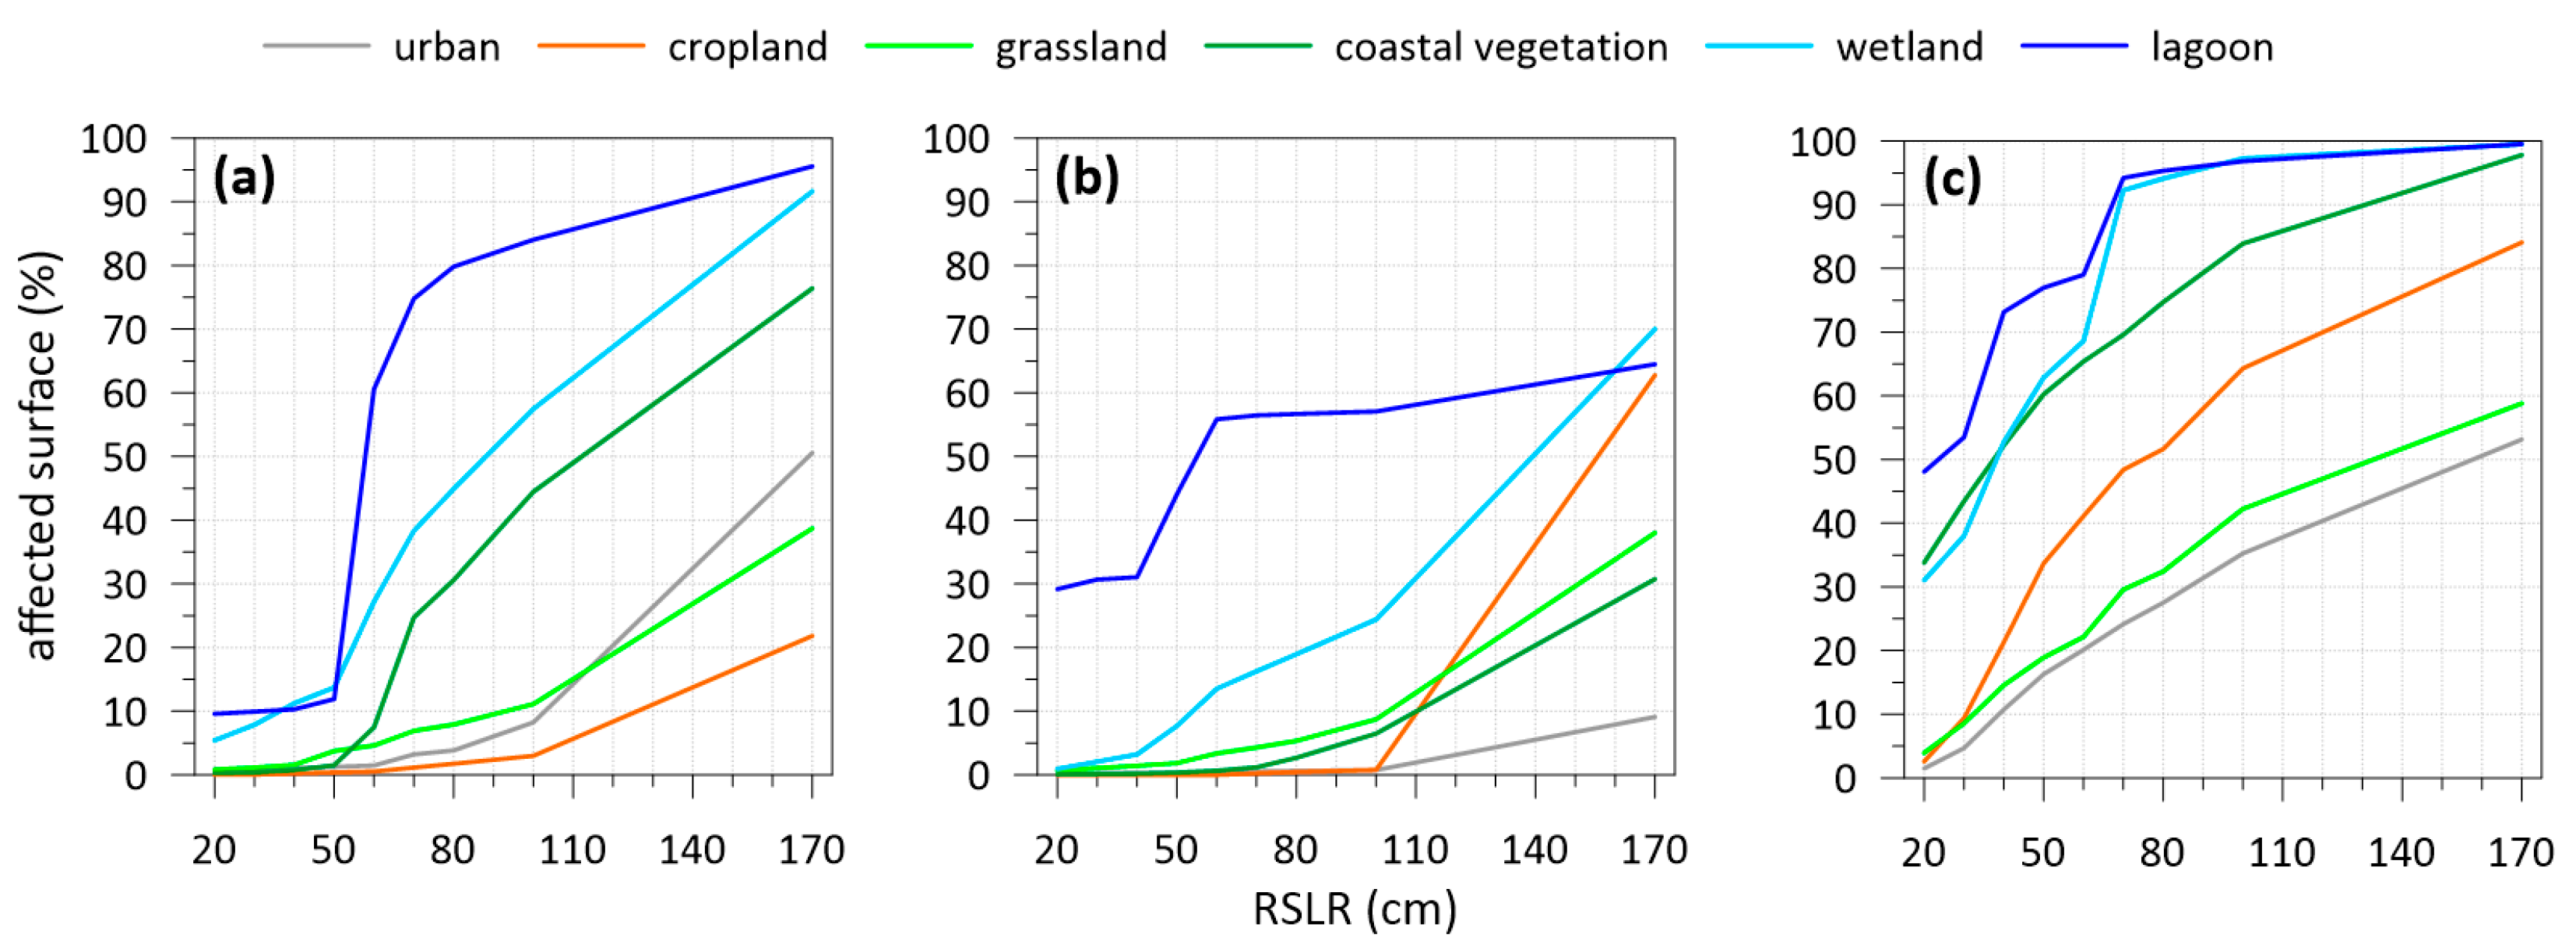
Figure 8 shows the relative percentage of habitats (by area) affected by inundation at the three study sites under the different RSLR scenarios. Although the evolution of affected surfaces with RSLR is similar, significant differences exist in the extent of inundation and the shape of the curve for each habitat type, largely reflecting their vertical distributions (Figure 4). The affected surface area for each habitat by 2050 and 2100 under the tested scenarios are given in Tables S1–S3 for GR, LD, and ED, respectively.
The most affected habitats are those found at the lowest elevations, namely coastal lagoons and wetlands. Although this was common between the three sites, the greatest susceptibility was simulated in the ED, where more than 90% of the wetland area is inundated assuming a RSLR of 70 cm (broadly equating to 2100 under the RCP8.5 scenario). Under the same conditions, 38% and 16% of the existing wetlands in the GR and LD are inundated, respectively. This general trend also applies to lagoons, although differences between the GR and LD are higher (Figure 8). This difference is even more pronounced for agricultural lands, where a 70 cm RSLR resulted in the submergence of approximately 50% in the ED compared to <1% in the GR and LD. Under the higher RSLR scenarios, agricultural lands in the GR and LD were increasingly affected but to a much lesser extent than in the ED.
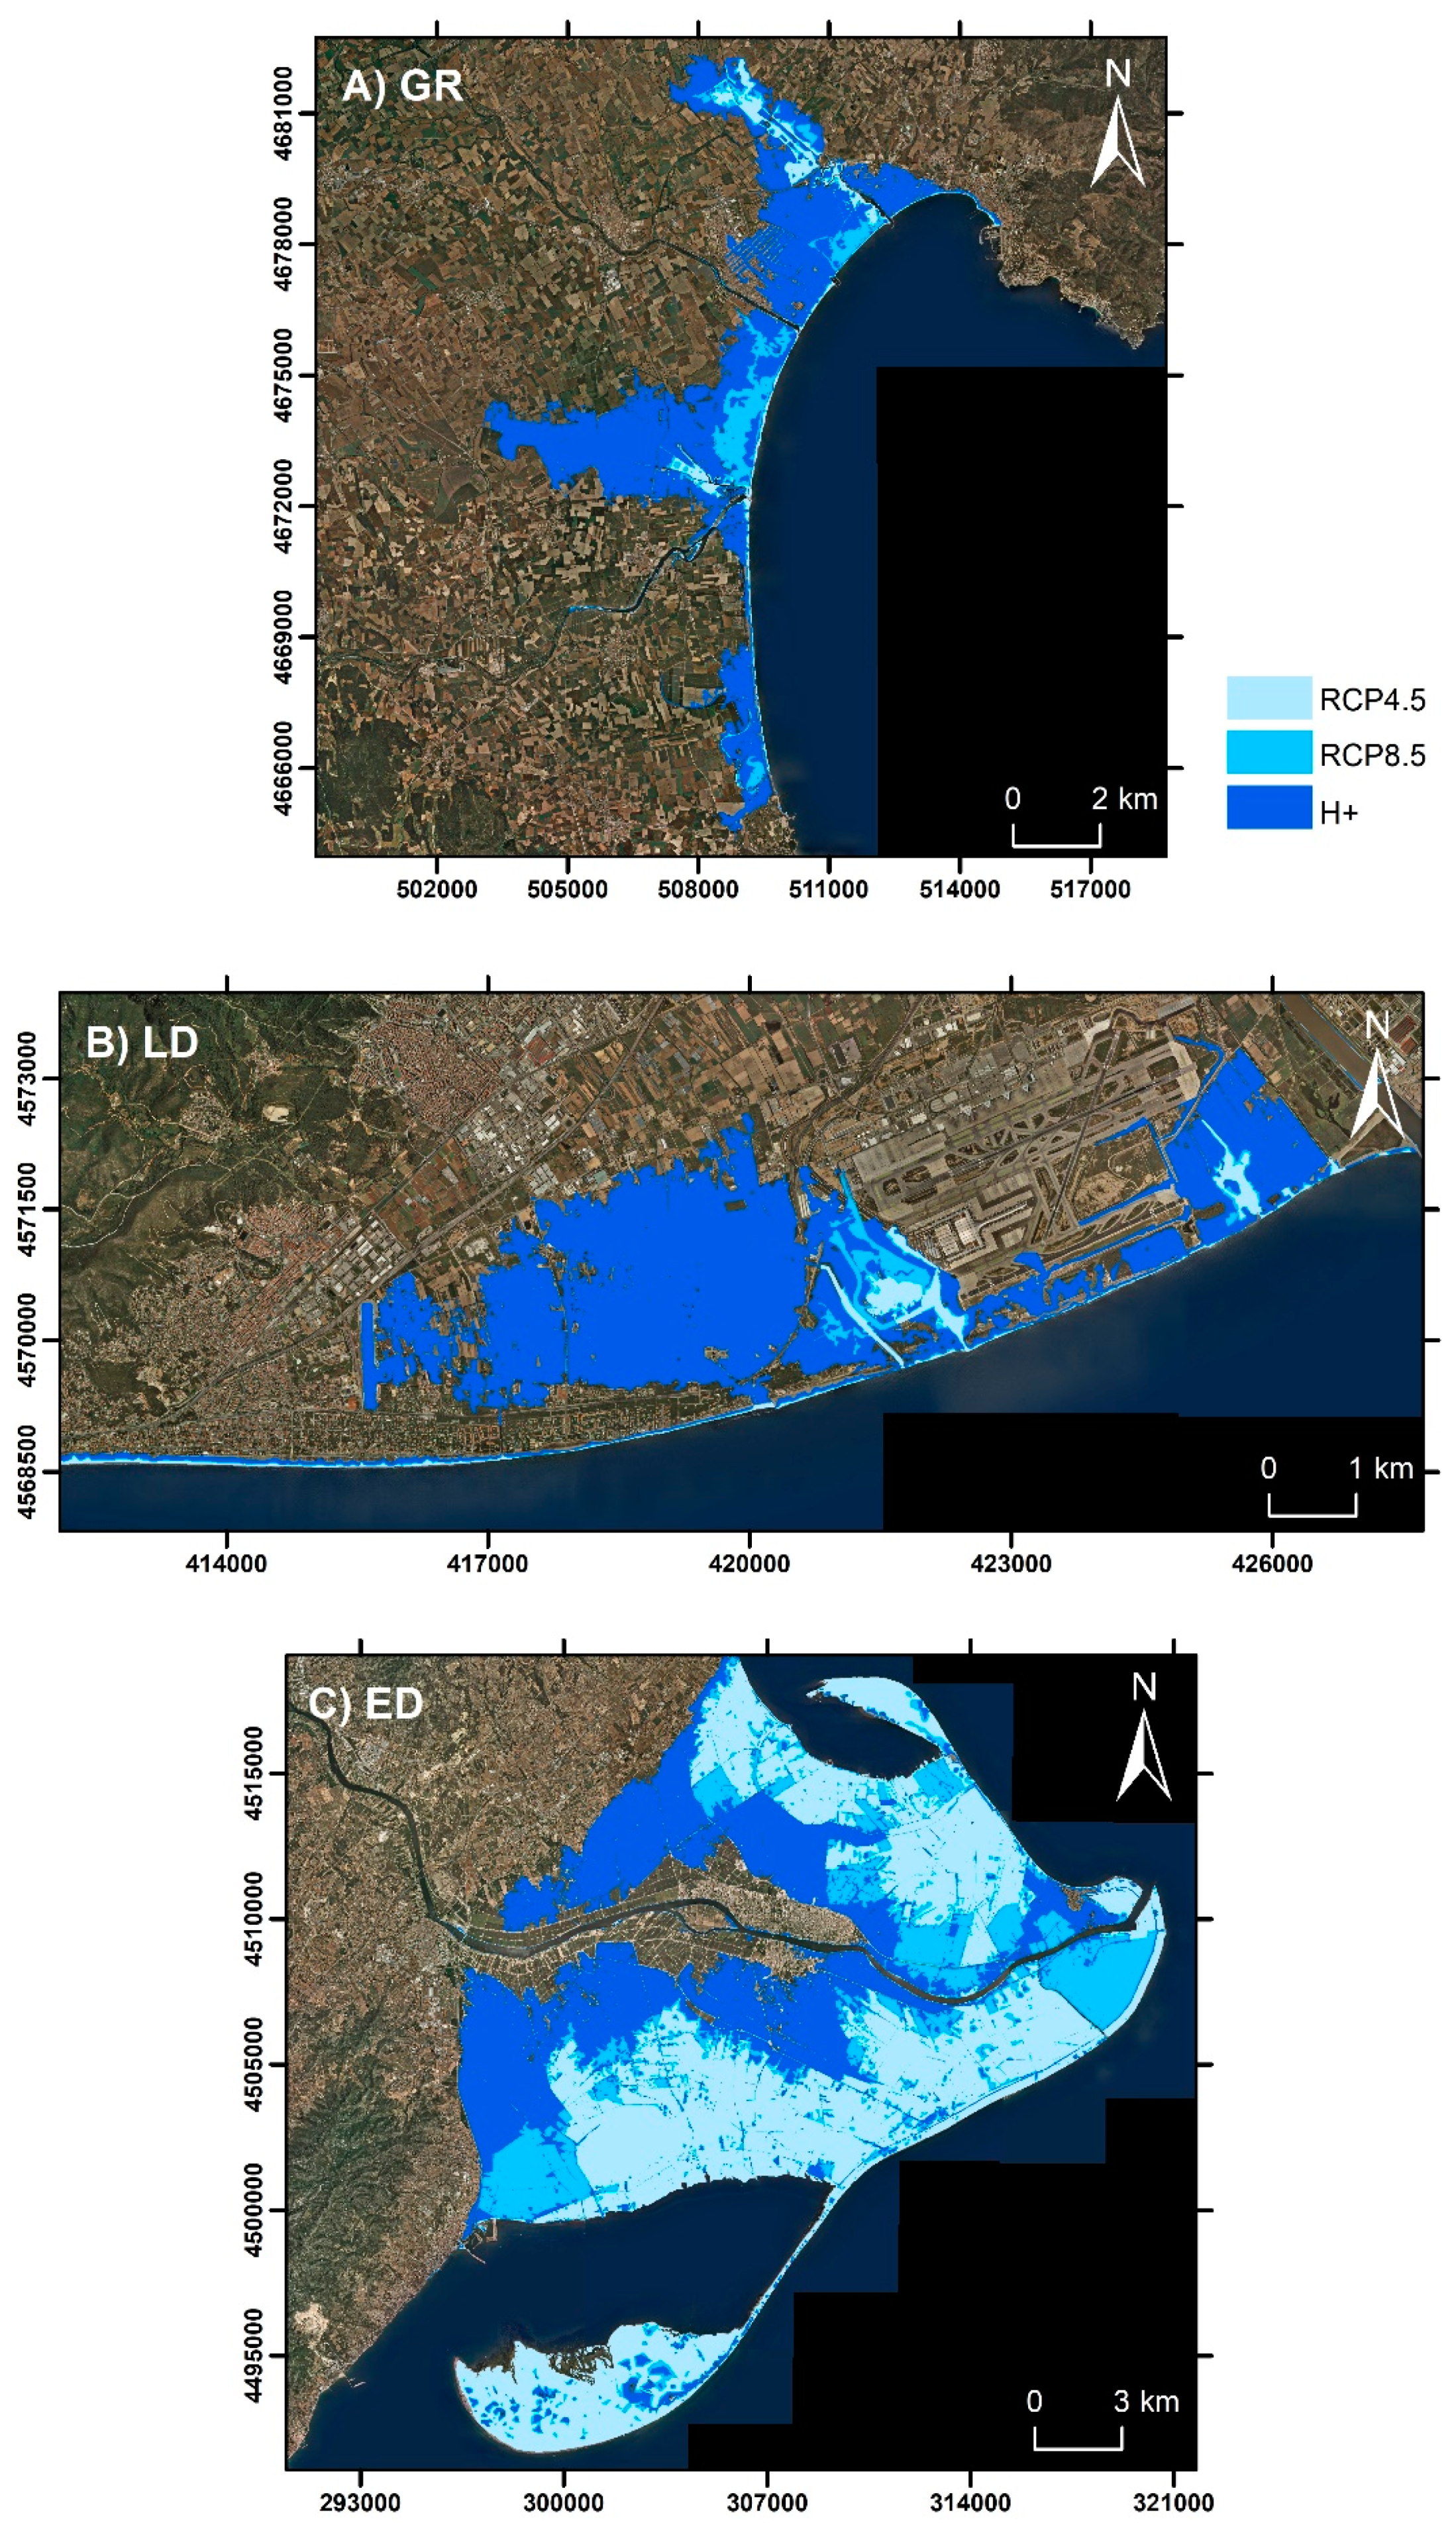
According to our methodology, habitats occupying inundated areas are not necessarily lost as they have some capacity to adapt to the new conditions. Tables S1–S3 show the evolution of habitat surfaces at each site under the different scenarios by 2050 and 2100. Natural habitats, which are located at the lowest elevations and are most directly affected by inundation, are also more likely to evolve or migrate in response to changing sea levels, and they are coastal lagoons, coastal vegetation, and wetlands. Figure 9 shows the projected habitat evolution in the three study sites by 2100 under the RCP8.5 scenario.
With the adopted rules, the largest habitat variation was estimated for coastal lagoons whose surfaces increase with time and with the magnitude of SLR, and they occupy almost all of the projected inundated surface. By far, the largest increase occurs in the ED, where a significant portion of the deltaic plain was inundated, generating a large, shallow waterbody partially protected by the sandy coastal fringe, with different eco-geomorphological characteristics depending on the site. Along the inner northern and southern bays, saltwater open lagoons occur due to their passive shorelines. On the other hand, along the seaward coast, brackish-saltwater leaky lagoons occur, partially protected by a narrow sandy barrier (Figure 9C). In the LD, the new lagoon surfaces would have a similar typology to the existing ones, mostly chocked lagoons elongated perpendicular to the coast (Figure 9B). This is due to the relatively high coastal profile that results in inundation progressing through existing channels that connect lagoons to the open sea. Lastly, the simulated future lagoon surface in the GR has a combination of elongated chocked brackish lagoons at the northern end of the bay and restricted/leaky lagoons in the central part (Figure 9A).
For wetlands, the largest conversion was also projected in the ED. At relatively low RSLR values (RCP8.5 by 2050), an increase of approximately 25% was predicted with losses due to full submergence (i.e., conversion to lagoons) compensated by the conversion of rice fields and areas of coastal vegetation in the intertidal zone to transitional wetlands. Importantly, approximately half of this projected area would not be captured without considering the dynamic adaptation of habitats (i.e., the “total damage approach” in Table S3). Under higher RSLR values (RCP8.5 by 2100), the wetland surface decreases to approximately 79% of the original values. In the LD and GR, the simulated variations are different from the ED as topography significantly differs (Figure 9). Thus, at low RSLR values (RCP8.5 by 2050), change in the wetland surface is negligible. With a higher rate of change (RCP8.5 by 2100), the wetland surface area in the GR and LD decreased to 71% and 90%, respectively (Tables S1 and S2).
Coastal vegetation shows a similar variation to wetlands, where a new fringe of halophyte vegetation developed close to the sea level affected by high tides (the HSL–MSL range). The largest variation was found in the ED, where a significant increase of up to 240% was simulated relative to the current state under low SLR scenarios (RCP4.5 and RCP8.5 by 2050). However, under the higher SLR scenario (e.g., RCP8.5 by 2100), although the area occupied by coastal vegetation is larger than under current conditions, it progressively decreased due to the effects of existing infrastructure. This change in areas of coastal vegetation was also observed in the GR and LD but was modulated according to their topographic and spatial characteristics. These factors determine the extension of halophytic vegetation in comparison with losses via direct inundation and landward beach migration, whereby current coastal vegetation could be buried by overwash deposits (Tables S1 and S2). The simulations also indicate that the composition of new areas of wetland and coastal vegetation would differ from the current communities via large-scale conversion to transitional wetlands, and halophytic communities would occur at the expense of freshwater vegetation and agricultural land.
Beach and dune habitats were simulated to decrease at all sites, with spatial patterns driven by the effect of existing infrastructure that limits landward migration. Thus, considering the expected change by 2050 under the RCP8.5 scenario, beaches decrease to approximately 96%, 89%, and 86% of their current area for GR, LD, and ED, respectively. As expected, the loss of beaches significantly increases beyond 2050 due to SLR acceleration and the lack of accommodation space for natural adaptation (Tables S1–S3).
Finally, agricultural lands were simulated as being the most negatively affected habitat, with estimated losses larger than those resulting from direct inundation given no capacity to adapt and because the fringes closest to the projected water levels are developed preventing their future use for agriculture. Thus, croplands currently occupying the future intertidal zone under a given RSLR scenario are likely to be replaced by halophytic vegetation and transitional wetlands. Moreover, in the GR and LD, agricultural land located at elevations below +0.5 m with respect to future MSL is too saline to support the current cropping systems. For example, under a relatively low RSLR scenario (2050 under RCP8.5), losses of cropland due to habitat conversion are 1.5%, 2.6%, and 5.1% above those from direct inundation in the GR, LD, and ED, respectively. Under the same scenario, by 2100 the relative increases in cropland losses are 8.9%, 26.1%, and 3.3% for GR, LD, and ED, respectively. This reflects the potential abandonment of the orchards and crops on the higher land in the GR and LD due to the saltwater intrusion.
5. Discussion
5.1. Methodological Aspects
We developed a pseudo-dynamic method to account for active shoreline responses to RSLR in predictions of the inundation of low-lying areas of sandy coasts. This approach is based on the coupling of an equilibrium-based coastal response and classical bathtub modeling approaches. Although simple, it permits the movement beyond a passive inundation model, which ignores the dynamic response of coastal environments to RSLR (e.g., [21]).
The dynamic adaptation of sandy shorelines to RSLR has been simulated by using the Bruun model, which was implemented considering the availability of accommodation space in the hinterland. When no obstacles exist, beaches adjust by migrating upward and landward so that their relative elevation is maintained and, consequently, afford the same level of protection against inundation. However, where a physical barrier prevents this landward migration, beaches will progressively erode and lose their dynamic protective capacity, and inundation will ultimately be controlled by the height of the barrier. Thus, a lack of accommodation space depends not only on the existence of a barrier but also on the rate of SLR, which determines the velocity of beach landward migration to reach the barrier. Our approach can be adapted for other models of coastal response to SLR (e.g., [68,89,90]), with the protection afforded by a beach ultimately controlled by the dynamic response to future conditions.
It has to be noted that we have not included shoreline changes other than RSLR-induced, and this should be equivalent to “isolate” the RSLR component in the long-term behavior of these areas. However, other factors such as river sediment supplies and longshore and cross-shore sediment transport patterns would also contribute to their long-term evolution (e.g., [59,71]). Integrating all these components into a single long-term morphodynamic model is an issue that is far from being solved at present (e.g., [66]). Importantly, our approach is closer to reality for assessing the inundation extent in sandy coasts, being relevant for low-lying beaches lower than the target RSLR. Thus, when we compared the computed inundated extents for the three study areas with those obtained by using the conventional bathtub approach, significant differences were only found for the ED (a <35% in the inundated area by 2050 under the RCP8.5 scenario). Although this trend should be maintained for higher RSLR provided accommodation space is available, both methods tended to produce similar results, with a reduction in the inundation extent of just about 5% by 2100. However, this is largely attributed to the hydraulic connectivity of the ED plain, where seawater entering through passive areas is distributed across the plain via the channel network (see also [26]).
We also implemented a simple method to account for the possibility of habitat conversion following inundation. Thus, SLR-induced damage projects are modulated and, as a consequence, may affect decision-making and the development of adaptation strategies. In most projections, an assumption is made that all inundated areas of land are lost. While this can be acceptable for highly modified environments, this may lead to unrealistic damage estimations for those natural systems able to adapt to future conditions.
There are some advanced tools to simulate habitat conversion, such as the SLAMM, which was specifically used to characterize wetland response under future sea-level scenarios [31,32,33,34]. This model allows for the dynamic assessment of SLR, transitioning away from simple and static inundation models, although concerns regarding application in different geomorphological, ecological, and hydrological settings have been raised [91,92]. Nevertheless, the use of complex landscape models provides detailed information on habitat responses despite the constraints of time-consuming computational effort and model calibration [35]. Here, we followed a much simpler approach based on the same underlying concept—that habitats have a capacity to adapt to new conditions—formulated as a series of rules based on ecological succession, tolerance to inundation and/or salinity, vertical distribution, and location with respect to the MSL. This approach considers the intertidal zone associated with the future MSL as a buffer area of potential high environmental value. When located within the flood plain outside the sandy fringe, areas of typical vegetation will naturally evolve, with habitat shifts being controlled by hydraulic connectivity to the sea and salinity tolerance (e.g., [93]). This is similar to the assumptions of some existing models for wetlands that predict vegetation distribution based on dominant hydrodynamic conditions, such as water depth and duration of inundation [94,95].
Although the capacity for wetland adaptation is highly linked to sediment availability and vertical accretion [27,96,97], this was not considered here as sediment input to the study areas is practically zero. For example, in the case of the ED, significant retention of riverine sediments behind dams in the upper Ebro River catchment (up to 99%) dramatically reduces the capacity for the vertical accretion of the delta plain in response to SLR [58,98]. Indeed, the suspended sediment load is currently <0.01 g/L [99], meaning the delta is unable to grow and suffers from intense coastal reshaping by wave action [59,100]. This anthropogenic impact on hydrology and sediment budgets can disrupt the eco-geomorphological feedbacks needed to adjust to SLR and hinder the natural capacity of systems to survive [101,102]. Therefore, the conversion rules we applied in our simulations are appropriate for the target study sites but should be adapted for application elsewhere if conditions permit vertical accretion. Overall, although a broadly simple approach, our methodology improves the impact assessment of the RSLR-induced inundation in low-lying natural areas both with respect to inundation extent and potential habitat loss. Importantly, the approach can be easily implemented in a GIS environment and, thus, used as an additional element in the decision-making process to design adaptation strategies in this type of environment.
5.2. Inundation-Driven Impacts on Study Sites
While the study sites are considered the most sensitive areas of the Catalan coast to SLR-induced permanent inundation, they show very different sensitivities depending on the configuration of the sea-land border, topography, geomorphology, and degree of human impact on the floodplain. The ED was found to be most vulnerable to SLR inundation due to (i) a very long passive coastline unable to protect the floodplain behind along the semi-enclosed bays, where floodwaters affect a large area of the hinterland; (ii) a very low relief, which exposes a large proportion of the floodplain to inundation under relatively low RSLR scenarios (approximately 73% of the plain is <1 m above MSL); and (iii) a dense network of channels crisscrossing the plain that, although may act as barriers, if not managed appropriately, can facilitate the transfer of floodwaters across the plain. In contrast, the LD and GR show more resilient configurations due to (i) coastlines formed by relatively wide sandy beaches with dunes able to adapt to changing sea levels while maintaining a good level of protection; (ii) limited exposure of the lowest part of the plains due to their topography (approximately 15% of their plains are <1 m above MSL); and (iii) the main areas of water entrance onto the plain are existing outlets connecting lagoons and rivers with the open sea, which restricts inundation in these areas.
In this context, it is important to highlight the need for reliable estimates of local subsidence rates, as these will determine the local acceleration of SLR and, consequently, modulate possible differences in RSLR under the same climatic scenario, as those reported by [103,104] for the Mediterranean coast. In the analyzed areas, used subsidence rates are based on existing local estimates, with GR and LD being the sites with a lower coverage and, consequently, with a larger associated uncertainty. Differences in vulnerability among study sites are also reflected in the expected impacts of SLR-inundation on representative habitats. For croplands, the ED is considered the only site to be significantly impacted by inundation based on both the relative and absolute magnitudes of the affected area. This is due to the extension and covered range of elevations of the deltaic plain surface, which indicated a direct impact (by inundation) on cultivated land of between 10% and 52% by 2050 and 2100, respectively, under RCP8.5. Existing studies on the impact of SLR on rice production due to salt intrusion have found a similar pattern [81] due to the relationship between soil salinity and surface elevation. Considering these results, it is expected that the productivity of agriculture land above the simulated inundation levels will also decrease due to progressive soil salinization.
The simulated impact of inundation on agriculture is much smaller in the LD and GR compared to the ED, both in absolute and relative terms, with approximately 26% and 10% of agricultural land affected, respectively, by 2100 under RCP8.5. It is important to note that these projections only account for direct inundation and do not reflect areas affected by saltwater intrusion, which would lead to higher losses in the GR and LD. For the LD and GR, as most of the agriculture lands affected by SLR would become disconnected from water, cultivation will likely be abandoned. This implies a net loss of ecosystem services provided by agricultural lands (e.g., [105]), including cultural services [82,83]. In the ED, the inundation of croplands maintained hydraulic connectivity in our simulations, driving the development of a shallow lagoon along the entire coast (Figure 9). Thus, the combination of a wide and gently sloping topography fringed with coastal vegetation, lagoons, and wetlands at the seaward boundaries of rice fields and protection from direct wave action afforded by an active sandy coastline provides ideal conditions for marsh development and migration. Indeed, in addition to vertical accretion, transgression into adjacent uplands is a primary mechanism for marsh survival, where gently sloping uplands favor marsh migration (e.g., [106]).
The current configuration of the ED plain appears to be the most important factor determining differences in the degree of inundation as well as the induced damage. On the one hand, the inundation extent is strongly controlled by the dense channel network crisscrossing the delta plain [25]. On the other hand, this network moderates habitat migration and the formation of new natural areas. To enhance this landscape shift from agriculture to natural habitats formed by lagoons and marshes, existing barriers in the plain (e.g., channels and other minor infrastructure) should be removed, as they function as the main obstacle for marsh expansion by upland migration (for example, [107,108]). This boundary effect has also been considered by [36] who analyzed the effects of SLR on the pristine and anthropic configurations of the ED.
The largest expansion of natural habitats was predicted for lagoons. In the case of the LD and GR, lagoons increased in area but maintained their typology by expanding from their current configuration over the surrounding wetlands according to local topography. This topographic control means that the LD is expected to be the site experiencing the lowest degree of lagoon expansion—approximately 184% by 2100 under RCP8.5 compared to 600% for the GR. In absolute terms, the simulated lagoon surface in the ED under this scenario will be approximately 0.16 times the current one. In contrast, once the critical rate of SLR at which wetlands drown is exceeded, the extensive inundation of the ED plain would result in a significant increase in lagoon surface area (approximately 565% by 2100 under RCP8.5) and significantly altered typology. A large proportion of this new surface would be occupied by saltwater open shallow lagoons along the bayside shorelines and brackish-saltwater leaky lagoons along the seaward coast. Under current conditions, freshwater inputs to lagoons occur via irrigation channels, a practice that can be maintained under future conditions.
Importantly, the ecological characteristics of converted natural areas may differ from the existing ones. Projected wetland areas would be dominated by saltwater ecosystems, whereas under current conditions, they are a mix of saltwater, brackish, and freshwater environments. In this context, salinity is generally one of the most important factors determining coastal wetland habitat type (e.g., [109]), and for the three study areas, SLR-related inundation will drive a shift in plant communities to salt- and flood-tolerant wetlands [110,111], having implications for wetland management [109].
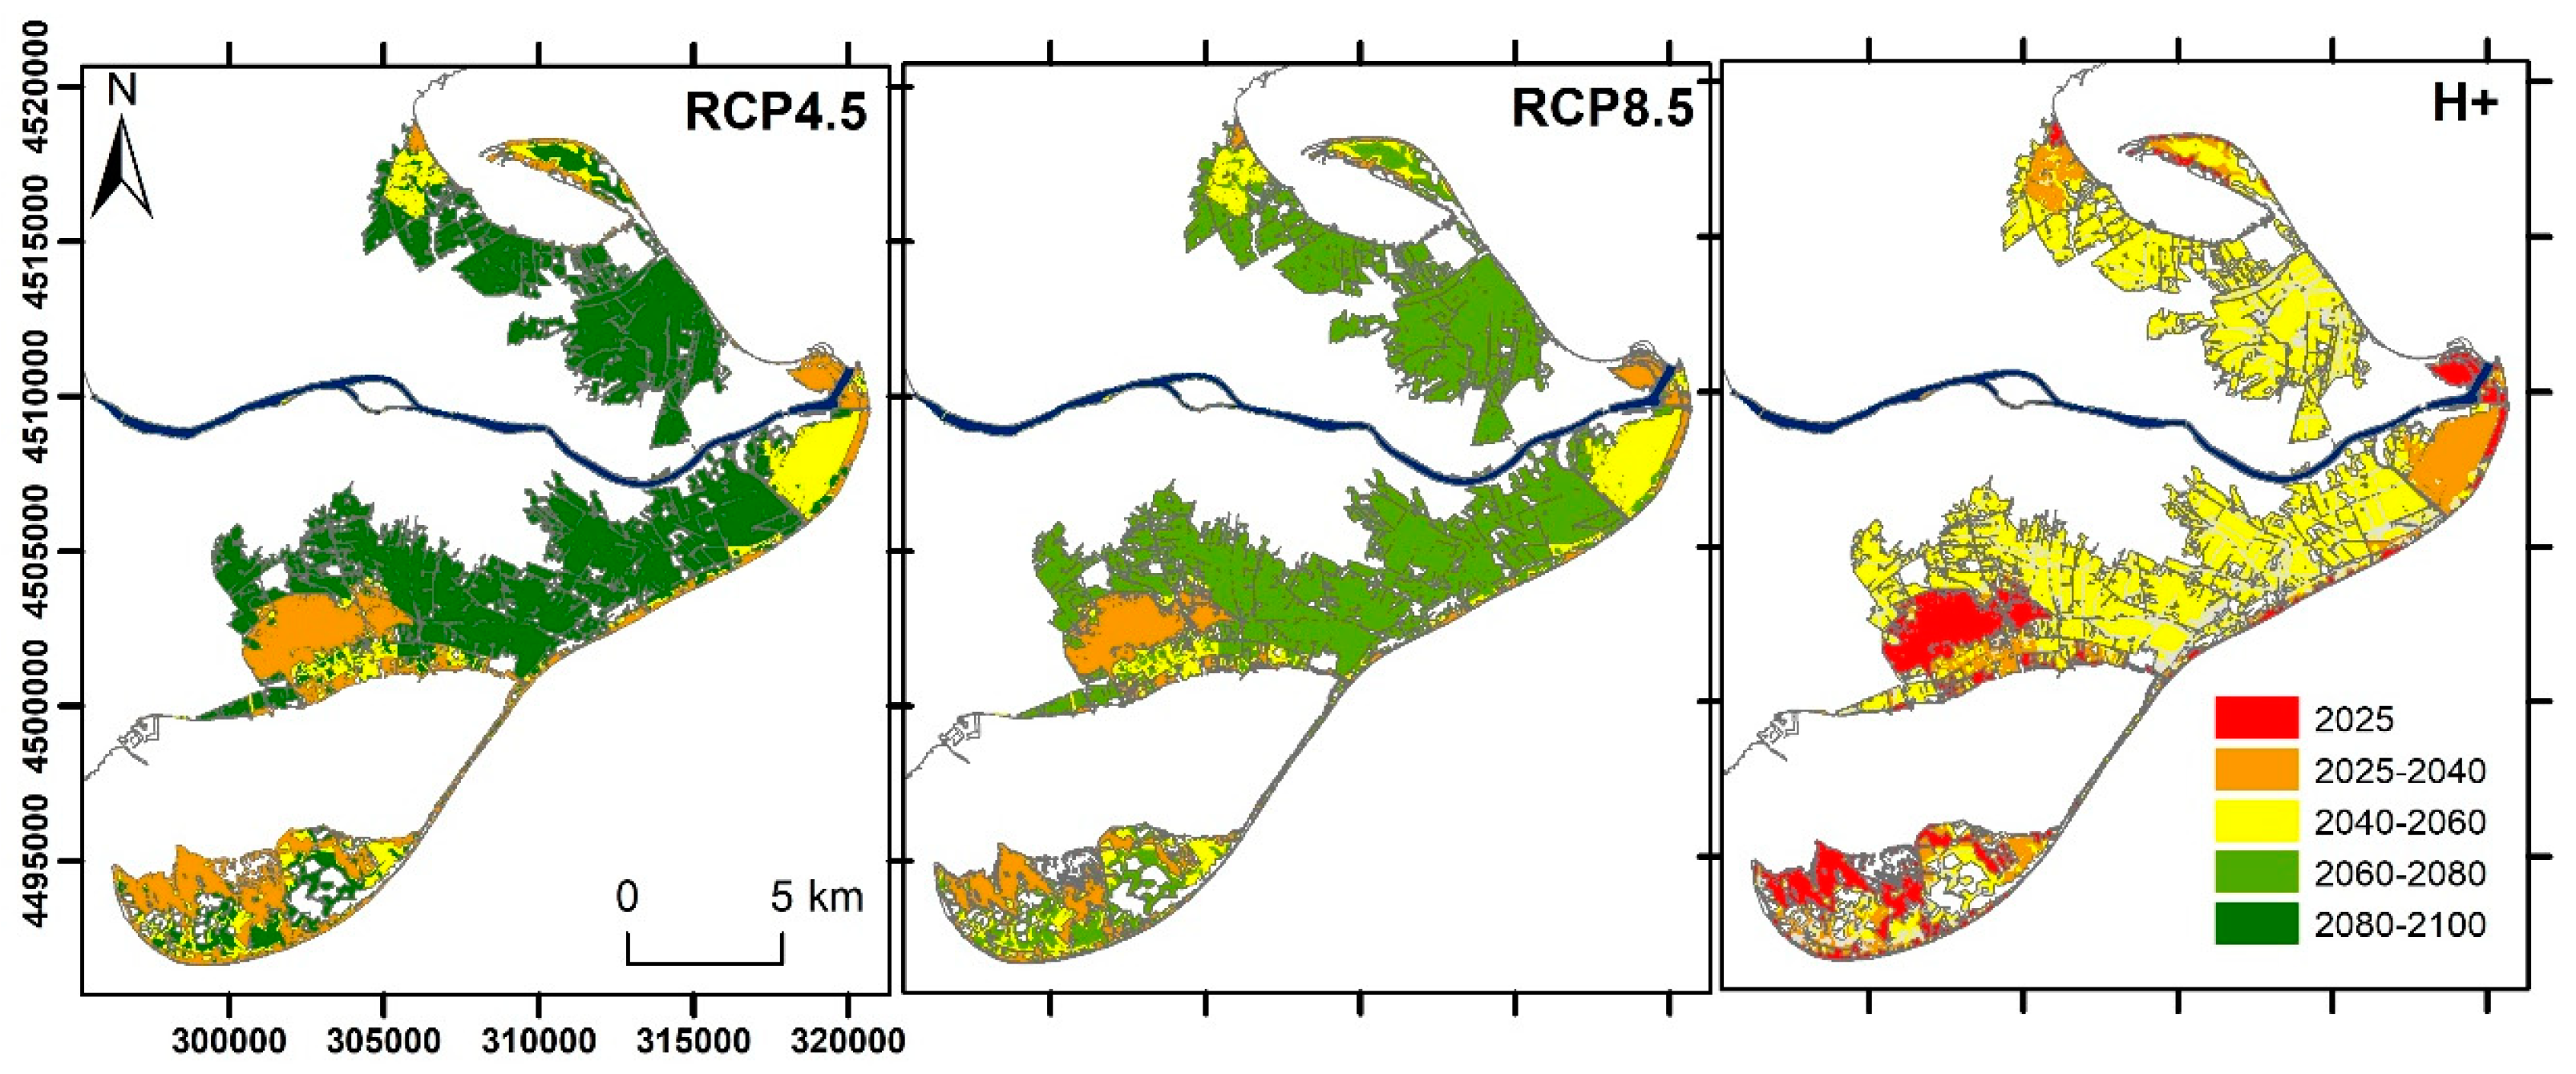
The time available to adapt becomes crucial when considering the ability of habitats to naturally respond to changing sea levels. We assessed the impact of inundation as a function of projected water levels but did not consider the time taken to reach these levels. Indeed, the rate of rising will strongly affect the capacity of these systems to respond. Thus, the longer the time taken to reach new conditions, the higher the likelihood that a system can respond via ecological succession. This temporal effect was examined for coastal marshes by [27], demonstrating threshold SLR rates that lead to marsh submergence and irreversible conversion to unvegetated areas. Such thresholds are site-specific and depend on factors such as sediment availability and tidal range (e.g., [106,112]). This potential effect is illustrated for the ED in Figure 10, which shows the inundation extent for three elevation ranges (0–0.1 m, 0.1–0.2 m, 0.2–0.5 m) under the simulated SLR scenarios. Although the extents are the same (being determined by the selected elevation range), the time required to inundate each segment and, consequently, the time for adaptation varies. Under RCP4.5 and RCP 8.5, the time to adapt at the lowest intervals (<0.1 m and <0.2 m) would be similar, becoming inundated by 2025–2040 and 2040–2060, respectively. However, at higher elevations (<0.5 m), the time available is approximately 20 years shorter under RCP8.5. In the case of the high-impact H+ scenario, the time for adaptation at all elevation ranges drastically decreases relative to RCP4.5 by 5, 20, and 40 years at <0.1 m, <0.2 m, and <0.5 m, respectively.
The inclusion of time as a variable in assessments of potential inundation damage is important because it has direct consequences in terms of (1) flood management, by constraining the design, development, and implementation of adaptation strategies, and (2) habitat response, by increasing the probability of adaptation and ecological succession.
5.3. Implications for Designing Adaptation Strategies
The approach adopted to assess the impact of RSLR in low-lying areas provides an alternative vision to considering the entire inundated surface as a total loss of value. The classical total damage approach results in management strategies based primarily on flood control. This is the case of the ED, where rice producers have developed an adaptation plan that includes building a dike along the bayside shorelines and at the back of beaches to prevent inundation of the deltaic plain and, thus, the inundation of rice fields [113]. However, even where such a barrier is advantageous, rice fields within the potential inundation area are typically below future projected water levels and, consequently, will be severely affected by saltwater intrusion (e.g., [81]). Thus, to maintain their productivity, additional investment to adapt the existing hydrological infrastructure is also required, such as pumping systems to remove water from low-lying fields. In the case of the LD and GR, this strategy is not likely plausible, given that the extent of habitats of economic interest is very small, unless the H+ scenario is considered. However, even in this extreme case, the damage is expected to be relatively low.
The adoption of an adaptation strategy based on protecting the anthropogenic system would artificially bind existing natural areas, such as lagoons and wetlands, disconnecting them from the sea, and further limiting accommodation space along the coastline. This implies a strategy based on poldering, although alternative nature-based strategies are increasingly being considered in areas that traditionally use this approach, including removing existing barriers to enhancing natural values (e.g., [114,115]). In fact, given there is no “silver bullet” solution to adaptation, a transformative change in current policies is needed that goes beyond the existing portfolio of accepted approaches [116].
Addressing maladaptation in coastal areas may have devastating effects and, sometimes, may cause more damage than a “do nothing” approach in which nature is allowed to take its course [117]. In areas of high environmental value, ensuring accommodation space for natural habitats to adapt may be a feasible strategy to cope with the effects of SLR [118]. However, urban sprawl and the existence of flood-prevention structures can act as barriers that inhibit such dynamic ecosystem responses [119]. Promoting natural protection by creating natural buffer areas must be accompanied by the progressive removal of anthropogenic infrastructure that prevents migration, thus favoring ecosystem connectivity. This may be feasible in the ED because of its low elevation and flat topography, since landward migration of wetlands is largely controlled by the topographic slope of the adjacent upland [106]. This could be achieved by reclaiming stretches of agricultural land located at the lowest elevations, which are the first to be affected by inundation and saline intrusion, to be transformed into wetlands and, in turn, restrict urban infrastructure and rice fields to higher elevations on the plain. This approach to managing inundations will result in a dynamic coastal landscape where habitats would shift according to future conditions and where the existing channel network could be used to control salinity. This strategy is not usually well received by local stakeholders set to be most economically affected [120,121,122] in general, and in the ED in particular [123,124]. In the GR, potential social conflicts exist between different stakeholders in the context of environmental protection, largely as a result of perceived threats to agriculture [125]. The existence of multiple stakeholders with different perspectives is always a challenge in adaptation planning, with “winners” favoring adaptation and “losers” opposing it [126]. Nevertheless, the creation of new wetland areas may support alternative economic activities focused on environmental conservation, which could be more sustainable given the high environmental value of the area (e.g., birdwatching, cycling, eco-tourism, etc.) [43,127]. Further understanding of the perceptions of all stakeholders is required during the design of sustainable adaptation actions in response to climate change [128]. When addressing SLR-induced flooding in highly vulnerable areas, such as lowlands, quantifying affected areas as direct losses is justified assuming no change in the status quo; however, considering the inherent capacity of some coastal landscapes to adapt, SLR may present new opportunities. In Catalonia, wherever possible, promoting habitat creation may help increase coastal resilience in the face of SLR and provide additional ecosystem services in environmental hotspots, even where these are progressively degraded by human actions.
6. Conclusions
In this work, we have presented a methodology for improved SLR-induced inundation-damage assessments in natural coastal areas. To improve the delineation of inundation-prone areas, the classical bathtub approach was integrated with an equilibrium-based coastal response to RSLR to account for the dynamic adaptation capacity of sandy shorelines. To improve the assessment of induced damage in inundated areas, the likely ability of coastal habitats to adapt to changing conditions was simulated by linking their spatial distribution with their expected ability to respond to changing sea-level conditions. This methodology was applied to assess the impact of different scenarios of RSLR in the most vulnerable low-lying areas of Catalonia, which also have the highest natural values along the coast.
Obtained results showed a very different susceptibility of the study sites to inundation, being the ED the most affected one under all considered scenarios. In terms of associated impacts, the most affected habitat was croplands, which is unable to adapt to new conditions, and it will convert to natural habitats (wetlands/lagoons) depending on local hydraulic connectivity. In this sense, existing man-made infrastructures in the ED plain play a double role. On the one hand, the existing network of channels controls the inundation extent on the plain, and on the other hand, they act as physical barriers limiting the horizontal habitat migration and the formation of new natural areas.
The adopted approach permits to move beyond traditional inundation-damage assessments where any affected area is considered as a total loss of value. In areas of high natural values, this may lead to consider SLR not only as a threat but also as an opportunity for a change in their management that allows a range of adaptation strategies different from classic protection measures.
Supplementary Materials
The following are available online at https://www.mdpi.com/2073-4441/12/11/3252/s1, Table S1: Projected surface (Ha) under the TDA and CA for different SLR scenarios at 2050 and 2100 in the GR. Table S2: Projected surface (Ha) under the TDA and CA for different SLR scenarios at 2050 and 2100 in the LD. Table S3: Projected surface (Ha) under the TDA and CA for different SLR scenarios at 2050 and 2100 in the ED.
Author Contributions
Conceptualization, J.A.J. and U.L.-D.; methodology, J.A.J. and U.L.-D.; data curation, U.L.-D.; implementation, U.L.-D.; formal analysis, U.L.-D. and J.A.J.; writing, U.L.-D. and J.A.J.; visualization, U.L.-D.; supervision, project administration, and funding acquisition, J.A.J. All authors have read and agreed to the published version of the manuscript.
Funding
This work was supported by the Spanish Ministry of Economy and Competitiveness (MINECO/AEI/FEDER, UE) in the framework of the M-CostAdapt research project (CTM2017-83655-C2-1-R). The first author was supported by a PhD grant from the Spanish Ministry of Economy and Competitiveness. We also thank the support of the Secretaria d’Universitats i Recerca, Departament d’Economia i Coneixement, Generalitat de Catalunya (2017SGR773).
Conflicts of Interest
The authors declare no conflict of interest. The funders had no role in the design of the study; in the collection, analyses, or interpretation of data; in the writing of the manuscript; or in the decision to publish the results.
Appendix A

Table A1.
Land cover types and main habitats found in the study areas.
| Category | Land Cover | Main Habitats | ||
|---|---|---|---|---|
| GR | BL | ED | ||
| Urban | Urban areas Buildings Parking areas Urban green areas Roads Infrastructures | Urban and industrial areas, including the associated ruderal vegetation | ||
| Urbanized areas, with important clearings of natural vegetation | ||||
| Barren | Cliffs, rocky outcrops. Bare, burned, eroded grounds Extraction and discharge areas | Undeveloped urban areas | ||
| Abandoned cultivated areas | ||||
| Salt mine | Salt mine | Non-existent | Salt mine and industrial salt ponds | |
| Cropland | Cultivated areas | Intensive herbaceous crops different from rice (cereals, fodder) | Intensive herbaceous crops different from rice (orchards and garden center) | Rice fields |
| Fruit trees | ||||
| Vineyards | ||||
| Grassland | Scrubland Shrub land Pasture and meadow | Lowland harvesting fields (mainly Gaudinia fragilis) | Lowland hayfields | |
| Temperate forest | Various (conifer, deciduous, evergreen trees) | Riverside woodlands | Pinewoods (Pinus pinea) and understory | Riverside woodlands |
| Residual dunes with pine trees (Pinus pinea, Pinus pinaster) | ||||
| Beach and dunes | Beach, dunes and sandy areas | Sandy beaches | ||
| Dunes and dune slacks | ||||
| Coastal vegetation | Shrubby and herbaceous communities on salt or gypsaceous soils | Salicornia sp. Swards | ||
| Junciform-leaved Spartina versicolor grassland of coastal sand muds | ||||
| Juncus maritimus beds of coastal and inland long-inundated, brackish depressions | ||||
| Wetland | Freshwater marsh | Non-existent | Lowland Cladium mariscus beds of riversides | |
| Brackish marsh | Reed beds | |||
| Bulrush beds (Scirpus spp.) | Cane formation along water courses | Bulrush beds (Scirpus spp.) | ||
| Coastal lagoon | Freshwater ponds | Standing fresh waters | ||
| Saltwater/brackish lagoons | Vegetated/non-vegetated lagoon | |||
| Non-existent | Mud and sand flats | |||
References
- McGranahan, G.; Balk, D.; Anderson, B. The rising tide: Assessing the risk of climate change and human settlements in low elevation coastal zones. Environ. Urban. 2007, 19, 17–37. [Google Scholar] [CrossRef]
- Valiela, I. Global Coastal Change; Wiley-Blackwell: Hoboken, NJ, USA, 2006; p. 376. [Google Scholar]
- Fitzgerald, D.M.; Fenster, M.S.; Argow, B.A.; Buynevich, I.V. Coastal impacts due to sea level rise. Annu. Rev. Earth Planet. Sci. 2008, 36, 601–647. [Google Scholar] [CrossRef] [Green Version]
- Syvitski, J.; Kettner, A.J.; Overeem, I.; Hutton, E.; Hannon, M.T.; Brakenridge, G.R.; Day, J.; Vörösmarty, C.; Saito, Y.; Giosan, L.; et al. Sinking deltas due to human activities. Nat. Geosci. 2009, 2, 681–686. [Google Scholar] [CrossRef]
- Ericson, J.P.; Vörösmarty, C.J.; Dingman, S.L.; Ward, L.G.; Meybeck, M. Effective sea level rise and deltas: Causes of change and human dimension implications. Global Planet. Chang. 2006, 50, 63–82. [Google Scholar] [CrossRef]
- Nicholls, R.J.; Brown, S.; Hanson, S.; Hinkel, J. Economics of Coastal Zone Adaptation to Climate Change; Development and Climate Change Discussion Paper No. 10; The World Bank: Washington, DC, USA, 2010. [Google Scholar]
- Nicholls, R.J.; Hoozemans, F.M.J. The Mediterranean: Vulnerability to coastal implications of climate change. Ocean Coast. Manag. 1996, 31, 105–132. [Google Scholar] [CrossRef]
- UNEP. State of the Environment and Development in the Mediterranean; United Nations Environment Programme/Mediterranean Action Plan (UNEP/MAP)-Plan Bleu: Athens, Greece, 2009; p. 204. [Google Scholar]
- Reimann, L.; Vafeidis, A.T.; Brown, S.; Hinkel, J.; Tol, R.S. Mediterranean UNESCO World Heritage at risk from coastal flooding and erosion due to sea-level rise. Nat. Commun. 2018, 9, 1–11. [Google Scholar] [CrossRef] [Green Version]
- Cramer, W.; Guiot, J.; Fader, M.; Garrabou, J.; Gattuso, J.P.; Iglesias, A.; Lange, M.A.; Lionello, P.; Llasat, M.C.; Paz, S.; et al. Climate change and interconnected risks to sustainable development in the Mediterranean. Nat. Clim. Chang. 2018, 8, 972–980. [Google Scholar] [CrossRef] [Green Version]
- Bondesan, M.; Castiglioni, G.B.; Elmis, C.; Gabbianellis, G.; Marocco, R.; Pirazzolift, P.A.; Tomasin, A. Coastal areas at risk from storm surges and sea-level rise in northeastern Italy. J. Coast. Res. 1995, 11, 1354–1379. [Google Scholar]
- Antonioli, F.; Anzidei, M.; Amorosi, A.; Presti, V.L.; Mastronuzzi, G.; Deiana, G.; de Falco, G.; Fontana, A.; Fontolan, G.; Lisco, S.; et al. Sea-level rise and potential drowning of the Italian coastal plains: Flooding risk scenarios for 2100. Quat. Sci. Rev. 2017, 158, 29–43. [Google Scholar] [CrossRef] [Green Version]
- Antonioli, F.; Falco, G.D.; Presti, V.L.; Moretti, L.; Scardino, G.; Anzidei, M.; Bonaldo, D.; Carniel, S.; Leoni, G.; Furlani, S.; et al. Relative Sea-Level Rise and Potential Submersion Risk for 2100 on 16 Coastal Plains of the Mediterranean Sea. Water 2020, 12, 2173. [Google Scholar] [CrossRef]
- Brunel, C.; Sabatier, F. Potential influence of sea-level rise in controlling shoreline position on the French Mediterranean Coast. Geomorphology 2009, 107, 47–57. [Google Scholar] [CrossRef]
- Frihy, O.E.; El-Sayed, M.K. Vulnerability risk assessment and adaptation to climate change induced sea level rise along the Mediterranean coast of Egypt. Mitig. Adapt. Strateg. Glob. Chang. 2013, 18, 1215–1237. [Google Scholar] [CrossRef]
- Brenner, J.; Jiménez, J.A.; Sardá, R. Environmental indicators GIS of the Catalan coast. J. Coast. Conserv. 2008, 11, 185–191. [Google Scholar] [CrossRef]
- Brenner, J.; Jiménez, J.A.; Sardá, R.; Garola, A. An assessment of the non-market value of the ecosystem services provided by the Catalan coastal zone, Spain. Ocean Coast. Manag. 2010, 53, 27–38. [Google Scholar] [CrossRef] [Green Version]
- Sánchez-Arcilla, A.; Jiménez, J.A.; Valdemoro, H.I. The Ebro Delta: Morphodynamics and vulnerability. J. Coast. Res. 1998, 14, 755–772. [Google Scholar]
- Sánchez-Arcilla, A.; Jiménez, J.A.; Valdemoro, H.I.; Gracia, V. Implications of climatic change on Spanish Mediterranean low-lying coasts: The Ebro Delta case. J. Coast. Res. 2008, 24, 306–316. [Google Scholar] [CrossRef]
- Nicholls, R.J.; Cazenave, A. Sea-level rise and its impact on coastal zones. Science 2010, 328, 1517–1520. [Google Scholar] [CrossRef]
- Passeri, D.L.; Hagen, S.C.; Medeiros, S.C.; Bilskie, M.V.; Alizad, K.; Wang, D. The dynamic effects of sea level rise on low-gradient coastal landscapes: A review. Earth’s Future 2015, 3, 159–181. [Google Scholar] [CrossRef]
- Poulter, B.; Halpin, P.N. Raster modelling of coastal flooding from sea-level rise. Int. J. Geogr. Inf. Syst. 2008, 22, 167–182. [Google Scholar] [CrossRef]
- Gallien, T.W.; Schubert, J.E.; Sanders, B.F. Predicting tidal flooding of urbanized embayments: A modeling framework and data requirements. Coast. Eng. 2011, 58, 567–577. [Google Scholar] [CrossRef]
- Leatherman, S.P. Modeling shore response to sea-level rise on sedimentary coasts. Prog. Phys. Geog. 1990, 14, 447–464. [Google Scholar] [CrossRef]
- Gutierrez, B.T.; Williams, S.J.; Thieler, E.R. Ocean coasts. In Coastal Sensitivity to Sea-Level Rise: A Focus on the Mid-Atlantic Region; Titus, J.G., Ed.; Environmetal Protection Agency: Washington, DC, USA, 2009; pp. 43–56. [Google Scholar]
- Alvarado-Aguilar, D.; Jiménez, J.A.; Nicholls, R.J. Flood hazard and damage assessment in the Ebro Delta (NW Mediterranean) to relative sea level rise. Nat. Hazards 2012, 62, 1301–1321. [Google Scholar] [CrossRef]
- Kirwan, M.L.; Guntenspergen, G.R.; D’Alpaos, A.; Morris, J.T.; Mudd, S.M.; Temmerman, S. Limits on the adaptability of coastal marshes to rising sea level. Geophys. Res. Lett. 2010, 37. [Google Scholar] [CrossRef] [Green Version]
- Lentz, E.E.; Thieler, E.R.; Plant, N.G.; Stippa, S.R.; Horton, R.M.; Gesch, D.B. Evaluation of dynamic coastal response to sea-level rise modifies inundation likelihood. Nat. Clim. Chang. 2016, 6, 696–700. [Google Scholar] [CrossRef]
- Van De Lageweg, W.I.; Slangen, A. Predicting dynamic coastal delta change in response to sea-level rise. J. Mar. Sci. Eng. 2017, 5, 24. [Google Scholar] [CrossRef] [Green Version]
- Bellard, C.; Bertelsmeier, C.; Leadley, P.; Thuiller, W.; Courchamp, F. Impacts of climate change on the future of biodiversity. Ecol. Lett. 2012, 15, 365–377. [Google Scholar] [CrossRef] [Green Version]
- Craft, C.; Clough, J.; Ehman, J.; Jove, S.; Park, R.; Pennings, S.; Guo, H.; Machmuller, M. Forecasting the effects of accelerated sea-level rise on tidal marsh ecosystem services. Front. Ecol. Environ. 2009, 7, 73–78. [Google Scholar] [CrossRef] [Green Version]
- Traill, L.W.; Perhans, K.; Lovelock, C.E.; Prohaska, A.; McFallan, S.; Rhodes, J.R.; Wilson, K.A. Managing for change: Wetland transitions under sea-level rise and outcomes for threatened species. Divers. Distrib. 2011, 17, 1225–1233. [Google Scholar] [CrossRef]
- Glick, P.; Clough, J.; Polaczyk, A.; Couvillion, B.; Nunley, B. Potential effects of sea-level rise on coastal wetlands in southeastern Louisiana. J. Coast. Res. 2013, 63, 211–233. [Google Scholar] [CrossRef]
- Clough, J.S.; Polaczyk, A.; Propato, A. SLAMM 6.7.Beta, Users Manual; Warren Pinnacle Consulting Inc.: Warren, VT, USA, 2016; p. 39. [Google Scholar]
- Mcleod, E.; Poulter, B.; Hinkel, J.; Reyes, E.; Salm, R. Sea-level rise impact models and environmental conservation: A review of models and their applications. Ocean Coast. Manag. 2010, 53, 507–517. [Google Scholar] [CrossRef]
- Prado, P.; Alcaraz, C.; Benito, X.; Caiola, N.; Ibáñez, C. Pristine vs. human-altered Ebro Delta habitats display contrasting resilience to RSLR. Sci. Total Environ. 2019, 655, 1376–1386. [Google Scholar] [CrossRef] [PubMed]
- Chu, M.L.; Guzman, J.A.; Muñoz-Carpena, R.; Kiker, G.A.; Linkov, I. A simplified approach for simulating changes in beach habitat due to the combined effects of long-term sea level rise, storm erosion, and nourishment. Environ. Modell. Softw. 2014, 52, 111–120. [Google Scholar] [CrossRef]
- Jiménez, J.A.; Valdemoro, H.I.; Bosom, E.; Sánchez-Arcilla, A.; Nicholls, R.J. Impacts of sea-level rise-induced erosion on the Catalan coast. Reg. Environ. Chang. 2017, 17, 593–603. [Google Scholar] [CrossRef]
- López-Dóriga, U.; Jiménez, J.A.; Nicholls, R.J. Impact of sea-level rise on the tourist-carrying capacity of Catalan beaches. Ocean Coast. Manag. 2019, 170, 40–50. [Google Scholar] [CrossRef] [Green Version]
- Ballesteros, C. The Coastal Risk Landscape Application on the Catalan Coast; Universitat Politècnica de Catalunya, Departament d’Enginyeria Civil i Ambiental: Barcelona, Spain, 2017. [Google Scholar]
- IDESCAT. Anuari Estadístic de Catalunya. Institut d’Estadística de Catalunya. Generalitat de Catalunya. Available online: www.idescat.cat (accessed on 1 April 2020).
- Brenner, J.; Jiménez, J.A.; Sardá, R. Definition of homogeneous environmental management units for the Catalan coast. Environ. Manag. 2006, 8, 993–1005. [Google Scholar] [CrossRef]
- Sauri, D.; Breton, F.; Ribas, A.; Llurdes, J.C.; Romagosa, F. Policy and Practice. The Ecological Values of Traditional Land Use in Low-lying Coastal Environments: The Example of the Aiguamolls de L’Emporda, Costa Brava. J. Environ. Plan. Manag. 2010, 43, 277–290. [Google Scholar] [CrossRef]
- Paül, V.; McKenzie, F.H. Agricultural areas under metropolitan threats: Lessons for Perth from Barcelona. In Demographic Change in Australia’s Rural Landscapes; Luck, G., Black, R., Race, D., Eds.; Springer: Dordrecht, The Netherlands, 2010; Volume 12, pp. 125–152. [Google Scholar] [CrossRef]
- Zografos, C. Flows of sediment, flows of insecurity: Climate change adaptation and the social contract in the Ebro Delta, Catalonia. Geoforum 2017, 80, 49–60. [Google Scholar] [CrossRef]
- Garcia-Lozano, C.; Pintó, J. Current status and future restoration of coastal dune systems on the Catalan shoreline (Spain, NW Mediterranean Sea). J. Coast. Conserv. 2018, 22, 519–532. [Google Scholar] [CrossRef]
- ICGC. Institut Cartogràfic I Geològic de Catalunya. Generalitat de Catalunya. Available online: www.icgc.cat (accessed on 1 January 2020).
- Mapa de Cubiertas del Suelo de Cataluña: Características de la Tercera Edición y Relaciones con SIOSE. Available online: https://www.creaf.uab.es/mcsc/textos/MCSC-3_SIOSE.pdf (accessed on 18 November 2020).
- Generalitat de Catalunya. Cartografia Dels Hábitats a Catalunya, Versió 2, 2018. Departament de Territori i Sostenibilidad. Territori i Patrimoni Natural. Available online: http://mediambient.gencat.cat/es/05_ambits_dactuacio/patrimoni_natural/sistemes_dinformacio/habitats/ (accessed on 1 January 2020).
- Generalitat de Catalunya. Cartografia Dels Hábitats D’interès Comunitari a Catalunya, Versió 2, 2018. Departament de Territori i Sostenibilidad. Territori i Patrimoni Natural. Available online: http://territori.gencat.cat/ca/01_departament/12_cartografia_i_toponimia/bases_cartografiques/medi_ambient_i_sostenibilitat/bases_miramon/territori/31_habitats_hic/ (accessed on 8 January 2020).
- Generalitat de Catalunya. Inventari de Zones Humides. Departament de Territori i Sostenibilidad. Territori i Patrimoni Natural. Available online: http://mediambient.gencat.cat/es/05_ambits_dactuacio/patrimoni_natural/sistemes_dinformacio/zones_humides/ (accessed on 8 January 2020).
- Church, J.A.; Clark, P.U.; Cazenave, A.; Gregory, J.M.; Jevrejeva, S.; Levermann, A.; Merrifield, M.A.; Milne, G.A.; Nerem, R.S.; Nunn, P.D.; et al. Sea level change. In Climate Change 2013: The Physical Science Basis; Stocker, T.F., Qin, D., Plattner, G.K., Tignor, M., Allen, S.K., Boschung, J., Nauels, A., Xia, Y., Bex, V., Midgley, P.M., Eds.; Contribution of Working Group I to the Fifth Assessment Report of the Intergovernmental Panel on Climate Change; Cambridge University Press: Cambridge, UK; New York, NY, USA, 2013. [Google Scholar]
- Sayol, J.M.; Marcos, M. Assessing flood risk under sea level rise and extreme sea levels scenarios: Application to the Ebro delta (Spain). J. Geophys. Res. 2018, 123, 794–811. [Google Scholar] [CrossRef] [Green Version]
- Jevrejeva, S.; Grinsted, A.; Moore, J.C. Upper limit for sea level projections by 2100. Environ. Res. Lett. 2014, 9. [Google Scholar] [CrossRef] [Green Version]
- Hinkel, J.; Jaeger, C.; Nicholls, R.J.; Lowe, J.; Renn, O.; Peijun, S. Sea-level rise scenarios and coastal risk management. Nat. Clim. Chang. 2015, 5, 188–190. [Google Scholar] [CrossRef]
- CADS. RISKCAT: Els Riscos Naturals a Catalunya. Informe Executiu. Technical Report, Consell Assessor per al Desenvolupament Sostenible, Generalitat de Catalunya, Barcelona. 2008. Available online: http://cads.gencat.cat/es/detalls/detallpublicacio/RISKCAT.-Els-riscos-naturals-a-Catalunya (accessed on 8 January 2020).
- Somoza, L.; Barnolas, A.; Arasa, A.; Maestro, A.; Rees, J.G.; Hernández-Molina, F.J. Architectural stacking patterns of the Ebro delta controlled by Holocene high-frequency eustatic fluctuations, delta-lobe switching and subsidence processes. Sediment. Geol. 1997, 117, 11–32. [Google Scholar] [CrossRef]
- Ibáñez, C.; Canicio, A.; Day, J.W.; Curcó, A. Morphologic development, relative sea level rise and sustainable management of water and sediment in the Ebre Delta, Spain. J. Coast. Conserv. 1997, 3, 191–202. [Google Scholar] [CrossRef]
- Jiménez, J.A.; Valdemoro, H.I.; Gracia, V.; Nieto, F. Processes reshaping the Ebro delta. Mar. Geol. 1997, 144, 59–79. [Google Scholar] [CrossRef]
- Pérez-Aragüés, F.; Pipia, L. Ebro Delta Subsidence. Historical 1992-2010; Technical Report, 2015; Project Ebro ADMICLIM, European Commission LIFE Programme: Catalunya, Spain, 2015; p. 88. [Google Scholar]
- Duro, J.; Inglada, J.; Closa, J.; Adam, N.; Arnaud, A. High resolution differential interferometry using time series of ERS and Envisat SAR Data. In Proceedings of the FRINGE 2003 Workshop, Frascati, Italy, 20 August 2004. [Google Scholar]
- Giménez, J.; Suriñach, E.; Fleta, J.; Goula, X. Recent vertical movements from high-precision levelling data in northeast Spain. Tectonophysics 1996, 263, 149–161. [Google Scholar] [CrossRef]
- Bruun, P. Sea-level rise as a cause of shore erosion. J. Waterw. Harbours Div. 1962, 88, 117–132. [Google Scholar]
- Cooper, J.A.G.; Pilkey, O.H. Sea-level rise and shoreline retreat: Time to abandon the Bruun rule. Global Planet. Chang. 2004, 43, 157–171. [Google Scholar] [CrossRef]
- Le Cozannet, G.; Oliveros, C.; Castell, B.; Garcin, M.; Idier, D.; Pedreros, R.; Rohmer, J. Uncertainties in sandy shorelines evolution under the Bruun rule assumption. Front. Mar. Sci. 2016, 3, 49. [Google Scholar] [CrossRef] [Green Version]
- Ranasinghe, R. On the need for a new generation of coastal change models for the 21st century. Sci. Rep. 2020, 10, 2010. [Google Scholar] [CrossRef]
- Toimil, A.; Camus, P.; Losada, I.J.; Le Cozannet, G.; Nicholls, R.J.; Idier, D.; Maspataud, A. Climate change-driven coastal erosion modelling in temperate sandy beaches: Methods and uncertainty treatment. Earth Sci. Rev. 2020, 202, 103110. [Google Scholar] [CrossRef]
- Ranasinghe, R.; Callaghan, D.; Stive, M.J.F. Estimating coastal recession due to sea level rise: Beyond the Bruun rule. Clim. Change 2012, 110, 561–574. [Google Scholar] [CrossRef] [Green Version]
- CIIRC. Estat de la Zona Costanera a Catalunya; International Centre for Coastal Resources Research: Barcelona, Spain, 2010; p. 25. [Google Scholar]
- Cowell, P.J.; Hanslow, D.J.; Meleo, J.F. Beach morphodynamics—The shoreface. In Handbook of Beach and Shoreface Morphodynamics; Short, A.D., Ed.; John Wiley and Sons: New York, NY, USA, 1999; pp. 39–71. [Google Scholar]
- Jiménez, J.A.; Sánchez-Arcilla, A. A long-term (decadal scale) evolution model for microtidal barrier systems. Coast. Eng. 2004, 51, 749–764. [Google Scholar] [CrossRef]
- Valdemoro, H.I.; Sánchez-Arcilla, A.; Jiménez, J.A. Coastal dynamics and wetlands stability. The Ebro delta case. Hydrobiologia 2007, 577, 17–29. [Google Scholar] [CrossRef]
- Durán, R.; Guillén, J.; Ruiz, A.; Jiménez, J.A.; Sagristà, E. Morphological changes, beach inundation and overwash caused by an extreme storm on a low-lying embayed beach bounded by a dune system (NW Mediterranean). Geomorphology 2006, 274, 129–142. [Google Scholar] [CrossRef] [Green Version]
- Benito, X.; Trobajo, R.; Ibáñez, C. Modelling habitat distribution of Mediterranean coastal wetlands: The Ebro Delta as case study. Wetlands 2004, 34, 775–785. [Google Scholar] [CrossRef]
- Mogensen, L.A.; Rogers, K. Validation and comparison of a model of the effect of sea-level rise on coastal wetlands. Sci. Rep. 2018, 8, 1–14. [Google Scholar] [CrossRef]
- Spencer, T.; Schuerch, M.; Nicholls, R.J.; Hinkel, J.; Lincke, D.; Vafeidis, A.T.; Reef, R.; McFadden, L.; Brown, S. Global coastal wetland change under sea-level rise and related stresses: The DIVA Wetland Change Model. Global Planet. Chang. 2016, 139, 15–30. [Google Scholar] [CrossRef] [Green Version]
- Ibáñez, C.; Sharpe, P.J.; Day, J.W.; Day, J.N.; Prat, N. Vertical accretion and relative sea level rise in the Ebro Delta Wetlands (Catalonia, Spain). Wetlands 2010, 30, 979–988. [Google Scholar] [CrossRef]
- Tabak, N.M.; Laba, M.; Spector, S. Simulating the effects of sea level rise on the resilience and migration of tidal wetlands along the Hudson River. PLoS ONE 2016, 11, e0152437. [Google Scholar] [CrossRef] [Green Version]
- Butcher, K.; Wick, A.F.; DeSutter, T.; Chatterjee, A.; Harmon, J. Soil salinity: A threat to global food security. Agron. J. 2016, 108, 2189–2200. [Google Scholar] [CrossRef]
- Tully, K.; Gedan, K.; Epanchin-Niell, R.; Strong, A.; Bernhardt, E.S.; BenDor, T.; Mitchell, M.; Kominoski, J.; Jordan, T.E.; Neubauer, S.C.; et al. The invisible flood: The chemistry, ecology, and social implications of coastal saltwater intrusion. BioScience 2012, 69, 368–378. [Google Scholar] [CrossRef]
- Genua-Olmedo, A.; Alcaraz, C.; Caiola, N.; Ibáñez, C. Sea level rise impacts on rice production: The Ebro Delta as an example. Sci. Total Environ. 2016, 571, 1200–1210. [Google Scholar] [CrossRef] [PubMed]
- Soy-Massoni, E.; Langemeyer, J.; Varga, D.; Sáez, M.; Pintó, J. The importance of ecosystem services in coastal agricultural landscapes: Case study from the Costa Brava, Catalonia. Ecosys. Serv. 2016, 17, 43–52. [Google Scholar] [CrossRef]
- Serra, P.; Saurí, D.; Salvati, L. Peri-urban agriculture in Barcelona: Outlining landscape dynamics vis à vis socio-environmental functions. Landsc. Res. 2018, 43, 613–631. [Google Scholar] [CrossRef] [Green Version]
- Maas, E.V.; Grattan, S.R. Crop yields as affected by salinity. Agric. Drain. 1999, 38, 55–108. [Google Scholar] [CrossRef]
- Machado, R.M.A.; Serralheiro, R.P. Soil Salinity: Effect on Vegetable Crop Growth. Management Practices to Prevent and Mitigate Soil Salinization. Horticulturae 2017, 3, 30. [Google Scholar] [CrossRef]
- Meyer, E.; Simancas, J.; Jensen, N. Conservation at California’s edge. Fremontia 2016, 44, 8–15. [Google Scholar]
- Fagherazzi, S.; Anisfeld, S.C.; Blum, L.K.; Long, E.; Feagin, R.A.; Fernandes, A.; Kearney, W.S.; Williams, K. Sea level rise and the dynamics of the marsh-upland boundary. Front. Environ. Sci. 2019, 7, 25. [Google Scholar] [CrossRef]
- Kirwan, M.L.; Gedan, K.B. Sea-level driven land conversion and the formation of ghost forests. Nat. Clim. Chang. 2019, 9, 450–457. [Google Scholar] [CrossRef] [Green Version]
- Dean, R.G.; Maurmeyer, E.M. Models for beach profile response. In Handbook of Coastal Processes and Erosion; Komar, D., Ed.; CRC Press: Boca Raton, FL, USA, 1983; pp. 151–166. [Google Scholar]
- Rosati, J.D.; Dean, R.G.; Walton, T.L. The modified Bruun Rule extended for landward transport. Mar. Geol. 2013, 340, 71–81. [Google Scholar] [CrossRef] [Green Version]
- Oreskes, N.; Shrader-Frechette, K.; Belitz, K. Verification, validation, and confirmation of numerical models in the Earth Sciences. Science 1994, 263, 641–646. [Google Scholar] [CrossRef] [PubMed] [Green Version]
- Rykiel, E.J., Jr. Testing ecological models: The meaning of validation. Ecol. Model. 1996, 90, 229–244. [Google Scholar] [CrossRef]
- Rogel, J.A.; Ariza, F.A.; Silla, R.O. Soil salinity and moisture gradients and plant zonation in Mediterranean salt marshes of Southeast Spain. Wetlands 2000, 20, 357–372. [Google Scholar] [CrossRef]
- Morris, J.T.; Sundareshwar, P.V.; Nietch, C.T.; Kjerfve, B.; Cahoon, D.R. Responses of coastal wetlands to rising sea level. Ecology 2002, 83, 2869–2877. [Google Scholar] [CrossRef]
- Todd, M.J.; Muneepeerakul, R.; Pumo, D.; Azaele, S.; Miralles-Wilhelm, F.; Rinaldo, A.; Rodriguez-Iturbe, I. Hydrological drivers of wetland vegetation community distribution within Everglades National Park, Florida. Adv. Water Resour. 2010, 33, 1279–1289. [Google Scholar] [CrossRef]
- Cahoon, D.R.; Reed, D.J.; Day, J.W., Jr. Estimating shallow subsidence in microtidal salt marshes of the southeastern United States: Kaye and Barghoorn revisited. Mar. Geol. 1995, 128, 1–9. [Google Scholar] [CrossRef]
- Reed, D.J. The response of coastal marshes to sea-level rise: Survival or submergence? Earth Surf. Proc. Land. 1995, 20, 39–48. [Google Scholar] [CrossRef]
- Ibáñez, C.; Canicio, A.; Curcó, A.; Day, J.W.; Prat, N. Evaluation of Vertical Accretion and Subsidence Rates; MEDDELT Final Report; Ebre Delta Plain Working Group, University of Barcelona: Barcelona, Spain, 1996. [Google Scholar]
- Rovira, A.; Alcaraz, C.; Ibáñez, C. Spatial and temporal dynamics of suspended load at-a-cross-section: The lowermost Ebro River (Catalonia, Spain). Water Res. 2012, 46, 3671–3681. [Google Scholar] [CrossRef] [Green Version]
- Jiménez, J.A.; Sánchez-Arcilla, A. Medium-term coastal response at the Ebro delta, Spain. Mar. Geol. 1993, 114, 105–118. [Google Scholar] [CrossRef]
- Rodríguez, J.F.; Saco, P.M.; Sandi, S.; Saintilan, N.; Riccardi, G. Potential increase in coastal wetland vulnerability to sea-level rise suggested by considering hydrodynamic attenuation effects. Nat. Commun. 2017, 8, 16094. [Google Scholar] [CrossRef]
- Sandi, S.G.; Rodríguez, J.F.; Saintilan, N.; Riccardi, G.; Saco, P.M. Rising tides, rising gates: The complex ecogeomorphic response of coastal wetlands to sea-level rise and human interventions. Adv. Wat. Resour. 2018, 114, 135–148. [Google Scholar] [CrossRef]
- Vacchi, M.; Marriner, N.; Morhange, C.; Spada, G.; Fontana, A.; Rovere, A. Multiproxy assessment of Holocene relative sea-level changes in the western Mediterranean: Sea-level variability and improvements in the definition of the isostatic signal. Earth-Sci. Rev. 2016, 155, 172–197. [Google Scholar] [CrossRef] [Green Version]
- Vecchio, A.; Anzidei, M.; Serpelloni, E.; Florindo, F. Natural Variability and Vertical Land Motion Contributions in the Mediterranean Sea-Level Records over the Last Two Centuries and Projections for 2100. Water 2019, 11, 1480. [Google Scholar] [CrossRef] [Green Version]
- Tscharntke, T.; Klein, A.M.; Kruess, A.; Steffan-Dewenter, I.; Thies, C. Landscape perspectives on agricultural intensification and biodiversity–ecosystem service management. Ecol. Lett. 2005, 8, 857–874. [Google Scholar] [CrossRef]
- Kirwan, M.L.; Temmerman, S.; Skeehan, E.E.; Guntenspergen, G.R.; Fagherazzi, S. Overestimation of marsh vulnerability to sea level rise. Nat. Clim. Chang. 2016, 6, 253–260. [Google Scholar] [CrossRef]
- Wolters, M.; Garbutt, A.; Bakker, J.P. Salt-marsh restoration: Evaluating the success of de-embankments in north-west Europe. Biol. Conserv. 2005, 123, 249–268. [Google Scholar] [CrossRef]
- Borchert, S.M.; Osland, M.J.; Enwright, N.M.; Griffith, K.T. Coastal wetland adaptation to sea level rise: Quantifying potential for landward migration and coastal squeeze. J. Appl. Ecol. 2018, 55, 2876–2887. [Google Scholar] [CrossRef]
- White, E.; Kaplan, D. Restore or retreat? Saltwater intrusion and water management in coastal wetlands. Ecosyst. Health Sust. 2017, 3, e01258. [Google Scholar] [CrossRef] [Green Version]
- McKee, K.L.; Mendelssohn, I.A. Response of a freshwater marsh plant community to increased salinity and increased water level. Aquat. Bot. 1989, 34, 301–316. [Google Scholar] [CrossRef]
- Day, J.W.; Britsch, L.D.; Hawes, S.R.; Shaffer, G.P.; Reed, D.J.; Cahoon, D. Pattern and process of land loss in the Mississippi Delta: A spatial and temporal analysis of wetland habitat change. Estuaries 2000, 23, 425–438. [Google Scholar] [CrossRef]
- Kirwan, M.L.; Megonigal, J.P. Tidal wetland stability in the face of human impacts and sea-level rise. Nature 2013, 504, 53–60. [Google Scholar] [CrossRef] [PubMed]
- Comunitat General de Regants del Canal de la Dreta del Ebre. Informe-síntesis sobre la problemática y la vulnerabilidad del delta del Ebro. In Propuesta de Medidas Generales en el Ámbito del Delta; Unpublished report; Amposta, Spain, 2017. [Google Scholar]
- Van Staveren, M.F.; Warner, J.F.; van Tatenhove, J.P.; Wester, P. Let’s bring in the floods: De-poldering in the Netherlands as a strategy for long-term delta survival? Water Int. 2014, 39, 686–700. [Google Scholar] [CrossRef]
- Wesselink, A.; Warner, J.; Syed, M.A.; Chan, F.; Tran, D.D.; Huq, H.; Huthoff, F.; Le Thuy, N.; Pinter, N.; Van Staveren, M.F.; et al. Trends in flood risk management in deltas around the world: Are we going ‘soft’. Int. J. Water Gov. 2015, 4, 25–46. [Google Scholar] [CrossRef]
- Suckall, N.; Tompkins, E.L.; Nicholls, R.J.; Kebede, A.S.; Lázár, A.N.; Hutton, C.; Vincent, K.; Allan, A.; Chapman, A.; Rahman, R.; et al. A framework for identifying and selecting long-term adaptation policy directions for deltas. Sci. Total Environ. 2018, 633, 946–957. [Google Scholar] [CrossRef] [Green Version]
- Hoggart, S.P.G.; Hanley, M.E.; Parker, D.J.; Simmonds, D.J.; Bilton, D.T.; Filipova-Marinova, M.; Franklin, E.L.; Kotsev, I.; Penning-Rowsell, E.C.; Rundle, S.; et al. The consequences of doing nothing: The effects of seawater flooding on coastal zones. Coast. Eng. 2014, 87, 169–182. [Google Scholar] [CrossRef]
- Haasnoot, M.; Brown, S.; Scussolini, P.; Jiménez, J.A.; Vafeidis, A.T.; Nicholls, R.J. Generic adaptation pathways for coastal archetypes under uncertain sea-level rise. Environ. Res. Commun. 2019, 1, 071006. [Google Scholar] [CrossRef]
- Enwright, N.M.; Griffith, K.T.; Osland, M.J. Barriers to and opportunities for landward migration of coastal wetlands with sea-level rise. Front. Ecol. Environ. 2016, 14, 307–316. [Google Scholar] [CrossRef]
- Myatt, L.B.; Scrimshaw, M.D.; Lester, J.N. Public perceptions and attitudes towards a forthcoming managed realignment scheme: Freiston Shore, Lincolnshire, UK. Ocean Coast. Manag. 2003, 46, 565–582. [Google Scholar] [CrossRef]
- Ledoux, L.; Cornell, S.; O’Riordan, T.; Harvey, R.; Banyard, L. Towards sustainable flood and coastal management: Identifying drivers of, and obstacles to, managed realignment. Land Use Policy 2005, 22, 129–144. [Google Scholar] [CrossRef]
- Parrott, A.; Burningham, H. Opportunities of, and constraints to, the use of intertidal agri-environment schemes for sustainable coastal defence: A case study of the Blackwater Estuary, southeast England. Ocean Coast. Manag. 2008, 51, 352–367. [Google Scholar] [CrossRef]
- Fatorić, S.; Chelleri, L. Vulnerability to the effects of climate change and adaptation: The case of the Spanish Ebro Delta. Ocean Coast. Manag. 2012, 60, 1–10. [Google Scholar] [CrossRef]
- Roca, E.; Villares, M. Public perceptions of managed realignment strategies: The case study of the Ebro Delta in the Mediterranean basin. Ocean Coast. Manag. 2012, 60, 38–47. [Google Scholar] [CrossRef]
- Roca, E.; Villares, M.; Fernández, E. Social perception on conservation strategies in the Costa Brava, Spain. J. Coast. Res. 2011, 61, 205–210. [Google Scholar] [CrossRef]
- Hinkel, J.; Aerts, J.C.; Brown, S.; Jiménez, J.A.; Lincke, D.; Nicholls, R.J.; Scussolini, P.; Sánchez-Arcilla, A.; Vafeidis, A.T.; Addo, K.A. The ability of societies to adapt to twenty-first-century sea-level rise. Nat. Clim. Chang. 2018, 8, 570–578. [Google Scholar] [CrossRef]
- Figueras, M.T.B.; Farrés, M.C.P.; Pérez, G.R. The carrying capacity of cycling paths as a management instrument. The case of Ebro delta (Spain). Ekológia (Bratisl.) 2011, 30, 438–451. [Google Scholar] [CrossRef]
- Fatorić, S.; Morén-Alegret, R.; Kasimis, C. Exploring climate change effects in Euro-Mediterranean protected coastal wetlands: The cases of Aiguamolls de l’Empordà, Spain and Kotychi-Strofylia, Greece. Int. J. Sustain. Dev. World Ecol. 2014, 21, 346–360. [Google Scholar] [CrossRef]
Figure 1.
The Catalan coast, coastal comarcas and wetlands (shadowed purple areas). The insets are the low-lying study areas and their digital elevation models (see Table 1). (The geographic coordinate system is ETRS89/UTM zone 31N).
Figure 1.
The Catalan coast, coastal comarcas and wetlands (shadowed purple areas). The insets are the low-lying study areas and their digital elevation models (see Table 1). (The geographic coordinate system is ETRS89/UTM zone 31N).

Figure 2.
Sea-level rise (SLR) scenarios used in this work.

Figure 3.
Model of SLR-induced inundation. (A) Static-approach and passive inundation following the bathtub method. (B) Pseudo-dynamic equilibrium profile response following the Bruun Rule and inundation following a modified bathtub method. Note: the beach profiles are not to scale.
Figure 3.
Model of SLR-induced inundation. (A) Static-approach and passive inundation following the bathtub method. (B) Pseudo-dynamic equilibrium profile response following the Bruun Rule and inundation following a modified bathtub method. Note: the beach profiles are not to scale.

Figure 4.
Vertical distribution of main habitat types in each study area. Values are the percentage (%) of a given habitat in a given altimetry range as a proportion of the total habitat surface within the study area. Note that the altimetry interval classes are different for each study area.
Figure 4.
Vertical distribution of main habitat types in each study area. Values are the percentage (%) of a given habitat in a given altimetry range as a proportion of the total habitat surface within the study area. Note that the altimetry interval classes are different for each study area.

Figure 5.
Computed inundated surface (ha) using the classical bathtub approach (blue line) and pseudo-dynamic method (orange line) in the Ebro Delta (ED) under the range of considered relative sea-level rise (RSLR) scenarios. Corresponding timelines for SLR under the selected scenarios are shown at the bottom.

Figure 6.
Inundation-prone areas in the ED under different RSLR scenarios: (a) 20 cm; (b) 30 cm; (c) 40 cm; and (d) 50 cm. Light-blue shading indicates additional areas of inundation not accounting for dynamic beach response (i.e., computed using the static bathtub approach but not the pseudo-dynamic method). Active beach adaptation to RSLR is prevented when accommodation space is insufficient (e.g., the red square in (c) where narrow beaches are backed by infrastructure). Due to the network of channels crisscrossing the plain, some areas otherwise protected by a beach can be inundated by water from adjoining areas (red arrows in (d)). (The geographic coordinate system is ETRS89/UTM zone 31N).

Figure 7.
Inundation extent for 2100 under different SLR-scenarios at the (A) Gulf of Roses (GR), (B) Llobregat Delta (LD), (C) ED. (The geographic coordinate system is ETRS89/UTM zone 31N).
Figure 7.
Inundation extent for 2100 under different SLR-scenarios at the (A) Gulf of Roses (GR), (B) Llobregat Delta (LD), (C) ED. (The geographic coordinate system is ETRS89/UTM zone 31N).

Figure 8.
Simulated proportion (%) of main habitat types inundated in the plain of (a) GR, (b) LD, and (c) ED.
Figure 8.
Simulated proportion (%) of main habitat types inundated in the plain of (a) GR, (b) LD, and (c) ED.

Figure 9.
Habitat distribution under (i) current conditions and (ii) projected changes assuming habitat conversion by 2100 under RCP8.5 scenario at the (A) GR, (B) LD, (C) ED. (The geographic coordinate system is ETRS89/UTM zone 31N).
Figure 9.
Habitat distribution under (i) current conditions and (ii) projected changes assuming habitat conversion by 2100 under RCP8.5 scenario at the (A) GR, (B) LD, (C) ED. (The geographic coordinate system is ETRS89/UTM zone 31N).

Figure 10.
Timeframes of inundation from 2025 to 2100 in the ED at different elevation ranges (0–0.1 m, 0.1–0.2 m, and 0.2–0.5 m) under RCP4.5, RCP8.5, and H+ scenarios. (The geographic coordinate system is ETRS89/UTM zone 31N.)
Figure 10.
Timeframes of inundation from 2025 to 2100 in the ED at different elevation ranges (0–0.1 m, 0.1–0.2 m, and 0.2–0.5 m) under RCP4.5, RCP8.5, and H+ scenarios. (The geographic coordinate system is ETRS89/UTM zone 31N.)

Table 1.
Main characteristics of the study sites (see Figure 1).
Table 1.
Main characteristics of the study sites (see Figure 1).
| Gulf of Roses (GR) | Llobregat Delta (LD) | Ebro Delta (ED) | ||
|---|---|---|---|---|
| Population (inhabitants in coastal comarcas) | 137,951 | 818,883 | 145,496 | |
| Coastal geomorphology | Active sandy coastline | Active sandy coastline with high dune fields areas | Active sandy outer shoreline and passive muddy semi-enclosed bays | |
| Analyzed surface (ha) | 850 | 4228 | 33,168 | |
| % Surface by elevation range above MSL | <0.5 | 6.48 | 6.21 | 53.06 |
| 0.5–1 | 9.90 | 9.11 | 20.01 | |
| 1–2 | 27.23 | 37.42 | 17.35 | |
| 2–3 | 18.72 | 30.83 | 6.25 | |
| >3 | 37.66 | 16.43 | 3.32 | |
| % Urban surface | 12.06 | 36.66 | 7.03 | |
| % Cropland surface | 63.90 | 26.34 | 68.42 | |
Table 2.
Representative values to calculate coastal fringe re-adaptation to RSLR following Bruun rule for each study site.
Table 2.
Representative values to calculate coastal fringe re-adaptation to RSLR following Bruun rule for each study site.
| Gulf of Roses | Llobregat Delta | Ebro Delta | |
|---|---|---|---|
| Shoreface slope | 1/87.5 | 1/100 | 1/225 |
| Critical beach width (m) | 80 | 60 | 100 |
Table 3.
Transition rules determining habitat shifts and associated sea-level criteria.
| Initial Habitat Type | Final Habitat Type | Sea-Level Criteria |
|---|---|---|
| Cropland Grassland Temperate forest | Halophyte vegetation | HSL–MSL |
| Transitional wetland | MSL–LSL | |
| Coastal lagoon | <LSL | |
| Coastal vegetation Wetland | Transitional wetland | MSL–LSL |
| Coastal lagoon | <LSL | |
| Coastal lagoon | Coastal lagoon | <MSL |
Table 4.
Inundation-prone area (ha) and the proportion (%) of study areas inundated using a pseudo-dynamic inundation method under different RSLR scenarios at given time horizons.
Table 4.
Inundation-prone area (ha) and the proportion (%) of study areas inundated using a pseudo-dynamic inundation method under different RSLR scenarios at given time horizons.
| Year | Scenario | GR | LD | ED | |||
|---|---|---|---|---|---|---|---|
| Ha | % | Ha | % | Ha | % | ||
| 2050 | RCP4.5 | 83 | 0.98 | 40 | 0.94 | 2923 | 8.81 |
| RCP8.5 | |||||||
| H+ | 169 | 1.99 | 67 | 1.59 | 8856 | 26.70 | |
| 2100 | RCP4.5 | 224 | 2.64 | 99 | 2.34 | 12,215 | 36.83 |
| RCP8.5 | 579 | 6.81 | 169 | 4.01 | 16,881 | 50.90 | |
| H+ | 2970 | 34.92 | 1518 | 35.91 | 26,838 | 80.91 | |
Publisher’s Note: MDPI stays neutral with regard to jurisdictional claims in published maps and institutional affiliations. |
© 2020 by the authors. Licensee MDPI, Basel, Switzerland. This article is an open access article distributed under the terms and conditions of the Creative Commons Attribution (CC BY) license (http://creativecommons.org/licenses/by/4.0/).
Share and Cite
MDPI and ACS Style
López-Dóriga, U.; Jiménez, J.A. Impact of Relative Sea-Level Rise on Low-Lying Coastal Areas of Catalonia, NW Mediterranean, Spain. Water 2020, 12, 3252. https://doi.org/10.3390/w12113252
AMA Style
López-Dóriga U, Jiménez JA. Impact of Relative Sea-Level Rise on Low-Lying Coastal Areas of Catalonia, NW Mediterranean, Spain. Water. 2020; 12(11):3252. https://doi.org/10.3390/w12113252
Chicago/Turabian StyleLópez-Dóriga, Uxía, and José A. Jiménez. 2020. "Impact of Relative Sea-Level Rise on Low-Lying Coastal Areas of Catalonia, NW Mediterranean, Spain" Water 12, no. 11: 3252. https://doi.org/10.3390/w12113252
Note that from the first issue of 2016, this journal uses article numbers instead of page numbers. See further details here.