Identification of Potential Sites for a Multi-Purpose Dam Using a Dam Suitability Stream Model
by
 ,
,
Zhenfeng Shao
1, 
Zahid Jahangir
1,*,
Qazi Muhammad Yasir
2,*,
Atta-ur-Rahman
3 and
Shakeel Mahmood
4 1
State Key Laboratory of Information Engineering in Surveying, Mapping and Remote Sensing, Wuhan University, Wuhan 430079, China
2
School of Geographical Sciences, Northeast Normal University, Changchun 130024, China
3
Department of Geography, University of Peshawar, Peshawar 25120, Pakistan
4
Department of Geography, Government College University Lahore, Lahore 54000, Pakistan
*
Authors to whom correspondence should be addressed.
Water 2020, 12(11), 3249; https://doi.org/10.3390/w12113249
Submission received: 3 October 2020
/
Revised: 13 November 2020
/
Accepted: 18 November 2020
/
Published: 19 November 2020
Abstract
:Optimal site selection of a dam is one of the crucial tasks in water resource management. In this study, a dam suitability stream model (DSSM) is utilized to identify potential sites for constructing multi-purpose dams. In DSSM, each input parameter is weighted using the analytic hierarchy process (AHP), and then weighted overlay analysis is performed in a Geographical Information System (GIS) environment. Compared to the previous studies, this study showed different results based on the crucial parameter that is “stream order”. Two resultant site suitability maps are prepared to differentiate the importance of stream order. Each of the resulting maps visualizes four classes of suitability from highly suitable to least suitable. The proposed sites will store water for a variety of uses at the local and regional level and reduce flood risk, which can be very useful for hydrologists and disaster risk managers.
1. Introduction
Multi-purpose dams facilitate human life by purveying water for household purposes, irrigation activities, hydropower generation, and reducing flood risk [1]. The suitable site of hydro-projects has the least pessimistic environmental impacts [2]. Therefore site suitability analysis for the construction of the dam is crucial [3] by considering geographical properties like downstream conditions [4], lakes [5], and geological hazards [6,7]. Water is one of the essential components of all human activities and supports life [8]. The distribution of water has been uneven and further disturb by global variability in climate [9]. Snow and glaciers melting due to the temperature rise have increased the discharge of rivers and the frequency of Glacial lake outburst floods (GLOFs). Similarly, variation in the amount and spatial pattern of rainfall has further intensified the magnitude and frequency of floods in the areas which receive more precipitation and drought in arid regions [10]. To avoid such a disaster and for the sake of development, dams provide a sustainable amount of benefits to humanity, such as flood risk mitigation, agriculture, and hydropower production [11,12]. Pakistan is one of those countries facing problems such as natural disasters, power crises, and water scarcity. Pakistan has been facing power crises for which hydropower projects generate renewable, environment-friendly energy sources. In Pakistan, 21% of gross domestic product (GDP), and 50% of the economy rely on agriculture [13]. In this regard, water resource management is the most critical issue and need in many countries worldwide [14]. Spotting feasible sites for the multi-purpose dam is a part of water resources management [1]. Moreover, building dams has a high fiscal cost; therefore, positive feasibility is necessary.
Multi-criteria decision-making (MCDM) methods can be utilized to solve such problems. MCDM methods use several criteria to make a problem solving decision. There are many MCDM methods and their applications in which the analytical hierarchy process (AHP) is one of the most used methods [15]. AHP is the most potent and most straightforward technique for solving the most crucial step of MCDM that is defining the weights of criteria [16]. The main steps involved in AHP are identifying the problem, making a hierarchy of selected criteria, making the pairwise comparison of chosen criteria, and weighing each criterion [17]. AHP facilitates decision-making under several criteria rather than one criterion [15]. AHP has been used as a weighting method for Geographical Information System (GIS)-based MCDM in many site suitability applications [18].
Previously many techniques have been applied to find potential sites for dams: multi-purpose earth dam sites use AHP [1]; GIS, which included overlay, polygon intersection, and normalized cumulative weighted index (NCWI) [19]; GIS spatial analysis for a valley by analyzing its shape, geometrical and bathometric properties [20]; a geo-spatial information system for small hydropower [21]; automation of the hydropower site identification process using a GIS-based computational program based on remote sensing and regional streamflow data [22]; assessment of small dam sites’ suitability based on satellite, climatological, and hydrological freely available data [23]; dam spots for flood control based on remote sensing (RS) and GIS [24]. Locating reservoirs with GIS and RS, where two models, Boolean and weighted linear combination (WLC), were comparatively evaluated [25].
However, most of the studies used the MCDM approach based on the amalgamation of GIS, RS, and AHP to find a feasible site for suitable dam sites; some of them are [9,13,26,27]. Therefore, in this study, we put forward a new model, DSSM, based on GIS, RS, and AHP as a weighting method to find potential sites for the multi-purpose dam. As most of the studies [9,13,19,20,21,24,27,28] involved stream and surface water as an essential parameter to determine potential sites for the dam as adequate water is vital, which has to be stored and utilized for many purposes. The models used in the previous research gave suitability maps but not directly on the streams according to their order of streams, which is very important. Another aspect is that some studies included stream order as a parameter in overlay analysis. However, the suitability map results were still all over the area, which is not satisfactory. Moreover, high stream order with enough catchment area and a perfect V-shaped valley are also considerable for dams’ cost-efficient development. This research is an effort to improve dam site identification analysis and elaborates on the different results based on stream order. Therefore, stream order is taken as the most crucial factor for this study.
The Panjkora River, situated in the Northwest of Pakistan, has enough capability where the multi-purpose dam can prove beneficial. To achieve this aim, we proposed a new approach named the dam suitability stream model (DSSM), which is based on GIS, remote sensing, and the theory of AHP, where the following objectives given below are set for the model:
- To generate suitability maps
- To propose multi-purpose dam sites
- Evaluate each proposed dam site
2. Materials and Methods
2.1. The Study Area
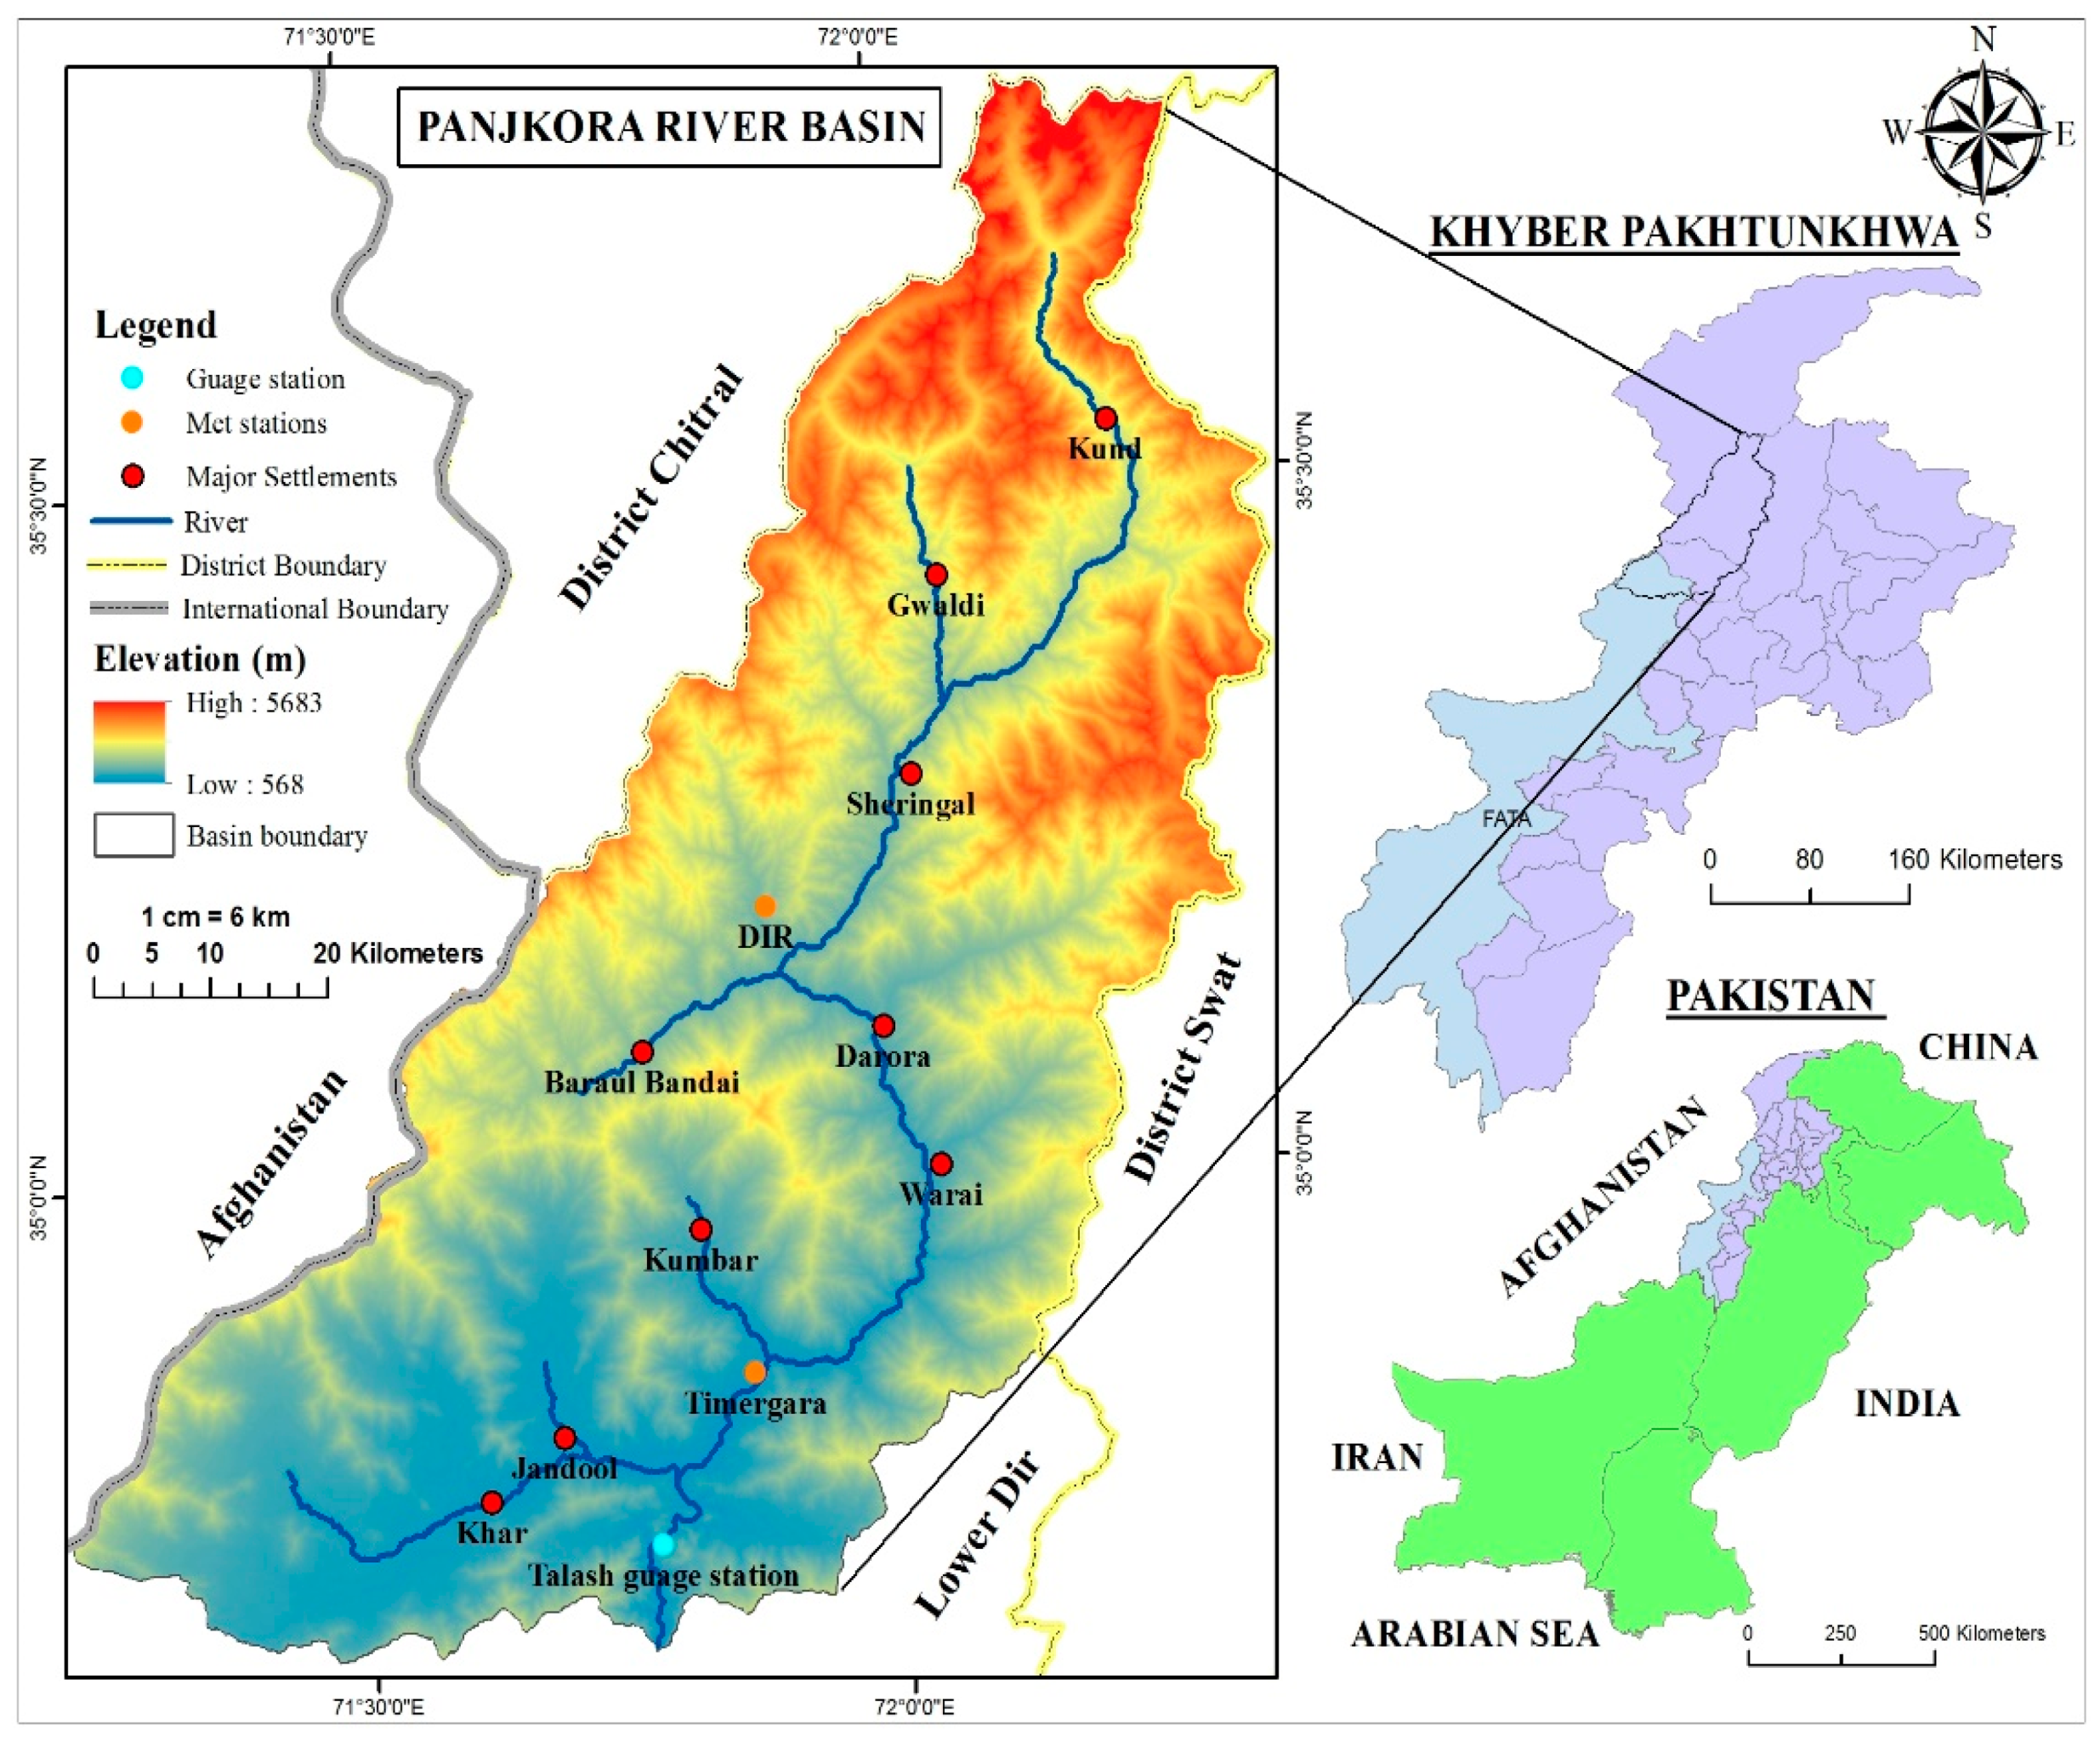
The Panjkora Basin is an essential physiographical unit situated in Eastern Hindu Kush, Northwest Pakistan. Its major tributaries are the Gwaldai, Kohistan, Barawal, Dir, Jandool, and Bajaur rivers. It flows from North to South and reaches the river Swat near Qalangi village [29]. It is roughly 113 km long and has a total catchment area of 5904 km2. Geographically, it extends from 34°39′30″ to 35°47′17″ North latitude and 71°13′8″ to 72°22′13″ East longitude (Figure 1).
The basin is located between the two mountain ranges, i.e., the eastern and western ranges, dividing it separately from the Swat Basin and Kabul Basin. The elevation exceeds 4000 m.a.s.l, where the mountains are covered with snow and several glaciers. The elevation of the basin ranges from 437 m.a.s.l to approximately 5963 m.a.s.l south to north. Climatically, the temperature fluctuates between 16 °C minimum and 32 °C maximum in summer, while in winter, from December to February, the temperature drops below freezing point [30]. The annual variation in rainfall is between 823 and 2149 mm. Almost every year, floods periodically occur, causing hydro-meteorological hazards, where flash flood and riverine flood are prominent in areas upstream Wari and downstream Wari, respectively. The scanty flood control embankment scheme, unorganized land-use changes, and unconstrained growth of anthropogenic activities along the river have increased the risk of flooding and the extent of potential damage to the study area [31]. Every year even in normal conditions, rain-water and melt-water have been lost into the Swat River. Therefore building the multi-purpose dam is needed to store water and generate power to meet local needs and contribute to national needs regarding power and water.
2.2. Data
The digital elevation model (DEM) of the Shuttle Radar Topographic Mission (SRTM) having 30 m spatial resolution and Sentinel-2A satellite image having spatial resolution from 10 m to 60 m were downloaded from open-source geo-database of the United States Geological Survey (USGS) for 31 January 2018 and 27 May 2017, respectively. The rainfall data record of the Dir met station (1971–2015), and Timergara met station was obtained from Pakistan Metrological Department regional office Peshawar. Discharge data of the past 30 years (1985–2015) of Talash gauging station were acquired from Provincial Irrigation and Drainage Authority Peshawar. A geological map of the study area was obtained from the Geological Survey of Pakistan.
2.3. Dam Suitability Stream Model
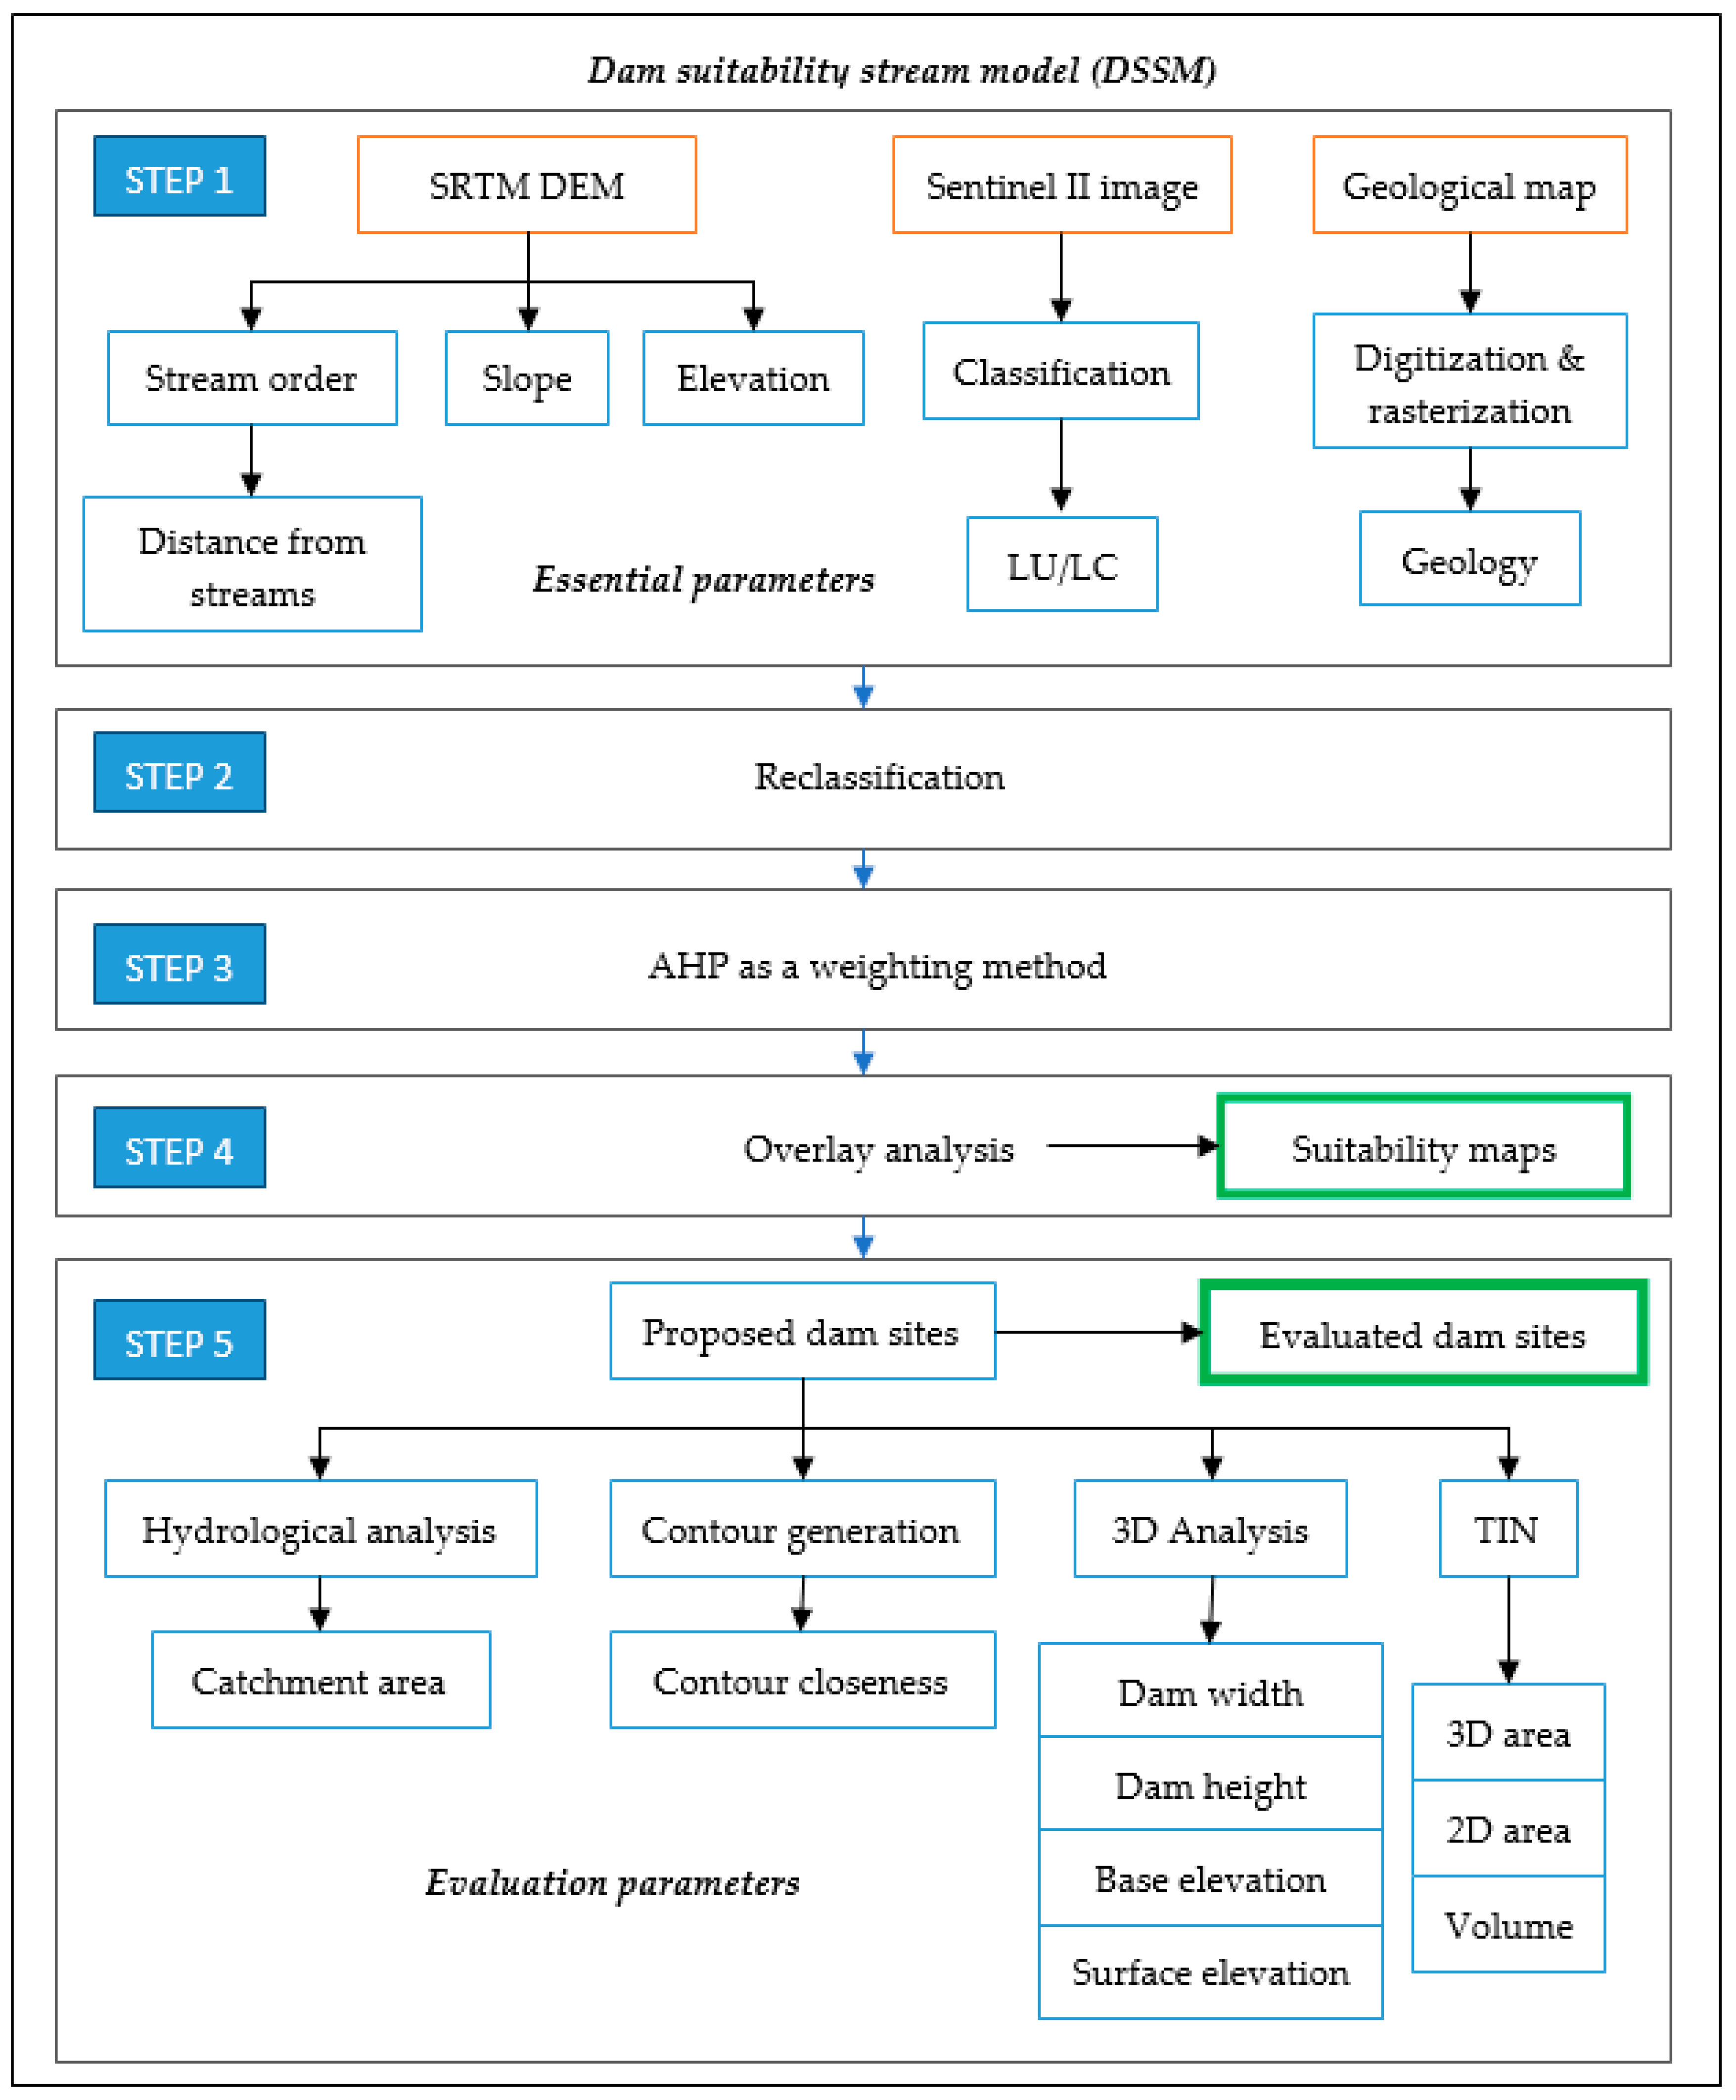
The dam suitability stream model (DSSM) is proposed in this study based on the stream order for identifying potential sites for dam construction (Figure 2). The model consists of several parameters in which streams and their order are considered as the main parameter. The DSSM has five significant stages, the 1st generation of parameters in raster layers taking the stream and their order into consideration (essential parameters); 2nd reclassification of all parameters; 3rd assigning weightage; 4th overaly analysis; 5th proposing and evaluation of dam sites based on evaluation parameters. Moreover, rainfall and discharge data are statistically analyzed. All the steps are discussed in Section 2.4, Section 2.5, Section 2.6, Section 2.7, Section 2.8 and Section 2.9.
2.4. Generation of Essential Parameters
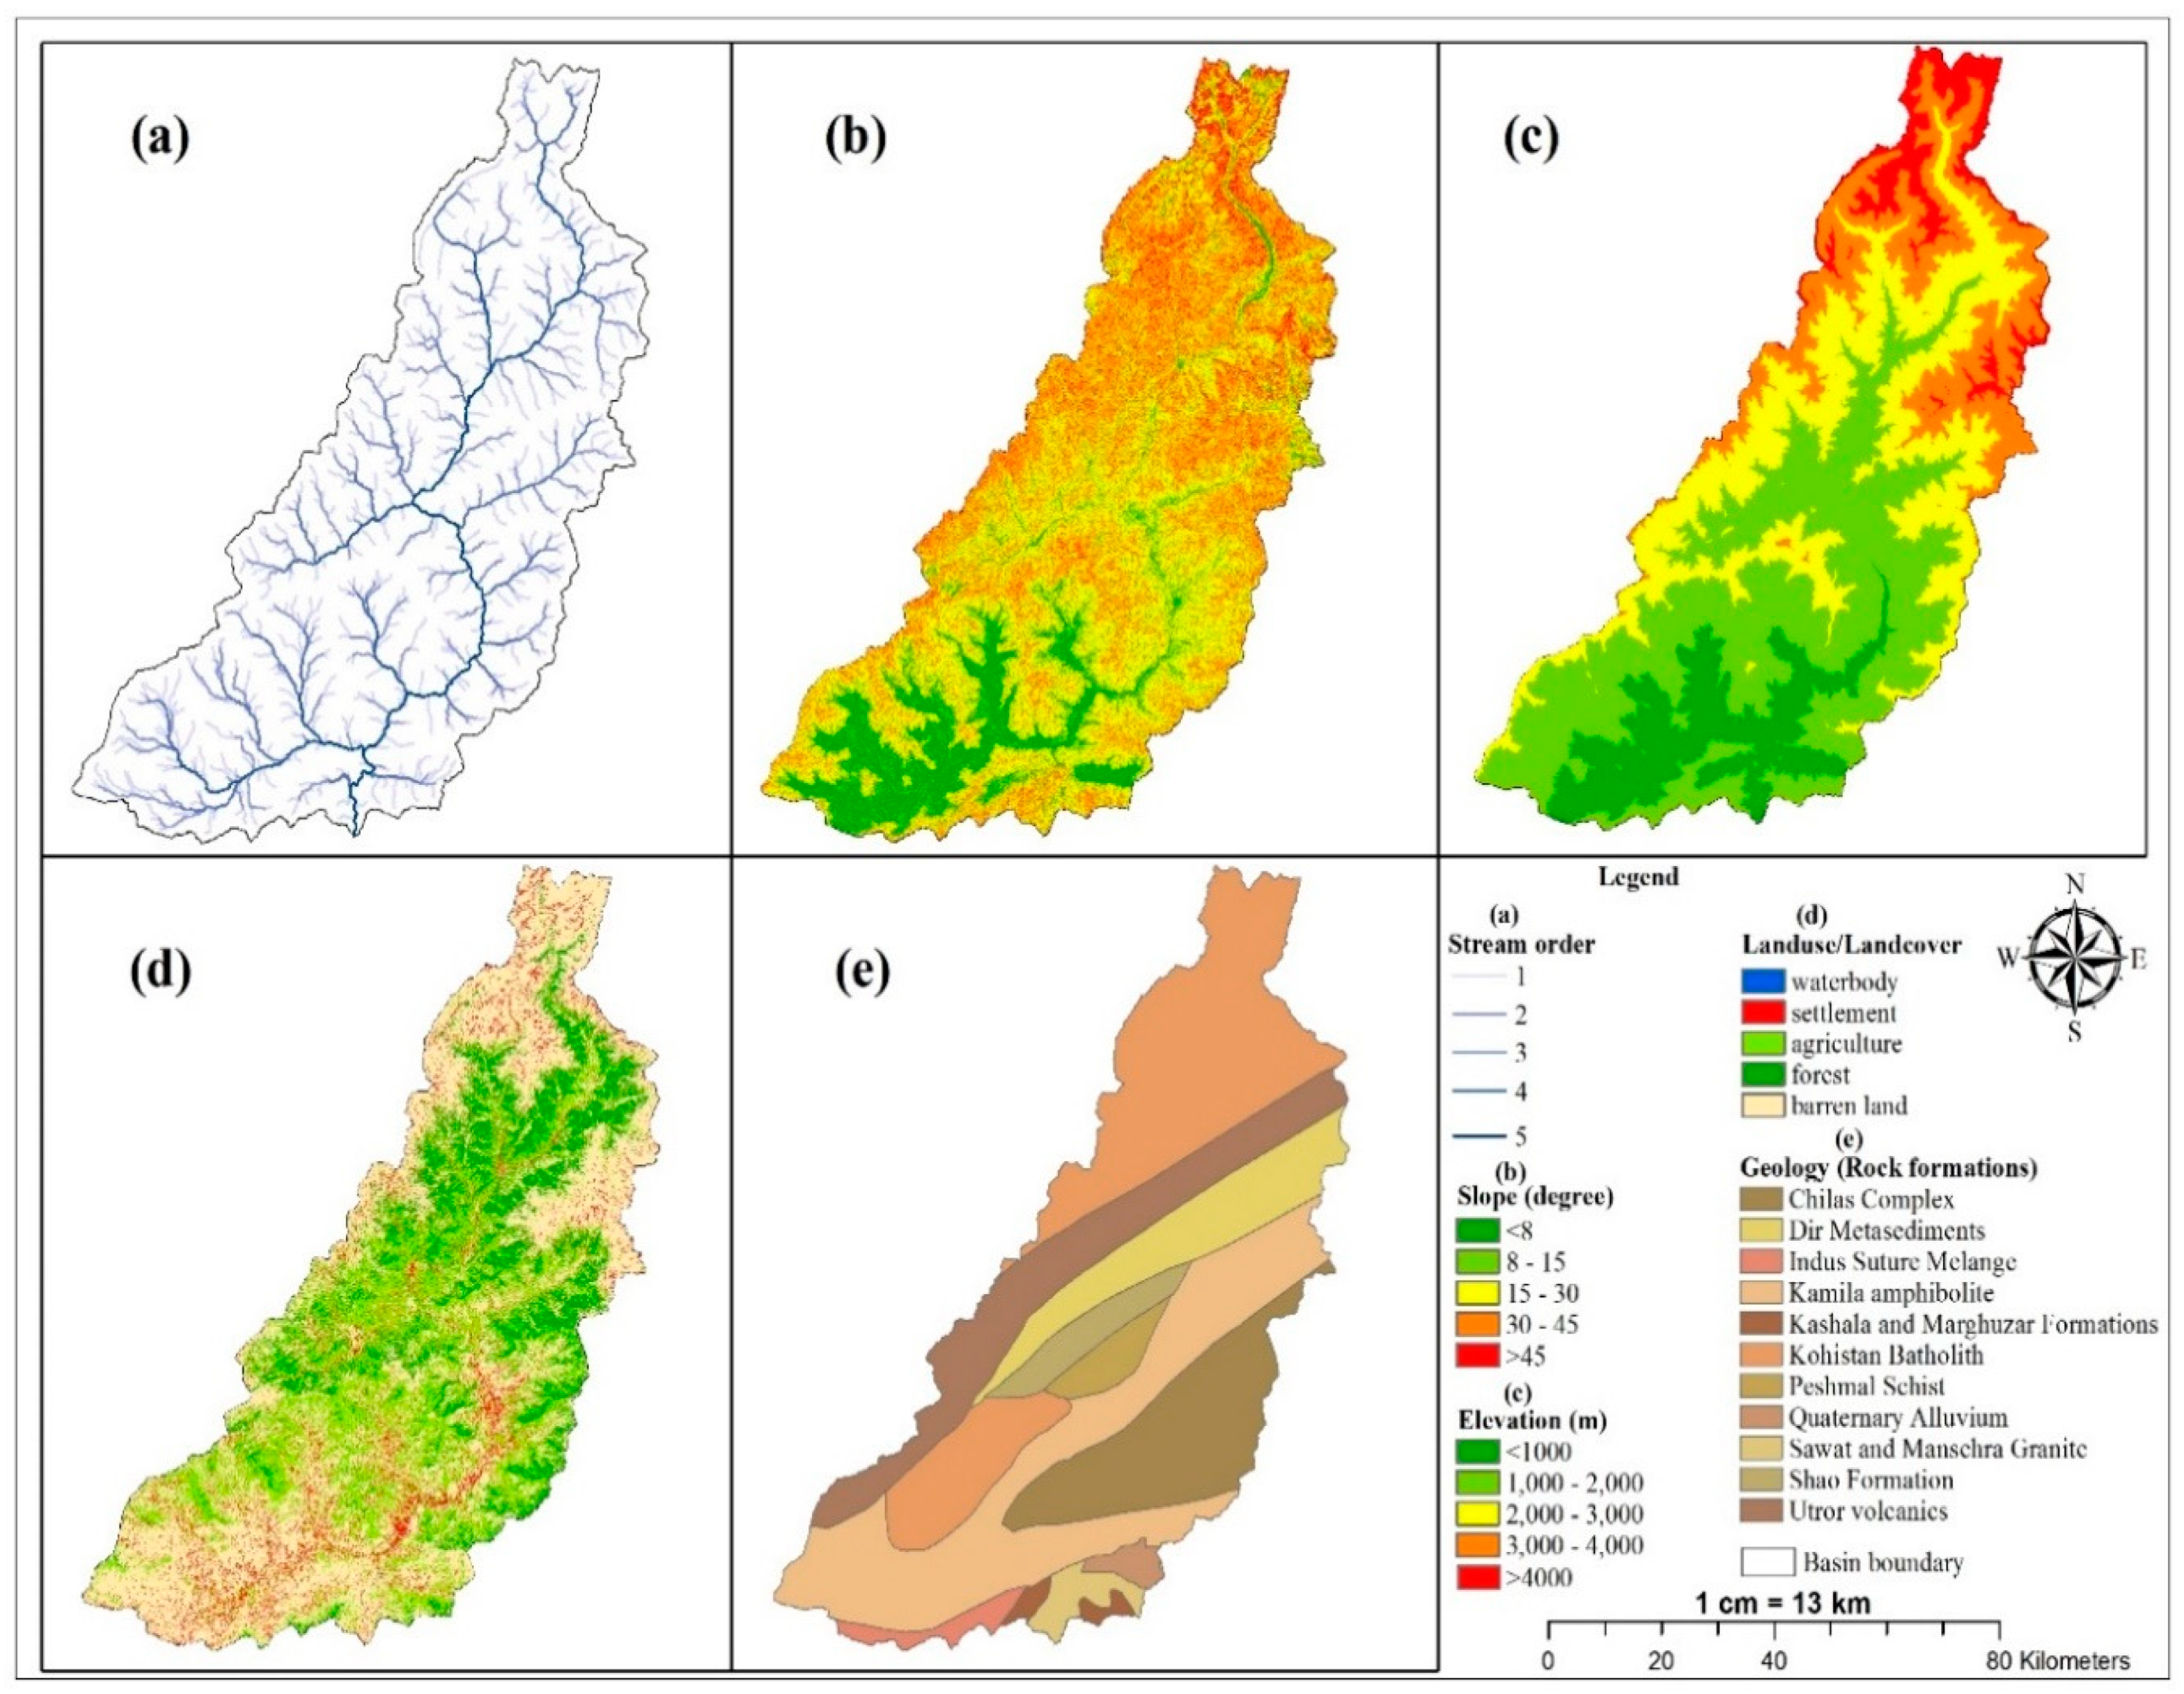
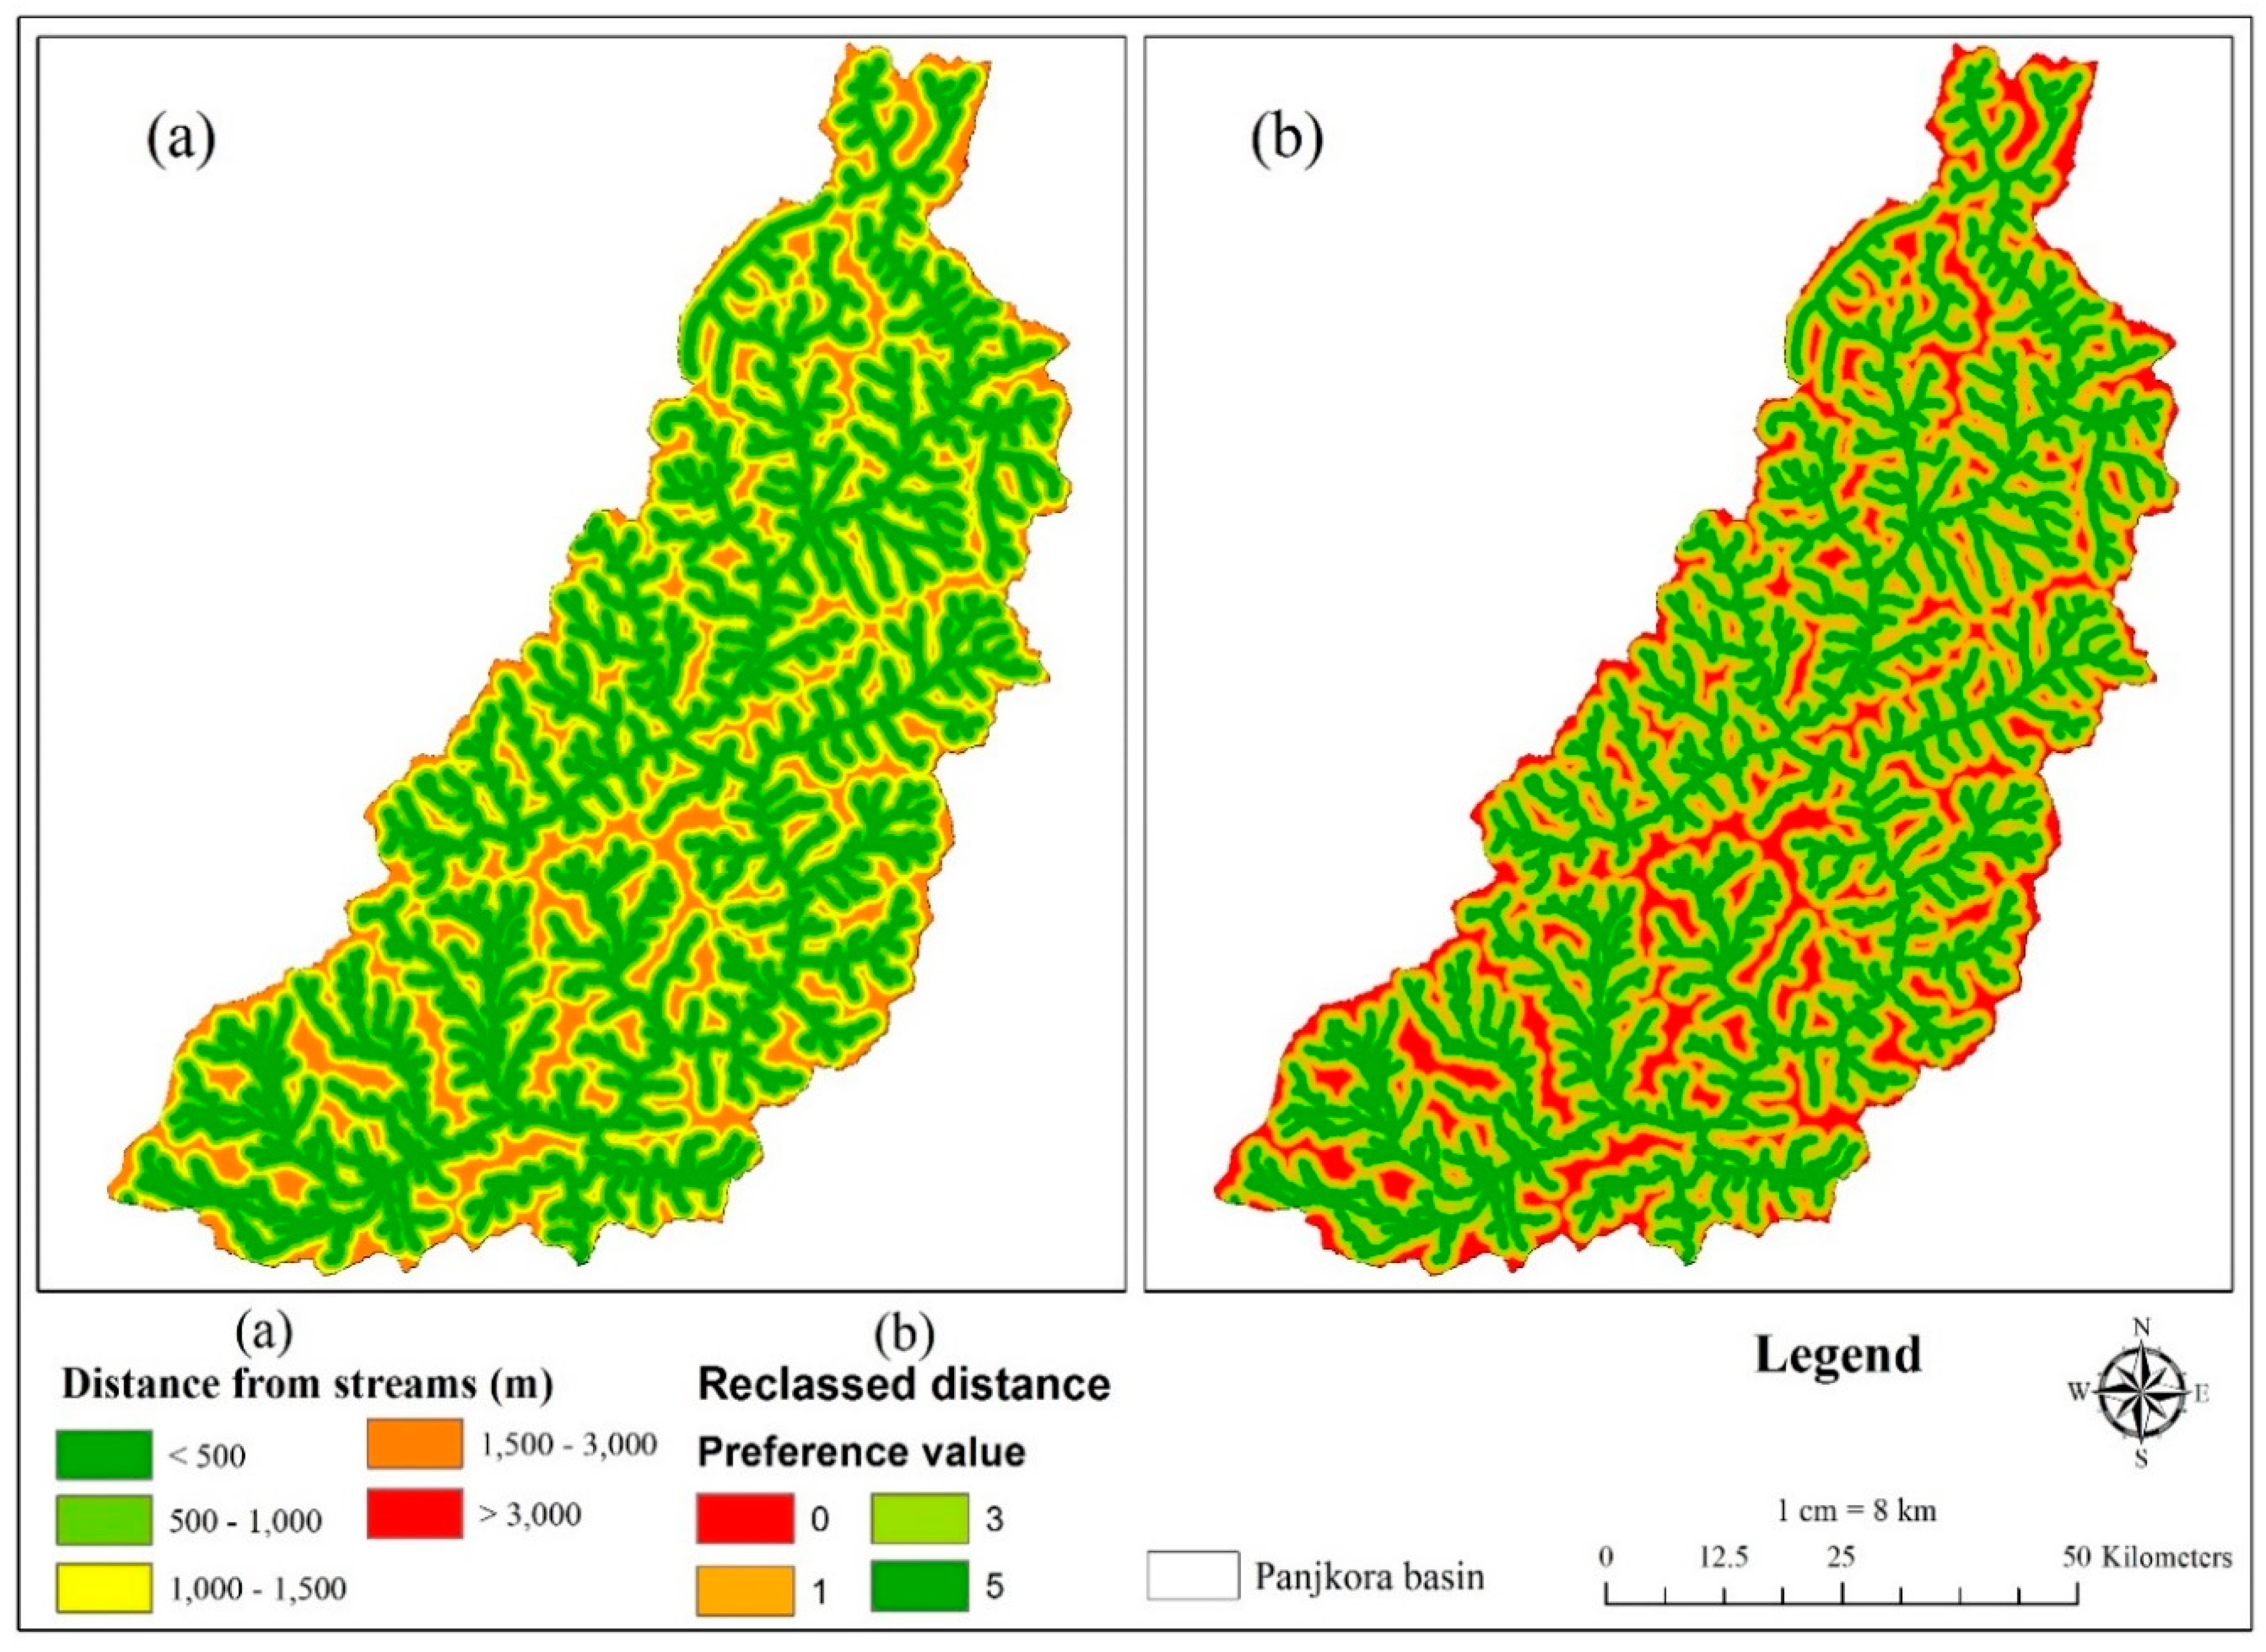
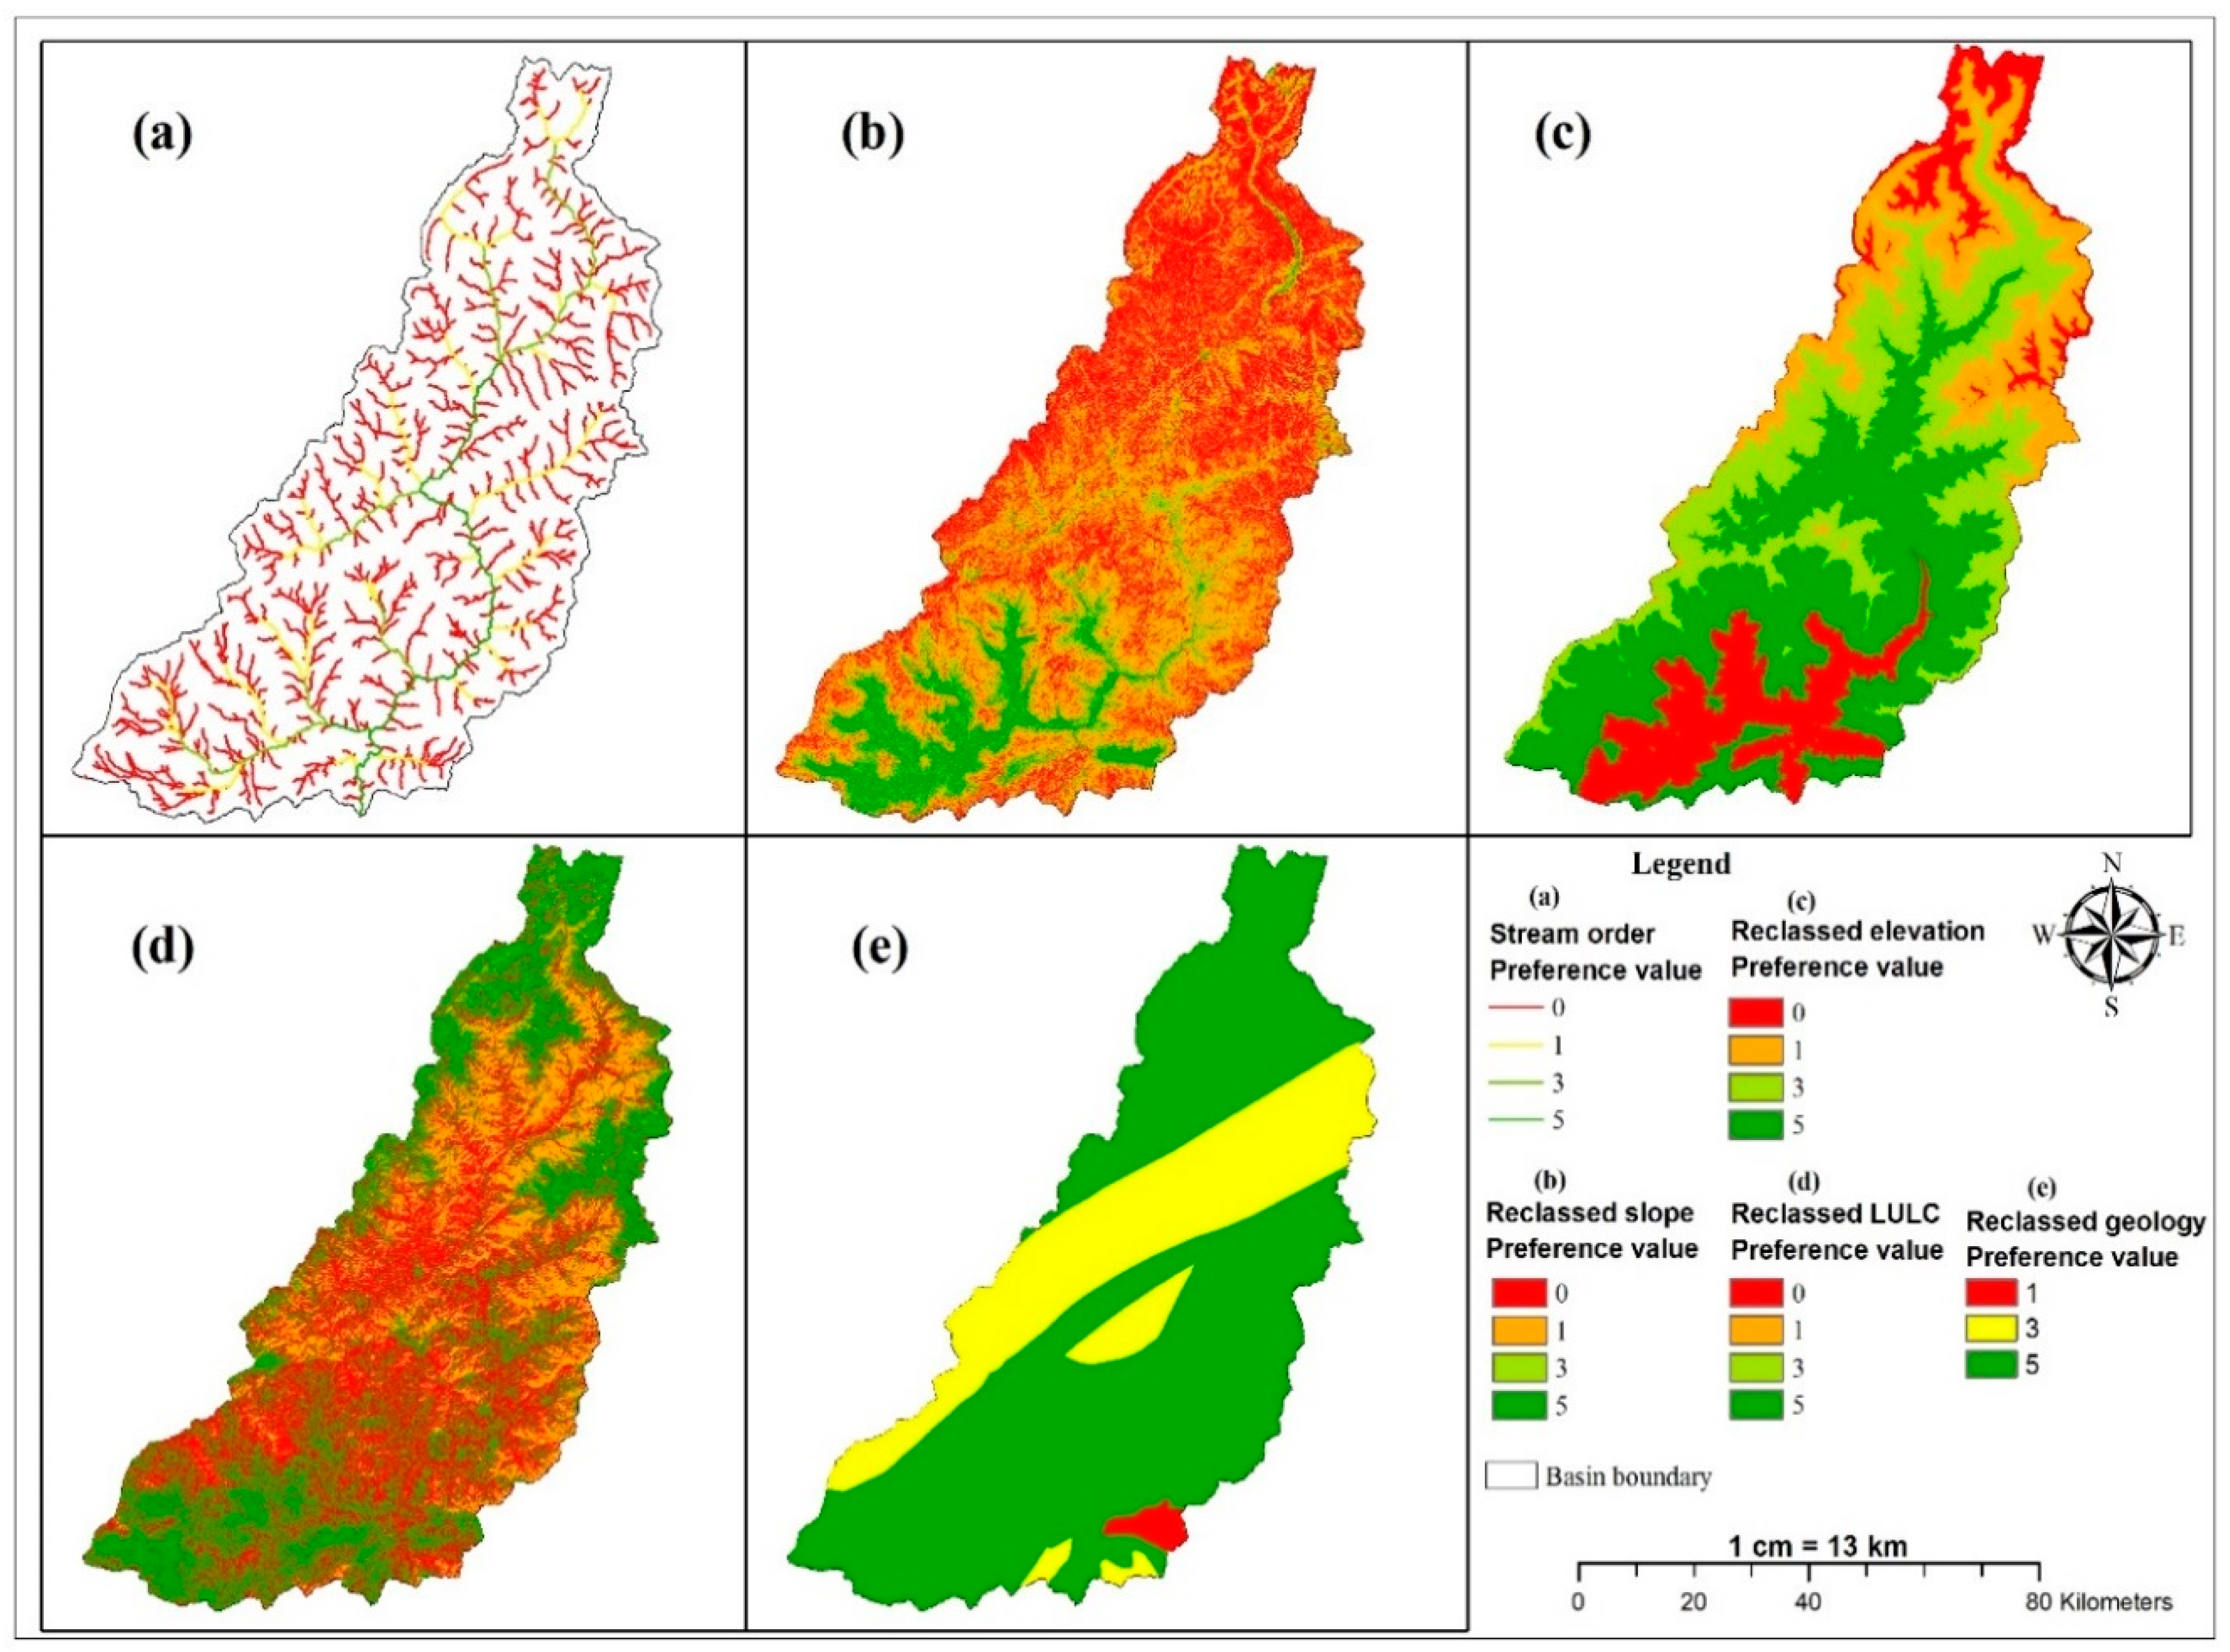
A watershed modeling approach was applied in a GIS environment by using SRTM DEM [32] to delineate the Panjkora River Basin. Strahler’s law [33] defined the stream order and we extracted the drainage network of the Panjkora Basin. Likewise, the slope map generated from DEM in the ArcGIS (Environmental Systems Research Institute (ESRI) located in Redlands, CA, USA) environment, and the slope’s degree, was classified into five classes [24,28]. DEM itself is considered as an elevation layer, which is organized into five classes. The satellite image is processed and classified by using a supervised image classification approach in ENVI 4.8. A land-use/land-cover (LULC) map is prepared in five classes, including water bodies, agricultural land, barren land, forest cover, and settlements [25]. The geological map is digitized and then saved as raster layers [34]. All the above criteria layers are shown in Figure 3. Moreover, the Euclidean distance tool in ArcGIS is used to build distance zones from Streams, and the layer, later on, is used instead of stream order itself. The Euclidean distance layer is named as the reciprocal parameter of stream order. (Figure 4). Each criterion’s classification is based on the literature [9,13] and expert opinions (Geologists, GIS experts, Geographers).
2.5. Reclassification
The raster criteria layers were reclassified using the reclassification tool in ArcGIS. The reclassification is performed on raster layers to classify them into four classes except geological, classified into three possible categories according to expert opinions. The pixel size of each layer is kept as 30 m × 30 m (Figure 5). For suitable site identification, all these parameters are considered during the analysis of potential dam sites (Table 1).
2.6. Rainfall and Discharge Data
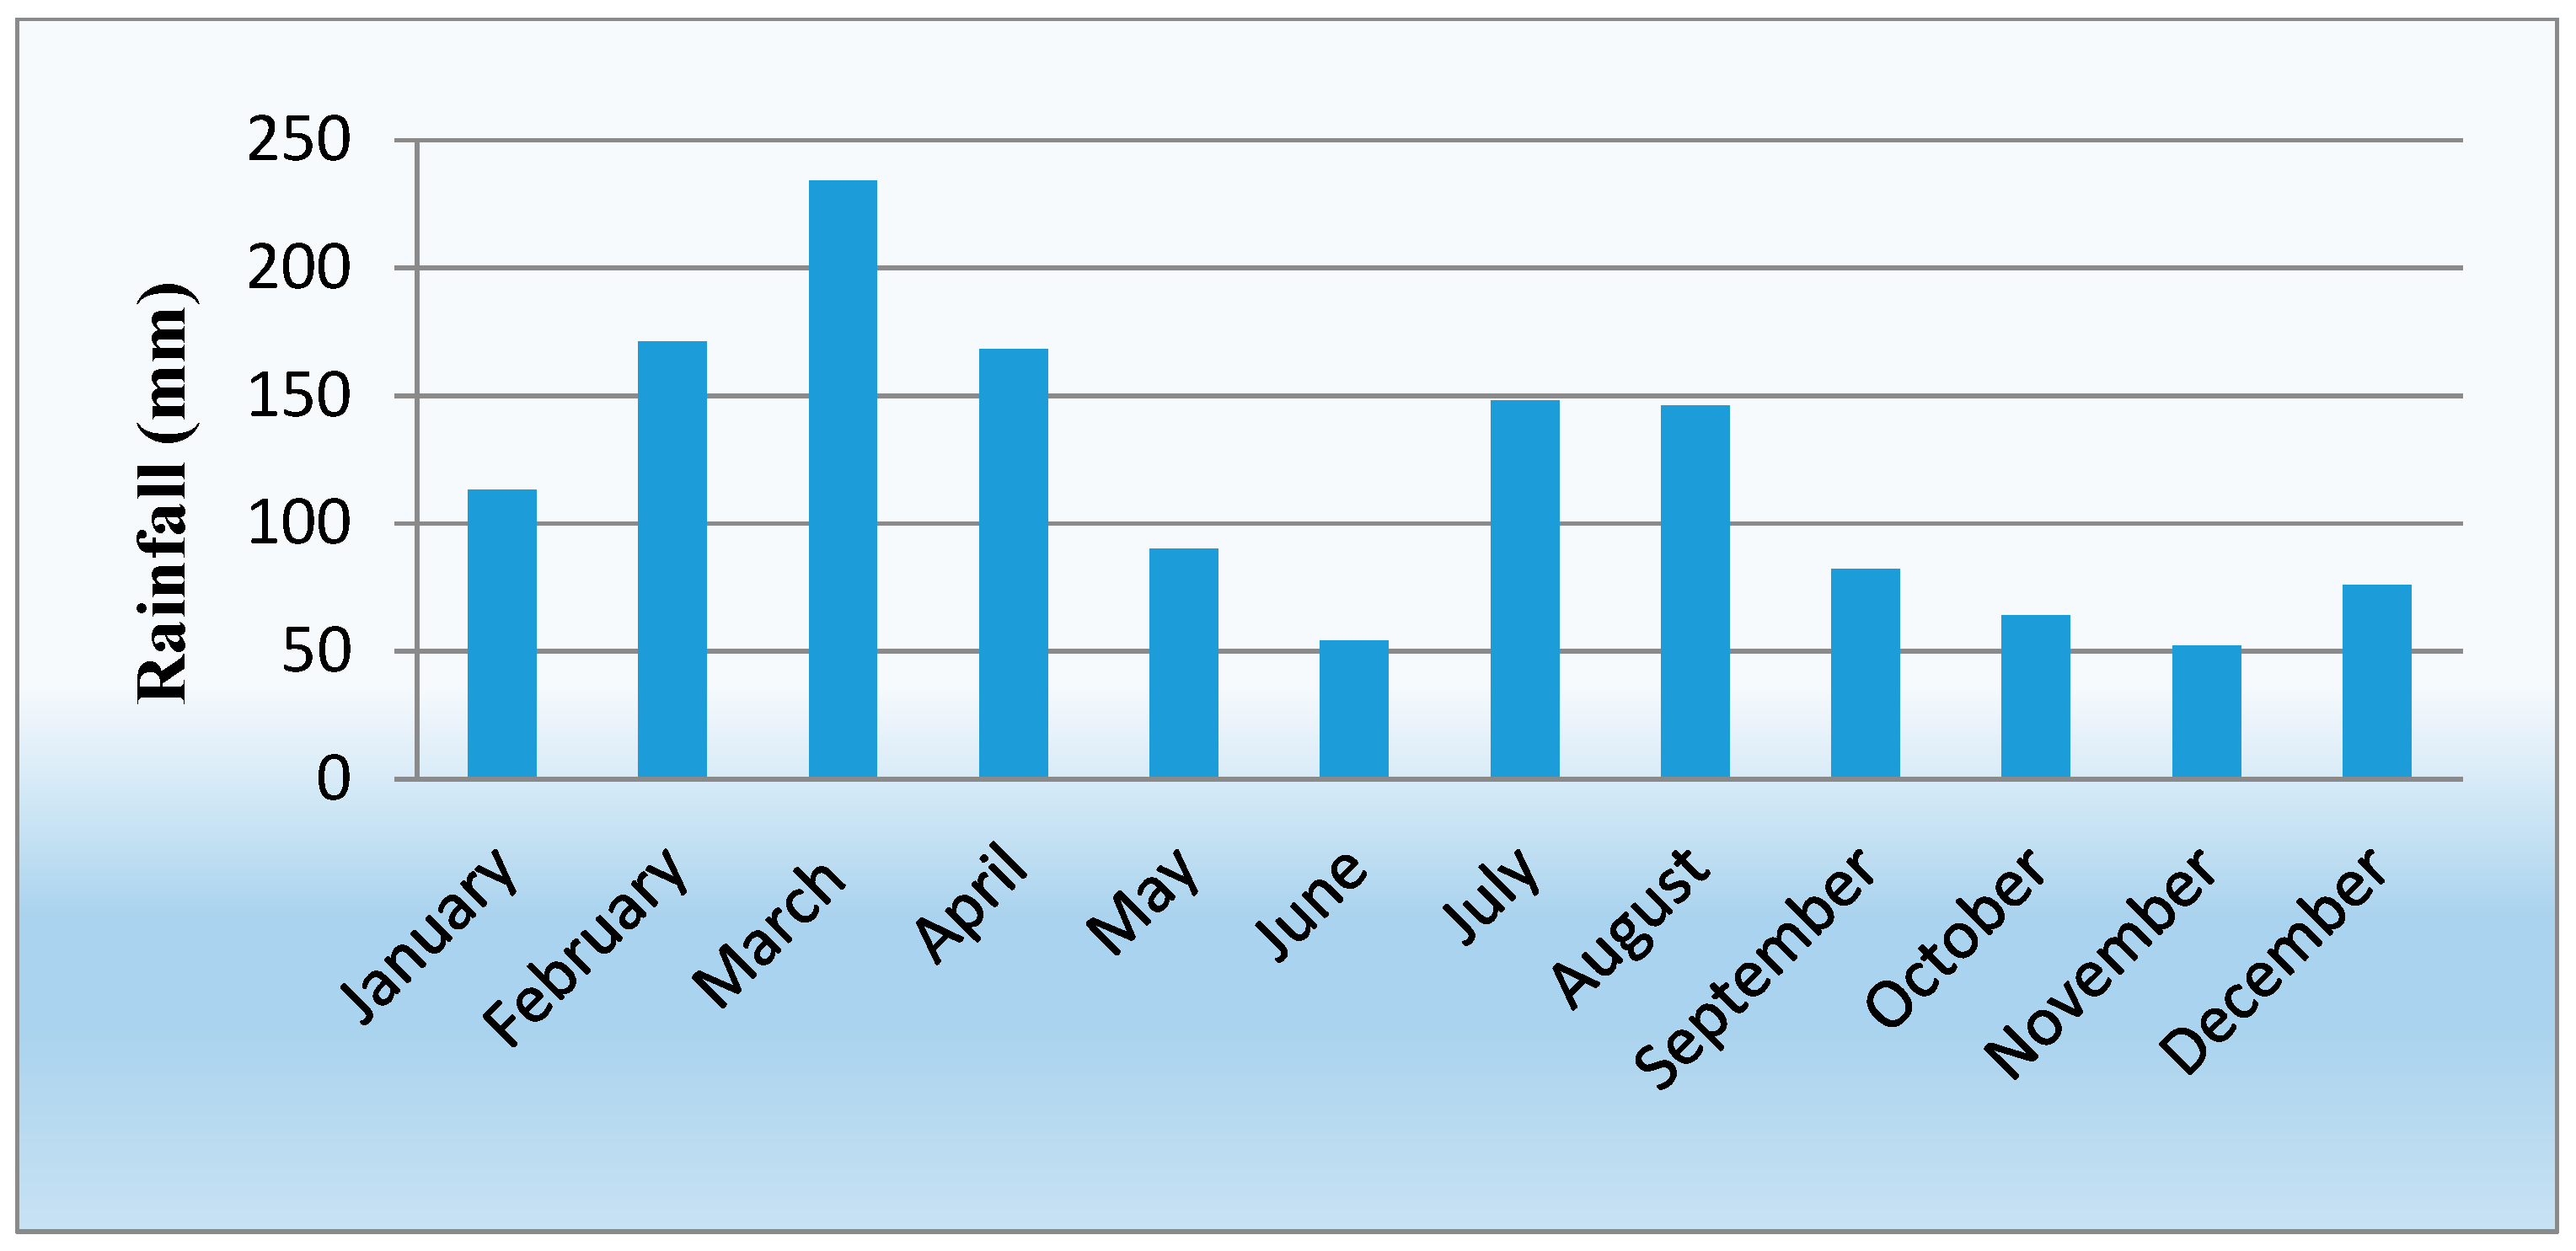
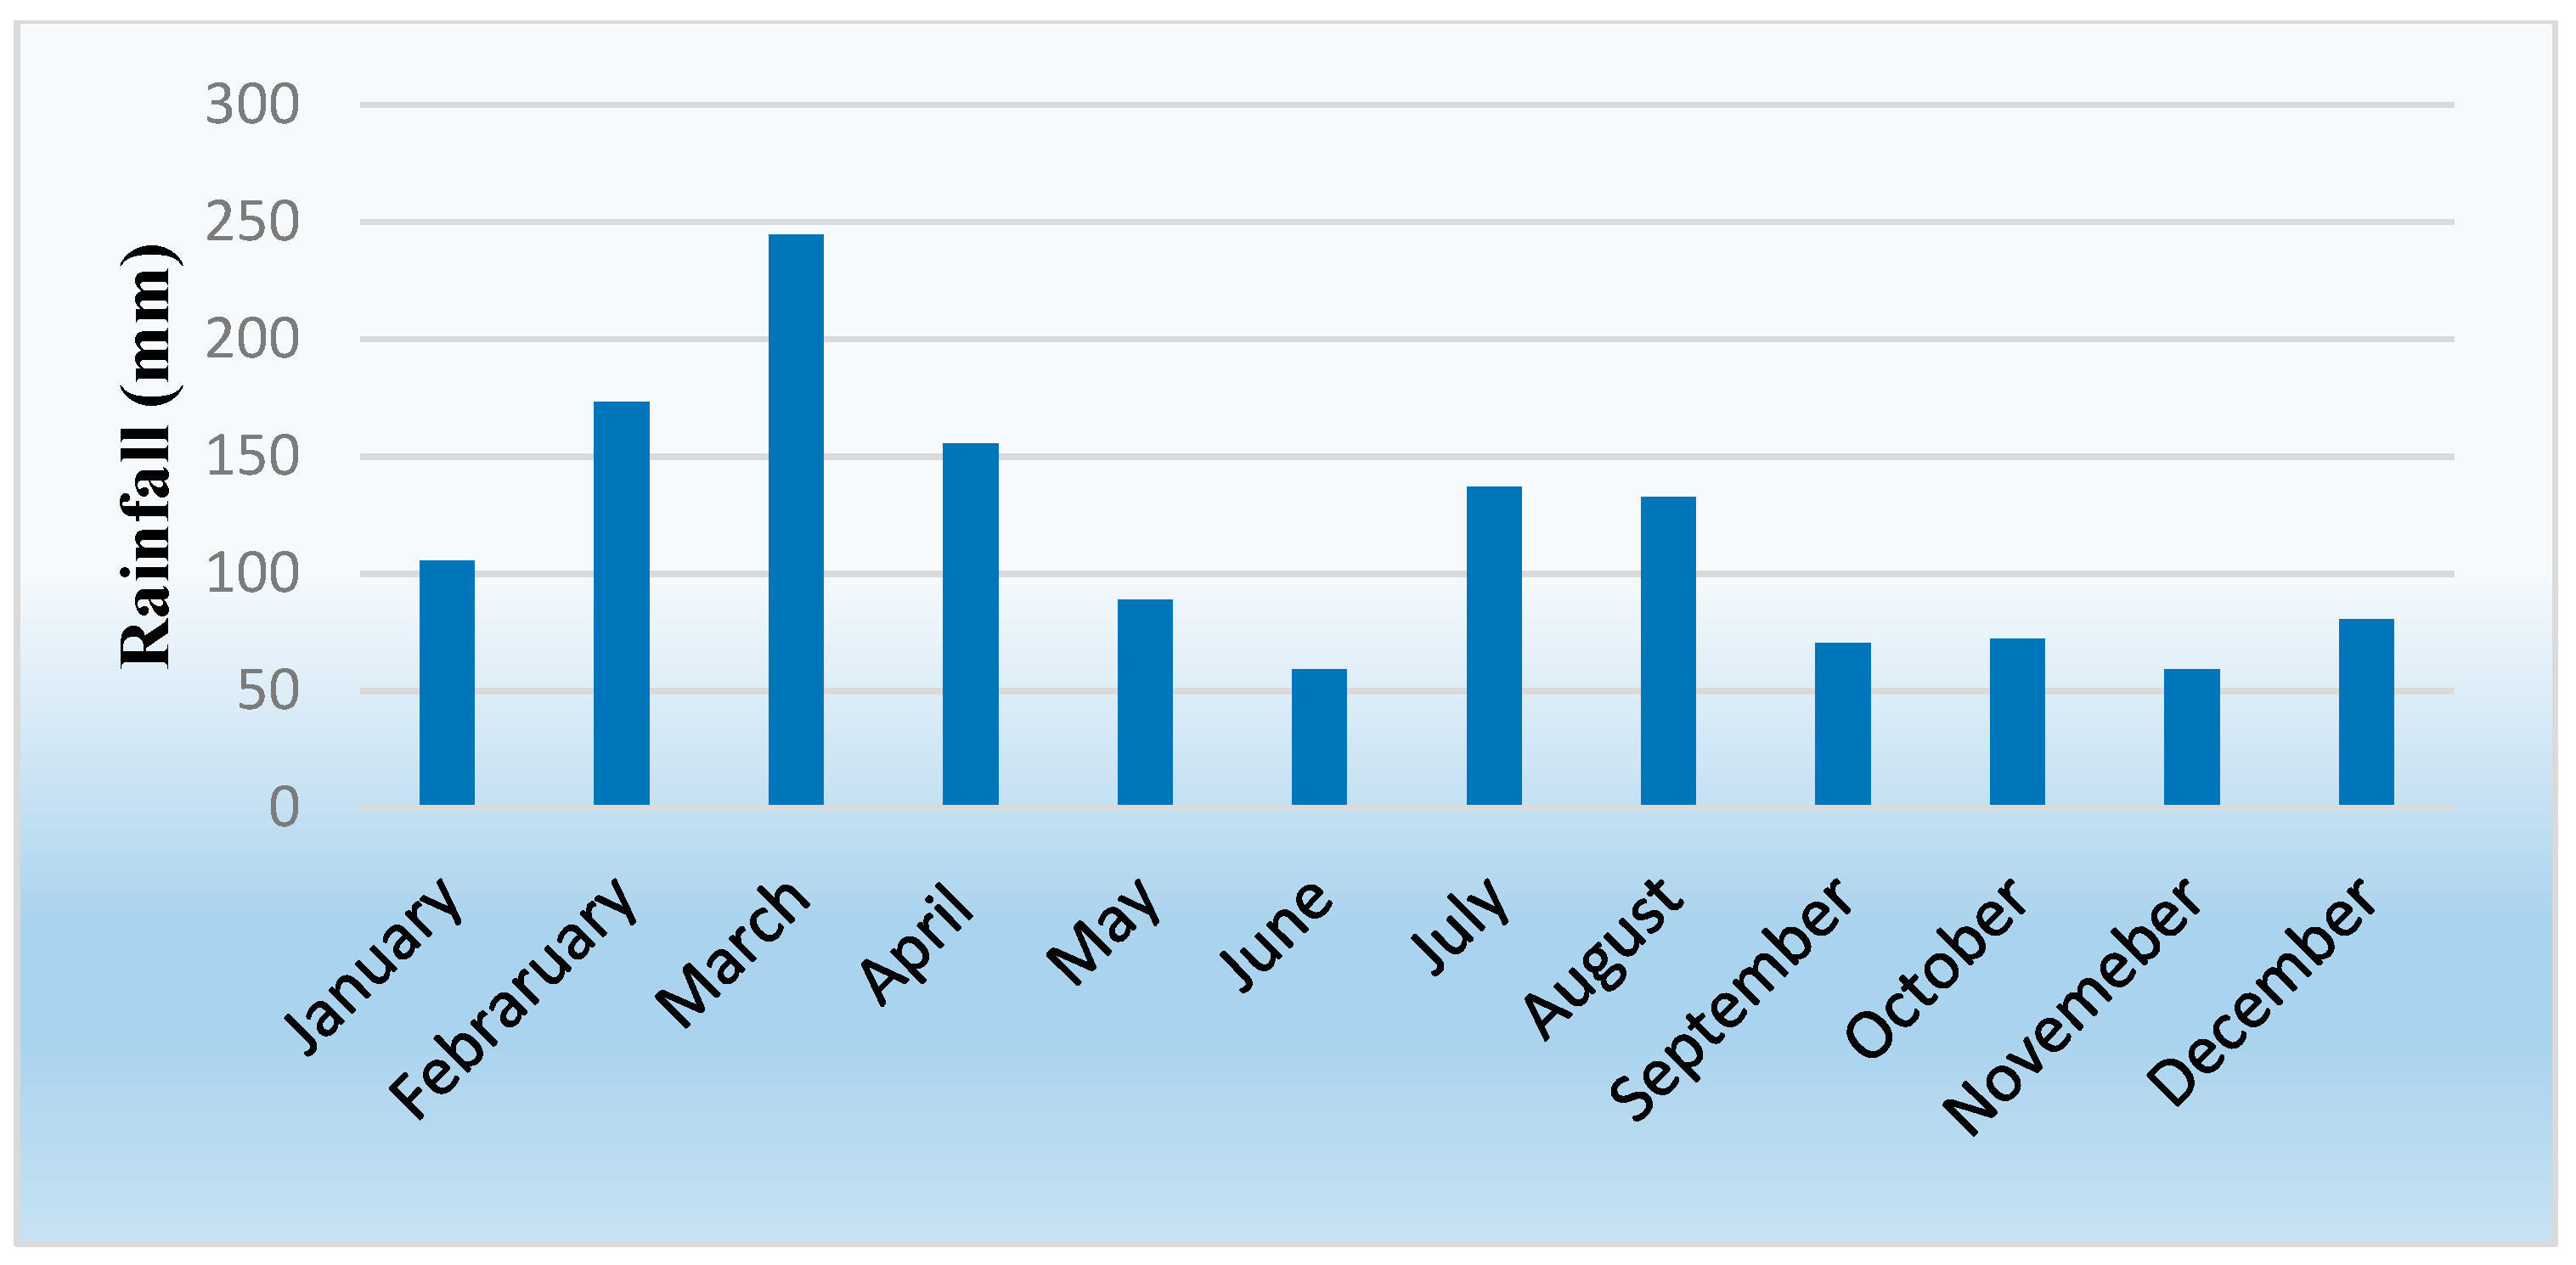
Average monthly rainfall data of 30 years from 1981 to 2010 are analyzed, and obtained from the Dir and Timergara met stations. The winter rainfall source is western depression, whereas Monsoon winds are the primary source of rainfall in summer. Rainfall is more prominent in winter than in summer. Similarly, the study area receives more rain in March, 234 mm upstream, and 244 mm in downstream areas (Figure 6 and Figure 7).
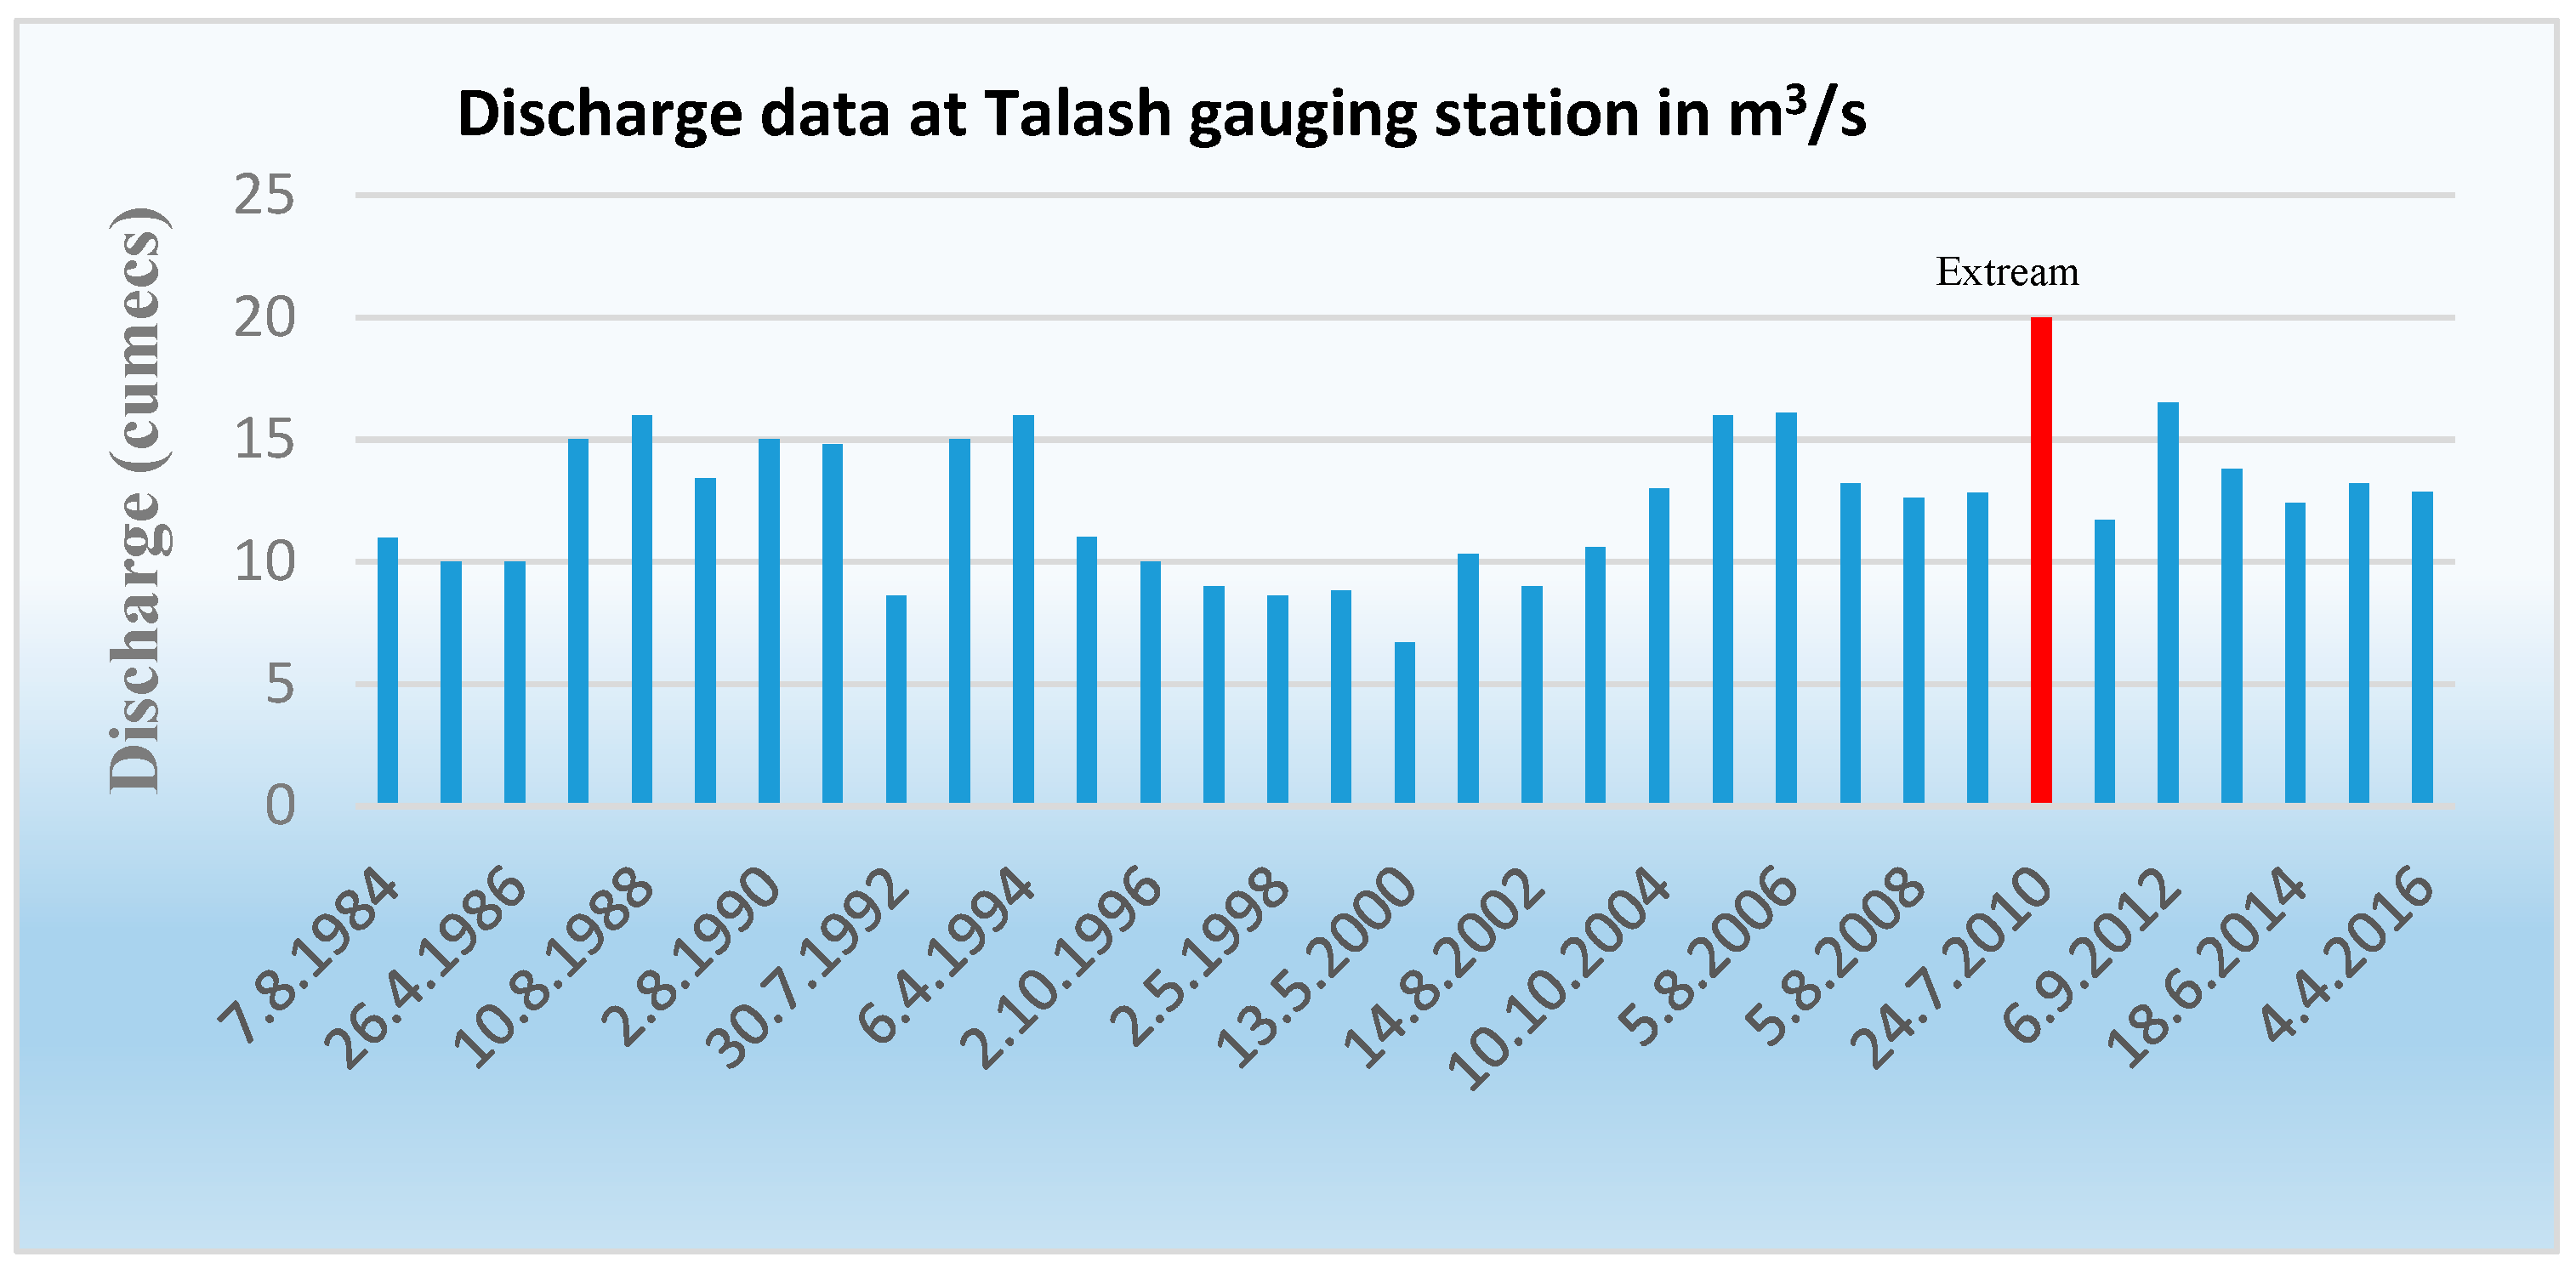
The highest discharges of the Panjkora River were recorded at the Talash gauge station for 30 years from 1985 to 2015 (Figure 8). The results reveal that ever highest discharge was recorded in July 2010. This highest peak shows disastrous 2010-flood due to the 4-day wet spell (27–30 July), where a massive quantity of fresh water was lost, causing damage and could not be stored for future use due to lack of dams. Similarly, each year even in normal conditions, rain-water and melt-water have been losing. Moreover, antecedent rainfall influences slope stability, which also causes landslides [35]. Therefore, building a multi-purpose dam is needed to store water.
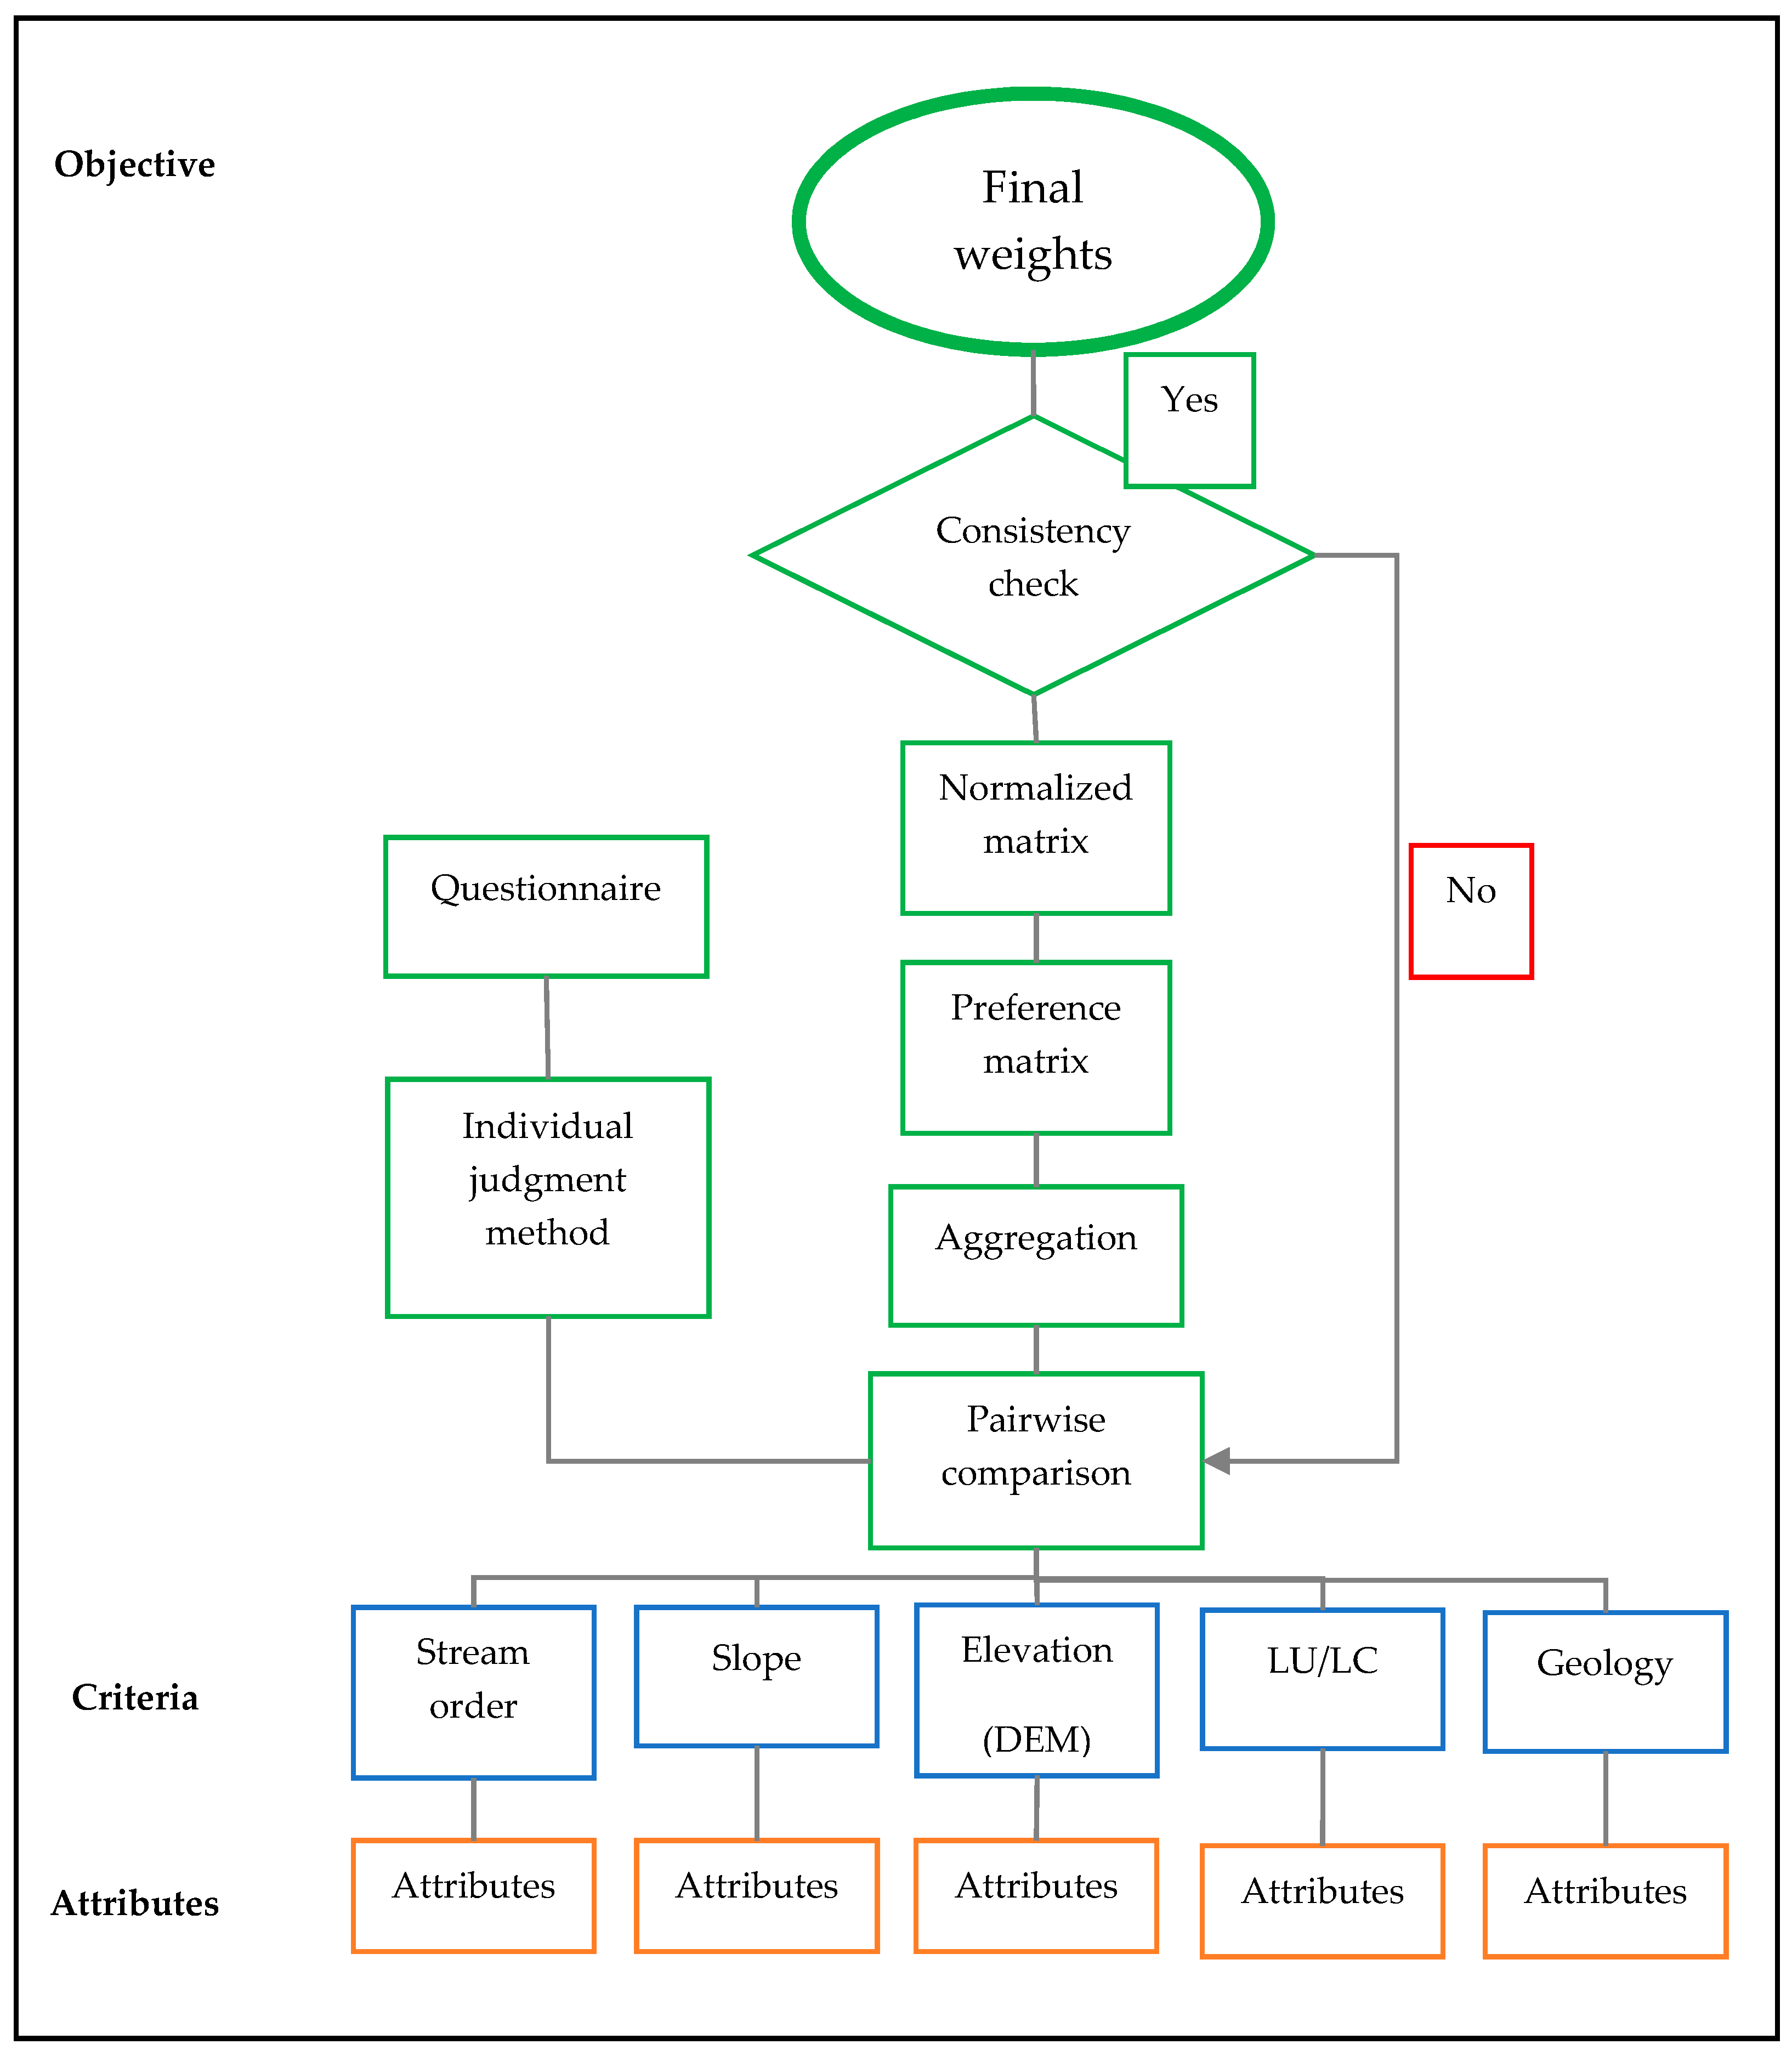
2.7. Analytic Hierarchy Process (AHP) Analysis
AHP has been used as a weighting method for GIS-based MCDM for site suitability analysis [18]. Therefore, this study also used AHP for assigning weights to each criterion. We used the AHP regarding the multi-purpose dam site suitability (Figure 9). According to the fundamental scale (Table 2), the pairwise comparison is applied to determine each criterion’s weight [36]. The whole process is divided into five steps; pairwise comparison of criteria with expert opinions, aggregation of expert opinions, forming the preference matrix (Table 3), finding a normalized matrix (Table 4) from the preference matrix, and calculation of consistency ratio. All the steps are discussed below.
The pairwise comparison of each criterion with the other is the most crucial step of this study. Therefore, the judgment of the appropriate values for each criterion is critical. In this regard, we considered some knowledge from the literature [9,13,16] and interviewed relevant filed (GIS, geology, geography and hydrology) experts individually to discuss each criterion’s importance over the other. Eight experts were interviewed using the individual judgment method, two experts per field. [37]. The numeric values used for judgments were taken from Table 2. A questionnaire was used to simplify the process, the same as the preference table (Table 3). The geometric mean are shown in Table 3, the final values assigned to each criterion [37]. According to our study, stream order obtained the highest importance, and slope, and elevation received moderate values. Where geology mostly consists of igneous geological formations, therefore, it obtained the lowest value.
Finally, the preference matrix (Table 3) is generated according to Table 2 with the literature and expert opinions. The scale values are used from equal importance to strong importance (Table 2), having numerical values of 1 to 5. The reason to keep the scale value up to 5 is that we used the same scale value 1 to 5 in the weighted overlay analysis tool; thus, we made the scales as close as possible.
Consistency Ratio
The validity of the calculated weights is given by the evaluation using a numerical index called the consistency ratio “CR” Equation (1). The CR is defined as the ratio between the consistency index “CI” and Random Index “RI”. CI is given by Equation (2), where RI is the standard value (Table 5) according to the number of criteria used in various research activities [17].
CI is given.
where λmax (Table 6) is the product between the column-wise sum in pairwise comparison matrix and the average weights from the normalized matrix and “n” is the number of criteria used in the AHP.
The resulting CR value is 0.04 that is acceptable. CR exceeding 0.1 is not reliable, and the entire exercise starts again unless the resulting value is less than 0.1. CR proves our measured matrix of preferences, and the estimated weights are trustworthy.
2.8. Overlay Analysis
Aggregation of all criterion layers is performed to find suitability maps using a weighted overlay tool in the ArcGIS. Weights from Table 1 and Table 4 are assigned to “scale value” and “influence%” options in the tool, respectively. All the raster layers with 30 m × 30 m spatial resolution with their calculated weights are input. Firstly, overlay analysis included stream order itself. Secondly, the Euclidean distance layer is used as a reciprocal of stream order.
2.9. Proposed Dam Sites and Evaluation
To evaluate and study the profile of proposed dam sites, nine parameters, including 3D surface area, 2D surface area, max. volume, elevation of dam base, the elevation of dam surface, dam height, dam width, catchment area, and contour closeness, are used. Contours are generated with a difference of 25 m from the DEM. A triangulated irregular network (TIN) was created using the contours to find 3D surface area and Volume. 3D The analyst tool in ArcGIS is used to find out the cross-section (height and width), which also exemplifies graphical representation. Hydrological tools are applied for measuring the catchment area.
3. Results
3.1. Suitability Maps and Stream Importance
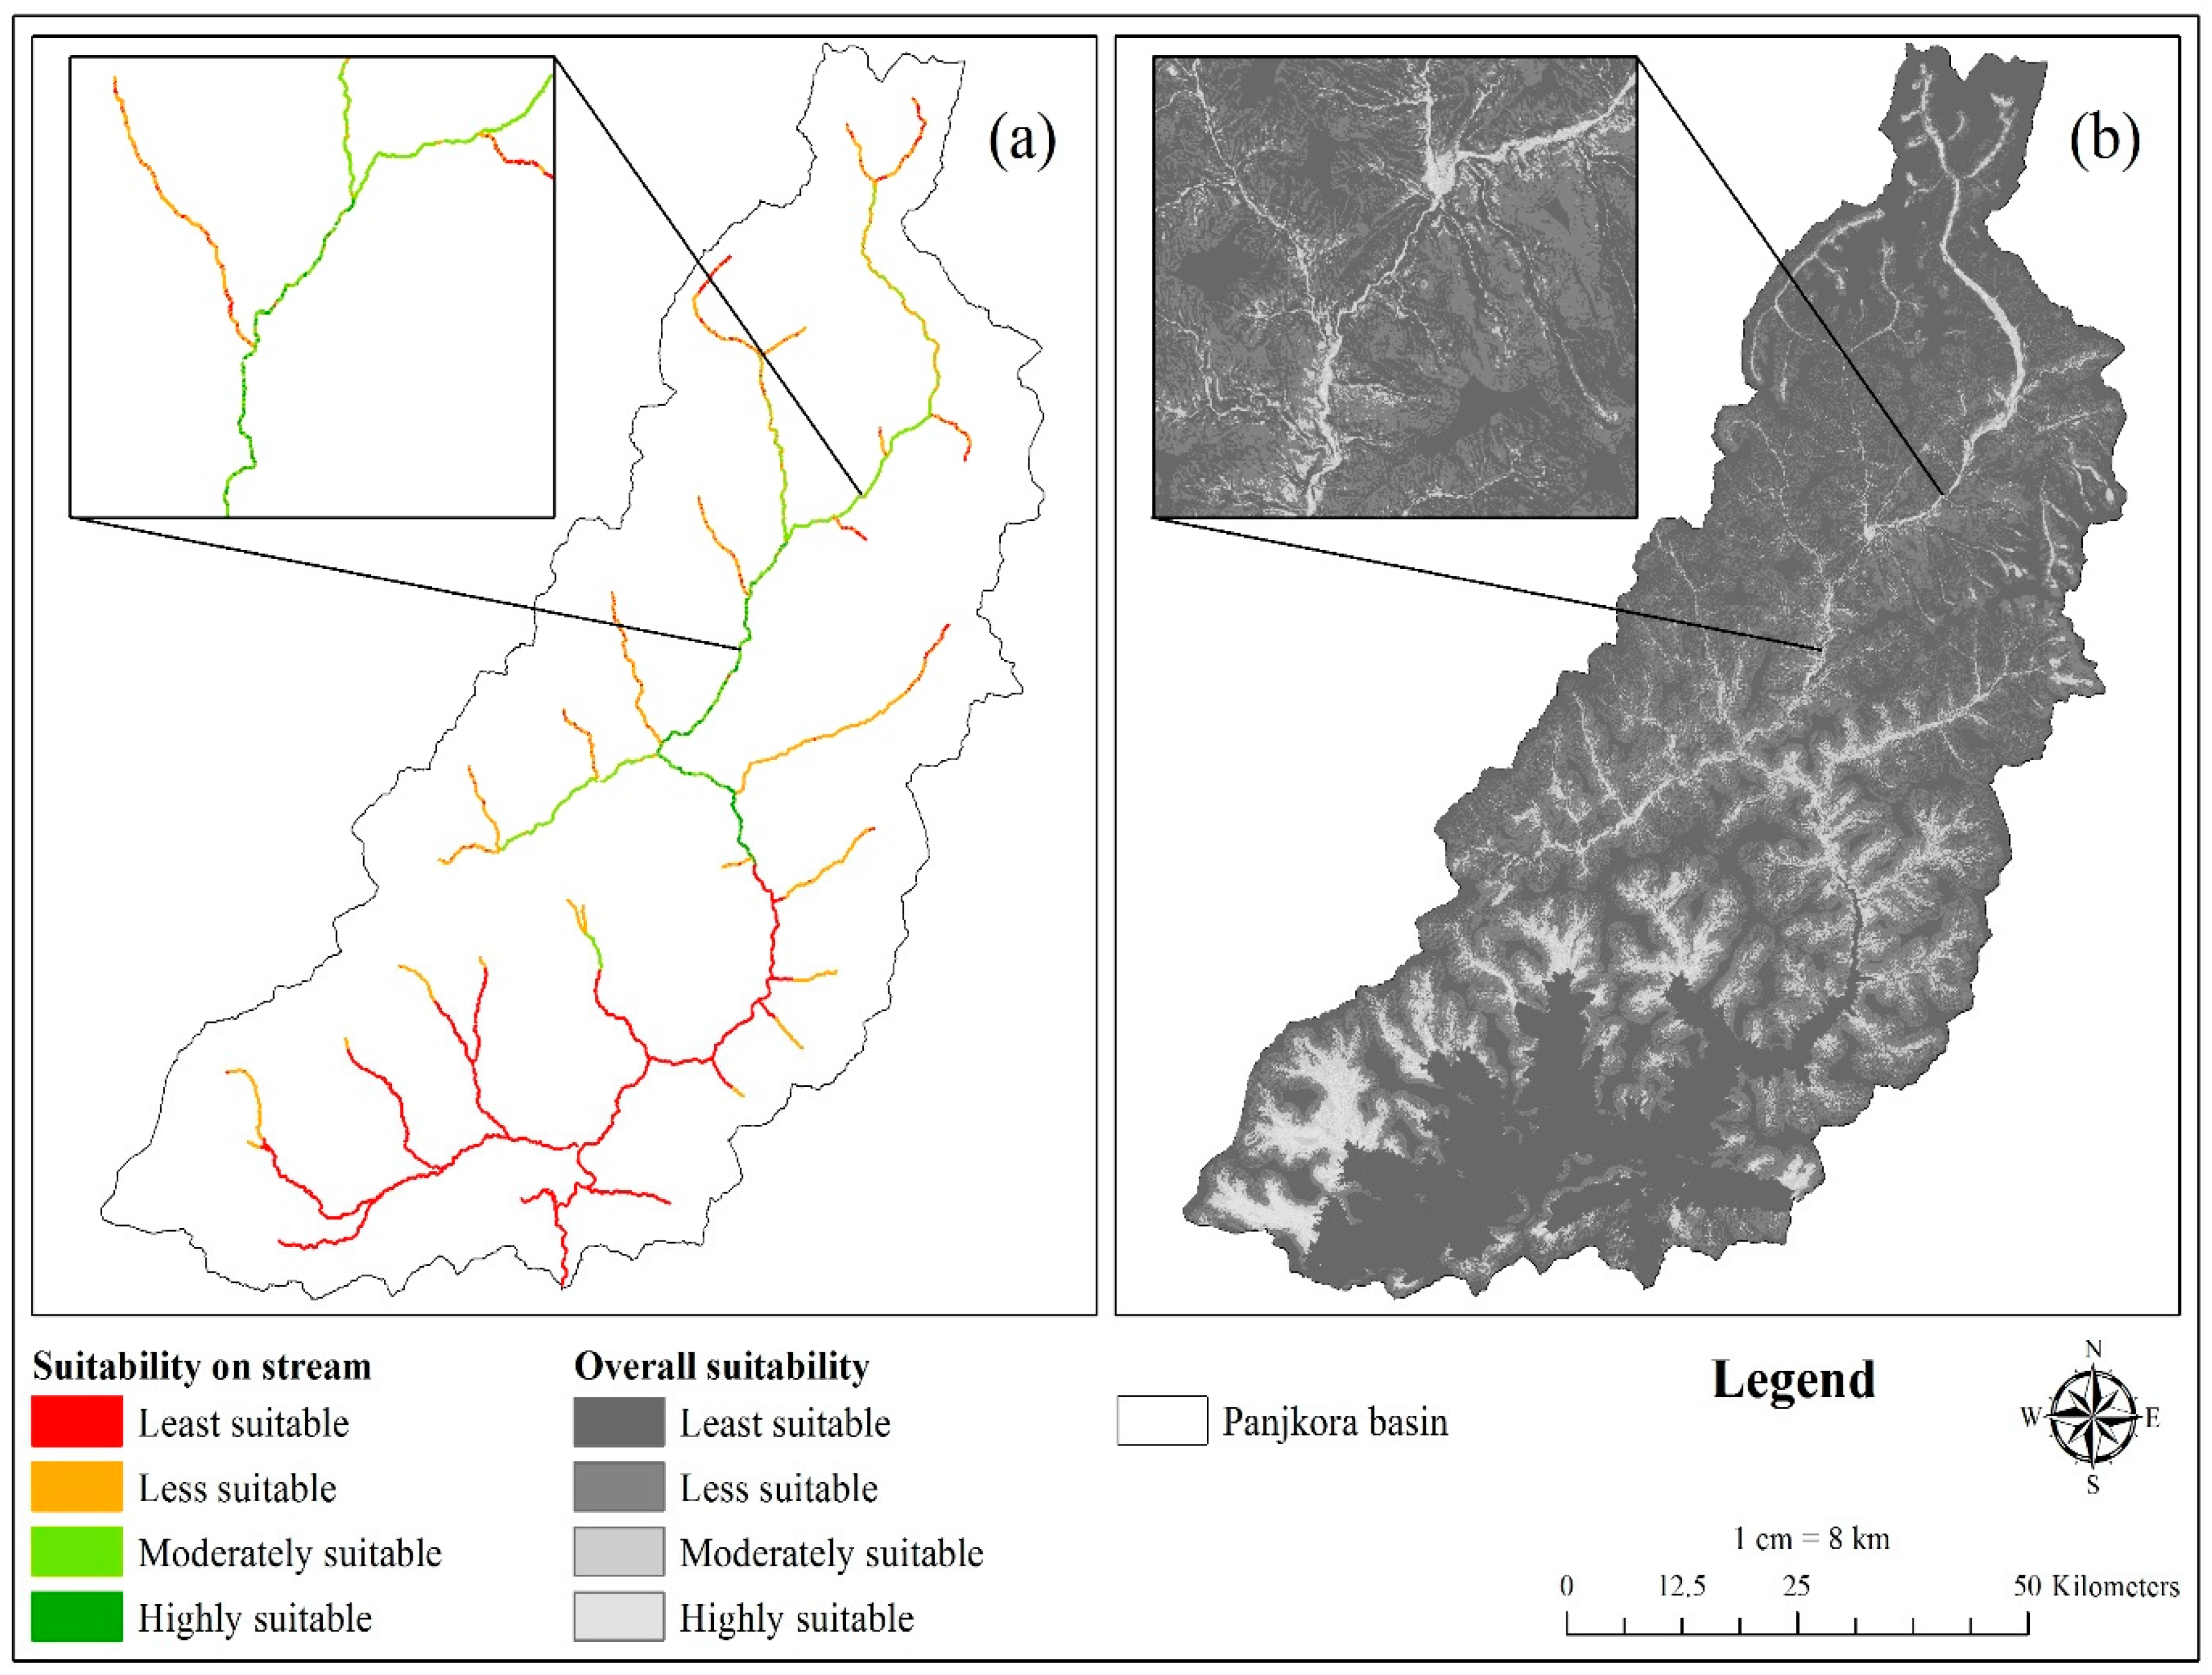
The results have shown two different suitability maps for dam sites named as “suitability on stream” (Figure 10a) and “overall suitability” (Figure 10b). There are four classes as “High, moderate, less, and least suitable” in both maps.
The first map was obtained by including stream order in overlay analysis as a reclassified raster layer with a pixel size as other layers, i.e., 30 m × 30 m. Here, the highest weight was given to the stream order with a pixel size of 30 m. Thus, the analysis picked the suitable pixels on the streams, but at the same time, the surrounding area was also considered as other layers, i.e., slope, elevation, LULC, and geology.
The second map was obtained by including the Euclidean distance layer as a reciprocal of the stream order layer in the analysis. In the Euclidean distance reclassified layer, the distance from the streams was classified into four classes, and all other parameters included were the same as in the first map. Unlike the first resultant map, suitability zones were found all over the study area, including the areas with no streams, but for the dam construction, the availability of water is a vital necessity.
The second resultant map showed a huge suitable area in the lower reaches where the stream order was very low. There is no doubt that it might have considered all other parameters to find the best suitable area, e.g., lower reaches with a more suitable slope. The first map, considering all parameters on streams and its surroundings, is more considerable and has shown results in the basin’s upper reaches. The upper reaches are also appropriate for achieving multi-purposes, i.e., agriculture usage, flood control, hydropower, etc. Lower reaches having more settlements and high flood risk zone [38]. Therefore, suitability on stream gave better results as compared to overall suitability.
3.2. Multi-Purpose Proposed Dam Sites
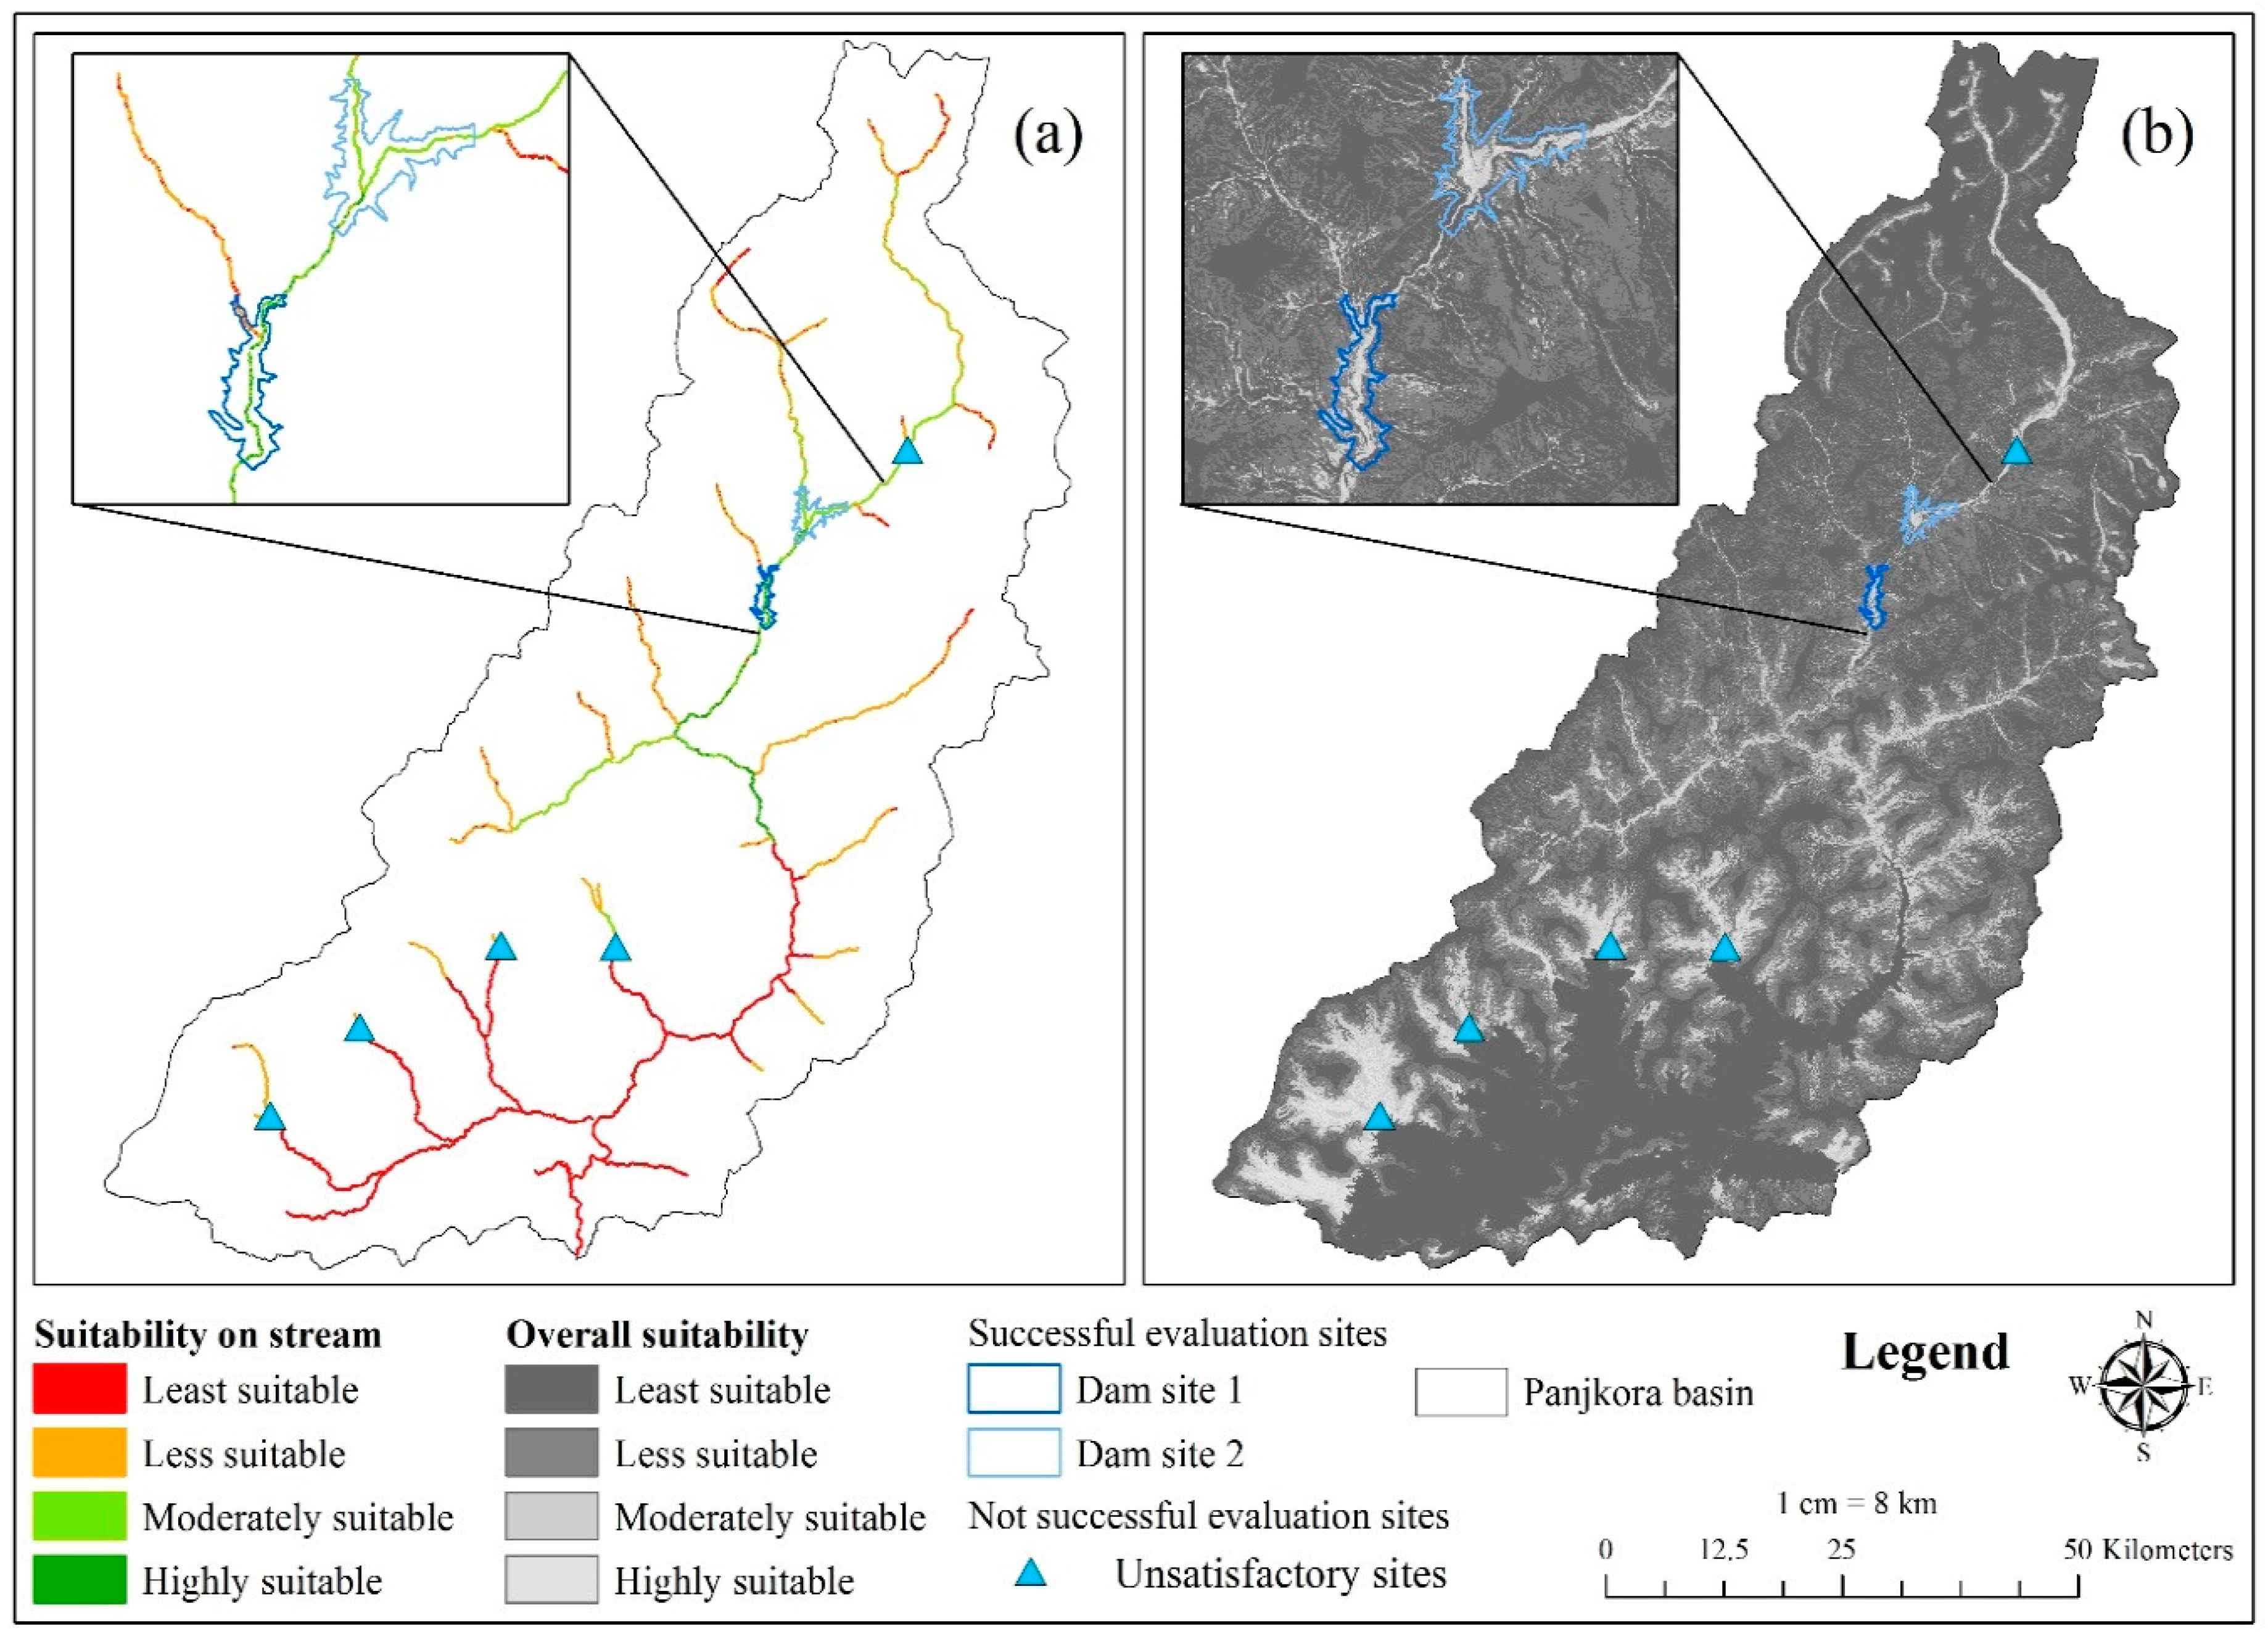
Two dam sites have been proposed based on the first results, suitability on stream. While considering both suitability maps, five other sites were tested, out of which four sites in the lower reaches selected for the test based on the second resultant map, overall suitability. All the five sites could not pass the evaluation criteria to propose the sites, and were therefore named “unsatisfactory sites.” There are negative results for unsatisfactory sites such as no V-shaped valley to construct a dam wall, low stream order, small catchment area, settlements, etc. In proposed sites, Dam site 1 is mainly in the highly suitable zone for dam construction, where Dam site 2 lies between high and moderate suitable zone based on suitability on stream (Figure 11). Both sites were evaluated based on the evaluation parameters, which are discussed in the next section.
3.3. Evaluation of Proposed Dam Sites
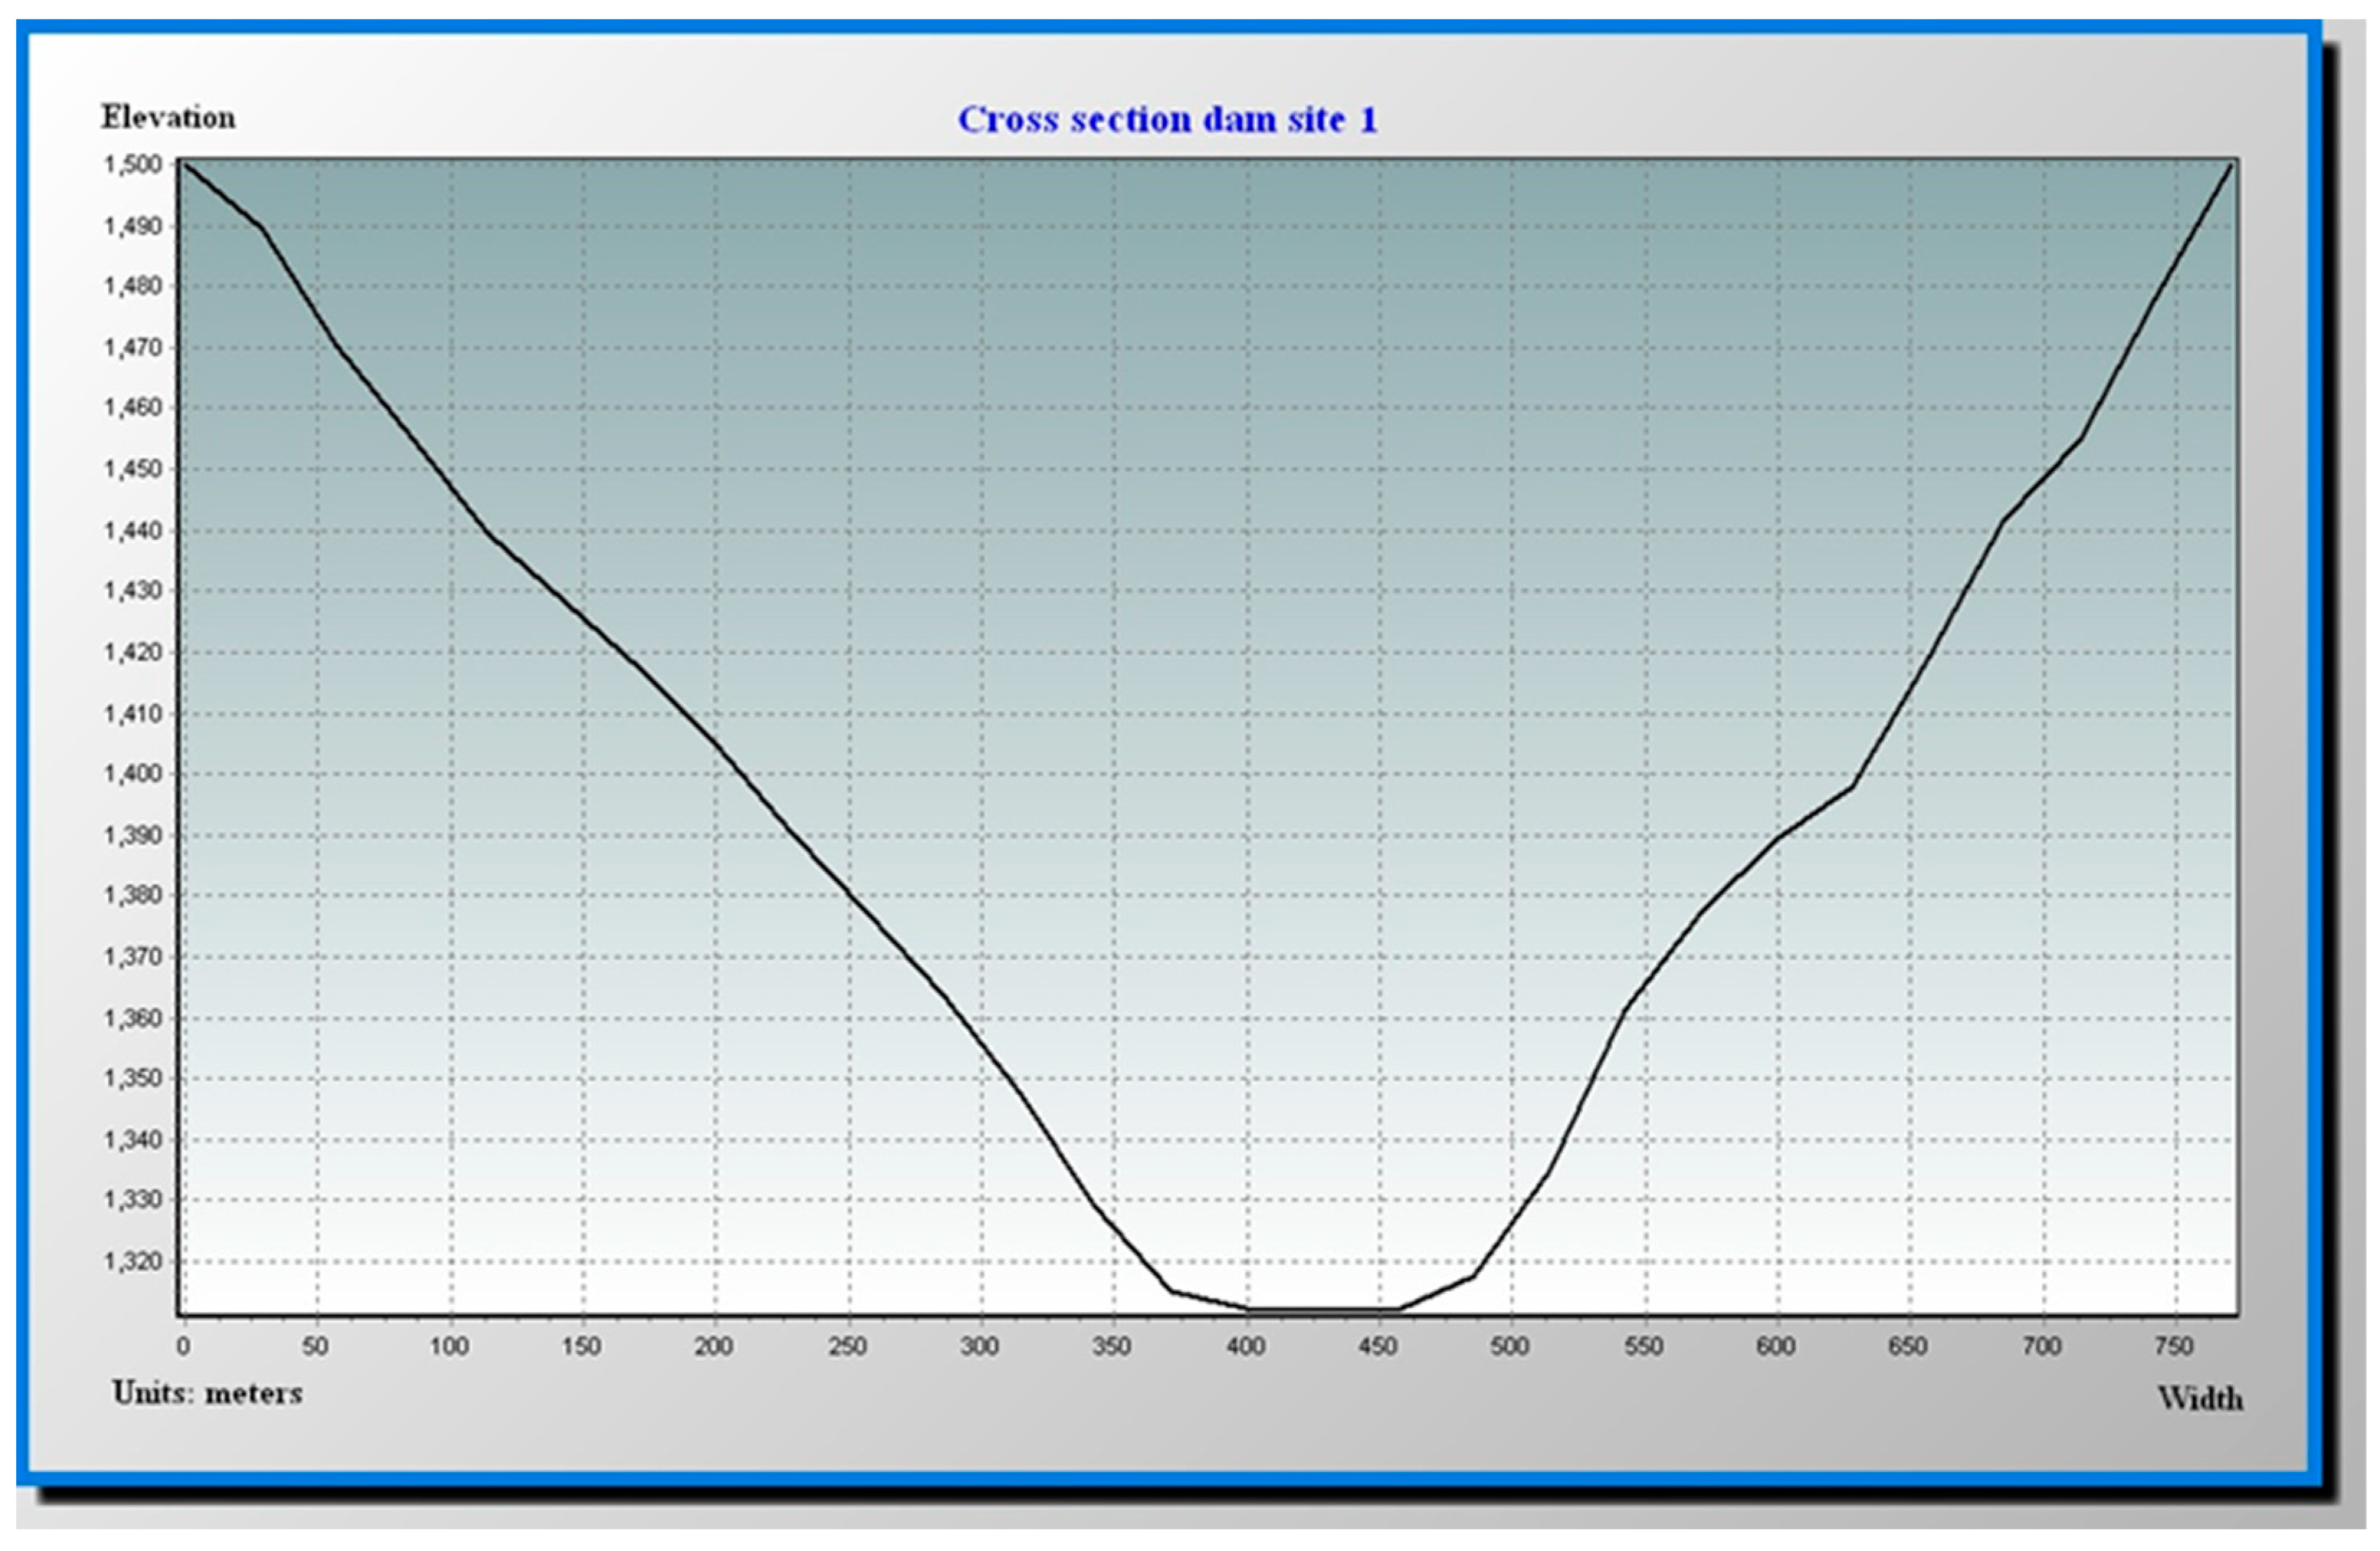
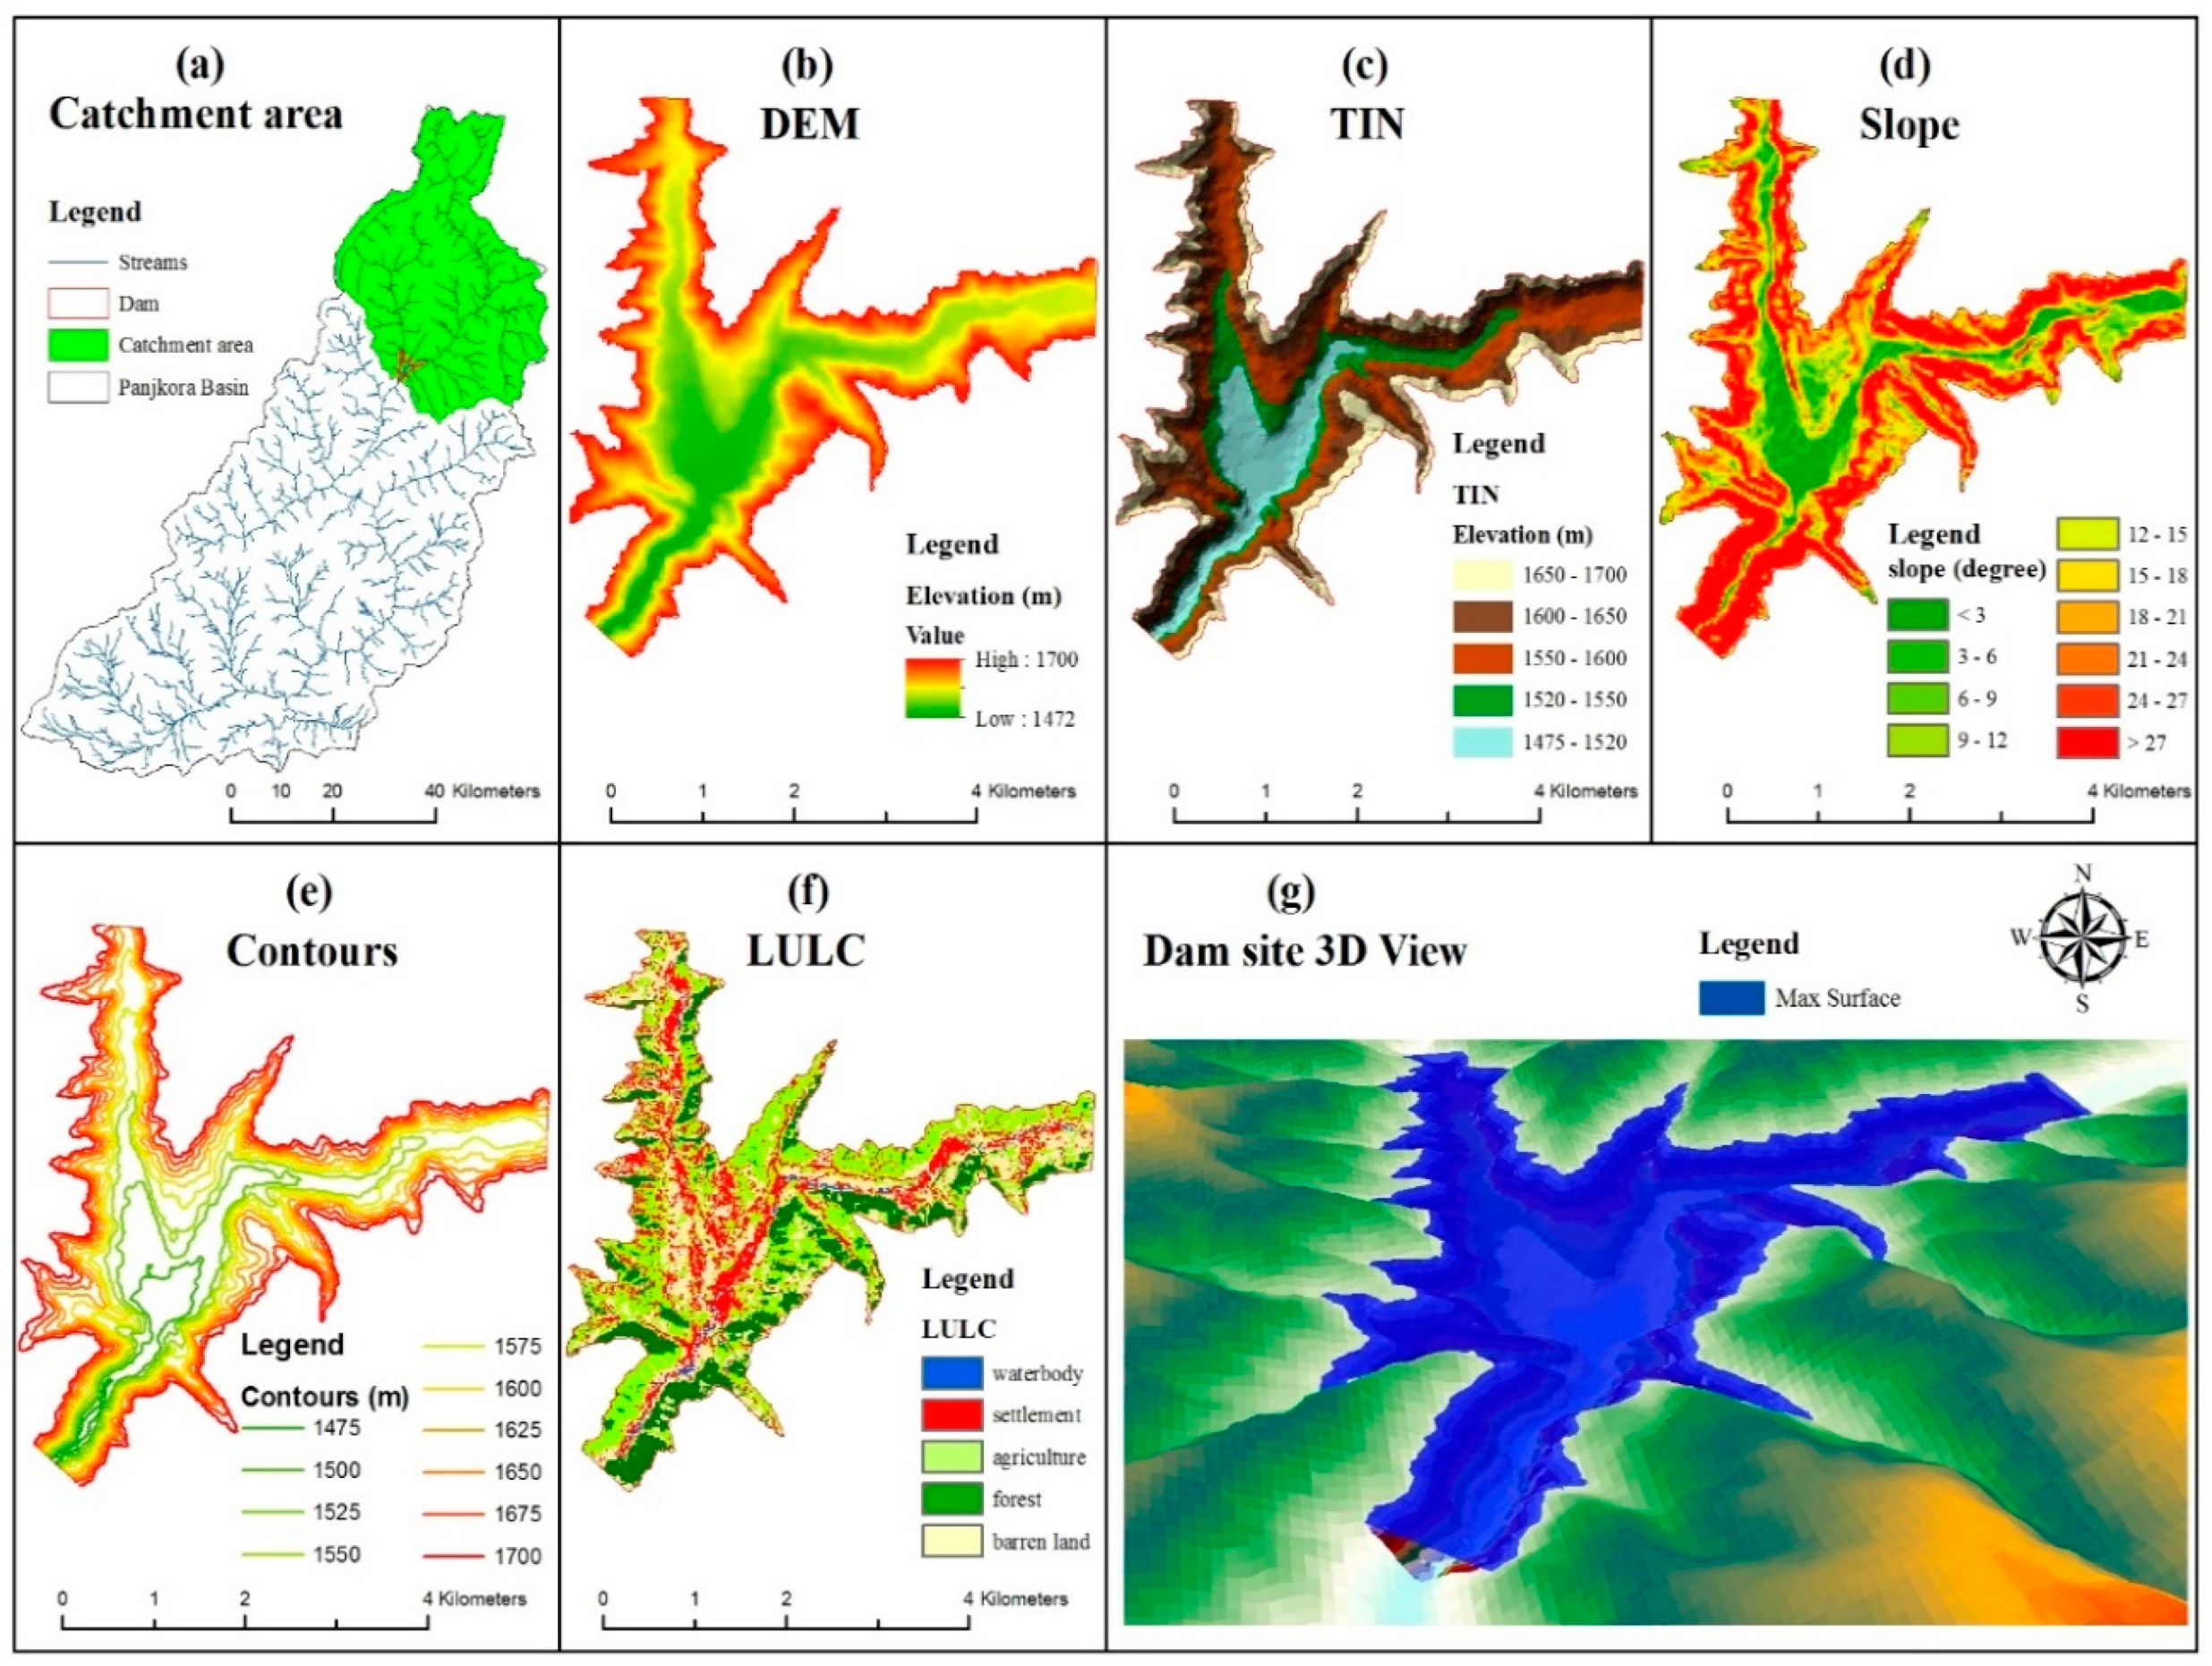
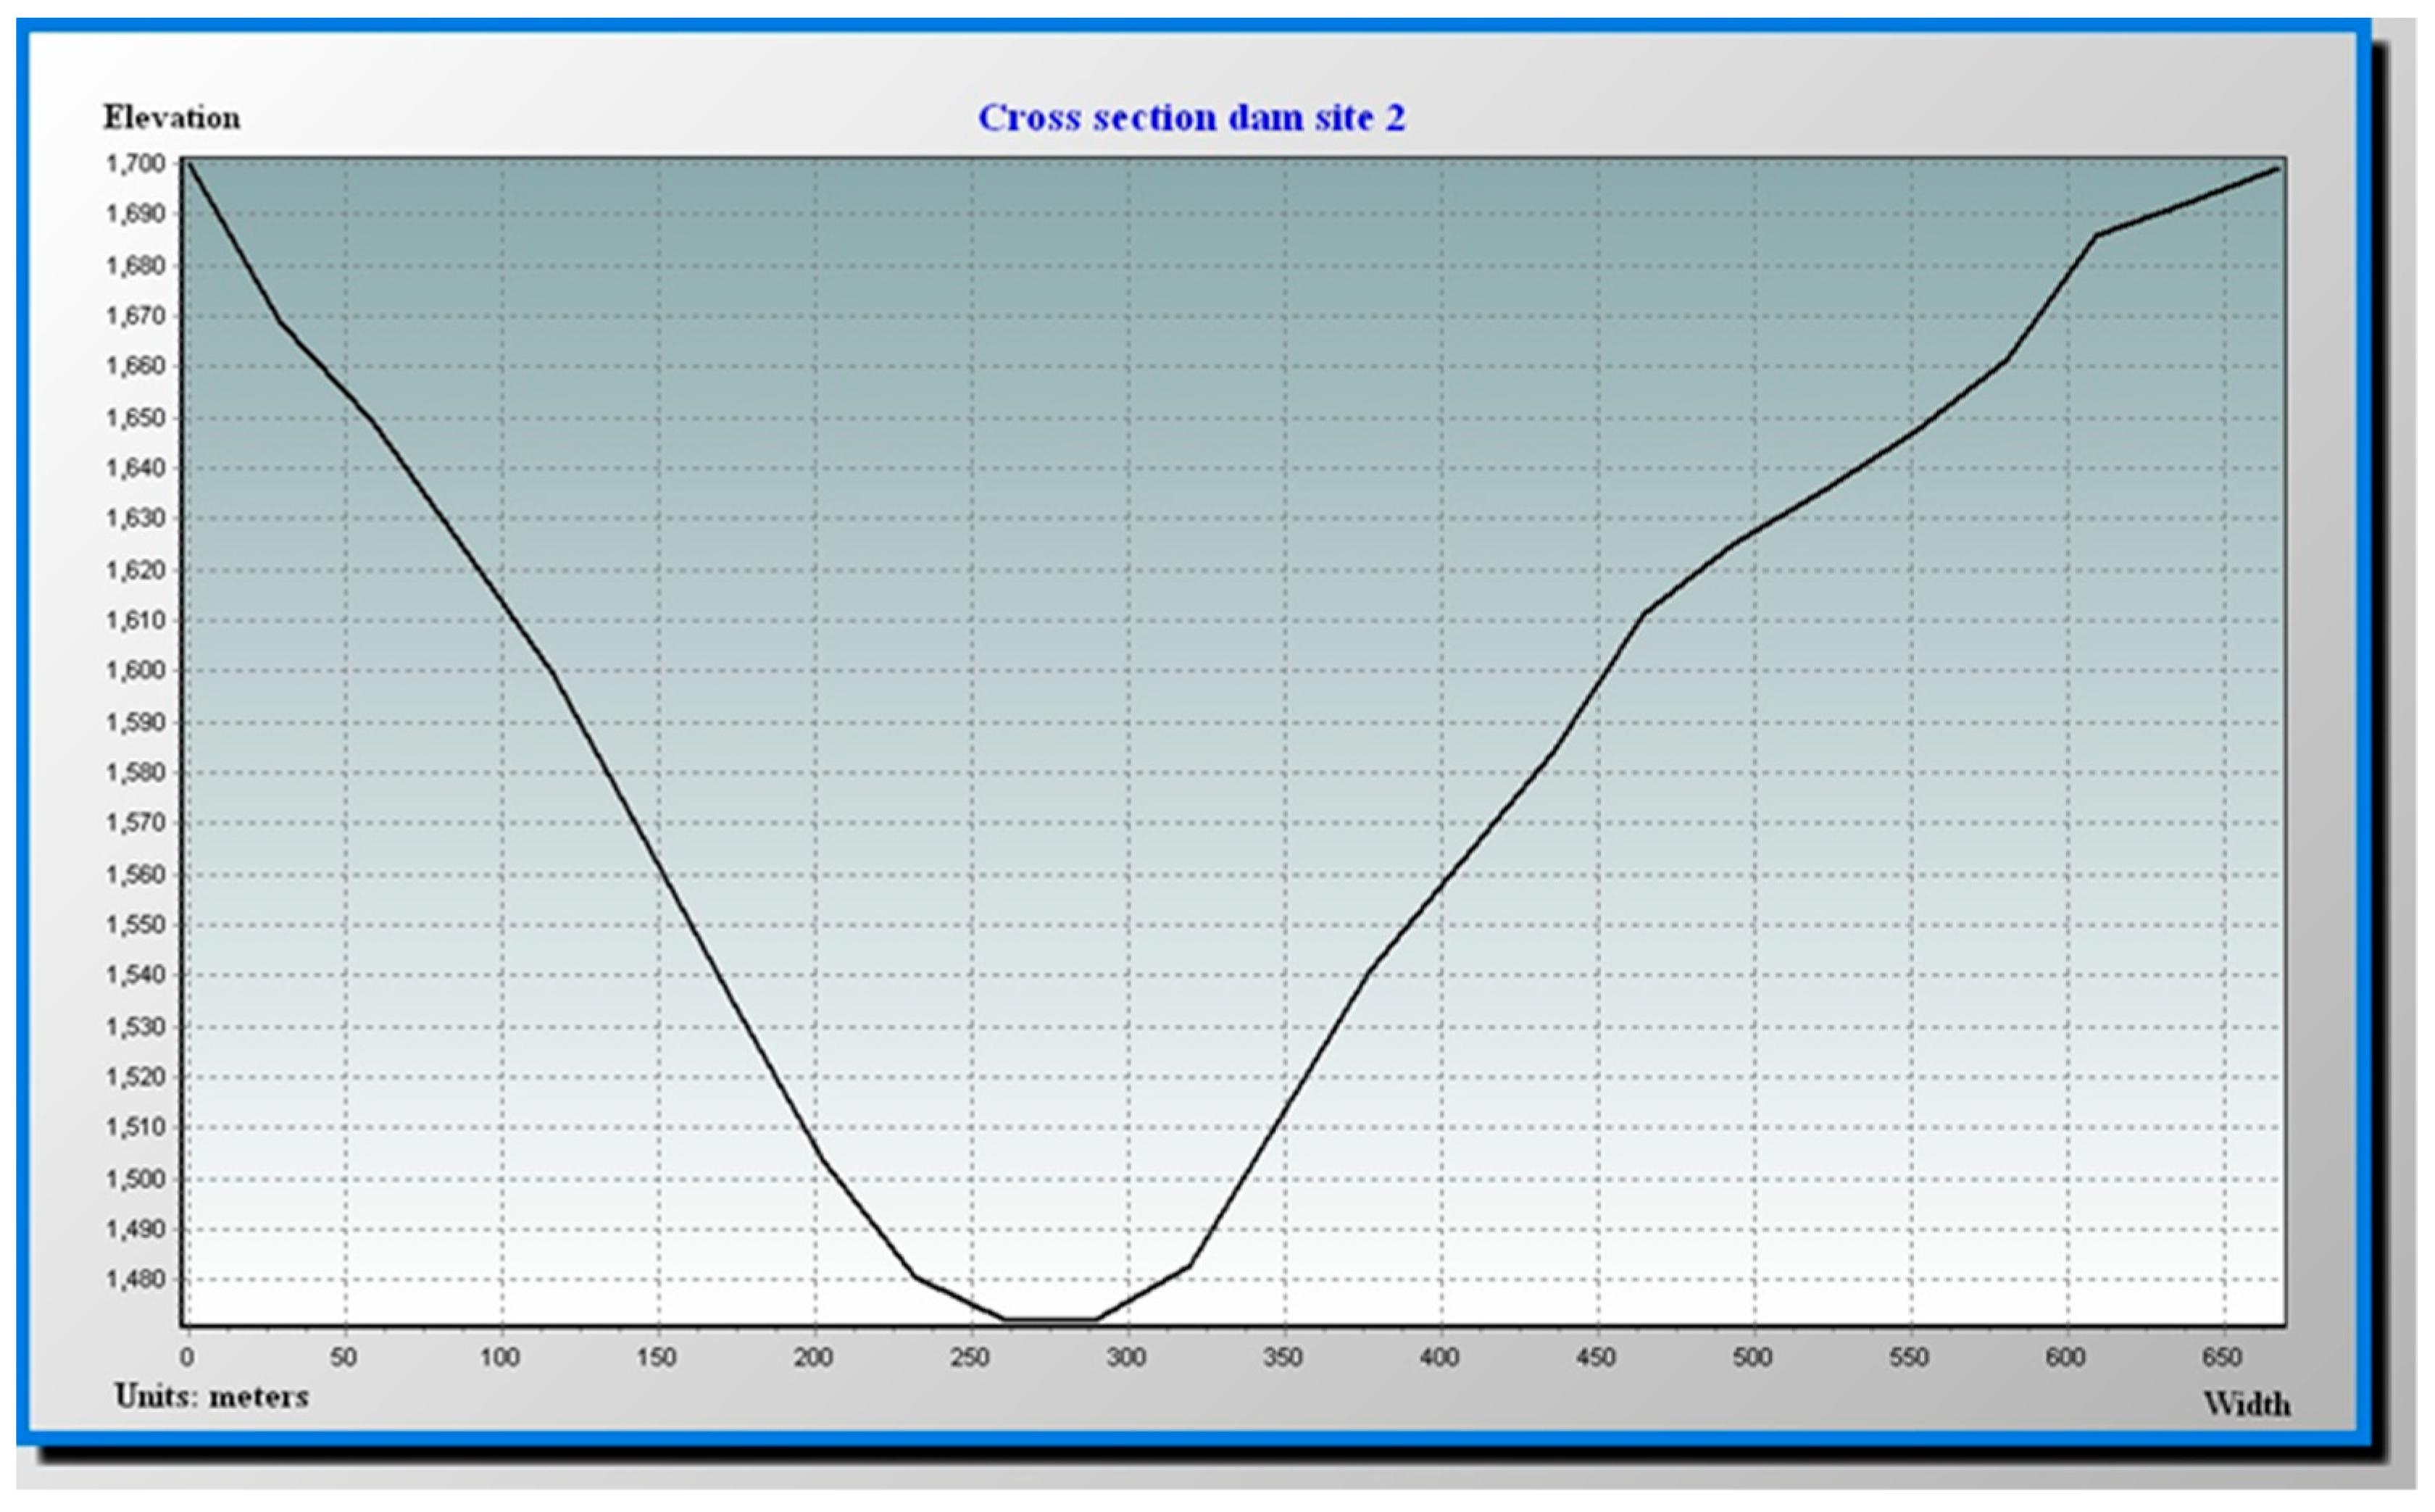
The proposed sites are evaluated based on the parameters listed in Table 7, and their visualized form is shown in figures (Figure 12, Figure 13, Figure 14 and Figure 15). In Table 7, the values of the essential parameters are also shown for both the proposed dam sites. Site 1 is on the stream of the larger highest order (stream order 5), which also has a larger catchment area (Figure 12) as compared to site 2 where the stream order is 4 (Figure 14). Volumetrically, site 2 is more extensive, which is also economically more suitable for constructing the dam wall as a cross-section (Figure 15) showing less width than site 2 (Figure 13). Site 1 lies in the moderate zone of geology, where metasedimentary rock exists (Dir metasediments). Dir metasediments are mostly composed of slates but are strong enough to resist the water from percolation. Site 2 lies in the high zone of geology consisting of volcanic rocks.
4. Discussion
In this study, hydro-meteorological, geological, land cover, and geo-morphometric characteristics are analyzed of the Panjkora River Basin and suitable sites for construction of multi-purpose dams. This study involved the essential parameters for dam suitability analysis and evaluation parameters for evaluating the proposed dam sites. Among the essential parameters of the model, stream order is crucial to ensure enough water availability that can be stored by the dam for many purposes. This study systemized the entire location analysis process by developing the dam suitability stream model (DSSM) by utilizing GIS, RS, and AHP, while enhancing the findings’ accuracy.
The model gave two types of suitability map, which were further analyzed, and we proposed two final dam sites. The proposed dam sites are in the upper reaches that fulfil the multi-purpose. Lower reaches consist of more settlements, e.g., Timergara is the central city in the lower reaches. As every river consists of the population living near the river, which is essential for life, but dam sites can also provide different benefits to the area, e.g., fishing industry, use of water for the marble industry, etc. Moreover, lower reaches are also a high flood hazard zone [38]. In 2010, a destructive flood disaster caused many deaths and economic losses, especially in the lower reaches. Therefore, the construction of these sites will prove to reduce flood disasters. Another advantage is the provision of water in the lower regions for agricultural production. The selection of these sites is considered the dam’s purposes, and all the parameters are analyzed to obtain the best possible area and conditions.
However, some parameters have not been taken into account that can influence the site suitability performance, such as economic performance, site accessibility, etc. The developed technique can be utilized alongside traditional approaches to ascertain new dam construction locations to increase efficiency and save time and resources. Future research can focus on high-resolution DEM, high-resolution satellite and aerial images, and advanced methods such as machine learning and deep learning to retrieve the model’s parameters in order to strengthen the model’s accuracy.
5. Conclusions
A new model DSSM is being proposed in the current study based on integrating GIS, remote sensing, and AHP to spot a feasible site for constructing a multi-purpose dam in the Panjkora Basin, northwest of Pakistan. The selection of sites for multi-purpose dams involves several factors. Therefore, DSSM can utilize all factors combined with streams and their order in an efficient way to solve this problem. DSSM uses AHP to assign weights for each criterion, where the highest weight is given to the most crucial parameter of the DSSM model, named as stream order.
Overlay analysis aggregates all the essential parameters in the form of raster maps with their concern calculated weights that resulted in the suitability maps. The results showed two types of suitability map, i.e., “suitability on stream” and “overall suitability” based on stream order and Euclidean distance (distance from streams), respectively. Each of the maps showed four suitability classes (highly suitable, moderately suitable, less suitable and least suitable). Two sites were proposed based on the first suitability map for multi-purpose dam construction, and each site is evaluated in a GIS environment using evaluation parameters.
The proposed sites are feasibly located where the whole region of the Panjkora river basin will yield multi-benefits such as flood reduction, water for agriculture, fish industry, and hydropower generation. Developing countries like Pakistan badly need such initiatives where an extensive amount of water is being wasted and causes disasters.
For further studies, it is recommended that high-resolution datasets will increase the accuracy of the study. Other parameters with streams and their order can also be included to improve model efficiency, depending on the area and analysis conditions.
Author Contributions
Conceptualization, Z.S., Z.J. and Q.M.Y.; Methodology and software, Z.S., Z.J., Q.M.Y.; Formal analysis, Z.S., Z.J., Q.M.Y.; Hydrological assessment. Z.J., Q.M.Y. and S.M.; Writing—Original draft preparation, Z.J., Q.M.Y.; review and editing, Z.S., A.-u.-R.; S.M.; Supervision, Z.S., A.-u.-R.; All authors have read and agreed to the published version of the manuscript.
Funding
This work was supported by the National Key R&D plan on strategic international scientific and technological innovation cooperation special project under Grant 2016YFE0202300, the National Natural Science Foundation of China under Grants 41771452, 41771454, and 41890820, the Natural Science Fund of Hubei Province in China under Grant 2018CFA007.
Acknowledgments
The authors would like to thanks the anonymous reviewers for their hard work.
Conflicts of Interest
The authors declare no conflict of interest.
References
- Yasser, M.; Jahangir, K.; Mohmmad, A. Earth dam site selection using the analytic hierarchy process (AHP): A case study in the west of Iran. Arab. J. Geosci. 2013, 6, 3417–3426. [Google Scholar] [CrossRef]
- Ledec, G.; Quintero, J.D. Good dams and bad dams: Environmental criteria for site selection of hydroelectric projects. In Latin America and Caribbean Region Sustainable Development Working Paper; No. 16; World Bank Group: Washington, DC, USA, 2003; p. 21. [Google Scholar]
- Ramakrishnan, D.; Bandyopadhyay, A.; Kusuma, K.N. SCS-CN and GIS-based approach for identifying potential water harvesting sites in the Kali Watershed, Mahi River Basin, India. J. Earth Syst. Sci. 2009, 118, 355–368. [Google Scholar] [CrossRef] [Green Version]
- Wen, Z.; Yang, H.; Zhang, C.; Shao, G.; Wu, S. Remotely sensed mid-channel bar dynamics in downstream of the three Gorges Dam, China. Remote Sens. 2020, 12, 409. [Google Scholar] [CrossRef] [Green Version]
- Zhou, Y.; Ma, J.; Zhang, Y.; Li, J.; Feng, L.; Zhang, Y.; Shi, K.; Brookes, J.D.; Jeppesen, E. Influence of the three Gorges Reservoir on the shrinkage of China’s two largest freshwater lakes. Glob. Planet. Chang. 2019, 177, 45–55. [Google Scholar] [CrossRef]
- Niu, R.; Zhang, L.; Shao, Z.; Cheng, Q. Web-based geological hazard monitoring in the three gorges area of China. Photogramm. Eng. Remote Sens. 2007, 73, 709–719. [Google Scholar] [CrossRef]
- Chen, Y.; Hu, R.; Lu, W.; Li, D.; Zhou, C. Modeling coupled processes of non-steady seepage flow and non-linear deformation for a concrete-faced rockfill dam. Comput. Struct. 2011, 89, 1333–1351. [Google Scholar] [CrossRef]
- Araujo, A.S.R.; Ribeiro, M.F.M.; Enzveiler, A.; Schenkel, P.; Fernandes, T.R.G.; Partata, W.A.; Irigoyen, M.C.; Llesuy, S.; Belló-Klein, A. Myocardial antioxidant enzyme activities and concentration and glutathione metabolism in experimental hyperthyroidism. Mol. Cell. Endocrinol. 2006, 249, 133–139. [Google Scholar] [CrossRef]
- Dai, X. Dam Site Selection Using an Integrated Method of AHP and GIS for Decision Making Support in Bortala, Northwest China. Master’s Thesis, Lund University, Lund, Sweden, 2016. [Google Scholar]
- Ali, K.; Bajracharyar, R.M.; Raut, N. Advances and Challenges in Flash Flood Risk Assessment: A Review. J. Geogr. Nat. Disasters 2017, 7. [Google Scholar] [CrossRef] [Green Version]
- Hecht, J.S.; Lacombe, G.; Arias, M.E.; Dang, T.D.; Piman, T. Hydropower dams of the Mekong River basin: A review of their hydrological impacts. J. Hydrol. 2019, 568, 285–300. [Google Scholar] [CrossRef]
- Bizzi, S.; Pianosi, F.; Soncini-Sessa, R. Valuing hydrological alteration in multi-objective water resources management. J. Hydrol. 2012, 472–473, 277–286. [Google Scholar] [CrossRef]
- Iftikhar, S.; Hassan, Z.; Shabbir, R. Site Suitability Analysis for Small Multipurpose Dams Using Geospatial Technologies. J. Remote Sens. GIS 2016, 5. [Google Scholar] [CrossRef]
- Bouman, B.A.M. A conceptual framework for the improvement of crop water productivity at different spatial scales. Agric. Syst. 2007, 93, 43–60. [Google Scholar] [CrossRef]
- Mardani, A.; Jusoh, A.; Nor, K.M.D.; Khalifah, Z.; Zakwan, N.; Valipour, A. Multiple criteria decision-making techniques and their applications—A review of the literature from 2000 to 2014. Econ. Res. Istraz. 2015, 28, 516–571. [Google Scholar] [CrossRef]
- Saaty, T.L. How to make a decision: The analytic hierarchy process. Eur. J. Oper. Res. 1990, 48, 9–26. [Google Scholar] [CrossRef]
- Saaty, T.L. Decision making with the Analytic Hierarchy Process. Sci. Iran. 2002, 9, 215–229. [Google Scholar] [CrossRef] [Green Version]
- Estoque, R.C. Analytic hierarchy process in geo-spatial analysis. In Progress in Geospatial Analysis; Springer: Berlin, Germany, 2012; ISBN 9784431540007. [Google Scholar]
- Padmavathy, A.S.; Ganesha Raj, K.; Yogarajan, N.; Thangavel, P.; Chandrasekhar, M.G. Checkdam site selection using GIS approach. Adv. Sp. Res. 1993, 13, 123–127. [Google Scholar] [CrossRef]
- Salih, S.A.; Al-Tarif, A.S.M. Using of GIS Spatial Analyses to Study the Selected Location for Dam Reservoir on Wadi Al-Jirnaf, West of Shirqat Area, Iraq. J. Geogr. Inf. Syst. 2012, 4, 117–127. [Google Scholar] [CrossRef] [Green Version]
- Yi, C.S.; Lee, J.H.; Shim, M.P. Site location analysis for small hydropower using geo-spatial information system. Renew. Energy 2010, 35, 852–861. [Google Scholar] [CrossRef]
- Larentis, D.G.; Collischonn, W.; Olivera, F.; Tucci, C.E.M. Gis-based procedures for hydropower potential spotting. Energy 2010, 35, 4237–4243. [Google Scholar] [CrossRef]
- Forzieri, G.; Gardenti, M.; Caparrini, F.; Castelli, F. A methodology for the pre-selection of suitable sites for surface and underground small dams in arid areas: A case study in the region of Kidal, Mali. Phys. Chem. Earth 2008, 33, 74–85. [Google Scholar] [CrossRef]
- Saleh Alatawi, E.A. Dam Site Selection Using Remote Sensing Techniques and Geographical Information System to Control Flood Events in Tabuk City. J. Waste Water Treat. Anal. 2015, 6. [Google Scholar] [CrossRef] [Green Version]
- Baban, S.M.J.; Wan-Yusof, K. Modelling optimum sites for locating reservoirs in tropical environments. Water Resour. Manag. 2003, 17, 1–17. [Google Scholar] [CrossRef]
- Bui, Q.B. Locating suitable dam site along the tien yen river, quang ninh province by employing GIS and multi-criteria analysis. In Proceedings of the 31st Asian Conference on Remote Sensing 2010, ACRS 2010, Hanoi, Vietnam, 1–5 November 2010; Volume 1, pp. 358–373. [Google Scholar]
- Jamali, I.A.; Mörtberg, U.; Olofsson, B.; Shafique, M. A Spatial Multi-Criteria Analysis Approach for Locating Suitable Sites for Construction of Subsurface Dams in Northern Pakistan. Water Resour. Manag. 2014, 28, 5157–5174. [Google Scholar] [CrossRef]
- Singh, J.P.; Singh, D.; Litoria, P.K. Selection of suitable sites for water harvesting structures in Soankhad watershed, Punjab using remote sensing and geographical information system (RS&GIS) approach—A case study. J. Indian Soc. Remote Sens. 2009, 37, 21–35. [Google Scholar] [CrossRef]
- Auden, J.B.; Dichter, D. The North-West Frontier of West Pakistan: A Study in Regional Geography; Clarendon Press: Oxford, UK, 1969; Volume 135, p. 94. [Google Scholar]
- Mahmood, S.; Khan, A.u.H.; Mayo, S.M. Exploring underlying causes and assessing damages of 2010 flash flood in the upper zone of Panjkora River. Nat. Hazards 2016, 83, 1213–1227. [Google Scholar] [CrossRef]
- Mahmood, S.; Khan, A.u.H.; Ullah, S. Assessment of 2010 flash flood causes and associated damages in Dir Valley, Khyber Pakhtunkhwa Pakistan. Int. J. Disaster Risk Reduct. 2016, 16, 215–223. [Google Scholar] [CrossRef]
- Khan, A.; Richards, K.S.; Parker, G.T.; McRobie, A.; Mukhopadhyay, B. How large is the Upper Indus Basin? The pitfalls of auto-delineation using DEMs. J. Hydrol. 2014, 509, 442–453. [Google Scholar] [CrossRef]
- Strahler, A.N. Quantitative analysis of watershed geomorphology. Eos Trans. Am. Geophys. Union 1957, 38, 913–920. [Google Scholar] [CrossRef] [Green Version]
- Lashkaripour, G.R.; Ghafoori, M. The engineering geology of the Tabarak Abad Dam. Eng. Geol. 2002, 66, 233–239. [Google Scholar] [CrossRef] [Green Version]
- Tang, D.; Li, D.Q.; Cao, Z.J. Slope stability analysis in the Three Gorges Reservoir Area considering effect of antecedent rainfall. Georisk 2017, 11, 161–172. [Google Scholar] [CrossRef]
- Saaty, T.L. The Analytical Hierarchy Process: Planning, Priority Setting, Resource Allocation; MacGraw-Hill Co.: New York, NY, USA, 1980. [Google Scholar]
- Saaty, T.L. Group Decision Making and the AHP. In The Analytic Hierarchy Process; Springer: Berlin/Heidelberg, Germany, 1989. [Google Scholar]
- Mahmood, S.; Rahman, A.u. Flash flood susceptibility modeling using geo-morphometric and hydrological approaches in Panjkora Basin, Eastern Hindu Kush, Pakistan. Environ. Earth Sci. 2019, 78. [Google Scholar] [CrossRef]
Figure 1.
Location map of the study area.

Figure 2.
Work flow of this study.

Figure 3.
Essential parameters: (a) stream order (b) slope (c) elevation (d) land use and land cover (LULC) (e) geology.
Figure 3.
Essential parameters: (a) stream order (b) slope (c) elevation (d) land use and land cover (LULC) (e) geology.

Figure 4.
Reciprocal parameter of stream order or Euclidean distance (a) distance from the streams (b) reclassified raster layer.
Figure 4.
Reciprocal parameter of stream order or Euclidean distance (a) distance from the streams (b) reclassified raster layer.

Figure 5.
Reclassified layers: (a) stream order (b) slope (c) elevation (d) LULC (e) geology.

Figure 6.
Average monthly precipitation (1981–2010) at Dir Met station.

Figure 7.
Average monthly precipitation at the Timergara met station.

Figure 8.
Highest discharge recorded at Talash gauging station in cubic meter per second.

Figure 9.
Analytic hierarchy process (AHP) as weighting method.

Figure 10.
Suitability maps: (a) suitability on stream (b) overall suitability.

Figure 11.
Proposed dam sites (a) dam sites with suitability on stream (b) dam sites with overall suitability.
Figure 11.
Proposed dam sites (a) dam sites with suitability on stream (b) dam sites with overall suitability.

Figure 12.
Evaluation parameters for Dam site 1: (a) catchment area (b) elevation (c) triangulated irregular network (TIN) (d) slope (e) contours (f) LULC (g) 3D view.
Figure 12.
Evaluation parameters for Dam site 1: (a) catchment area (b) elevation (c) triangulated irregular network (TIN) (d) slope (e) contours (f) LULC (g) 3D view.

Figure 13.
Cross-section area of Dam site 1.

Figure 14.
Evaluation parameters for Dam site 2: (a) catchment area (b) elevation (c) TIN (d) slope (e) contours (f) LULC (g) 3D view.
Figure 14.
Evaluation parameters for Dam site 2: (a) catchment area (b) elevation (c) TIN (d) slope (e) contours (f) LULC (g) 3D view.

Figure 15.
Cross-section area of Dam site 2.


Table 1.
Reclassified layers and their preference value.
| S.No | Criteria | Classes | Preference Value | Suitability |
|---|---|---|---|---|
| 1 | Stream order | 1st order | O | Restricted (Least) |
| 2nd order | ||||
| 3rd order | 1 | Less | ||
| 4th order | 3 | Moderate | ||
| 5th order | 5 | High | ||
| Euclidean distance or Buffered streams (m) | <500 | 5 | High | |
| 500–1000 | 3 | Moderate | ||
| 1000–1500 | 1 | Less | ||
| 1500–3000 | 0 | Restricted (Least) | ||
| >3000 | ||||
| 2 | Slope (degree) | <8 | 5 | High |
| 8–15 | 3 | Moderate | ||
| 15–30 | 1 | Less | ||
| 30–45 | 0 | Restricted (Least) | ||
| 45> | ||||
| 3 | Digital Elevation Model (m) | 1000–2000 | 5 | High |
| 2000–3000 | 3 | Moderate | ||
| 3000–4000 | 1 | Less | ||
| <1000 | 0 | Restricted (Least) | ||
| 4000> | ||||
| 4 | Land cover | Agriculture | 0 | Restricted (Least) |
| Settlement | ||||
| Forest | 1 | Less | ||
| Waterbody | 3 | Moderate | ||
| Barren land | 5 | High | ||
| 5 | Geology | Quaternary Alluvium | 1 | Less |
| Utror Volcanics | 3 | Moderate | ||
| Dir met sediments | ||||
| Kashala and Marghuzar | ||||
| Peshmal schist | ||||
| Kohistan batholith | 5 | High | ||
| Kamila amphibolite | ||||
| Chilas complex | ||||
| Swat and Mansehra | ||||
| Shao | ||||
| Indus suture melange |
Table 2.
Saaty’s pairwise comparison scale.
| Intensity of Importance/Judgments | Numeric Value |
|---|---|
| Equal importance | 1 |
| Equal to moderate importance | 2 |
| Moderate importance | 3 |
| Moderate to strong importance | 4 |
| Strong importance | 5 |
| Strong to very strong importance | 6 |
| Very strong importance | 7 |
| Very strong to extremely strong importance | 8 |
| Extreme importance | 9 |
Source [36].
Table 3.
Pairwise comparison matrix with intensity judgments (preference matrix).
| Criteria | Stream Order | Slope | DEM | Land Use | Geology |
|---|---|---|---|---|---|
| Stream order | 1 | 3 | 2 | 3 | 4 |
| Slope | 1/3 | 1 | 2 | 3 | 5 |
| DEM | 1/2 | 1/2 | 1 | 2 | 3 |
| Land use | 1/3 | 1/3 | 1/2 | 1 | 2 |
| Geology | 1/4 | 1/5 | 1/3 | 1/2 | 1 |
| Sum of all | 2.416 | 5.033 | 5.833 | 9.5 | 15 |
Each entity’s division by the total sum of their column in the preference matrix gave the normalized matrix (Table 4). Where the weights calculated using formulas given as. Average = (sum of each row)/5. Weights used in overlay analysis = (average) × 100.
Table 4.
Normalized matrix.
| Criteria | Stream Order | Slope | DEM | Land Cover | Geology | Average | Weight |
|---|---|---|---|---|---|---|---|
| Stream order | 0.413 | 0.596 | 0.342 | 0.316 | 0.267 | 0.39 | 39 |
| Slope | 0.138 | 0.199 | 0.342 | 0.316 | 0.333 | 0.27 | 27 |
| DEM | 0.206 | 0.099 | 0.171 | 0.210 | 0.2 | 0.18 | 18 |
| Land cover | 0.138 | 0.066 | 0.086 | 0.105 | 0.133 | 0.10 | 10 |
| Geology | 0.113 | 0.093 | 0.056 | 0.052 | 0.067 | 0.06 | 6 |
Table 5.
Consistency indices for a randomly generated matrix.
| Number of Criteria (n) | 2 | 3 | 4 | 5 | 6 | 7 | 8 |
|---|---|---|---|---|---|---|---|
| RI | 0 | 0.52 | 0.9 | 1.12 | 1.24 | 1.32 | 1.41 |
Table 6.
Calculation of consistency index (CI).
| Column Wise Sum of Criteria | Criteria Average | Product of Both Columns |
|---|---|---|
| 2.416 | 0.39 | 0.94 |
| 5.033 | 0.27 | 1.35 |
| 5.833 | 0.18 | 1.04 |
| 9.5 | 0.10 | 0.95 |
| 15 | 0.06 | 0.9 |
| λmax = 5.18 |
Table 7.
Evaluation and essential parameters of dam sites.
| S.No | Evaluation Parameters | Dam 1 | Dam 2 | Essential Parameters | Dam 1 | Dam 2 | |
|---|---|---|---|---|---|---|---|
| 1 | 3D Surface area (m2) | 8,186,840.85 | 12,589,480.68 | LULC in % | Barren | 23.74 | 25.90 |
| 2 | 2D surface area (m2) | 7,468,419.79 | 11,132,673.38 | Agriculture | 46.25 | 35.75 | |
| 3 | Max volume (m3) | 572,532,394.56 | 1,127,977,779.13 | Forest | 13.53 | 18.88 | |
| 4 | Elevation of base (m) | 1312–1428 | 1472–1570 | Settlement | 15.24 | 18.52 | |
| 5 | Elevation of surface (m) | 1500 | 1700 | Water | 1.24 | 0.95 | |
| 6 | Dam height (m) | 188 | 228 | Stream order | 5 | 4 | |
| 7 | Dam width (m) | 750 | 650 | Slope (degree) | <15 | <15 | |
| 8 | Catchment area (km) | 1742.06 | 1451.6 | Average elevation (m) | 1423 | 1598 | |
| 9 | Contour closeness | High | Very high | Geological stability | Between moderate and high | High | |
Publisher’s Note: MDPI stays neutral with regard to jurisdictional claims in published maps and institutional affiliations. |
© 2020 by the authors. Licensee MDPI, Basel, Switzerland. This article is an open access article distributed under the terms and conditions of the Creative Commons Attribution (CC BY) license (http://creativecommons.org/licenses/by/4.0/).
Share and Cite
MDPI and ACS Style
Shao, Z.; Jahangir, Z.; Muhammad Yasir, Q.; Atta-ur-Rahman; Mahmood, S. Identification of Potential Sites for a Multi-Purpose Dam Using a Dam Suitability Stream Model. Water 2020, 12, 3249. https://doi.org/10.3390/w12113249
AMA Style
Shao Z, Jahangir Z, Muhammad Yasir Q, Atta-ur-Rahman, Mahmood S. Identification of Potential Sites for a Multi-Purpose Dam Using a Dam Suitability Stream Model. Water. 2020; 12(11):3249. https://doi.org/10.3390/w12113249
Chicago/Turabian StyleShao, Zhenfeng, Zahid Jahangir, Qazi Muhammad Yasir, Atta-ur-Rahman, and Shakeel Mahmood. 2020. "Identification of Potential Sites for a Multi-Purpose Dam Using a Dam Suitability Stream Model" Water 12, no. 11: 3249. https://doi.org/10.3390/w12113249
Note that from the first issue of 2016, this journal uses article numbers instead of page numbers. See further details here.