Numerical Investigation of Multiple-Impact Behavior of Granular Flow on a Rigid Barrier


1
Department of Geotechnical Engineering, College of Civil Engineering, Tongji University, Shanghai 200092, China
2
Key Laboratory of Geotechnical and Underground Engineering of the Ministry of Education, Tongji University, Shanghai 200092, China
3
College of Surveying and Geo—Informatics, Tongji University, Shanghai 200092, China
4
Department of Civil Engineering, School of Mechanics and Engineering Science, Shanghai University, Shanghai 200444, China
*
Author to whom correspondence should be addressed.
Water 2020, 12(11), 3228; https://doi.org/10.3390/w12113228
Submission received: 8 October 2020
/
Revised: 5 November 2020
/
Accepted: 11 November 2020
/
Published: 18 November 2020
(This article belongs to the Section Hydrology)
Abstract
:The debris–barrier interaction issue has gained considerable attention among the engineering community, but most researches have only focused on the single-surge impact condition, with the multiple-surge impact mechanism still lacking clarity. However, multiple-surge impact is more typical in the field. Thus, we conduct some numerical simulations based on the discrete element method (DEM) and present a series of results that provide preliminary insights into the multiple-surge impact mechanism. The DEM model is firstly calibrated using physical experimental results and then used to investigate the flow kinematics, impact dynamics and energy evolution of the successive impact process. The results indicate that compared with single-surge conditions, the barrier is safer under multiple-surge impact as the deposition spreading distance is extended by 6–20% and the impact force is reduced by 6–30%. The dead zone formed by the previous surge behaves as a cushioning layer and a medium for momentum transfer. Three mechanisms of energy dissipation during surge–dead-zone interactions were identified: friction and penetration at the interaction face between the surge and dead zone, inelastic deformation of the dead zone, and inter-particle interaction within the surge. Each component was analyzed, which shows that inter-particle collision friction accounts for over 60% of the total energy loss during surge–dead-zone interaction. In addition, the performance of granular jump theory in predicting the multiple-surge impact force is assessed, and some possible modifications are proposed. Finally, some engineering implications from the presented numerical results are discussed.
1. Introduction
Strengthening the impact resistance of structures to withstand rapid granular flows is of concern to design engineers aiming to prevent the harmful effects of landslide disasters [1,2]. Various types of mitigation structures have been designed to reduce the destructive power of such disasters, for example, check dams, flexible barriers, baffle arrays and slit dams [3,4,5,6,7,8,9,10]. The design of impact-resisting structures relies on good knowledge of the debris–barrier interaction; however, our understanding of this mechanism is still lacking [11,12,13,14,15,16,17].
In nature, granular flows occur where loose overlying deposits are disturbed, and, in specific conditions, multiple small flow events may occur within a short time period [7]. When a flow reaches a barrier and overflows, some of the flow material will be captured behind the barrier at the final stage. Often, before the deposited material is swept away, another flow surge may reach the barrier, creating a multiple-surge impact event. Although such events are common, current research focuses on single-surge impact [4,5,10,13,17,18,19,20]. Only several authors have addressed this issue. Albaba et al. [21] simulated two surges of granular flow impacting on a flexible barrier and observed that the peak impact force decreased by 25% when compared with the force exerted by a single surge with the same total mass. Using a large-scale model test, Tan et al. [7] investigated the dynamic response of a flexible barrier under the impact of three surges of debris flow, and concluded that the retaining capacity of the barrier deteriorated under multiple-surge impact. However, these studies have not elucidated the instinct mechanism during multiple-surge impact process. In addition, impact force estimation models also largely cover single-surge impact, such as hydraulic models [22], with the multiple-impact model seldomly being solved. As a result, it is urgent to investigate the mechanism and explore a reliable force estimation model of multiple-surge impact.
The most challenging aspect of force estimation under the multiple-surge impact condition is the consideration of the dead zone, which is the static material deposited behind the barrier after impact. During debris–barrier interaction, the dead zone helps to dissipate the kinematic energy of the subsequent flow, which results in a lower impact force on the barrier [13,23]. Faug et al. [19] studied the length of the dead zone, which is important for defense structure design. Song et al. [6] also highlighted the importance of the dead zone in energy dissipation during interaction. However, these studies have not thoroughly provided quantitative analysis. Under multiple-surge impact, the interaction between the dead zone and subsequent surges is important, because the dead zone can serve as a cushioning layer. In engineering practice, granular layers are often used to protect structures from impact loading, providing added reinforcement, for example, in rock sheds [18,24] and rigid barriers [25]. Therefore, it is also important to examine the cushioning effect of the dead zone during multiple-surge impact, which is not well covered in the literature, because it may offer some engineering implications.
In order to fill the gaps identified above, we calibrate a numerical model based on the discrete element method (DEM) using physical experimental results. This model is further used to investigate the multiple-surge impact process of granular flow on a rigid barrier. Specifically, the impact mechanism and the cushioning effect of the dead zone were quantitatively analyzed, and the evolution of the force impacting the barrier was investigated and discussed. Additionally, the possible solutions for multiple-surge impact force estimation are also discussed. Our results may provide useful information for better design of rigid barriers in the field.
2. Materials and Methods
For decades, researchers have developed various numerical methods to simulate flow-type landslides, such as rock avalanches and debris flow [26]. Among these methods, the DEM has advantages over the continuum mechanics method [3,27] in modeling granular flows, as it can well address the discrete nature of such flows. The DEM is also widely used to investigate debris–barrier interaction [9,28] because it provides micro-scale information that cannot be obtained in physical modelling [29]. Based on this information, we can determine the relation between the micro-mechanism and macro-behavior [5,17,24].
In DEM simulation, the granular flow is represented by an assembly of spherical or non-spherical particles, and the single-particle motion (translation and rotation) is governed by Newton’s second law of motion. By calculating the contact force between the particles and solving Newton’s second law of motion, the particles’ position and velocity can be obtained step by step, providing a reliable model of the granular flow movement, impact and deposition.
In our study, we adopt a commercial software named EDEM to conduct simulations, in which the micro-contact force could be calculated by the Hertz–Mindlin (no-slip) contact model for its computational efficiency. The model calculates the normal force () by Hertz’s theory and the tangential force () by Mindlin’s no-slip model:
here, the subscript n is the normal direction, and t is the tangential direction; K denotes the elastic stiffness constant, and D is the damping coefficient; u represents the overlapping or relative displacement between two particles in contact; is the relative velocity; and is the coefficient of the Coulomb friction. Equation (2) shows that the tangential force is limited by Coulomb’s law of friction and accounts for the gross sliding movement between two particles in contact. A rolling torque is adopted to address the rolling friction, expressed as:
where is the rolling friction, is the distance between the contact point and the center of mass, and is the unit angular velocity of the particle at the contact point.
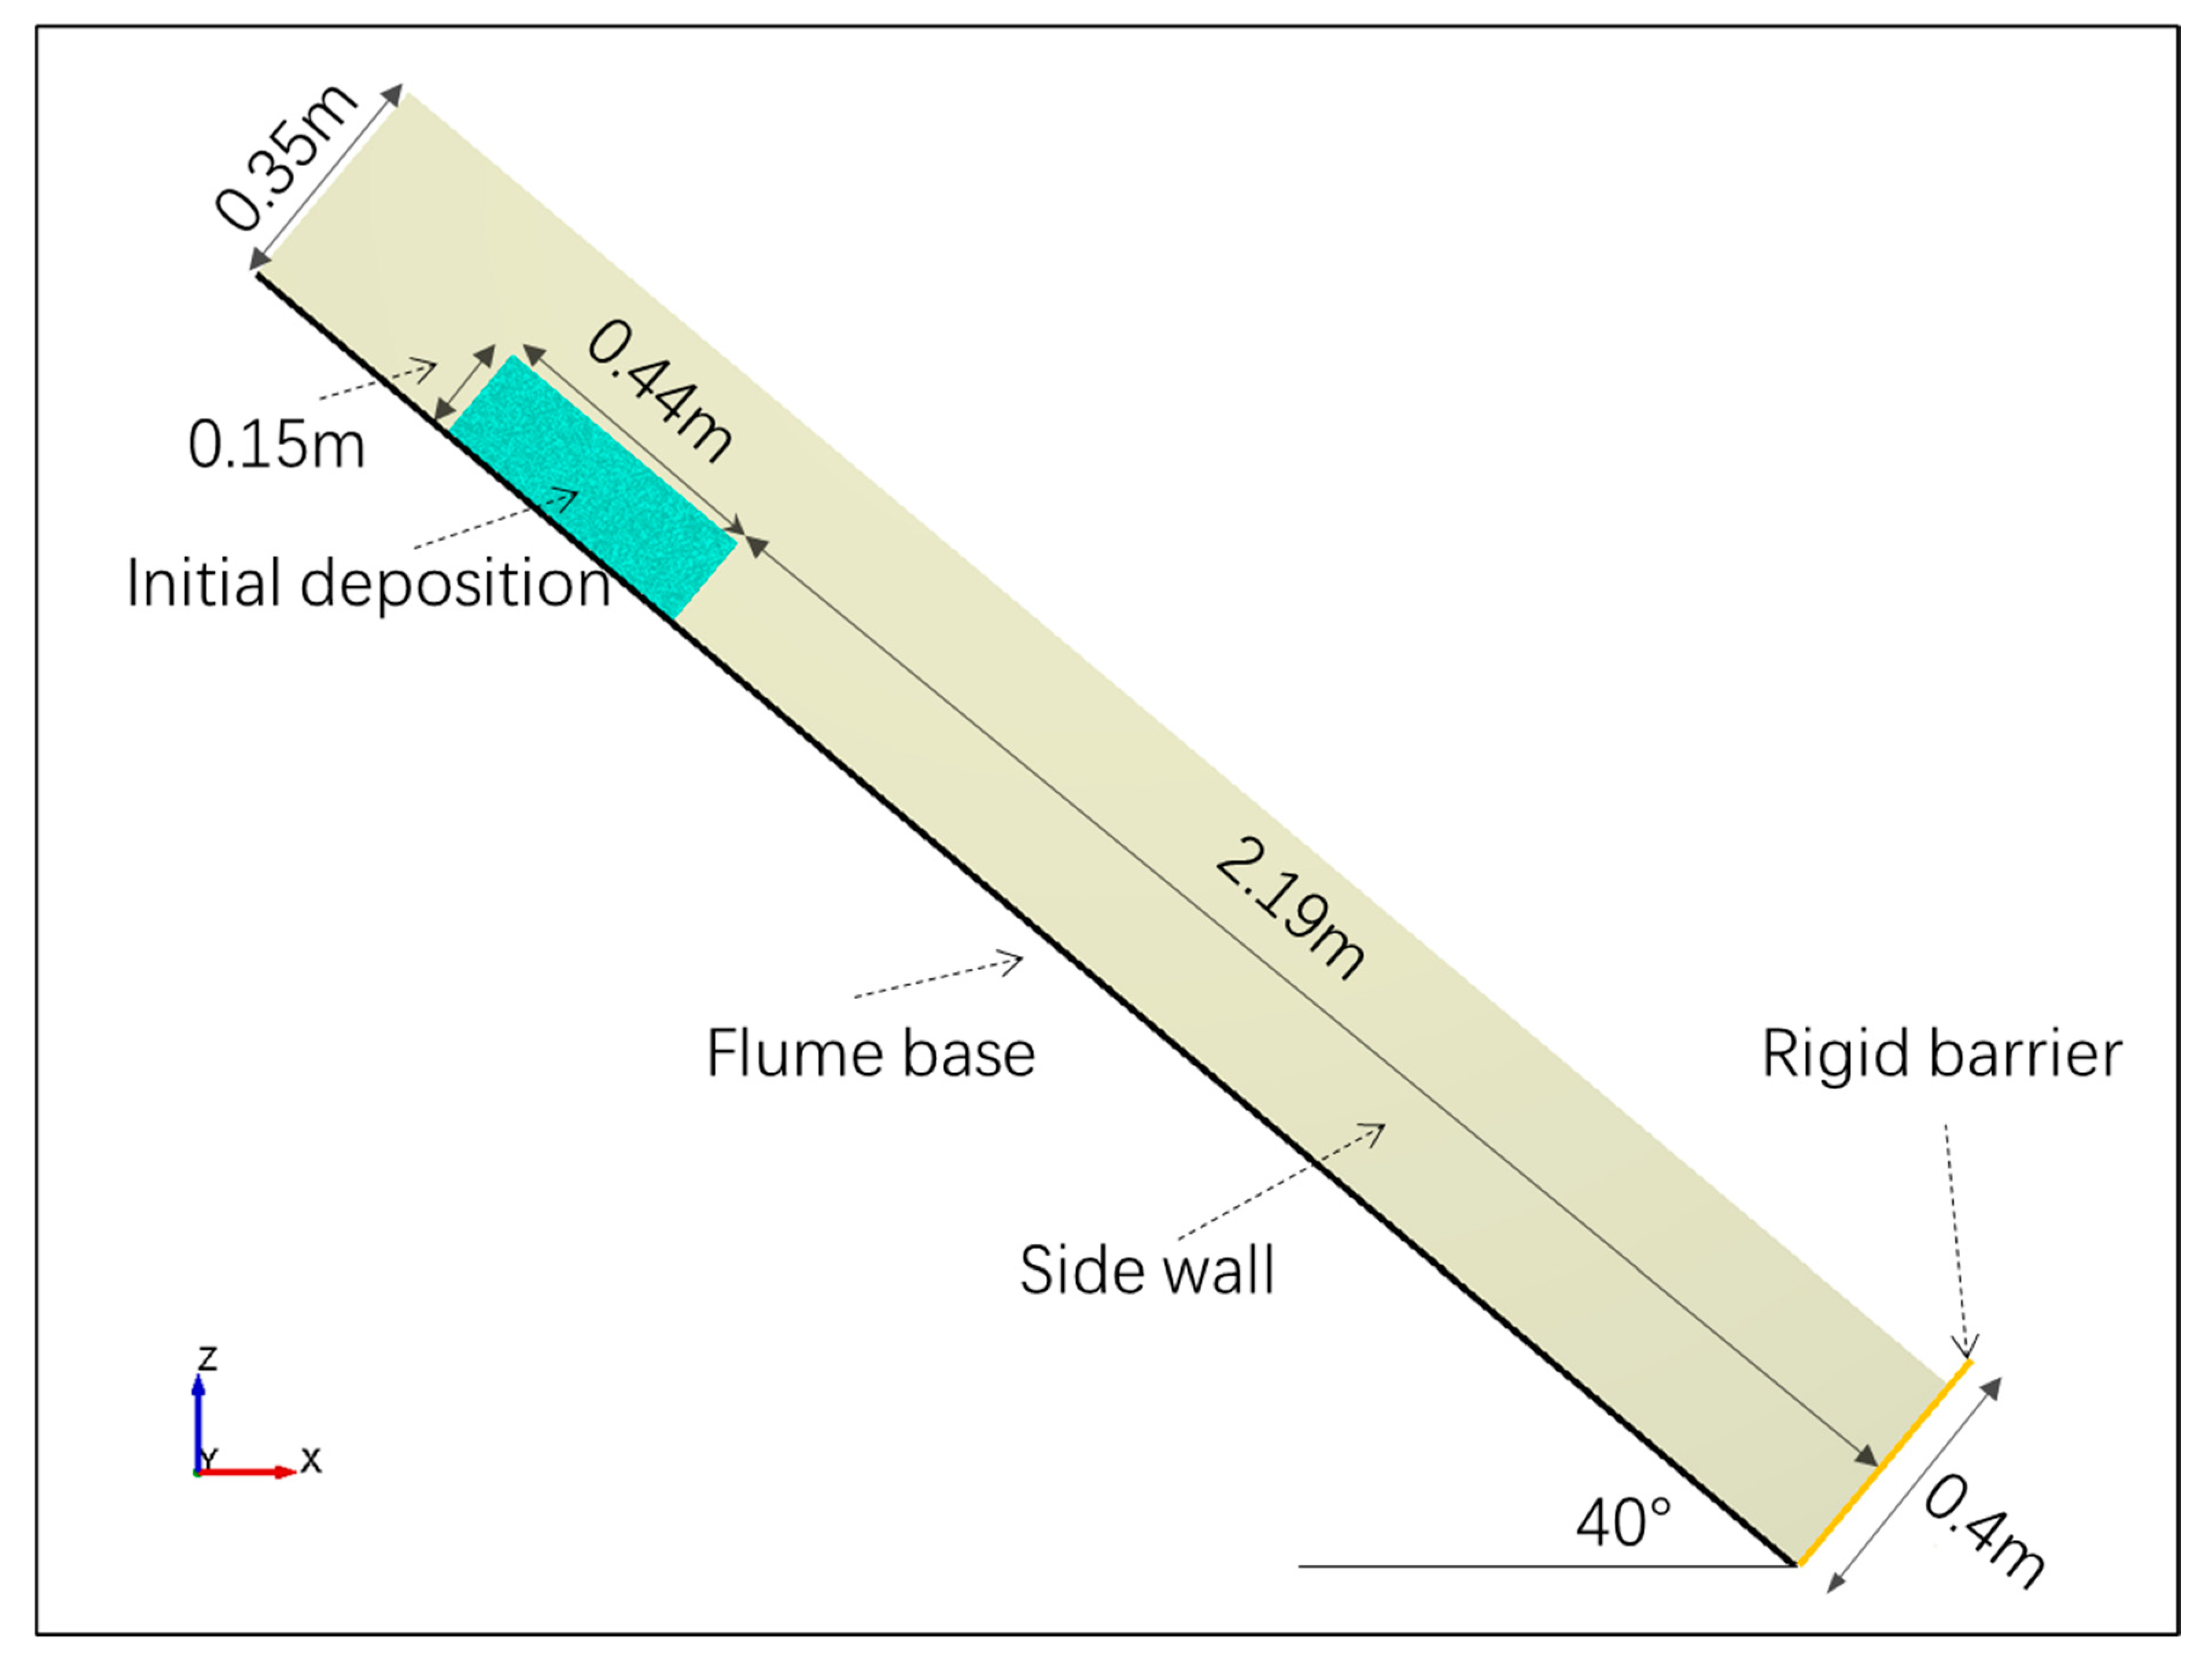
The numerical model (Figure 1) is based on the physical test conducted by Jiang and Towhata [14]. The flume is inclined at 40°, and a 0.4 m-high rigid barrier is set at the end of the flume, perpendicular to the flume base. The flume sidewall is 0.35 m high and 0.3 m wide, and the total flume length is 2.19 m. Initially, we used spherical particles with a particle diameter of 10–20 mm to model the granular soil, forming a rectangular deposition body, 0.15 m high, 0.44 m long and 0.3 m wide. The total mass of the particles is 27 kg, and the bulk density of the initial disposition body is 13.6 kN/m3, similar to that in the experiment of Jiang and Towhata [14]. The flume and barrier were represented in the model by a wall element. The DEM input parameters are listed in Table 1, which are obtained by experimental measurement and calibration or from other studies.
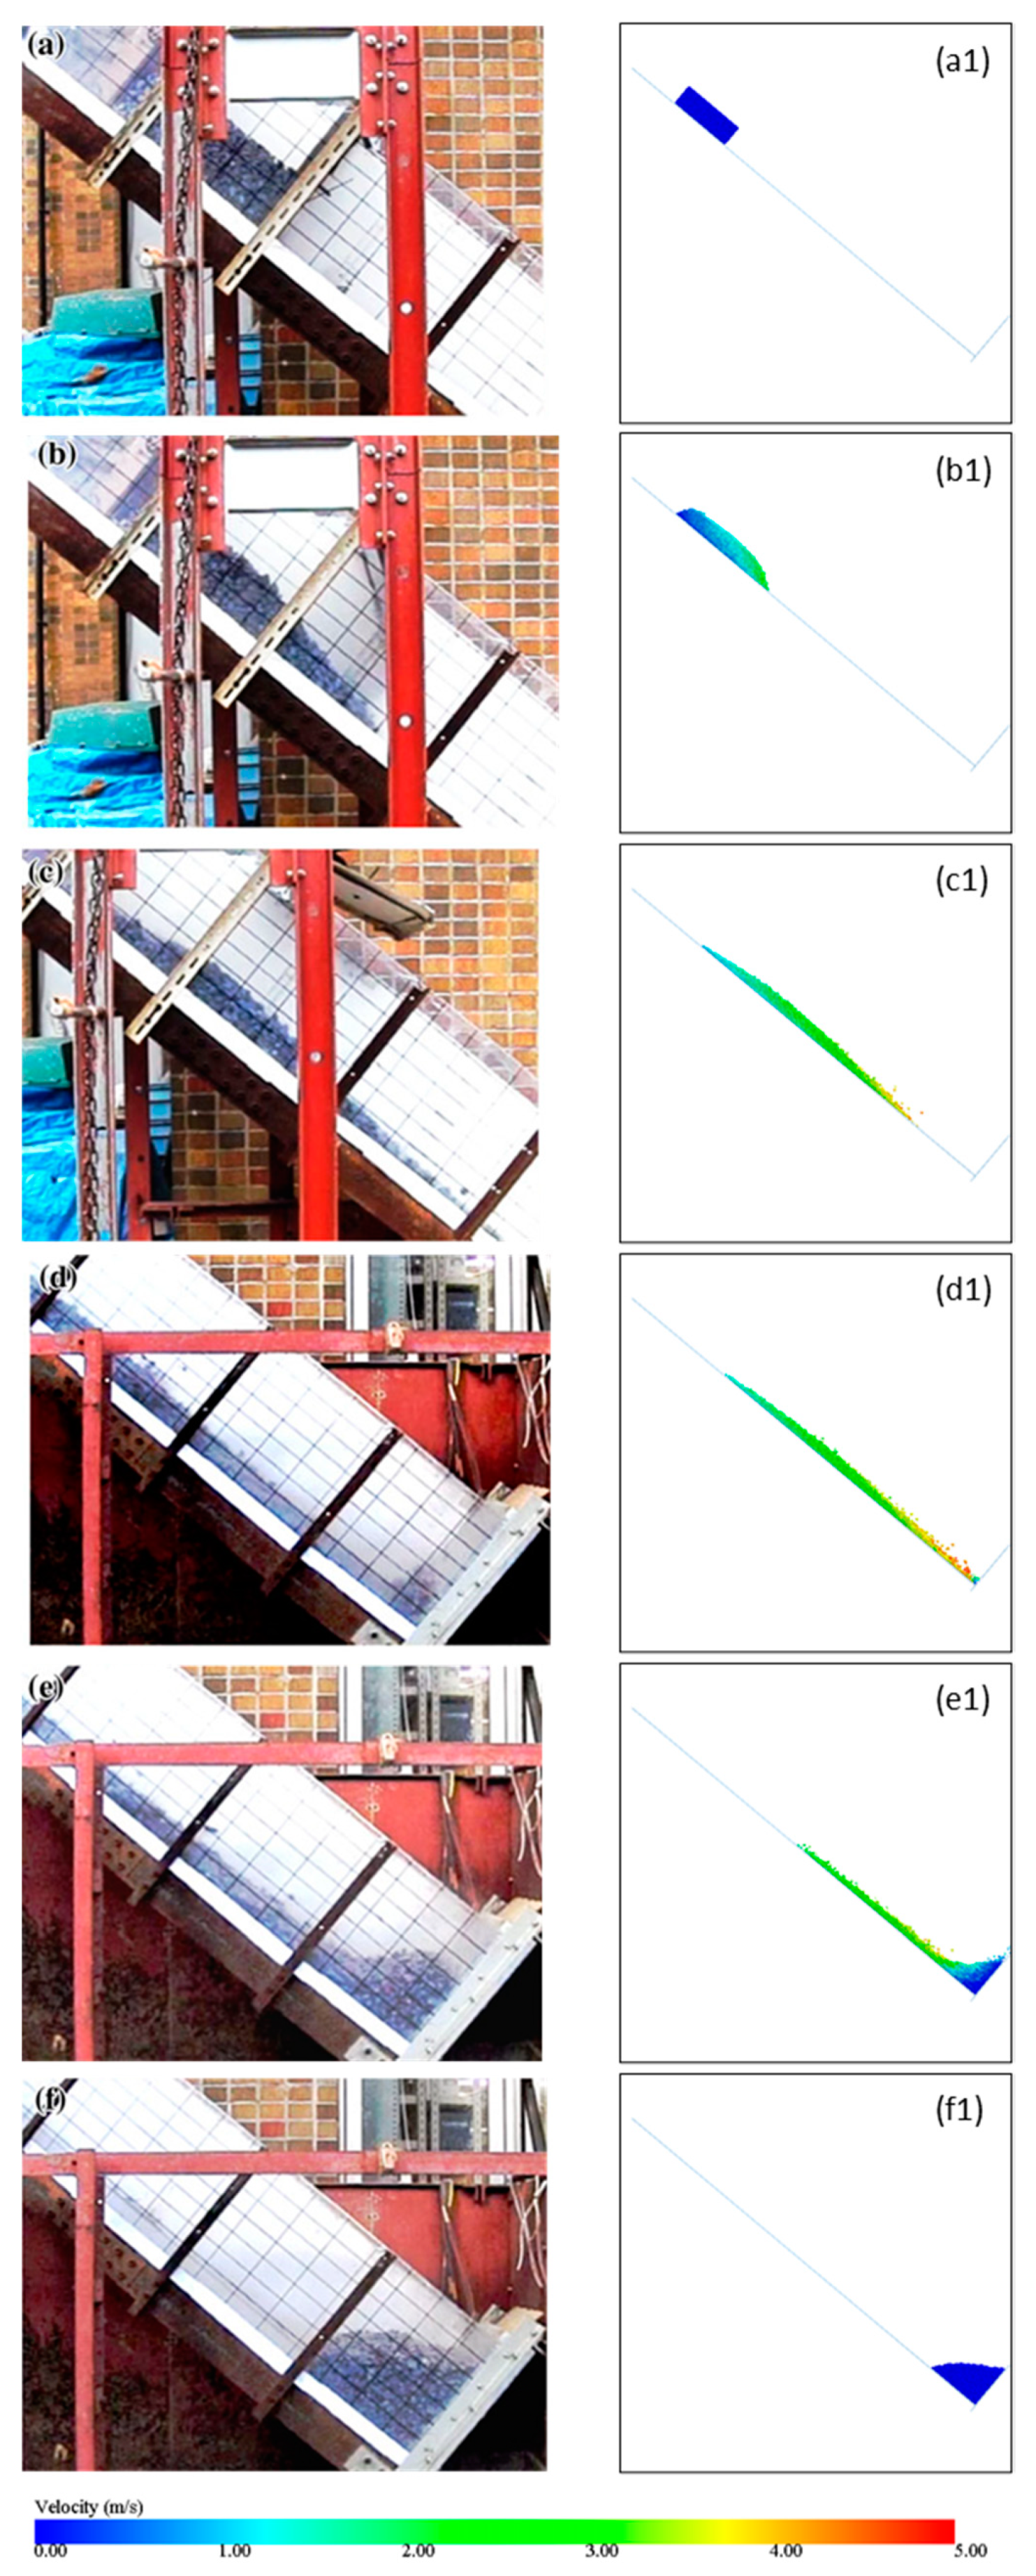
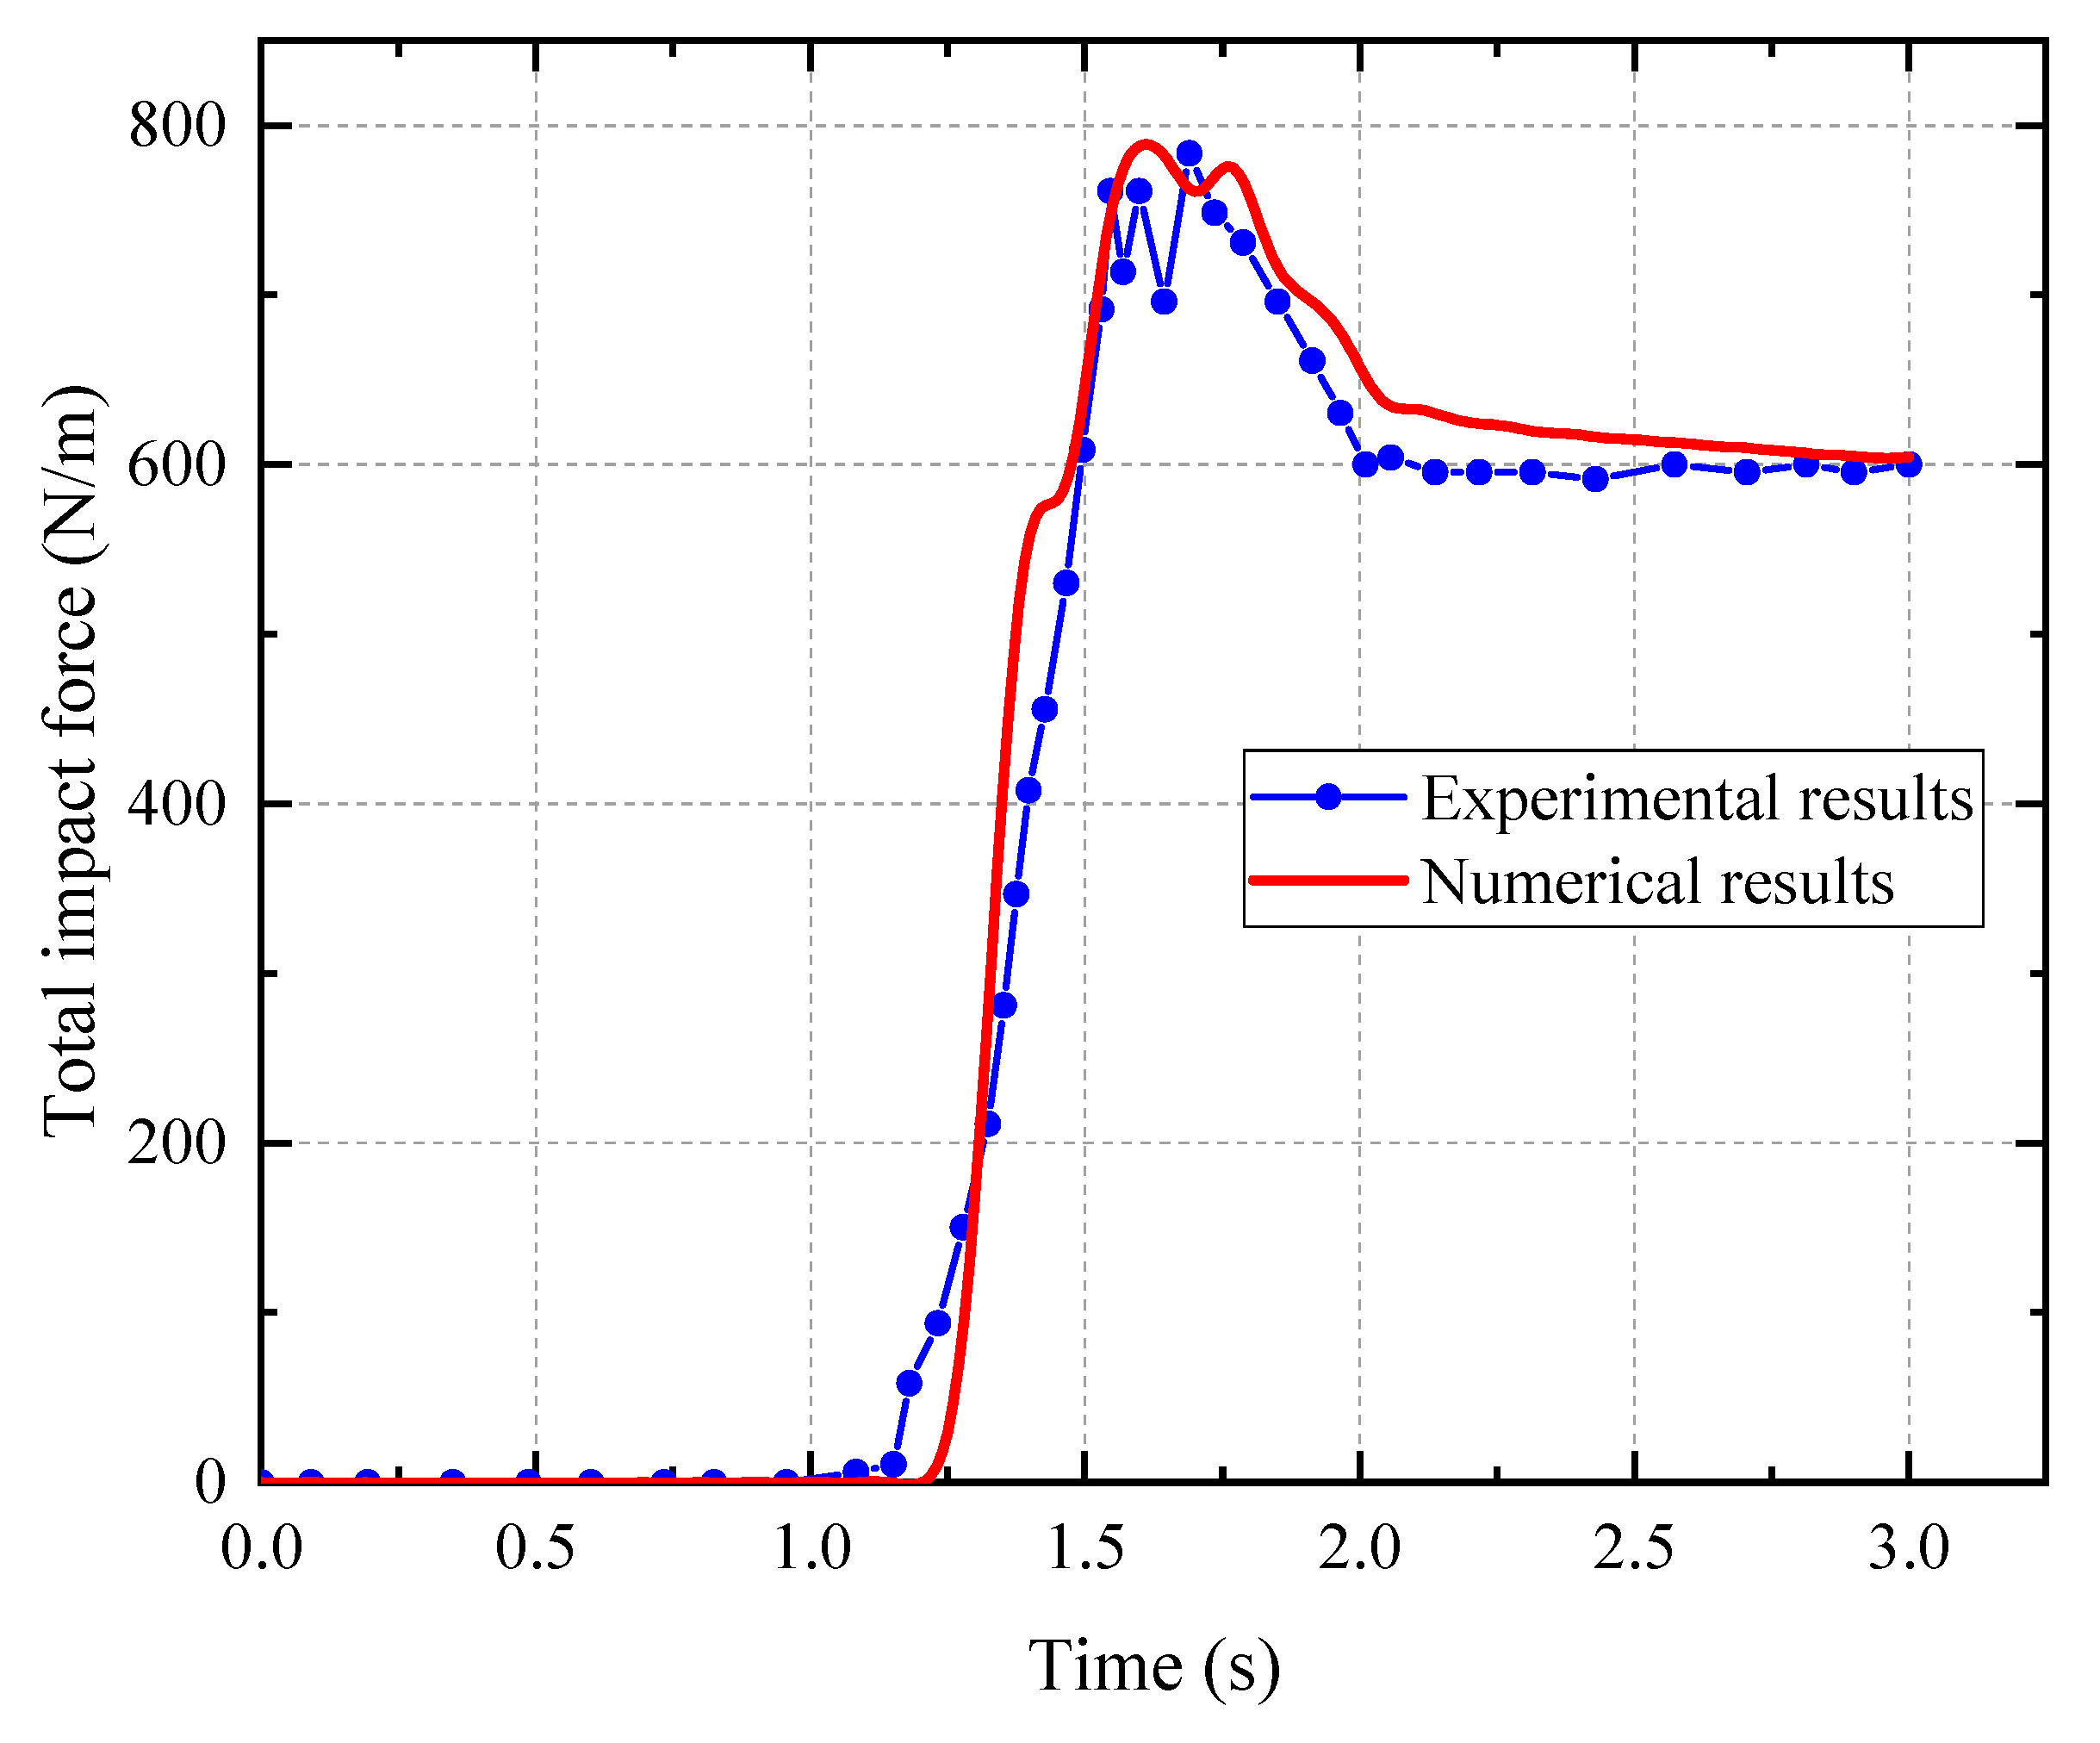
The proposed numerical model was validated by comparing the flow kinematics and impact dynamics of granular flow with that observed in laboratory experiments of Jiang and Towhata [14]. The comparison results are presented in Figure 2, which verifies that our DEM model could generally capture the four stages of flow evolution process reported by Jiang and Towhata [14]. (1) The flow starts from a dam break failure of a rectangular debris deposition with obvious particle motion at flow surface (Figure 2a,a1,b,b1). (2) Then, a mature flow is developed: the flow length is increased, while the flow depth becomes smaller, especially at the flow front where the particles collision is significant (Figure 2c,c1). (3) When the flow front reaches the barrier, some discrete particles become agitated because of impact and rebound. Meanwhile, a portion of flow deposits behind barrier, and the dead zone develops with ongoing debris–barrier interaction (Figure 2d,e,d1,e1). (4) Finally, all particles settle behind the barrier that formed a trapezoidal deposition morphology (Figure 2f,f1). We also compared the Froude number (, where v and H denote the average velocity and depth of the flow front, respectively) of the numerical and experiment results. Our result, = 7.8, was close to the experimental results (6.7). In addition, the comparison of time-dependent impact force is shown in Figure 3. It is noticed the peak value, residual value and evolution trend of impact force registered in physical tests are reasonably reproduced. These comparisons indicate that the proposed numerical model can be used reliably to investigate the multiple-surge impact behavior of granular flow. More details of calibration process of the DEM model can be accessed in Appendix A.
Based on the calibrated model, we first consider two scenarios: a single-surge event and double-surge impact. The latter scenario follows the methodology of Albaba et al. [21]. Initially, surge1, which has half the volume of the single-surge scenario, was formed. This flow reaches the rigid barrier and forms the dead zone, then another surge (surge2) with a volume equal to that of surge1 is released and interacts with the dead zone and the barrier. The total volume of surge and the slope angle varied in the modeling to investigate the effect of the morphology of the dead zone on the multiple-surge impact mechanism. The simulation program is presented in Table 2.
3. Results and Interpretation
3.1. Flow–Dead-Zone Interaction Mechanism
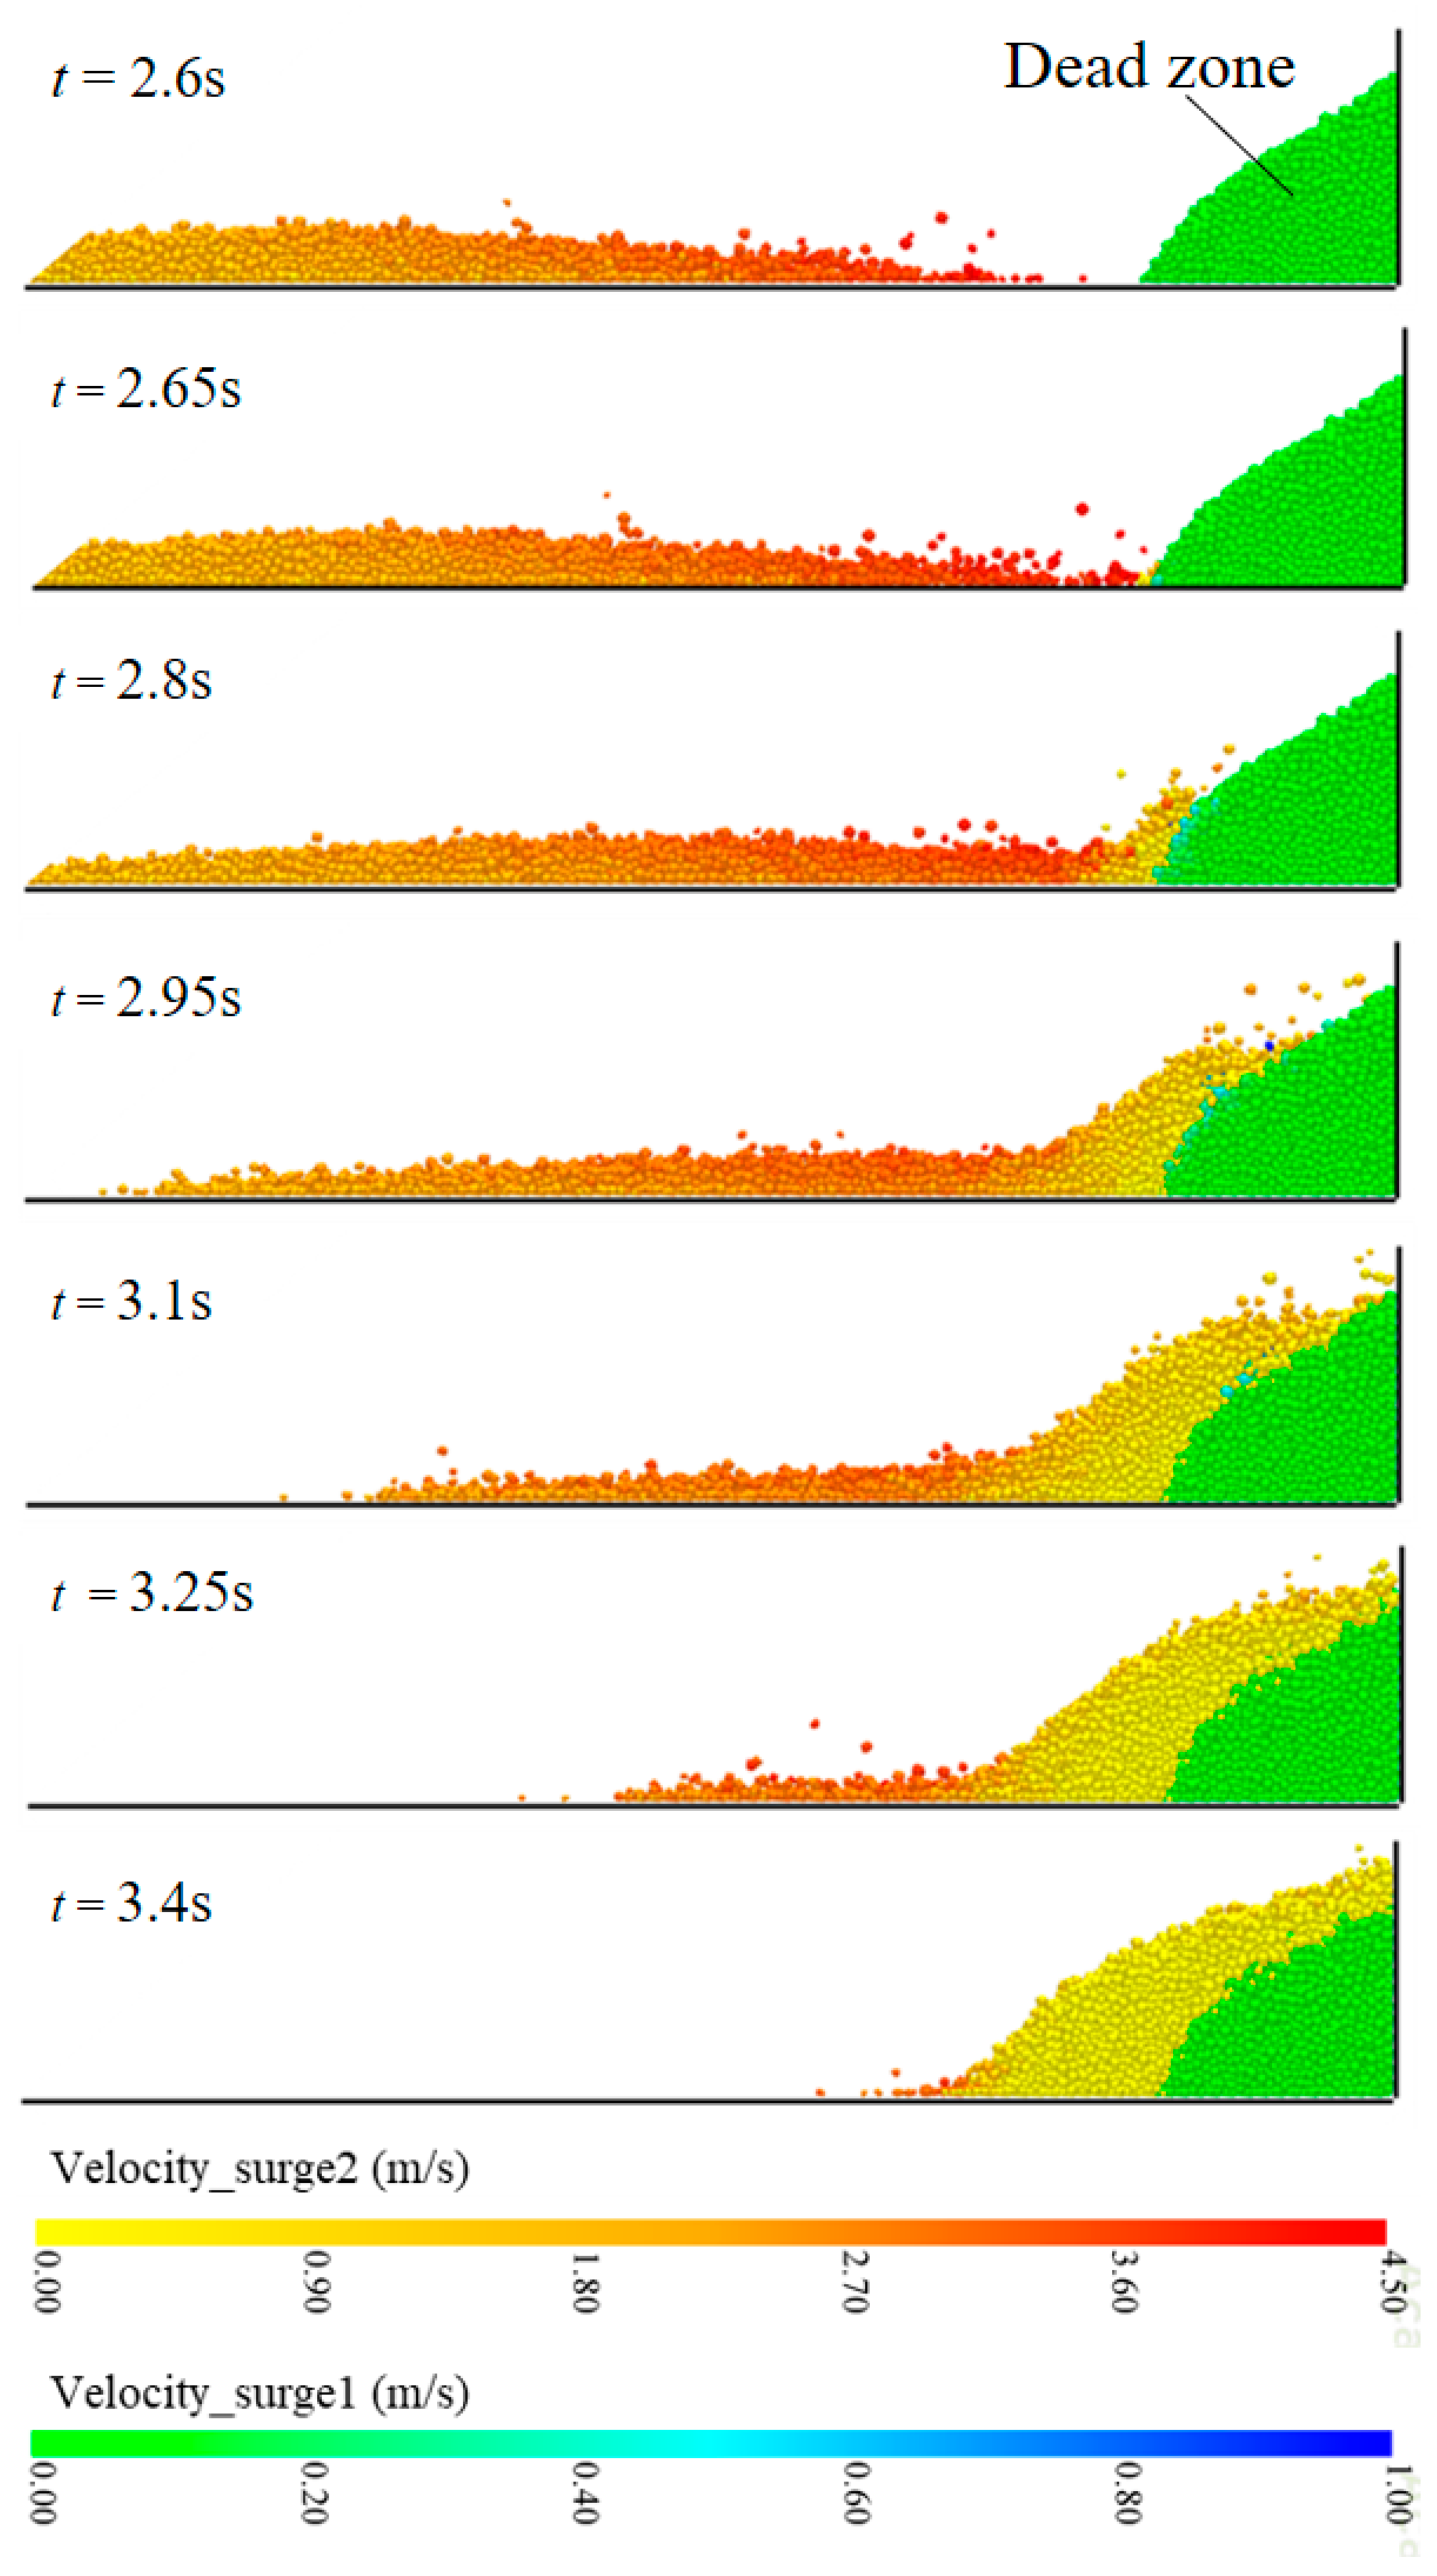
Here, we present the flow kinematics of multiple-surge impact and discuss the general interaction mechanisms. Figure 4 shows snapshots of the interaction between surge2 and the dead zone formed by surge1 during a simulation with a slope angle of 40° and a total surge volume of 39.6 L. The diagrams are rotated to lie horizontal. At t = 2.6 s (the initial time is set as the moment of the release of surge1), the front of surge2 is approaching the foot of the dead zone; at t = 2.65 s the front impacts the tail of the dead zone with an average flow velocity of 4.3 m/s, followed by a drastic decrease in the flow velocity by about 90% at t = 2.8 s. At the same time, some particles of the tail of the dead zone are entrained upward at a very low velocity (about 0.5 m/s). As more flow material arrives, the front of surge2 moves along the upper surface of the dead zone, causing minor deformation in the dead zone mass. This deformation is more obvious at t = 2.95 s. Some finer particles of surge2 are embedded in the larger voids of the dead zone by the pressure of upper flow, thus increasing the flow resistance of surge2. This phenomenon, which was also observed in other studies, serves as a mechanism for particle-size segregation during debris–barrier interaction [30]. At t = 3.1 s, a few particles of surge2 impact the barrier; at same time, the dead zone deformation reaches its maximum. Toward the end of the process (t = 3.25 s and t = 3.4 s), more particles impact the barrier, generating a steady impact force on the barrier. At the final stage, a large portion of the particles are deposited at the foot of the dead zone and on top of it, and only a small portion of the particles have interacted with the barrier.
During the interaction process described above, at least three mechanisms of energy consumption can be identified in addition to the energy dissipated by the barrier and by flume friction: (1) friction and penetration at the interaction face between surge2 and the dead zone (surge1), (2) inelastic deformation of the dead zone and (3) inter-particle interaction within surge2. A more quantitative discussion about these three mechanisms is presented in Section 3.3.
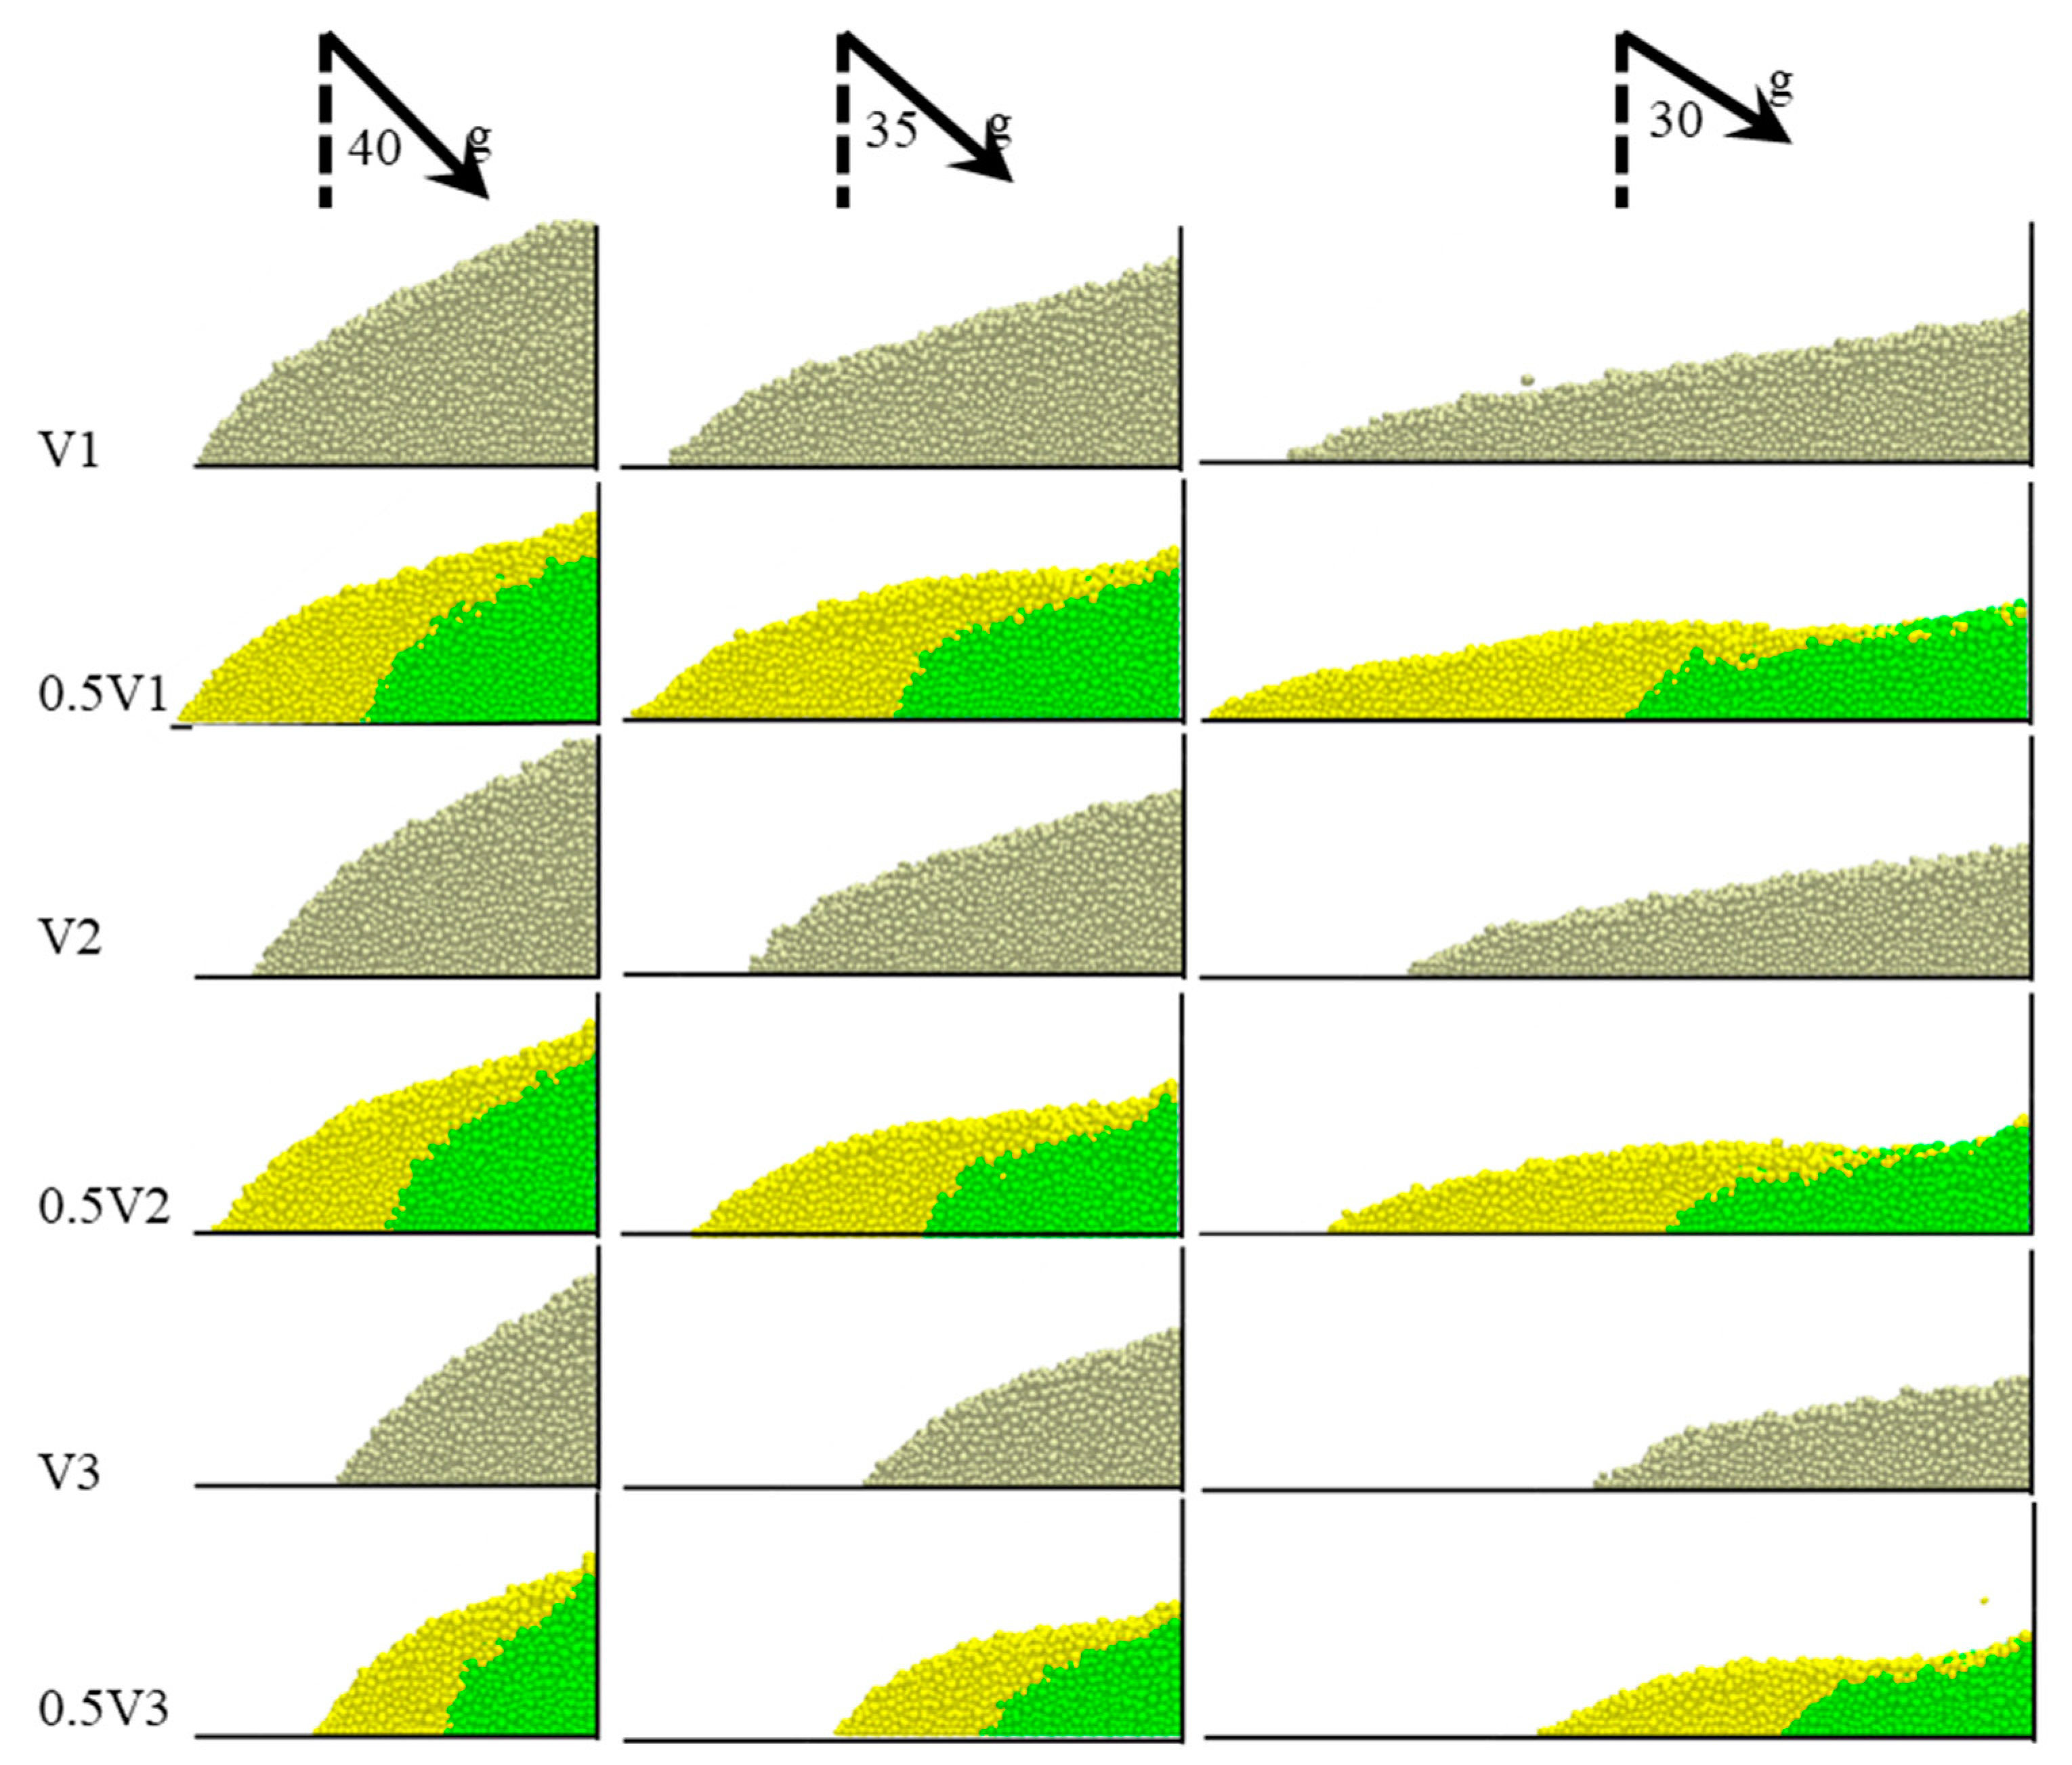
At the final stage, because of the effect of the dead zone during multiple-surge impact, many particles are deposited at the foot of the dead zone; thus, the final deposition morphology is more spread out compared with that of the single-surge impact. Figure 5 shows the deposition morphology of granular flows at the final stage, with flume angles of 40°, 35° and 30° and surge volumes V1, V2 and V3, respectively. For each volume V, the simulation was repeated with two flows, each of volume 0.5∙V. The diagrams were rotated to lie horizontally. Overall, the final deposition after the double-surge impact is more spread out than that of the single-surge impact; the difference increases when the flume angle is smaller (Figure 5). For quantitative comparison, we measured the spreading distance, which is defined as the length of the deposition along the flume base from the bottom of the barrier, normalized using Equation (4):
where is the additional spreading distance of the deposition, and and represent the spreading distance of the deposition formed by the single-surge and double-surge impact, respectively. The normalized results are presented in Table 3. As the flume angle decreases, the difference between the spreading distance of the single- and double-surge depositions increases, reaching almost 20%. When the slope is relatively gentle, the flow is slower because of a smaller potential energy, hence the granular flow has lower kinetic energy. The dead zone formed by surge1 has a gentler free surface; therefore, less particles are transported to the top of the dead zone because of the longer energy dissipation path, that is, more particles will be deposited at the tail of the dead zone. The combination of these two effects results in a larger deposition spreading distance when the flume slope is gentler (Figure 5). The volume of the dead zone (block volume) has a small influence on enlargement of the spreading distance of the deposition. For example, when the flume was steeper (flume angle of 40°), for a block volume of 19.8 L (V1), the spreading distance was 6.48% greater for the double-surge case, and when the block volume decreased to 15.84 L (V2), the spreading distance increased by an additional 4.59% (a total of 11.074); however, when the block volume decreased further to 9.9 L (V3), the spreading distance only increased by 10%. The results under all the flow conditions considered in this paper show a similar trend, which suggests that there is an optimal block volume where the difference between the single- and double-surge spreading distance is the largest; this should be further investigated in the future.
3.2. Impact Dynamics
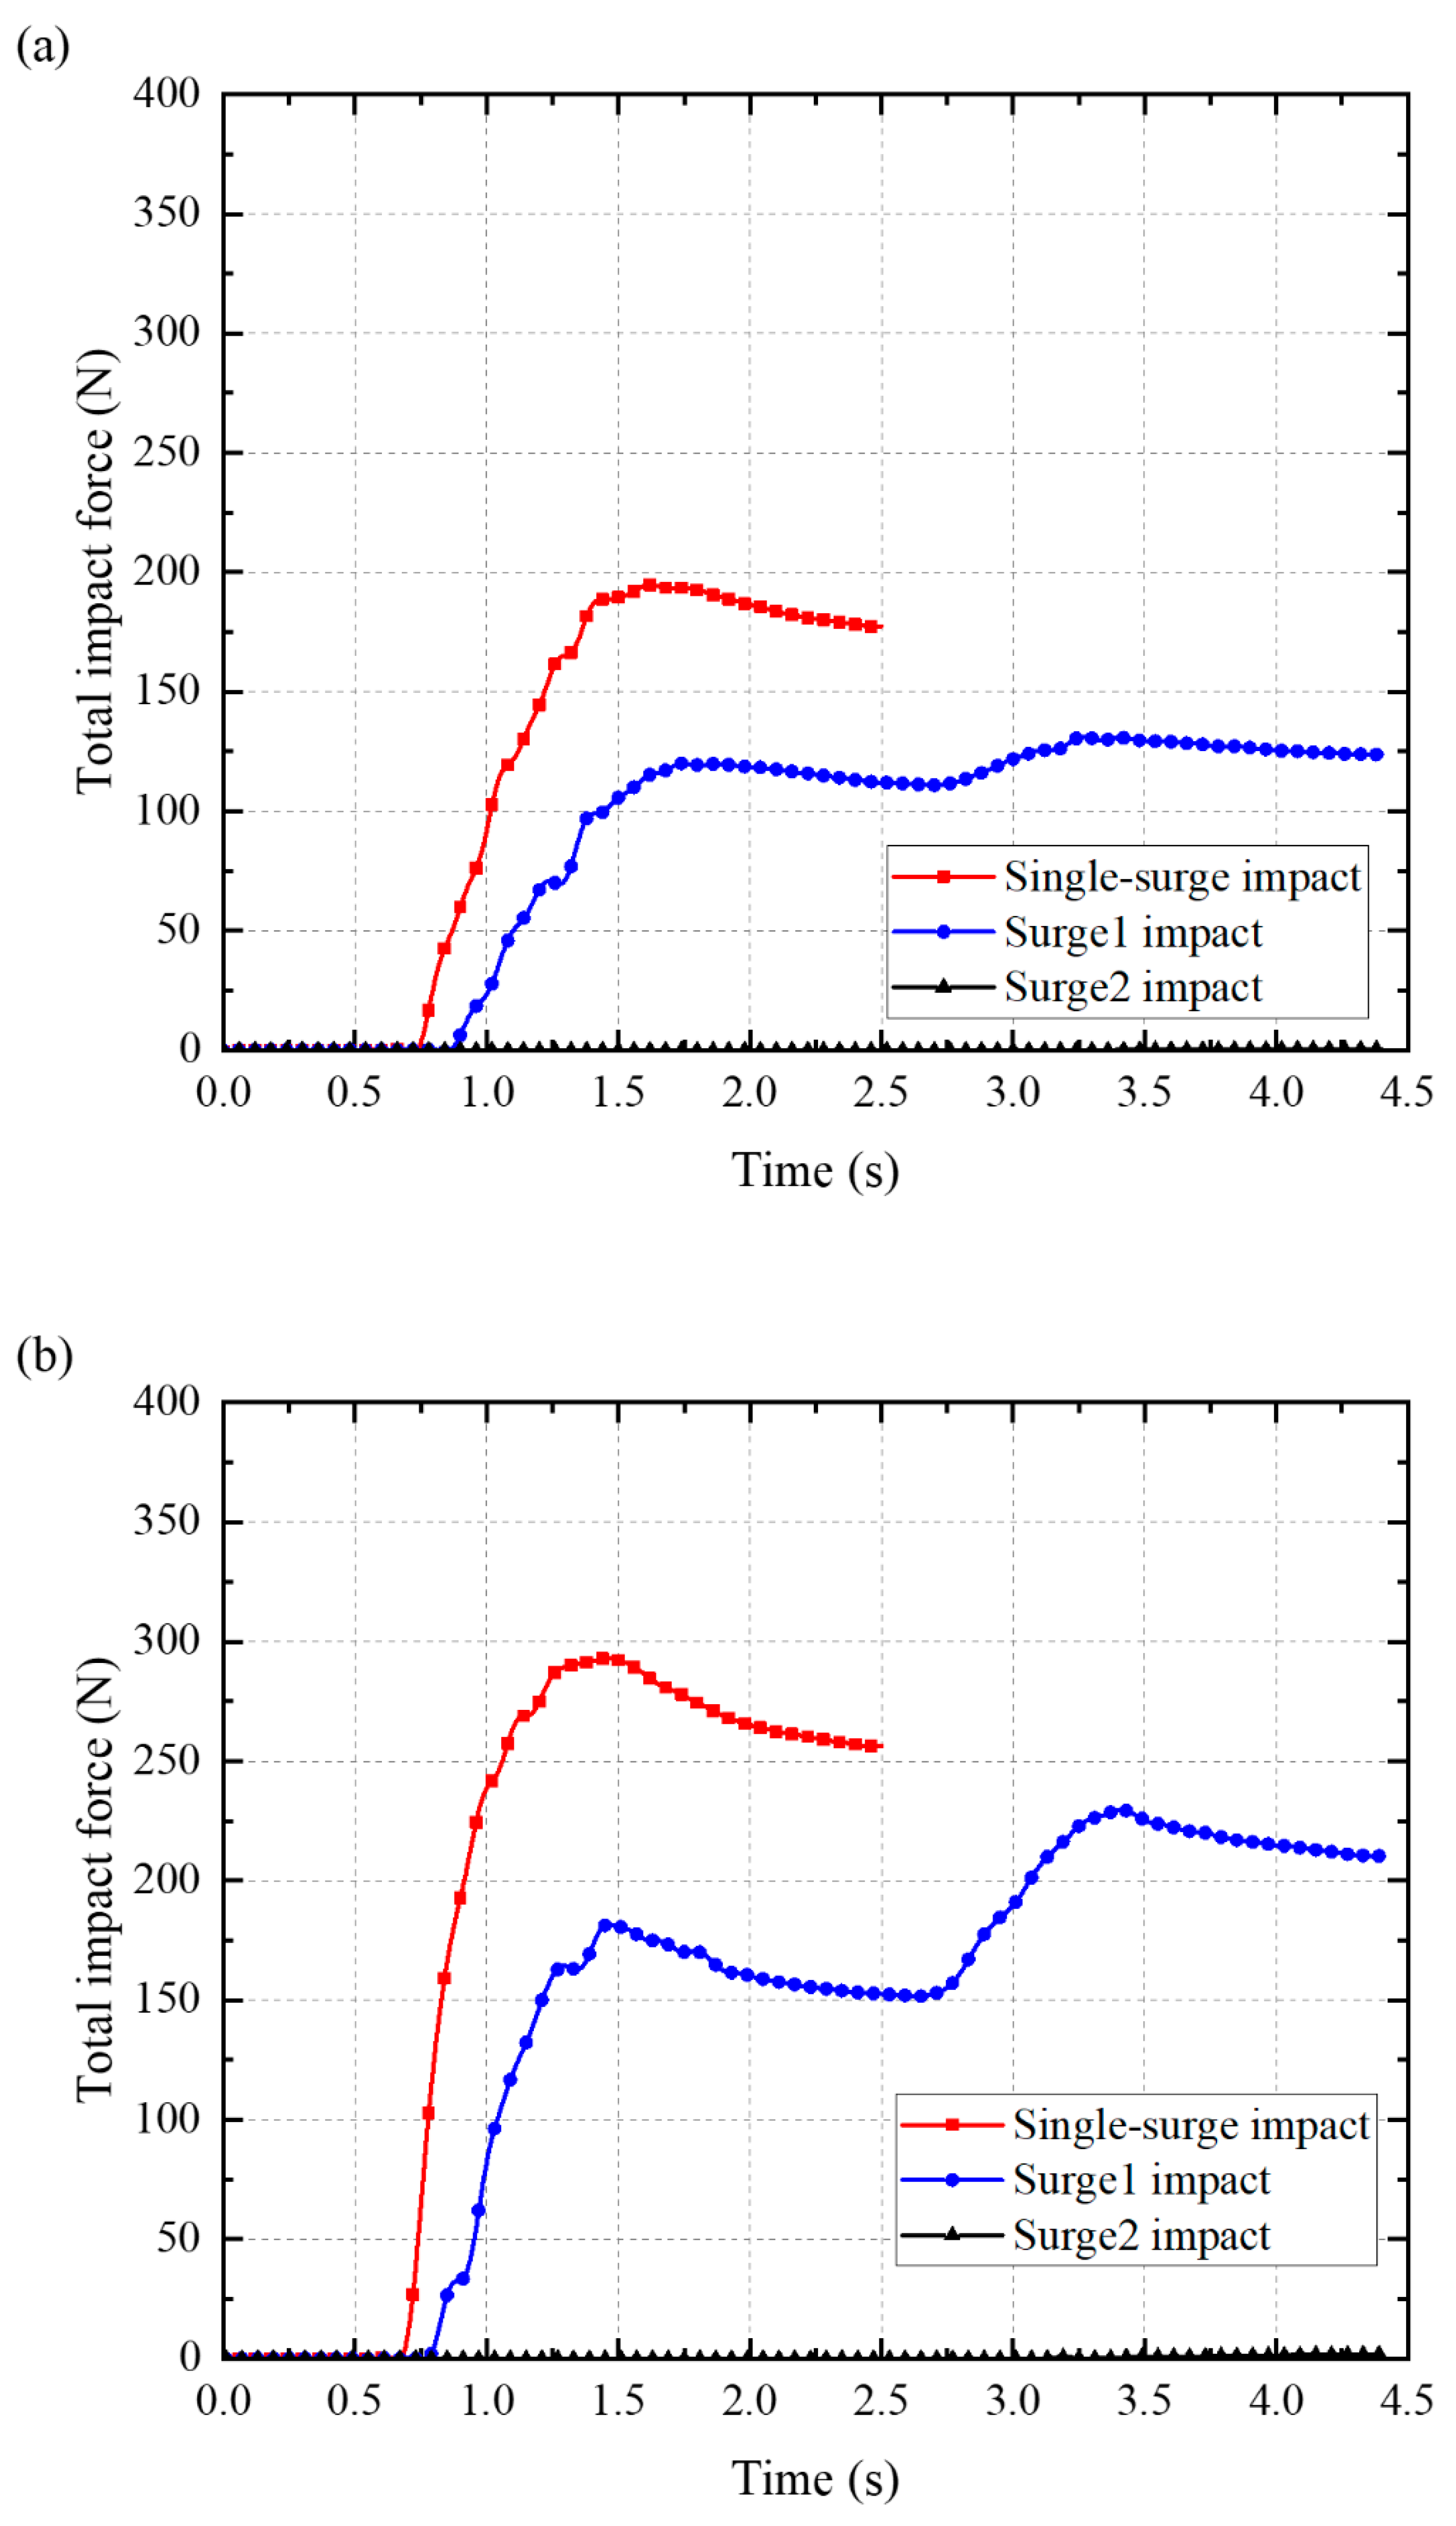
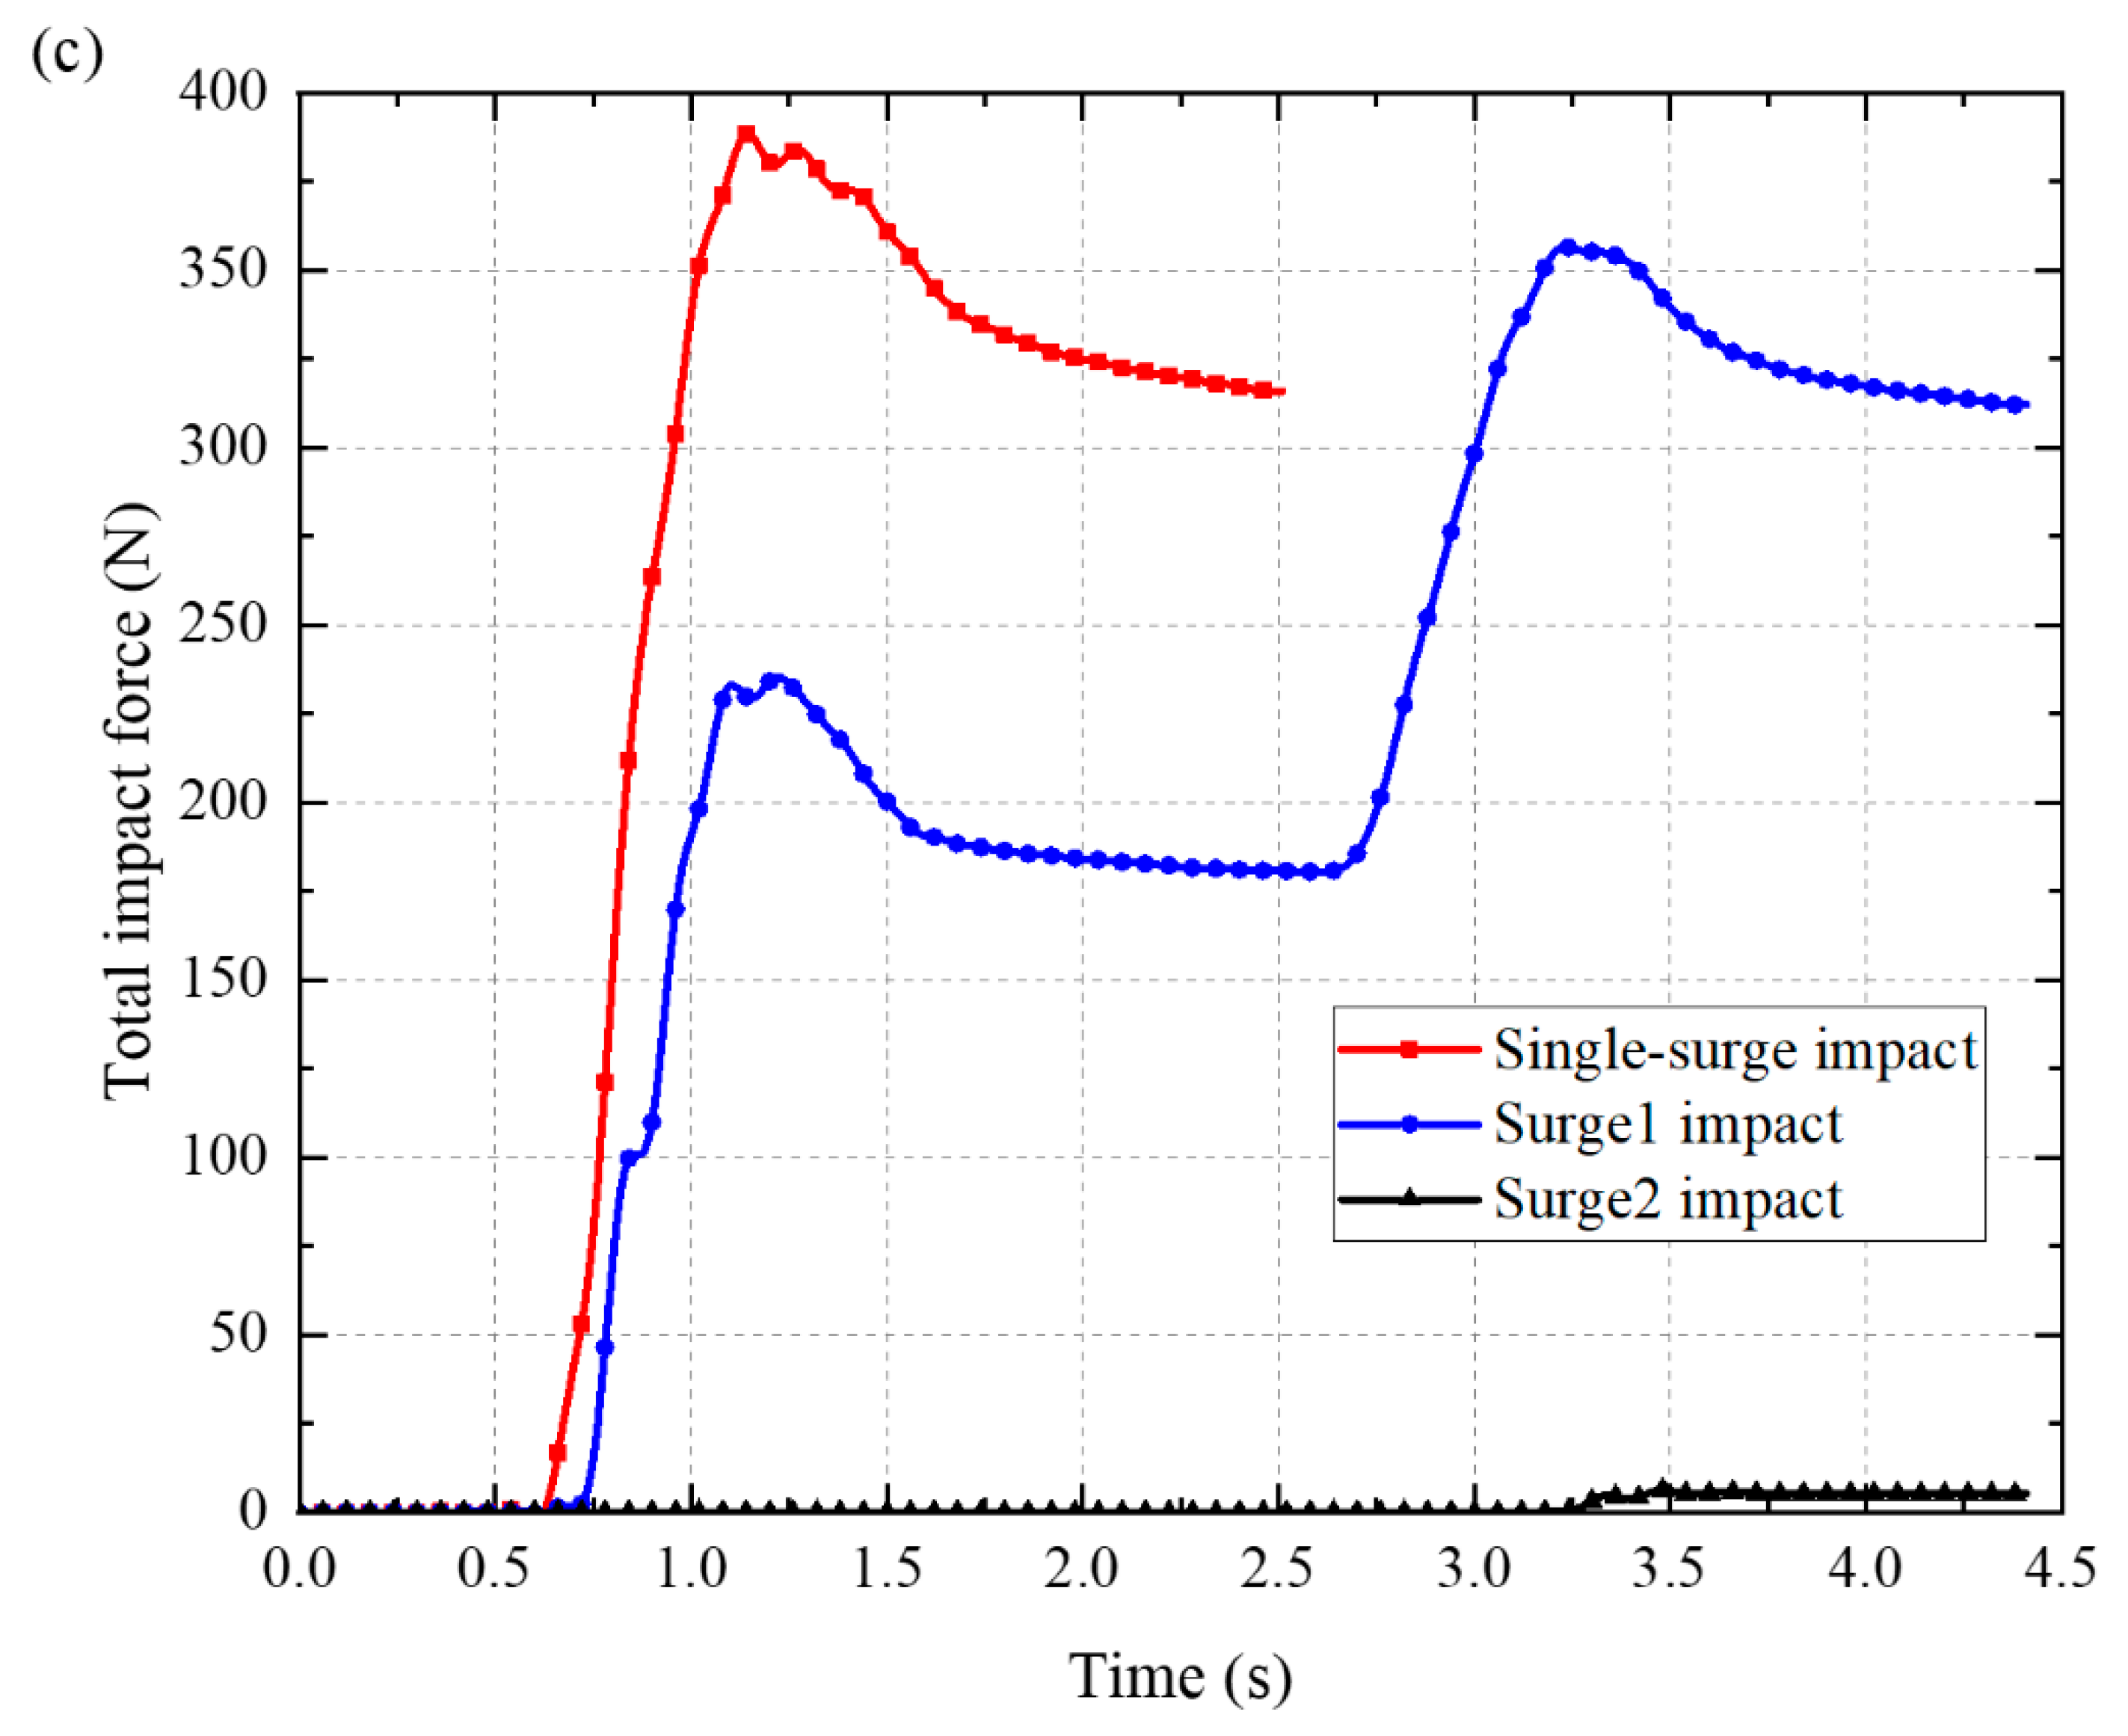
The impact force on a barrier is a big concern in engineering practice [3,11,14,28]. In this section, the evolution of the impact force is investigated in detail. Figure 6c shows the simulated time–history curve of the impact force on a barrier for single-surge and double-surge impacts with a slope angle of 40° and total surge volume of 39.6 L. Under single-surge impact, the granular flow front reached the barrier at t = 0.65 s; as the particles collided with the barrier, the impact force increased sharply and reached a peak at t = 1.14 s, then gradually decreased to a level determined by the earth pressure exerted by the dead zone at the end of the approached flow. Under the multiple-surge impact, the curve of surge1 is similar to that of the single-surge impact, but the peak impact force and residual force are lower by 39.44% and 42.87%, respectively. As shown above, surge2 impacts the dead zone formed by surge1 and flows up the free surface of the dead zone (Figure 4) until reaching the barrier. A large portion of the impact energy is dissipated, leaving only a small impact force acting on the barrier (about 1.29% of the peak force generated by the single-surge impact). However, after surge2 impacts the dead zone (t = 2.65 s; Figure 6c), the force on the barrier also increases sharply, peaking within a short time (about 0.58 s) and then decreasing again. This indicates that the impact energy of surge2 is transformed to an impact force on the barrier mainly through the dead zone. In this process, the dead zone serves as a cushioning layer that protects the barrier from the high-impact force. Figure 6 also gives the influence of slope angle on debris impact force. With a lower slope angle, the time–history curve of impact force is gentler.
In our quantitative analysis, we calculated the total force generated by surge1 and surge2 and compared this with the force exerted by the single-surge impact. The peak force reduction was calculated and normalized by the force of the single-surge impact. The results are presented in Table 4 and reveal the cushioning effect. The highest peak force reduction was 32.65%, which demonstrates that the dead zone serves as an effective cushioning layer and provides the barrier with a stabilizing effect against debris flow. Table 4 also shows the effect of the slope angle and block volume on the peak force reduction, with a similar effect to that shown in Table 3. For example, when the block volume is 19.8 L, as the slope angle decreases from 40° to 30°, the peak force reduction increases from 7.43% to 32.65%. At a slope angle of 40°, when the block volume decreases from 19.8 L to 9.9 L, the peak force reduction first increases from 7.43% to 17.84% and then decreases to 12.51%. All the results exhibit a similar trend, which again suggests an optimal block volume that causes the largest peak force reduction. This aspect should be further investigated in the future.
3.3. Energy Evolution
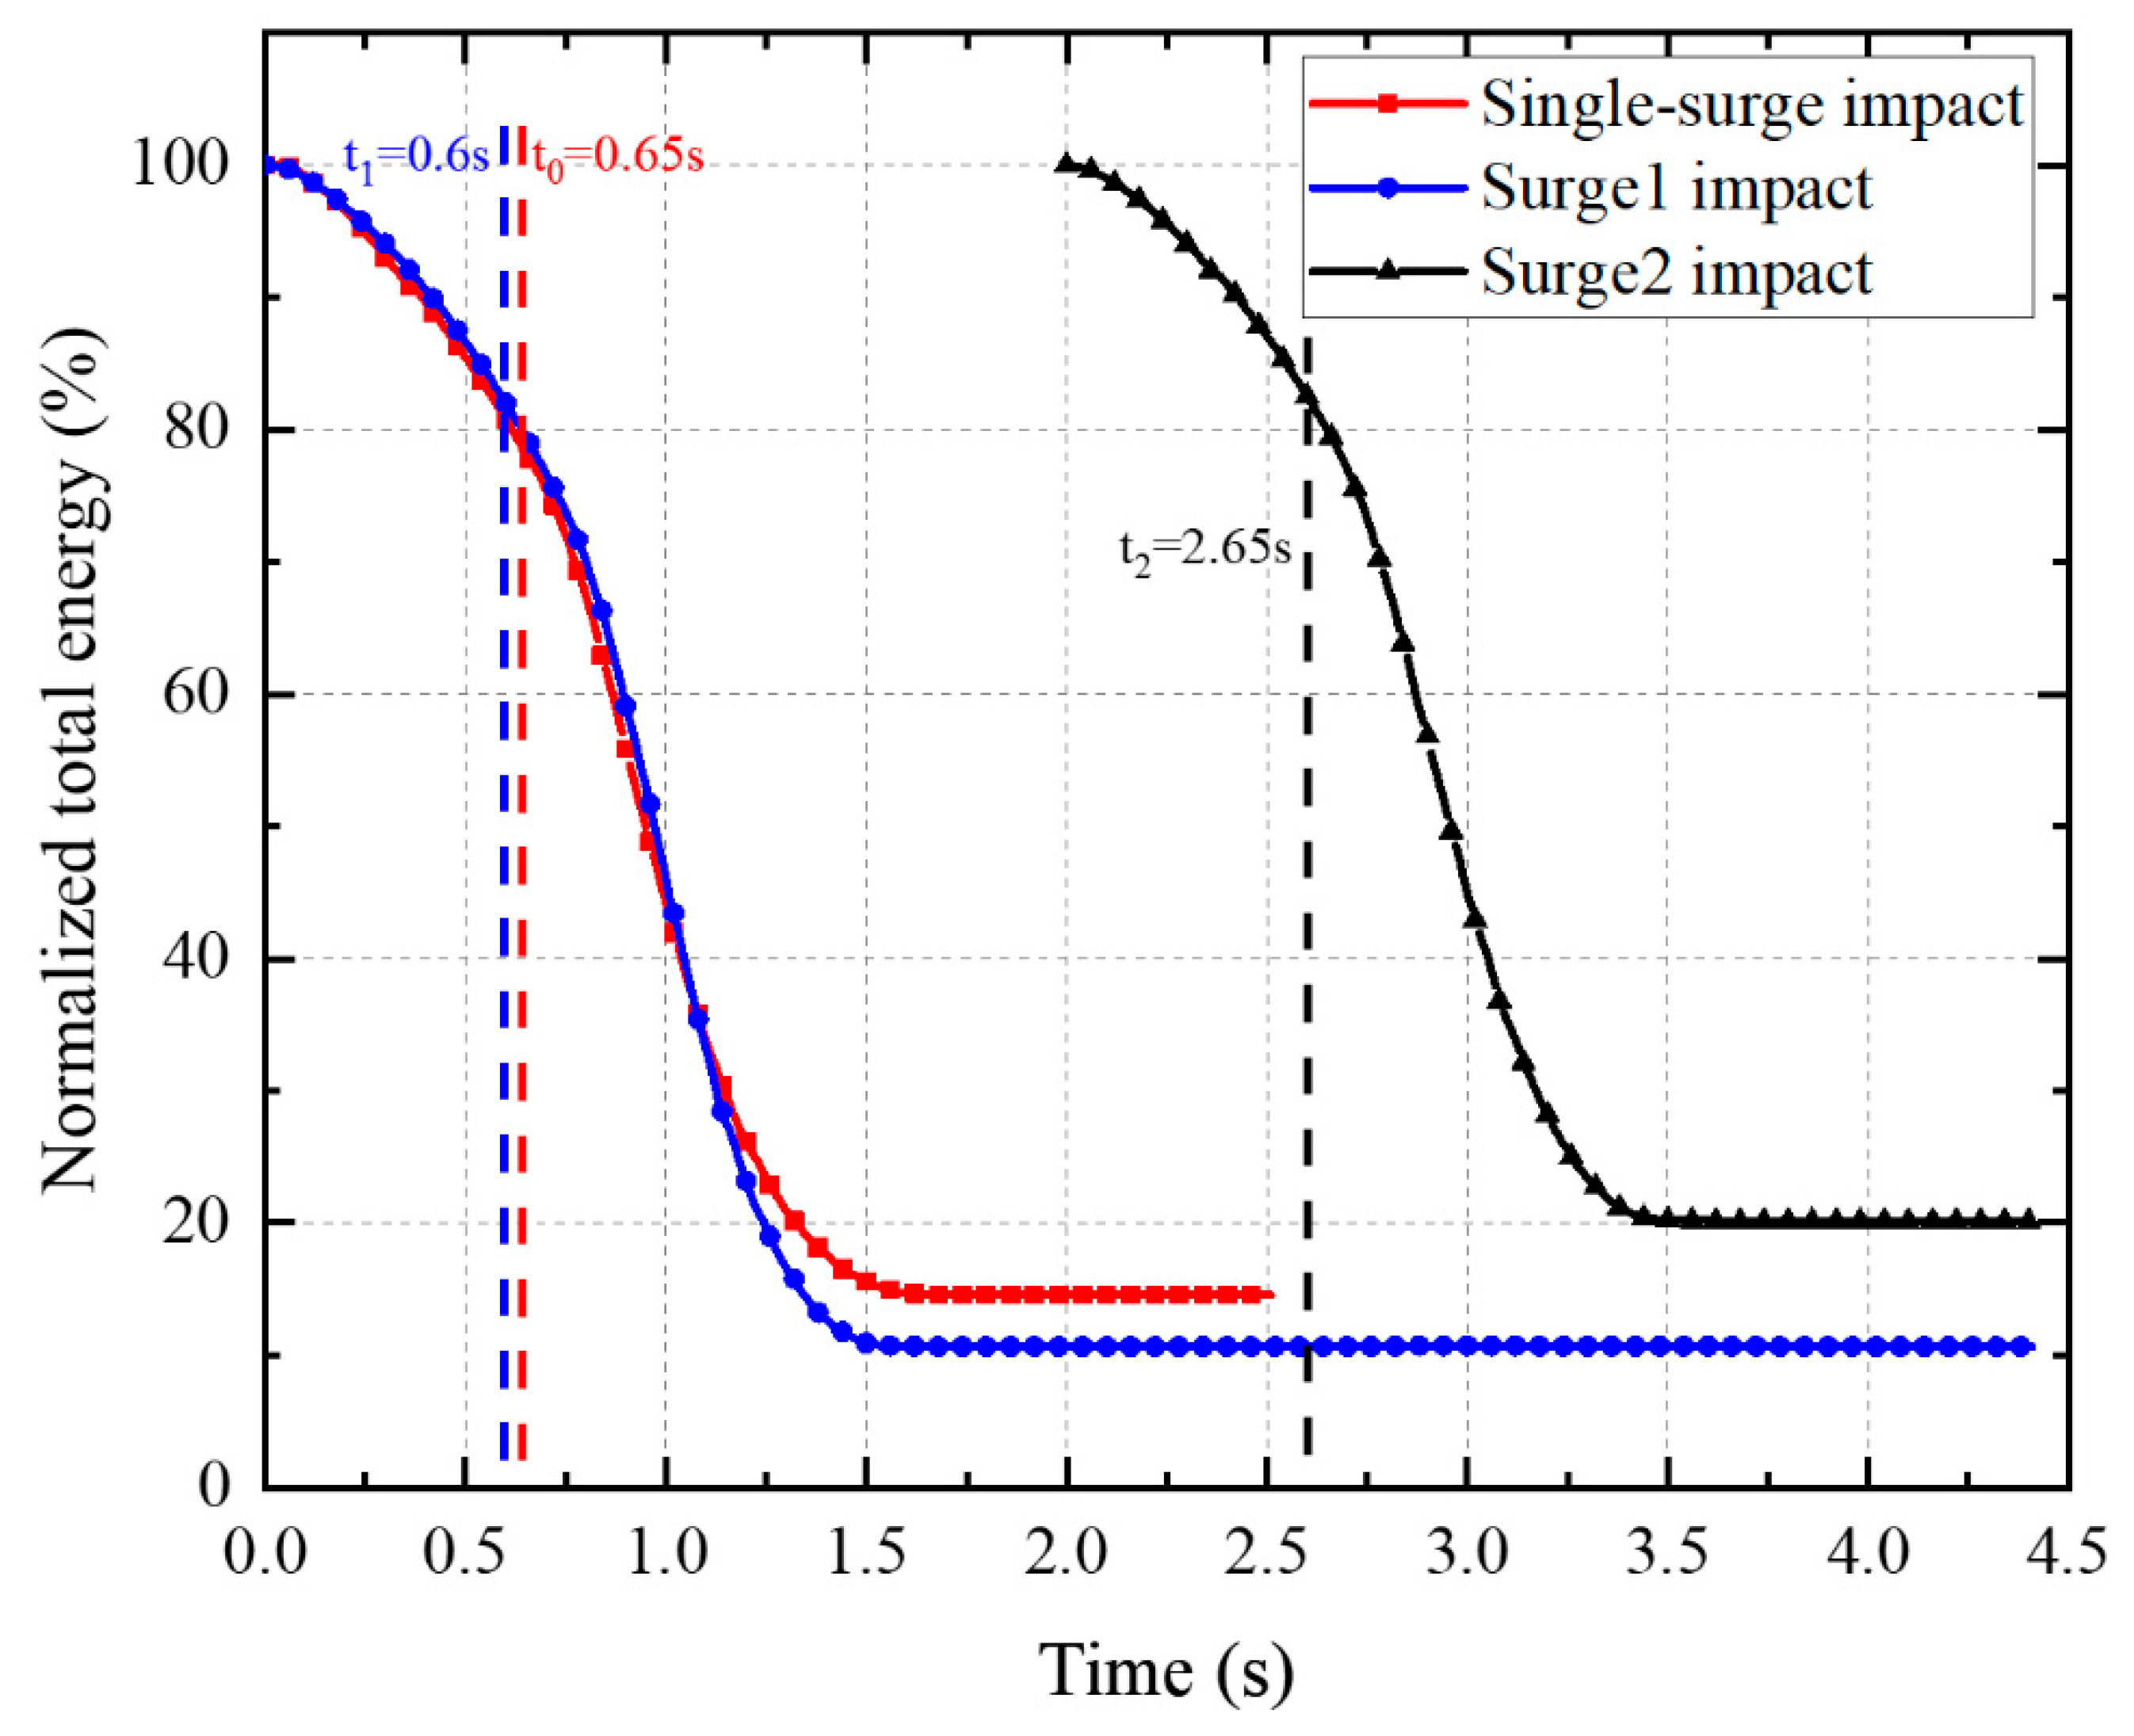
Modeling the energy evolution can offer insights on the multiple-surge impact behavior. The evolution of the normalized total energy of the debris surge was simulated for a slope angle of 40° and total surge volume of 39.6 L (Figure 7). As soon as the debris is released, the total energy begins to decrease, initially slowly, then at a higher rate. As the flow motion ends, the energy curve flattens at a low level and maintains that level, which represents the total energy of the dead zone. The single-surge and double-surge impacts have a similar total energy evolution trend. However, during the single-surge impact, about 85.44% of the total energy is dissipated, while for surge1 and surge2, 89.31% and 79.85% of the energy is dissipated, respectively. In the interaction between the surge and the dead zone, most of the debris surge particles are deposited at the foot of the dead zone and above it in the flume (Figure 4). This results in a lower energy loss for surge2 because the dead zone of surge2 has a higher potential energy at the final stage. Therefore, surge2 cannot fully interact with the flume and the barrier, hence, more energy can be dissipated by particle–particle interaction as the surge–dead-zone interaction increases during the double-surge impact. To quantitatively assess this process, we directly measured the energy absorbed by the particle–particle interaction. The energy loss caused by inter-particle interaction could be directly computed in DEM simulation because the particle energy loss through normal damping, tangential damping or shear friction and rolling friction could all be automatically registered during particle contact. For the single-surge impact, particle–particle interaction accounts for 40.75% of the total energy loss, while for the double-surge impact, it accounts for 60.14% of the energy loss. This indicates that the dead zone facilitates the dissipation of almost 20% of additional impact energy.
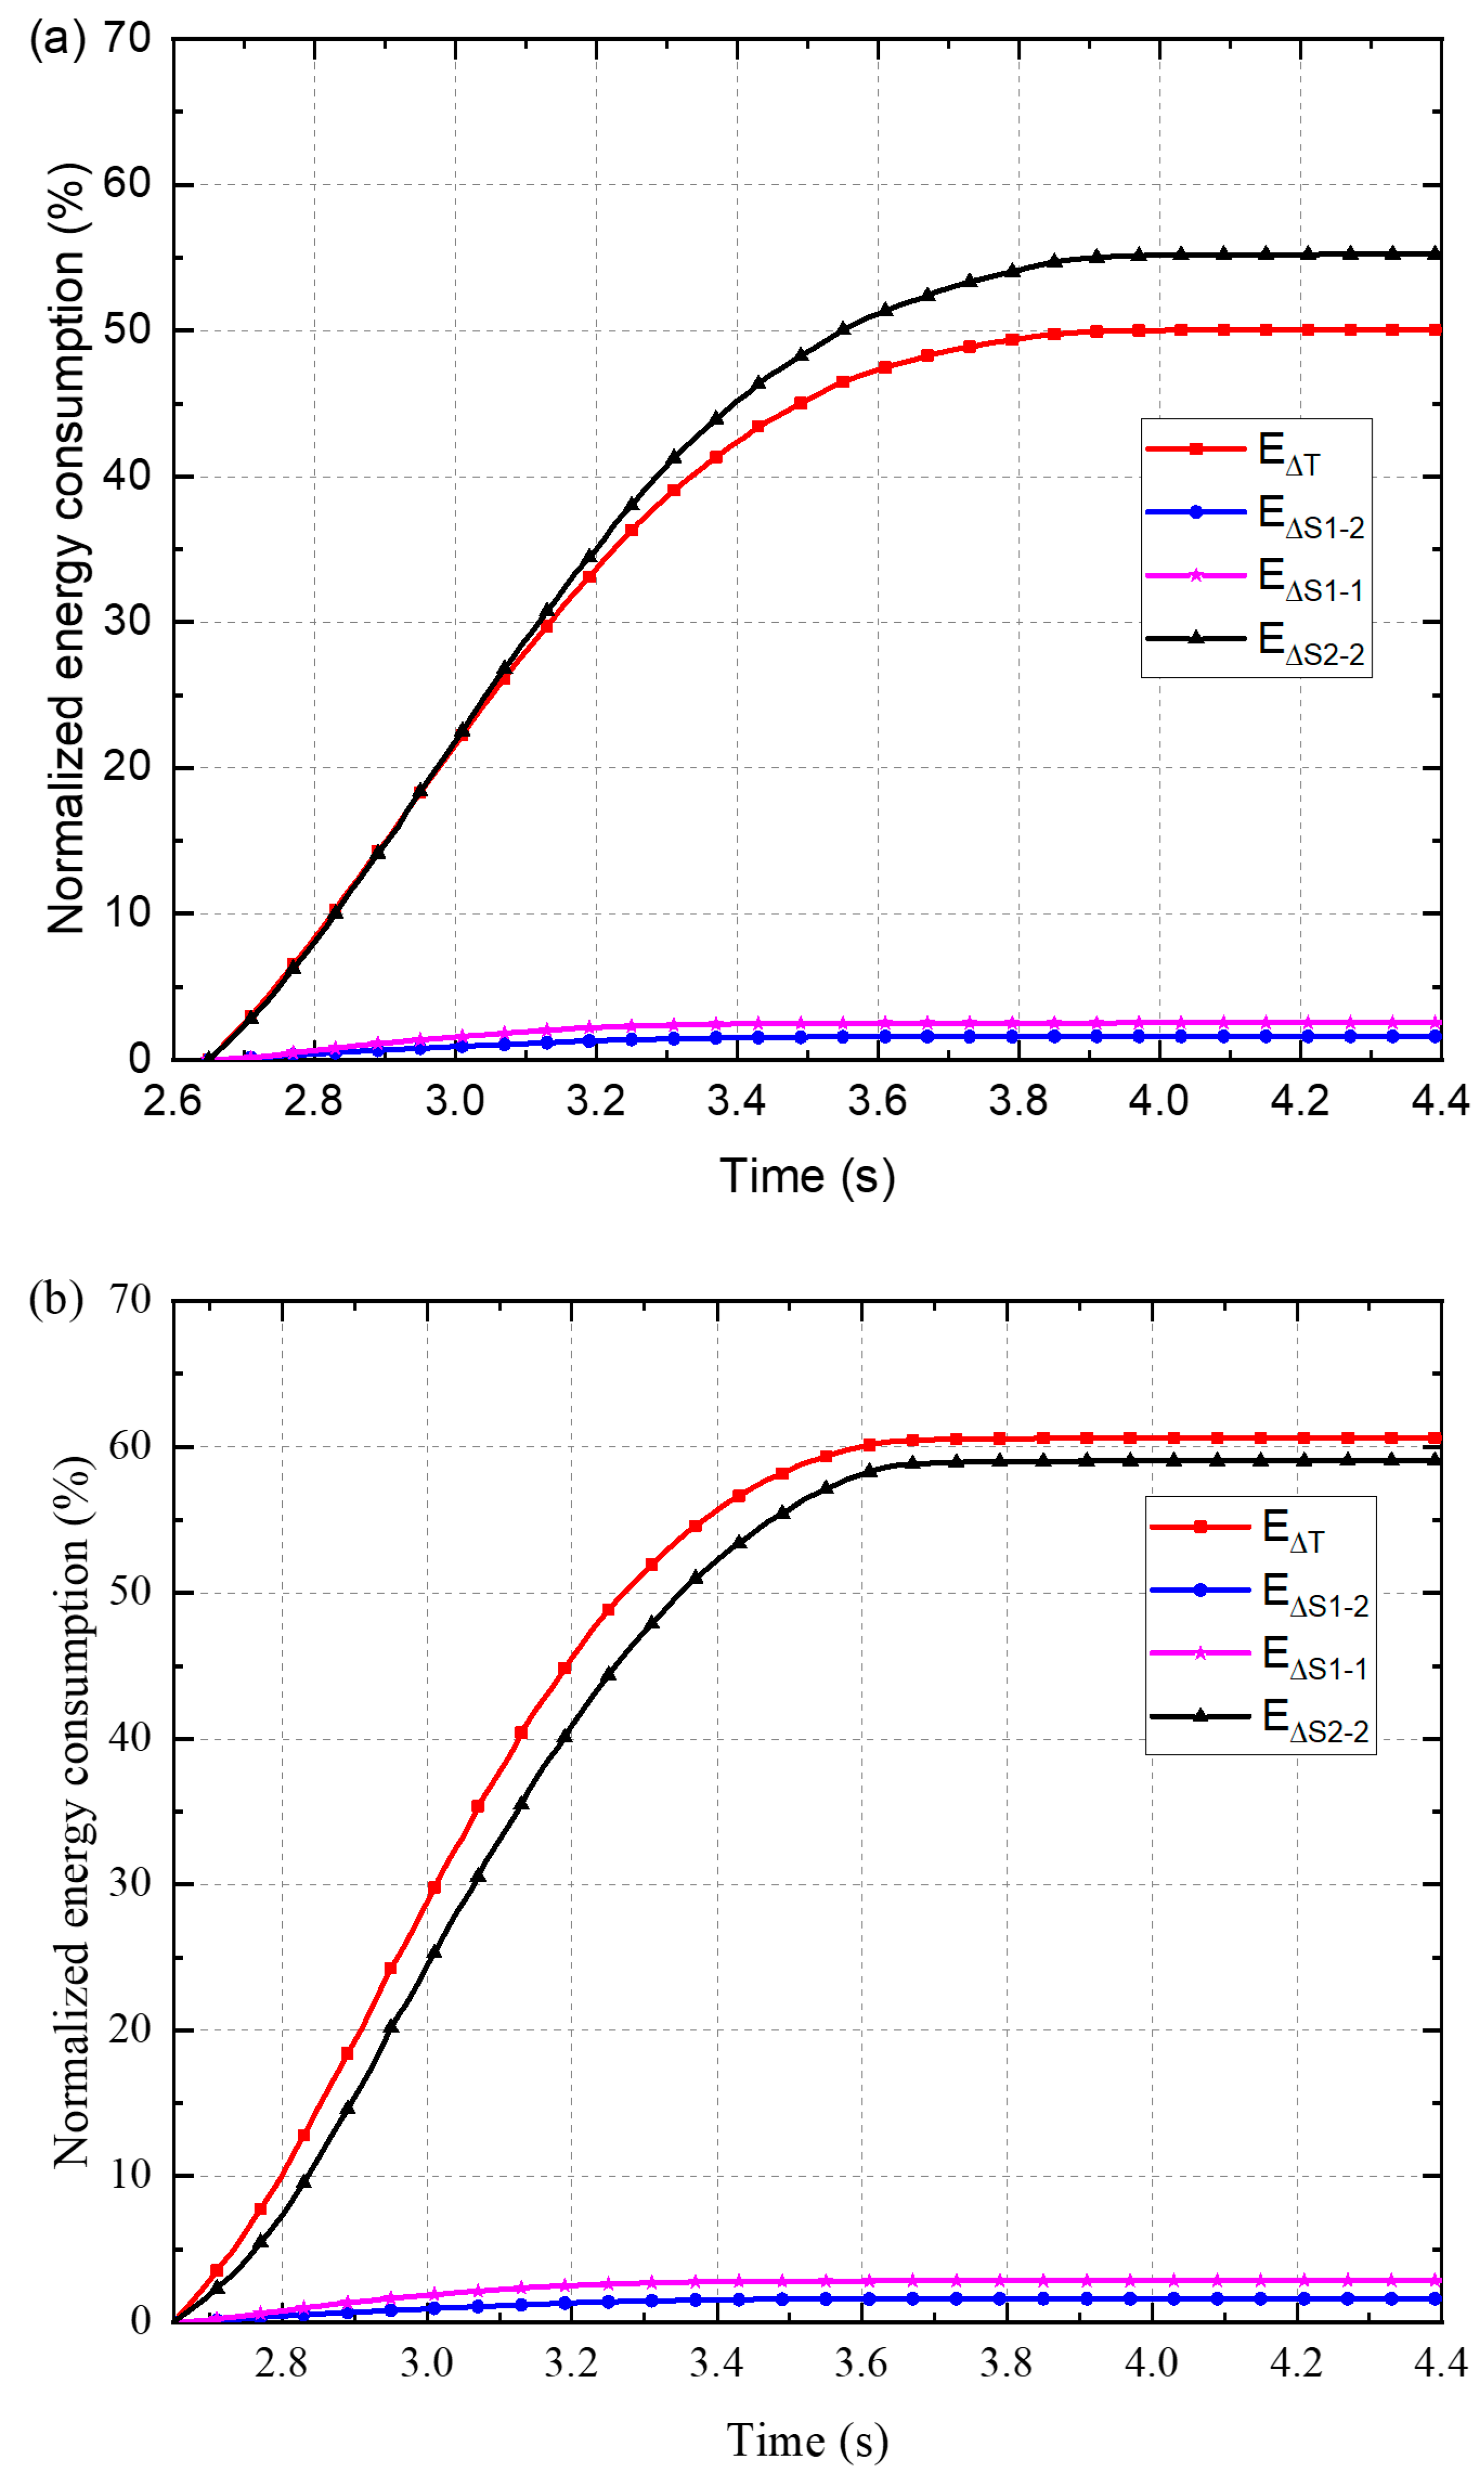
In Section 3.1, we identified three energy consumption mechanisms for multiple-surge impact during surge–dead-zone interaction: the friction and penetration at the interaction face between surge2 and the dead zone (), the inelastic deformation of the dead zone () and the inter-particle interaction within surge2 (). In our detailed analysis of the energy consumption, we focused on the interaction process. Thus, the start time (t = 0) was set as the time when surge2 reached the tail of the dead zone formed by surge1 (originally t = 2.65 s), and the time–history curve of the total energy loss () was recalculated. The amount of energy absorbed by the three identified mechanisms was measured and normalized by the total energy loss (). The results are presented in Figure 8 with slope angles of 30°, 35°, 40° and a total surge volume of 39.6 L. For the slope angle of 40°, the total energy loss increases with time, reaching 65.78% at the final stage. The inelastic deformation of the dead zone () only accounts for 3.59% of the total energy loss, and the friction and penetration at the interaction face between surge2 and the dead zone () account for 1.94%. However, the surge2 inter-particle interaction accounts for 62.99% of the total energy loss. The remaining energy is absorbed by the flume and barrier friction. Using the same method, we calculated the energy loss at the other flow conditions (Table 5), and the results show a very small variation. Thus, we conclude that during multiple-surge impact, the enhanced inter-particle interaction within the subsequent surge is the main process of energy consumption.
4. Discussion
4.1. Prediction of Multiple-Surge Impact Forces
Calculating debris flow impact forces is an important part of structure design and risk mapping [3,11,14,28,31]. For decades, many impact force prediction models have been proposed for engineering purposes [11], and the hydraulic model is commonly used because it is simple and easy to use [11,14,31]. Generally, the maximum flow velocity and depth are used to predict the peak force on the barrier [14,31]. However, this strategy ignores the complex debris–barrier interaction mechanism, such as the dead zone formation, which has been shown to be an important factor when addressing the impact forces on the barrier [13,23,31]. Therefore, the impact force exerted on a barrier by dry granular flows may be overestimated, leading to needless construction costs [23]. Koo et al. [23] proposed a simplified load model based on rigid body motion, assuming that the dead zone formed during debris–barrier interaction is triangular shaped with an inclined free surface. When the second flow reaches the tail of the dead zone, the velocity and depth are recorded before the flow moves up along the free surface of the dead zone and finally impacts the barrier. During this process, Koo et al. [23] only considered the kinetic energy loss caused by interface friction and gravity, which is similar to rigid body motion. In our simulation (Section 3), the interface friction only accounts for a small fraction of the energy loss (~2%), and most of the energy is dissipated by the inter-particle interaction within the moving flow; the inelastic deformation of the dead zone also dissipates some of the energy (~5%). Thus, predicting the impact force on a barrier is complex and requires further investigation.
While multiple-surge impact is a more complex process, it is more realistic than single-surge impact; however, very few models account for the multiple-surge impact forces. Tan et al. [7] studied multiple-surge impact on a flexible barrier; however, the impact force was calculated separately and was based on single-surge impact. Albaba et al. [28] proposed an analytic solution based on the granular jump theory and depth-averaged method for calculating the time–history curve of granular flow impact on a rigid barrier. This method may be suitable for predicting the force of multiple-surge impact because it is strongly time-dependent.
In the model of Albaba et al. [28], the total impact force on the barrier is composed of the static force exerted by the dead zone behind the barrier and the inertia force of the flowing mass:
where C and are time-dependent factors calculated using Equations (6) and (7); is the particle density; and are the depth-averaged solid volume fraction and flow velocity of the subsequent flow, respectively; is the flow depth; is the flume width; is the solid volume fraction of the dead zone (0.6 is suggested by Albaba et al. [28]); g is gravity; and is the flume angle.
here, denotes the granular jump height as in Equation (8); is the Froude number; is the ratio of to ; is a shape coefficient; is the Coulomb friction coefficient of the dead zone (Albaba et al. [28] used ); and and are the length and height of the dead zone, respectively.
Albaba et al. [28] suggested that when the slope angle () is lower than the inter-friction angle (arctan), the dead zone formed behind the barrier has a rectangular shape; thus, the shape coefficient ( equals 1, and are assumed equal, and can be estimated from the previous time step, as formulated by Equation (9):
The impact forces on the barrier in the cases of multiple-surge impact with a slope angle of 30°, 35° and 40° (arctan = 53°, hence = 1) are back-analyzed based on the model of Albaba et al. [28]. Table 6 shows that the model prediction is not satisfactory, especially when the flume is steep. For example, under , the peak force of the first surge impact is underestimated by ~31.84%, and the total peak force during the second surge impact is underestimated by ~14.71%. However, under , the model performs well with the peak force and main evolution being reasonably well captured. The discrepancy may be explained by the inaccurate representation of the shape of the dead zone. Based on Albaba et al. [28], the dead zone formed by the granular flow was modeled as rectangular; however, our numerical modeling of the dead zone showed an almost trapezoidal shape with a steep free surface (Figure 4 and Figure 5). This misrepresentation of the dead-zone shape effect is the main flaw of this model. To overcome this problem, we used a larger shape coefficient () (Table 6), which improved the accuracy of the results. Additionally, when the second surge impacts the dead zone formed by the first surge, it causes deformation of the dead zone (Figure 2), which may account for the overestimation of the prediction at the second stage, especially for high values (Table 6). In addition, the momentum transfer effect of the dead zone has also not been properly addressed.
4.2. Engineering Implications and Limitations
Our multiple-surge simulation presents a more realistic case than the single-surge case when addressing debris flows or debris avalanche barrier design in engineering practice because multiple-surge impact is more commonly encountered in nature [7,21]. As multiple-surge impact is not normally incorporated into barrier design, our results offer preliminarily insights for structural engineers. Overall, for flow masses with the same total volume, a barrier will be safer under multiple-surge impact than under single-surge impact because the deposition spreading distance is extended by 6%~20% and the impact force is reduced by 6%~30%. These findings are useful when considering barrier design that utilizes only single-surge impact theory because they provide assurance that the design has an adequate safety margin in the more common multiple-surge events. The multiple-surge impact mechanism discussed in this paper is essential for establishing the design strategy for barrier structures planned to withstand multiple-surge impact, as these should be carefully addressed in the impact force prediction model. For example, to improve the performance of the original depth-averaged model, two factors should be addressed: the dead-zone shape effect and the momentum transfer effect of the dead zone. As shown in Figure 5 and Table 3, a portion of the material deposited behind the barrier can be retained, especially when the slope is gentle, as the impact force decreases and the capture capacity of the barrier increases. However, one should be extremely careful when using our conclusions when the slope is steeper, because under such a condition, the retaining capacity of the barrier is small and overflow may be more likely to occur. Additionally, our study simulates dry granular flows; thus, the results may be more suitable for arid regions and where small flow events are dominant. It is important to note that our research aims to highlight the importance of the multiple-surge impact process in debris–barrier interaction and to present some preliminarily guidelines for barrier structure design, although a comprehensive design strategy needs to consider multiple aspects. In future research, more experiments, including numerical simulation and physical modeling, are needed to obtain a deeper understanding of multiple-surge impact and establish a reliable and verified design method.
Being a preliminary study, we acknowledge that there are still some open issues that have not been resolved. For example, our analysis showed interesting trends in the effect of the flow-mass volume on the deposition morphology and peak force on the barrier, which requires further study. Adding viscous flows to our model is another research path which should be investigated in detail because the impact behavior would be considerably different from the friction flow pattern in the current model [13]; viscous flows may develop distinct energy distribution routes and will need specific barrier design strategies.
5. Conclusions
When granular flows encounter a rigid barrier, the debris–barrier interaction is a crucial but challenging issue in landslide mitigation measurements design and vulnerability analysis of buildings. Current research on this issue focuses on single-surge impact conditions while the multiple-surge impact mechanism remains unclear, although multi-surge events are more common in engineering practice. In this study, we present some DEM-based numerical simulations that offer preliminary insights into barrier design against multiple-surge impact. The main conclusions are as follows:
- (1)
- For cases in which the total volume of flow material is the same, the barrier is safer under double-surge impact than under single-surge impact, as the deposition spreading distance is extended by 6%~20% and the impact force is reduced by 6%~30%.
- (2)
- Compared with single-surge impact, the energy dissipated by particle–particle interaction during double-surge impact is enhanced by 20% because of the effect of the dead zone.
- (3)
- After the first surge is deposited and the dead zone is formed, the second surge arrives, and a large portion of the energy is dissipated when the second surge interacts with the dead zone. The second flow then impacts the barrier, generating a negligible impact force. The momentum of the subsequent surge is transmitted to the barrier mainly through the dead zone. Thus, the dead zone serves as an effective cushioning layer that protects the barrier.
- (4)
- Multiple-surge impact is a complex process. During the interaction between subsequent surges and the dead zone, three energy consumption mechanisms were identified: (1) friction and penetration at the interaction surface between surge2 and the dead zone, (2) inelastic deformation of the dead zone and (3) inter-particle interaction within surge2. These three mechanisms account for about 2%, 3% and 63% of the total energy loss, respectively.
- (5)
- The depth-averaged model based on granular jump theory may be a promising solution for predicting the multiple-surge impact force on the barrier. However, the performance of the original version is less satisfactory due to the dead zone shape effect, the cushion effect and the dead zone transition, leading to deformation not being reasonably addressed.
Author Contributions
Conceptualization, Y.H.; data curation, B.Z.; formal analysis, B.Z.; funding acquisition, Y.H.; investigation, B.Z.; project administration, Y.H.; resources, Y.H. and P.L.; software, B.Z.; supervision, Y.H., P.L. and C.L.; validation, P.L.; visualization, B.Z.; writing—original draft, B.Z.; writing—review and editing, B.Z. All authors have read and agreed to the published version of the manuscript.
Funding
This work was supported by the National Natural Science Foundation of China (grant No. 41831291).
Acknowledgments
The authors thank the editor and the reviewers for their help to improve the quality of our manuscript.
Conflicts of Interest
The authors declare no conflict of interest.
Appendix A
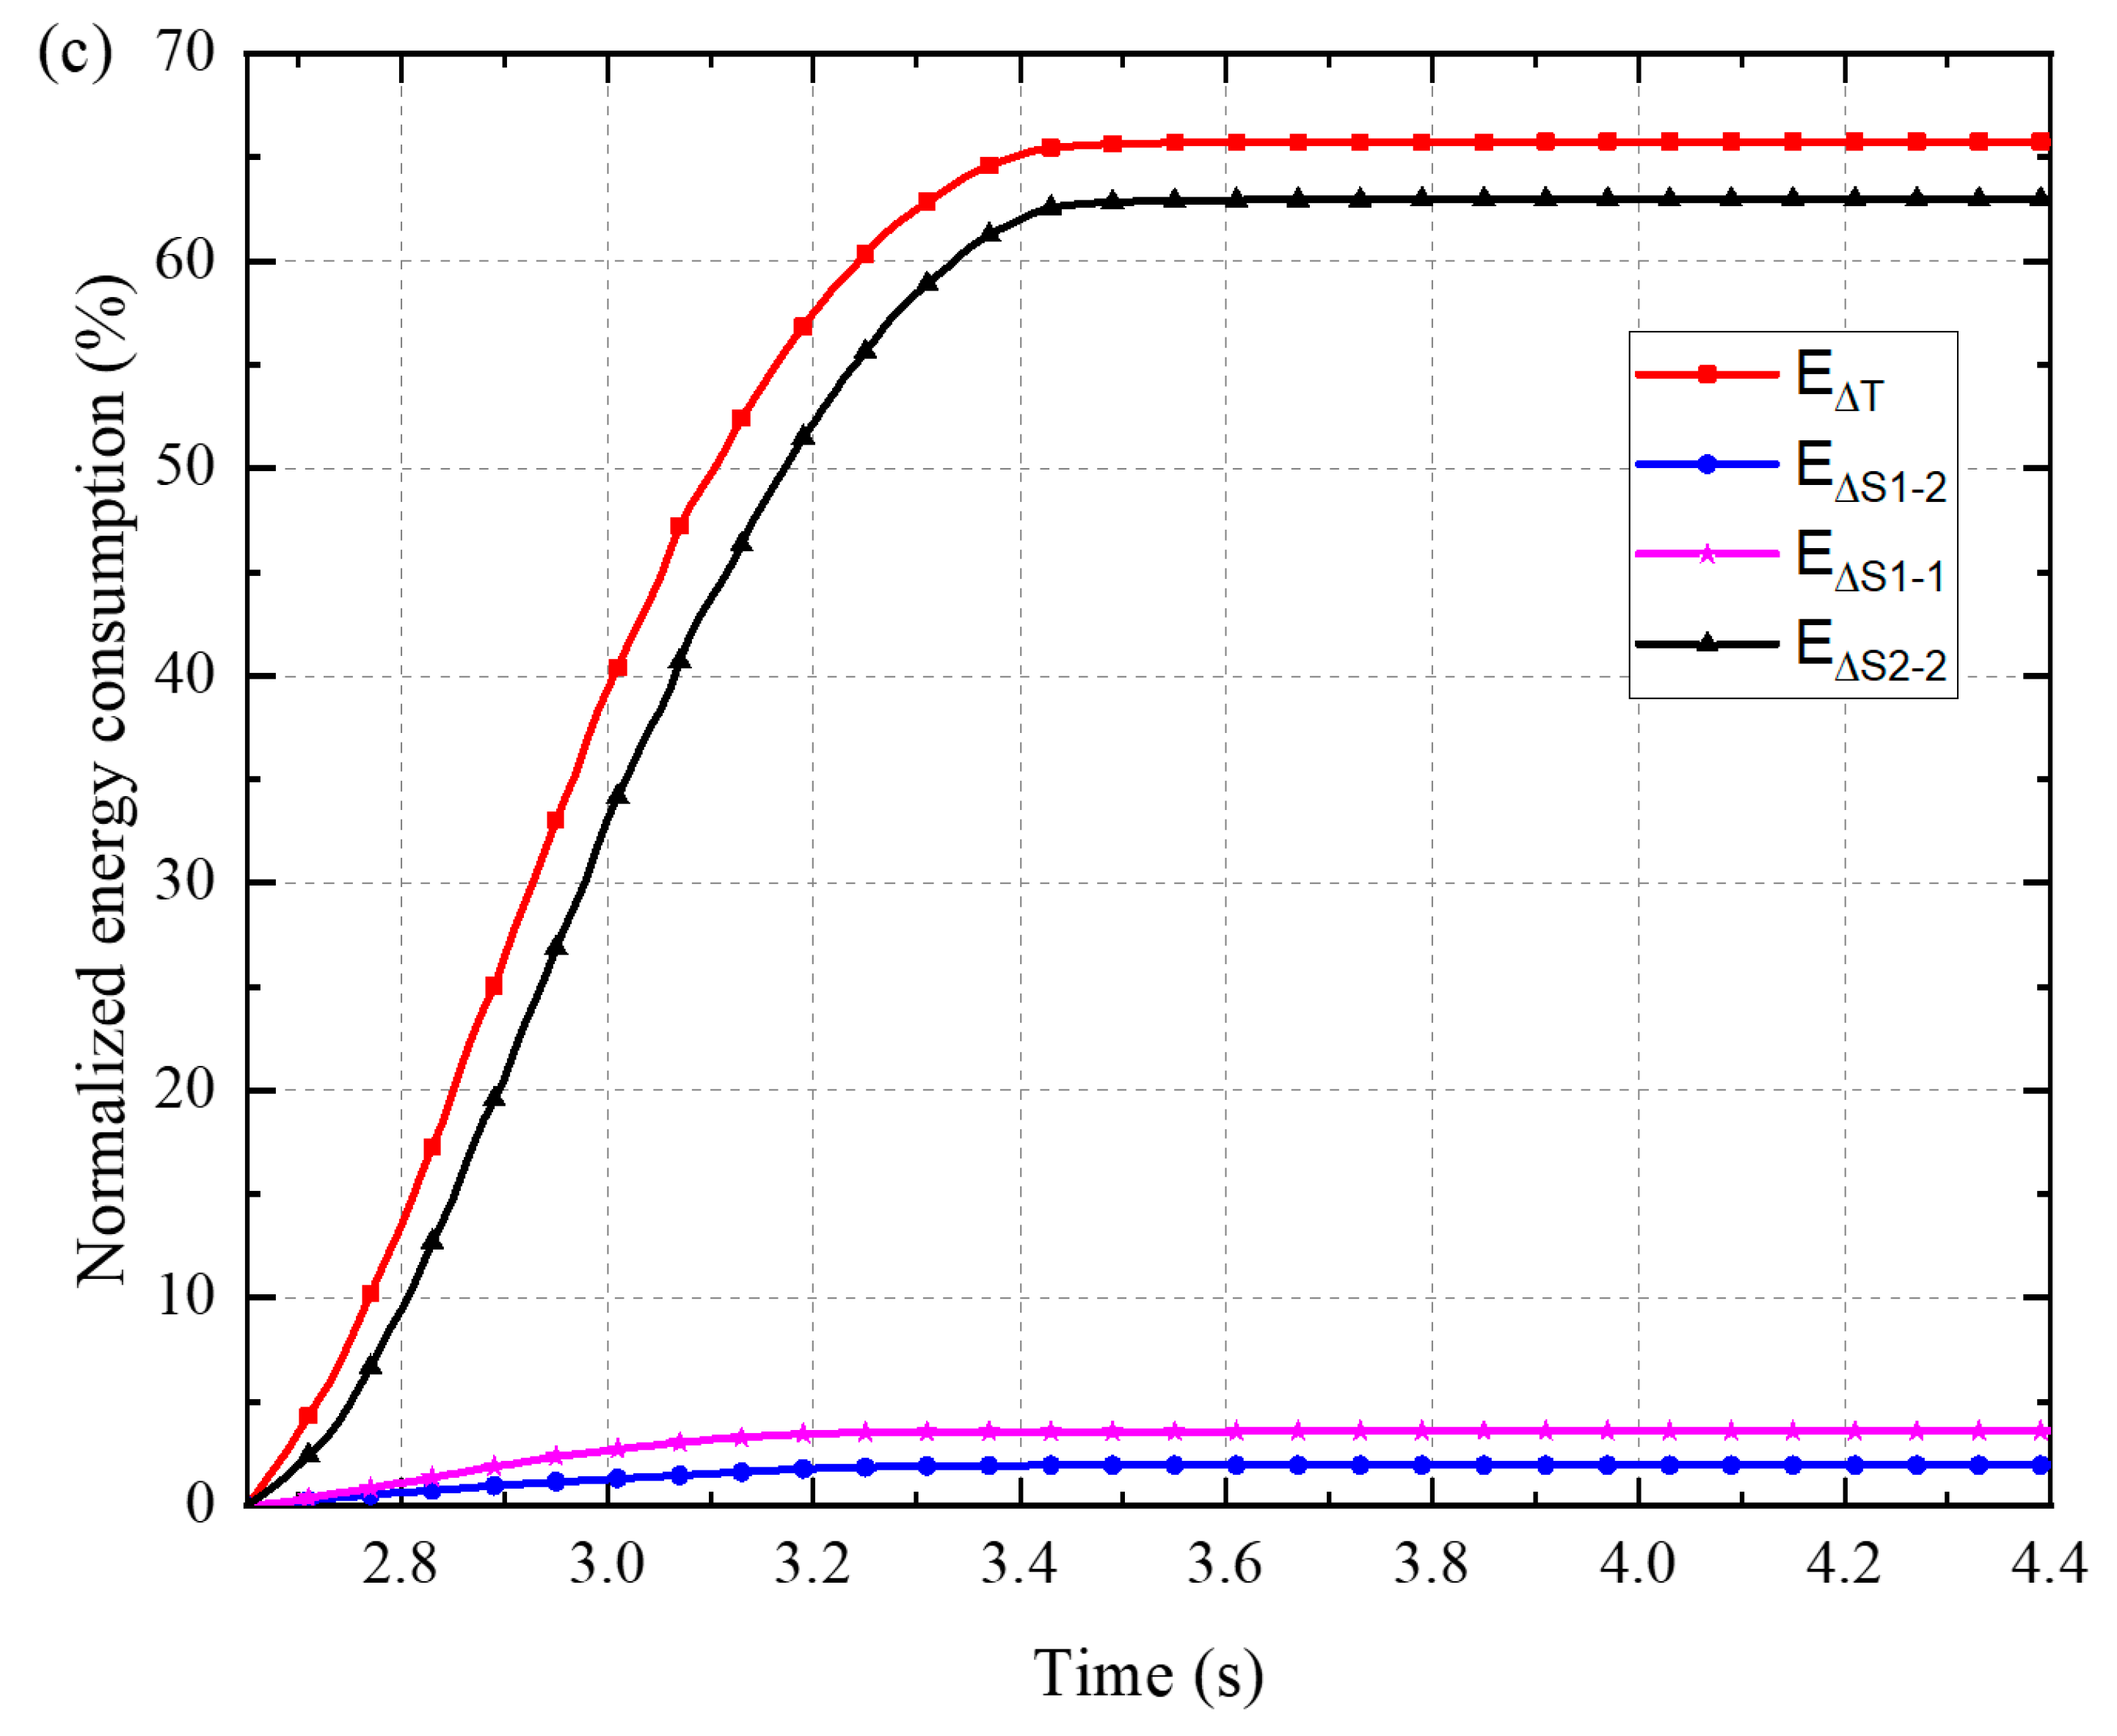
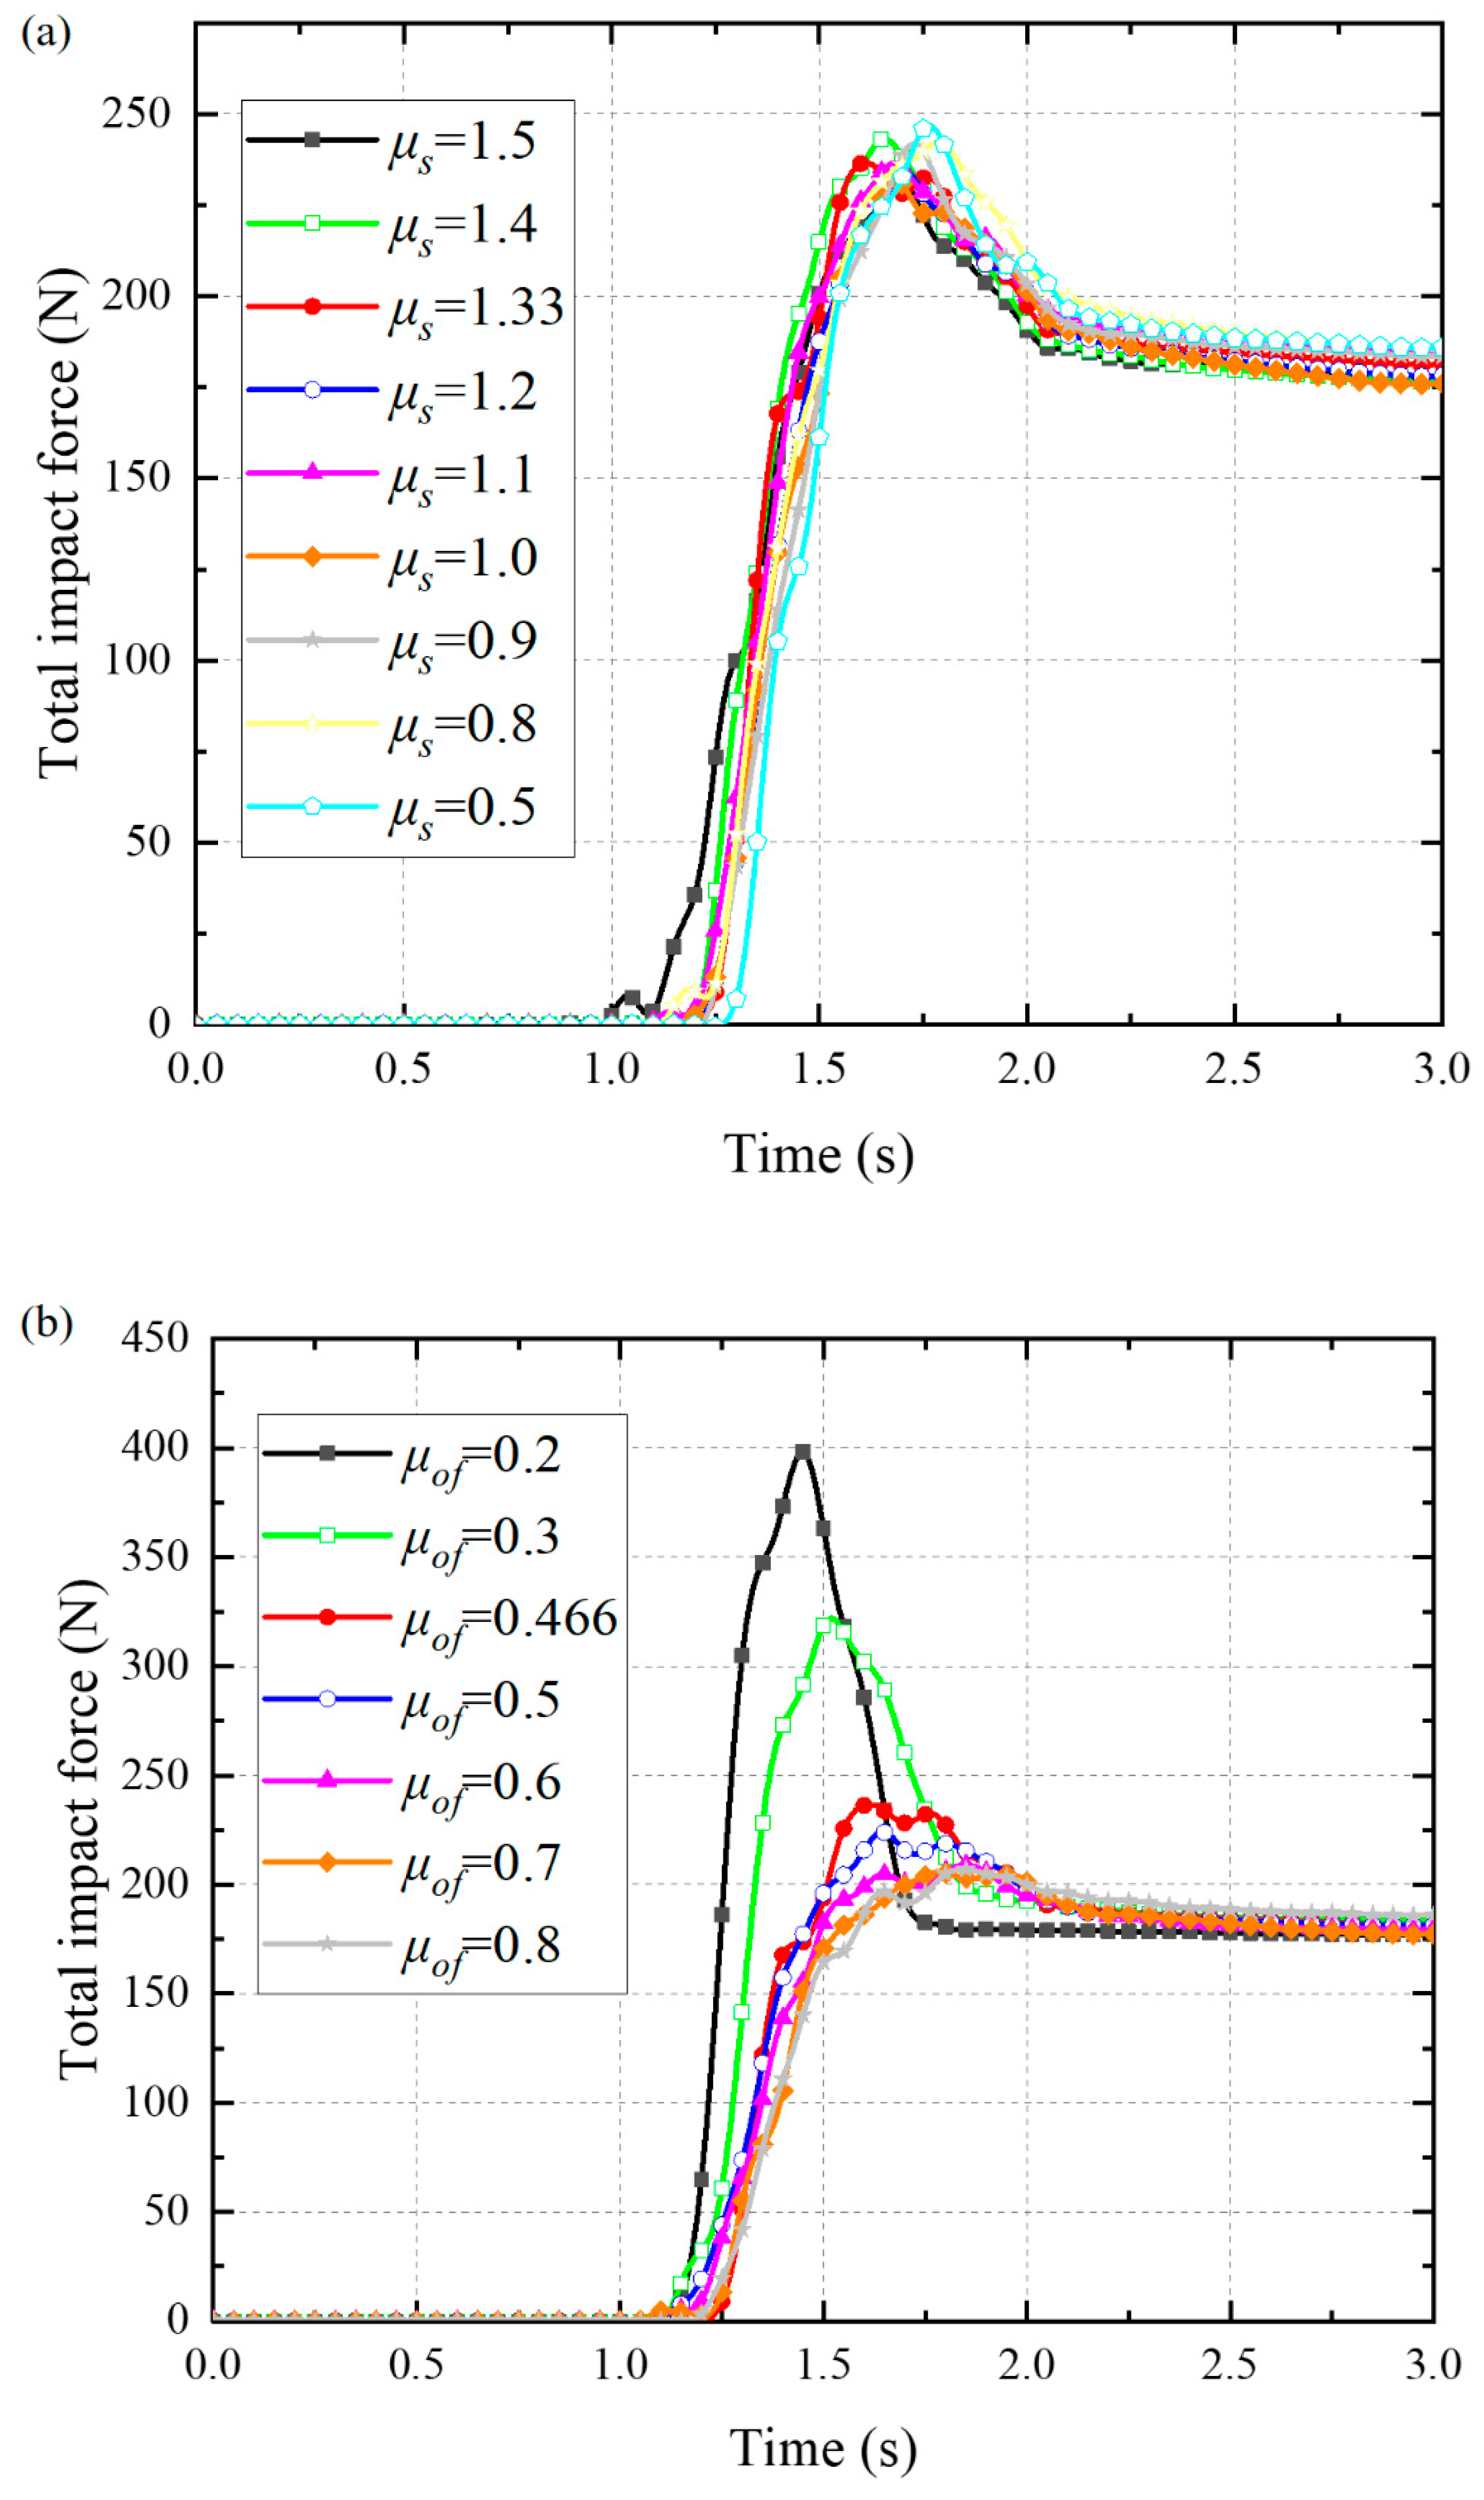
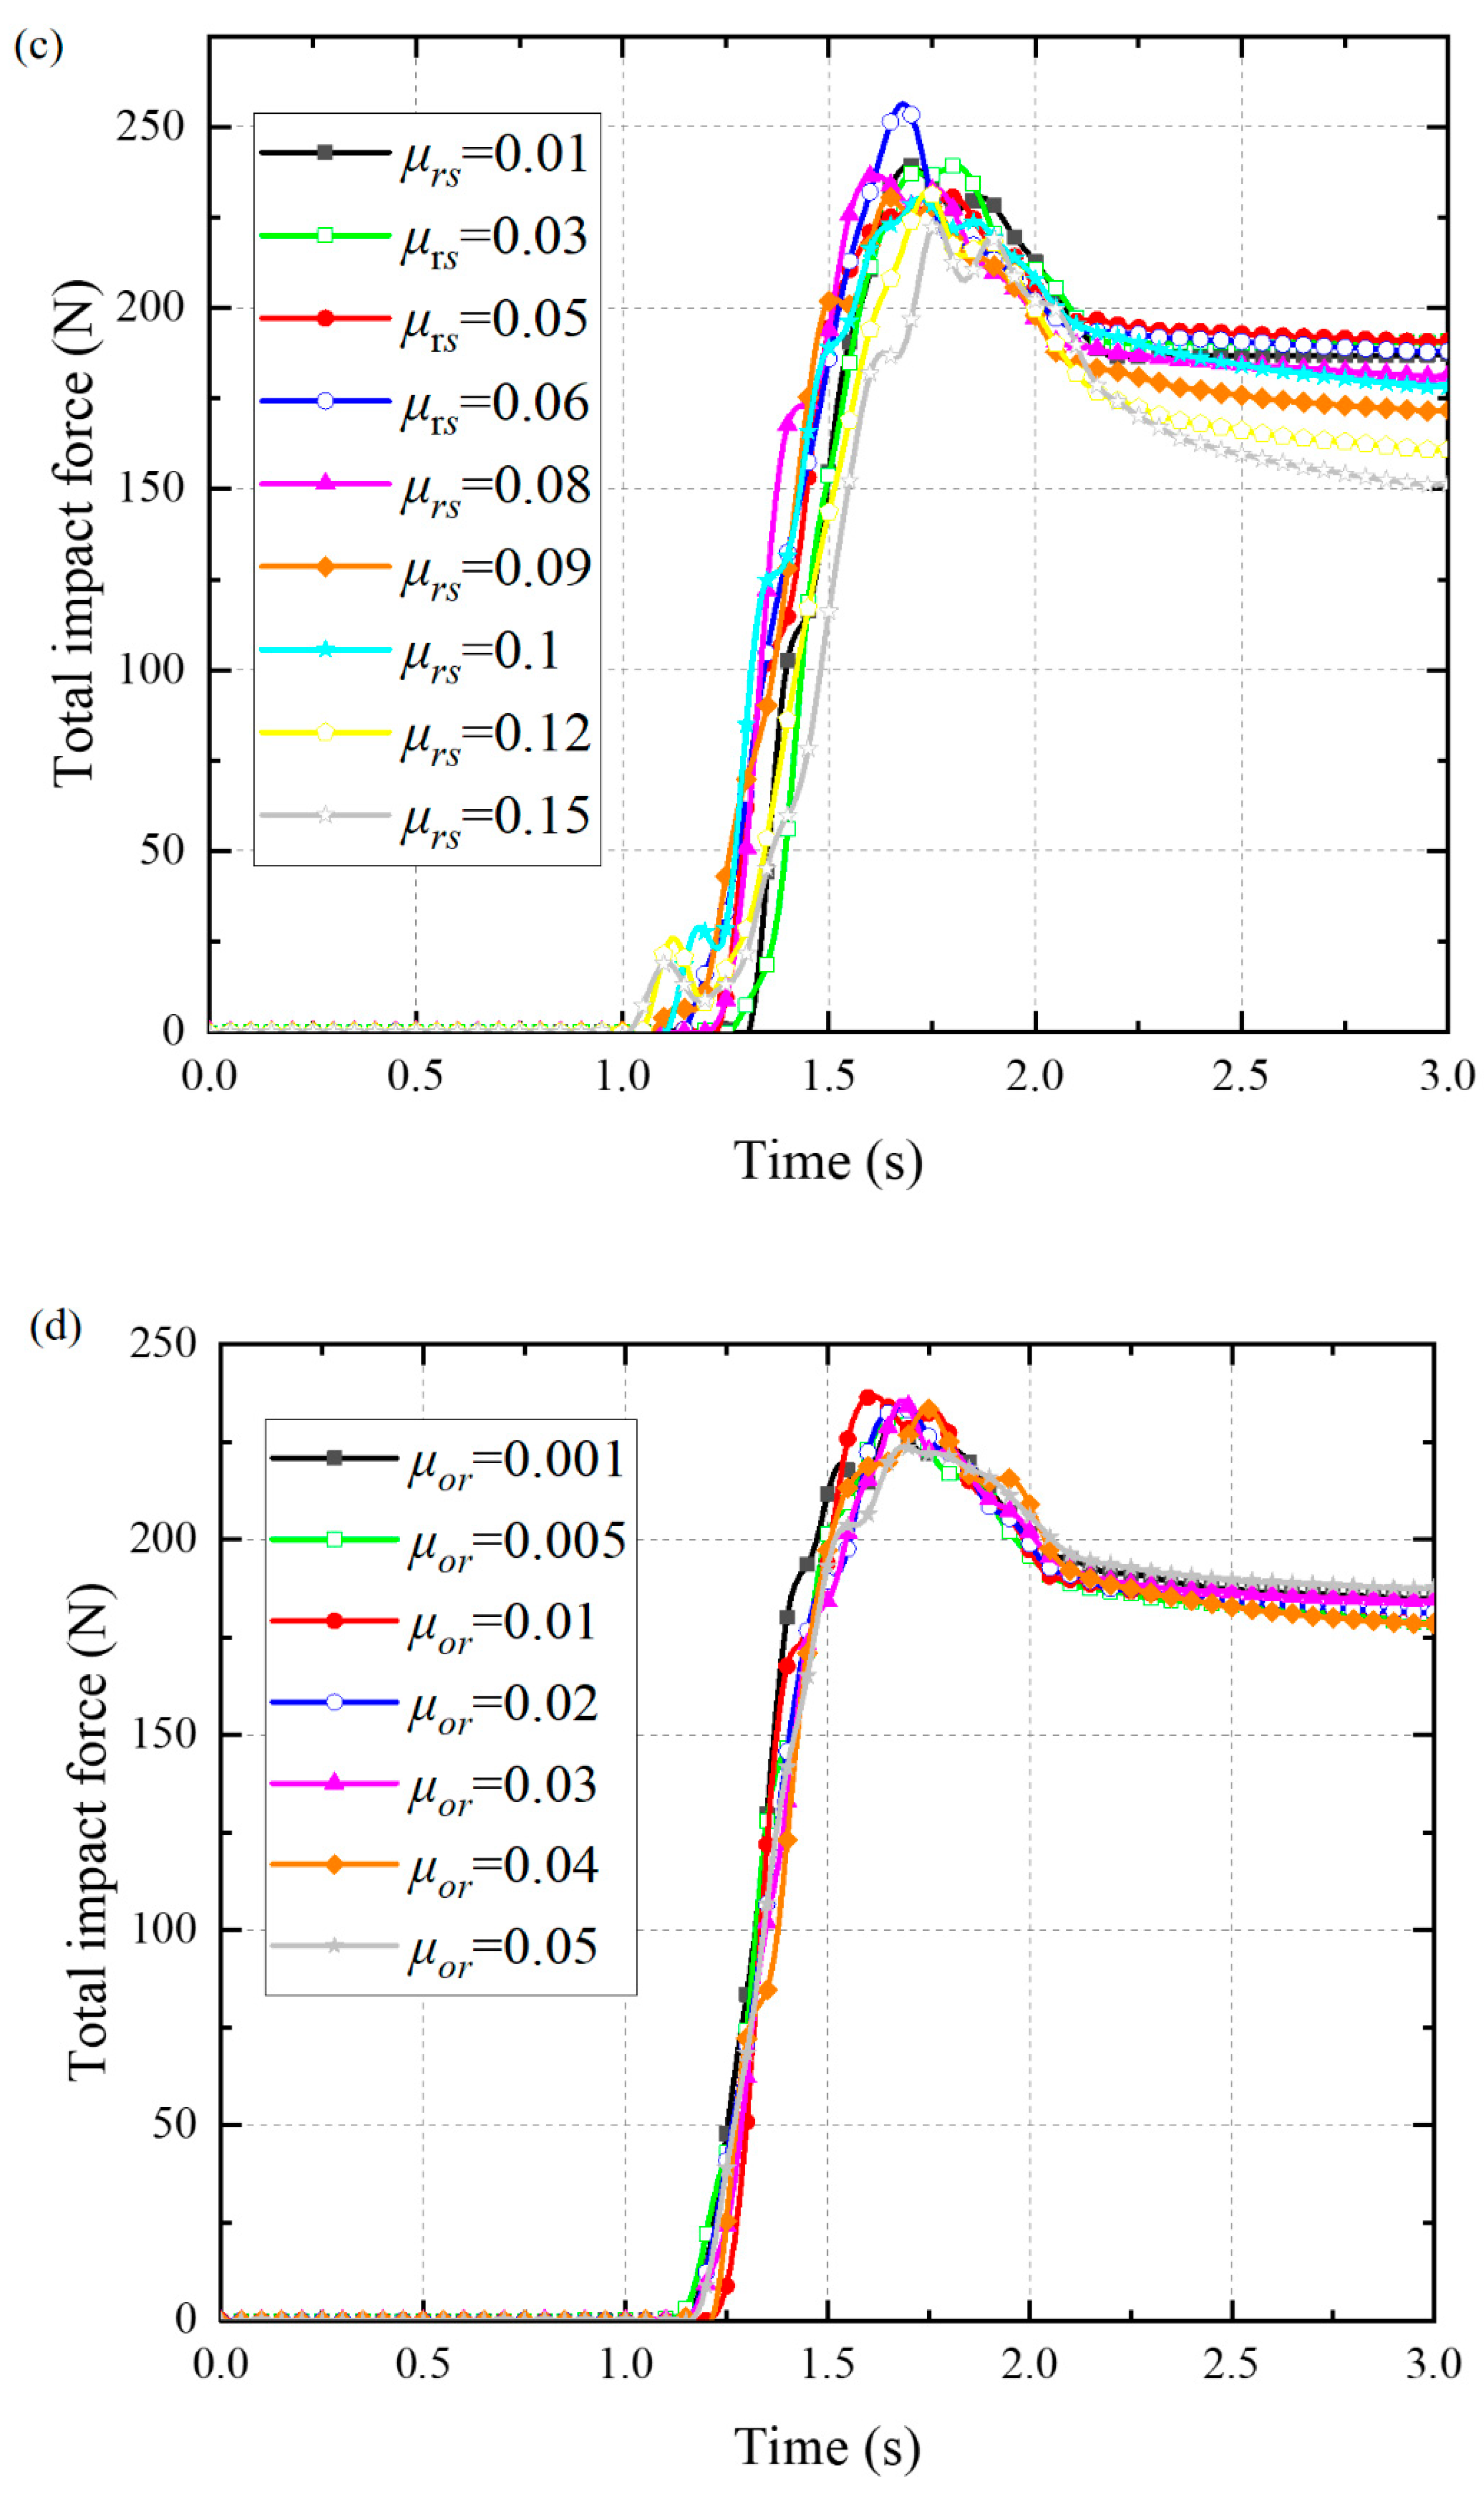
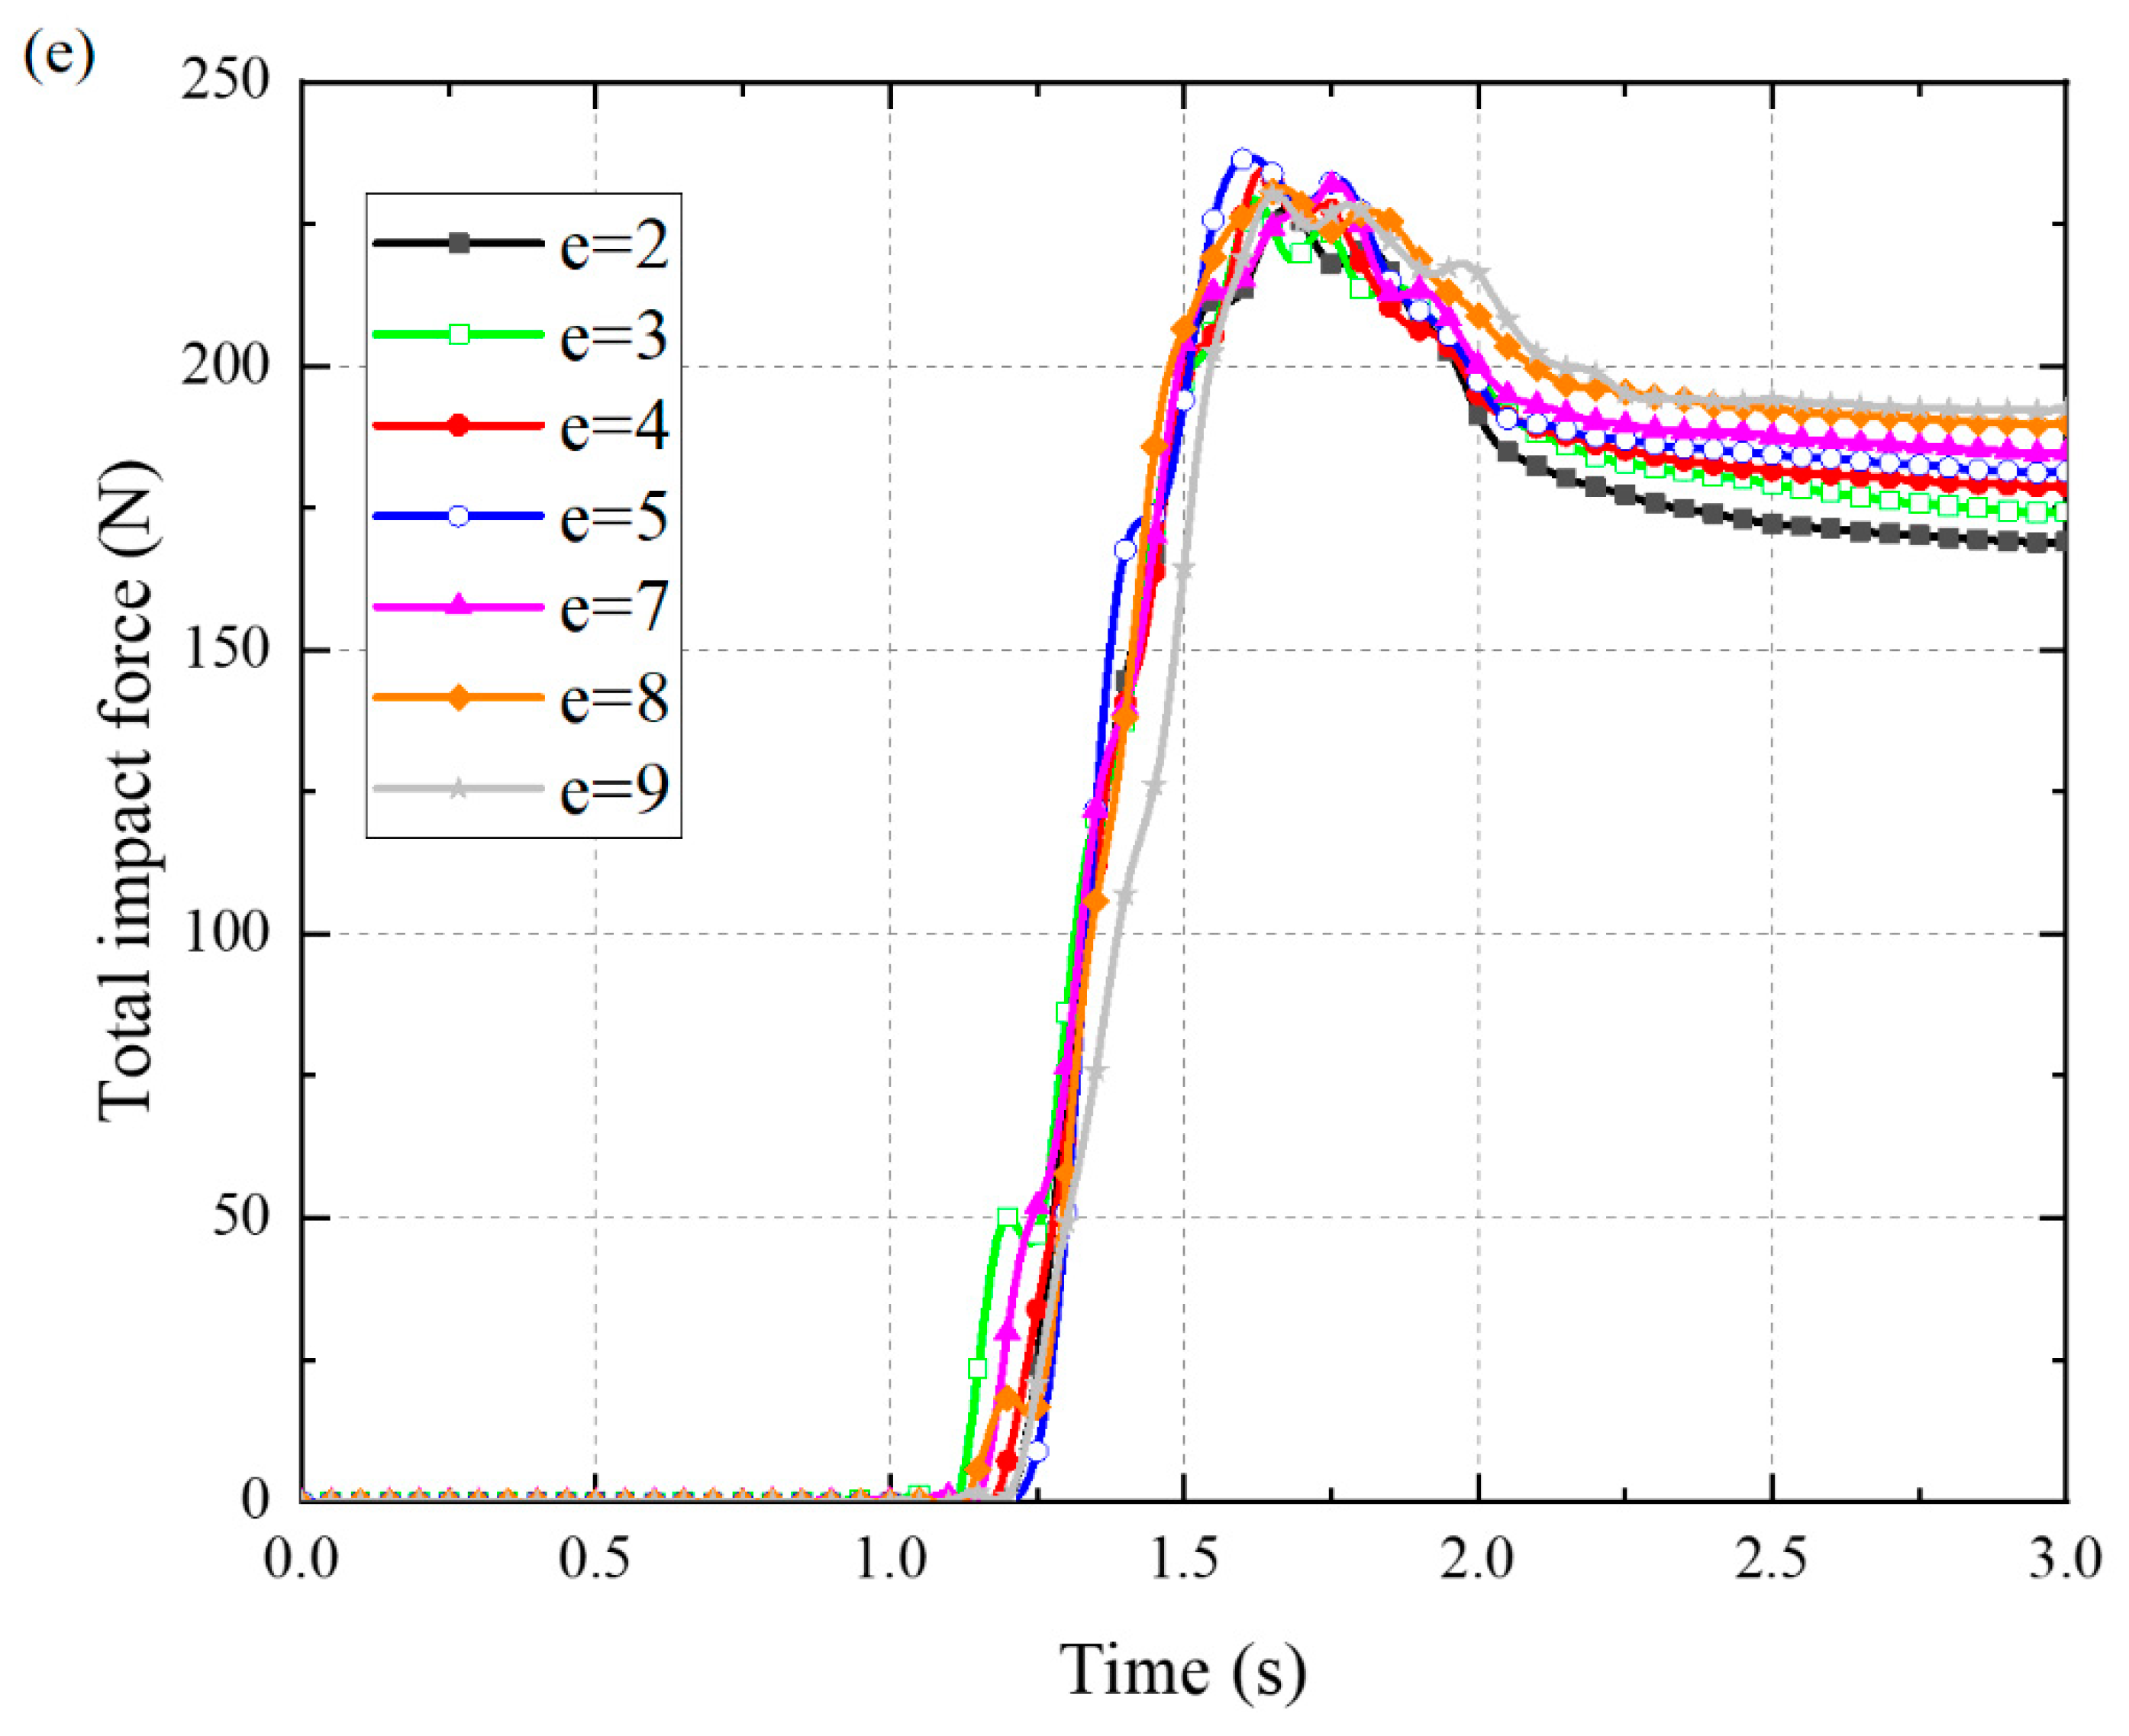
In this Appendix, we examine the effect of input parameter variation, including , , , and e, on impact force computed by the proposed DEM model. The results are presented in Figure A1a–e. It is observed that the results are most sensitive to the variation of the static friction coefficient of flume–particle interaction () especially in peak value (Figure A1b) and the rolling friction coefficient of inter-particle interaction (), especially in residual stage (Figure A1c). In the process of verification, the impact force is compared between physical tests and numerical simulations, while in our interpretation, the energy evolutions during debris–barrier interaction are adopted. We have confidence that these results are reliable, because the impact force on barrier is directly related to flow velocity and flow depth, which is controlled by the amount of energy dissipated in particle scale of granular flow.
Figure A1.
Sensitivity analysis showing the effect of input parameter variation, including (a) , (b) , (c) , (d) and (e) e, on impact force computed by the proposed DEM model.
Figure A1.
Sensitivity analysis showing the effect of input parameter variation, including (a) , (b) , (c) , (d) and (e) e, on impact force computed by the proposed DEM model.


References
- Li, Y.; Ma, C.; Wang, Y. Landslides and debris flows caused by an extreme rainstorm on 21 July 2012 in mountains near Beijing, China. Bull. Eng. Geol. Environ. 2017. [Google Scholar] [CrossRef]
- Thouret, J.C.; Antoine, S.; Magill, C.; Ollier, C. Lahars and debris flows: Characteristics and impacts. Earth-Sci. Rev. 2020, 201, 103003. [Google Scholar] [CrossRef]
- Dai, Z.L.; Huang, Y.; Cheng, H.L.; Xu, Q. SPH model for fluid–structure interaction and its application to debris flow impact estimation. Landslides 2017, 14, 917–928. [Google Scholar] [CrossRef]
- Wang, D.P.; Li, Q.Z.; Bi, Y.Z.; He, S.M. Effects of new baffles system under the impact of rock avalanches. Eng. Geol. 2020, 264. [Google Scholar] [CrossRef]
- Bi, Y.Z.; He, S.M.; Du, Y.J.; Sun, X.P.; Li, X.P. Effects of the configuration of a baffle–avalanche wall system on rock avalanches in Tibet Zhangmu: Discrete element analysis. Bull. Eng. Geol. Environ. 2018, 78, 2267–2282. [Google Scholar] [CrossRef]
- Song, D.; Zhou, G.G.D.; Xu, M.; Choi, C.E.; Li, S.; Zheng, Y. Quantitative analysis of debris-flow flexible barrier capacity from momentum and energy perspectives. Eng. Geol. 2019, 251, 81–92. [Google Scholar] [CrossRef]
- Tan, D.Y.; Yin, J.H.; Qin, J.Q.; Zhu, Z.H.; Feng, W.Q. Experimental study on impact and deposition behaviours of multiple surges of channelized debris flow on a flexible barrier. Landslides 2020. [Google Scholar] [CrossRef]
- Leonardi, A.; Goodwin, G.R.; Pirulli, M. The force exerted by granular flows on slit dams. Acta Geotech. 2019, 14, 1949–1963. [Google Scholar] [CrossRef]
- Zhou, G.G.D.; Du, J.H.; Song, D.R.; Choi, C.E.; Hu, H.S.; Jiang, C. Numerical study of granular debris flow run-up against slit dams by discrete element method. Landslides 2020, 17, 585–595. [Google Scholar] [CrossRef]
- Rossi, G.; Armanini, A. Impact force of a surge of water and sediments mixtures against slit check dams. Sci. Total Environ. 2019, 683, 351–359. [Google Scholar] [CrossRef]
- Vagnon, F. Design of active debris flow mitigation measures: A comprehensive analysis of existing impact models. Landslides 2020, 17, 313–333. [Google Scholar] [CrossRef]
- Ng, C.W.W.; Choi, C.E.; Koo, R.C.H.; Goodwin, G.R.; Song, D.; Kwan, J.S.H. Dry granular flow interaction with dual-barrier systems. Geotechnique 2018, 68, 386–399. [Google Scholar] [CrossRef] [Green Version]
- Ng, C.W.W.; Song, D.; Choi, C.E.; Liu, L.H.D.; Kwan, J.S.H.; Koo, R.C.H.; Pun, W.K. Impact mechanisms of granular and viscous flows on rigid and flexible barriers. Can. Geotech. J. 2016, 54, 188–206. [Google Scholar] [CrossRef]
- Jiang, Y.J.; Towhata, I. Experimental Study of Dry Granular Flow and Impact Behavior Against a Rigid Retaining Wall. Rock Mech. Rock Eng. 2013, 46, 713–729. [Google Scholar] [CrossRef]
- Tan, D.Y.; Yin, J.H.; Zhu, Z.H.; Qin, J.Q.; Chan, H.C.M. Fast Door-Opening Method for Quick Release of Rock Boulder or Debris in Large-Scale Physical Model. Int. J. Geomech. 2020, 20. [Google Scholar] [CrossRef]
- Luo, H.Y.; Zhang, L.M. Earth Pressure Buildup in Impacting Earth Flow behind a Barrier. Int. J. Geomech. 2020, 20. [Google Scholar] [CrossRef]
- Gao, G.; Meguid, M.A. Modeling the Impact of a Falling Rock Cluster on Rigid Structures. Int. J. Geomech. 2018, 18. [Google Scholar] [CrossRef]
- Jiang, Y.J.; Wang, Z.Z.; Song, Y.; Xiao, S.Y. Cushion Layer Effect on the Impact of a Dry Granular Flow against a Curved Rock Shed. Rock Mech. Rock Eng. 2018, 51, 2191–2205. [Google Scholar] [CrossRef]
- Faug, T.; Lachamp, P.; Naaim, M. Experimental investigation on steady granular flows interacting with an obstacle down an inclined channel: Study of the dead zone upstream from the obstacle. Application to interaction between dense snow avalanches and defence structures. Nat. Hazards Earth Syst. Sci. 2002, 2, 187–191. [Google Scholar] [CrossRef]
- Jiang, R.; Fei, W.P.; Zhou, H.W.; Huo, M.; Zhou, J.W.; Wang, J.M.; Wu, J.J. Experimental and numerical study on the load and deformation mechanism of a flexible net barrier under debris flow impact. Bull. Eng. Geol. Environ. 2020. [Google Scholar] [CrossRef]
- Albaba, A.; Lambert, S.; Kneib, F.; Chareyre, B.; Nicot, F. DEM Modeling of a Flexible Barrier Impacted by a Dry Granular Flow. Rock Mech. Rock Eng. 2017, 50, 3029–3048. [Google Scholar] [CrossRef]
- He, S.; Liu, W.; Li, X. Prediction of impact force of debris flows based on distribution and size of particles. Environ. Earth Sci. 2016, 75. [Google Scholar] [CrossRef]
- Koo, R.C.H.; Kwan, J.S.H.; Ng, C.W.W.; Lam, C.; Choi, C.E.; Song, D.; Pun, W.K. Velocity attenuation of debris flows and a new momentum-based load model for rigid barriers. Landslides 2016, 14, 617–629. [Google Scholar] [CrossRef]
- Shen, W.G.; Zhao, T.; Dai, F.; Jiang, M.J.; Zhou, G.G.D. DEM analyses of rock block shape effect on the response of rockfall impact against a soil buffering layer. Eng. Geol. 2019, 249, 60–70. [Google Scholar] [CrossRef]
- Ng, C.W.W.; Su, Y.; Choi, C.E.; Song, D.; Lam, C.; Kwan, J.S.H.; Chen, R.; Liu, H. Comparison of Cushioning Mechanisms between Cellular Glass and Gabions Subjected to Successive Boulder Impacts. J. Geotech. Geoenvironmental Eng. 2018, 144, 04018058. [Google Scholar] [CrossRef]
- Soga, K.; Alonso, E.; Yerro, A.; Kumar, K.; Bandara, S. Trends in large-deformation analysis of landslide mass movements with particular emphasis on the material point method. Géotechnique 2015, 66, 248–273. [Google Scholar] [CrossRef] [Green Version]
- Huang, Y.; Cheng, H.L.; Dai, Z.L.; Xu, Q.; Liu, F.; Sawada, K.; Moriguchi, S.; Yashima, A. SPH-based numerical simulation of catastrophic debris flows after the 2008 Wenchuan earthquake. Bull. Eng. Geol. Environ. 2015, 74, 1137–1151. [Google Scholar] [CrossRef]
- Albaba, A.; Lambert, S.; Faug, T. Dry granular avalanche impact force on a rigid wall: Analytic shock solution versus discrete element simulations. Phys. Rev. E 2018, 97, 052903. [Google Scholar] [CrossRef]
- Bi, Y.; He, S.; Li, X.; Ouyang, C.; Wu, Y. Effects of segregation in binary granular mixture avalanches down inclined chutes impinging on defending structures. Environ. Earth Sci. 2016, 75. [Google Scholar] [CrossRef]
- Zhou, G.G.D.; Song, D.; Choi, C.E.; Pasuto, A.; Sun, Q.C.; Dai, D.F. Surge impact behavior of granular flows: Effects of water content. Landslides 2018, 15, 695–709. [Google Scholar] [CrossRef]
- Shen, W.G.; Zhao, T.; Zhao, J.D.; Dai, F.; Zhou, G.G.D. Quantifying the impact of dry debris flow against a rigid barrier by DEM analyses. Eng. Geol. 2018, 241, 86–96. [Google Scholar] [CrossRef]
Figure 1.
Discrete element method (DEM) model.

Figure 2.
Comparison of flow and deposition morphology between physical and experimental results [14]: (a–f) obtained by us and DEM simulation results (a1–f1).
Figure 2.
Comparison of flow and deposition morphology between physical and experimental results [14]: (a–f) obtained by us and DEM simulation results (a1–f1).

Figure 3.
Evolution of the impact force on a rigid barrier showing the numerical results (red line) and physical experimental results [14] (blue line).
Figure 3.
Evolution of the impact force on a rigid barrier showing the numerical results (red line) and physical experimental results [14] (blue line).

Figure 4.
Simulation results showing the interaction between surge2 and the dead zone formed by surge1. The slope angle is 40° and surge volume is 19.8 L.
Figure 4.
Simulation results showing the interaction between surge2 and the dead zone formed by surge1. The slope angle is 40° and surge volume is 19.8 L.

Figure 5.
The final deposition morphology of the single-surge and multiple-surge impact for slope angles 40°, 35° and 30° and surge volumes V1 = 19.8 L, V2 = 15.84 L and V3 = 9.9 L.
Figure 5.
The final deposition morphology of the single-surge and multiple-surge impact for slope angles 40°, 35° and 30° and surge volumes V1 = 19.8 L, V2 = 15.84 L and V3 = 9.9 L.

Figure 6.
Typical time–history curve of the impact force on a rigid barrier showing the evolution of the single-surge impact and multiple-surge impact (surge1 and surge2). The slope angle is (a) 30°, (b) 35° and (c) 40°. The total surge volume is 39.6 L.
Figure 6.
Typical time–history curve of the impact force on a rigid barrier showing the evolution of the single-surge impact and multiple-surge impact (surge1 and surge2). The slope angle is (a) 30°, (b) 35° and (c) 40°. The total surge volume is 39.6 L.


Figure 7.
Normalized total energy of the debris surge with a slope angle of 40° and surge volume of 39.6 L. The vertical dashed lines mark critical times of the flow front. t0 and t1 are the time the flow fronts reach the barrier, while t2 is the time when surge2 arrives at the dead zone formed by surge1.

Figure 8.
Energy consumption during the interaction process between surge2 and the dead zone formed by surge1. The slope angle is (a) 30°, (b) 35° and (c) 40°. The total surge volume is 39.6 L. The initial time is readjusted to t = 2.65 s when the front of surge2 reaches the tail of the dead zone, which means we focus only on the interaction process.


Table 1.
DEM input parameters.
| Material Parameters | Value | Source |
|---|---|---|
| Particle diameter (mm) | 10–20 | [14] |
| Particle density (kg/m3) | 2550 | Lime stone |
| Young’s modulus of particle (MPa) | 100 | [14] |
| Particle Poisson’s ratio | 0.25 | Lime stone |
| Barrier/flume density (kg/m3) | 7900 | Steel material |
| Young’s modulus of barrier/flume (GPa) | 200 | Steel material |
| Poisson’s ratio of barrier/flume | 0.3 | Steel material |
| Coefficient of restitution | 0.5 | Calibration |
| Particle friction coefficient | 1.33 | [14] |
| Particle rolling friction coefficient | 0.08 | Calibration |
| Flume friction coefficient | 0.466 | [14] |
| Barrier friction coefficient | 0.384 | [14] |
| Flume/barrier rolling friction coefficient | 0.01 | Calibration |
Table 2.
DEM simulation program.
| Case Number | Surge Number | Initial Deposition Volume/L | Slope Angle |
|---|---|---|---|
| 1 | Single surge | V1:39.6 | 30°, 35°, 40° |
| 2 | Surge1 and surge2 | 0.5V1:19.8 | |
| 3 | Single surge | V2:31.68 | |
| 4 | Surge1 and surge2 | 0.5V2:15.84 | |
| 5 | Single surge | V3:19.8 | |
| 6 | Surge1 and surge2 | 0.5V3:9.9 |
Table 3.
Quantitative description of the effect of multiple-surge impact on the spreading distance of debris deposition.
Table 3.
Quantitative description of the effect of multiple-surge impact on the spreading distance of debris deposition.
| Slope Angle | Block Volume1 | Block Volume2 | Block Volume3 |
|---|---|---|---|
| 30° | 12.58% | 18.59% | 17.62% |
| 35° | 6.80% | 12.98% | 9.32% |
| 40° | 6.48% | 11.07% | 10.00% |
Table 4.
Peak impact force reduction caused by the cushioning effect of the dead zone.
| Slope Angle | Block Volume1 | Block Volume2 | Block Volume3 |
|---|---|---|---|
| 40° | 7.43% | 17.84% | 12.51% |
| 35° | 21.48% | 24.02% | 15.15% |
| 30° | 32.65% | 31.38% | 22.93% |
Table 5.
Energy consumption mode during the interaction process between surge2 and the dead zone formed by surge1.
Table 5.
Energy consumption mode during the interaction process between surge2 and the dead zone formed by surge1.
| Slope Angle | Block Volume | |||
|---|---|---|---|---|
| 40 | V1 | 1.94% | 3.59% | 62.99% |
| V2 | 2.06% | 3.69% | 62.83% | |
| V3 | 2.27% | 3.73% | 62.19% | |
| 35 | V1 | 1.61% | 2.85% | 59.04% |
| V2 | 1.75% | 2.83% | 59.53% | |
| V3 | 1.99% | 2.95% | 58.86% | |
| 30 | V1 | 1.60% | 2.54% | 55.24% |
| V2 | 1.64% | 2.48% | 55.97% | |
| V3 | 2.53% | 4.01% | 87.12% |
Table 6.
Peak impact force estimated by the depth-averaged model.
| Slope Angle | 40° | 35° | 30° | |
|---|---|---|---|---|
| DEM results | First impact/N | 235.22 | 181.71 | 120.00 |
| Second impact/N | 359.59 | 230.10 | 131.12 | |
| Estimated results with = 1 | First impact/N | 160.34 | 113.06 | 109.40 |
| Error | −31.84% | −37.78% | −8.83% | |
| Second impact/N | 306.70 | 202.78 | 145.33 | |
| Error | −14.71% | −11.87% | 10.83% | |
| Estimated results with = 1.3 for the slope angle of 40 and with = 1.2 for the slope angle of 35 | First impact/N | 190.98 | 131.46 | / |
| Error | −18.81% | −27.66% | / | |
| Second impact/N | 376.87 | 264.37 | / | |
| Error | 4.80% | 14.89% | / | |
Note: a negative margin of error means that the impact force is underestimated, and a positive margin of error means that it is overestimated.
Publisher’s Note: MDPI stays neutral with regard to jurisdictional claims in published maps and institutional affiliations. |
© 2020 by the authors. Licensee MDPI, Basel, Switzerland. This article is an open access article distributed under the terms and conditions of the Creative Commons Attribution (CC BY) license (http://creativecommons.org/licenses/by/4.0/).
Share and Cite
MDPI and ACS Style
Zhang, B.; Huang, Y.; Lu, P.; Li, C. Numerical Investigation of Multiple-Impact Behavior of Granular Flow on a Rigid Barrier. Water 2020, 12, 3228. https://doi.org/10.3390/w12113228
AMA Style
Zhang B, Huang Y, Lu P, Li C. Numerical Investigation of Multiple-Impact Behavior of Granular Flow on a Rigid Barrier. Water. 2020; 12(11):3228. https://doi.org/10.3390/w12113228
Chicago/Turabian StyleZhang, Bei, Yu Huang, Ping Lu, and Chunxiang Li. 2020. "Numerical Investigation of Multiple-Impact Behavior of Granular Flow on a Rigid Barrier" Water 12, no. 11: 3228. https://doi.org/10.3390/w12113228
Note that from the first issue of 2016, this journal uses article numbers instead of page numbers. See further details here.