Article

Study on Landscape Patches Influencing Hillslope Erosion Processes and Flow Hydrodynamics in the Loess Plateau of Western Shanxi Province, China

1
School of Soil and Water Conservation, Beijing Forestry University, Beijing 100083, China
2
Forest Ecosystem Studies, National Observation and Research Station, Jixian 042200, China
3
Key Laboratory of State Forestry Administration on Soil and Water Conservation, Beijing Forestry University, Beijing 100083, China
4
Engineering Research Center of Forestry Ecological Engineering, Ministry of Education, Beijing Forestry University, Beijing 100083, China
5
State Key Laboratory of Simulation and Regulation of Water Cycle in River Basin, China Institute of Water Resources and Hydropower Research, Beijing 100083, China
*
Author to whom correspondence should be addressed.
Water 2020, 12(11), 3201; https://doi.org/10.3390/w12113201
Submission received: 20 October 2020 / Revised: 30 October 2020 / Accepted: 10 November 2020 / Published: 16 November 2020
(This article belongs to the Special Issue River Basin Management and River Evolution Research)

Abstract

:
Although vegetation restoration plays an important role in the management of surface runoff and soil erosion, the large-scale restoration of vegetation can increase water consumption and reduce surface water resources, thus affecting the health of river ecosystems. Therefore, vegetation restoration should aim to achieve a vegetation landscape pattern that optimizes protection of soil resources while limiting water consumption. This study established field runoff plots with different landscape patch types, including bare land, S-road patches, strip patches, grid patches, and random patches, as well as different quantities patches of 5, 10, 15, and 20. An artificial rainfall experiment was conducted to determine the effect of different vegetation patches in reducing runoff and sediment, and the relationship between the types and number of vegetation patches and hydrodynamic parameters. The results showed that the runoff yields of the four vegetation patch types decreased by 16.1–48.7% compared with that of bare land, whereas sediment yields decreased by 42.1–86.5%. In addition, the resistance coefficients of the poorly connected patch patterns, including strip patches, grid patches, and random patches, ranged between 0.2–1.17 times higher than that of the well-connected S-road patch pattern, and the stream power decreased by 33.3–50.7%. Under a set vegetation coverage rate, an increase in the number of vegetation patches resulted in a significant reduction in runoff velocity, runoff yield, and sediment yield, increases in surface roughness and flow resistance, and reductions in runoff shear force and stream power. Besides, the sensitivity of soil to erosion decreased with an increasing number of the patch in the vegetation landscape, whereas the sensitivities of patch combinations with poor connectivity were lower than those with good connectivity. The results of this study highlight the importance of vegetation patch type and quantity for control of soil erosion.

1. Introduction

Soil erosion has become an ecological and environmental challenge of global concern [1]. The Loess Plateau is known to be one of the most highly erosive regions globally and acts as a major source of sediment to the Yellow River [2]. Serious soil erosion results in not only land degradation and ecosystem damage, but also in bank erosion downstream, which has a huge negative impact on production [3]. The Chinese government has implemented a series of soil and water conservation measures since the 1950s in an attempt to control serious soil erosion occurring on the Loess Plateau. These measures have resulted in a decrease in the annual sediment transport volume of the Yellow River from ~1.34 Gt in 1951–1979 to ~0.73 Gt in 1980–1999 [4]. Many studies over the world have demonstrated that vegetation cover play an important role in the prevention of soil and water losses [5,6]. Consequently, the relationship between vegetation and soil erosion by runoff has become a popular topic within the study of the ecological environment of the Loess Plateau region [3,7,8,9,10,11,12].
Trees have been planted on a large scale in the Loess Plateau region by the Chinese government since 1999 through the “Grain for Green” project, which has increased vegetation coverage and reduced soil erosion [13,14,15]. The vegetation carrying capacity of the arid and semi-arid Loess Plateau region is limited due to limited rainfall, and the planting of too much vegetation may result in soil desiccation and vegetation degradation [16]. Under limited water resources, reasonable vegetation allocation can improve soil structure, increase soil erosion resistance, and thus reduce soil and water loss [7,17], whereas unreasonable vegetation distribution in arid and semi-arid areas world aggravate soil erosion [18,19]. The slope surface is the basic unit of soil erosion [20], the optimization of the distribution of limited vegetation on the hillslope surface is the key to realizing conservation of water and soil in the Loess Plateau.
Past studies on the optimal allocation of vegetation have mainly focused on the impacts of coverage, type, structure and spatial distribution of vegetation on slope runoff, sediment and hydrodynamic mechanisms [21,22,23,24,25,26], and these studies have usually used a simple vegetation configuration, mainly including hedgerows, grass strips and grass carpet [25,27]. Although Feng et al. analyzed the relationship between spatial patterns of different vegetation types and soil erosion, the distribution of vegetation investigated in that study was uniform [27]. The factors controlling vegetation restoration in the arid and semi-arid regions include topography, inclination, slope direction and soil moisture, among which soil moisture is the key factor controlling vegetation restoration [28]. Limited availability in water resources increases the patchiness of the vegetation distribution [29]. Vegetation patches are generally accepted to be the basis for the study of landscape patterns and soil erosion processes, and are the basic structural units affecting sediment production and sediment transport at different scales. The patches of vegetation in the landscape plays an important role in regulating the hydrological cycle and the ecological balance, and the majority of recent studies on vegetation patch have focused on the impact of the sizes and locations of a single patch or a single type of patch on soil erosion [30,31,32,33]. However, there have been relatively few studies on the impact of patterns of vegetation patchiness in the landscape on hillslope erosion. The selection of an appropriate combination of vegetation landscape patches under particular vegetation coverage is necessary for a comprehensive comparison of the effectiveness of these combinations in reducing runoff and sediment and improving hydraulic characteristics. The current study aimed to evaluate the effects of patch combination type and quantity within the vegetation landscape on surface runoff and soil loss on the slopes of the Loess Plateau. The specific objectives of the current study were to: (1) under a given vegetation coverage rate and using bare land as the control, compare the effects of the types and quantities of patches in different vegetation landscapes on surface runoff and soil loss; (2) compare the effects of the types and quantities of patches in different vegetation landscapes on hydrodynamic parameters; and (3) quantify the relationship between surface runoff and soil erosion in runoff plots for an improved understanding of the impact of vegetation landscape patches on soil erosion. The results of the present study can provide a reference for the optimal allocation of slope vegetation and ecological restoration in arid and semi-arid areas.

2. Materials and Methods
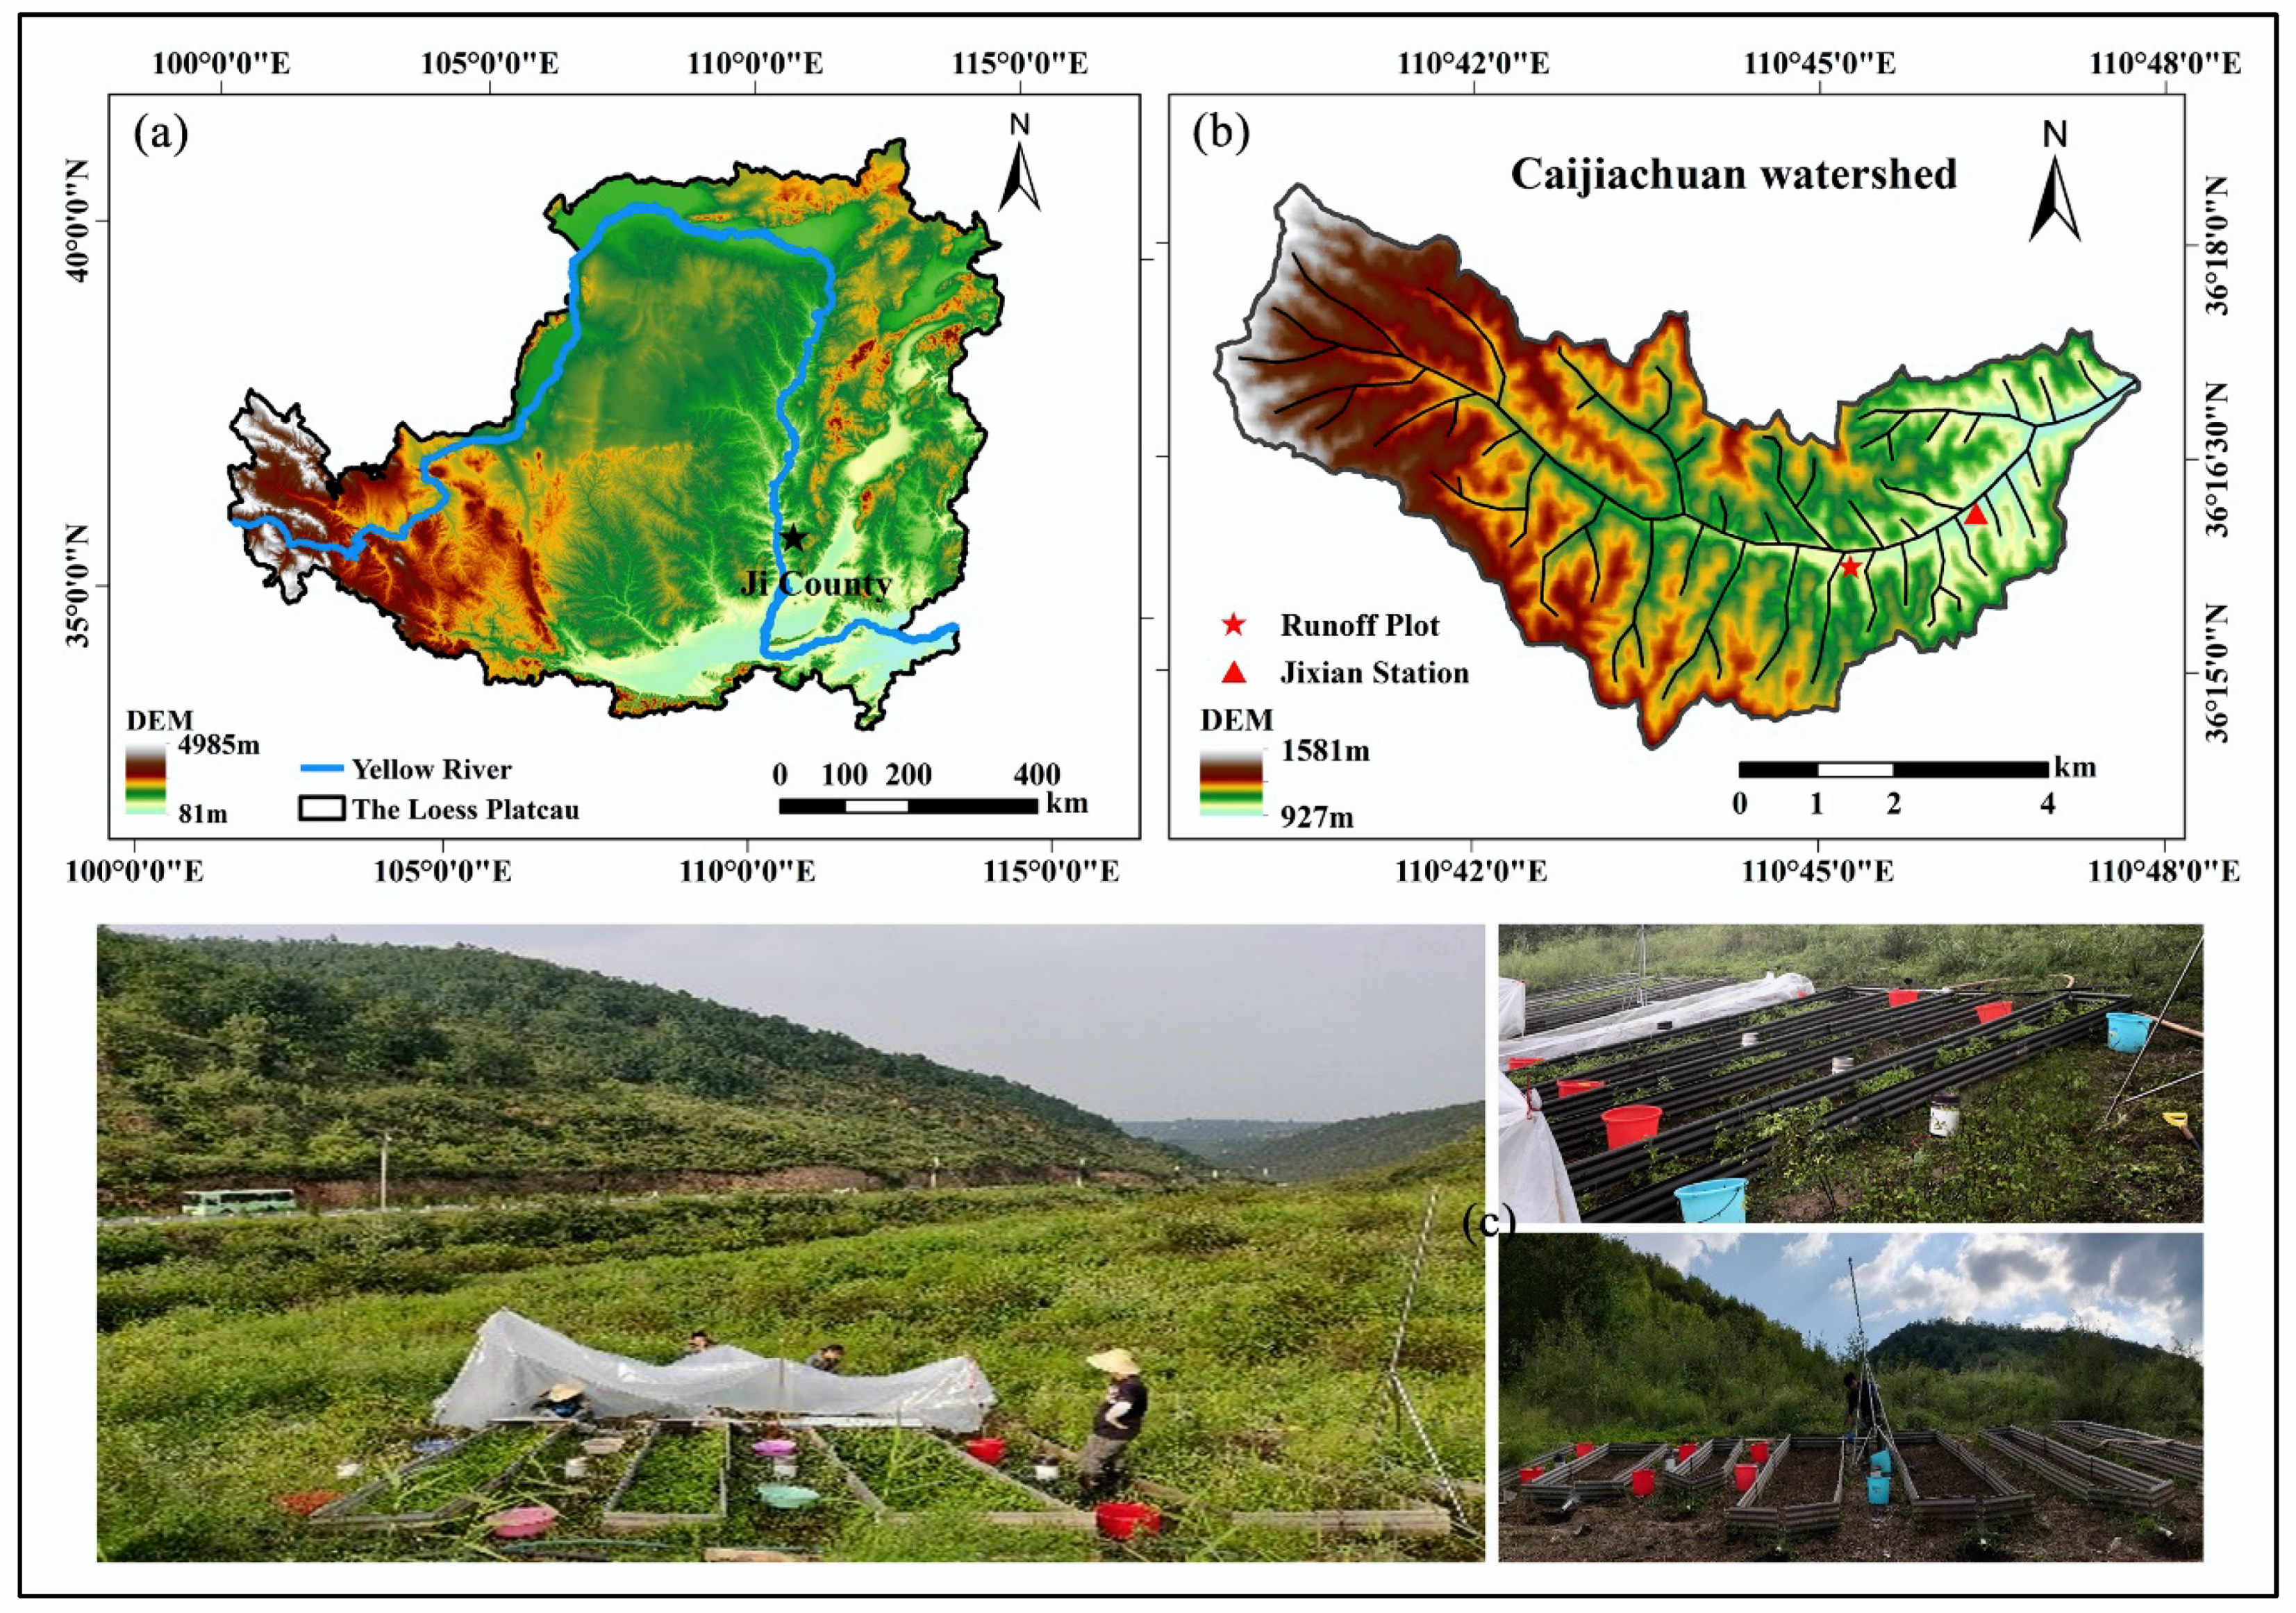
2.1. Study Area

The experimental area of the present study is located in the Cai Jiachuan Watershed, Ji County, Shanxi Province, China (110°39′45″–110°47′45″ E, 36°14′27″–36°18′23″ N). The study area falls within a warm temperate continental monsoon climate zone with an average annual temperature of 10.2 °C and average annual precipitation of 576 mm, with the majority of precipitation occurring from July to September, accounting for ~60% of annual rainfall. The main soil types in the study area are brown soil and loess parent material with a uniform soil texture [34]. The dominant land use types in the Cai Jiachuan Watershed include woodland, shrub, grassland, secondary forest, orchard, agricultural land, and bare land. The watershed has diverse vegetation types with high species richness and diversity, with a vegetation coverage of ~65%. The main vegetation species include Robinia pseudoacacia, Platycladus orientails, Pinus tabuliformis, Quercus liaotungensis, Lespedeza bicolor, Potentilla chinensis, and Artemisia gmelinii [35]. Figure 1 shows the geographic position of the study area.
The present study selected a hillside with the same site conditions to avoid the influence of different site conditions (Figure 1). The terrain of the experimental plot was relatively flat, with an average slope gradient of ~15°. The experimental plot had similar vegetation and soil types. 
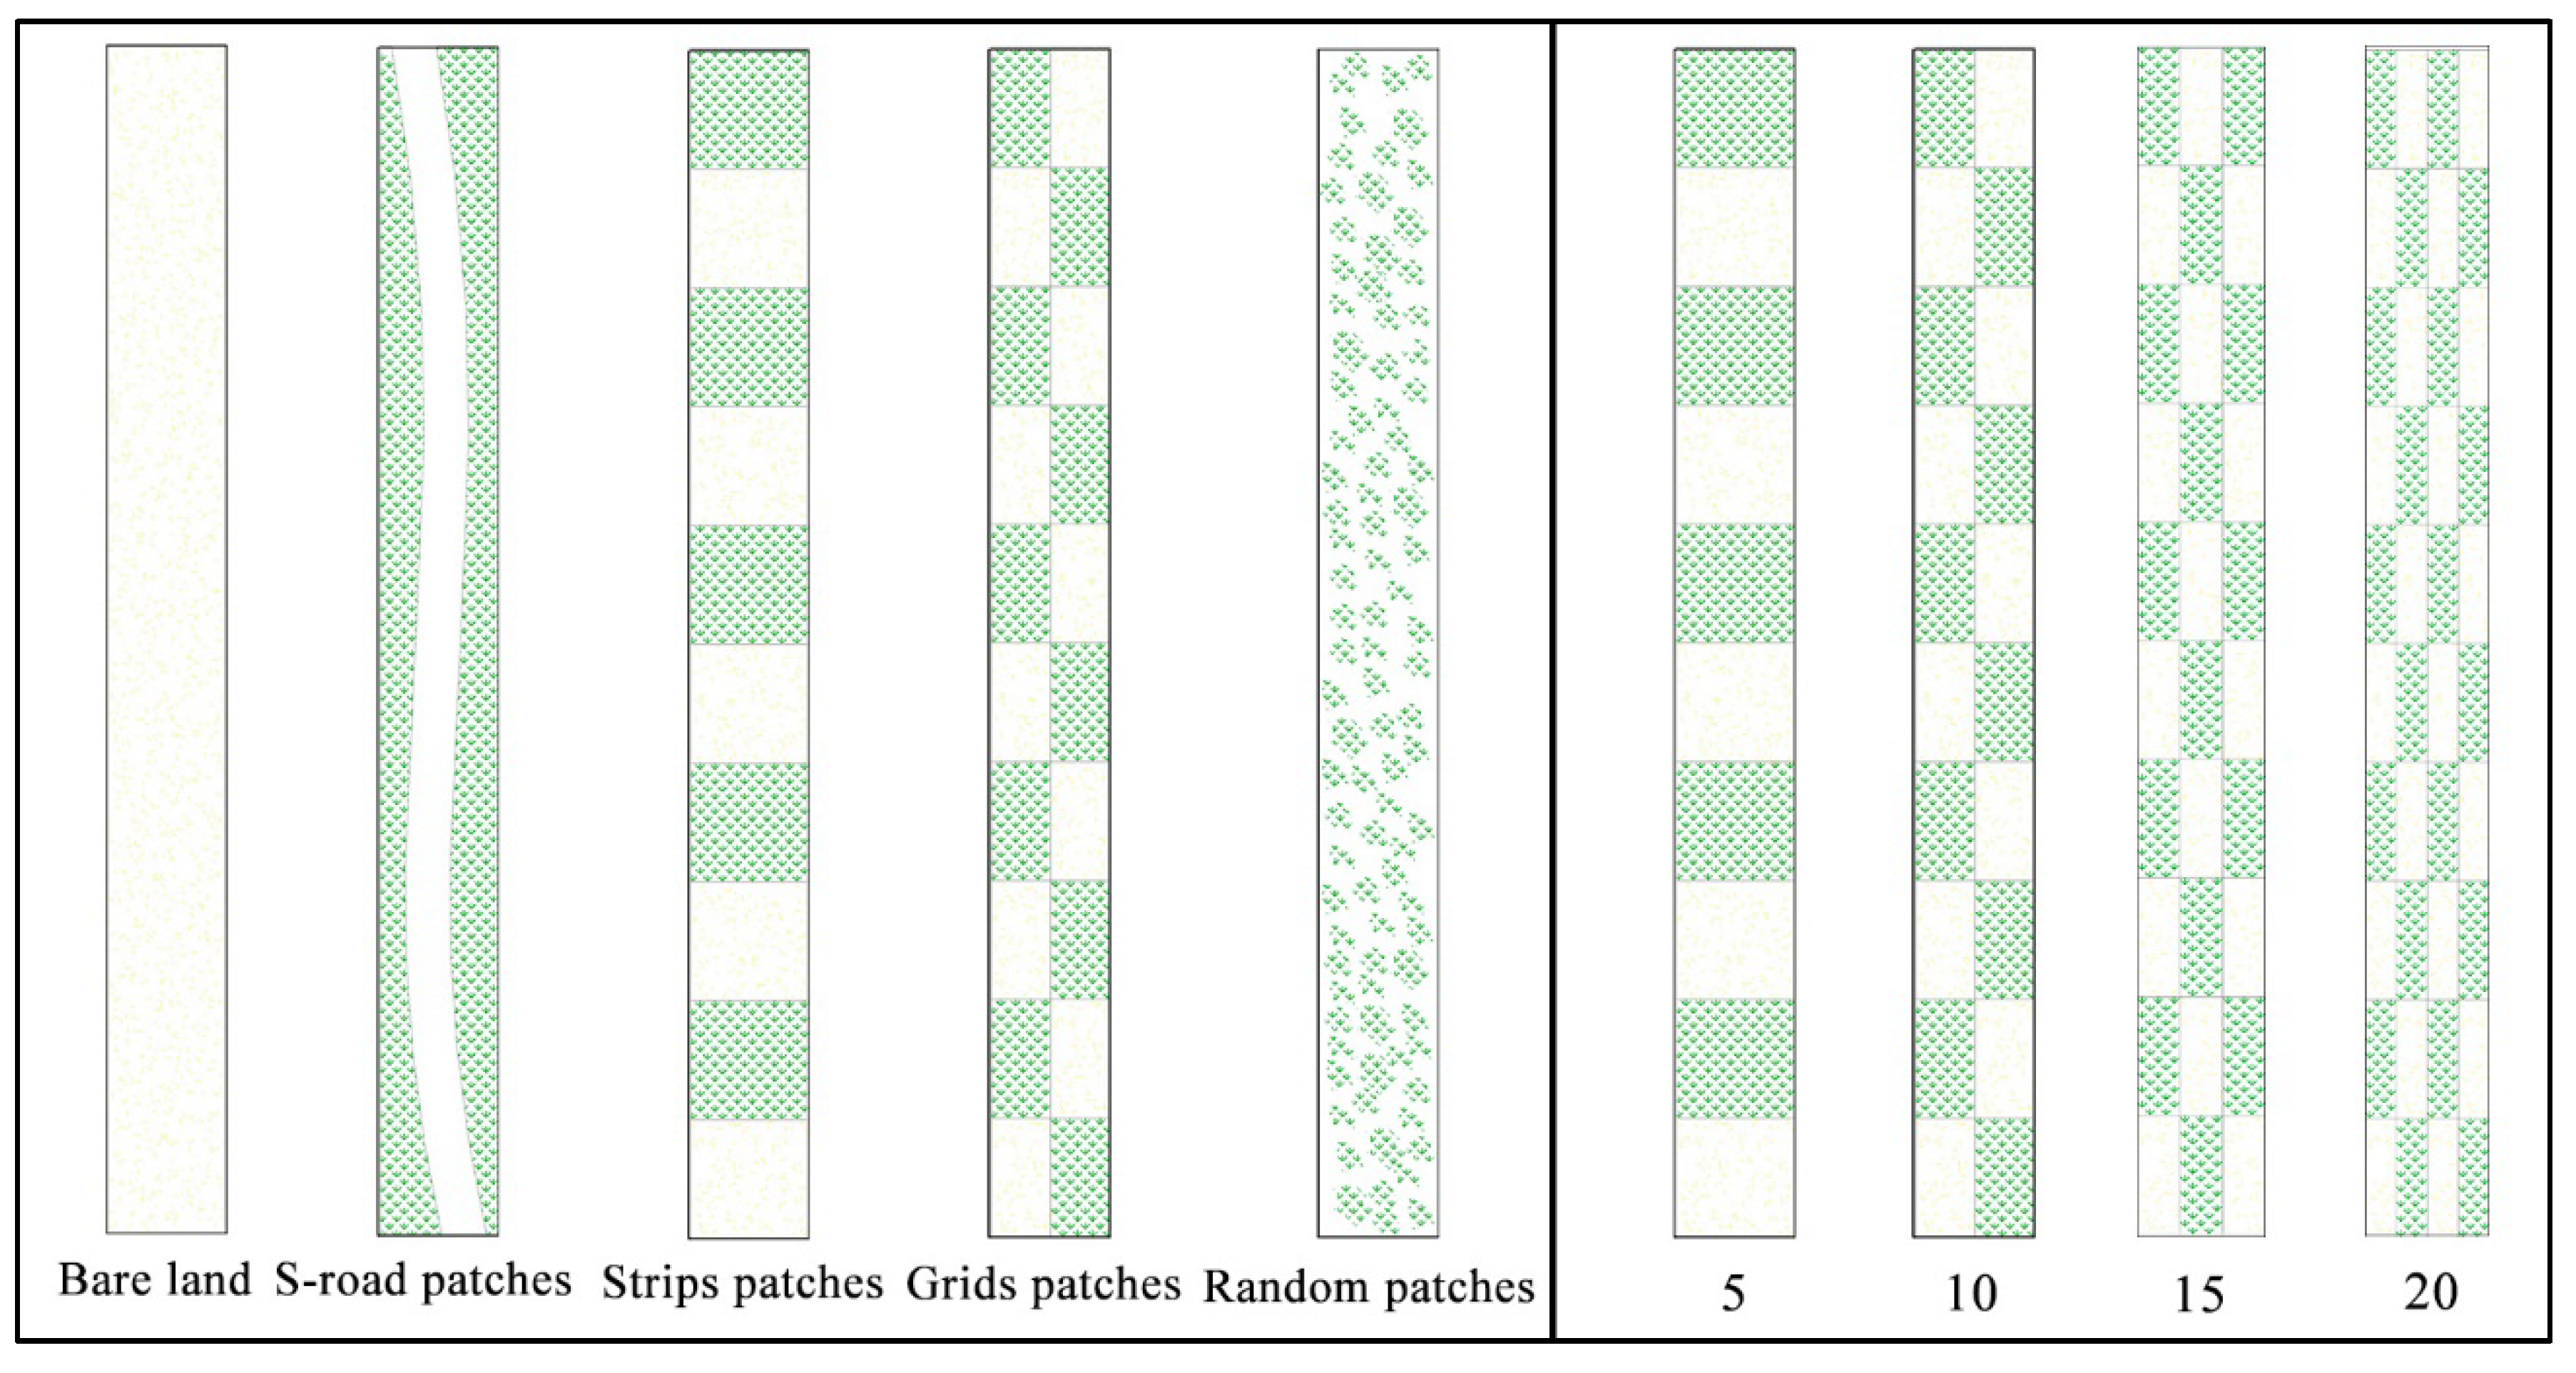
Table 1 shows the soil properties to a depth of 0–10 cm in experimental grassland. The runoff plot was made of polyvinyl chloride (PVC) with dimensions of 5.0 m (length) × 0.5 m (width) × 0.3 m (height). A PVC board was inserted into the ground to a depth of 15 cm so that the top of the board was 15 cm higher than ground level. A V-shaped groove was set at the lower end of the runoff plot into which a PVC pipe with a diameter of 10 cm at the outlet was installed and connected to a bucket for collection of runoff and sediment. Previous studies have shown that, under the condition of limited water resources, the effective coverage of vegetation on the Loess Plateau ranges from 29.26% to 50.94% [36]. Therefore, considering the vegetation coverage of the study area, the present study selected a vegetation coverage of 50%. Two types of runoff plots were designed in the present study (Figure 2): (1) different combinations of landscape patches, including bare ground, horizontal path, field grid path, S-road path, and random patches, under a common coverage of 50%; and (2) a uniform distribution of patches under a common coverage of 50%, but with varying numbers of patches (5, 10, 15, and 20). In the first combination, the number of patches of horizontal bars and field grids were 5 and 10, respectively, which was used in the patch pattern of 5 and 10 in the second combination, and each patch combination had two runoff plot replicates. The redundant vegetation in the runoff plot was eradicated during September 2017 according to the runoff plot design scheme, and the bare surface was leveled off. Table 2 shows information for each runoff plot.

2.2. Experimental Designs

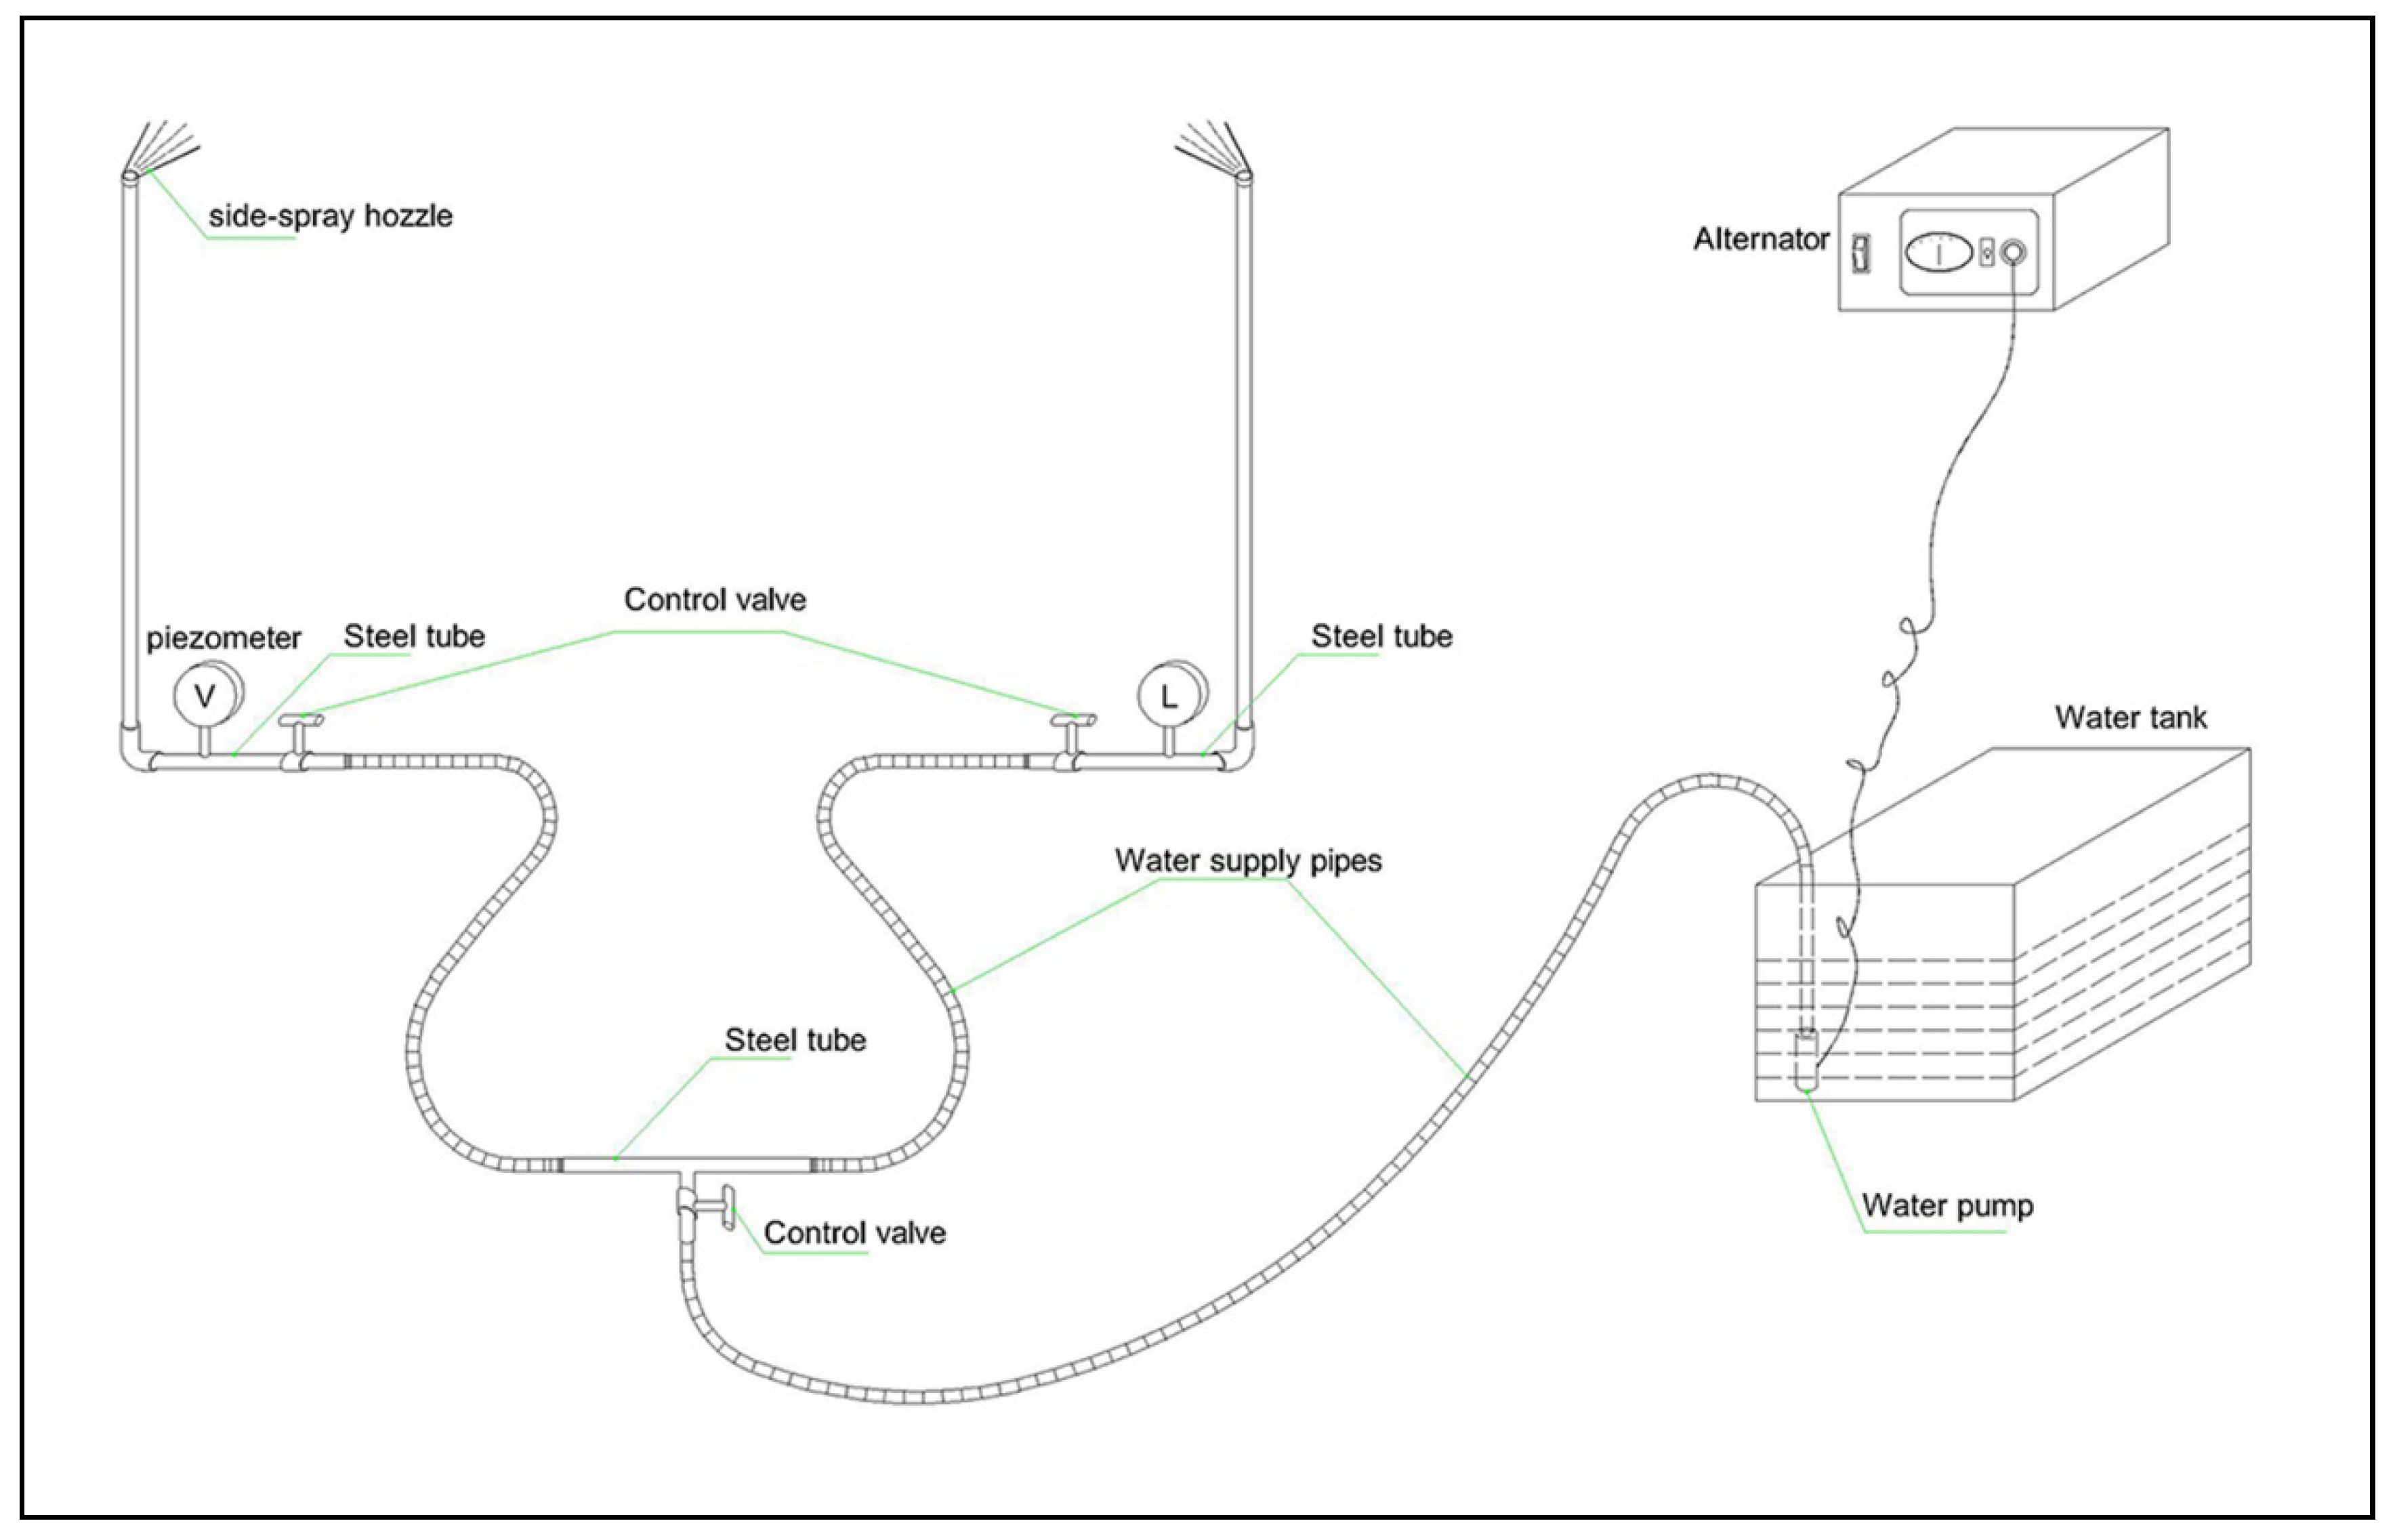
The present study used a side-spray portable simulated rainfall system developed by the Institute of Soil and Water Conservation, Ministry of Water Resources, Chinese Academy of Sciences [37,38,39]. The system consists of a water supply bag, a water supply pump, a water supply line with a bore diameter of 48 mm, a control valve, a pressure gauge, two tripods with a height of 7 m, and two nozzles (Figure 3). Rainfall intensity of the system can be adjusted within a range of 30 mm h−1 to 120 mm h−1 and a uniformity of >85% by changing the water pressure and nozzle size in the pipeline using the control valve [38]. Since the effective rainfall coverage area of the system is 5 m × 4 m, the simulated rainfall was concurrently applied to the two adjacent plots. Rainfall intensity was determined before each rainfall experiment to regulate the uniformity and spatial distribution of rainfall [39]. A statistical analysis of several rainfall data for the study area identified two general categories of rainfall: (1) heavy rainfall intensity with short duration; and (2) weak rainfall intensity with long duration. Statistical analysis of rainfall in the first category over the most recent 3 years identified average rainfall intensity to be 7.37 mm in 5 min. Therefore, the average rainfall intensity of the artificial rainfall device was set to 7.5 mm over 5 min, or an artificial rainfall intensity of 90 mm h−1.

2.3. Experimental Treatments and Measurement

Simulated rainfall experiments were conducted from July to August 2018. Soil water contents of all runoff plots were controlled to be equal by measurement of the soil water content of each plot before the experiment using time domain reflectometry (TDR) and adjusting soil water content if required (Table 2). The slope of each plot was covered with a plastic sheet and left to stand for 24 h before the experiment. The duration of each simulated rainfall event in the experiment was ~65 min, and the water temperature was measured using a mercury thermometer before starting the simulated rainfall. The time required to produce initial runoff during a simulated rainfall event was recorded, and, after this point, samples of runoff and sediment were collected every 2 min for the first 10 min, and every 5 min thereafter, until a total of 15 runoff samples were collected. The total runoff of each plot was measured after each experiment. After 24 h of sediment precipitation, the clear liquid super stratum was separated from the sediment, and sediment was transferred to a large aluminum box and dried in an oven at 105 °C for 24 h. The dye tracer method [23] was applied to 1-m sections of the upper, middle and lower slopes of the runoff plots to measure surface velocity by recording the time taken for KMnO4 solution to pass through the measured section. Flow velocity was measured every 10 min during the entire experiment, and the average flow velocity at three different slope positions was taken to be the runoff velocity at that period.

2.4. Data Analysis

An index representing the hydrodynamic characteristics of the slope was selected to accurately describe the mechanical relationship between the landscape patch and the rainfall erosion process.
The mean flow velocity (m s−1) is the product of different flow patterns of slope runoff and their correction coefficients.
v = k × v m .
In Equation (1), v is the mean flow velocity (m s−1), v m represents the actual measured flow rate (m s−1), and k is the correction coefficient, where values of k for laminar flow, transition flow, and turbulent flow are 0.67, 0.7, and 0.8, respectively [40].
The sectional water depth was relatively shallow due to the long slope of the runoff plot and the influences of the slippery surface, raindrops, and patches of ground, resulting in large errors in the direct measurements. Therefore, the mean water depth was estimated by the following formula:
h = Q v · B · t .
In Equation (2), h is the average surface water depth (mm), Q is the runoff over t flow time (m3), B is the cross-section width of the runoff plot (m), and t is the sampling time (s).
The Reynolds numbers (Re) and Froude numbers (Fr) can reflect the flow state:
R e = v · R γ ,
F r = v g · h .
In Equation (3) and Equation (4), R e is Reynolds number (dimensionless), R means hydraulic radius (m), which is approximately equal to water depth h (m), γ represents the kinematic viscosity coefficient (m2 s−1), γ = 0.01775 1 + 0.0337 T + 0.000221 T 2 , T is the water flow temperature (°C) ( T = 20   ° C ), and g is the gravitational acceleration (9.8 m s−2).
The Darcy-Weisbach’s friction coefficient ( f ) and Manning’s roughness coefficient ( n ) were used to represent the resistance along the slope flow:
f = 8 · g · R · J v 2 ,
n = R 2 3 · J 1 2 v .
In Equation (5) and Equation (6), f is the Darcy-Weisbach coefficient, and J is the hydraulic energy slope (m m−1), namely the tangent of slope gradient.
Runoff shear force refers to the runoff force that can result in the mobilization of soil particles:
τ = ρ · g · h · J .
In Equation (7), τ is runoff shear force (Pa), ρ is the density of water (kg m−3), g is the gravity constant (9.8 m s−2), and h is mean water depth (m).
Runoff power ( W ) characterizes the power consumed by water flow per unit area and reflects the power required for a certain amount of soil erosion:
W = τ · v = ρ · g · R · J · v .
In Equation (8), W is the flow power (W m−2).
Analysis of variance (ANOVA) in the statistical software package IBM SPSS Statistics 25.0 (International Business Machines Corporation, Armonk, New York, USA) was used in the present study to test for significant differences among runoff rate, sediment transport rate, and hydrodynamic parameters of different patch combinations and numbers. The Shapiro-Wilk statistical method was used to test the normality of all dependent and independent variables, and all variables that did not conform to the normal distribution where transformed using the natural logarithm treatment. Excel 2016 was used to record and process experimental data. Regression analysis and correlation analysis among various indicators were conducted in SPSS 25.0. Origin 2017 (OriginLab, Northampton, MA, USA) was used to map the experimental results.

3. Results

3.1. Effects of Different Types of Vegetation Patches on Runoff and Sediment Processes and Their Hydrodynamic Characteristics

Under the same rainfall condition, the flow yield time required for runoff to develop among the different combinations of vegetation patches was 0.76–2.48 min. The times required for runoff under S-road patches, strip patches, grid patches, and random patches were 0.13 min, 1.13 min, 0.96 min, and 1.72 min slower than that of bare land, respectively. ANOVA indicated that the grid patches required more time for initiation of runoff compared to that of other patch types (Table 3). The runoff curves of different vegetation patches were similar under the simulated rainfall conditions (Figure 4a). The runoff curve could be divided into three obvious stages: (1) a rapid increase in the runoff rate with increasing rainfall duration during the early stage (0–15 min); (2) a gradual increase in runoff rate (15–45 min); and (3) gradually stabilization (45–60 min). However, the stable yield runoff rate varied widely among different vegetation patch combinations, with those of S-road patches, strip patches, grid patches, and random patches reduced by 16.12%, 49.55%, 51.35%, and 48.56% compared to that of bare land, respectively (p < 0.05). However, there was little difference in the stable yield runoff rate between grid patches and strip patches (Table 3). The total runoff and average runoff yield rate showed similar changes.
The sediment transport response to patch combinations of different vegetation differed to that of runoff, with sediment transport showing a greater fluctuation compared to that of runoff (Figure 4b). The sediment yields of bare land and S-road patches increased rapidly in the first 15 min of runoff and gradually decreased with increasing rainfall duration, finally tending to stabilize. However, the sediment yields of grid patches, strip patches, and random patches gradually increased with increasing rainfall duration, finally tending to stabilize, with the stabilization occurring earlier than that under bare land and S-road patches (Figure 4b). The stable sediment yield rates of S-road patches, strip patches, grid patches, and random patches were lower than that of bare land by 42.14%, 68.19%, 71.24%, and 86.54%, respectively (p < 0.05) (Table 3). There was no significant difference in average sediment yield between grid patches and strip patches. However, the sediment yield of strip patches was smaller than that of grid patches during the early stages of sediment production, whereas the opposite was true during the later stage (Figure 4b). This result can be attributed to strips of vegetation located at the bottom of the runoff plot increasing resistance to flow resistance, thereby promoting water infiltration into the soil and trapping sediment, thereby reducing sediment yield during the initial stage of rainfall. However, sediment yield of strip patches began to increase with progressing rainfall duration due to the limited retention capacity of horizontal strips.
Connectivity paths, and consequently also flow velocity, varied among the different types of landscape patch combinations (Table 4). The average flow rates of S-road patches, strip patches, grid patches and random patches were lower than that of bare land by 12.72%, 28.98%, 29.33%, and 46.64%, respectively (p < 0.05). However, there was no significant different in average velocity between strip patches and grid patches (Table 4). The Reynolds number, flow shear stress, and stream power showed similar trends to that of the average flow rate. However, there were no major changes in flow depth among strips, grids, and random patches with poor connectivity paths, with flow depth ranging from 0.84 mm to 0.89 mm. However, these three patch combinations showed stronger flow resistance, with the Darcy-Weisbach resistance coefficient of random patches 59.83% higher than that of bare soil (p < 0.05). Patch combination had little influence on Manning’s roughness, with only minor differences between S-road patches, strip patches, and grid patches (p < 0.05). However, there were large differences in the Manning’s roughness coefficient of up to 0.153 between random patches and other patch combinations.

3.2. Effects of the Number of Vegetation Patches on Runoff and Sediment Processes and Their Hydrodynamic Characteristics

The time required to start generating flow increased with increasing number of patches. However, there was no significant difference in time required for generating runoff between patch numbers of 5 and 10, and the time required for flow generation with the number of 10 was the smallest (1.72 min). Figure 5a shows the changes in runoff rates among different patch numbers. The different patch numbers obtained similar runoff curves under simulated rainfall conditions (Figure 5a). In the early stage of runoff (0–15 min), it increased rapidly as time went on, then entered the fluctuation stage (15–45 min), and finally became gradually stable (4–60 min). However, average runoff rate decreased with increasing patch number, with significant differences in average runoff rate among the different patch numbers (Table 5). The average yields 10, 15, and 20 vegetation patches decreased by 5.10%, 10.48%, and 16.94%, compared to that of 5 vegetation patches, respectively. The present study observed no significant difference between the combined total runoff yield rate and stable runoff yield rate under similar patch numbers.
Sediment yields showed similar variation to the runoff process among the different number of patches (Figure 5b). Although sediment yield increased rapidly in the first 10 min after runoff yield, there were significant differences in average sediment yield among different patch number combinations after 15 min (Figure 5b and Table 5). The sediment yields of 10, 15, and 20 vegetation patches decreased by 9.59%, 21.10% and 29.26% compared that of 5 vegetation patches, respectively (p < 0.05). A similar pattern was observed for total sediment yields of different vegetation patch number combinations. However, there was no significant differences in sediment yield between patch numbers 5 and 10 and between patch numbers 15 and 20.
The present study converted vegetation patch numbers into the area. With an increasing number of patches, the area of individual patches decreased, with the patch areas of 5, 10, 15 and 20 vegetation patch combinations being 0.25 m2, 0.125 m2, 0.0833 m2, and 0.0625 m2, respectively. Runoff rate increased with increasing area of individual patches (Figure 6). The relationship between runoff rate and single patch area could be described using a power function ( y = 0.4502 x 0.1274 , R 2 = 0.9247 , p < 0.01). Sediment yield showed the same relationship, and regression analysis showed a significant power function relationship between sediment yield and patch area ( y = 12.018 x 0.2459 , R 2   = 0.9481, p < 0.01).
Average flow velocity decreased with an increasing number of patches in different vegetation landscapes (Table 6). The average flow velocity under 5 vegetation patches was 4.02 cm s−1, with those of 10, 15, and 20 patches 0.50%, 6.22%, and 13.18% lower, respectively. Increasing the number of patches in the vegetation landscape resulted in no significant difference in average flow depth, with flow depth ranging from 0.84 mm to 0.89 mm. There were increases in surface roughness and runoff resistance with increasing number of patches in the vegetation landscape, with the Manning’s roughness coefficient increasing from 0.114 to 0.130 and the Darcy-Weisbach resistance coefficient increasing from 10.62 to 13.99 under 10 and 20 vegetation patches, respectively. Under the same rainfall conditions, an increase in the number of vegetation patches in the vegetation landscape resulted in a decrease in flow shear stress and stream power, with flow shear stress decreasing from 2.37 to 2.27 from 5 to 20 vegetation patches, whereas stream power decreased significantly by 17.71%.

3.3. The Relationship Between Runoff and Soil Loss under Different Patch Types and Quantity

Table 7 and Figure 7 show the relationships between slope runoff and soil erosion under different patch types and quantity. All the relationships conformed to the power function y = a x b , (p < 0.01). The coefficient a of the function can be expressed as soil loss per unit runoff and can be used as a parameter to reflect the sensitivity of soil erosion [22]. A comparison of sediment yield of different vegetation patch types showed that the order of the different patch types according to the value of coefficient a was: bare land > S-road patches > strip patches > grid patches > random patches, with a maximum of 147.437 and minimum of 33.396. In addition, coefficient a decreased with increasing patch number, with a maximum and minimum of 95.9 and 52.3, respectively.

4. Discussion

Vegetation patches play an important role in the prevention and control of soil erosion and have important effects on surface runoff, sediment transport, and hydrodynamic parameters [41,42,43]. This study monitored runoff and erosion resulting from simulated rainfall under the same vegetation coverage rates, but with combinations of different vegetation patches. The results showed that different vegetation patches types and numbers resulted in significantly reduced runoff and sediment production compared to those of bare land. The results of the present study are consistent with those of [27,31,44], who demonstrate that vegetation patches significantly reduce soil erosion, improve soil structure, increase soil porosity, and improve the resistance of soil to erosion. Previous studies have shown that surface mulch can increase the resistance of soil to water erosion [42,45,46] being contrary for bare soils [47,48]. The present study showed that vegetation patches of different types and numbers can reduce runoff velocity and flow sediment concentration (Table 3), improve flow resistance, and reduce runoff shear force and flow power by increasing surface roughness and runoff path extent (Table 5). An increase in the Darcy-Weisbach resistance coefficient and a decrease in flow shear stress indicated that more energy was used to overcome water flow resistance, resulting in less energy being available for soil erosion and sediment transport.
Previous studies have demonstrated a relatively clear relationship between vegetation coverage and soil erosion, and there has also been extensive study of the effect of vegetation on water flow resistance [43,49]. However, the majority of studies have focused on vegetation with a uniform distribution, including grass strips, grass carpet, and hedgerows, and relatively few studies have considered the relationship between landscape patches and hydrodynamics [50,51]. The lower rainfall and generally higher proportion of erosive rainfall in the arid and semi-arid Loess Plateau region have resulted in serious soil erosion [22,27], insufficient water resources, and fragmented distribution of vegetation patches [32,33]. The fragmentation of vegetation patches results in an increase in surface roughness and changes to the connectivity path, which in turn affect the path and strength of surface runoff and sediment transport on the Loess Plateau [45].
A strong interaction between vegetation patches and hydrologic process exist [43], and many studies have demonstrated that banded patches play an important role in soil and water conservation. For example, artificial grass zones placed at different locations can delay the generation of runoff compared with that of bare fields, thereby reducing the runoff coefficient by 4–20% and soil loss by >77% [27]. Slopes with mountain roads produce 2–3 times more runoff and 6–200 times more sediment than slopes with natural vegetation [52]. The present study showed that, under the same vegetation coverage rate, connecting paths differed among patches of different vegetation types, resulting in significant changes in the runoff process and sediment transport. The yield time of runoff and sediment transport was short for roads with good connectivity, resulting in the generation of more runoff. In contrast, the yield times were extended and yield was limited for patch combinations with poor connectivity, such as strip patches, grid patches, and random patches. This result can be mainly attributed to patch combinations with poor connectivity resulting in increased runoff paths and increased soil infiltration, thus reducing surface runoff [53]. In addition, the decreases in surface runoff, velocity, runoff shear force, and sediment transport capacity [50,53] resulted in great reductions in the sediment yields of vegetation patches with poor connectivity. Although different patch combinations showed the same results, the influence of patch number on runoff and sediment was lower than that of patch type [54]. This result can be mainly attributed to the fact that, although different numbers of vegetation patch combinations did not extend the runoff path, they did result in runoff passing through the vegetation patches many times, which increased flow resistance, reduced flow velocity, and shortened the distance of runoff through the bare land, thereby preventing the formation of large runoff [25,43].
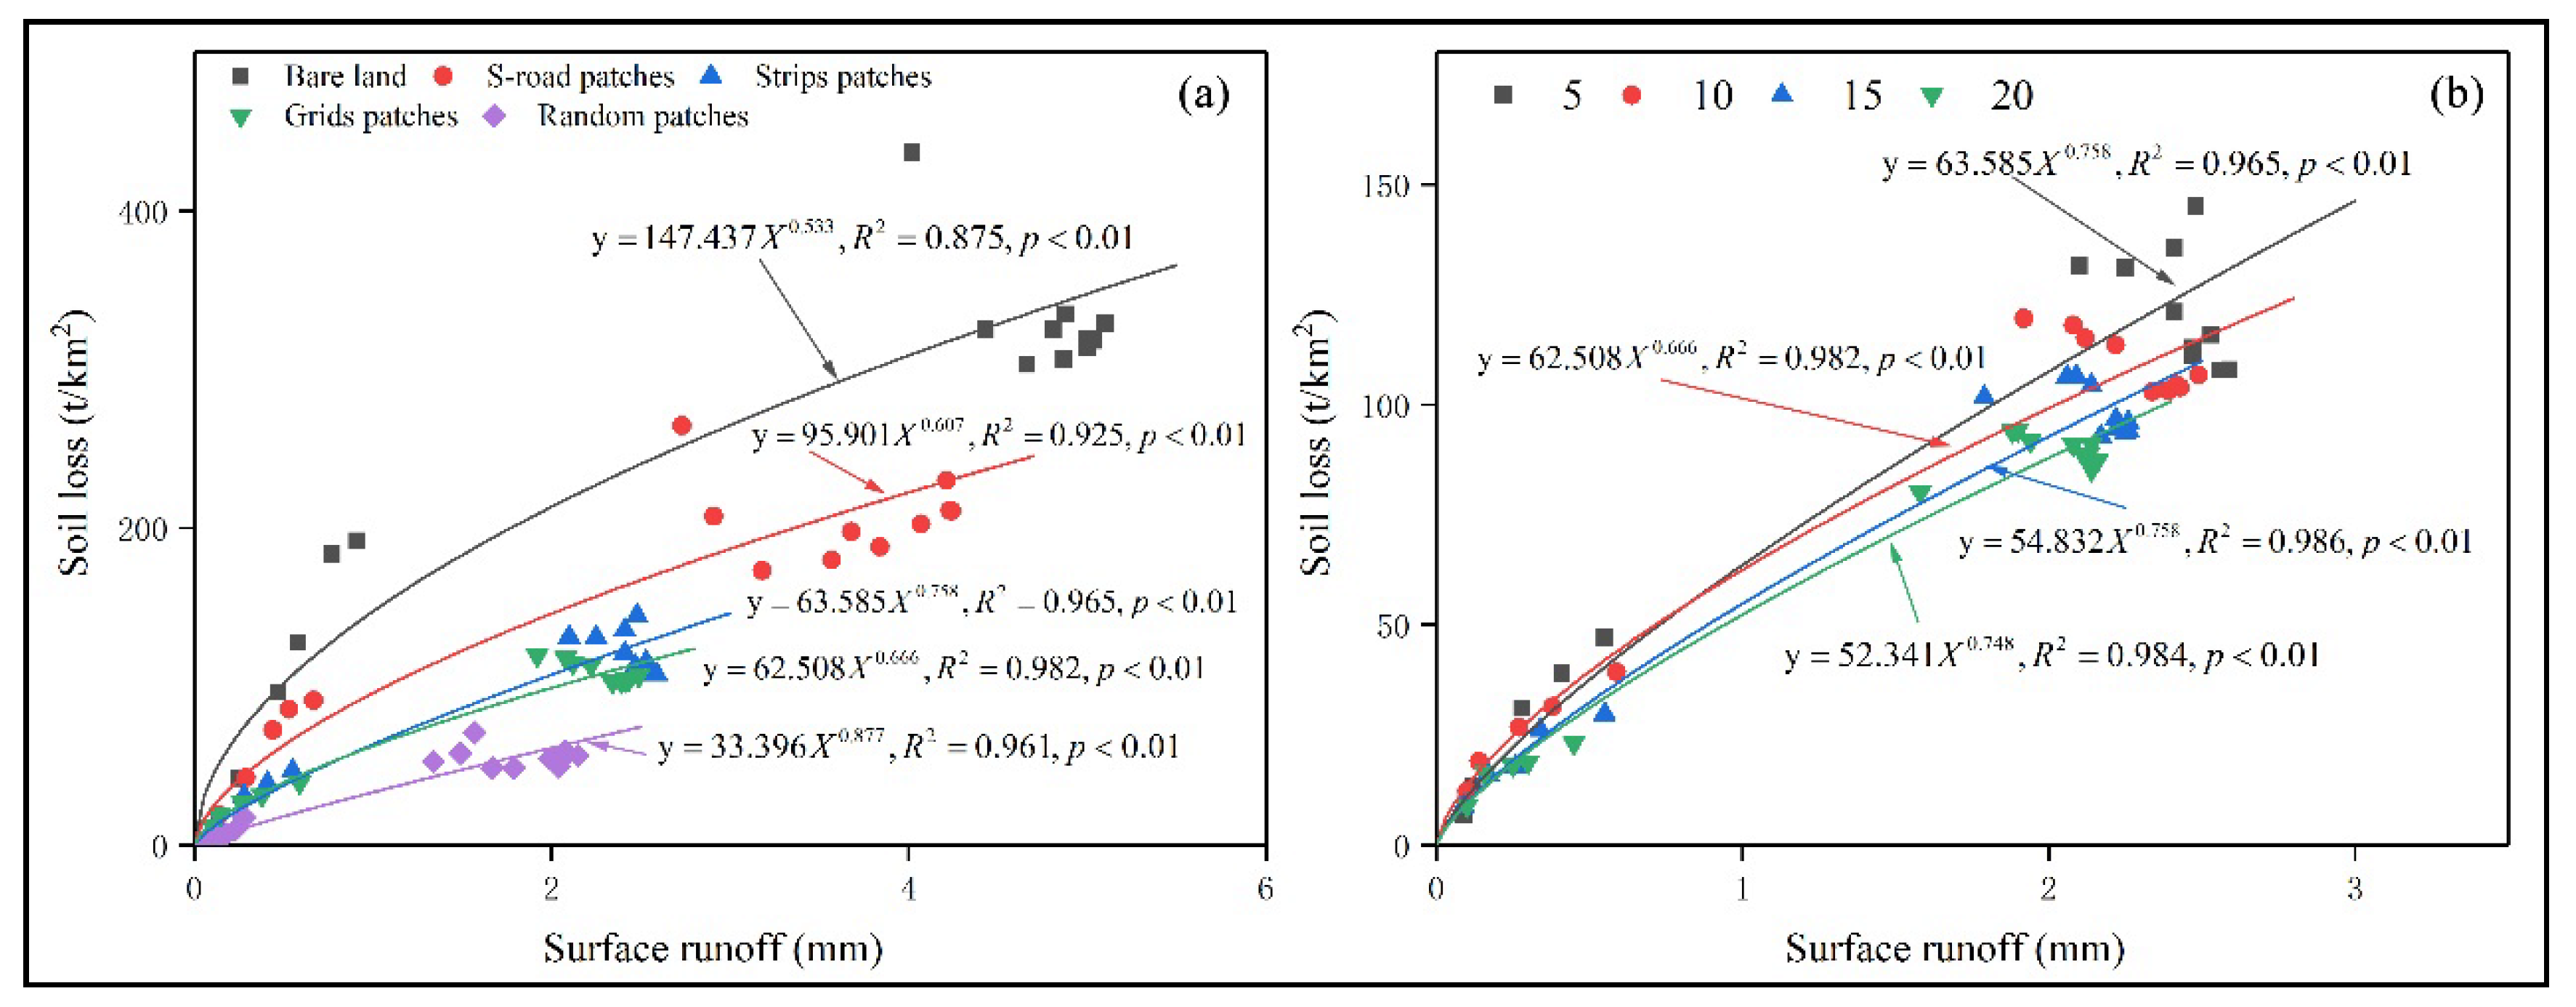
The present study showed that the power function coefficient a between surface runoff and soil loss in different combinations of vegetation patches and vegetation coverage can be interpreted as the amount of soil loss per unit of runoff, and can be used as a parameter within the assessment of soil erosion. The value of the coefficient a is positively correlated with the susceptibility of soil to erosion [22]. The present study showed that the values of coefficient a for vegetation landscapes with poor connectivity were far less than that those of well-connected patch combinations due to the extension of runoff paths, reduction in flow rate, improvement in soil infiltration rate, and reduction in runoff, thereby reducing the susceptibility of soil to erosion. The coefficient a decreased with the increasing patch number (Table 7). This results can be mainly attributed to the increase in vegetation patch numbers, shortening of the bare land runoff path and increasing surface roughness, thus resulting in a decrease in surface runoff velocity and an increase in soil infiltration [40,45]. In addition, the main vegetation species examined in the present study was Potentilla chinensis, which is characterized by fusiform root tubers and a developed root system, thereby greatly improving the resistance of surface soil to water erosion [55,56].
The results of the present study showed that strip patches, grid patches, random patches, and high-density patch combinations can be used as the methods of identifying appropriate vegetation types and extent within the construction of vegetation for control of soil erosion on the Loess Plateau. The optimal allocation of vegetation patches on slopes not only reduces soil and water loss but also changes the runoff and sediment transport process. The mode used to connect vegetation patches results in changes to the flow resistance and runoff connecting paths, as well as affects the water-sediment transport process and hydrodynamic parameters [19].
The scientific and rational optimization of vegetation can be an effective means of controlling soil erosion on the Loess Plateau and can promote sustainable development of the Yellow River Basin. However, the majority of past studies on the optimal allocation of vegetation have focused on the impact of changes in land use and vegetation cover on hydrological processes, while ignoring the comprehensive impact of vegetation landscape patches on runoff flow resistance and hydrological connectivity [52,57]. The low rainfall and high evaporation of the arid and semi-arid Loess Plateau region results in patch distributions of vegetation [29]. The optimization of the allocation of vegetation patches is important under limited water resources. The present study explained the mechanism of sediment yield on a slope by examining changes in sediment yield and hydrodynamic parameters of vegetation patches of different types and quantities, following which the optimal slope vegetation distribution pattern was determined to provide a reference for the optimal allocation of artificial vegetation in the Loess Plateau vegetation restoration process. The results of the present study are of great significance for establishing the quantitative relationship between patterns of landscape vegetation patches and hydrodynamic parameters, which can be applied to hydrological process models. It is generally accepted that many factors affect slope soil erosion, particularly rainfall intensity, slope, and vegetation coverage [26,30,58,59]. However, the present study did not consider the effects of other vegetation coverage, rainfall intensity, and slope conditions on soil erosion, which was not conducive to the calibration of hydrological model parameters. Future studies should therefore conduct comprehensive studies to determine the effects of vegetation patches on runoff and sediment transport under different conditions.

5. Conclusions

Two types of experiments were designed under the same vegetation coverage rate to determine whether vegetation patches can reduce runoff and sediment. The main hypothesis was to identify the effects of the type and number of vegetation patches on the hydrodynamic parameters of runoff and sediment. The results showed that the types and numbers of vegetation patches play a significant role in both runoff and sediment detachment. The combination of different vegetation patches showed a significant reduction in the runoff rates and sediment volumes but an increase in surface roughness and a flow resistance. In addition, we observed a reduction in hydraulic shear force and runoff power. Patch combinations of poorly connected vegetation landscapes registered stronger flow resistance and had a large impact on flow and sediment yield. Under a uniform distribution of vegetation patches, the runoff rate and sediment yield decreased significantly with an increased number of patches. Although the increase in the number of vegetation patches also resulted in a decrease in flow shear stress and stream power to different degrees, the differences between the combinations with similar patch numbers were not significant. The correlation between runoff and soil erosion, considering different patch types and vegetation coverages, conformed to the power function relationship. The coefficient a of the power function represented the sensitivity of soil to be eroded. The sensitivity of soil to erosion decreased with an increasing number of vegetation patch types, while the sensitivities of patch combinations with poor connectivity were lower than those with good connectivity. We concluded that, from this perspective, the optimization of vegetation in the Loess Plateau region requires sufficient consideration to reducing the connectivity of vegetation patches and increasing the density of patches.

Author Contributions

Conceptualization and methodology, R.S. and J.Z. (Jianjun Zhang); software, validation, formal analysis, data curation, writing—original draft preparation and visualization, R.S.; writing—review, editing, R.S., L.M., S.Z., Y.Y. (Yang Yu), D.W., and J.Z. (Jianjun Zhang); experiments, data curation, R.S., M.S., H.Z., Y.Y. (Yunbin Yang), J.Z. (Jianan Zhang), Y.Z.; resources and supervision, J.Z. (Jianjun Zhang); project administration, J.Z. (Jianjun Zhang); funding acquisition, J.Z. (Jianjun Zhang). All authors have read and agreed to the published version of the manuscript.

Funding

This work was supported by the National Key Research and Development Program of China (No. 2016YFC0501704) and the Major Science and Technology Program for Water Pollution Control and Treatment (No. 2017ZX07102-001). Yang Yu received the Young Elite Scientist Sponsorship Program by the China Association for Science and Technology (2017–2019).

Acknowledgments

In addition, we thank the reviewers for their useful comments and suggestions.

Conflicts of Interest

The authors declare no conflict of interest.

References

  1. Panagos, P.; Standardi, G.; Borrelli, P.; Lugato, E.; Montanarella, L.; Bosello, F. Cost of agricultural productivity loss due to soil erosion in the European Union: From direct cost evaluation approaches to the use of macroeconomic models. Land Degrad. Dev. 2018, 29, 471–484. [Google Scholar] [CrossRef]
  2. Li, M.; Yao, W.; Ding, W.; Yang, J.; Chen, J. Effect of grass coverage on sediment yield in the hillslope-gully side erosion system. J. Geogr. Sci. 2009, 19, 321–330. [Google Scholar] [CrossRef]
  3. Yu, Y.; Zhao, W.; Martinez-Murillo, J.F.; Pereira, P. Loess Plateau: From degradation to restoration. Sci. Total Environ. 2020, 738, 140206. [Google Scholar] [CrossRef]
  4. Wang, S.; Fu, B.; Piao, S.; Lu, Y.; Ciais, P.; Feng, X.; Wang, Y. Reduced sediment transport in the Yellow River due to anthropogenic changes. Nat. Geosci. 2016, 9, 38–41. [Google Scholar] [CrossRef]
  5. Rodrigo-Comino, J. Five decades of soil erosion research in "terroir". The State-of-the-Art. Earth Sci. Rev. 2018, 179, 436–447. [Google Scholar] [CrossRef]
  6. Rodrigo-Comino, J.; Martinez-Hernandez, C.; Iserloh, T.; Cerda, A. Contrasted Impact of Land Abandonment on Soil Erosion in Mediterranean Agriculture Fields. Pedosphere 2018, 28, 617–631. [Google Scholar] [CrossRef] [Green Version]
  7. Zhou, Z.C.; Shangguan, Z.P. The effects of ryegrass roots and shoots on loess erosion under simulated rainfall. Catena 2007, 70, 350–355. [Google Scholar] [CrossRef]
  8. Liu, W.; Zhang, X.C.; Dang, T.; Zhu, O.; Li, Z.; Wang, J.; Wang, R.; Gao, C. Soil water dynamics and deep soil recharge in a record wet year in the southern Loess Plateau of China. Agric. Water Manag. 2010, 97, 1133–1138. [Google Scholar] [CrossRef]
  9. Fu, W.; Huang, M.; Gallichand, J.; Shao, M. Optimization of plant coverage in relation to water balance in the Loess Plateau of China. Geoderma 2012, 173, 134–144. [Google Scholar] [CrossRef]
  10. Zhang, X.; Yu, G.Q.; Li, Z.B.; Li, P. Experimental Study on Slope Runoff, Erosion and Sediment under Different Vegetation Types. Water Resour. Manag. 2014, 28, 2415–2433. [Google Scholar] [CrossRef]
  11. Zhou, J.; Fu, B.; Gao, G.; Lü, Y.; Liu, Y.; Lü, N.; Wang, S. Effects of precipitation and restoration vegetation on soil erosion in a semi-arid environment in the Loess Plateau, China. Catena 2016, 137, 1–11. [Google Scholar] [CrossRef]
  12. Zhang, X.; Li, P.; Li, Z.B.; Yu, G.Q.; Li, C. Effects of precipitation and different distributions of grass strips on runoff and sediment in the loess convex hillslope. Catena 2018, 162, 130–140. [Google Scholar] [CrossRef]
  13. Zhang, X.; Wu, B.; Ling, F.; Zeng, Y.; Yan, N.; Yuan, C. Identification of priority areas for controlling soil erosion. Catena 2010, 83, 76–86. [Google Scholar] [CrossRef]
  14. Zhao, G.; Mu, X.; Wen, Z.; Wang, F.; Gao, P. Soil erosion, conservation, and eco-environment changes in the loess plateau of China. Land Degrad. Dev. 2013, 24, 499–510. [Google Scholar] [CrossRef]
  15. Cerda, A.; Lucas Borja, M.E.; Ubeda, X.; Francisco Martinez-Murillo, J.; Keesstra, S. Pinus halepensis M. versus Quercus ilex subsp Rotundifolia L. runoff and soil erosion at pedon scale under natural rainfall in Eastern Spain three decades after a forest fire. Forest Ecol. Manag. 2017, 400, 447–456. [Google Scholar] [CrossRef] [Green Version]
  16. Cao, S.; Chen, L.; Shankman, D.; Wang, C.; Wang, X.; Zhang, H. Excessive reliance on afforestation in China’s arid and semi-arid regions: Lessons in ecological restoration. Earth Sci. Rev. 2011, 104, 240–245. [Google Scholar] [CrossRef]
  17. Fu, B.; Chen, L.; Ma, K.; Zhou, H.; Wang, J. The relationships between land use and soil conditions in the hilly area of the loess plateau in northern Shaanxi, China. Catena 2000, 39, 69–78. [Google Scholar] [CrossRef]
  18. Iogunovic, I.; Telak, L.J.; Pereira, P. Experimental Comparison of Runoff Generation and Initial Soil Erosion Between Vineyards and Croplands of Eastern Croatia: A Case Study. Air Soil Water Res. 2020, 13, 1–9. [Google Scholar] [CrossRef]
  19. Marques, M.; Ruiz-Colmenero, M.; Bienes, R.; García-Díaz, A.; Sastre, B. Effects of a Permanent Soil Cover on Water Dynamics and Wine Characteristics in a Steep Vineyard in the Central Spain. Air Soil Water Res. 2020, 13, 1–10. [Google Scholar] [CrossRef]
  20. Shi, Z.; Song, C. Water Erosion Processes: A Historical Review. J. Soil Water Conserv. 2016, 30, 1–10. (In Chinese) [Google Scholar] [CrossRef]
  21. Fattet, M.; Fu, Y.; Ghestem, M.; Ma, W.; Foulonneau, M.; Nespoulous, J.; Le Bissonnais, Y.; Stokes, A. Effects of vegetation type on soil resistance to erosion: Relationship between aggregate stability and shear strength. Catena 2011, 87, 60–69. [Google Scholar] [CrossRef]
  22. Chen, H.; Zhang, X.; Abla, M.; Lü, D.; Yan, R.; Ren, Q.; Ren, Z.; Yang, Y.; Zhao, W.; Lin, P.; et al. Effects of vegetation and rainfall types on surface runoff and soil erosion on steep slopes on the Loess Plateau, China. Catena 2018, 170, 141–149. [Google Scholar] [CrossRef]
  23. Li, C.; Pan, C. The relative importance of different grass components in controlling runoff and erosion on a hillslope under simulated rainfall. J. Hydrol. 2018, 558, 90–103. [Google Scholar] [CrossRef]
  24. Liu, Y.F.; Liu, Y.; Wu, G.L.; Shi, Z.H. Runoff maintenance and sediment reduction of different grasslands based on simulated rainfall experiments. J. Hydrol. 2019, 572, 329–335. [Google Scholar] [CrossRef]
  25. Yang, S.; Gao, Z.-L.; Li, Y.-H.; Niu, Y.-B.; Su, Y.; Wang, K. Erosion control of hedgerows under soils affected by disturbed soil accumulation in the slopes of loess plateau, China. Catena 2019, 181. [Google Scholar] [CrossRef]
  26. Hou, G.; Bi, H.; Huo, Y.; Wei, X.; Zhu, Y.; Wang, X.; Liao, W. Determining the optimal vegetation coverage for controlling soil erosion in Cynodon dactylon grassland in North China. J. Clean Prod. 2020, 244. [Google Scholar] [CrossRef]
  27. Pan, C.; Ma, L. How the spatial distribution of grass contributes to controlling hillslope erosion. Hydrol Process. 2020, 34, 68–81. [Google Scholar] [CrossRef]
  28. Shen, M.S.; Zhang, J.J.; Zhang, S.H.; Zhang, H.B.; Sun, R.X.; Zhang, Y.Z. Seasonal variations in the influence of vegetation cover on soil water on the loess hillslope. J. Mt. Sci. 2020, 17, 2148–2160. [Google Scholar] [CrossRef]
  29. Boer, M.; Puigdefabregas, J. Effects of spatially structured vegetation patterns on hillslope erosion in a semiarid Mediterranean environment: A simulation study. Earth Surf. Proc. Land. 2005, 30, 149–167. [Google Scholar] [CrossRef]
  30. Bochet, E.; Poesen, J.; Rubio, J.L. Runoff and soil loss under individual plants of a semi-arid Mediterranean shrubland: Influence of plant morphology and rainfall intensity. Earth Surf. Process. Landf. 2006, 31, 536–549. [Google Scholar] [CrossRef]
  31. Wu, G.L.; Wang, D.; Liu, Y.; Hao, H.M.; Fang, N.F.; Shi, Z.H. Mosaic-pattern vegetation formation and dynamics driven by the water-wind crisscross erosion. J. Hydrol. 2016, 538, 355–362. [Google Scholar] [CrossRef]
  32. Lu, R.; Liu, Y.F.; Jia, C.; Huang, Z.; Liu, Y.; He, H.; Liu, B.R.; Wang, Z.J.; Zheng, J.; Wu, G.L. Effects of mosaic-pattern shrub patches on runoff and sediment yield in a wind-water erosion crisscross region. Catena 2019, 174, 199–205. [Google Scholar] [CrossRef]
  33. Zhou, J.; Fu, B.; Yan, D.; Lu, Y.; Wang, S.; Gao, G. Assessing the integrity of soil erosion in different patch covers in semi-arid environment. J. Hydrol. 2019, 571, 71–86. [Google Scholar] [CrossRef]
  34. Mei, X.; Zhu, Q.; Ma, L.; Zhang, D.; Wang, Y.; Hao, W. Effect of stand origin and slope position on infiltration pattern and preferential flow on a Loess hillslope. Land Degrad. Dev. 2018, 29, 1353–1365. [Google Scholar] [CrossRef]
  35. Hou, G.; Bi, H.; Wang, N.; Cui, Y.; Ma, X.; Zhao, D.; Wang, S. Optimizing the Stand Density of Robinia pseudoacacia L. Forests of the Loess Plateau, China, Based on Response to Soil Water and Soil Nutrient. Forests 2019, 10, 663. [Google Scholar] [CrossRef] [Green Version]
  36. Jiao, X.; Liu, G.; Tu, X. Estimat on of water resources carrying capacity for revegetation in the Loess Plateau. J. Hydraul. Eng. 2014, 45, 1344–1351. (In Chinese) [Google Scholar] [CrossRef]
  37. Wu, Q.; Wang, L.; Wu, F. Tillage-impact on infiltration of the Loess Plateau of China. Acta Agric. Scand. Soil Plant Sci. 2014, 64, 341–349. [Google Scholar] [CrossRef]
  38. Wang, L.; Dalabay, N.; Lu, P.; Wu, F. Effects of tillage practices and slope on runoff and erosion of soil from the Loess Plateau, China, subjected to simulated rainfall. Soil Till. Res. 2017, 166, 147–156. [Google Scholar] [CrossRef]
  39. Lin, Q.; Xu, Q.; Wu, F.; Li, T. Effects of wheat in regulating runoff and sediment on different slope gradients and under different rainfall intensities. Catena 2019, 183. [Google Scholar] [CrossRef]
  40. An, J.; Zheng, F.; Lu, J.; Li, G. Investigating the Role of Raindrop Impact on Hydrodynamic Mechanism of Soil Erosion Under Simulated Rainfall Conditions. Soil Sci. 2012, 177, 517–526. [Google Scholar] [CrossRef]
  41. Vásquez Méndez, R.; Ventura Ramos, E.; Oleschko, K.; Hernández Sandoval, L.; Parrot, J.F.; Nearing, M.A. Soil erosion and runoff in different vegetation patches from semiarid Central Mexico. Catena 2010, 80, 162–169. [Google Scholar] [CrossRef]
  42. Krause, S.; Lewandowski, J.; Grimm, N.B.; Hannah, D.M.; Pinay, G.; Mcdonald, K.; Marti, E.; Argerich, A.; Pfister, L.; Klaus, J.; et al. Ecohydrological interfaces as hot spots of ecosystem processes. Water Resour. Res. 2017, 53, 6359–6376. [Google Scholar] [CrossRef] [Green Version]
  43. Sun, W.; Mu, X.; Gao, P.; Zhao, G.; Li, J.; Zhang, Y.; Chiew, F. Landscape patches influencing hillslope erosion processes and flow hydrodynamics. Geoderma 2019, 353, 391–400. [Google Scholar] [CrossRef]
  44. Barbosa-Briones, E.; Cardona-Benavides, A.; Reyes-Hernandez, H.; Munoz-Robles, C. Ecohydrological function of vegetation patches in semi-arid shrublands of central Mexico. J. Arid Environ. 2019, 168, 36–45. [Google Scholar] [CrossRef]
  45. Zhang, Q.; Wang, Z.; Wu, B.; Shen, N.; Liu, J.E. Identifying sediment transport capacity of raindrop-impacted overland flow within transport-limited system of interrill erosion processes on steep loess hillslopes of China. Soil Till. Res. 2018, 184, 109–117. [Google Scholar] [CrossRef]
  46. Omidvar, E.; Hajizadeh, Z.; Ghasemieh, H. Sediment yield, runoff and hydraulic characteristics in straw and rock fragment covers. Soil Till. Res. 2019, 194, 104324. [Google Scholar] [CrossRef]
  47. Rodrigo-Comino, J.; Senciales, J.M.; Sillero-Medina, J.A.; Gyasi-Agyei, Y.; Ruiz-Sinoga, J.D.; Ries, J.B. Analysis of Weather-Type-Induced Soil Erosion in Cultivated and Poorly Managed Abandoned Sloping Vineyards in the Axarquía Region (Málaga, Spain). Air Soil Water Res. 2019, 12, 1–11. [Google Scholar] [CrossRef]
  48. Rodrigo-Comino, J.; Keesstra, S.; Cerdà, A. Soil Erosion as an Environmental Concern in Vineyards: The Case Study of Celler del Roure, Eastern Spain, by Means of Rainfall Simulation Experiments. Beverages 2018, 4, 31. [Google Scholar] [CrossRef] [Green Version]
  49. Zhang, G.; Liu, G.; Wang, G.; Wang, Y. Effects of patterned Artemisia capillaris on overland flow velocity under simulated rainfall. Hydrol. Process. 2012, 26, 3779–3787. [Google Scholar] [CrossRef]
  50. Zhang, G.; Liu, G.; Yi, L.; Zhang, P. Effects of patterned Artemisia capillaris on overland flow resistance under varied rainfall intensities in the Loess Plateau of China. J. Hydrol. Hydromech. 2014, 62, 334–342. [Google Scholar] [CrossRef] [Green Version]
  51. Pan, D.; Gao, X.; Dyck, M.; Song, Y.; Wu, P.; Zhao, X. Dynamics of runoff and sediment trapping performance of vegetative filter strips: Run-on experiments and modeling. Sci. Total Environ. 2017, 593, 54–64. [Google Scholar] [CrossRef] [PubMed]
  52. Ramos-Scharron, C.E. Land disturbance effects of roads in runoff and sediment production on dry tropical settings. Geoderma 2018, 310, 107–119. [Google Scholar] [CrossRef] [Green Version]
  53. Xu, X.; Zheng, F.; Qin, C.; Wu, H.; Wilson, G.V. Impact of cornstalk buffer strip on hillslope soil erosion and its hydrodynamic understanding. Catena 2017, 149, 417–425. [Google Scholar] [CrossRef]
  54. Bautista, S.; Mayor, A.G.; Bourakhouadar, J.; Bellot, J. Plant spatial pattern predicts hillslope semiarid runoff and erosion in a Mediterranean landscape. Ecosystems 2007, 10, 987–998. [Google Scholar] [CrossRef] [Green Version]
  55. Vannoppen, W.; De Baets, S.; Keeble, J.; Dong, Y.; Poesen, J. How do root and soil characteristics affect the erosion-reducing potential of plant species? Ecol. Eng. 2017, 109, 186–195. [Google Scholar] [CrossRef]
  56. Wang, B.; Li, P.P.; Huang, C.H.; Liu, G.B.; Yang, Y.F. Effects of root morphological traits on soil detachment for ten herbaceous species in the Loess Plateau. Sci. Total Environ. 2021, 754, 142304. [Google Scholar] [CrossRef]
  57. Williams, C.J.; Pierson, F.B.; Robichaud, P.R.; Al Hamdan, O.Z.; Boll, J.; Strand, E.K. Structural and functional connectivity as a driver of hillslope erosion following disturbance. Int. J. Wildland Fire. 2016, 25, 306–321. [Google Scholar] [CrossRef] [Green Version]
  58. Yu, Y.; Wei, W.; Chen, L.; Feng, T.; Daryanto, S. Quantifying the effects of precipitation, vegetation, and land preparation techniques on runoff and soil erosion in a Loess watershed of China. Sci. Total Environ. 2019, 652, 755–764. [Google Scholar] [CrossRef]
  59. Feng, J.; Wei, W.; Pan, D. Effects of rainfall and terracing-vegetation combinations on water erosion in a loess hilly area, China. J. Environ. Manag. 2020, 261. [Google Scholar] [CrossRef]
Figure 1. (a) The location of the National Field Research Station of Forest Ecosystem in the Cai Jiachuan Watershed, Ji County, Shanxi Province, China; (b) the location of runoff plots in the study watershed; (c) photograph illustration the landscape of the study areas.
Water 12 03201 g001
Figure 2. Field experiment blueprints of different types of patches and different number of patches under the same coverage.
Water 12 03201 g002
Figure 3. Schematic of the side-spray rainfall simulation system used in the present study.
Water 12 03201 g003
Figure 4. Variation in rates of runoff (a) and sediment transport (b) under different types of vegetation patches.
Water 12 03201 g004
Figure 5. Variation in runoff rates (a) and sediment transportation (b) under different numbers of vegetation patches.
Water 12 03201 g005
Figure 6. Between the rate of runoff (a), sediment transport (b), and patch area within an experiment.
Water 12 03201 g006
Figure 7. Between surface runoff and soil loss for different vegetation patch types (a) and numbers (b) within an experiment.
Water 12 03201 g007
Table 1. The properties of soil to a depth of 0–10 cm for the experimental grassland.
Bulk Density (g cm−3)Clay (%)Silt (%)Sand (%)Organic C (g kg−1)
1.342.352.0145.6914.59
Table 2. Basic overview of the runoff plots.
Landscape TypesThe Slope Condition of the PlotProphase Water Content (%)
Random patchesBare patches and vegetation patches were naturally distributed on the slope19.5 ± 0.5
Grid patchesMosaic distribution of bare patches and vegetation patches with dimensions of 0.25 m × 0.5 m20.2 ± 0.2
Horizonal pathMosaic distribution of bare patches and vegetation patches with dimensions of 0.5 m × 0.5 m20.1 ± 0.4
S-road pathA sloping road in the middle of the slope, accounting for 50% of the total plot area19.6 ± 0.6
Bare landAn absence of vegetation on the slope surface19.8 ± 0.4
Matts (15)Mosaic distribution of bare patches and vegetation patches with dimensions of 0.17 m × 0. 5 m19.6 ± 0.4
Matts (20)Mosaic distribution of bare patches and vegetation patches with dimensions of 0.125 m × 0.5 m19.8 ± 0.5
Table 3. Run-off and sediment yields for different types of vegetation patches under simulated rainfall.
Treatment/
Patches Number
RunoffSediment
Starting Time (min)Total Volume (L)Average Rate (mm/min·m2)Steady Rate (mm/min·m2)Total Amount (g)Sediment Concentration (g/L)Rate (g/min·m2)
Bare soil0.76 ± 0.04 (c)126.98 ± 2.32 (a)0.737 ± 0.023 (a)0.999 ± 0.014 (a)3953.17 ± 56.89 (a)17.65 ± 0.28 (a)26.22 ± 1.33 (a)
S-road patches0.89 ± 0.03 (c)96.85 ± 0.69 (b)0.558 ± 0.023 (b)0.838 ± 0.027 (b)2376.461 ± 0.883 (b)13.091 ± 0.443 (b)15.17 ± 0.55 (b)
Strips patches1.89 ± 0.06 (b)64.31 ± 1.02 (c)0.372 ± 0.014 (c)0.504 ± 0.016 (c)1357.58 ± 1.27 (c)9.09 ± 0.20 (c)8.34 ± 0.23 (c)
Grids patches1.72 ± 0.03 (b)60.72 ± 1.55 (c)0.353 ± 0.014 (c)0.486 ± 0.029 (c)1220.16 ± 23.47 (c)9.39 ± 0.23 (c)7.54 ± 0.35 (c)
Random patches2.48 ± 0.07 (a)47.77 ± 3.28 (d)0.273 ± 0.022 (d)0.414 ± 0.011 (d)598.53 ± 63.35 (d)4.85 ± 1.03 (d)3.53 ± 0.38 (d)
Note: The data in the table represent averages ± standard error (SE). The same lower-case letter indicates no significant difference at p < 0.05 between the different types of vegetation patches.
Table 4. Flow hydrodynamic parameters for different types of vegetation patches under simulated rainfall.
Treatment/Patches NumberFlow Velocity (v, cm/s)Flow Depth (h, mm)Reynolds Number (Re)Froude Number (Fr)Darcy-Weisbach Resistance (f)Manning Roughness (n)Flow Shear Stress (τ, Pa)Stream Power (W, w/m2)
Bare soil5.66 ± 0.01 (a)1.24 ± 0.02 (a)70.04 ± 1.28 (a)0.54 ± 0.01 (a)7.72 ± 0.12 (c)0.102 ± 0.001 (c)10.20 ± 0.14 (a)0.189 ± 0.003 (a)
S-road patches4.94 ± 0.00 (b)1.08 ± 0.00 (b)53.23 ± 0.19 (b)0.51 ± 0.00 (a)8.86 ± 0.03 (c)0.106 ± 0.000 (bc)7.02 ± 0.01 (b)0.144 ± 0.001 (b)
Strips patches4.02 ± 0.00 (c)0.89 ± 0.01 (c)35.48 ± 0.56 (c)0.46 ± 0.00 (b)11.05 ± 0.16 (b)0.115 ± 0.001 (b)4.92 ± 0.00 (c)0.096 ± 0.002 (c)
Grids patches4.00 ± 0.02 (c)0.84 ± 0.03 (c)33.50 ± 0.86 (c)0.47 ± 0.01 (b)10.62 ± 0.41 (b)0.112 ± 0.003 (b)4.45 ± 0.10 (c)0.090 ± 0.002 (c)
Random patches3.02 ± 0.03 (d)0.87 ± 0.05 (c)26.35 ± 1.81 (d)0.36 ± 0.02 (c)19.22 ± 0.73 (a)0.150 ± 0.005 (a)2.88 ± 0.27 (d)0.071 ± 0.005 (d)
Note: The data in the table represent averages ± standard error (SE). The same lower-case letter indicates no significant difference at p < 0.05 between the different types of vegetation patches.
Table 5. Run-off and sediment yields for the different numbers of vegetation patches under simulated rainfall.
Patches NumberRunoffSediment
Starting Time (min)Total Volume (L)Average Rate (mm/min·m2)Steady Rate (mm/min·m2)Total Amount (g)Sediment Concentration (g/L)Rate (g/min·m2)
51.89 ± 0.06 (bc)64.31 ± 1.02 (a)0.372 ± 0.014 (a)0.504 ± 0.016 (a)1357.58 ± 1.27 (a)9.09 ± 0.20 (a)8.34 ± 0.23 (a)
101.72 ± 0.03 (b)60.72 ± 1.55 (ab)0.353 ± 0.014 (b)0.486 ± 0.029 (ab)1220.16 ± 23.47 (b)9.39 ± 0.23 (a)7.54 ± 0.35 (b)
151.95 ± 0.05 (b)57.18 ± 0.46 (bc)0.333 ± 0.009 (c)0.445 ± 0.011 (ab)1085.45 ± 2.75 (c)7.71 ± 0.42 (b)6.58 ± 0.21 (c)
202.25 ± 0.07 (a)53.30 ± 1.04 (c)0.309 ± 0.008 (d)0.427 ± 0.009 (b)977.69 ± 0.50 (d)7.57 ± 0.44 (b)5.90 ± 0.17 (d)
Note: The data in the table represent averages ± standard error (SE). The same lower-case letter indicates no significant difference at p < 0.05 between the different numbers of vegetation patches.
Table 6. Flow hydrodynamic parameters for the different numbers of vegetation patches under simulated rainfall.
Treatment/Patches NumberFlow Velocity (v,cm/s)Flow Depth (h,mm)Reynolds Number (Re)Froude Number (Fr)Darcy-Weisbach Resistance (f)Manning Roughness (n)Flow shear Rtress (τ,Pa)Stream Power (W,w/m2)
54.02 ± 0.00 (a)0.89 ± 0.01 (a)35.48 ± 0.56 (a)0.46 ± 0.00 (a)11.05 ± 0.16 (bc)0.117 ± 0.0001 (bc)2.37 ± 0.04 (a)0.096 ± 0.002 (a)
104.00 ± 0.02 (a)0.84 ± 0.03 (a)33.50 ± 0.86 (a)0.47 ± 0.01 (a)10.62 ± 0.41 (c)0.114 ± 0.0003 (c)2.25 ± 0.07 (b)0.090 ± 0.002 (a)
153.77 ± 0.01 (b)0.84 ± 0.01 (a)31.54 ± 0.25 (b)0.44 ± 0.00 (b)11.95 ± 0.23 (b)0.121 ± 0.0001 (b)2.25 ± 0.03 (c)0.085 ± 0.001 (ab)
203.49 ± 0.00 (c)0.85 ± 0.02 (a)29.40 ± 0.57 (b)0.41 ± 0.00 (c)13.99 ± 0.29 (a)0.130 ± 0.0002 (a)2.27 ± 0.05 (c)0.079 ± 0.001 (b)
Note: The data in the table represent averages ± standard error (SE). The same lower-case letter indicates no significant difference at p < 0.05 between the different numbers of vegetation patches.
Table 7. Relationships between surface runoff and soil loss for different patch types and quantity.
Treatment/Patches NumberRegression FunctionR2p
Bare land y = 147.437 x 0.533 0.875<0.01
S-road patches y = 95.901 x 0.607 0.925<0.01
Strips patches y = 63.585 x 0.758 0.965<0.01
Grids patches y = 62.508 x 0.666 0.982<0.01
Random patches y = 33.396 x 0.877 0.961<0.01
5 y = 63.585 x 0.758 0.965<0.01
10 y = 62.508 x 0.666 0.982<0.01
15 y = 54.832 x 0.758 0.986<0.01
20 y = 52.341 x 0.748 0.984<0.01
Note: x, surface runoff (mm); y, soil loss (t km−2).
Publisher’s Note: MDPI stays neutral with regard to jurisdictional claims in published maps and institutional affiliations.

