Article

Integrating the InVEST and SDSM Model for Estimating Water Provision Services in Response to Future Climate Change in Monsoon Basins of South China

1
College of Resources and Environment Science, Hunan Normal University, Changsha 410081, China
2
Agro-Ecological Processes in Subtropical Region, Institute of Subtropical Agriculture, Chinese Academy of Sciences, Changsha 410125, China
3
College of Resources and Environment, University of Chinese Academy of Sciences, Beijing 100049, China
4
Key Laboratory of Geospatial Big Data Mining and Application, Changsha 410081, China
*
Author to whom correspondence should be addressed.
Water 2020, 12(11), 3199; https://doi.org/10.3390/w12113199
Submission received: 13 September 2020 / Revised: 6 November 2020 / Accepted: 10 November 2020 / Published: 16 November 2020
(This article belongs to the Section Hydrology)

Abstract

:
An assessment of how future climate change will impact water provision services is important for formulating rational water resources management and development strategies as well as for ecosystem protection. The East Asian monsoon is an important component of the Asian climate and its changes affect the climate in East Asia and seriously affect the provision of water services. In this study, through the coupling of the Integrated Valuation of Ecosystem Services and Tradeoffs (InVEST) model and Statistical Downscaling Technique Model (SDSM), we evaluated the impact of future climate change on water provisions in a typical East Asian monsoon basin of South China. The results demonstrate the applicability of the InVEST model combined with the SDSM model over the East Asian monsoon river basins. Under representative concentration pathway 4.5 scenario (RCP4.5), the annual average maximum and minimum temperatures would continually increase far into the future (2080–2095). However, the maximum and minimum temperatures slightly decreased under representative concentration pathway 2.6 scenario (RCP2.6) in the far future (2080–2095). The annual average precipitation and reference evapotranspiration experienced slight but steady increasing trends under the RCP2.6 and RCP4.5 scenarios. Based on the InVEST model simulation, annual average water yield would increase by 19.3% (33.5%) far in the future (2080–2095) under RCP2.6 (4.5) scenario. This study provides a valuable reference for studying future climate change impacts on water provisions in East Asian monsoon basins.

1. Introduction

The climate is predicted to change significantly by the end of the twenty-first century according to the Fifth Assessment Report of the Intergovernmental Panel on Climate Change (IPCC AR5) [1,2]. Climate change will significantly affect terrestrial hydrology, which in turn will affect water resources [3]. Water is important for all natural and socioeconomic systems. Climate change can directly impact the variation and patterns of water resources availability and indirectly affect agriculture, energy supply and overall water infrastructure [4,5]. Therefore, projecting climate change and assessing its potential effects on water provision services is important for present and future assessments and management planning of water resources.
The impact of climate change has been extensively studied using general circulation models (GCMs), which can provide credible information about the historical, current and future climate [6,7]. They are considered the most effective and commonly used tools to simulate the general circulation of the oceans or planetary atmosphere [8]. The IPCC AR5 promoted the development of the fifth phase of the Coupled Model Intercomparison Project Phase 5 (CMIP5), which includes a large number of GCMs [9]. The Canadian Earth System Model (CanESM2) is one of these models which is widely used in building future climate scenarios [10,11,12]. Chen et al. [13] demonstrated that the CanESM2 model can accurately simulate the air temperature over China. The CanESM2 model can also simulate the variability of precipitation over China quite well [14].
However, due to the relatively coarse spatial resolution (usually about 50,000 km2) of GCM outputs, some climate information at regional and basin scale applications are not well predicted for climate impact studies [15]. As a consequence, GCMs generally fail when considering the features required in hydrologic modeling and impact assessment on water resources [16]. Hence, the downscaling technique is used to bridge this difference and downscale the relatively coarse-resolution GCMs to smaller regional or basin scales. One form of the downscaling technique is the dynamic downscaling method, which has a clear physical meaning. The other form is the statistical downscaling method, which builds a statistical relationship between the local and large-scale variables to project for the future. The statistical downscaling method has an advantage over the dynamic downscaling method because it is low-cost, computationally undemanding and the implementation is convenient [17,18].
There are various statistical downscaling methods available. The statistical downscaling model (SDSM) is one of the most famous and promising downscaling methods [19,20]. It has been widely used to downscale coarser-resolution GCMs to a finer-resolution regional or basin scale [21,22]. Many comparative studies have shown that the SDSM model is easy to operate and has the superior capability to capture local-scale climate variability [23,24]. The SDSM model efficiently forecasts single and multiple-site climate variables for current and different future emission scenarios while requiring inexpensive computation [7]. It has been applied in many places around the world, and a variety of previous work has focused on temperature and precipitation downscaling [23,25,26,27]. To quantify the impacts of future climate change on regional hydrological regimes, some scholars used the SDSM model to convert the GCM output into fine-resolution climate parameters for hydrological modeling. Zhou et al. [28] integrated the soil and water assessment tool (SWAT) model and the SDSM model to quantify the impacts of climate change on streamflow in the Lake Dianchi watershed, China. Meenu et al. [21] assessed the impacts of future climate change scenarios on the hydrology in the Tunga-Bhadra river basin of India with the Hydrologic Modeling System version 3.4 and SDSM model. Liu and Xu [29] used two downscaling methods and a SWAT model to quantify the effects of climate change on the basin water cycle in the Yangtze and Yellow River basins. However, as of now, few studies have focused on future water provision responses to climate change scenarios by integrating the SDSM model and ecosystem service models.
Water provision is an important ecosystem service that provides the foundation for human survival and development [30]. Given the complexity involving the roles and pathways of water resources in ecosystems, calculating and mapping water provision are still a challenge. Ecosystem service models such as Integrated Valuation of Ecosystem Service and Tradeoffs (InVEST) [31] can be easily used and provide a simple quantitative method to estimate water provisions under a wide range of conditions. The InVEST model is a widely used ecosystem service model jointly developed by Stanford University, the World Wildlife Fund, and the Nature Conservancy. The water yield module in InVEST model is crucial to water-related ecosystem services and can quantitatively evaluate the water provision capacity of different sub-watersheds on a large scale. It is a spatially explicit tool that uses fewer data and variables compare to SWAT and the results can be reported in the gridded map, table and shapefile. The InVEST model has been used to successfully evaluate the water provision in small and large river basins in different regions of the world, including China, Europe, India, and Iran [32,33,34,35]. Moreover, many studies and results have suggested that water provision estimates are highly sensitive to climate [36,37,38]. However, the application of the InVEST model combined with the downscaling method to evaluate future water provisions is rare in the pertinent literature, especially in East Asian monsoon basin. It is of vital importance to predict climate change and assess its potential impact on water provision services.
This study aims to evaluate the impact of future climate change scenarios on the water provision services in a typical East Asian monsoon basin of South China. There were two objectives of this paper: (1) to investigate future climate scenarios developed from CanESM2 under two Representative Concentration Pathway (RCP) emission scenarios (RCP2.6 and RCP4.5) using the SDSM model; (2) to assess future water provisions using the InVEST model together with downscaling outputs. The results may provide a useful reference for planning water infrastructure projects and water resources management in the East Asian monsoon river basins.

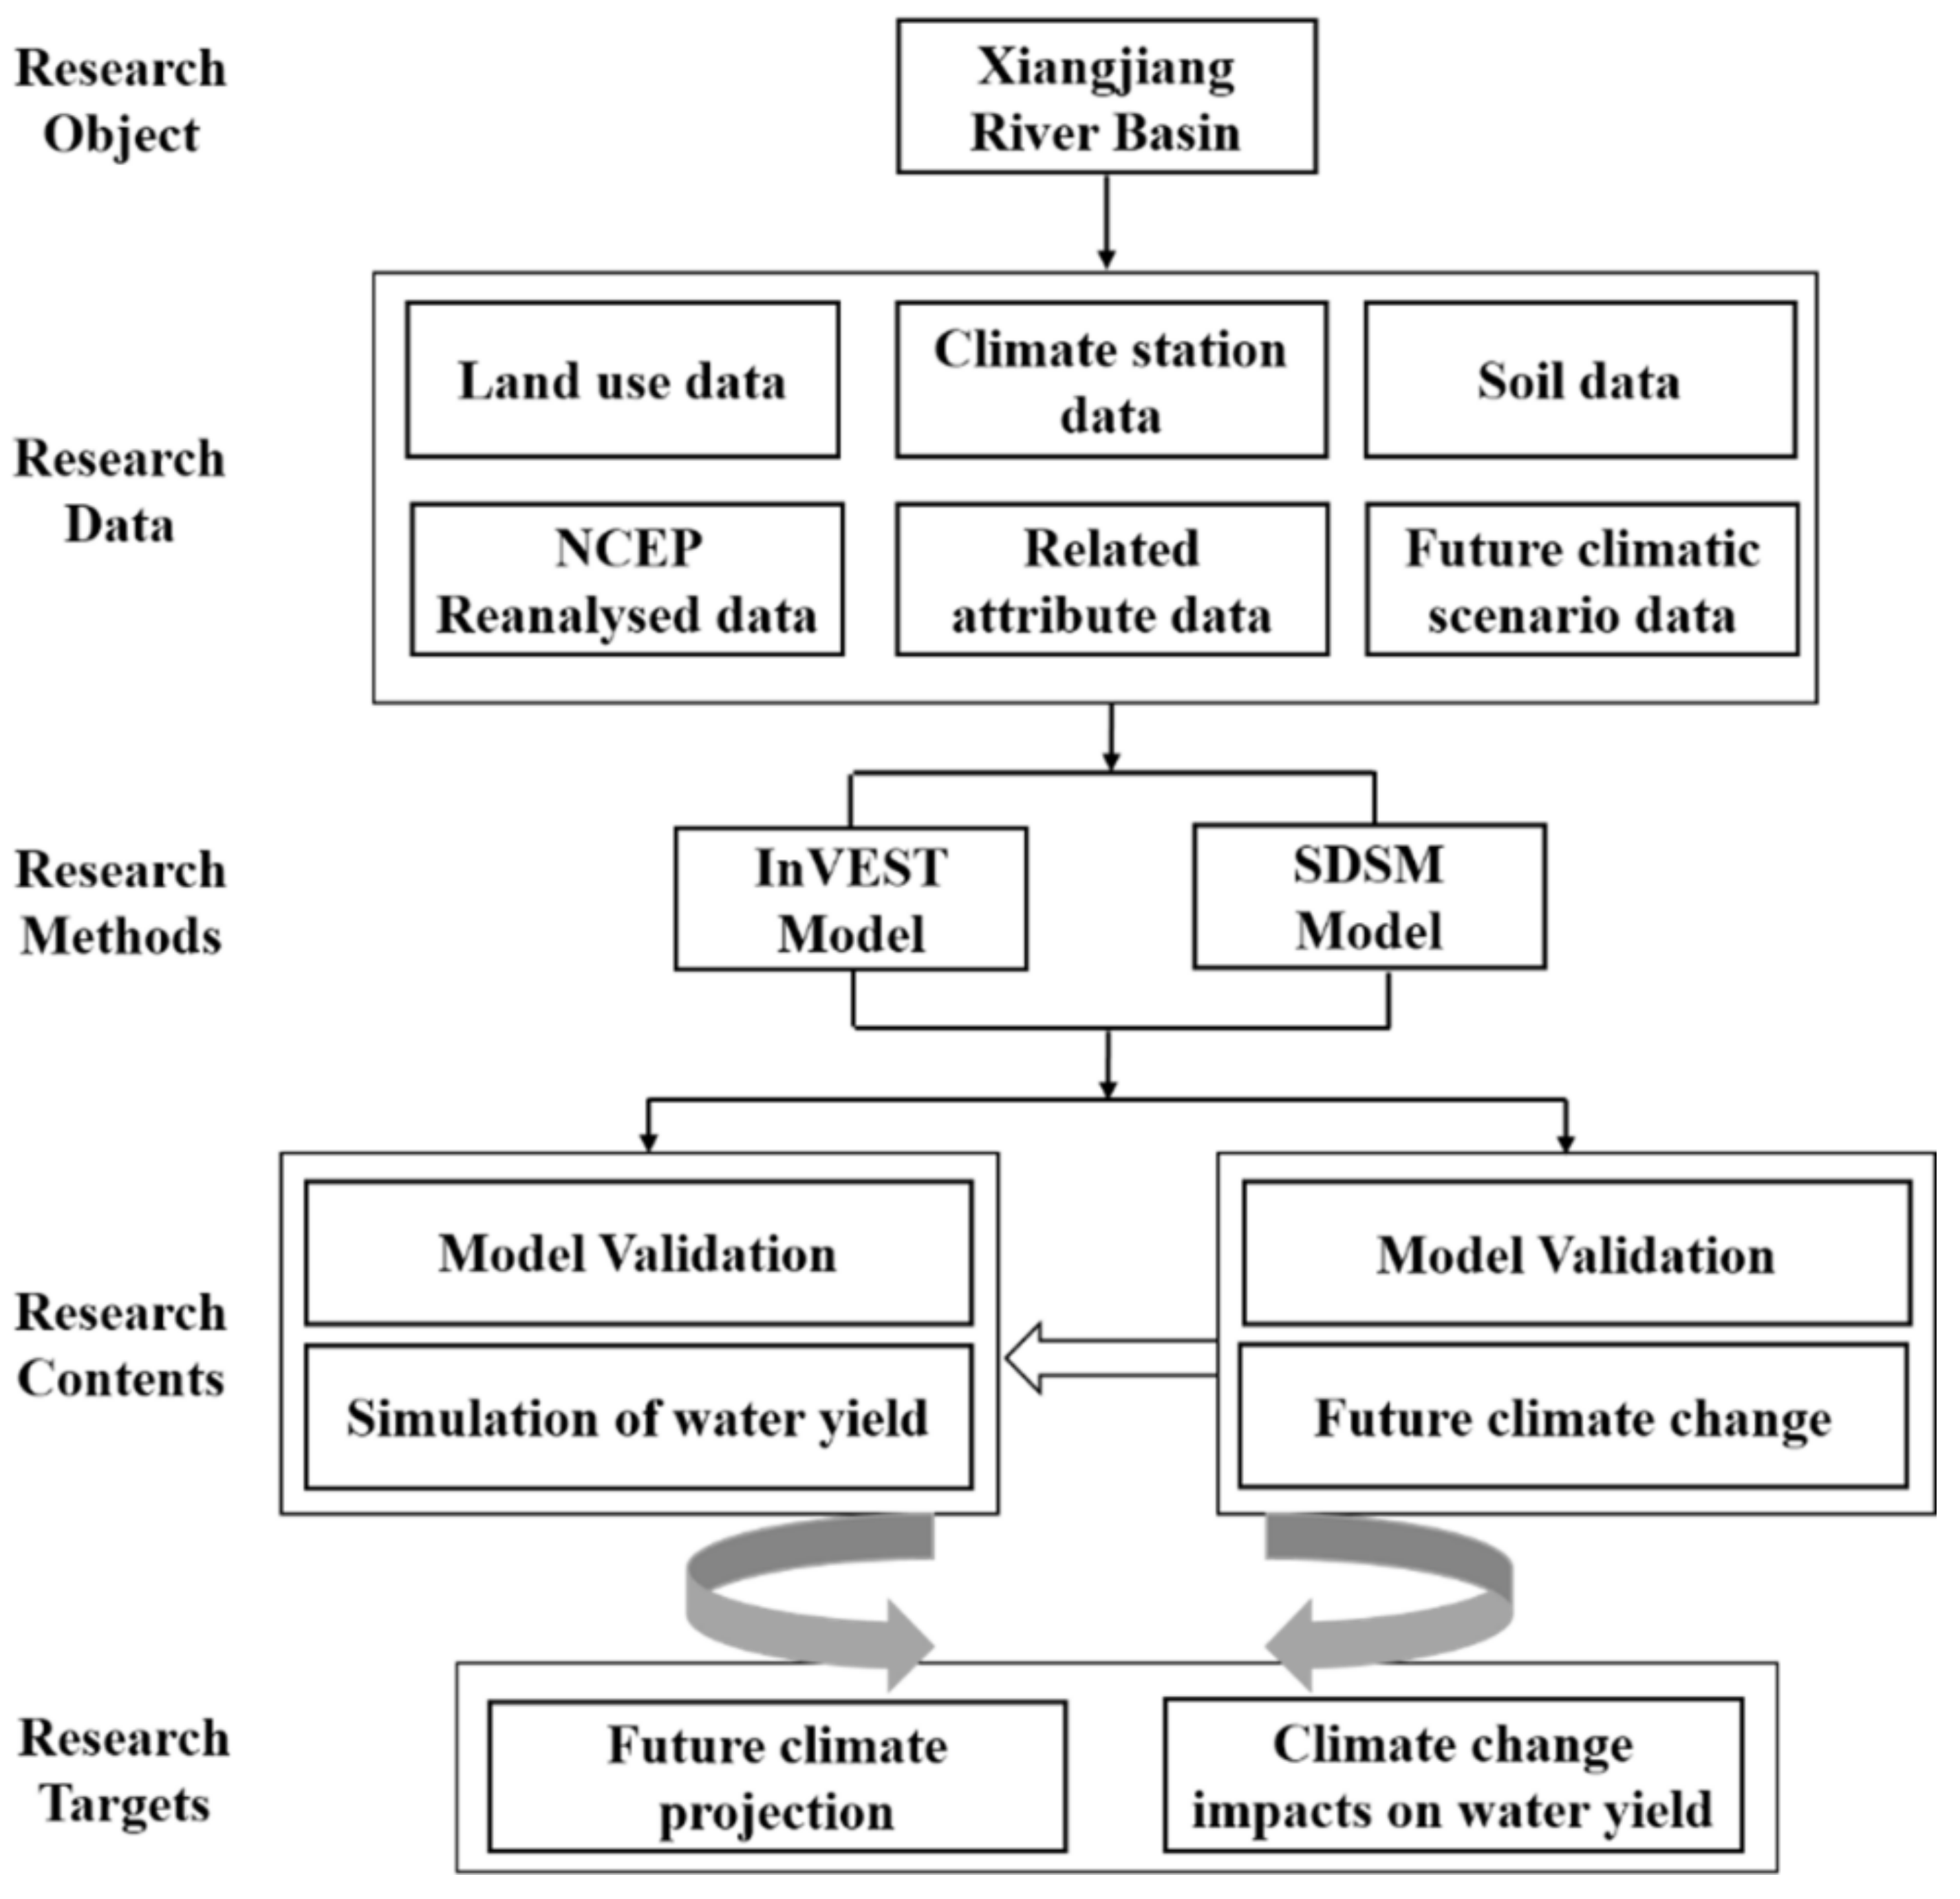
2. Materials and Methods

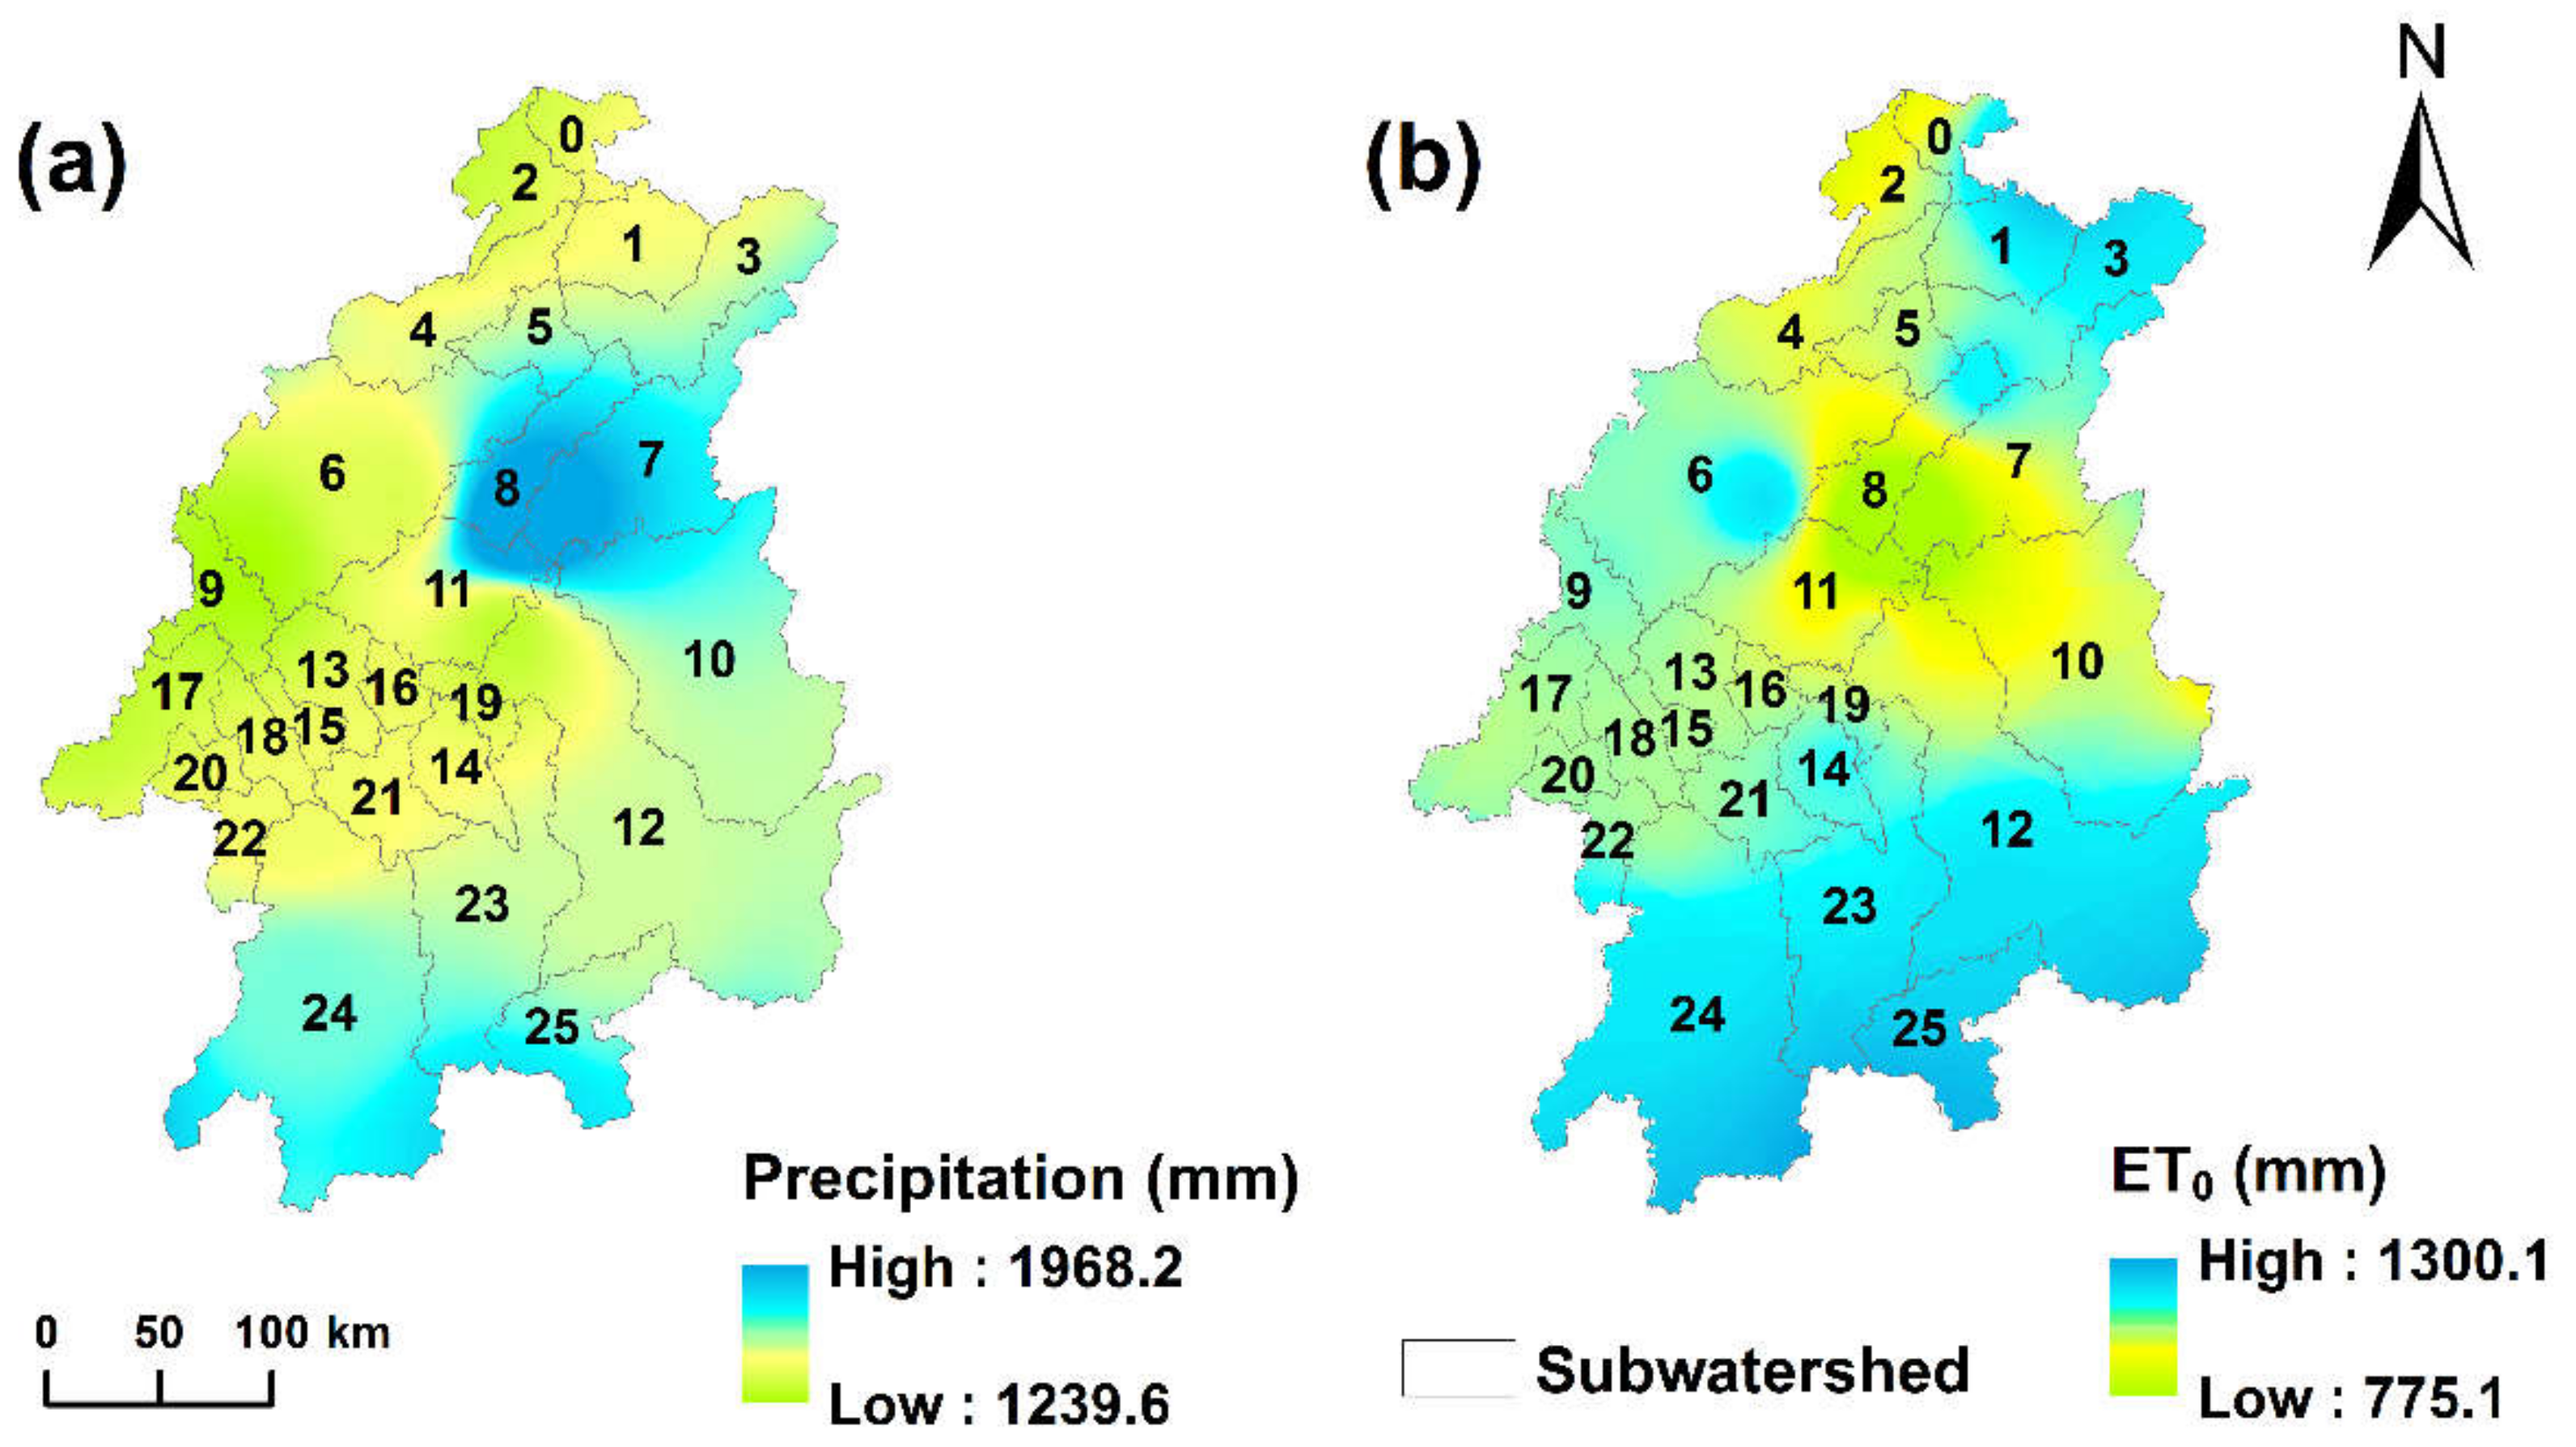
2.1. Xiangjiang River Basin

The Xiangjiang River spans latitudes of 24°30′ N to 28°40′ N and longitudes of 110°30′ E and 114°30′E. It is one of the most important rivers and the major tributaries of the Yangtze River in China. The study area covers an area of nearly 8.5 × 10⁴ km2, occupying about 88.9% of the total area of the Xiangjiang River basin area (Figure 1). It covers 9 cities in Hunan Province including Changsha, Xiangtan, Zhuzhou, Yongzhou, Loudi, Yueyang, Shaoyang, Chenzhou and Hengyang. The study area covers 60% of the population and 40% of the total area of Hunan Province and is responsible for 63.5% of the gross domestic product [39]. It is located in the East Asian monsoon climate zone with annual precipitation > 1200 mm and average temperature of 17 °C. The major land use types of the study area are woodland, farmland, grassland, residential area and water. According to the Water Resources Bulletin of Hunan Province, the natural runoff of the Xiangjiang River Basin from 2000 to 2015 is 465.1–1059.6 × 108 m3, which changed greatly. Moreover, serious and frequent droughts and floods often occur in the study area, which affects the development of the river basin and has a significant impact on Hunan’s agriculture and other economies [40].

2.2. Data

In this paper, we used InVEST (version 3.3.3) with input data which includes gridded maps of land use/cover, soil properties, climate and some biophysical coefficients. Observed meteorological data, the National Center of Environmental Prediction (NCEP), and the future GCM grid outputs were used for the SDSM model. The basic data information and their sources are summarized as follows.
The observed daily precipitation, maximum and minimum temperatures data covering 1966–2015 from 22 weather stations around the study area (Figure 1) were taken from the Climatic Data Center, National Meteorological Information Center, China Meteorological Administration (http://data.cma.cn/). All observed data series were quality controlled. The reanalysis dataset predictor variables of the NCEP is daily series for 1969–2005 at a spatial resolution of 2.8125° × 2.8125°, which includes 26 large-scale atmospheric variables such as horizontal wind, near surface relative and specific humidity, mean sea level pressure and others [41].
The CanESM2 under RCP2.6 and RCP4.5 scenarios were chosen in this study. These scenarios were daily series for 2006–2100 and included the same large-scale atmospheric variables as NCEP data. The RCP2.6 scenario is an ideal low emissions scenario which has a peak radiative forcing of 3.1 W m−2 (approximately 490 ppm CO2) before 2100 and then declines to 2.6 W m−2 by 2100 [42]. This scenario presents a future with many policies and technologies for reducing greenhouse gas emissions. RCP4.5 scenario reflects an intermediate stabilization scenario, which assumes that radiative forcing stabilizes at 4.5 W m−2 (about 650 ppm CO2) in 2100 [2]. This scenario considers the development of the global economy, and there will still be long-term global greenhouse gas emissions and short-lived material emissions [43], which is also in line with China’s future economic development. RCP8.5 is an impossible high-risk future scenario, especially in China, which is not considered in this study. The NCEP and CanESM2 datasets were downloaded from the Canadian Centre for Climate Modeling and Analysis (https://www.canada.ca/en.html) and obtained for each location using the actual station latitude and longitude grid-box at a resolution of 2.8125°×2.8125°.
The gridded map of soil depth and soil texture (%silt, %sand, %clay, %organic carbon) were generated based on the National Tibetan Plateau Data Center (http://data.tpdc.ac.cn/zh-hans/ [44]). The land use/land cover (LULC) data from 2000 to 2015 were derived from the Climate Change Initiative of the European Space Agency (http://maps.elie.ucl.ac.be/CCI/viewer/download.php) at 300 m spatial resolution. For further study, twenty-Two land cover types in the study area were reclassified into six major groups, which are woodland, farmland, grassland, residential area, water, and unused land.

2.3. Methods

In this study, we used SDSM 4.2 to downscale the precipitation, minimum and maximum temperatures in the study area. The hydrological projections are performed by using the InVEST (version 3.3.3) model, which has been tested on this basin prior to this study [38]. A flow chart of the techniques using in this study is shown in Figure 2.

2.3.1. InVEST Model

The water yield module in InVEST model was used to map and quantify water provisions. The module is a spatially explicit tool and calculates the sum and averages of the water yield based on the Budyko curve [45] and the principle of water balance at the sub-watershed level. It runs in the gridded map at an average annual time step which requires five types of gridded data, a sub-watershed shapefile data, a biophysical table, and a constant parameter Z. A fully detailed description of InVEST model can be found in Sharp et al. [31]. All gridded data were resampled at a spatial scale of 1000 m and projected using the WGS84.
In addition to LULC and soil depth, the input gridded data also includes Plant available water content (PAWC), annual reference evapotranspiration, and precipitation. The PAWC calculation follows Zhou’s method [46] that requires soil chemical and physical properties. The reference evapotranspiration (ET0) was estimated using the Hargreaves equation [47] which requires only maximum and minimum temperatures. Gridded annual precipitation and annual ET0 were obtained using the inverse distance weighted interpolation method in ArcGIS 10.4 software (http://www.esri.com/software/arcgis) for each corresponding time period for the Xiangjiang River Basin. Figure 3a,b showed the average annual precipitation and ET0 from 2000 to 2015. The sub-watershed was extracted from the SRTM product with a spatial resolution of 30 m [48] (http://srtm.csi.cgiar.org/) using ArcGIS 10.4. The parameter Z was assumed to be 7, which resulted in the lowest error [38]. The biophysical coefficients of each LULC class used in the module mainly include the root depth and plant evapotranspiration coefficient (Kc). The root depth was obtained from Canadell et al.’s study [49], and the Kc was provided by FAO 56 guidelines [50].

2.3.2. SDSM Downscaling Method

The SDSM model is an integration of the Stochastic Weather Generator (SWG) and the Multiple Linear Regression (MLR) promoted by Wilby, Dawson and Barrow [51]. Regression parameters were created by MLR downscaling method based on the empirical relationship between the local climate predictands (temperature and precipitation data) and relevant large-scale predictors (NCEP). Then the parameters along with GCMs large-scale (CanESM2) were revised by SWG to imitate future climate change scenarios. Generally, the SDSM model is applied by a set of steps (Figure 4). Detail procedures and steps can be found in Wilby et al. [22,51].
In the study, the precipitation, maximum and minimum temperatures were chosen as predictands. We applied the SDSM model to downscale their future time series at different meteorological stations. The future climate change scenarios were developed from the CanESM2 under the two RCP emission scenarios (RCP2.6 and RCP4.5) in three future periods: near future (2020s, 2020–2035), middle future (2050s, 2050–2065) and far future (2080s, 2080–2095). The most relevant predictors were selected in the SDSM model based on correlation and partial correlation analysis between the large-scale predictors and predictands from all given stations. Following the user manual, the wet day threshold was set to 0 mm, and a fourth root transformation was applied to the original precipitation data to convert it to a normal distribution [22]. In the predicators selected, the mean temperature at 2 m, surface meridional velocity, near surface specific humidity and mean sea level pressure were determined to be generally suitable large-scale predictors for the simulation of temperature predictands. As for precipitation, the usage frequency of 850 hPa velocity, surface meridional velocity, relative humidity at 500 hPa and 850 hPa were amongst the highest in this downscaling experiment. These selected predictors were used in the calibration procedure.

2.3.3. Performance Assessment

The accuracy of the water yield simulation was performed by comparing the observed and simulated annual streamflow data. Prior study showed the proper application of the InVEST model and showed that it can provide a reliable base for future projections of water yield in the study area [38]. The SDSM model was used to calibrate the relationship between predictands and predictors before generating future climate change scenarios, and validation was required subsequent to calibration. The performance of the model was determined by the root mean square error (RMSE) and coefficient of determination (R2). Details of these statistical methods are available in Gupta, Sorooshian and Yapo [52] and Moriasi et al. [53].
The downscaled baseline precipitation and ET0 generated from the SDSM model were input to the InVEST model to simulate the water yield. The water yield of the Xiangjiang River Basin for the baseline period (2000–2015) was characterized using simulated results from the InVEST model developed in this study. The downscaled future precipitation and ET0 for the CanESM2 under RCP2.6 and RCP4.5 scenarios were input into the InVEST model to explore water yield response to projected future climate change scenarios. Other input data (i.e., sub-watershed shapefile, biophysical table, soil depth, Z, and LULC in 2015) were kept constant for all future scenarios. The simulated water yield based on the future projections was then synthesized in terms of long-term annual average values for the near future (2020–2035), middle future (2050–2065) and far future (2080–2095). The change of water yield was reported as the effects of climate change on water provision services, with respect to a simulated baseline period (2000–2015).

3. Results and Discussion

3.1. Climate Change Scenarios

3.1.1. SDSM Calibration and Validation

According to the availability of observed data, the calibration period of daily meteorological data was 30 years from 1966 to 1995 and data from the last 10 years (1996–2005) were used for validation of each predictand in each meteorological station. Ordinary least squares were used for optimization. As shown in Figure 5a,b there was good agreement between the observed and simulated minimum and maximum temperature values. The R2 were 0.96 and 0.97 between yearly observed and simulated minimum and maximum temperatures. The RMSE was 0.4 and 0.3 °C for the maximum and minimum temperatures, respectively. However, precipitation did not perform better than temperature. The R2 between yearly observed and simulated data was 0.54 and RMSE was 165.7 mm, as shown in Figure 5c. In conclusion, the SDSM model can generate projected climate scenarios over the Xiangjiang River Basin. Relatively speaking, the simulation effect of precipitation is not as good as that of temperature. Precipitation is heterogeneous, more complex, and difficult to simulate precisely, and many previous studies have demonstrated that downscaling can better construct temperature series than precipitation [6,23,54]. Further research is needed to gain insights regarding the future atmospheric circulation change on precipitation.

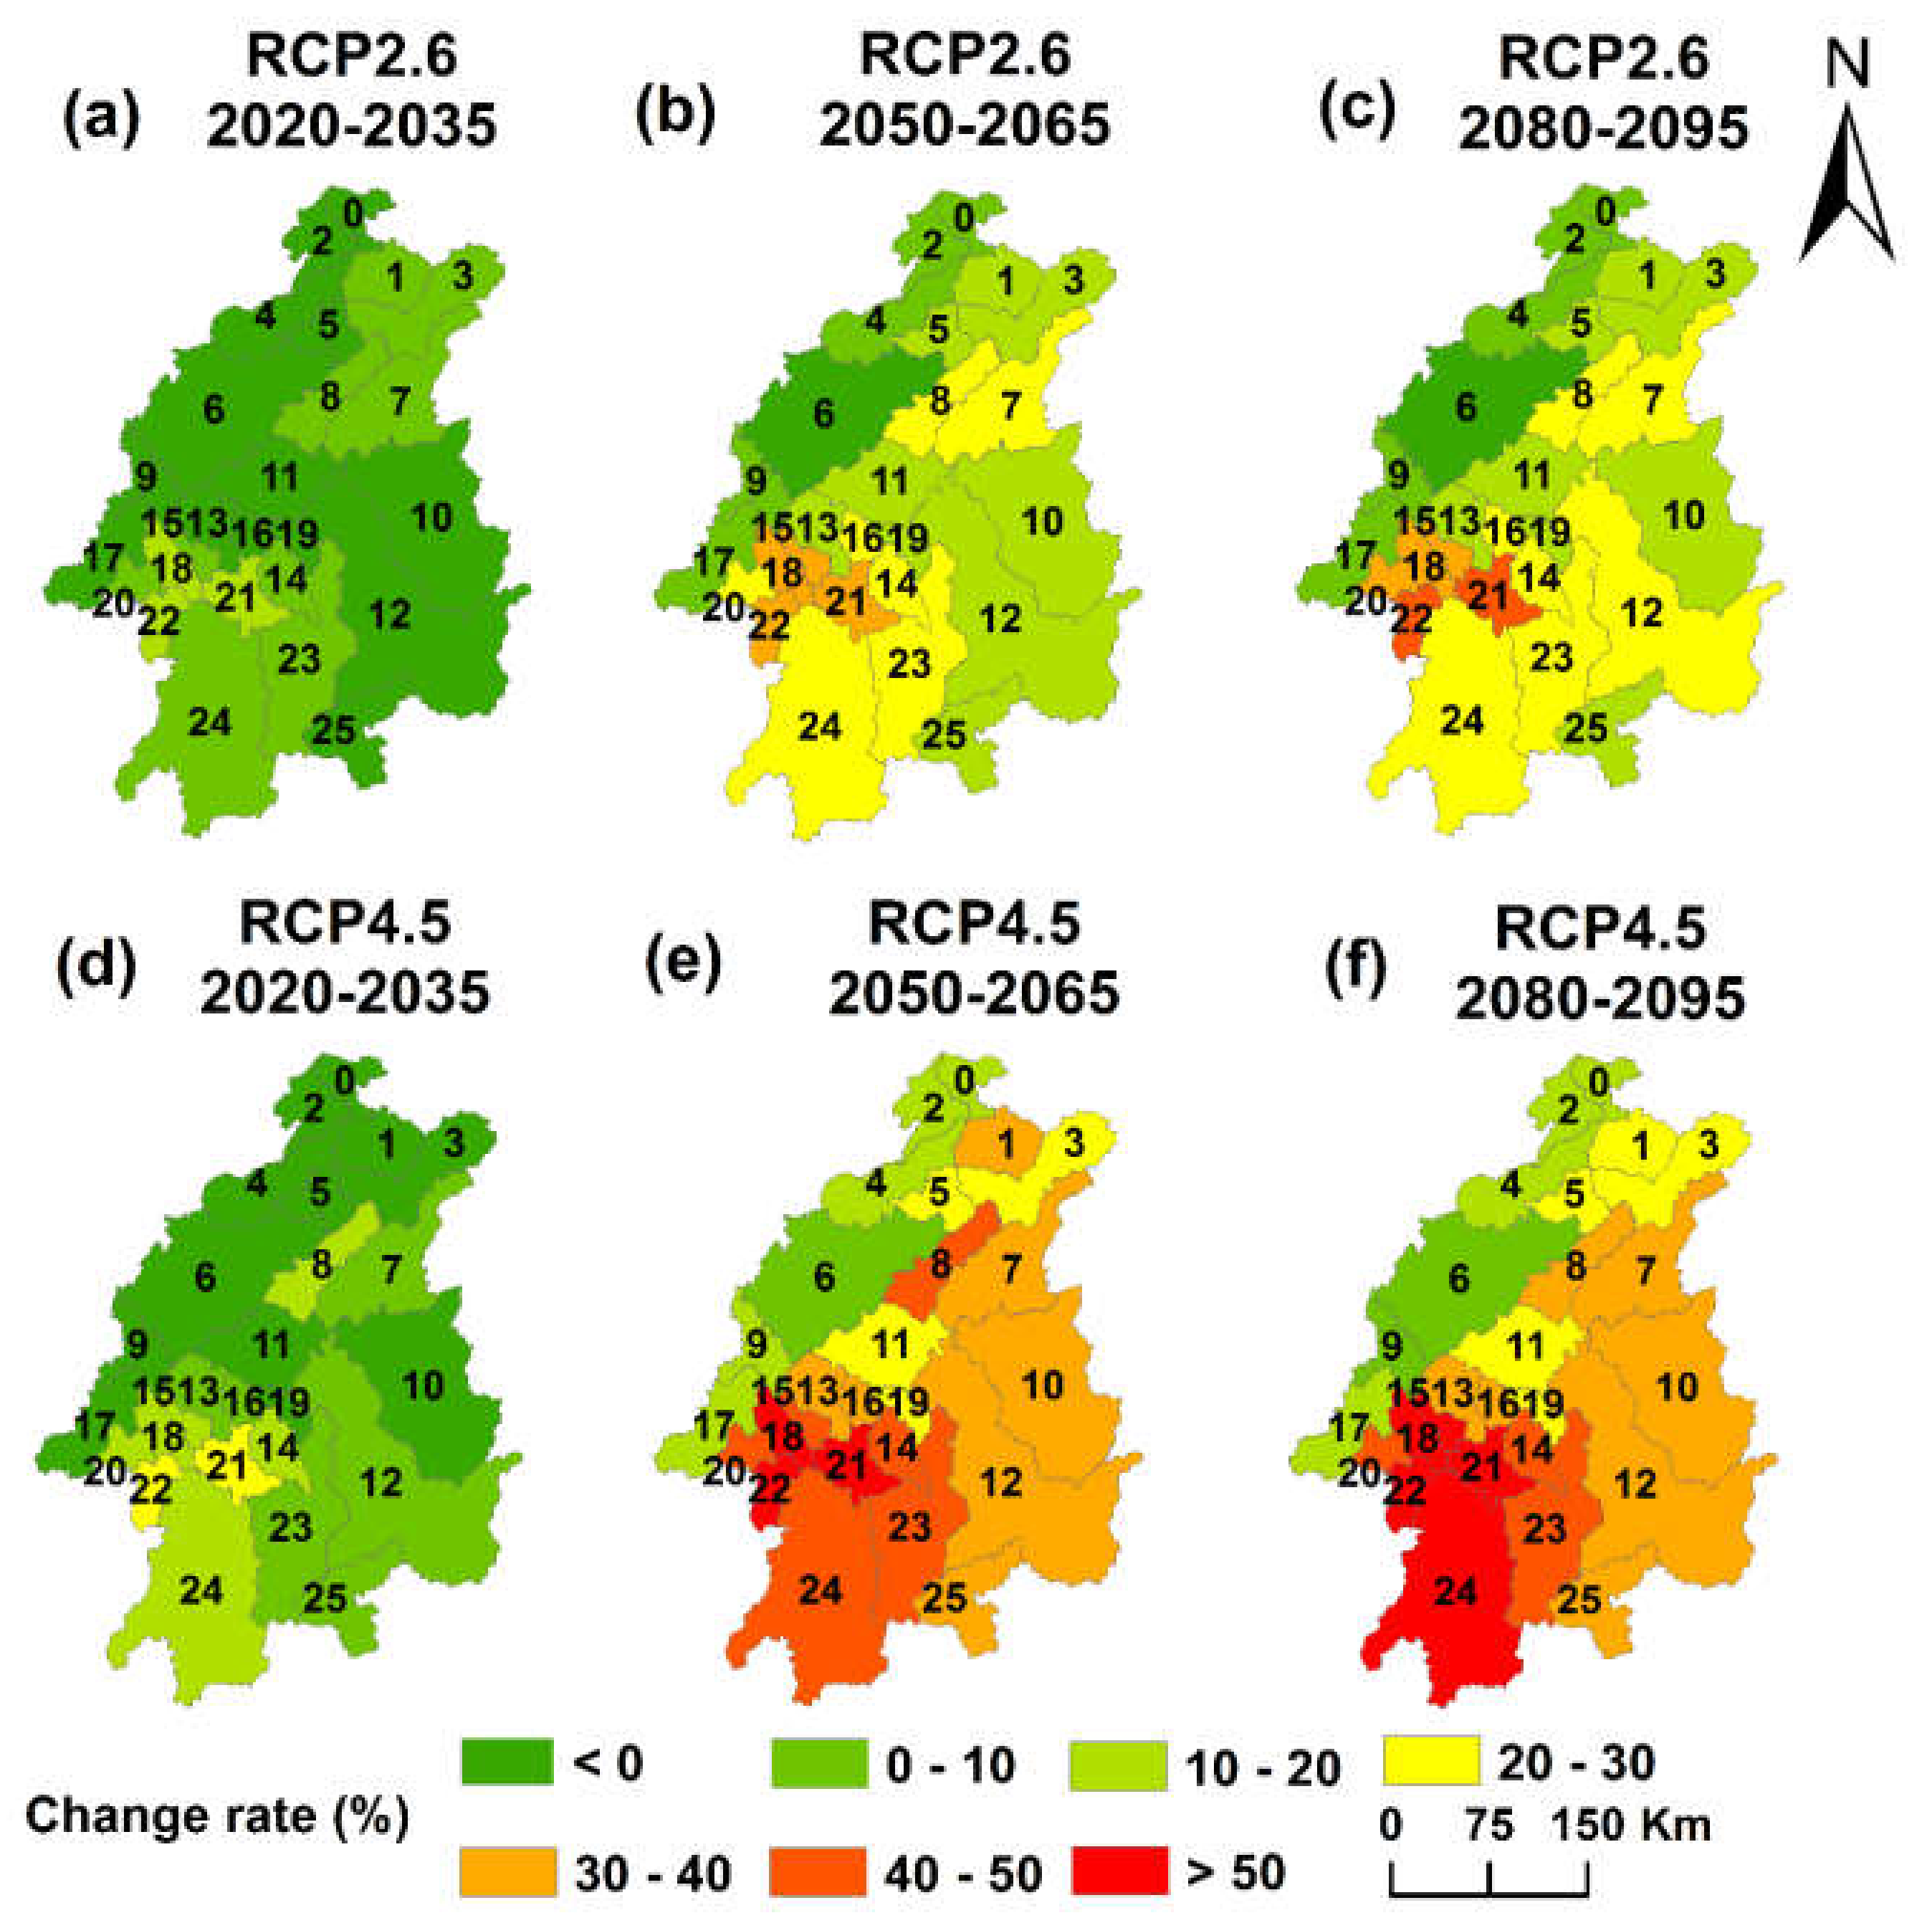
3.1.2. Downscaling Future Climate Change Scenarios

The CanESM2 under RCP2.6 and RCP4.5 data were entered into the calibrated SDSM model for each weather station to produce the future time series of precipitation, and maximum and minimum temperatures. It provided a basis for the next step of estimating the spatial and temporal changes of water yield under the future climate change scenarios in the study area. The predicted range of the mean annual precipitation, ET0, and maximum and minimum temperatures under RCP2.6 and RCP4.5 scenarios were drawn using box-plot to observe the changes in the baseline and three future periods. The Figure 6a and b both showed an increase in average annual maximum and minimum temperatures under the RCP2.6 scenario of the study area in the 2020s. The average annual maximum and minimum temperatures were projected to increase by 0.5 and 0.6 °C more than the baseline value, respectively. In the 2050s, the maximum and minimum temperatures would be consistently warming. They were both likely to increase by 0.2 °C in comparison with the 2020s, but the uncertainty of the maximum temperature was higher. However, the maximum temperature stopped increasing in the 2080s, and the minimum temperature even began to decrease. The average annual precipitation under the RCP2.6 scenario of the study area was roughly equivalent to the baseline period in the 2020s (Figure 6c). It was observed that the average annual precipitation was likely to increase 9% and 10% in the 2050s and 2080s, respectively. Figure 6d showed the average annual ET0 of the study area under the RCP2.6 scenario. The results indicate that the average annual ET0 showed an increasing trend in the 2020s and 2050s. The average annual ET0 of the study area was projected to increase by 4% in the 2020s. In the 2050s and 2080s, the average annual ET0 both increased by around 6%, but the uncertainty was higher in the 2050s.
The baseline and three future periods of precipitation, ET0, and minimum and maximum temperatures of the study area under the RCP4.5 scenario are shown in Figure 7. The average annual maximum and minimum temperatures of the study area were projected to increase consistently over three future periods under the RCP4.5 scenario (Figure 7a,b). The projected average annual maximum temperature of the study area was likely to increase 0.3, 1.1 and 1.4 °C in the 2020s, 2050s and 2080s, respectively. It was observed that the minimum temperature was gradually increasing compared to the baseline period over three future periods by 0.4 °C for the 2020s, 1.2 °C for the 2050s and 1.5 °C for the 2080s. The average annual precipitation of the study area under the RCP4.5 scenario was similar to that under the RCP2.6 scenario (Figure 7c). In the 2020s, the precipitation seemed to be roughly equivalent to the baseline period. A difference occurs in the 2050s and 2080s in the average annual precipitation of the study area under the RCP4.5 scenario, with a change rate of 18% and 20.4% compared to the baseline period. It was clearly higher than that under the RCP2.6 scenario, with a change rate of 9% and 10% compared to the baseline period. The projected average annual ET0 of the study area has increased similarly to temperature under the RCP4.5 scenario (Figure 7d). It was likely to increase by 3.3% for the 2020s, 6.2% for the 2050s and 8% for the 2080s compared to the baseline period. As expected, the temperature rise in the RCP4.5 scenario is greater than in the RCP2.6 scenario, which is consistent with many studies [55,56]. RCP4.5 is a higher-emission scenario and projects higher atmospheric carbon dioxide (CO2) concentrations. In addition, Ma et al. [57] used four GCMs to estimate future precipitation under RCP4.5 scenario in the same basin. Their results show that the annual precipitation will continue to increase in the future, which is consistent with our research results.
In this study, the ET0 was estimated using the Hargreaves equation which is recognized by FAO which may generate improved results over the Penman-Monteith model, especially where the latter cannot be fully parameterized [58]. Nowadays, many researchers developed some approaches and models to estimate ET0, taking into account the effects of CO2 concentration. The recent work of Yang et al. [59], published in Nature Climate change, establishes the relationship between canopy resistance r s and CO2 to improve the FAO Penman-Monteith model. However, it requires a lot of input parameters that are difficult to record and their findings are based on CMIP5 model outputs.
Whether and to extent results could represent the real world remains an open question for future investigations. In fact, the relationship between CO2 concentration and ET0 is complicated. Allen et al. [60] considered that fluctuation in r s value would have a negligible effect on the ET0 calculation. Lovelli et al. [61] and Snyder et al. [62] concluded that the effect of increasing CO2 concentration may be annulled by an increase in air temperature and subsequent increase in evapotranspiration rate. In other hand, CO2 concentration variation at regional or basin scale may be less obvious and difficult to obtain. Most regional and basin scale studies do not specifically consider the influence of CO2 concentration [19,63,64]. In our study, the weather station data used did not contain so many observation parameters including CO2 concentration data. The RCP scenarios have considered the change of CO2 concentration in the future period. RCP2.6 scenario is a low emissions scenario which has approximately 490 ppm CO2 before 2100. For RCP4.5 scenario, year 2100 concentrations are approximately 650 ppm CO2. In this future scenario, they included 26 large-scale atmospheric variables such as mean temperature at 2 m, horizontal wind, near surface relative and specific humidity, mean sea level pressure and others. We use local climate predictands and relevant large-scale atmospheric variables to imitate future climate change scenarios based on the SDSM model. To some extent, the effects of CO2 concentration has been considered under different RCPs and periods. In our study, ET0 are projected to slightly increase under both RCPs. This is similar to the previous studies from Tao et al. [18] in the same basin, which suggests that the annual ET0 shows an upward trend under the RCP4.5 scenario during the period from 2011 to 2100. Further studies are necessary to gain insights regarding the complex relationship between ET0 and CO2 concentration.

3.2. Impact of Climate Change on Water Yield

The water yield computations obtained by the InVEST model were aggregated for each sub-watershed. The spatial distribution of average annual water yields was displayed in the baseline period for the Xiangjiang River Basin (Figure 8a). The average annual water yield of the Xiangjiang River Basin for the baseline period was 7.1 × 10³ m3 ha−1. The spatial distribution patterns exhibited that water yields in the north and west were generally lower than in other areas. Sub-watershed 8 and 25 had the highest water yield contribution per hectare area which was around 8.1 × 10³ m3 ha−1. In Figure 3, the spatial distribution of average annual precipitation from 2000 to 2015 is similar to that of water yield, which is lower in the northern and western sub-basins, and higher in the southern and northeastern sub-basins. These results are consistent with many studies, which show that precipitation has a particularly strong influence over water yield [65,66,67].
Under the RCP2.6 scenario in the 2020s, the average annual precipitation and total annual water yield seemed to be roughly equivalent to the baseline period. The areas with undergoing an increase in water yield were mainly in the southwest and northeast. But water yield was lower in the western part of the region, which was approximately 5.5 × 10³ m3 ha−1. With the increase of the precipitation, water yields were generally higher in every sub-watershed under the RCP2.6 scenario in the 2050s compared to 2020s. This was particularly true in the sub-watersheds 7 and 8 with the highest water yield contribution (approximately 9.7 × 10³ m3 ha−1). The spatial distribution and average annual water yield of the Xiangjiang River Basin in the 2080s were similar in 2050s, which was approximately 8.5 ×10³ m3 ha−1. Compare with the RCP4.5 scenario, the average annual water yield was generally higher under the RCP4.5 scenario. Especially in the 2050s and 2080s (Figure 8f,g), the average annual water yield of the entire basin was 9.4 × 10³ m3 ha−1 and 9.5 × 10³ m3 ha−1. Water yield showed a maximum value of 1.1 × 10³ m3 ha−1 in the northern and eastern parts of the region.
Figure 9 showed details of changes in the simulated water yield over the Xiangjiang River Basin during the current and future climate change scenarios. Under the RCP2.6 scenario in the 2020s, the total annual water yield seemed to be roughly equivalent to the baseline period. The increase in annual water yield was located in the northeast and southwest parts of the region, while the decrease included the other parts of the region. As shown in Figure 9b and c, the results showed an increase in most of the sub-watersheds under the RCP2.6 scenario in the 2050s and 2080s. Large increases (>40%) occurred located in the sub-watersheds 18, 21 and 22 in the southwest part of the region. However, the sub-watershed 6 in the western part of the region was expected to show a negative trend. On the whole, most of the regions may experience growth trend under the RCP4.5 scenario, especially compared to the RCP2.6 scenario. Under the RCP4.5 scenario in the 2020s (Figure 9d), the average annual water yield of the entire basin only increased by 1.2% compared to the baseline period. It was observed that the water yield of the entire basin was likely to increase by 33% and 33.5% in the 2050s and 2080s, respectively. Especially in the southwest part of the region, the average annual water yield had a large increase (>40%).
Since LULC, soil parameters, and other characteristics of the sub-basins are major inputs for the InVEST model, it can also change the hydrological cycle and thereby influencing water yield. However, these parameters usually do not change much compared with climate data, and this study mainly studies the impact of future climate change on water yield. So, we assume that other input data besides climate data (i.e., sub-watershed shapefile, biophysical table, soil depth, Z, and LULC) were kept constant for all future scenarios. Further studies are necessary to gain insights regarding the model performance with changes in LULC or other characteristics. GCMs are one of the most useful tools in quantifying the impacts of climate change. Limitations of this study are that one GCM was used for the downscaling, and the results will be largely dependent on the climate change signals from one GCM. Previous studies have shown that the inherent uncertainty in the original GCMs introduces a certain degree of uncertainty to future projected water yield [25,68]. To better understand water yields under different climates and reduce predictive uncertainty, more GCMs and downscaling techniques should be adopted.

4. Conclusions

In the present study, we conducted suitability assessments of the CanESM2 and SDSM downscaling models in a typical East Asian monsoon basin of South China. Through the coupling of the SDSM and InVEST model, the influence of future climate change on water provisions was quantified.
The SDSM model was used to project future precipitation, and minimum and maximum temperatures. The results demonstrate the applicability of the SDSM model over the East Asian monsoon river basins. The downscaled results of the CanESM2 based on the calibrated SDSM model show that annual average maximum and minimum temperatures will continue to increase under the RCP4.5 scenario. But the maximum and minimum temperatures slightly decrease under the RCP2.6 scenario in the far future (2080–2095). Under the RCP2.6 and RCP4.5 scenarios, average precipitation and reference evapotranspiration both show slight but steady increasing trends.
Based on the InVEST model simulation, the result suggests that the ecosystem service model was able to explain the temporal and spatial changes of observed water yields. Annual average water yield would increase by 19.3% (33.5%) in the far future (2080–2095) under the RCP2.6 (4.5) scenario. The results of this study would help to understand the potential impact of future climate change on water provisions and planning water resource management and adaptation strategies in the East Asian monsoon river basins.

Author Contributions

Conceptualization, W.L.; Methodology, D.Y.; Software, D.Y.; Validation, C.X.; Investigation, D.Y.; Writing—Original Draft, D.Y.; Writing—Reviewing and Editing, C.X., L.T. and X.X.; Visualization, D.Y.; Supervision, X.X.; Project administration, W.L.; Funding acquisition, W.L.; Authorship must be limited to those who have contributed substantially to the work reported. All authors have read and agreed to the published version of the manuscript.

Funding

This research was funded by the National Key Research and Development Program of China, grant number 2016YFC0502401; the National Natural Science Foundation of China, grant number 41501478; and the Construction Program of the Key Discipline in Hunan Province, grant number 2016001.

Conflicts of Interest

The authors declare no conflict of interest.

References

  1. IPCC. Climate Change 2007, The Physical Science Basis; Cambridge University Press WG1: Cambridge, UK, 2007. [Google Scholar]
  2. IPCC. Climate Change 2013, The Physical Science Basis; Cambridge University Press WG1: Cambridge, UK, 2013. [Google Scholar]
  3. Li, L.; Diallo, I.; Xu, C.Y.; Stordal, F. Hydrological projections under climate change in the near future by RegCM4 in Southern Africa using a large-scale hydrological model. J. Hydrol. 2015, 528, 1–16. [Google Scholar] [CrossRef]
  4. Ebrahim, G.Y.; Jonoski, A.; Van Griensven, A.; Di Baldassarre, G. Downscaling technique uncertainty in assessing hydrological impact of climate change in the Upper Beles River Basin, Ethiopia. Hydrol. Res. 2012, 44, 377–398. [Google Scholar] [CrossRef]
  5. Mekonnen, D.F.; Disse, M. Analyzing the future climate change of Upper Blue Nile River basin using statistical downscaling techniques. Hydrol. Earth Syst. Sci. 2018, 22, 2391–2408. [Google Scholar] [CrossRef] [Green Version]
  6. Gonzalez, P.; Neilson, R.P.; Lenihan, J.M.; Drapek, R.J. Global patterns in the vulnerability of ecosystems to vegetation shifts due to climate change. Glob. Ecol. Biogeogr. 2010, 19, 755–768. [Google Scholar] [CrossRef]
  7. Zhang, Y.; You, Q.; Chen, C.; Ge, J. Impacts of climate change on streamflows under RCP scenarios: A case study in Xin River Basin, China. Atmos. Res. 2016, 178, 521–534. [Google Scholar] [CrossRef]
  8. Alexandru, A.; Sushama, L. Current climate and climate change over India as simulated by the Canadian Regional Climate Model. Clim. Dyn. 2014, 45, 1059–1084. [Google Scholar] [CrossRef]
  9. Taylor, K.E.; Stouffer, R.J.; Meehl, G.A. An Overview of CMIP5 and the Experiment Design. Bull. Am. Meteorol. Soc. 2012, 93, 485–498. [Google Scholar] [CrossRef] [Green Version]
  10. Gebrechorkos, S.H.; Hülsmann, S.; Bernhofer, C. Regional climate projections for impact assessment studies in East Africa. Environ. Res. Lett. 2019, 14, 044031. [Google Scholar] [CrossRef]
  11. Dai, A.; Bloecker, C.E. Correction to: Impacts of internal variability on temperature and precipitation trends in large ensemble simulations by two climate models. Clim. Dyn. 2018, 52, 307. [Google Scholar] [CrossRef] [Green Version]
  12. Emami, F.; Koch, M. Evaluation of Statistical-Downscaling/Bias-Correction Methods to Predict Hydrologic Responses to Climate Change in the Zarrine River Basin, Iran. Climate 2018, 6, 30. [Google Scholar] [CrossRef] [Green Version]
  13. Chen, L.; Frauenfeld, O.W. Surface Air Temperature Changes over the Twentieth and Twenty-First Centuries in China Simulated by 20 CMIP5 Models. J. Clim. 2014, 27, 3920–3937. [Google Scholar] [CrossRef]
  14. Yu, X.; Zhao, Y.; Ma, X.; Yao, J.; Li, H. Projected changes in the annual cycle of precipitation over central Asia by CMIP5 models. Int. J. Clim. 2018, 38, 5589–5604. [Google Scholar] [CrossRef]
  15. Huang, J.; Zhang, J.; Zhang, Z.; Xu, C.; Wang, B.; Yao, J. Estimation of future precipitation change in the Yangtze River basin by using statistical downscaling method. Stoch. Environ. Res. Risk Assess. 2011, 25, 781–792. [Google Scholar] [CrossRef]
  16. Alizamir, M.; Moghadam, M.A.; Monfared, A.H.; Shamsipour, A. Statistical downscaling of global climate model outputs to monthly precipitation via extreme learning machine: A case study. Environ. Prog. Sustain. Energy 2018, 37, 1853–1862. [Google Scholar] [CrossRef]
  17. Das, J.; Umamahesh, N.V. Future Projection of Precipitation and Temperature Extremes Using Change Factor Method over a River Basin: Case Study. J. Hazard. Toxic Radioact. Waste 2018, 22, 04018006. [Google Scholar] [CrossRef]
  18. Tao, X.-E.; Chen, H.; Xu, C.-Y.; Hou, Y.-K.; Jie, M.-X. Analysis and prediction of reference evapotranspiration with climate change in Xiangjiang River Basin, China. Water Sci. Eng. 2015, 8, 273–281. [Google Scholar] [CrossRef] [Green Version]
  19. Gebrechorkos, S.H.; Bernhofer, C.; Hülsmann, S. Impacts of projected change in climate on water balance in basins of East Africa. Sci. Total. Environ. 2019, 682, 160–170. [Google Scholar] [CrossRef]
  20. Wilby, R.L.; Dawson, C.W. The Statistical DownScaling Model: Insights from one decade of application. Int. J. Clim. 2013, 33, 1707–1719. [Google Scholar] [CrossRef]
  21. Meenu, R.; Rehana, S.; Mujumdar, P.P. Assessment of hydrologic impacts of climate change in Tunga-Bhadra river basin, India with HEC-HMS and SDSM. Hydrol. Process. 2013, 27, 1572–1589. [Google Scholar] [CrossRef]
  22. Wilby, R.; Dawson, C.; Murphy, C.; O’Connor, P.; Hawkins, E. The Statistical DownScaling Model - Decision Centric (SDSM-DC): Conceptual basis and applications. Clim. Res. 2014, 61, 259–276. [Google Scholar] [CrossRef] [Green Version]
  23. Hassan, Z.; Shamsudin, S.; Harun, S. Application of SDSM and LARS-WG for simulating and downscaling of rainfall and temperature. Theor. Appl. Clim. 2013, 116, 243–257. [Google Scholar] [CrossRef]
  24. Khan, M.S.; Coulibaly, P.; Dibike, Y.B. Uncertainty analysis of statistical downscaling methods using Canadian Global Climate Model predictors. Hydrol. Process. 2006, 20, 3085–3104. [Google Scholar] [CrossRef]
  25. Hu, Y.; Maskey, S.; Uhlenbrook, S. Downscaling daily precipitation over the Yellow River source region in China: A comparison of three statistical downscaling methods. Theor. Appl. Clim. 2013, 112, 447–460. [Google Scholar] [CrossRef]
  26. Liu, J.; Chen, S.; Li, L.; Li, J. Statistical Downscaling and Projection of Future Air Temperature Changes in Yunnan Province, China. Adv. Meteorol. 2017, 2017, 2175904. [Google Scholar] [CrossRef] [Green Version]
  27. Matthew, O.J.; Abiye, O.E. Evaluation of SDSM Performance in Simulating Rainfall and Temperature over Nigeria. Br. J. Appl. Sci. Technol. 2017, 20, 1–15. [Google Scholar] [CrossRef]
  28. Zhou, J.; He, D.; Xie, Y.; Liu, Y.; Yang, Y.; Sheng, H.; Guo, H.; Zhao, L.; Zou, R. Integrated SWAT model and statistical downscaling for estimating streamflow response to climate change in the Lake Dianchi watershed, China. Stoch. Environ. Res. Risk Assess. 2015, 29, 1193–1210. [Google Scholar] [CrossRef]
  29. Liu, L. Hydrological implications of climate change on River Basin water cycle: Case studies of the Yangtze River and Yellow River basins, China. Appl. Ecol. Environ. Res. 2017, 15, 683–704. [Google Scholar] [CrossRef]
  30. Fu, B.; Wang, Y.; Xu, P.; Yan, K.; Li, M. Value of ecosystem hydropower service and its impact on the payment for ecosystem services. Sci. Total. Environ. 2014, 472, 338–346. [Google Scholar] [CrossRef]
  31. Sharp, R.; Tallis, H.T.; Ricketts, T.; Guerry, A.D.; Wood, S.A.; Chaplin-Kramer, R. InVEST +VERSION+ User’s Guide. The Natural Capital Project; Stanford University, University of Minnesota, The Nature Conservancy and World Wildlife Fund: Stanford, CA, USA, 2016; Volume 371. [Google Scholar]
  32. Boithias, L.; Acuña, V.; Vergoñós, L.; Ziv, G.; Marcé, R.; Sabater, S. Assessment of the water supply:demand ratios in a Mediterranean basin under different global change scenarios and mitigation alternatives. Sci. Total Environ. 2014, 470, 567–577. [Google Scholar] [CrossRef]
  33. Goyal, M.K.; Khan, M. Assessment of spatially explicit annual water-balance model for Sutlej River Basin in eastern Himalayas and Tungabhadra River Basin in peninsular India. Hydrol. Res. 2016, 48, 542–558. [Google Scholar] [CrossRef] [Green Version]
  34. Hu, W.; Li, G.; Gao, Z.; Jia, G.; Wang, Z.; Li, Y.; Wenmin, H.; Guo, L.; Yi, L. Assessment of the impact of the Poplar Ecological Retreat Project on water conservation in the Dongting Lake wetland region using the InVEST model. Sci. Total. Environ. 2020, 733, 139423. [Google Scholar] [CrossRef] [PubMed]
  35. Rahimi, L.; Malekmohammadi, B.; Yavari, A.R. Assessing and Modeling the Impacts of Wetland Land Cover Changes on Water Provision and Habitat Quality Ecosystem Services. Nat. Resour. Res. 2020, 29, 3701–3718. [Google Scholar] [CrossRef]
  36. Han, H.; Dong, Y. Spatio-temporal variation of water supply in Guizhou Province, China. Hydrol. Res. 2016, 19, 181–195. [Google Scholar] [CrossRef]
  37. Marquès, M.; Bangash, R.F.; Kumar, V.; Sharp, R.; Schuhmacher, M. The impact of climate change on water provision under a low flow regime: A case study of the ecosystems services in the Francoli river basin. J. Hazard. Mater. 2013, 263, 224–232. [Google Scholar] [CrossRef]
  38. Yang, D.; Liu, W.; Tang, L.; Chen, L.; Li, X.; Xu, X. Estimation of water provision service for monsoon catchments of South China: Applicability of the InVEST model. Landsc. Urban Plan. 2019, 182, 133–143. [Google Scholar] [CrossRef]
  39. Zhang, Z.; Chen, Y.; Wang, P.; Shuai, J.; Tao, F.; Shi, P. River discharge, land use change, and surface water quality in the Xiangjiang River, China. Hydrol. Process. 2013, 28, 4130–4140. [Google Scholar] [CrossRef]
  40. Li, J.-B.; Zheng, Y.-Y.; Gao, C.-H.; Yang, Y. A discussion on geographical regularity of flood and drought in Hunan Province. J. Nat. Disasters 2000, 9, 115–120. [Google Scholar]
  41. Kalnay, E.; Kanamitsu, M.; Kistler, R.; Collins, W.; Deaven, D.; Gandin, L.; Iredell, M.; Saha, S.; White, G.; Woollen, J.; et al. The NCEP/NCAR 40-year reanalysis project. Bull. Am. Meteorol. Soc. 1996, 77, 437–471. [Google Scholar] [CrossRef] [Green Version]
  42. Van Vuuren, D.P.; Edmonds, J.; Kainuma, M.; Riahi, K.; Thomson, A.; Hibbard, K.; Hurtt, G.C.; Kram, T.; Krey, V.; Lamarque, J.-F.; et al. The representative concentration pathways: An overview. Clim. Chang. 2011, 109, 5–31. [Google Scholar] [CrossRef]
  43. Thomson, A.M.; Calvin, K.V.; Smith, S.J.; Kyle, G.P.; Volke, A.; Patel, P.; Delgado-Arias, S.; Bond-Lamberty, B.; Wise, M.A.; Clarke, L.E.; et al. RCP4.5: A pathway for stabilization of radiative forcing by 2100. Clim. Chang. 2011, 109, 77–94. [Google Scholar] [CrossRef] [Green Version]
  44. China Soil Map Based Harmonized World Soil Database (HWSD) (v11)(2009); National Tibetan Plateau Data Center, Food and Agriculture Organization of the United Nations, International Institute for Applied Systems Analysis: Rome, Italy, 2019.
  45. Marlatt, W.E.; Budyko, M.I.; Miller, D.H. Climate and Life. J. Range Manag. 1975, 28, 160. [Google Scholar] [CrossRef]
  46. Zhou, W.; Liu, G.; Pan, J.; Feng, X. Distribution of available soil water capacity in China. J. Geogr. Sci. 2005, 15, 3–12. [Google Scholar] [CrossRef]
  47. Hargreaves, G.H.; Allen, R.G. History and Evaluation of Hargreaves Evapotranspiration Equation. J. Irrig. Drain. Eng. 2003, 129, 53–63. [Google Scholar] [CrossRef]
  48. Jarvis, A.; Guevara, E.; Reuter, H.I.; Nelson, A.D. Hole-Filled SRTM for the Globe: Version 4: Data Grid. CGIAR Consortium for Spatial Information. 2008. Available online: http://srtm.csi.cgiar.org (accessed on 6 May 2017).
  49. Canadell, J.; Jackson, R.B.; Ehleringer, J.B.; Mooney, H.A.; Sala, O.E.; Schulze, E.-D. Maximum rooting depth of vegetation types at the global scale. Oecologia 1996, 108, 583–595. [Google Scholar] [CrossRef] [PubMed]
  50. FAO Irrigation and Drainage; Allen, R.G.; Pereira, L.S.; Raes, D.; Smith, M. Crop Evapotranspiration—Guidelines for Computing Crop Water Requirements; Paper No. 56; Food and Agriculture Organization of the United Nations: Rome, Italy, 1998. [Google Scholar]
  51. Wilby, R.L.; Dawson, C.; Barrow, E. sdsm—A decision support tool for the assessment of regional climate change impacts. Environ. Model. Softw. 2002, 17, 145–157. [Google Scholar] [CrossRef]
  52. Gupta, H.V.; Sorooshian, S.; Yapo, P.O. Status of Automatic Calibration for Hydrologic Models: Comparison with Multilevel Expert Calibration. J. Hydrol. Eng. 1999, 4, 135–143. [Google Scholar] [CrossRef]
  53. Moriasi, D.N.; Arnold, J.G.; Van Liew, M.W.; Bingner, R.L.; Harmel, R.D.; Veith, T.L. Model Evaluation Guidelines for Systematic Quantification of Accuracy in Watershed Simulations. Trans. ASABE 2007, 50, 885–900. [Google Scholar] [CrossRef]
  54. Yang, T.; Li, H.; Wang, W.; Xu, C.-Y.; Yu, Z. Statistical downscaling of extreme daily precipitation, evaporation, and temperature and construction of future scenarios. Hydrol. Process. 2012, 26, 3510–3523. [Google Scholar] [CrossRef]
  55. Mirdashtvan, M.; Najafinejad, A.; Malekian, A.; Sa’Doddin, A. Downscaling the contribution to uncertainty in climate-change assessments: Representative concentration pathway (RCP) scenarios for the South Alborz Range, Iran. Meteorol. Appl. 2017, 25, 414–422. [Google Scholar] [CrossRef]
  56. Ouhamdouch, S.; Bahir, M. Climate Change Impact on Future Rainfall and Temperature in Semi-arid Areas (Essaouira Basin, Morocco). Environ. Process. 2017, 4, 975–990. [Google Scholar] [CrossRef]
  57. Ma, C.; Pan, S.; Wang, G.; Liao, Y.; Xu, Y.-P. Changes in precipitation and temperature in Xiangjiang River Basin, China. Theor. Appl. Clim. 2015, 123, 859–871. [Google Scholar] [CrossRef]
  58. Droogers, P.; Allen, R.G. Estimating Reference Evapotranspiration Under Inaccurate Data Conditions. Irrig. Drain. Syst. 2002, 16, 33–45. [Google Scholar] [CrossRef]
  59. Yang, Y.; Roderick, M.L.; Zhang, S.; McVicar, T.R.; Donohue, R.J. Hydrologic implications of vegetation response to elevated CO2 in climate projections. Nat. Clim. Chang. 2018, 9, 44–48. [Google Scholar] [CrossRef]
  60. Allen, R.G.; Pruitt, W.O.; Wright, J.L.; Howell, T.A.; Ventura, F.; Snyder, R.; Itenfisu, D.; Steduto, P.; Berengena, J.; Yrisarry, J.B.; et al. A recommendation on standardized surface resistance for hourly calculation of reference ETo by the FAO56 Penman-Monteith method. Agric. Water Manag. 2006, 81, 1–22. [Google Scholar] [CrossRef]
  61. Lovelli, S.; Perniola, M.; Di Tommaso, T.; Ventrella, D.; Moriondo, M.; Amato, M. Effects of rising atmospheric CO2 on crop evapotranspiration in a Mediterranean area. Agric. Water Manag. 2010, 97, 1287–1292. [Google Scholar] [CrossRef]
  62. Snyder, R.L.; Moratiel, R.; Song, Z.; Swelam, A.; Jomâa, I.; Shapland, T. EVAPOTRANSPIRATION RESPONSE TO CLIMATE CHANGE. Acta Hortic. 2011, 922, 91–98. [Google Scholar] [CrossRef]
  63. Das, J.; Umamahesh, N. Downscaling Monsoon Rainfall over River Godavari Basin under Different Climate-Change Scenarios. Water Resour. Manag. 2016, 30, 5575–5587. [Google Scholar] [CrossRef]
  64. Remesan, R.; Holman, I.P. Effect of baseline meteorological data selection on hydrological modelling of climate change scenarios. J. Hydrol. 2015, 528, 631–642. [Google Scholar] [CrossRef] [Green Version]
  65. Hamel, P.; Guswa, A.J. Uncertainty analysis of a spatially explicit annual water-balance model: Case study of the Cape Fear basin, North Carolina. Hydrol. Earth Syst. Sci. 2015, 19, 839–853. [Google Scholar] [CrossRef] [Green Version]
  66. Sánchez-Canales, M.; Benito, A.L.; Passuello, A.; Terrado, M.; Ziv, G.; Acuña, V.; Schuhmacher, M.; Elorza, F.J. Sensitivity analysis of ecosystem service valuation in a Mediterranean watershed. Sci. Total. Environ. 2012, 440, 140–153. [Google Scholar] [CrossRef]
  67. Terrado, M.; Acuna, V.; Ennaanay, D.; Tallis, H.; Sabater, S. Impact of climate extremes on hydrological ecosystem services in a heavily humanized Mediterranean basin. Ecol. Indic. 2014, 37, 199–209. [Google Scholar] [CrossRef]
  68. Montenegro, S.; Ragab, R. Impact of possible climate and land use changes in the semi arid regions: A case study from North Eastern Brazil. J. Hydrol. 2012, 434–435, 55–68. [Google Scholar] [CrossRef]
Figure 1. Location of the Xiangjiang River Basin, digital elevation model (elevation, m), and meteorological stations.
Water 12 03199 g001
Figure 2. The workflow of the study.
Water 12 03199 g002
Figure 3. Spatial pattern of (a) average annual precipitation and (b) average annual reference evapotranspiration over the Xiangjiang River Basin from 2000 to 2015. The numerals in the map refer to sub-basins.
Water 12 03199 g003
Figure 4. SDSM climate scenario generation process.
Water 12 03199 g004
Figure 5. Scatter plots of yearly maximum and minimum temperatures and precipitation (ac) between measured and simulated series for the Xiangjiang River Basin.
Water 12 03199 g005
Figure 6. Box plots of the simulated and observed mean annual maximum and minimum temperature, precipitation and reference crop evapotranspiration (ad) over the Xiangjiang River Basin under the RCP2.6 scenario.
Water 12 03199 g006
Figure 7. Box plots of the simulated and observed mean annual maximum and minimum temperature, precipitation and reference crop evapotranspiration (ad) over the Xiangjiang River Basin under the RCP4.5 scenario.
Water 12 03199 g007
Figure 8. Spatial distribution of simulated annual mean water yield over the Xiangjiang River Basin under the current (a) and two climate change scenarios in the three future periods (bg).
Water 12 03199 g008
Figure 9. Variation of the simulated water yield over the Xiangjiang River Basin in the three future periods under RCP2.6 (ac) and RCP4.5 (df).
Water 12 03199 g009
Publisher’s Note: MDPI stays neutral with regard to jurisdictional claims in published maps and institutional affiliations.

