How Elevated CO2 Shifts Root Water Uptake Pattern of Crop? Lessons from Climate Chamber Experiments and Isotopic Tracing Technique


1
Key Laboratory of Water Cycle and Related Land Surface Processes, Institute of Geographic Sciences and Natural Resources Research, Chinese Academy of Sciences, Beijing 100101, China
2
College of Resources and Environment, University of Chinese Academy of Sciences, Beijing 100049, China
3
National Engineering Laboratory for Lake Pollution Control and Ecological Restoration, Chinese Research Academy of Environmental Sciences, Beijing 100021, China
*
Author to whom correspondence should be addressed.
Water 2020, 12(11), 3194; https://doi.org/10.3390/w12113194
Submission received: 15 October 2020
/
Revised: 3 November 2020
/
Accepted: 13 November 2020
/
Published: 15 November 2020
(This article belongs to the Special Issue Flow, Heat and Biogeochemical Transport in Coupled Surface Water-Vadose Zone-Groundwater System)
Abstract
:Root water uptake plays an important role in water transport and carbon cycle among Groundwater–Soil–Plant–Atmosphere–Continuum. The acclimation of crops under elevated carbon dioxide concentrations (eCO2) depends greatly on their capability to exploit soil water resources. Quantifying root water uptake and its relationship with crop growth under eCO2 remains challenging. This study observed maize growth subjected to current CO2 (400 ppm) and eCO2 (700 ppm) treatments via a device combined with a climate chamber and weighing lysimeters. Root water uptake patterns were determined based on the isotopic tracing technique. The main water uptake depth shifted from 0−20 cm under current treatment to 20−40 cm under eCO2 at the seedling growth stage. Maize took up 22.7% and 15.4% more soil water from a main uptake depth of 40−80 cm at jointing and tasseling stages in response to eCO2, respectively. More soil water (8.0%) was absorbed from the 80−140 cm layer at the filling stage under eCO2. Soil water contributions at the main uptake depth during seedling stage were negatively associated with leaf transpiration rate (Tr), net photosynthetic rate (Pn), and leaf area index (LAI) under both treatments, whereas significant positive correlations in the 40−80 cm layer under current treatment shifted to the 80−140 cm layer by eCO2. Deep soil water benefited to improve Tr, Pn and LAI under both treatments. No significant correlation between soil water contributions in each layer and leaf water use efficiency was induced by eCO2. This study enhanced our knowledge of crop water use acclimation to future eCO2 and provides insights into agricultural water management.
1. Introduction
Global food security is undergoing an increasing crisis, threatened by climate change. Elevated atmospheric carbon dioxide concentrations (eCO2) have great impacts on water use, crop growth and yield [1,2,3]. Root water uptake is critical in water and carbon cycles in Groundwater–Soil–Plant–Atmosphere–Continuum (GSPAC) by influencing canopy transpiration and growth of crops [1,4]. Understanding the depth distribution and magnitude of root water uptake is important for planning irrigation and developing crop acclimation strategies to climate change [1,5]. The global CO2 concentration is predicted to reach 700 ppm by the end of the 21st century [6]. Maize is the most important food crop and is widely cultivated around the globe. Global demand for maize production is projected to double by 2050 facing a notable increase in CO2 [7,8]. Determining the root water uptake patterns and their relationships with the growth of maize under eCO2 is crucial, in particular for agricultural water management in response to future climate change [1,9,10].
Numerous experiments and model predictions have concentrated on the effects of eCO2 on maize growth, yield, and water use efficiency [8,11,12,13,14]. Exposure of maize to eCO2 has several physiological effects. The main physiological effect of eCO2 is the significant decrease in plant transpiration (11%–22%) with improving water use efficiency [12,13,15,16]. However, there are many controversies over the responses of leaf photosynthesis to eCO2. Maize, as a C4 crop, is usually saturated at current CO2 and does not show significant structural (leaf area) or photosynthetic acclimation to eCO2 [15,17]. Nevertheless, a few controlled experimental studies showed an improvement of photosynthesis under sufficient water supply [18,19,20], while others argued that the growth of maize benefitted from the increasing CO2 only under drought stress conditions [8,21,22]. These various feedbacks of plant ecophysiological indices will lead to a considerable discrepancy in the response of water utilization and yield of maize to eCO2.
Maize root water uptake has been widely investigated using isotope tracing techniques in recent years [4,23,24,25,26]. The stable isotopes of hydrogen and oxygen (2H and 18O) are effective tools to quantify the proportional contribution of water sources to plant water uptake [10,27,28,29,30]. Most of the previous studies have determined the main root water uptake depth of maize and its seasonal variability among various irrigation and fertilization strategies. Maize across the globe was identified to primarily absorb shallow soil water (mostly at the upper 20 cm depth), particularly during the vegetative and mature stages [4,31]. Soil water in deep layers (even more than 120 cm) could be taken up by maize during the silking and milking stages [26]. The contributions of soil water sources were found to be positively correlated with the root length or dry root weight density [24,26], and they were negatively related to the soil water content for summer maize [26]. Nevertheless, to what extent soil water contributions at different depths will be altered through crop growth variations by eCO2 is poorly known. To our knowledge, no previous study has investigated the seasonal variation in root water uptake pattern and its correlation with growth of maize under eCO2.
In this study, maize growth under the current and eCO2 treatments was monitored in an indoor device which was combined with a climate chamber, weighing lysimeters and groundwater supply systems. The 2H and 18O isotopes were used to determine the root water uptake patterns. The objectives of this study were: (1) to quantify the seasonal variations in the contributions of soil water sources to plant water uptake under current and eCO2 treatments, (2) to compare the correlations between soil water contributions in different layers and plant ecophysiological indices at current and eCO2 treatments, and (3) to investigate the impacts of eCO2 on water use strategies.
2. Materials and Methods
2.1. Description of the Experiment
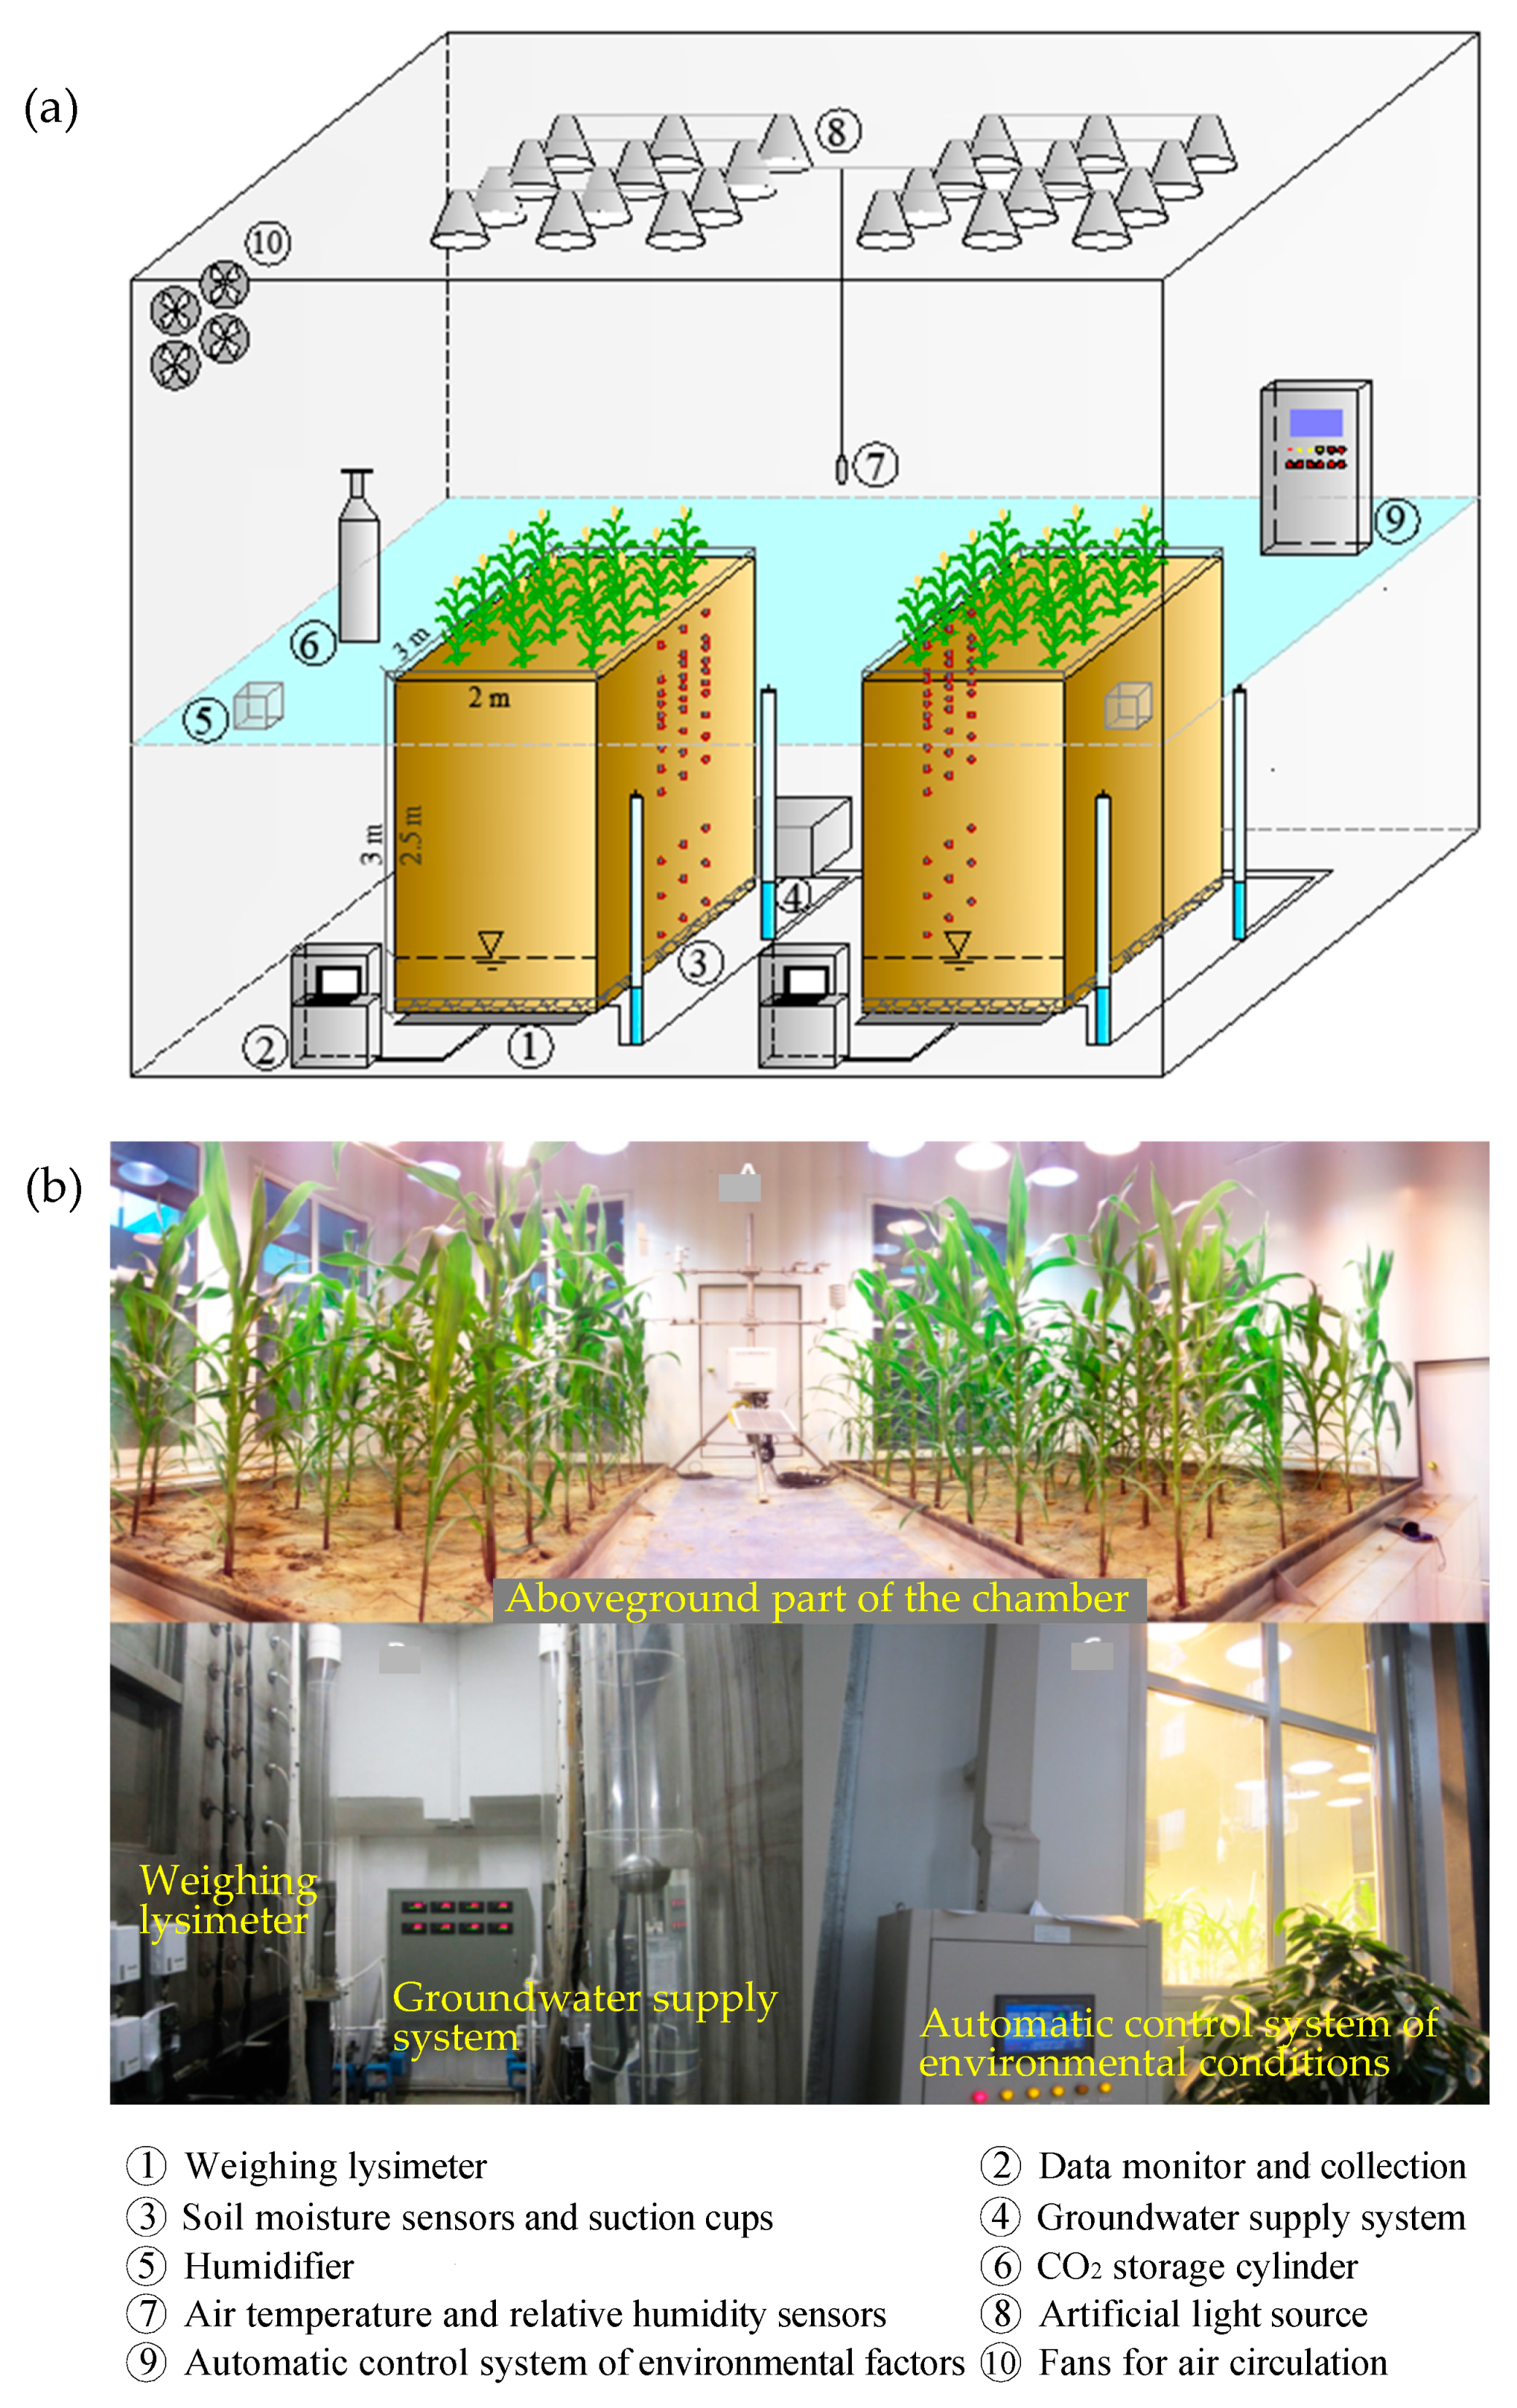
A coupled device with climate chamber and weighing lysimeters was used to conduct the experiments of maize in the Institute of Geographic Sciences and Natural Resources Research, Chinese Academy of Sciences, Beijing, China. The coupled device was composed of one climate chamber (7 m long, 5 m wide and 4.5 m high), two weighting lysimeters (3 m long, 2 m wide and 3 m deep), and a groundwater supply system (Figure 1). The climate chamber had a CO2 gas storage cylinder connecting with a sensor transmitter and a flow velocity meter to control the CO2 concentration. Two centrifugal humidifiers and an air conditioning system were utilized to control the humidity and air temperature, respectively. The air in the climate chamber was circulated using four fans. There were twenty-four sodium lamps and metal halide lamps to provide light source for crop growth in climate chamber.
The two lysimeters were designed as replicates for experiments, which were filled with alluvial soil from farmlands in Beijing. The soil texture was sandy loam, consisting of 60.21% sand, 39.09% silt and 0.70% clay. It had a field capacity of 0.25 cm3 cm−3 and a saturated water content of 0.48 cm3 cm−3. Seven 5TE sensors (Decagon Devices, Pullman, WA, USA) were installed at depths of 10, 30, 40, 80, 100, 120 and 170 cm below the soil surface in each lysimeter to monitor the soil water content (θ). Thirteen porous ceramic suction cups (DLS-Ⅱ, IGSNRR, Beijing, China) were installed at depths of 10, 30, 40, 50, 60, 70, 80, 100, 120, 140, 170, 200, and 230 cm in each lysimeter to extract soil water for isotope analysis. A Mariotte bottle connected with a water storage tank was used for controlling the water table in each lysimeter.
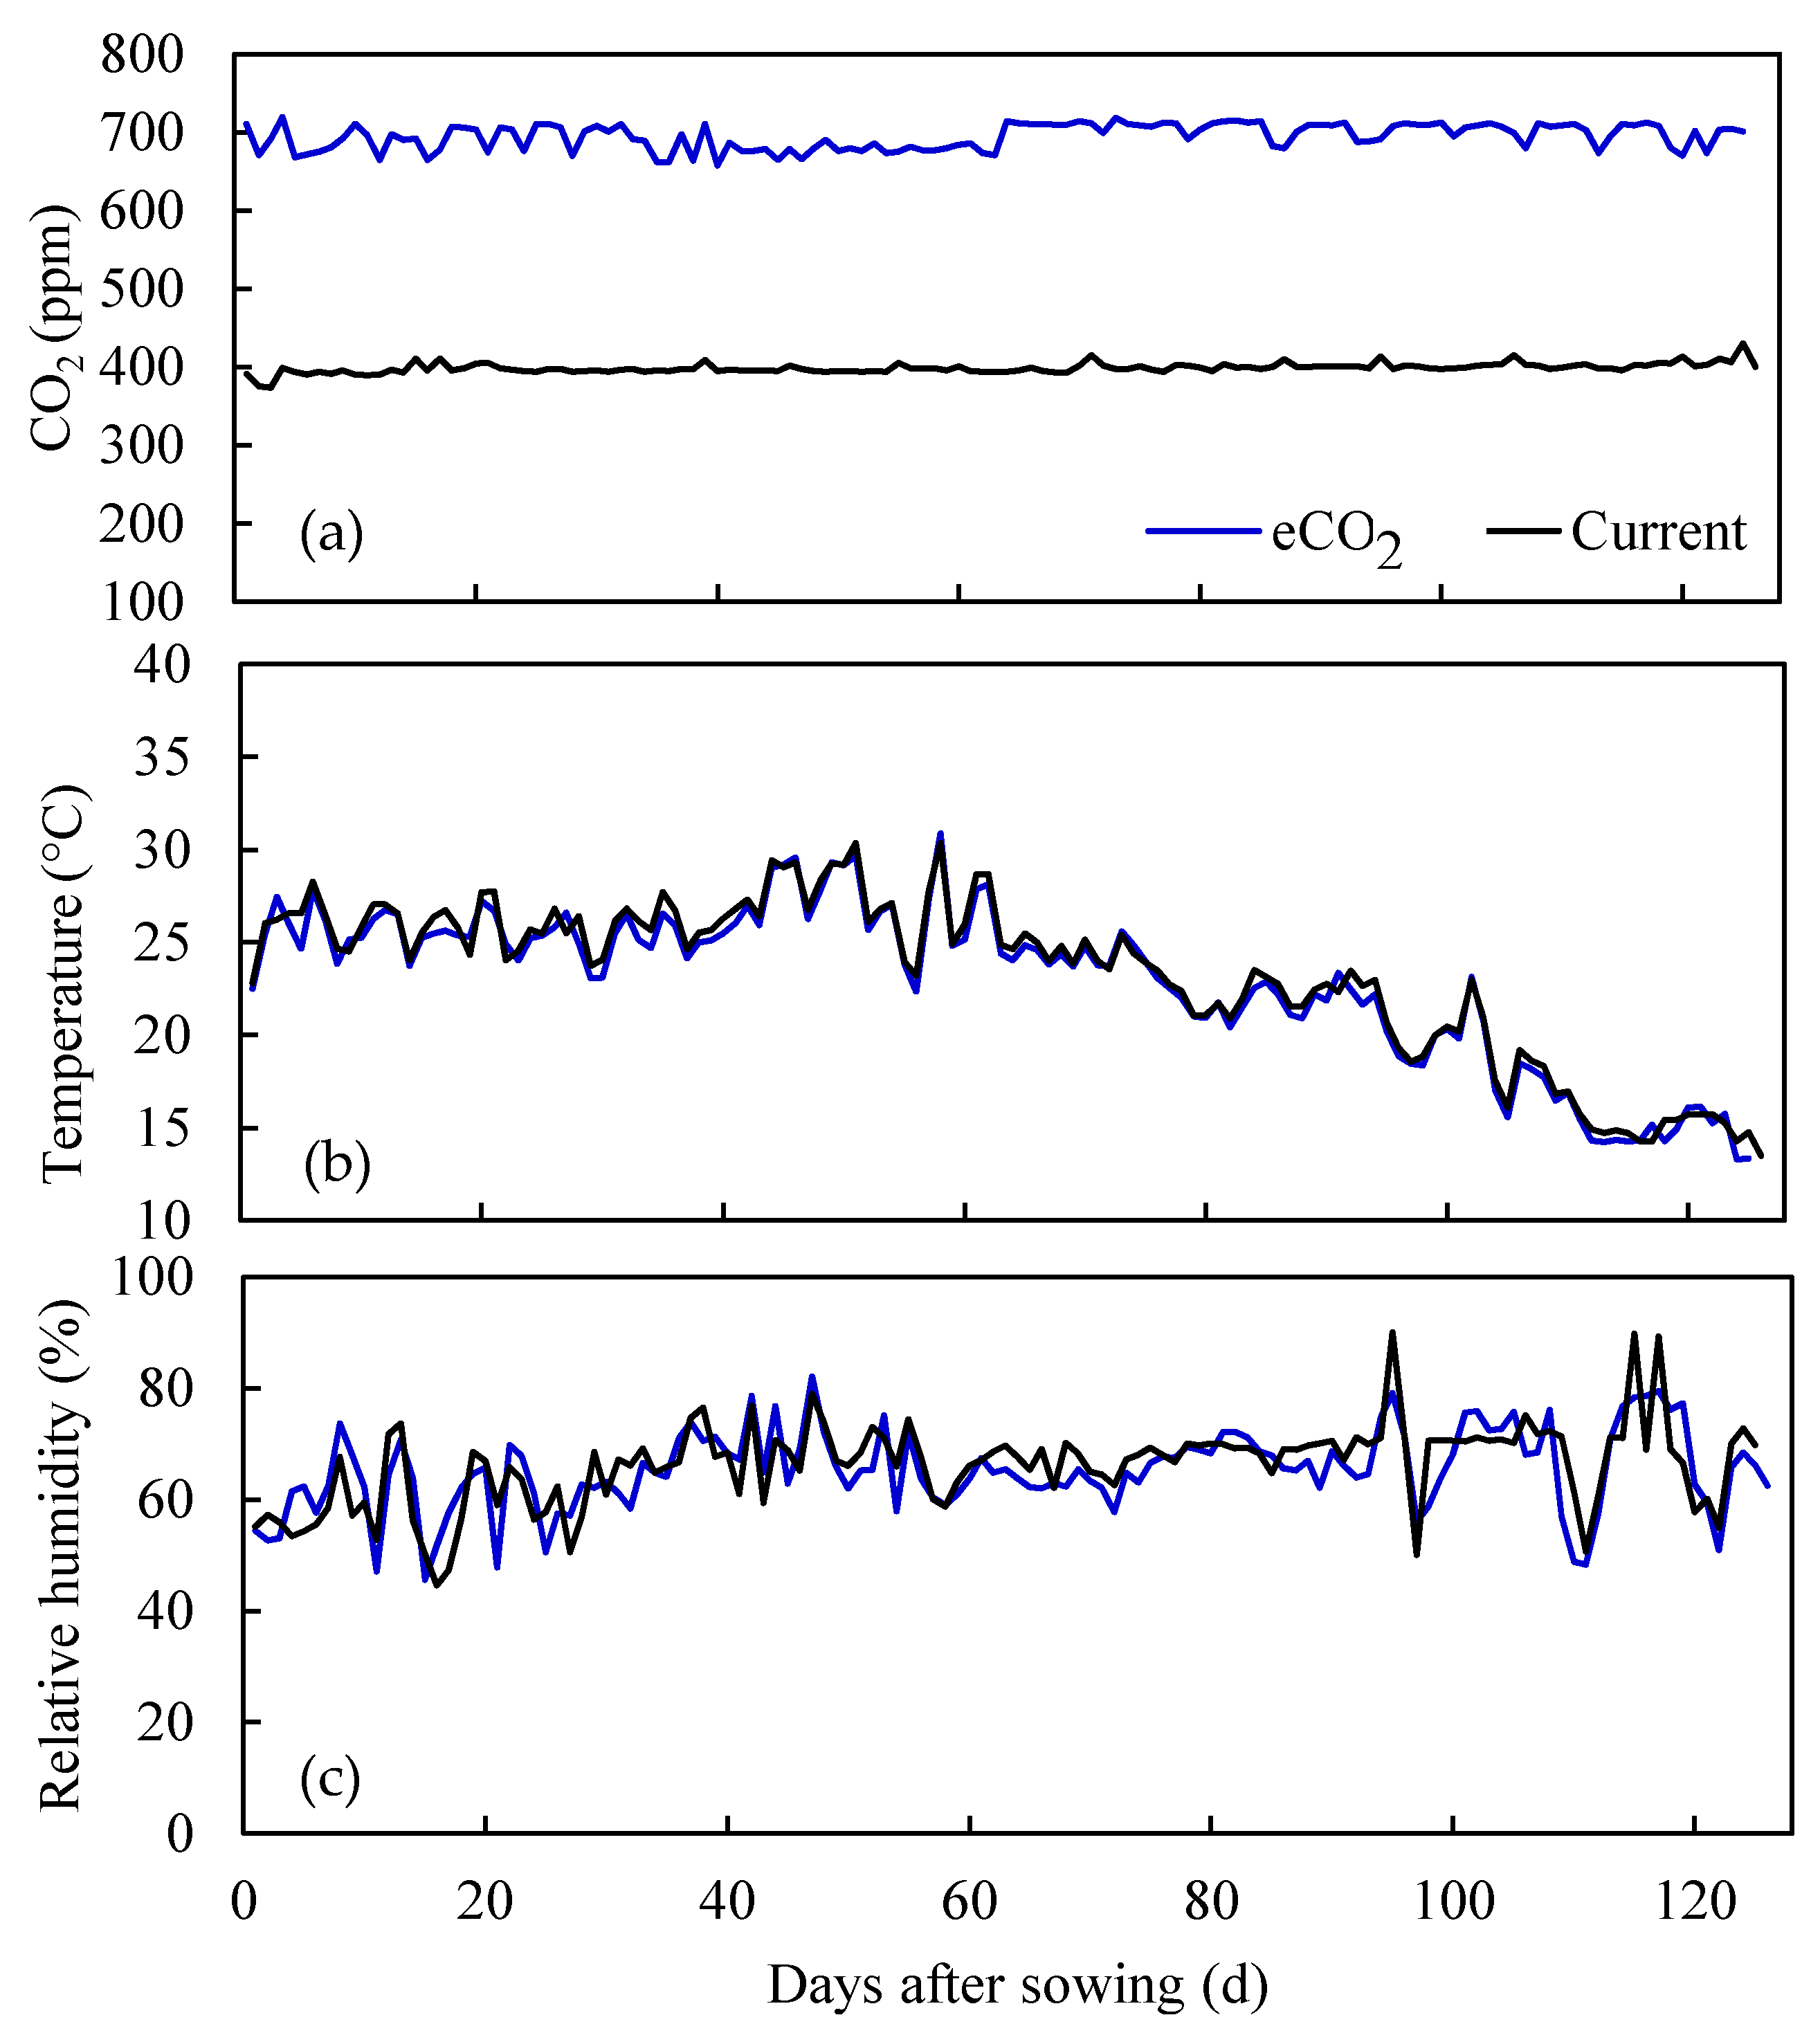
Maize (cultivar ZhengDan 958) was sown with an intrarow spacing of 63 cm and interrow spacing of 37 cm in each lysimeter. It was treated at two different CO2 concentrations in this study (Figure 1). One treatment represents current CO2 condition (400 ppm) conducted between 17 May 2014 to 19 September 2014, and the other treatment represents eCO2 condition (700 ppm) predicted for the end of this century which was conducted from 26 October 2015 to 28 February 2016. The daily variations in the CO2 concentrations during the growing season of maize under current and eCO2 treatments are indicated in Figure 2. The growth periods for each treatment are shown in Table 1. Amount of irrigation and fertilization was same between the current and eCO2 treatments (Table 1). The air temperature and relative humidity for the two treatments were mainly controlled to match those representing the normal climate conditions in the summer maize season, determined from the Beijing metrological station (116°28´ E, 39°48´ N) (Figure 2). The light intensity was set to 150 W·m−2 above the canopy from 6 a.m. to 6 p.m. and the water table depth kept at 2.5 m for both treatments.
2.2. Water Sampling and Isotope Analysis
Samples of irrigation, soil water, and stem water were collected in two lysimeters as two replicates to analyze the differences in seasonal isotopic compositions (δ2H and δ18O) between the current and eCO2 treatments. Irrigation water was sampled via a 50 ml polyethylene bottle and then sealed with parafilm. Soil water at depths of 10, 30, 40, 50, 60, 70, 80, 100, 120, 140, 170, 200, and 230 cm were collected using the porous ceramic suction cups installed in the weighing lysimeters (Figure 1). There were one or two sampling campaigns of soil water within the seedling (10 d and 31 d), jointing (43 d and 51 d), tasseling (72 d), and filling (94 d) growth stages under each treatment.
On the same dates for soil water collection, the stems between the first node and the soil surface of one representative plant in each lysimeter were sampled for isotopic analysis. They were cut into several 2 to 3 cm long pieces and all the epidermises were removed. All the samples of stems were then put into 4 ml glass bottles and kept at −15 °C and −20 °C via a refrigerator before isotope measurements. Stem water was extracted using the cryogenic vacuum distillation system (LI-2000, LICA, Beijing, China).
The isotopic compositions in different water samples were measured by the Los Gatos Research (LGR) liquid water isotope analyzer (DLT-100, Mountain View, CA, USA). The measured δ2H and δ18O values were calibrated using the Vienna Standard Mean Ocean Water (VSMOW) international standards. The precision was ±1‰ for δ2H and ±0.1‰ for δ18O measurements. Deuterium excess (d-excess) reflects the fractionation or isotopic enrichment of individual samples and is described as d-excess = δ2H – 8.0 × δ18O [32].
2.3. Measurements of Plant Ecophysiological Indices
Plant transpiration is the main force for root water uptake [10], and its fraction in evapotranspiration is positively correlated with the leaf area index (LAI) [33]. Carbon allocation to root growth may vary with any change in leaf photosynthesis and affect the water use strategies by roots [1]. Therefore, four typical growth indicators including transpiration rate (Tr), net photosynthetic rate (Pn), water use efficiency at leaf scale (WUEL), and LAI were selected to explore their correlations with plant water uptake patterns in this study. Six representative plants were selected in each plot to measure the leaf growth characteristics of maize. These measurements were generally conducted on the sampling dates of soil water. The Pn and Tr were measured on the second leaf of the representative plants by an LI-6400 photosynthesis system (LI-COR Inc., USA) with a leaf room temperature of 28 °C and flow rate of 500 μmol s−1 [34]. The WUEL was calculated as the Pn divided by the Tr. The measurements of maximum width and length of all leaves were conducted via a steel tape to calculate the leaf area for each plant. The LAI was estimated as the division of the total leaf area and related ground surface area per plant.
2.4. Quantification of Water Source Contributions to Maize
The MixSIAR Bayesian mixing model has the advantage of accounting for uncertainties in estimation of source contributions and providing an optimal solution rather than a range of feasible solutions [35]. It was particularly efficient in the case of over three potential water sources for plant water uptake [36]. In this study, dual stable isotopes together with the MixSIAR model (v2.1.3) were used to determine the seasonal variations in the main water uptake depth and quantify the contributions of soil water at different depths to maize water uptake. Soil water at different depths was considered as the primary water sources for maize, since soil water was a mixture of irrigation water, old soil water, and upward fluxes of groundwater in our experiments. The soil water sources were divided into five layers including 0−20, 20−40, 40−80, 80−140, and 140−250 cm, in terms of seasonal variations in the δ2H and δ18O isotopes. The δ2H and δ18O values of soil water averaged from those at all sampling depths within each layer were input as raw source data into the MixSIAR model. The isotopic compositions of stem water on the same dates were input as mixture data. For convergence, the run length of the Markov chain Monte Carlo (MCMC) parameter was specified as “very long”. Both the process error and residual error were used to evaluate the model erroneous. The median (50% quantiles) proportions referred to the contributions of soil water in each layer to stem water in this study.
2.5. Statistical Analysis
Differences of the seasonal variations in the isotopic compositions of water sources and growth indicators were compared between the current and eCO2 treatments via analysis of variance (ANOVA) with LSD (least significance difference). The correlations between the proportions of soil water contribution in different layers and plant ecophysiological indices under two treatments were estimated. All statistical analyses were conducted using the SPSS (version 22.0) software package (IBM Corp., Chicago, Illinois, USA). The level of statistical significance was determined as p < 0.05.
3. Results
3.1. Water Stable Isotopes under Current CO2 and ECO2 Treatments
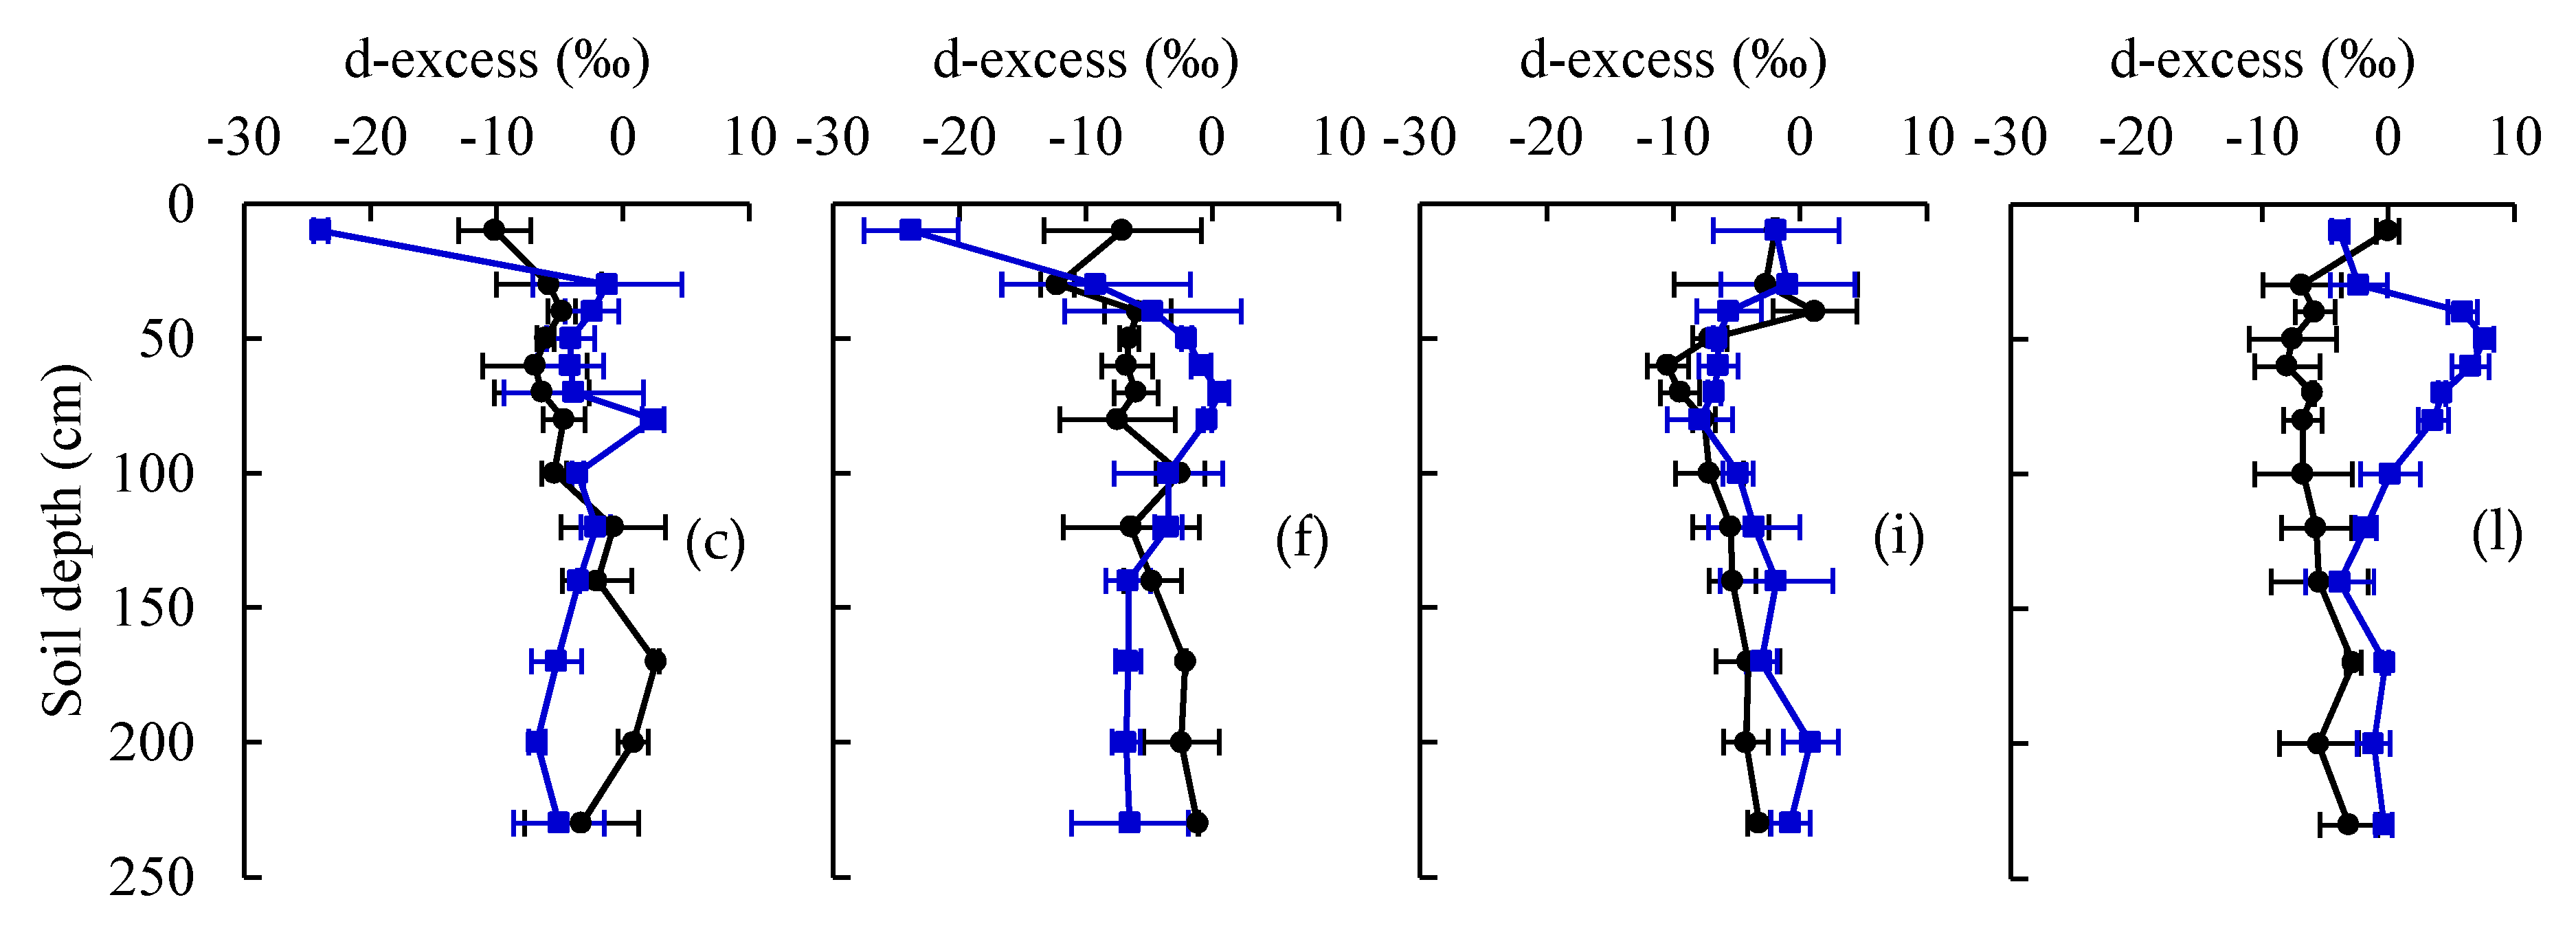
For the current treatment, soil water isotopic values (δ2H and δ18O) exhibited greater seasonal variation in the 0−80 cm layer than those in other soil layers (Figure 3). The isotopic compositions of soil water especially at the upper 20 cm layer were significantly more enriched at the tasseling and filling growth stages compared to the seedling and jointing stages (p < 0.05). The soil water isotopes within the 80−140 cm layer remained stable with depleted values over the entire observation period. Notably enriched soil water isotopes in the deep layer (140−250 cm) occurred at the filling stage for current treatment. Significant differences in the soil water isotopes between the current and eCO2 treatments were characterized by enriched values in the 0−80 cm soil layer at the seedling and jointing stages (p < 0.05) (Figure 3). The more negative d-excess also indicated that the 0−80 cm soil layer was exposed to increased evaporation under eCO2 compared to the current treatment at the seedling and jointing stages. The lowest d-excess in the 0−20 cm layer suggested the highest impact of evaporation near the soil surface under eCO2 (Figure 3). It was found that eCO2 resulted in larger variance in the soil water isotopic values within the 80−140 cm layer, but an inverse change appeared in the 140−250 cm layer.
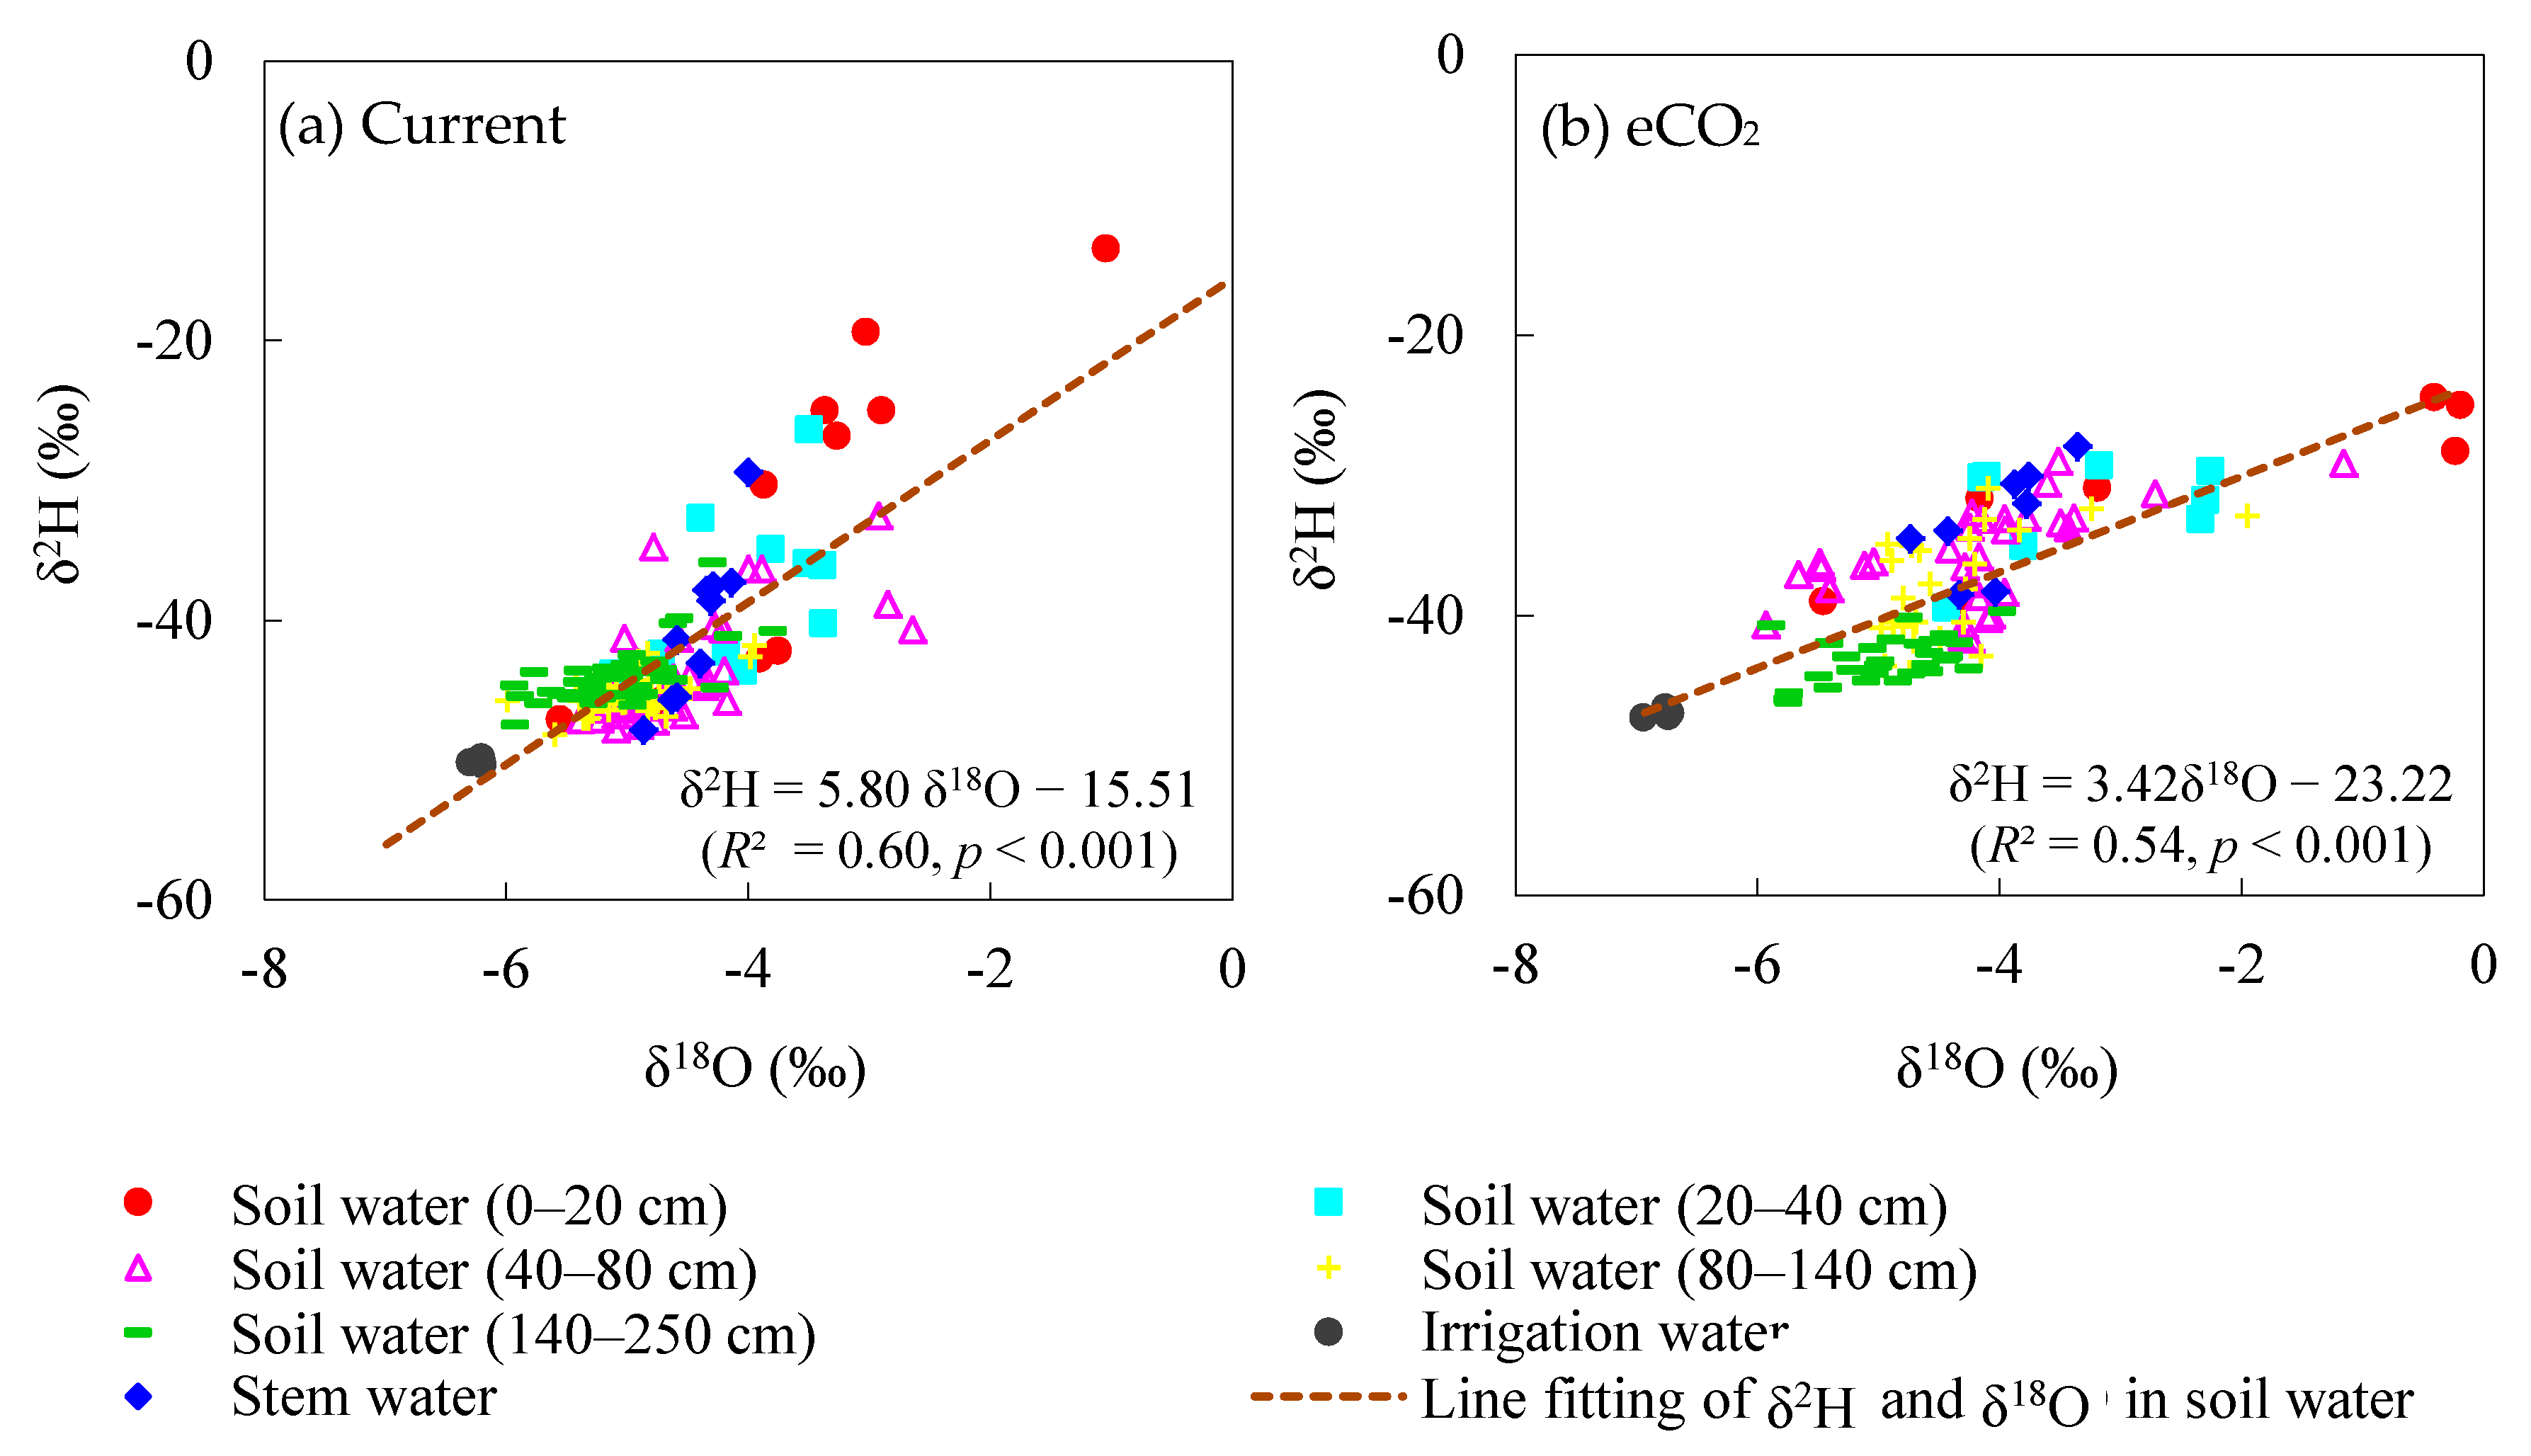
All soil water isotopes under the current treatment were more enriched than irrigation water, and the soil water line was fitted as δ2H = 5.80 δ18O−15.51 (R² = 0.60, p < 0.001) (Figure 4a). Soil water isotopes endured greater evaporation fractionation under eCO2, indicated by a lower slope in the soil water line (δ2H =3.42 δ18O23.22, R² = 0.54, p < 0.001) (Figure 4b). Stable isotopes of stem water mainly fell on the soil water lines under both the current and elevated CO2 treatments. Most stem water isotopes exhibited similar values to those of the soil water in the 40−80 cm layer over the observed growing period, except in the surface layer (0−20 cm) at the seedling stage for the current treatment (Figure 4a). Maize under eCO2 had more positive δ2H and δ18O values in stem water at the seedling and jointing stages. They matched well with those enriched isotopic values in soil water, especially in the 20−40 cm and 40−80 cm layers, suggesting a higher reliance on water sources from these two layers for maize under eCO2.
3.2. Plant Ecophysiological Indices under Current CO2 and eCO2 Treatments
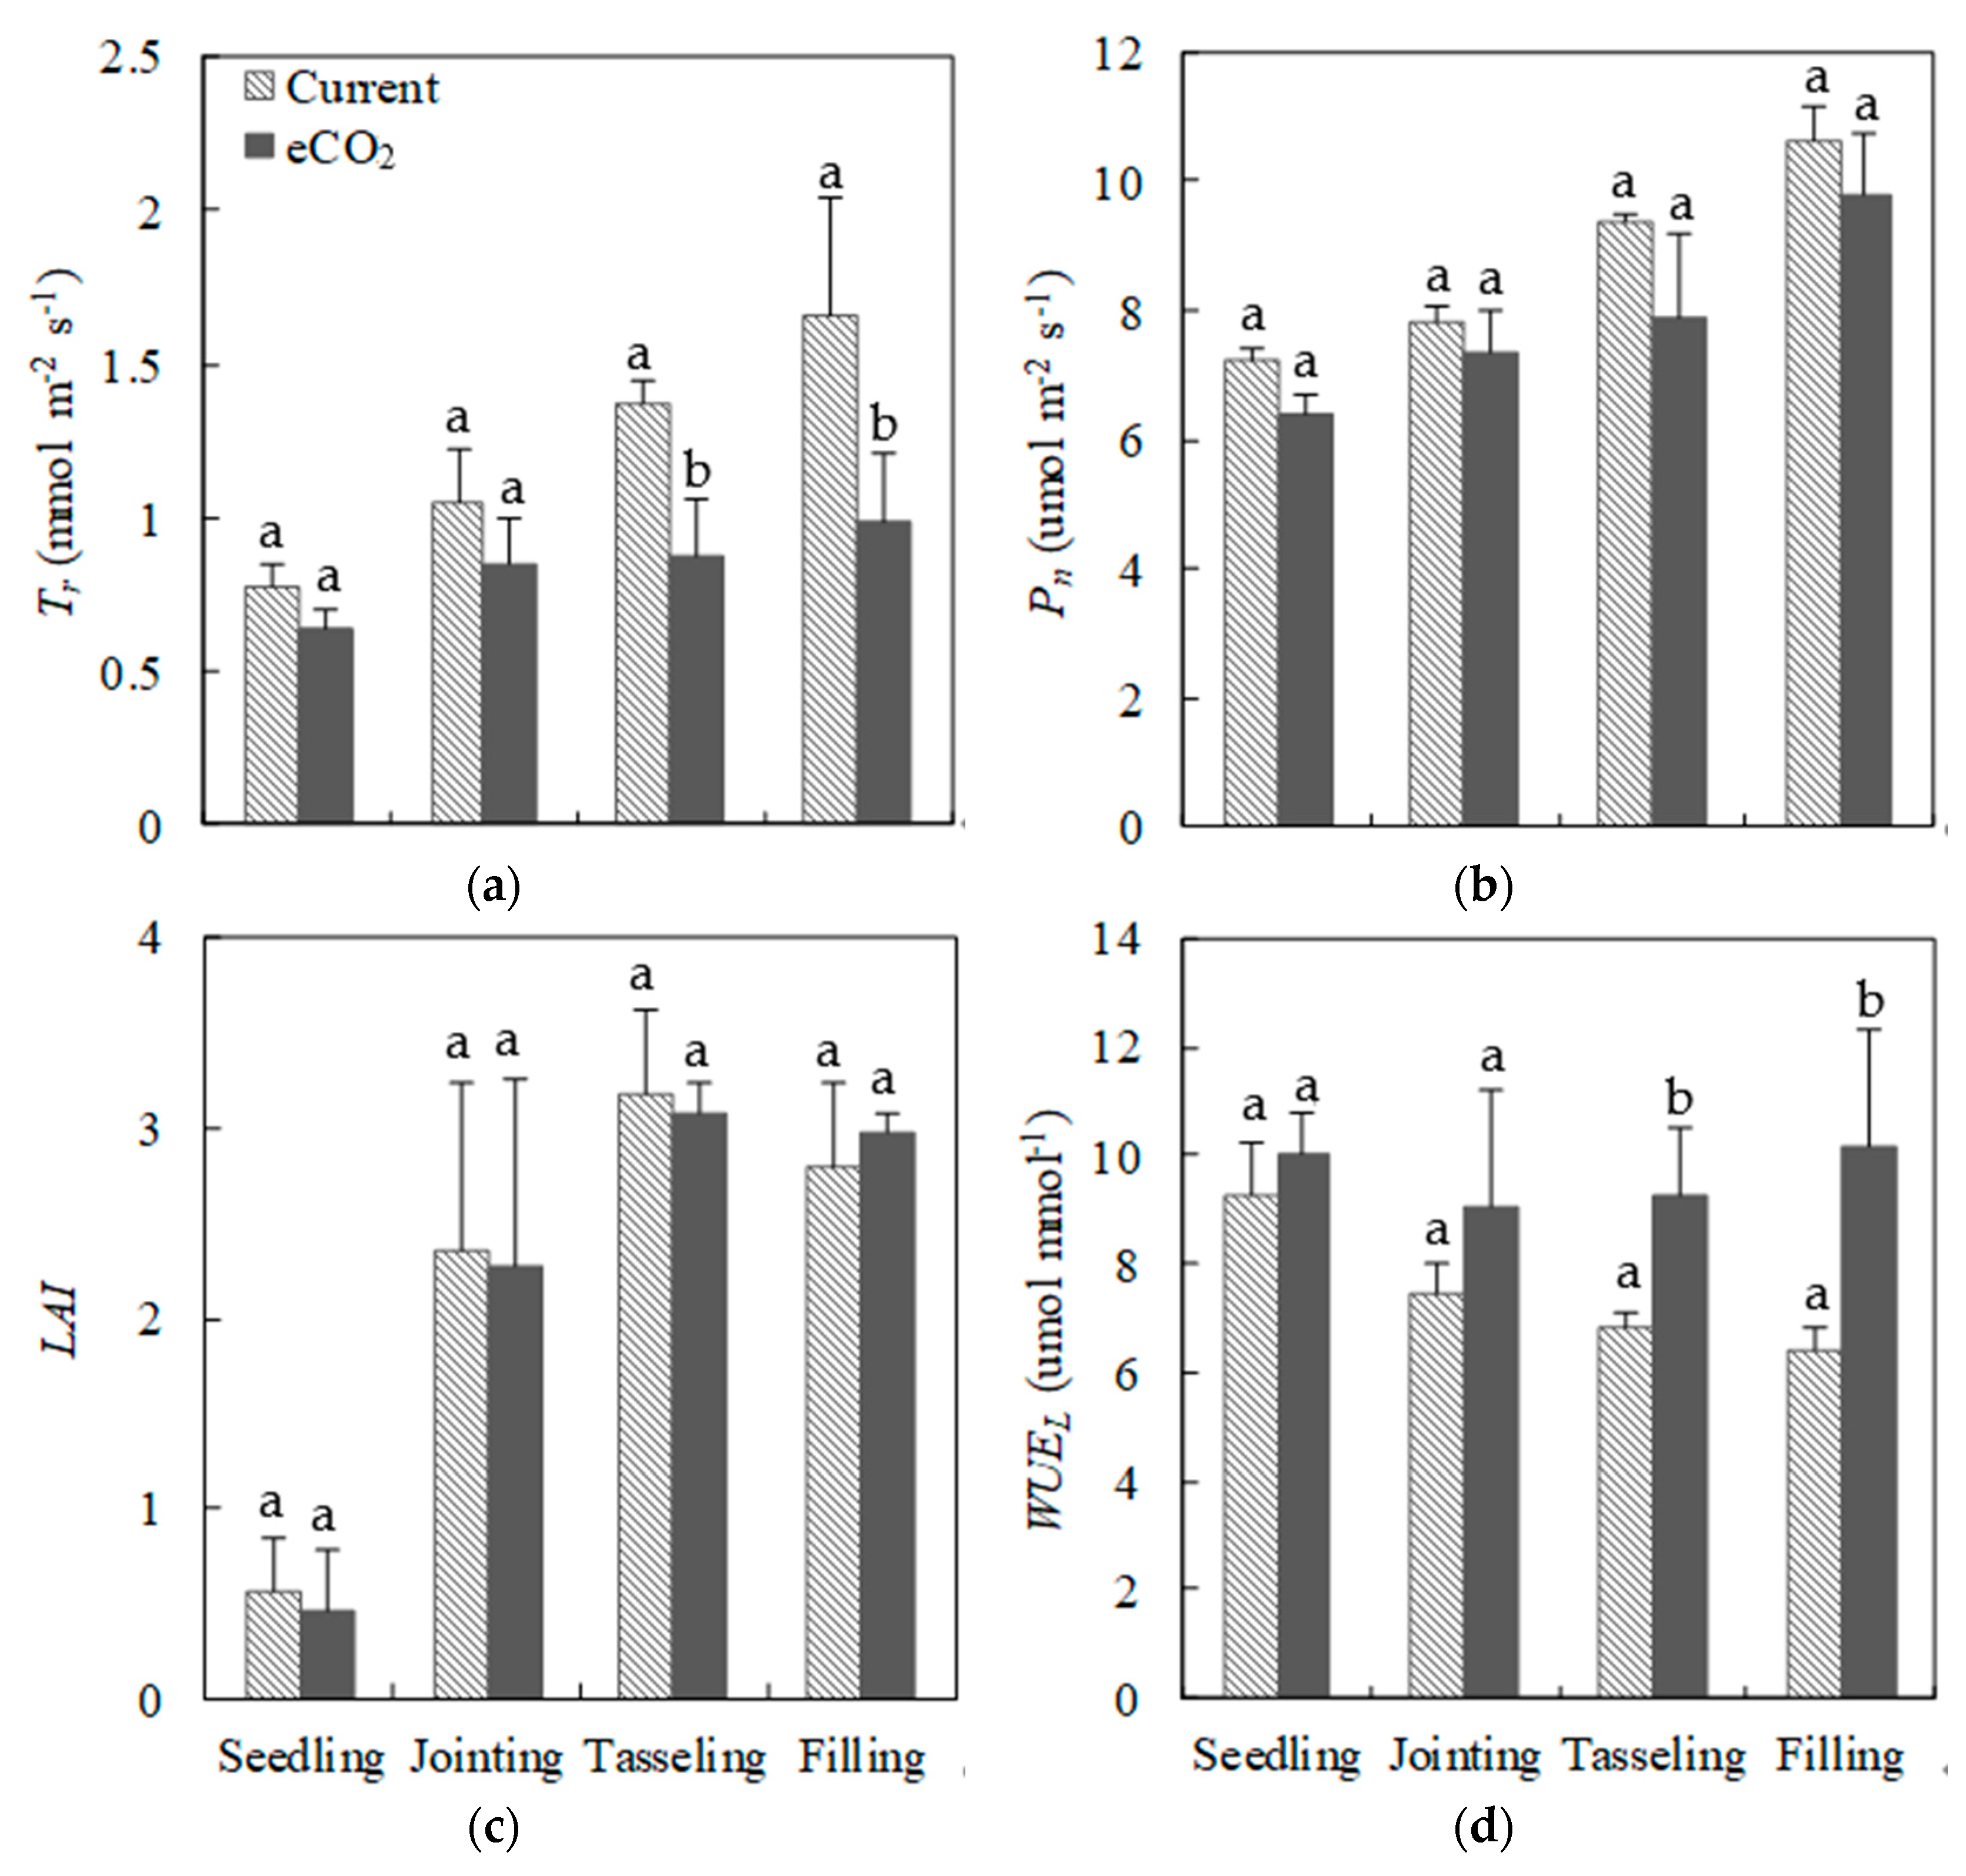
There were large differences of photosynthesis parameters of maize leaves between eCO2 and current treatments (Figure 5a,b). The mean value of Pn was 7.2 (±0.2), 7.8 (±0.2), 9.4 (±0.1), and 10.6 (±0.5) umol m−2 s−1 at the seedling, jointing, tasseling, and filling growth stages for the current treatment, respectively (Figure 5b). Although Pn had an increasing trend from the seedling to filling stage under eCO2, it was on average 10.2% lower than that under the current treatment (Figure 5b). The mean value of Tr increased rapidly from the seedling (0.6 mmol m−2 s−1) to filling (1.7 mmol m−2 s−1) stage compared to Pn under the current treatment (Figure 5a and b). However, eCO2 resulted in a significantly greater reduction in Tr (with a mean of 28.1%, p < 0.05), especially at the filling stage with respect to changes in Pn. Maize leaves developed rapidly at the jointing stage and then LAI reached the maximum value at the tasseling stage for both treatments (mean of 3.1) (Figure 5c). However, eCO2 decreased LAI slightly by 4.4% during the first three growth stages but increased with a mean of 4.4% at the filling stage compared to the current treatment (Figure 5c). The differences of LAI under current and eCO2 treatments during the entire growth period were not significant (p > 0.05). It was evident that the mean of WUEL decreased greatly from 9.3 to 6.4 umol mmol−1 during the observed growth period under the current treatment (Figure 5d). Higher WUEL (with a mean of 30.5%) was induced by eCO2, particularly at the tasseling and filling stages (p < 0.05).
3.3. Root Water Uptake Patterns under Current CO2 and eCO2 Treatments
The main water source for maize was soil water in the 0−20 cm layer at the seedling stage and in the 40−80 cm layer at other growth stages under the current treatment (Figure 6a). The soil water in the 0−20 cm layer contributed to a maximum of 44.0% of maize water uptake at the seedling stage. The contribution of soil water in the 20−40 layer remained at low values (ranging between 8.9 and 19.4%) at the seedling to tasseling stages, while this contribution increased to 24.1% (±16.5%) at the filling stage. Maize greatly relied on the water source from the 40−80 cm soil layer, starting from the jointing stage, taking up water with a mean of 29.2% (±3.8%) from this layer (Figure 6a). There was a stable contribution of soil water in the 80−140 cm layer (17.6% ± 2.4%) under the current treatment. Soil water in the 140−250 cm layer, providing 22.0% (±7.9%) water to plant water take, played an important role in water utilization by maize, especially at the tasseling and filling stages (Figure 6a).
Compared to the current treatment, the main water uptake depth shifted from 0−20 cm to 20−40 cm at the seedling stage under eCO2 treatment (Figure 6b). The contribution of soil water in the 20−40 layer at this stage was 27.4% higher than that for maize exposed to the current treatment (Figure 6b). The main water uptake depth at the jointing and tasseling stages under eCO2 was the 40−80 cm layer, which was same as under current treatment. Nevertheless, the soil water contribution in 40−80 cm layer was 22.7% and 15.4% higher at the jointing and tasseling stages under eCO2, respectively (Figure 6b). More soil water was absorbed from the 0−20 cm (16.6%) and 80−140 cm (8.0%) layers at the filling stage for maize under eCO2 treatment. There was an average 8.6% reduction in the contribution of water source from the deep layer (140–250 cm) to maize water uptake over the entire growth period under eCO2 treatment with respect to current treatment (Figure 6b).
3.4. Correlations between Root Water Uptake Patterns and Crop Growth under Current and eCO2 Treatments
For maize under the current treatment, significant negative correlations were found between the proportions of soil water contribution in the 0−20 cm layer and Tr, Pn and LAI (p < 0.01), as shown in Table 2. The Tr, Pn and LAI showed significant positive correlations (p < 0.05) with the water contributions in both the 40−80 cm and 140−250 cm soil layers under the current treatment, suggesting greater reliance of leaf development on soil water in these two layers. No correlations were found between the soil water contributions in the 20−40 cm and 80−140 cm layers and Tr, Pn as well as LAI under the current treatment. The WUEL was positively related to the soil water contributions in the 0−20 cm layer (p < 0.05), indicating that maize took up more surface soil water for Pn rather than Tr. On the contrary, there were negative effects of soil water contribution in the 140−250 cm layer on WUEL.
In comparison with the current treatment, eCO2 modified the correlations between Tr, Pn and LAI of maize and soil water contributions at all layers except the deep layer of 140−250 cm (Table 2). There was no correlation between the soil water contributions in the 0−20 cm and 40−80 cm layers (p > 0.05) and Tr, Pn and LAI under eCO2 treatment, compared to those significant correlations under the current treatment. However, the Tr, Pn and LAI were significantly correlated with soil water contributions in the 20−40 cm (negative) and 80−140 cm (positive) layers (p < 0.05) under eCO2 treatment, in comparison with a nonsignificant correlation in these two layers under current treatment. Leaf photosynthesis and growth decreased as it took up more soil water from the 20−40 cm layer, whereas increasing water uptake from the 80−140 cm layer was helpful for maize leaf development under eCO2 treatment. Promotion of water contribution from the deep soil layer increased maize photosynthesis and growth under eCO2, which was consistent with the positive effects under the current treatment (Table 2). It was evident that the soil moisture in the deep layer could stimulate leaf growth and photosynthesis regardless of whether it suffered from current or elevated CO2 concentrations. However, no correlation was found between WUEL and soil water contributions in each layer under eCO2 treatment.
4. Discussion
4.1. Impacts of eCO2 on Crop Water Uptake
Our results demonstrated that increased CO2 concentration to 700 ppm shifted the water uptake depth of maize (Figure 6). Water uptake patterns were closely linked to LAI, transpiration, photosynthesis, and water use efficiency at the leaf scale. However, these correlations exhibited significant differences in each soil layer among the eCO2 and current treatments (Table 2). Seasonal variation in root water uptake is mainly determined by the distribution of water availability in the soil profile and crop characteristics [4,24,25,37]. Root biomass in the upper 80 cm depths was reported to account for approximately 90% of the total root biomass for maize crop [24]. It could be found that soil water in the 0−80 cm layer contributed a mean of 64.7% to maize under the current treatment over the growth period in this study. However, maize sourced significantly more water from the 0−80 cm layer particularly at the seedling and jointing growth stages under eCO2 treatment, suggesting eCO2 could stimulate higher carbon levels available for root growth as leaf photosynthesis rates reduced [38,39].
Shifts in root water uptake patterns due to eCO2 typically depend on the growth stage [31]. For the current treatment at the seedling stage, roots mainly took up soil water from the surface layer (0−20 cm) [23,24,26]. Nevertheless, soil water in the 20−40 cm layer was primarily absorbed by maize at this stage under eCO2. The reason might be that the soil evaporation in the surface layer was enhanced, indicated by the enriched isotopic values of surface soil water. This stronger evaporation resulted in greater soil water depletion in the 0−20 cm layer. Plants could increase their carbon allocation to roots extending to deeper wet soil in case of notable water depletion at the shallow depth [1]. Consequently, maize shifted to predominantly access water in the 20−40 cm layer at the seedling stage under eCO2. The greater soil water contributions at the main water uptake depth at this stage coincided with the initial growth of maize either under current or eCO2 treatment. Therefore, the soil water contributions had negative correlations with Tr, Pn and LAI at the seedling stage under both current and eCO2 treatments.
Maize under eCO2 became more reliant on soil water in the 40−80 cm layer when it developed into the jointing stage compared to the current treatment (Figure 6). This implied that eCO2 induced greater root biomass accumulation in this layer to tap more soil water at the jointing stage. Furthermore, soil water holding capacity in the 40−80 cm layer was increased, associated with significant higher soil moisture (p < 0.05) at the tasseling stage under eCO2 than that under the current treatment. It consequently raised the soil water contribution in the 40−80 cm layer at the tasseling stage. However, excessive water depletion in this layer reduced the Tr, Pn and LAI due to eCO2.
At the latter growth stages, crops growing in an environment with high CO2 concentration had more photosynthates allocated to the fine root growth [39,40,41]. The fine root biomass in the 80−140 cm layer was likely to be promoted by eCO2 and became more efficient in absorbing soil water for increasing leaf photosynthesis and LAI at the filling stage (Figure 6 and Table 2). Since root water uptake is mostly driven by crop transpiration, it seemed that the consecutive reduction in Tr throughout the seedling to filling growth period restricted the root foraging capacity for accessing water from the deep soil layer of 140–250 cm (Figure 6). However, this deep-water source played an important role in increasing the Tr, Pn and LAI of maize both under current and eCO2 treatments (Table 2). Plants prefer deep water sources that are hydraulically more difficult but stable to access—especially under drought conditions [9,10].
4.2. Implications of this Study
The eCO2 decreased Tr by 17.0% but increased evapotranspiration by 2.7% at the seedling growth stage in this study. It suggested that most of the potential water savings under eCO2 could be lost by an increase in evaporation [33,42]. Improvement of water management at this vegetative stage is critical for crop development under eCO2 [33,43]. Straw mulching traditionally used to reduce the evaporative water loss is recommended for improving maize growth under eCO2. Many experiments showed that eCO2 improved C4 plant–water relations and thereby indirectly enhanced photosynthesis, growth, and yield under drought [8,11,18]. Dry conditions could induce greater root growth accessing soil water stored in deep layers to improve grain filling of maize [44].
Our experiments suggested that deficit irrigation is better applied at the jointing stage to reduce root biomass accumulation in the middle soil layer (40−80 cm). Nevertheless, greater water supply is required at the grain filling stage under eCO2, leading to greater root growth and water uptake ability from deeper layers (80−250 cm). Crop yield responds strongly to even small amounts of additional soil water in the deep layer because it coincides with grain development [2,45]. Moreover, physiological processes such as photosynthesis may be prolonged and thus lead to greater crop growth. These implications provide important insights into agricultural water management under climate change and water scarcity environments.
The development of rooting depth was not observed during the experiments, which requires further investigation by microlysimeters in future studies. The inter-relationships between root water uptake and crop growth under current and eCO2 treatments also need further analysis by a quantitative biophysical model. It should be noted that some environmental conditions (i.e., light intensity and wind speed) of the controlled indoor experiments in this study could not be the same as the surroundings of the natural environment, because of the technical difficulties and expensive costs. The indoor experiments are advantageous in comparing the responses of the water cycle and crop growth to different climate conditions such as increasing CO2 and air temperature. More controlled experiments with different CO2 concentrations are needed in future studies. The parameters and mechanisms obtained in the experiments can be incorporated into the models to predict the future grain yield under changing environments.
5. Conclusions
In this study, seasonal responses of root water uptake patterns to eCO2 (700 ppm) and their correlations with growth of maize were determined using a device combined with a climate chamber and weighing lysimeters. The decreases in leaf transpiration and photosynthesis due to eCO2, stimulated roots to absorb significantly more soil water from the upper 80 cm layer in the entire growing season, even from the 80−140 cm layer at the filling growth stage. However, the root water forging capability from the deep layer of 140−250 cm was reduced under eCO2. The shifts of root water uptake sources due to eCO2 depended on the growth stage. The main water uptake depth at the seedling stage shifted from 0−20 cm to 20−40 cm by eCO2, when the soil water contributions were negatively correlated with LAI, Tr and Pn either under current or eCO2 treatment. Although the soil water contribution in the 40−80 cm layer was higher at the jointing (22.7%) and tasseling (15.4%) stages under eCO2, no correlation was found between it and leaf growth compared to the positive relations under the current treatment. Soil water extraction from the 80−140 cm layer was beneficial for the growth of LAI, Tr and Pn under eCO2. Overall, the WUEL increased significantly but it was not ascribed to the water contribution in an individual soil layer under eCO2. These shifts of crop water uptake patterns by eCO2 suggested that agricultural management practices should be applied for conserving soil water at the initial growth stage of maize under eCO2. Increasing the water uptake capability of roots in the deep layer will provide benefits by improving the grain yield of maize.
Author Contributions
Conceptualization, Y.M.; formal analysis, Y.M. and Y.W.; funding acquisition, Y.M. and X.S.; investigation, Y.M. and Y.W.; methodology, Y.M., Y.W. and X.S.; project administration, Y.M. and X.S.; software, Y.M.; writing – original draft, Y.M.; writing—review and editing, Y.M. All authors have read and agreed to the published version of the manuscript.
Funding
This research was funded by the National Natural Science Foundation of China, grant numbers 41671027 and 41730749.
Acknowledgments
Sincere thanks go to L.T., Y.Q. and L.Y. for assistance with the experiments.
Conflicts of Interest
The authors declare no conflict of interest.
References
- Grossiord, C.; Sevanto, S.; Dawson, T.E.; Adams, H.D.; Collins, A.D.; Dickman, L.T.; Newman, B.D.; Stockton, E.A.; McDowell, N.G. Warming combined with more extreme precipitation regimes modifies the water sources used by trees. New Phytol. 2017, 213, 584–596. [Google Scholar] [CrossRef] [PubMed]
- Uddin, S.; Löw, M.; Parvin, S.; Fitzgerald, G.; Bahrami, H.; Tausz-Posch, S.; Armstrong, R.; O’Leary, G.; Tausz, M. Water use and growth responses of dryland wheat grown under elevated [CO2] are associated with root length in deeper, but not upper soil layer. Field Crops Res. 2018, 224, 170–181. [Google Scholar] [CrossRef]
- Dubey, S.K.; Sharma, D. Assessment of climate change impact on yield of major crops in the Banas River Basin, India. Sci. Total Environ. 2018, 635, 10–19. [Google Scholar] [CrossRef] [PubMed]
- Asbjornsen, H.; Mora, G.; Helmers, M.J. Variation in water uptake dynamics among contrasting agricultural and native plant communities in the Midwestern US. Agric. Ecosyst. Environ. 2007, 121, 343–356. [Google Scholar] [CrossRef]
- Wang, J.; Fu, B.J.; Lu, N.; Zhang, L. Seasonal variation in water uptake patterns of three plant species based on stable isotopes in the semi-arid Loess Plateau. Sci. Total Environ. 2017, 609, 27–37. [Google Scholar] [CrossRef]
- IPCC, Core Writing Team. Climate Change: Synthesis Report. Contribution of Working Groups I, II and III to the Fifth Assessment Report of the Intergovernmental Panel on Climate Change; Pachauri, R.K., Meyer, L.A., Eds.; IPCC: Geneva, Switzerland, 2014; p. 151. [Google Scholar]
- Tilman, D.; Kenneth, G.C.; Pamela, A.M.; Rosamond, N.; Stephen, P. Agricultural sustainability and intensive production practices. Nature 2002, 418, 671–677. [Google Scholar] [CrossRef]
- Manderscheid, R.; Erbs, M.; Weigel, H. Interactive effects of free-air CO2 enrichment and drought stress on maize growth. Eur. J. Agron. 2014, 52, 11–21. [Google Scholar] [CrossRef]
- Beyer, M.; Hamutoko, J.T.; Wanke, H.; Gaj, M.; Koeniger, P. Examination of deep root water uptake using anomalies of soil water stable isotopes, depth-controlled isotopic labeling and mixing models. J. Hydrol. 2018, 566, 122–136. [Google Scholar] [CrossRef]
- Amin, A.; Zuecco, G.; Geris, J.; Schwendenmann, L.; McDonnell, J.J.; Borga, M.; Penna, D. Depth distribution of soil water sourced by plants at the global scale: A new direct inference approach. Ecohydrology 2020, 13, e2177. [Google Scholar] [CrossRef]
- Leakey, A.D.B.; Uribelarrea, M.; Ainsworth, E.A.; Naidu, S.L.; Rogers, A.; Ort, D.R.; Long, S.P. Photosynthesis, productivity, and yield of maize are not affected by open-air elevation of CO2 concentration in the absence of drought. Plant Physiol. 2006, 140, 779–790. [Google Scholar] [CrossRef] [Green Version]
- Oliver, R.J.; Finch, J.W.; Taylor, G. Second generation bioenergy crops and climate change: A review of the effects of elevated atmospheric CO2 and drought on water use and the implications for yield. Glob. Chang. Biol. Bioenergy 2009, 1, 97–114. [Google Scholar] [CrossRef]
- Drewry, D.T.; Kumar, P.; Long, S.; Bernacchi, C.; Liang, X.-Z.; Sivapalan, M. Ecohydrological responses of dense canopies to environmental variability: 2. Role of acclimation under elevated CO2. J. Geophys. Res. 2010, 115, G04023. [Google Scholar] [CrossRef]
- Markelz, R.J.C.; Strellner, R.S.; Leakey, A.D.B. Impairment of C4 photosynthesis by drought is exacerbated by limiting nitrogen and ameliorated by elevated [CO2] in maize. J. Exp. Bot. 2011, 62, 3235–3246. [Google Scholar] [CrossRef] [PubMed] [Green Version]
- Le, P.V.V.; Kumar, P.; Drewry, D.T. Implications for the hydrologic cycle under climate change due to the expansion of bioenergy crops in the Midwestern United States. Proc. Natl. Acad. Sci. USA 2011, 108, 15085–15090. [Google Scholar] [CrossRef] [PubMed] [Green Version]
- Allen, L.H., Jr.; Kakani, V.G.; Vu, J.C.V.; Boote, K.J. Elevated CO2 increases water use efficiency by sustaining photosynthesis of water-limited maize and sorghum. J. Plant Physiol. 2011, 168, 1909–1918. [Google Scholar] [CrossRef]
- Kim, S.-H.; Sicher, R.C.; Bae, H.; Gitz, D.C.; Baker, J.T.; Timlin, D.J.; Reddy, V.R. Canopy photosynthesis, evapotranspiration, leaf nitrogen, and transcription profiles of maize in response to CO2 enrichment. Glob. Chang. Biol. 2006, 12, 588–600. [Google Scholar] [CrossRef]
- Kang, S.Z.; Zhang, F.C.; Hu, X.T.; Zhang, J.H. Benefits of CO2 enrichment on crop plants are modified by soil water status. Plant Soil 2002, 238, 69–77. [Google Scholar] [CrossRef]
- Leakey, A.D.B.; Bernacchi, C.J.; Dohleman, W.F.G.; Ort, D.R.; Long, S.P. Will photosynthesis of maize (Zea mays) in the US Corn Belt increase in future [CO2] rich atmospheres? An analysis of diurnal courses of CO2 uptake under free-air concentration enrichment (FACE). Glob. Chang. Biol. 2004, 10, 951–962. [Google Scholar] [CrossRef]
- Driscoll, S.P.; Prins, A.; Olmos, E.; Kunert, K.J.; Foyer, C.H. Specification of adaxial and abaxial stomata, epidermal structure and photosynthesis to CO2 enrichment in maize leaves. J. Exp. Bot. 2006, 57, 381–390. [Google Scholar] [CrossRef] [Green Version]
- van der Kooi, C.J.; Reich, M.; Löw, M.; De Kok, L.J.; Tausza, M. Growth and yield stimulation under elevated CO2 and drought: A meta-analysis on crops. Environ. Exp. Bot. 2016, 122, 150–157. [Google Scholar] [CrossRef]
- Li, X.J.; Kang, S.Z.; Zhang, X.T.; Li, F.S.; Lu, H.N. Deficit irrigation provokes more pronounced responses of maize photosynthesis and water productivity to elevated CO2. Agric. Water Manag. 2018, 195, 71–83. [Google Scholar] [CrossRef]
- Wang, P.; Song, X.F.; Han, D.M.; Zhang, Y.H.; Liu, X. A study of root water uptake of crops indicated by hydrogen and oxygen stable isotopes: A case in Shanxi Province, China. Agric. Water Manag. 2010, 97, 475–482. [Google Scholar] [CrossRef]
- Ma, Y.; Song, X.F. Using stable isotopes to determine seasonal variations in water uptake of summer maize under different fertilization treatments. Sci. Total Environ. 2016, 550, 471–483. [Google Scholar] [CrossRef] [PubMed]
- Wu, Y.J.; Du, T.S.; Li, F.S.; Li, S.E.; Ding, R.S.; Tong, L. Quantification of maize water uptake from different layers and root zones under alternate furrow irrigation using stable oxygen isotope. Agric. Water Manag. 2016, 168, 35–44. [Google Scholar] [CrossRef]
- Zhao, X.; Li, F.D.; Ai, Z.P.; Li, J.; Gu, C.K. Stable isotope evidences for identifying crop water uptake in a typical winter wheat–summer maize rotation field in the North China Plain. Sci. Total Environ. 2018, 618, 121–131. [Google Scholar] [CrossRef]
- Sprenger, M.; Leistert, H.; Gimbel, K.; Weiler, M. Illuminating hydrological processes at the soil-vegetation-atmosphere interface with water stable isotopes. Rev. Geophys. 2016, 54. [Google Scholar] [CrossRef] [Green Version]
- Wang, J.; Lu, N.; Fu, B.J. Inter-comparison of stable isotope mixing models for determining plant water source partitioning. Sci. Total Environ. 2019, 666, 685–693. [Google Scholar] [CrossRef]
- Huang, L.; Zhang, Z.S. Stable isotopic analysis on water utilization of two xerophytic shrubs in a revegetated desert area: Tengger Desert, China. Water 2015, 7, 1030–1045. [Google Scholar] [CrossRef] [Green Version]
- Wu, J.B.; Li, H.P.; Niu, J.M.; Liu, T.J.; Zheng, H.X.; Xu, X.T.; Miao, S. Water uptake patterns of alfalfa under winter irrigation in cold and arid grassland. Water 2020, 12, 1093. [Google Scholar] [CrossRef]
- Penna, D.; Geris, J.; Hopp, L.; Scandellari, F. Water sources for root water uptake: Using stable isotopes of hydrogen and oxygen as a research tool in agricultural and agroforestry systems. Agric. Ecosyst. Environ. 2020, 291, 106790. [Google Scholar] [CrossRef]
- Dansgaard, W. Stable isotopes in precipitation. Tellus 1964, 16, 436–468. [Google Scholar] [CrossRef]
- Wang, L.; Good, S.P.; Caylor, K.K. Global synthesis of vegetation control on evapotranspiration partitioning. Geophys. Res. Lett. 2014, 41, 6753–6757. [Google Scholar] [CrossRef]
- Ritchie, S.W.; Hanway, J.J. How a Corn Plant Develops; Special Report No. 48; Iowa State University Press: Ames, IA, USA, 1982. [Google Scholar]
- Stock, B.C.; Semmens, B.X. MixSIAR GUI User Manual, Version 1.0. 2013. Available online: http://conserver.iugo-cafe.org/user/brice.semmens/MixSIAR (accessed on 7 February 2020).
- Rothfuss, Y.; Javaux, M. Reviews and syntheses: Isotopic approaches to quantify root water uptake: A review and comparison of methods. Biogeosciences 2017, 14, 2199–2224. [Google Scholar] [CrossRef] [Green Version]
- Mahindawansha, A.; Orlowski, N.; Kraft, P.; Rothfuss, Y.; Racela, H.; Breuer, L. Quantification of plant water uptake by water stable isotopes in rice paddy systems. Plant Soil 2018, 429, 281–302. [Google Scholar] [CrossRef]
- Newton, P.C.D.; Clark, H.; Bell, C.C.; Glasgow, E.M. Interaction of soil moisture and elevated CO2 on the above-ground growth rate root length density and gas exchange of curves from temperate pasture. J. Exp. Bot. 1996, 47, 771–779. [Google Scholar] [CrossRef] [Green Version]
- de Graaff, M.A.; van Groenigen, K.J.; Six, J.; Hungate, B.; van Kessel, C. Interactions between plant growth and soil nutrient cycling under elevated CO2: A meta-analysis. Glob. Chang. Biol. 2006, 12, 2077–2091. [Google Scholar] [CrossRef]
- Norby, R.J.; Wullschleger, S.D.; Gunderson, C.A.; Johnson, D.W.; Ceulemans, R. Tree responses to rising CO2 in field experiments: Implications for the future forest. Plant Cell Environ. 1999, 22, 683–714. [Google Scholar] [CrossRef]
- Matamala, R.; Gonzàlez-Meler, M.A.; Jastrow, J.D.; Norby, R.J.; Schlesinger, W.H. Impacts of fine root turnover on forest NPP and soil C sequestration potential. Science 2003, 302, 1385–1387. [Google Scholar] [CrossRef]
- Wilson, K.B.; Carlson, T.N.; Bunce, J.A. Feedback significantly influences the simulated effect of CO2 on seasonal evapotranspiration from two agricultural species. Glob. Chang. Biol. 1999, 5, 903–917. [Google Scholar] [CrossRef]
- Liu, C.M.; Zhang, X.Y.; Zhang, Y.Q. Determination of daily evaporation and evapotranspiration of winter wheat and maize by large-scale weighing lysimeter and micro-lysimeter. Agric. For. Meteorol. 2002, 111, 109–120. [Google Scholar] [CrossRef]
- Hammer, G.L.; Dong, Z.S.; McLean, G.; Doherty, A.; Messina, C.; Schusler, J.; Zinselmeier, C.; Paszkiewicz, S.; Cooper, M. Can changes in canopy and/or root system architecture explain historical maize yield trends in the US Corn Belt? Crop Sci. 2009, 49, 299–312. [Google Scholar] [CrossRef]
- Wall, G.W.; Brooks, T.J.; Adam, R.; Cousins, A.B.; Kimball, B.A.; Pinter, P.J.; LaMorte, R.L.; Triggs, J.; Ottman, M.J.; Leavitt, S.W.; et al. Elevated atmospheric CO2 improved sorghum plant water status by ameliorating the adverse effects of drought. New Phytol. 2001, 152, 231–248. [Google Scholar] [CrossRef]
Figure 1.
(a) Schematic diagram and (b) photographs of the coupled device with climate chamber and weighing lysimeters.
Figure 1.
(a) Schematic diagram and (b) photographs of the coupled device with climate chamber and weighing lysimeters.

Figure 2.
Daily variations in (a) carbon dioxide (CO2) concentrations; (b) temperature and (c) relative humidity under current and elevated CO2 (eCO2) treatments.
Figure 2.
Daily variations in (a) carbon dioxide (CO2) concentrations; (b) temperature and (c) relative humidity under current and elevated CO2 (eCO2) treatments.

Figure 3.
Depth distribution of δ2H, δ18O, and deuterium excess (d-excess) at seedling (a–c), jointing (d–f), tasseling (g–i), and filling (j–l) growth stages of maize under current and eCO2 treatments, respectively.
Figure 3.
Depth distribution of δ2H, δ18O, and deuterium excess (d-excess) at seedling (a–c), jointing (d–f), tasseling (g–i), and filling (j–l) growth stages of maize under current and eCO2 treatments, respectively.


Figure 4.
Isotopic values of stem water, irrigation water, and soil water in different layers under (a) current and (b) eCO2 treatments, respectively.
Figure 4.
Isotopic values of stem water, irrigation water, and soil water in different layers under (a) current and (b) eCO2 treatments, respectively.

Figure 5.
Seasonal variations in the (a) transpiration rate (Tr), (b) net photosynthetic rate (Pn), (c) leaf area index (LAI), and (d) leaf water use efficiency (WUEL) of maize at different growth stages under current and eCO2 treatments, respectively.
Figure 5.
Seasonal variations in the (a) transpiration rate (Tr), (b) net photosynthetic rate (Pn), (c) leaf area index (LAI), and (d) leaf water use efficiency (WUEL) of maize at different growth stages under current and eCO2 treatments, respectively.

Figure 6.
Proportions of soil water contribution in each layer at different growth stages under (a) current and (b) eCO2 treatments, respectively.
Figure 6.
Proportions of soil water contribution in each layer at different growth stages under (a) current and (b) eCO2 treatments, respectively.


Table 1.
The growth stages and application of irrigation and fertilizer for maize under current and elevated CO2 (eCO2) treatments.
Table 1.
The growth stages and application of irrigation and fertilizer for maize under current and elevated CO2 (eCO2) treatments.
| Stage | Days after Sowing | Amount of Irrigation (mm) | Fertilizer | ||
|---|---|---|---|---|---|
| Current | eCO2 | Type | Amount (kg ha−1) | ||
| Seedling | 0–32 | 0–33 | 20 | Urea | 300 |
| Jointing | 33–64 | 34–66 | 60 | None | None |
| Tasseling | 65–79 | 67–82 | 60 | Urea | 300 |
| Filling | 80–103 | 83–105 | None | None | None |
| Maturity | 104–125 | 106–126 | 60 | None | None |
Table 2.
Correlation analysis between proportions of soil water contribution in different layers and ecophysiological indices of maize during the seedling to filling growth period under current and eCO2 treatments.
Table 2.
Correlation analysis between proportions of soil water contribution in different layers and ecophysiological indices of maize during the seedling to filling growth period under current and eCO2 treatments.
| Proportions in Each Layer | Tr | Pn | LAI | WUEL | ||||
|---|---|---|---|---|---|---|---|---|
| Current | eCO2 | Current | eCO2 | Current | eCO2 | Current | eCO2 | |
| 0–20 cm | −0.84 ** | 0.00 | −0.92 ** | 0.00 | −0.91 ** | −0.14 | 0.64 * | 0.00 |
| 20–40 cm | 0.00 | −0.54 * | 0.01 | −0.58 * | −0.01 | −0.88 ** | 0.00 | −0.05 |
| 40–80 cm | 0.53 * | 0.00 | 0.61 * | 0.00 | 0.83 * | 0.09 | −0.38 | 0.01 |
| 80–140 cm | −0.06 | 0.67 * | −0.01 | 0.67 * | 0.00 | 0.58 * | 0.13 | 0.01 |
| 140–250 cm | 0.69 * | 0.82 ** | 0.60 * | 0.72 ** | 0.60 * | 0.60 * | −0.73 ** | −0.03 |
Note: * Significant level p < 0.05, ** Significant level p < 0.01. Bold front represents the significant correlation (p < 0.05).
Publisher’s Note: MDPI stays neutral with regard to jurisdictional claims in published maps and institutional affiliations. |
© 2020 by the authors. Licensee MDPI, Basel, Switzerland. This article is an open access article distributed under the terms and conditions of the Creative Commons Attribution (CC BY) license (http://creativecommons.org/licenses/by/4.0/).
Share and Cite
MDPI and ACS Style
Ma, Y.; Wu, Y.; Song, X. How Elevated CO2 Shifts Root Water Uptake Pattern of Crop? Lessons from Climate Chamber Experiments and Isotopic Tracing Technique. Water 2020, 12, 3194. https://doi.org/10.3390/w12113194
AMA Style
Ma Y, Wu Y, Song X. How Elevated CO2 Shifts Root Water Uptake Pattern of Crop? Lessons from Climate Chamber Experiments and Isotopic Tracing Technique. Water. 2020; 12(11):3194. https://doi.org/10.3390/w12113194
Chicago/Turabian StyleMa, Ying, Yali Wu, and Xianfang Song. 2020. "How Elevated CO2 Shifts Root Water Uptake Pattern of Crop? Lessons from Climate Chamber Experiments and Isotopic Tracing Technique" Water 12, no. 11: 3194. https://doi.org/10.3390/w12113194
Note that from the first issue of 2016, this journal uses article numbers instead of page numbers. See further details here.