The Hydro-Isostatic Rebound Related to Megalake Chad (Holocene, Africa): First Numerical Modelling and Significance for Paleo-Shorelines Elevation


Abstract
:1. Introduction
2. Materials and Methods
2.1. Case Study: Megalake Chad
2.2. Modelling
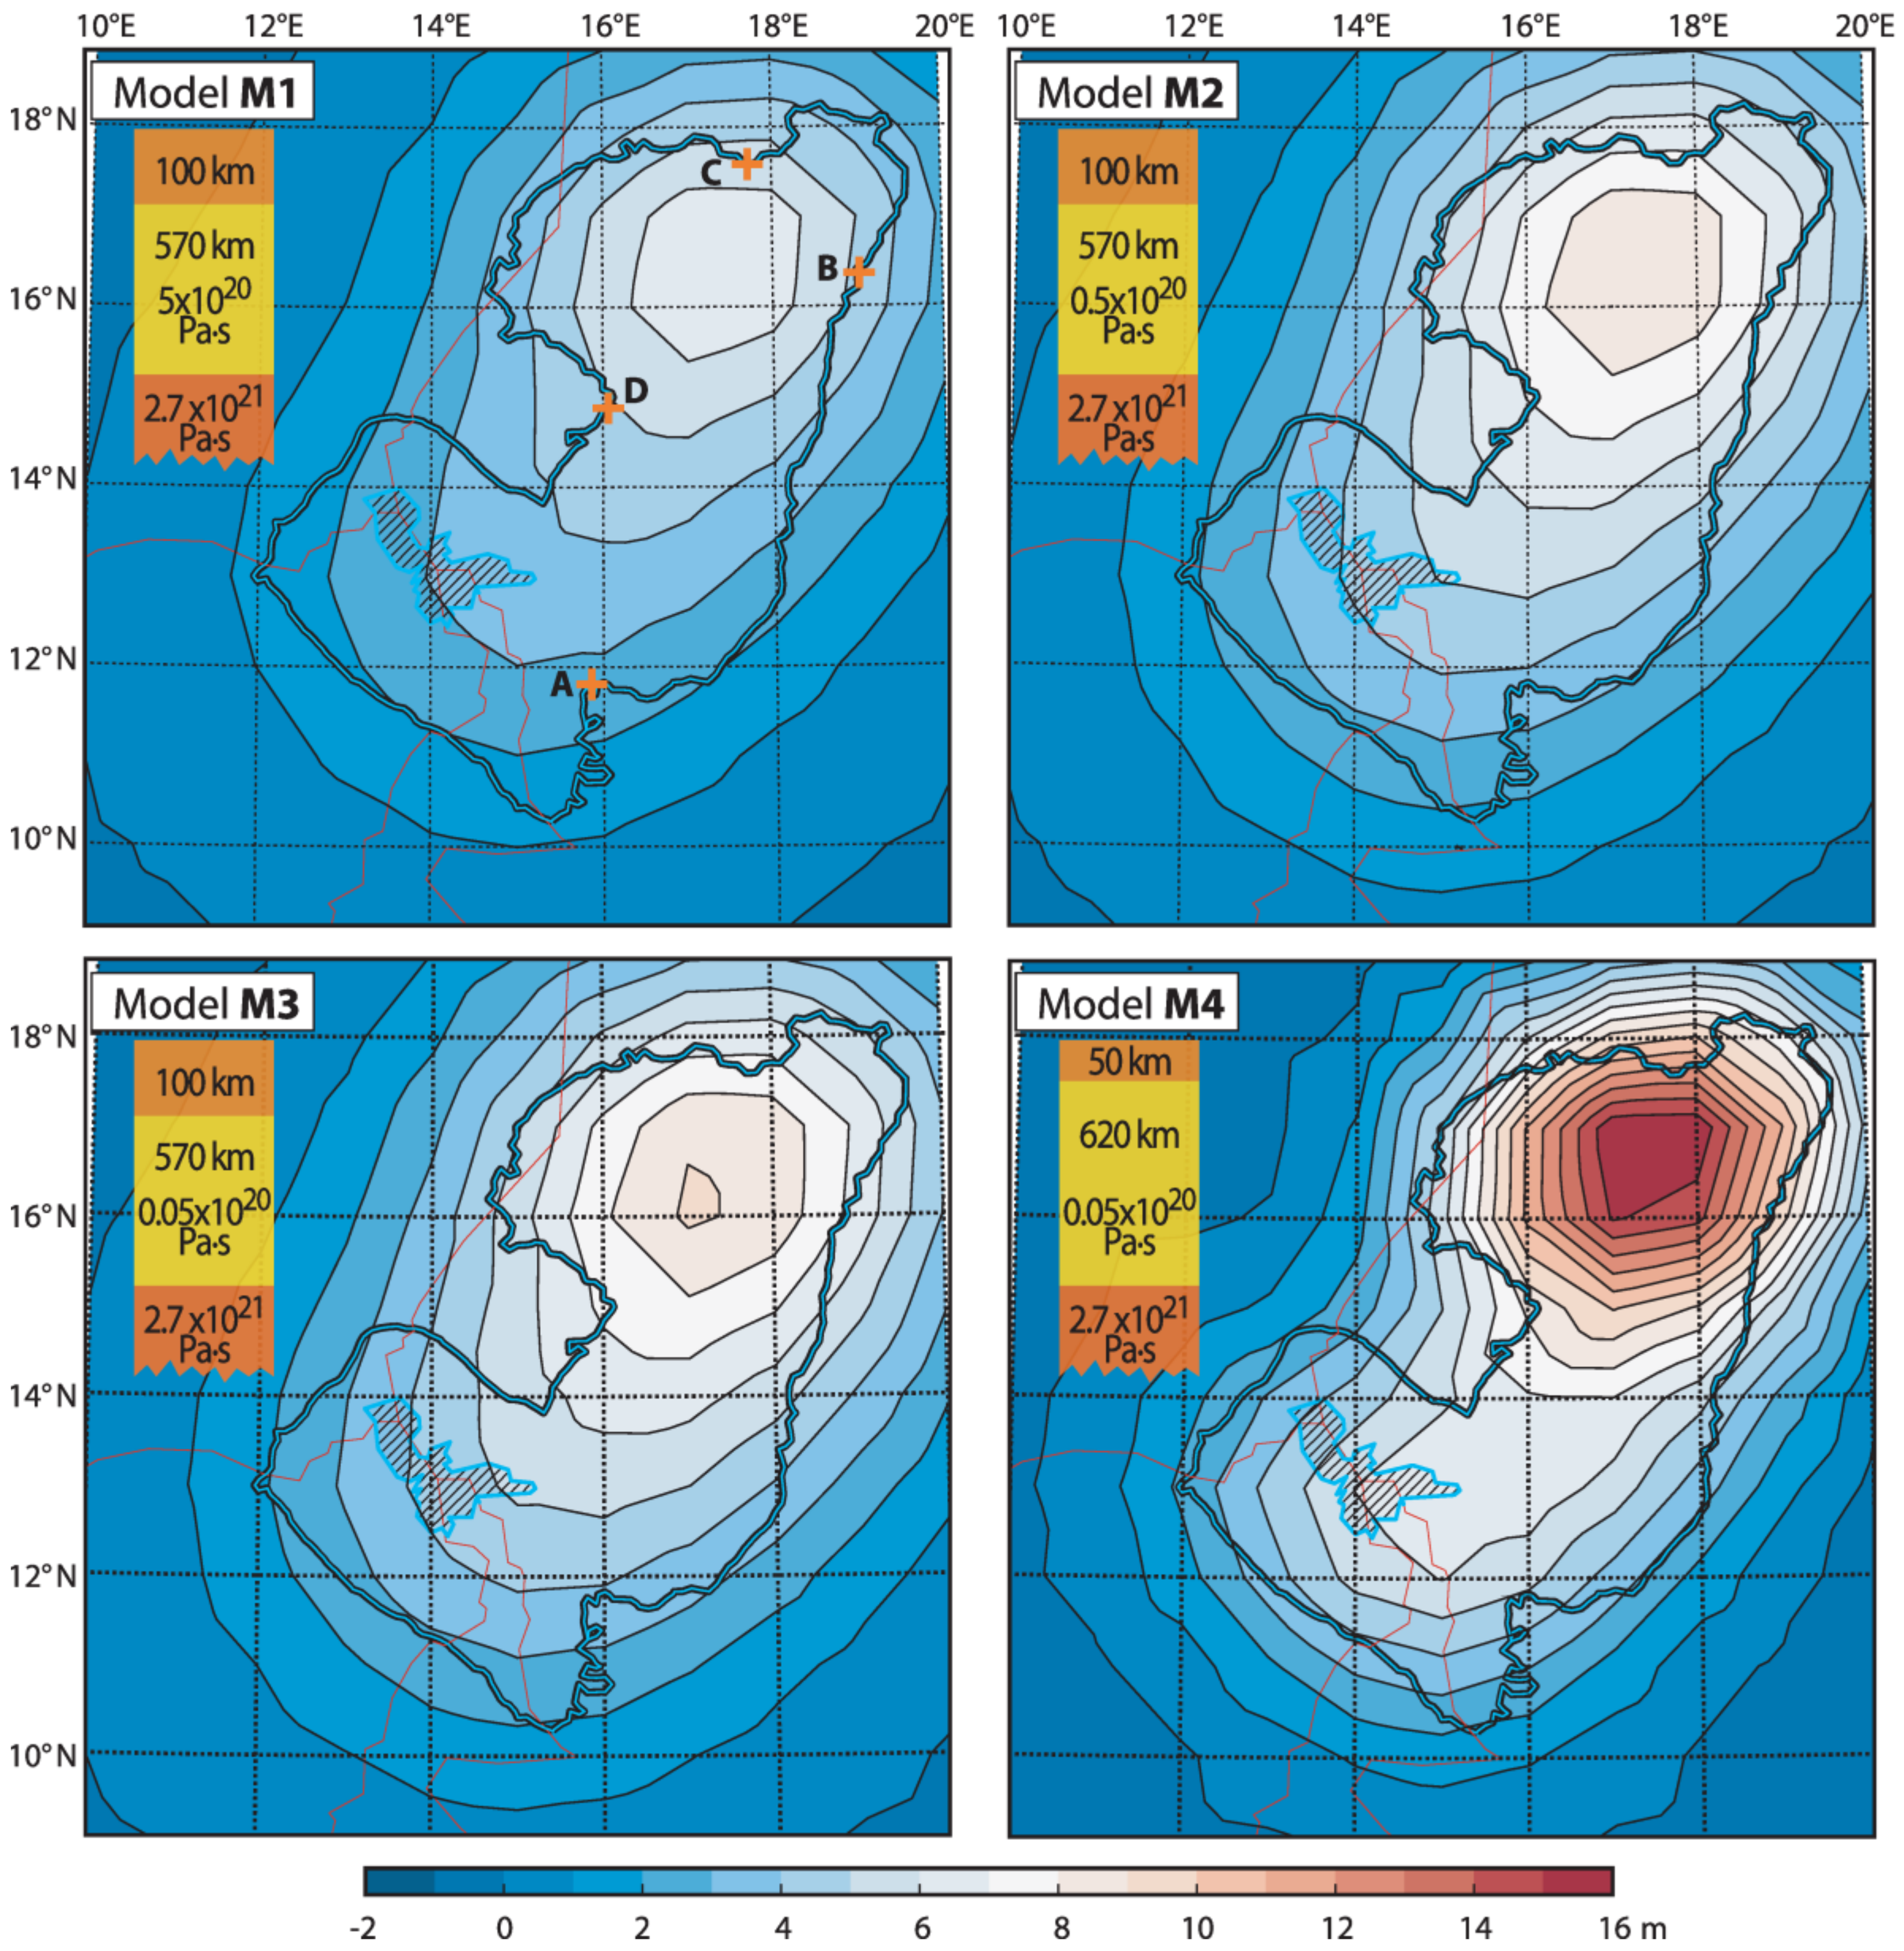
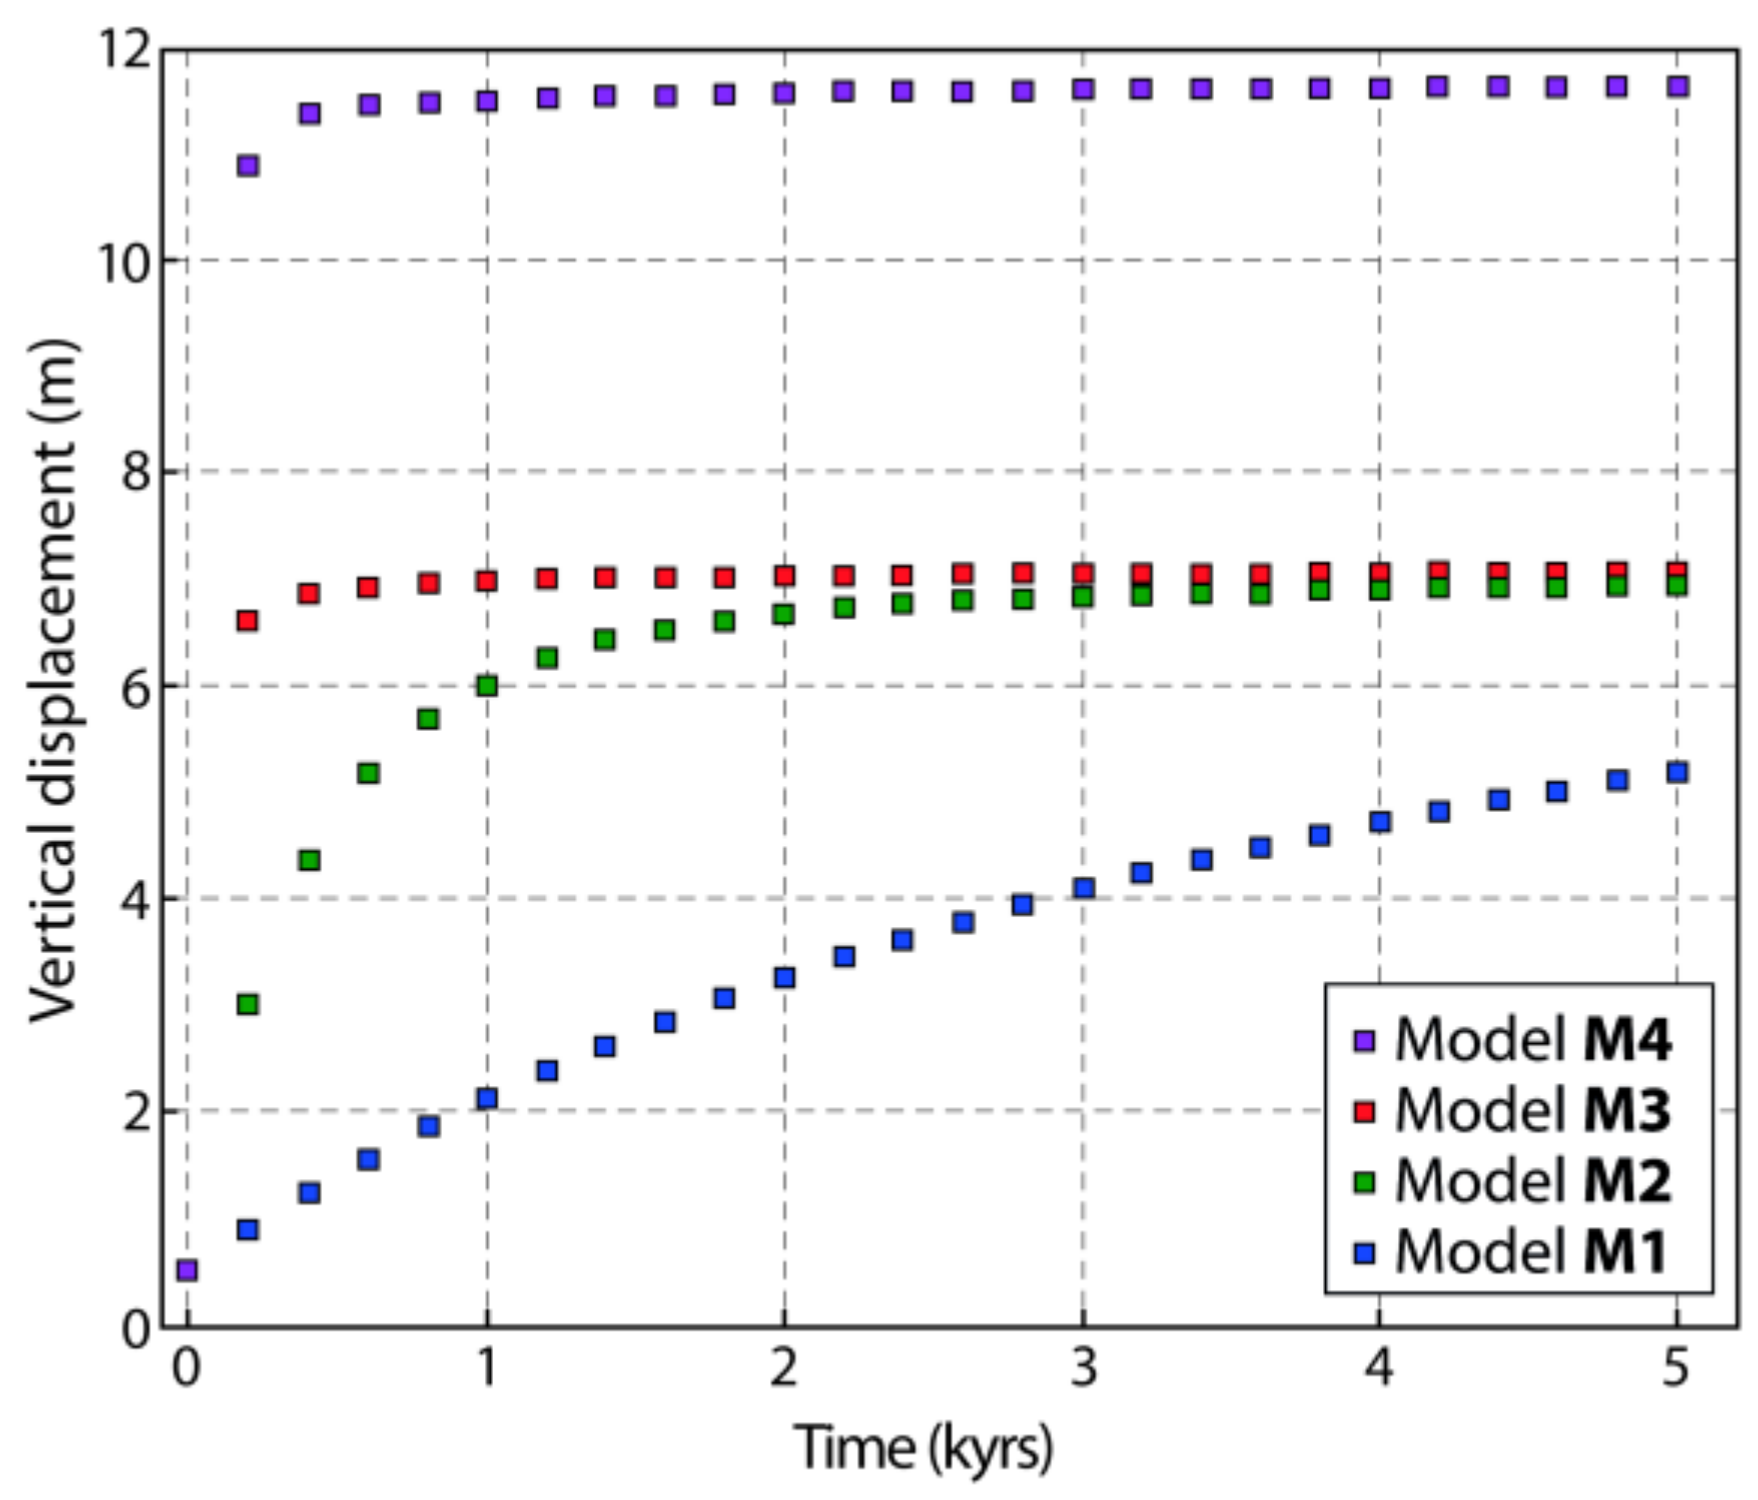
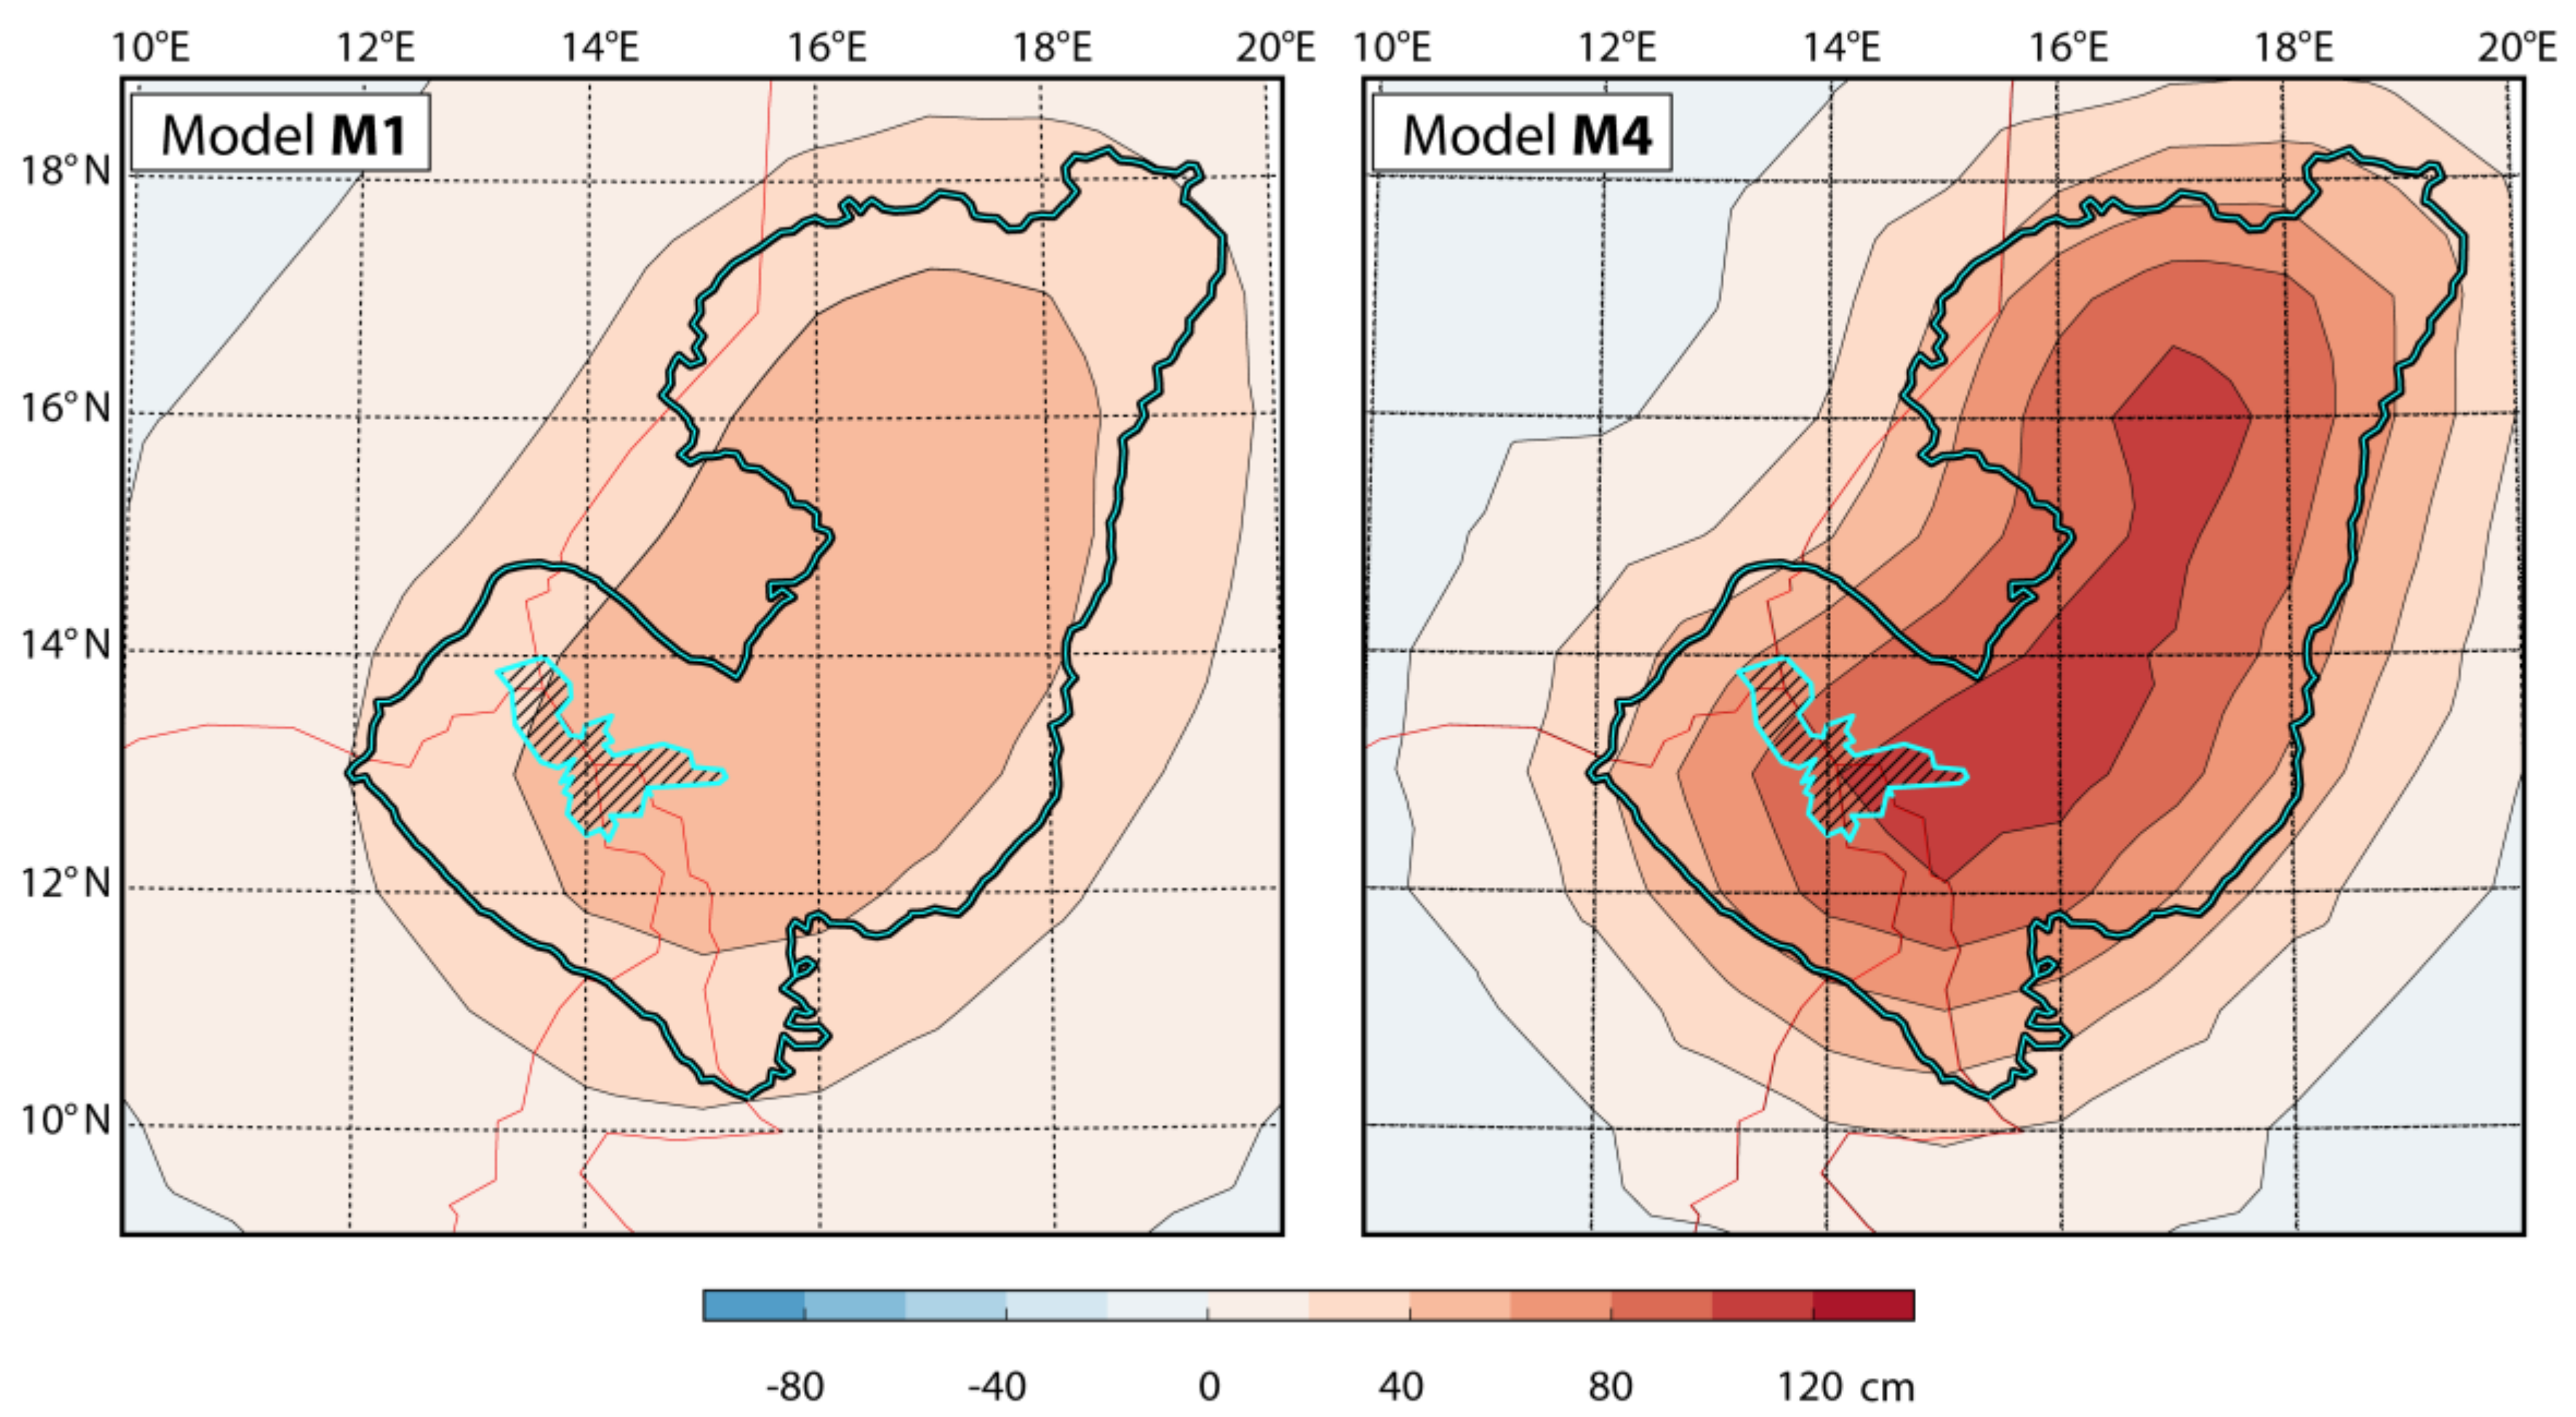
3. Results
4. Discussion
4.1. Mayo Kebbi Spillway
4.2. Chari River Delta Area
4.3. North-Bodélé/Angamma Deltaic Complex
4.4. Kanem Dune Field Area
4.5. Perspectives and Improvements
5. Conclusions
Author Contributions
Funding
Acknowledgments
Conflicts of Interest
References
- Rayburn, J.A.; Teller, J.T. Isostatic rebound in the northwestern part of the Lake Agassiz basin: Isobase changes and overflow. Palaeogeogr. Palaeoclimatol. Palaeoecol. 2007, 246, 23–30. [Google Scholar] [CrossRef]
- Fraser, C.; Hill, P.R.; Allard, M. Morphology and facies architecture of a falling sea level strandplain, Umiujaq, Hudson Bay, Canada. Sedimentology 2005, 52, 141–160. [Google Scholar] [CrossRef]
- Nutz, A.; Ghienne, J.F.; Schuster, M.; Roquin, C.; Raynal, O.; Bouchette, F.; Duringer, P.; Cousineau, P.A. Seismic-stratigraphic record of a deglaciation sequence:from the marine Laflamme Gulf to Lake Saint-Jean (late Quaternary, Québec, Canada). Boreas 2014, 43, 309–329. [Google Scholar] [CrossRef]
- Nutz, A.; Ghienne, J.F.; Schuster, M.; Dietrich, P.; Roquin, C.; Hay, M.B.; Bouchette, F.; Cousineau, P.A. Forced regressive deposits of a deglaciation sequence: Example from the Late Quaternary succession in the Lake Saint-Jean basin (Québec, Canada). Sedimentology 2015, 62, 1573–1610. [Google Scholar] [CrossRef]
- Dietrich, P.; Ghienne, J.F.; Schuster, M.; Lajeunesse, P.; Nutz, A.; Deschamps, R.; Roquin, C.; Duringer, P. From outwash to coastal systems in the Portneuf-Forestville deltaic complex (Québec North Shore): Anatomy of a forced regressive deglacial sequence. Sedimentology 2017, 64, 1044–1078. [Google Scholar] [CrossRef]
- Peltier, W.R. Global sea level rise and glacial isostatic adjustment: An analysis of data from the East Coast of North America. Geophys. Res. Lett. 1996, 23, 717–720. [Google Scholar] [CrossRef]
- Peltier, W.R.; Drummond, R. Rheological stratification of the lithosphere: A direct inference based upon the geodetically observed pattern of the glacial isostatic adjustment of the North American continent. Geophys. Res. Lett. 2008, 35, L16314. [Google Scholar] [CrossRef]
- Mémin, A.; Spada, G.; Boy, J.P.; Rogister, Y.; Hinderer, J. Decadal geodetic variations in Ny-Alesund (Svalbard): Role of past and present ice-mass change. Geophys. J. Int. 2014, 198, 285–297. [Google Scholar] [CrossRef] [Green Version]
- Tarasov, L.; Dyke, A.; Neal, R.; Peltier, W. A data-calibrated distribution of deglacial chronologies for the North American ice complex from glaciological modeling. Earth Planet. Sci. Lett. 2012, 315–316, 30–40. [Google Scholar] [CrossRef]
- Bartol, J.; Govers, R. Flexure due to the Messinian-Pontian sea level drop in the Black Sea. Geochem. Geophys. Geosyst. 2009, 10, Q10013. [Google Scholar] [CrossRef] [Green Version]
- Pekar, S.F.; Christie-Blick, N.; Kominz, M.A.; Miller, K.G. Calibration between eustatic estimates from backstripping and oxygen isotopic records for the Oligocene. Geology 2002, 30, 903–906. [Google Scholar] [CrossRef]
- Crittenden, M.D. New data on the isostatic deformation of Lake Bonneville. Geol Surv. Prof. Pap. 1963, 454-E, 1–31. [Google Scholar]
- Bloom, A.L. Pleistocene shorelines: A new test of isostasy. Geol. Soc. Am. Bull. 1967, 78, 1477–1494. [Google Scholar] [CrossRef]
- Nakiboglu, S.M.; Lambeck, K. A study of the Earth’s response to surface loading with application to Lake Bonneville. Geophys. J. Int. 1982, 70, 577–620. [Google Scholar] [CrossRef]
- Bills, B.G.; May, G.M. Lake Bonneville: Constraints on lithospheric thickness and upper mantle viscosity from isostatic warping of Bonneville, Provo, and Gilbert stage shorelines. J. Geophys. Res. 1987, 92, 11493–11508. [Google Scholar] [CrossRef]
- May, G.; Bills, B.; Hodge, D. Far-field flexural response of Lake Bonneville from paleopluvial lake elevations. Phys. Earth Planet. In. 1991, 68, 274–284. [Google Scholar] [CrossRef]
- Bills, B.G. Hydro-isostatic deflection and tectonic tilting in the central Andes: Initial results of a GPS survey of Lake Minchin. Geophys. Res. Lett. 1994, 21, 293–296. [Google Scholar] [CrossRef]
- Bills, B.G.; Currey, D.R.; Marshall, G.A. Viscosity estimates for the crust and upper mantle from patterns of lacustrine shoreline deformation in the Great Basin. J. Geophys. Res. 1994, 99, 22059–22086. [Google Scholar] [CrossRef]
- Adams, K.D.; Wesnousky, S.G.; Bills, B.G. Isostatic rebound, active faulting, and potential geomorphic effects in the Lake Lahontan basin, Nevada and California. Geol. Soc. Am. Bull. 1999, 111, 1739–1756. [Google Scholar] [CrossRef]
- Kaufmann, G.; Amelung, F. Reservoir-induced deformation and continental rheology in vicinity of Lake Mead, Nevada. J. Geophys. Res. 2000, 105, 16341–16358. [Google Scholar] [CrossRef]
- Caskey, S.J.; Ramelli, A.R. Tectonic displacement and far-field isostatic flexure of pluvial lake shorelines, Dixie Valley, Nevada. J. Geodyn. 2004, 38, 131–145. [Google Scholar] [CrossRef]
- Leverington, D.W.; Ghent, R.R. Differential subsidence and rebound in response to changes in water loading on Mars: Possible effects on the geometry of ancient shorelines. J. Geophys. Res. 2004, 109, E01005. [Google Scholar] [CrossRef]
- Steffen, H.; Kaufmann, G. Numerical modelling of deformation changes induced by lake-level fluctuations of the Hohenwarte reservoir, Thuringia, Germany. J. Geodyn. 2006, 41, 411–421. [Google Scholar] [CrossRef]
- Bills, B.G.; Adams, K.D.; Wesnousky, S.G. Viscosity structure of the crust and upper mantle in western Nevada from isostatic rebound patterns of the late Pleistocene Lake Lahontan high shoreline. J. Geophys. Res. 2007, 112, 1–18. [Google Scholar] [CrossRef] [Green Version]
- Melnick, D.; Garcin, Y.; Quinteros, J.; Strecker, M.R.; Olago, D.; Tiercelin, J.J. Steady rifting in northern Kenya inferred from deformed Holocene lake shorelines of the Suguta and Turkana basins. Earth Planet. Sci. Lett. 2012, 331–332, 335–346. [Google Scholar] [CrossRef]
- England, P.C.; Walker, R.T.; Fu, B.; Floyd, M.A. A bound on the viscosity of the Tibetan crust from the horizontality of palaeolake shorelines. Earth Planet. Sci. Lett. 2013, 375, 44–56. [Google Scholar] [CrossRef] [Green Version]
- Adams, K.D.; Bills, B.G. Isostatic rebound and palinspastic restoration of the Bonneville and Provo shorelines in the Bonneville Basin, UT, NV, and ID. In Lake Bonneville: A Scientific Update; Oviatt, C.G., Shroder, J., Jr., Eds.; Elsevier: Amsterdam, The Netherlands, 2016; Volume 20, pp. 145–164. [Google Scholar]
- Ghienne, J.F.; Schuster, M.; Bernard, A.; Duringer, P.; Brunet, M. The Holocene giant Lake Chad revealed by digital elevation models. Quat. Int. 2002, 87, 81–85. [Google Scholar] [CrossRef]
- Schuster, M.; Roquin, C.; Brunet, M.; Duringer, P.; Fontugne, M.; Mackaye, H.T.; Vignaud, P.; Ghienne, J.F. Highlighting Holocene Lake Mega-Chad paleoshorelines from space. Quat. Sci. Rev. 2005, 24, 1821–1827. [Google Scholar] [CrossRef]
- Pias, J.; Guichard, E. Origine et conséquences de l’existence d’un cordon sableux dans la partie sud-ouest de la cuvette tchadienne. C. R. Acad. Sci. 1957, 244, 791–793. [Google Scholar]
- Pias, J. Chronologie du dépôt des sédiments tertiaires et quaternaires dans la cuvette tmadienne (République du Tchad). C. R. Acad. Sci. 1967, 264, 2432–2435. [Google Scholar]
- Schneider, J.L. Evolution du dernier lacustre et peuplement préhistorique aux Pays Bas du Tchad. Bull. Asequa 1967, 14–15, 203–215. [Google Scholar]
- Servant, M.; Ergenzinger, P.; Coppens, Y. Datations absolues sur un delta lacustre quaternaire au Sud du Tibesti (Angamma). C. R. Somm. Soc. Geol. Fr. 1969, 8, 313–314. [Google Scholar]
- Ergenzinger, P.J. Das Gebiet des Enneri Misky im Tibesti Gebirge, République du Tchad. Erlauterungen zu einer Geomorphologischen Karte 1:200000. Berl. Geogr. Abh. 1978, 23, 71. [Google Scholar]
- Farr, T.G.; Kobrick, M. Shuttle radar topography mission produces a wealth of data. Eos 2000, 81, 583–585. [Google Scholar] [CrossRef]
- Schuster, M.; Duringer, P.; Ghienne, J.F.; Bernard, A.; Brunet, M.; Vignaud, P.; Mackaye, H.T. The Holocene Lake Mega-Chad: Extension, dynamic and palaeoenvironmental implications since upper Miocene. In Proceedings of the European Union of Geosciences XI, Strasbourg, France, 8–12 April 2001. Abstract book and CDROM, 2001, 177. [Google Scholar]
- Schuster, M.; Duringer, P.; Ghienne, J.F.; Vignaud, P.; Beauvilain, A.; Mackaye, H.T.; Brunet, M. Coastal conglomerate around the Hadjer el Khamis inselbergs (western Chad, central Africa): New evidence for Lake Mega-Chad episodes. Earth Surf. Proc. Land. 2003, 28, 1059–1069. [Google Scholar] [CrossRef]
- Drake, N.; Bristow, C. Shorelines in the Sahara: Geomorphological evidence for an enhanced monsoon from palaeolake Megachad. Holocene 2006, 6, 901–911. [Google Scholar] [CrossRef]
- Leblanc, M.; Favreau, G.; Maley, J.; Nazoumou, Y.; Leduc, C.; Van Oevelen, P.J.; Stagnitti, F. Reconstruction of Megalake Chad using shuttle radar topographic mission data. Palaeogeogr. Palaeoclimatol. Palaeoecol. 2006, 239, 16–27. [Google Scholar] [CrossRef]
- Schuster, M.; Duringer, P.; Ghienne, J.F.; Roquin, C.; Sepulchre, P.; Moussa, A.; Lebatard, A.E.; Mackaye, H.T.; Likius, A.; Vignaud, P.; et al. Chad Basin: Paleoenvironments of the Sahara since the late Miocene. C. R. Geosci. 2009, 341, 612–620. [Google Scholar] [CrossRef] [Green Version]
- Bouchette, F.; Schuster, M.; Ghienne, J.F.; Denamiel, C.; Roquin, C.; Moussa, A.; Duringer, P. Hydrodynamics in the Holocene Lake Mega-Chad. Quat. Res. 2010, 73, 226–236. [Google Scholar] [CrossRef]
- Schuster, M.; Roquin, C.; Durand, A.; Moussa, A.; Ghienne, J.F.; Allenbach, B.; Duringer, P.; Bouchette, F. Shorelines of the Holocene Megalake Chad (Africa, Sahara) investigated with very high resolution satellite imagery (Pléiades): Example of the Goz Kerki paleo-spit. Rev. Fr. Photogr. Teledetect. 2014, 208, 63–68. [Google Scholar]
- Armitage, S.J.; Bristow, C.S.; Drake, N.A. West African monsoon dynamics inferred from abrupt fluctuations of Lake Mega-Chad. Proc. Natl. Acad. Sci. USA 2015, 112, 8543–8548. [Google Scholar] [CrossRef] [PubMed] [Green Version]
- Burke, K. The Chad Basin: An active intra-continental basin. Tectonophysics 1976, 36, 197–206. [Google Scholar] [CrossRef]
- Begg, G.C.; Griffin, W.L.; Natapov, L.M.; O’Reilly, S.Y.; Grand, S.P.; O’Neill, C.J.; Hronsky, J.M.A.; Poudjom Djomani, Y.; Swain, C.J.; Deen, T.; et al. The lithospheric architecture of Africa: Seismic tomography, mantle petrology, and tectonic evolution. Geosphere 2009, 5, 23–50. [Google Scholar] [CrossRef]
- Pérez-Gussinyé, M.; Metois, M.; Fernandez, M.; Vergés, J.; Fullea, J.; Lowry, A.R. Effective elastic thickness of Africa and its relationship to other proxies for lithospheric structure and surface tectonics. Earth Planet. Sc. Lett. 2009, 287, 152–167. [Google Scholar] [CrossRef]
- deMenocal, P.B.; Tierney, J.E. Green Sahara: African humid periods paced by Earth’s orbital changes. Nat. Educ. Knowl. 2012, 3, 12. [Google Scholar]
- Bard, E. Out of the African humid period. Science 2013, 342, 808–809. [Google Scholar] [CrossRef]
- Pachur, H.J.; Kröpelin, S. Wadi Howar: Paleoclimatic evidence from an extinct river system in the Southeastern Sahara. Science 1987, 237, 298–300. [Google Scholar] [CrossRef] [Green Version]
- Paillou, P.; Schuster, M.; Tooth, S.; Farr, T.; Rosenqvist, A.; Lopez, S.; Malézieux, J.M. Mapping of a major paleodrainage system in Eastern Libya using orbital imaging Radar: The Kufrah River. Earth Planet. Sc. Lett. 2009, 277, 327–333. [Google Scholar] [CrossRef]
- Quade, J.; Dente, E.; Armon, M.; Ben Dor, Y.; Morin, E.; Adam, O.; Enzel, Y. Megalakes in the Sahara? A Review. Quat. Res. 2018, 90, 253–275. [Google Scholar] [CrossRef]
- Faure, H. Lacs quaternaires du Sahara. Int. Ver. Für Theor. Und Angew. Limnol.: Mitt. 1969, 17, 131–146. [Google Scholar] [CrossRef]
- Damnati, B. Holocene lake record in the Northern Hemisphere of Africa. J. Afr. Earth Sci. 2000, 31, 253–262. [Google Scholar] [CrossRef]
- Kuper, R.; Kröpelin, S. Climate-Controlled Holocene occupation in the Sahara: Motor of Africa’s Evolution. Science 2006, 313, 803–807. [Google Scholar] [CrossRef] [PubMed] [Green Version]
- Kröpelin, S.; Verschuren, D.; Lézine, A.M.; Eggermont, H.; Cocquyt, C.; Francus, P.; Cazet, J.P.; Fagot, M.; Rumes, B.; Russell, J.M.; et al. Climate-Driven ecosystem succession in the Sahara: The Past 6000 years. Science 2008, 320, 765–768. [Google Scholar] [CrossRef] [PubMed] [Green Version]
- Sereno, P.C.; Garcea, E.A.A.; Jousse, H.; Stojanowski, C.M.; Saliège, J.F.; Maga, A.; Ide, O.A.; Knudson, K.J.; Mercuri, A.M.; Stafford, T.W., Jr.; et al. Lakeside cemeteries in the Sahara: 5000 years of Holocene population and environmental change. PLoS ONE 2008, 3, e2995. [Google Scholar] [CrossRef] [PubMed]
- Nutz, A.; Schuster, M.; Ghienne, J.F.; Roquin, C.; Bouchette, F. Wind-driven waterbodies: A new category of lake within an alternative sedimentologically-based lake classification. J. Paleolimnol. 2018, 59, 189–199. [Google Scholar] [CrossRef]
- Maley, J. Palaeoclimates of Central Sahara during the early Holocene. Nature 1977, 269, 573–577. [Google Scholar] [CrossRef]
- Spada, G. The Theory Behind TABOO; Samizdat Press: Golden, CO, USA, 2003; p. 108. Available online: https://samizdat.mines.edu/the-taboo-post-glacial-rebound-calculator-by-giorgio-spada/ (accessed on 10 November 2020).
- Spada, G. TABOO User Guide; Samizdat Press: Golden, CO, USA, 2003; p. 120. Available online: https://samizdat.mines.edu/the-taboo-post-glacial-rebound-calculator-by-giorgio-spada/ (accessed on 10 November 2020).
- Farrell, W.E. Deformation of the Earth by surface loads. Rev. Geophys. Space Phys. 1972, 10, 761–797. [Google Scholar] [CrossRef]
- Peltier, W.R. The impulse response of a Maxwell Earth. Rev. Geophys. Space Phys. 1974, 12, 649–669. [Google Scholar] [CrossRef]
- Dziewonski, A.M.; Anderson, D.L. Preliminary reference Earth model. Phys. Earth Planet. Inter. 1981, 25, 297–356. [Google Scholar] [CrossRef]
- Peltier, W.R. Global glacial isostasy and the surface of the Ice-Age Earth: The ICE-5G (VM2) Model and GRACE. Ann. Rev. Earth. Planet. Sci. 2004, 32, 111–149. [Google Scholar] [CrossRef]
- Deniel, C.; Vincent, P.M.; Beauvilain, A.; Gourgaud, A. The Cenozoic volcanic province of Tibesti (Sahara of Chad): Major units, chronology, and structural features. B. Volcanol. 2015, 77, 1–21. [Google Scholar] [CrossRef]
- Durand, A. Oscillations of Lake Chad over the past 50000 years: New data and hypothesis. Palaeogeogr. Palaeoclimatol. Palaeoecol. 1982, 16, 37–53. [Google Scholar] [CrossRef]
- Costas, S.; Ferreira, Ó.; Plomaritis, T.A.; Leorri, E. Coastal barrier stratigraphy for Holocene high-resolution sea-level reconstruction. Sci. Rep. 2016, 6, 38726. [Google Scholar] [CrossRef] [PubMed] [Green Version]


| Earth Models | Lithosphere | Upper Mantle | Lower Mantle | ||
|---|---|---|---|---|---|
| L (km) | T (km) | η (1020Pa·s) | T (km) | η (1021 Pa·s) | |
| M1 | 100 | 570 | 5 | 2221 | 2.7 |
| M2 | 100 | 570 | 0.5 | 2221 | 2.7 |
| M3 | 100 | 570 | 0.05 | 2221 | 2.7 |
| M4 | 50 | 620 | 0.05 | 2221 | 2.7 |
| Dourbali Lobe of the Chari River Delta | North-Bodélé/Angamma Deltaic Complex | Goz Kerki Sand Spit | ||
|---|---|---|---|---|
| Elevation of the strandplain | 330 to 333 m asl | 340 to 347 m asl | 332 to 337 m asl | |
| Elevation of the late, singular beach ridges | poorly defined, no value | ca. 338 m | ca. 330 m | |
| Differential isostatic uplift relative to Mayo Kebbi (±1 m) | M1 | 1.5 m | 4.5 m | 4 m |
| M3 | 2 m | 6 m | 4.5 m | |
| M4 | 3.5 m | 10.5 m | 8.5 m | |
| Expected present-day elevation of past MLC shorelines if once adjusted to that of the spillway (325 m asl) | M1 | 326.5 m | 329.5 m | 329 m |
| M4 | 328.5 m | 335.5 m | 333.5 m | |
| Residual mismatch | M1 | >3.5 m | >10.5 m | >3 m |
| M4 | >1.5 m | >4.5 m | potentially no mismatch | |
| Overflow Thickness Above the Spillway | Dourbali Lobe of the Chari River Delta | North-Bodélé/Angamma Deltaic Complex | Goz Kerki Sand Spit | |
|---|---|---|---|---|
| Elevation of the strandplain | - | 330–333 m asl | 340–347 m asl | 332–337 m asl |
| Elevation of the late, singular beach ridges | - | poorly defined, no value | ca. 338 m | ca. 330 m |
| Model M1 Expected present-day elevation of past MLC shorelines | 0 m | 326.5 m | 329.5 m | 329 m |
| 4 m | 330.5 m | 333.5 m | 333 m | |
| 8 m | 334.5 m | 337.5 m | 337 m | |
| Model M3 Expected present-day elevation of past MLC shorelines | 0 m | 327 m | 331 m | 329.5 m |
| 4 m | 331 m | 335 m | 333.5 m | |
| 8 m | 335 m | 339 m | 337.5 m | |
| Model M4 Expected present-day elevation of past MLC shorelines | 0 m | 328.5 m | 335.5 m | 333.5 m |
| 4 m | 332.5 m | 339.5 m | 337.5 m | |
| 8 m | 336.5 m | 343.5 m | 341.5 m |
Publisher’s Note: MDPI stays neutral with regard to jurisdictional claims in published maps and institutional affiliations. |
© 2020 by the authors. Licensee MDPI, Basel, Switzerland. This article is an open access article distributed under the terms and conditions of the Creative Commons Attribution (CC BY) license (http://creativecommons.org/licenses/by/4.0/).
Share and Cite
Mémin, A.; Ghienne, J.-F.; Hinderer, J.; Roquin, C.; Schuster, M. The Hydro-Isostatic Rebound Related to Megalake Chad (Holocene, Africa): First Numerical Modelling and Significance for Paleo-Shorelines Elevation. Water 2020, 12, 3180. https://doi.org/10.3390/w12113180
Mémin A, Ghienne J-F, Hinderer J, Roquin C, Schuster M. The Hydro-Isostatic Rebound Related to Megalake Chad (Holocene, Africa): First Numerical Modelling and Significance for Paleo-Shorelines Elevation. Water. 2020; 12(11):3180. https://doi.org/10.3390/w12113180
Chicago/Turabian StyleMémin, Anthony, Jean-François Ghienne, Jacques Hinderer, Claude Roquin, and Mathieu Schuster. 2020. "The Hydro-Isostatic Rebound Related to Megalake Chad (Holocene, Africa): First Numerical Modelling and Significance for Paleo-Shorelines Elevation" Water 12, no. 11: 3180. https://doi.org/10.3390/w12113180