Article

Probabilistic Groundwater Flow, Particle Tracking and Uncertainty Analysis for Environmental Receptor Vulnerability Assessment of a Coal Seam Gas Project

by
Dennis Gonzalez
1,*,
Sreekanth Janardhanan
2,
Daniel E. Pagendam
3 and
Daniel W. Gladish
3
1
CSIRO Land and Water, Adelaide 5000, Australia
2
CSIRO Land and Water, Brisbane 4000, Australia
3
CSIRO Data61, Brisbane 4000, Australia
*
Author to whom correspondence should be addressed.
Water 2020, 12(11), 3177; https://doi.org/10.3390/w12113177
Submission received: 29 September 2020 / Revised: 1 November 2020 / Accepted: 8 November 2020 / Published: 13 November 2020
(This article belongs to the Section Hydrology)

Abstract

:
The production of coalbed methane, or coal seam gas (CSG) in Australia increased 250-fold since the 1990s to around 1502 petajoules in 2019 and continues to expand. Groundwater flow in the aquifers intersected by gas wells could potentially facilitate a transport pathway for migration of contaminants or poorer quality water from deeper formations. While regulatory and mitigation mechanisms are put in place to minimize the risks, quantitative environmental impact assessments are also undertaken. When many gas wells are drilled in a wide area where many potential receptors are also spatially distributed, potential source-receptor combinations are too numerous to undertake detailed contamination risk assessment using contaminant transport modelling. However, valuable information can be gleaned from the analysis of groundwater flow directions and velocities to inform and prioritise contamination risk assessment and can precede computationally challenging stochastic contaminant transport modelling. A probabilistic particle tracking approach was developed as a computationally efficient screening analysis of contamination pathways for a planned CSG development near Narrabri in northern New South Wales, Australia. Particle tracking was run iteratively with a numerical groundwater flow model across a range of plausible parameter sets to generate an ensemble of estimated flow paths through the main Great Artesian Basin aquifer in the area. Spatial patterns of path lines and spatial relationships with potential receptors including neighbouring groundwater extraction wells and hydrologically connected ecological systems were analysed. Particle velocities ranged from 0.5 to 11 m/year and trajectories indicated dedicated contaminant transport modeling would be ideally focused at the local scale where wells are near potential receptors. The results of this type of analysis can inform the design of monitoring strategies and direct new data collection to reduce uncertainty and improve the effectiveness of adaptive management strategies and early detection of impacts.

1. Introduction

The commercial production of coalbed methane or coal seam gas (CSG) as it is also known began in Australia in the 1990s and has grown from around 2 petajoules (PJ) per year in 1997–1998 to 1502 PJ/year as of December 2019 with a further 31,803 PJ of remaining CSG reserves in Queensland [1]. Gas wells provide a potential pathway for introduced and/or geogenic contaminants to enter intersected aquifers [2,3]. Prediction of contamination pathways is challenging in data sparse areas such as deep coal-bearing sedimentary basins where pre-development monitoring is rare. There is usually high uncertainty in hydrogeological parameters for aquifers and aquitards. To account for uncertainty a probabilistic approach is useful for producing a range of plausible outcomes but is time consuming and costly for contaminant transport modelling. For efficient regional scale screening level assessment of receptor vulnerability and identification and prioritisation of source-receptor combinations that may need detailed analyses, a probabilistic particle tracking method was developed and applied for a CSG project near Narrabri, in northern New South Wales (NSW), Australia, approximately 500 km north-east of Sydney.
This study assessed the vulnerability of specific receptors to contamination from a set of point source locations (CSG wells) the pathways from which could vary according to conceptual and empirical understanding of hydrogeological characteristics and is similar to previous studies in this respect [4,5]. However, the study presented here applied a stochastic approach. This is also distinct from groundwater vulnerability assessments that assume the inherent vulnerability of a groundwater system is dependent on a group of factors that are spatially overlaid to generate a type of vulnerability index. The most common examples of these are based on the ‘DRASTIC’ method originally developed by the United States Environmental Protection Agency [6]. These methods assess relative groundwater vulnerability across an area and are suited to examining diffuse pollution sources particularly those from the ground surface through the vadose zone and into aquifers, as opposed to point sources of contamination [7,8].
In Australia, the majority of CSG development in Queensland has occurred in the Surat Basin and Bowen Basin, both of which form part of the wider Great Artesian Basin (GAB) with the number of new wells drilled peaking at 1634 in 2013–14; 901 additional wells began producing in the 2018–2019 period [1]. The Narrabri Gas Project (NGP) in NSW is within the Gunnedah geological basin which underlies part of the younger Surat Basin and is a sub-unit of the GAB. Overlying the CSG targets, the GAB comprises extensive aquifers with good water quality that have a long history of use for irrigation, stock watering, industrial, domestic and town water supply [9] and support a wide range of groundwater-dependent ecosystems including streams and riparian habitats, springs and wetlands [10]. The sustainability of the GAB aquifers has been increasingly challenged since the beginning of land development with historical over-extraction leading to chronic declines in water tables, associated surface water flows and cases of spring extinction. Further demands from extractive industries are expected to increase pressure on this important asset [10].
CSG-associated contaminants can be introduced externally through drilling muds and hydraulic fracturing fluids where they are used and can also originate as geogenic compounds from within coal formations. The physical and chemical composition of water from within CSG target formations typically has high ionic concentrations (e.g., sodium to 300 mmol/L, chlorine to 100 mmol/L) [11] and various organic compounds that are hazardous to human health and the environment [12]. The health and environmental risks of these chemicals depends largely on their respective load, persistence and toxicity, all influenced by local hydrogeological conditions, e.g., travel times and distances, minerology, and factors affecting chemical and biological degradation potential in the aquifer.
Contaminants can potentially be released directly through well casing or cementing failures, or through inter-aquifer or aquitard leakage particularly near faults and shears as a result of fracture stimulation or over-pressurisation, or through depressurisation of coal seams and compaction that compromises well integrity [2,3]. CSG well barrier or casing failure rates vary internationally. In the United States, failure rates as defined by casing pressure thresholds were estimated at 3.4% from about 1000 wells over 10 years of annual testing. In Australia, compliance auditing from 2010 to 2015 reported no subsurface leaks, and subsurface casing failures rates were determined to be effectively zero after remediation of suspicious cementing during construction that was detected at a rate of 0.3%; surface well head leaks were reported at a rate of 3% and subsequently repaired [2].
Development of contaminant transport models that simulate advection, dispersion, attenuation and transformation processes are computationally expensive. It is also challenging to deploy such models when dealing with numerous, spatially distributed contaminant sources and receptors. Additional complexity arises where there are uncertainties about hydrogeological characteristics; in such circumstances model simulations undertaken for risk assessment should consider a wide range of plausible realizations of groundwater system characteristics. Models then need to be run over multiple iterations to produce a defensible risk assessment. The probabilistic particle tracking method implemented in this study can be used as a screening analysis for assessing the vulnerability of receptors in the region from specific point sources and identify source-receptor combinations that warrant detailed contamination risk assessment.
The mod-PATH3DU package [13] is a modelling library that allows probabilistic predictive analysis of travel paths, times and distances. The mod-PATH3DU package can be used in conjunction with numerical flow models using unstructured grids e.g., MODFLOW-USG [14]. This differs from previous code that was applicable only to regular grid geometry. The variable resolution and cell geometry that is possible with unstructured grids, from a mathematical perspective, enables more precise calculations to be made in areas of interest without sacrificing computational efficiency across the entire model domain. As mod-PATH3DU only simulates advective processes it is computationally efficient for running multiple iterations, at high resolution, across large spatial extents, and over long time series. This enables rapid identification of pathways between potential sources and receptors and assessing the vulnerability of receptors by estimating the likelihood of interception via a flow path through its distance and time. If receptors are identified as vulnerable by this method, targeted contamination risk assessment could apply dedicated transport modelling approaches that account for dilution, dispersion, degradation or sorption processes that may significantly influence final concentrations of contaminants. The effects of dilution and attenuation, particularly over time scales of 10s to 100s of years could be expected to reduce peak concentrations at receptor locations markedly. It is therefore reasonable to conclude that the current study predictions provide a conservative assessment of receptor vulnerability.
The objective of this study was to apply probabilistic particle tracking analyses to assess the vulnerability of numerous, spatially distributed potential environmental and economic receptors (e.g., water bores, springs, and groundwater dependent ecosystems) for a CSG project with 425 planned well pads across an area of 957 km2 near the town of Narrabri in northern NSW, Australia.

2. Materials and Methods

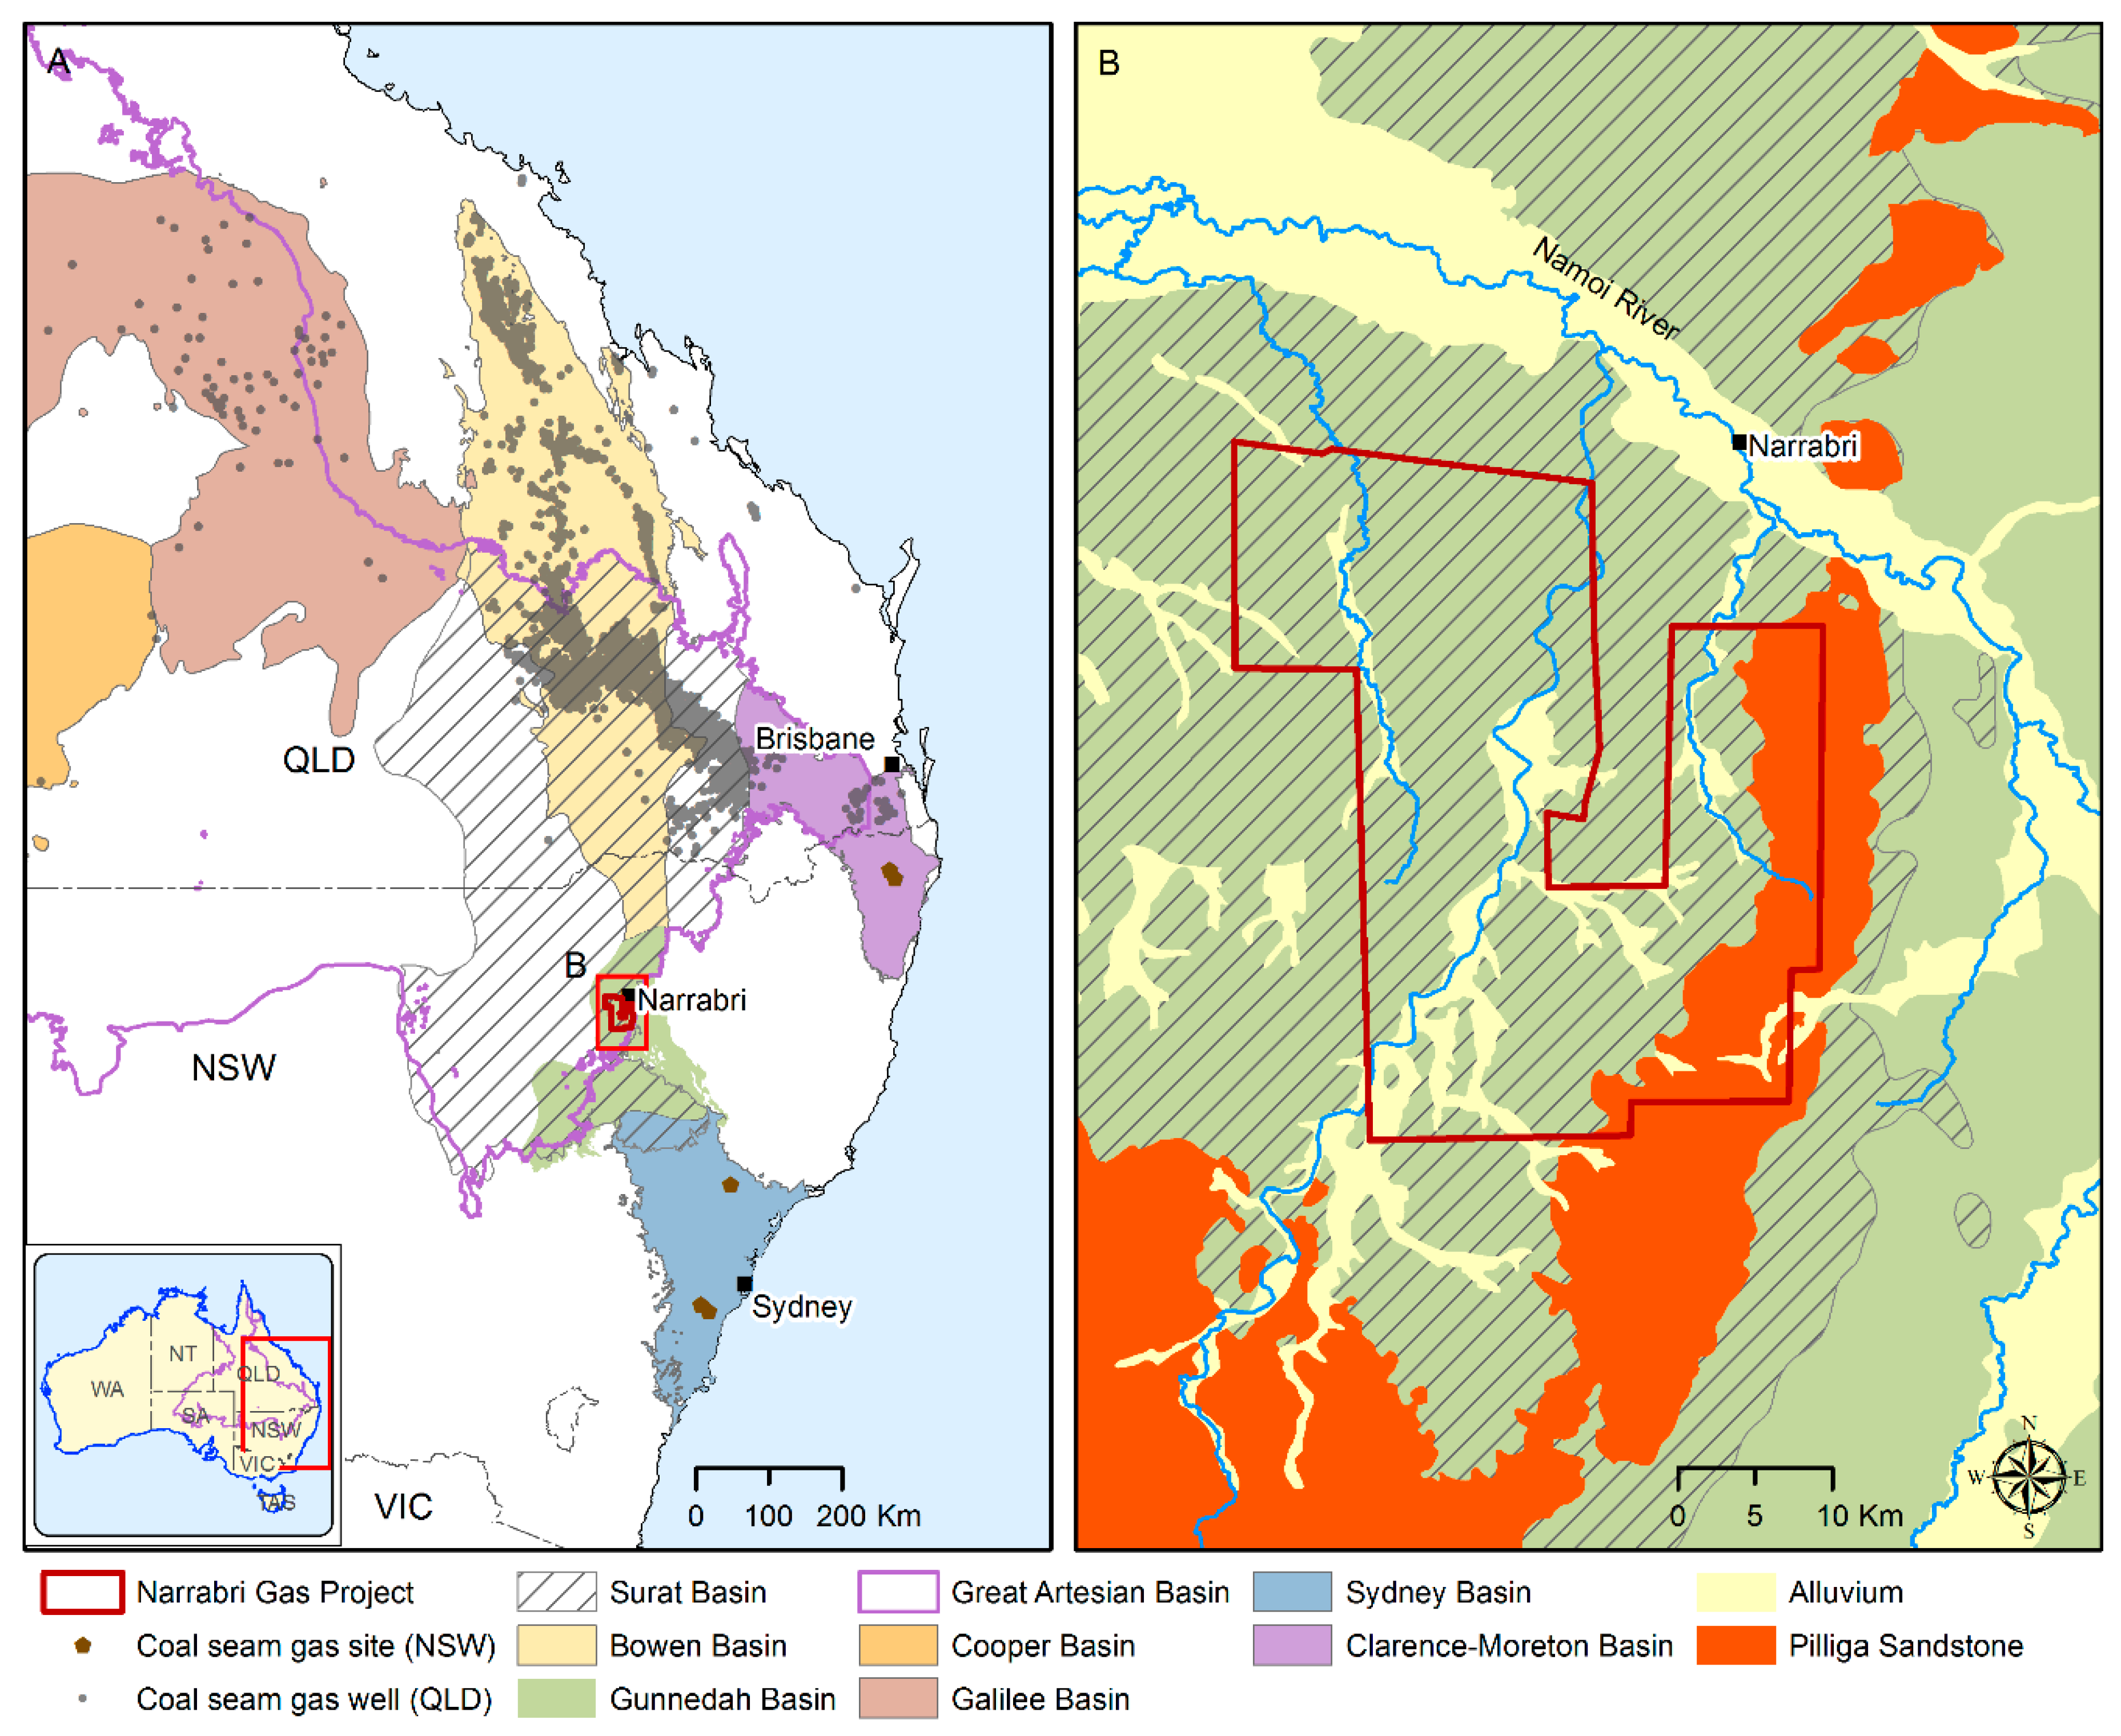
2.1. Regional Geology and Hydrogeology

The Narrabri Gas Project (NGP) near the town of Narrabri in northern NSW targets the Hoskissons Coal and Maules Creek gas-bearing coal seams within the Permian-Triassic Gunnedah geological basin (Figure 1). Of similar Permian age but located and extending further north is the Bowen Basin containing one of the largest coal reserves in Australia. The younger Surat Basin overlies southern parts of the Bowen Basin and the Gunnedah Basin in central New South Wales. These geological basins comprise parts of the wider Great Artesian Basin (Figure 1), the aquifers within which are separated by layers of interburden that generally act as aquitards (Figure 2). The GAB is one of the world’s largest groundwater systems and at >1.7 million km2 covers over 20% of Australia [15]. The major groundwater sources in the Narrabri area comprise of aquifers in the alluvial and Pilliga Sandstone aquifers. Groundwater use in the Namoi River catchment is amongst the highest in NSW and within the Murray–Darling Basin system, with annual extraction entitlements of over 340 million cubic metres [16]. The Namoi River is the main watercourse in the area and is connected to a network of minor streams and creeks, parts of which are hydrologically connected to groundwater systems (Figure 1 and Figure 2). These surface and subsurface water resources support a range of ecological and economic assets in the region.
The NGP plans up to 850 CSG wells in pairs on up to 425 wells pads within the project area (Figure 1). Gas production was estimated to be up to 200 TJ/day over the 25-year life of the project. Depressurisation of the coal seams was expected to generate about 1.5 million cubic metres of water from the coal seams. The use of hydraulic fracture stimulation is not expected to be required [17].

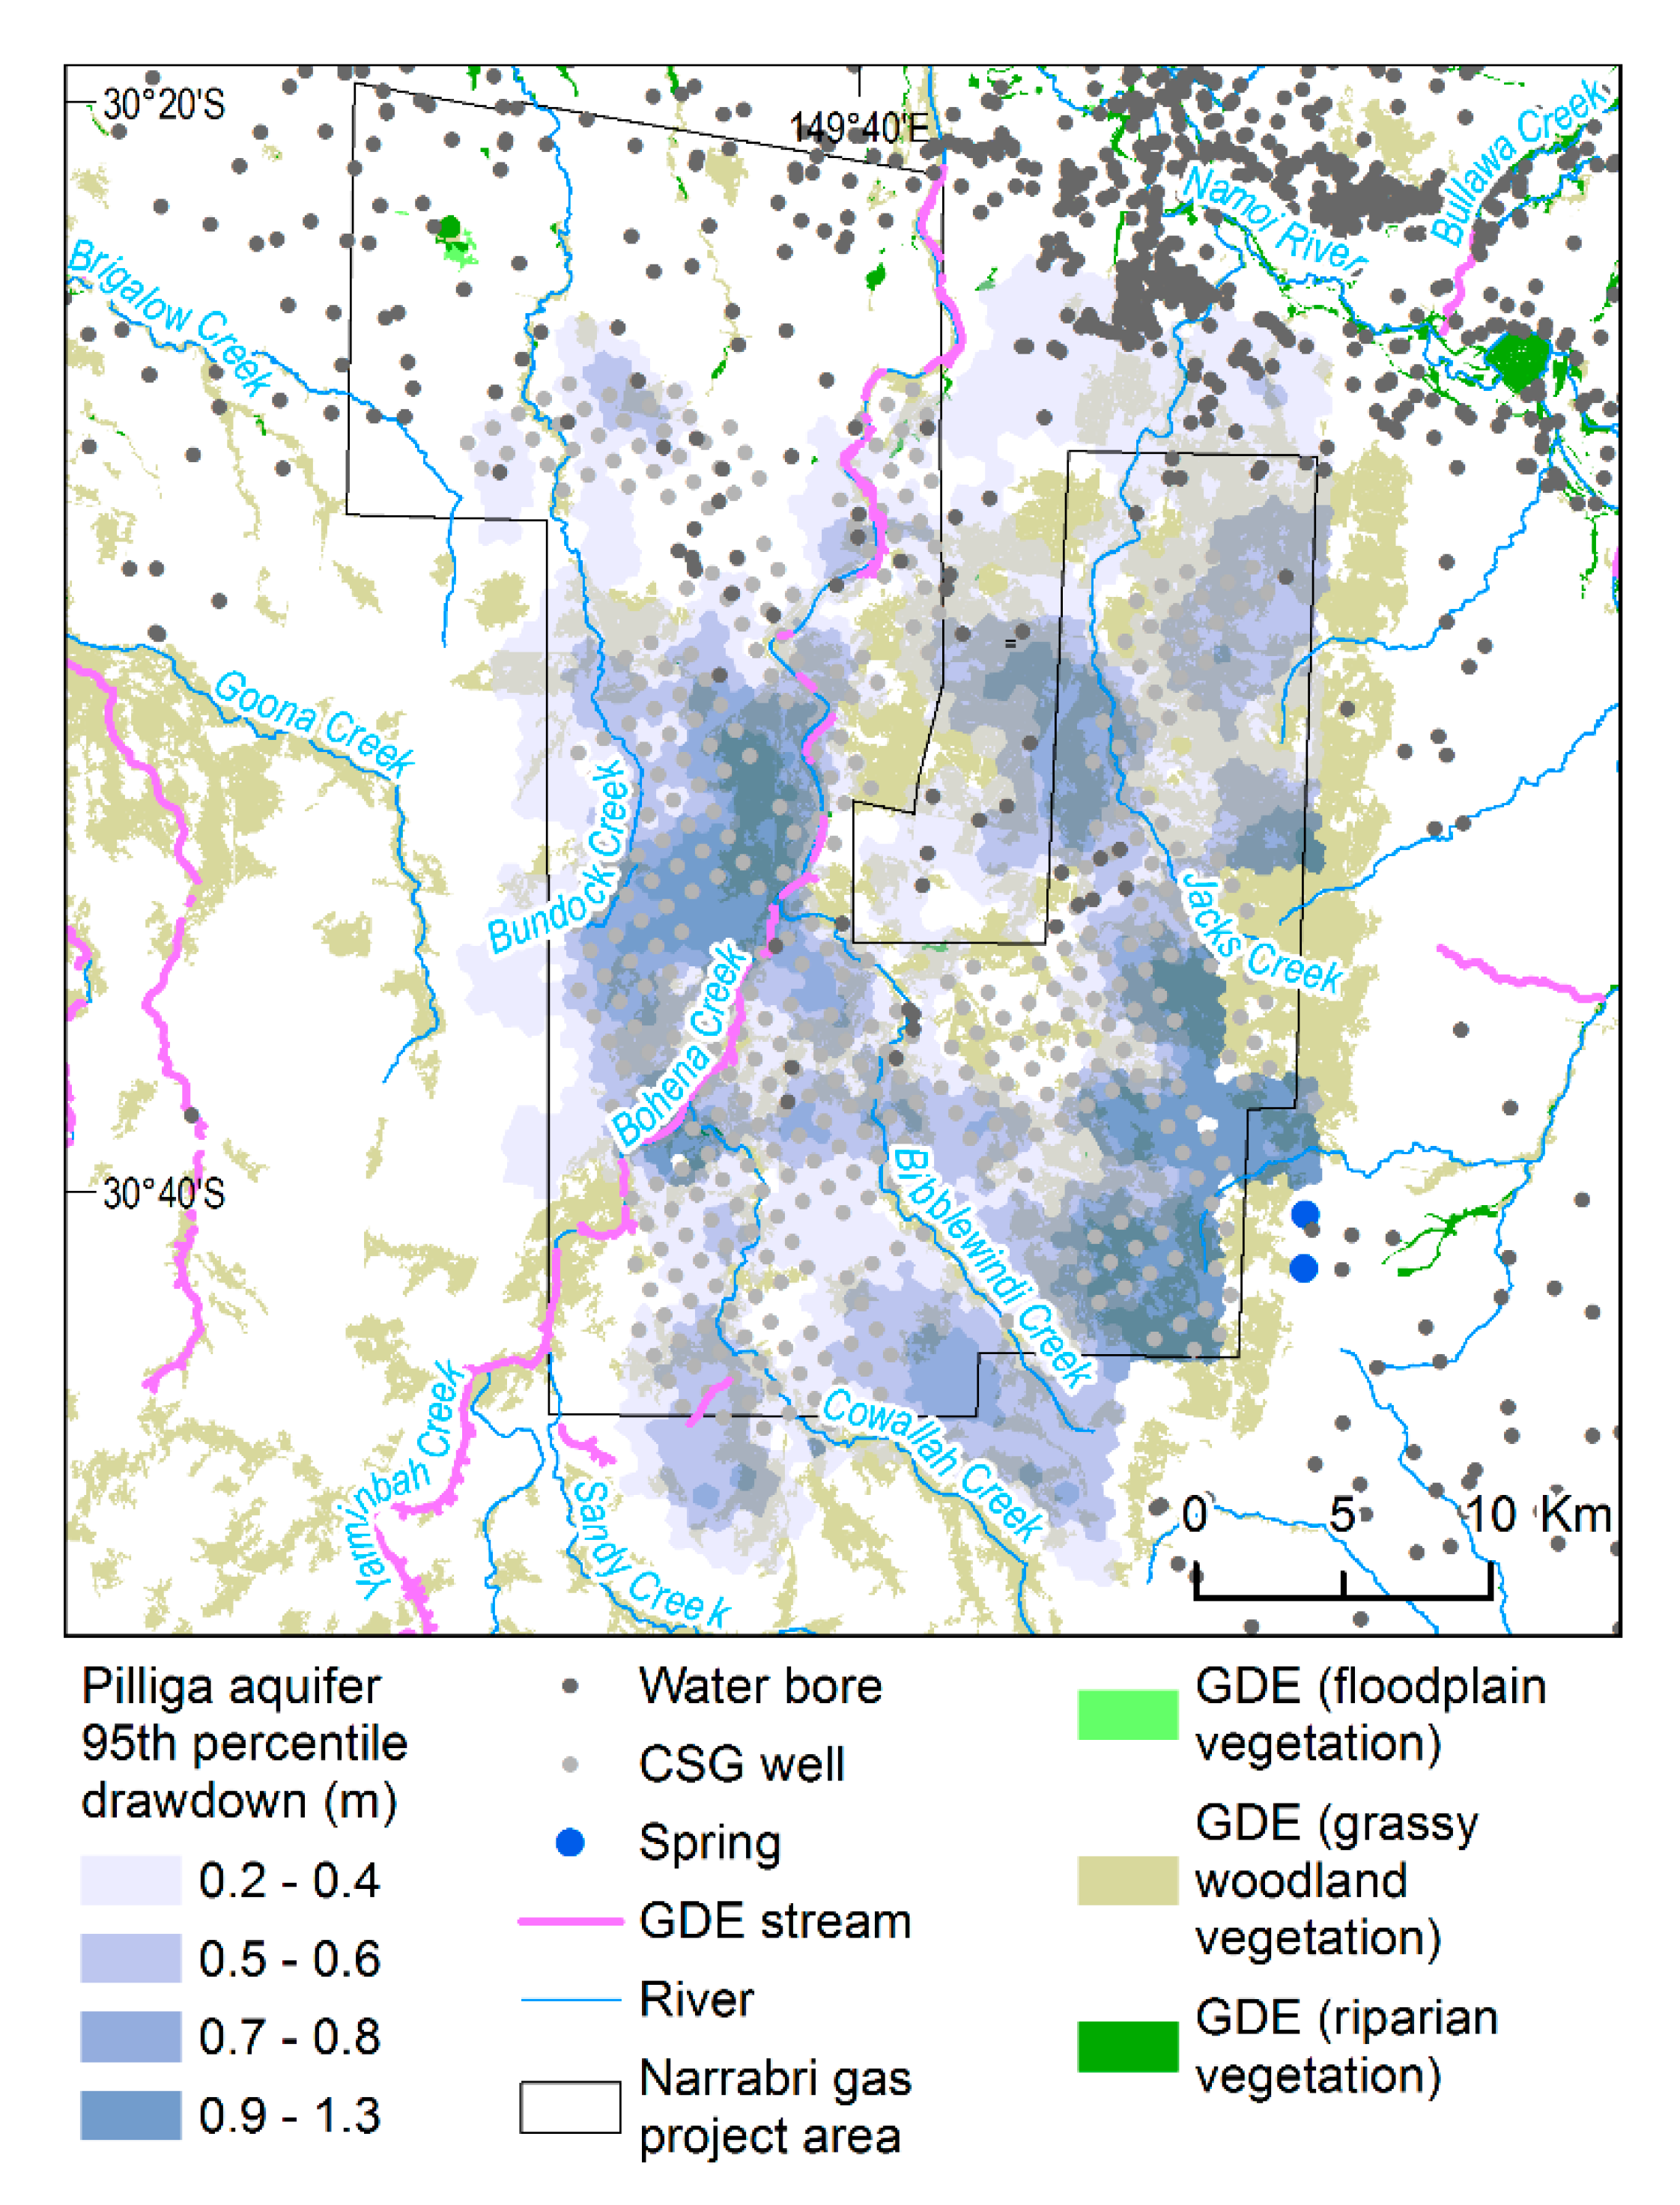
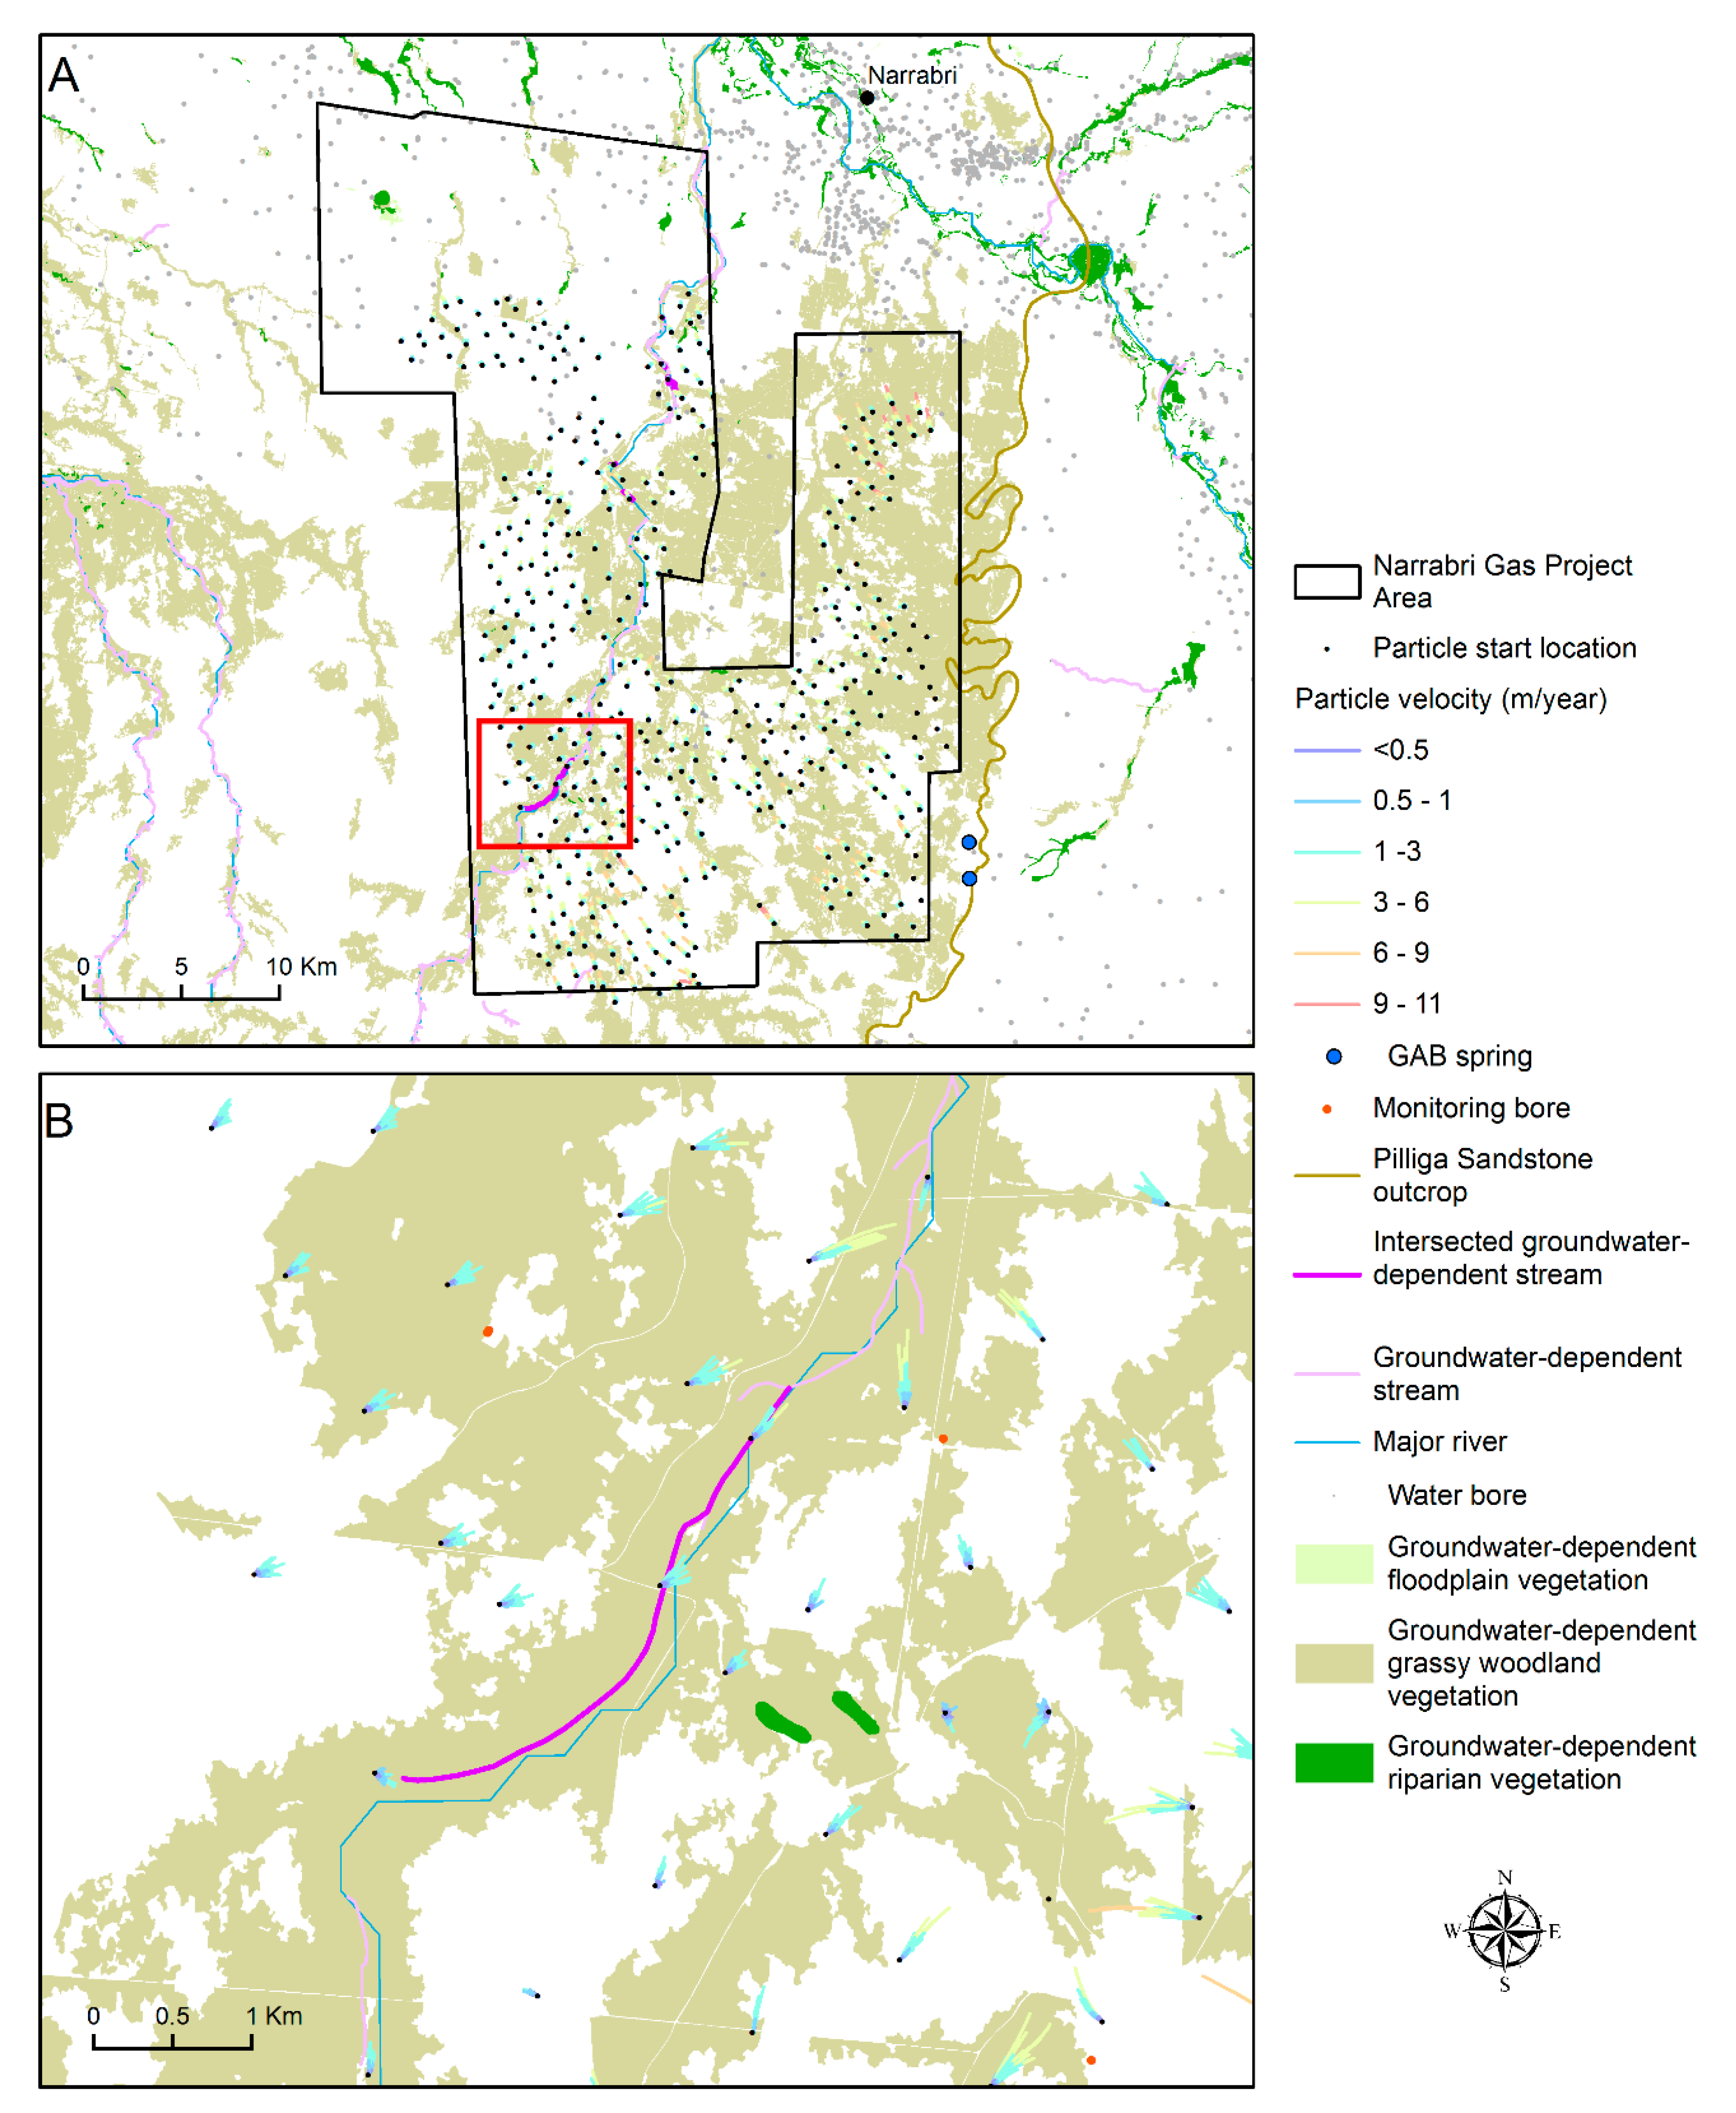
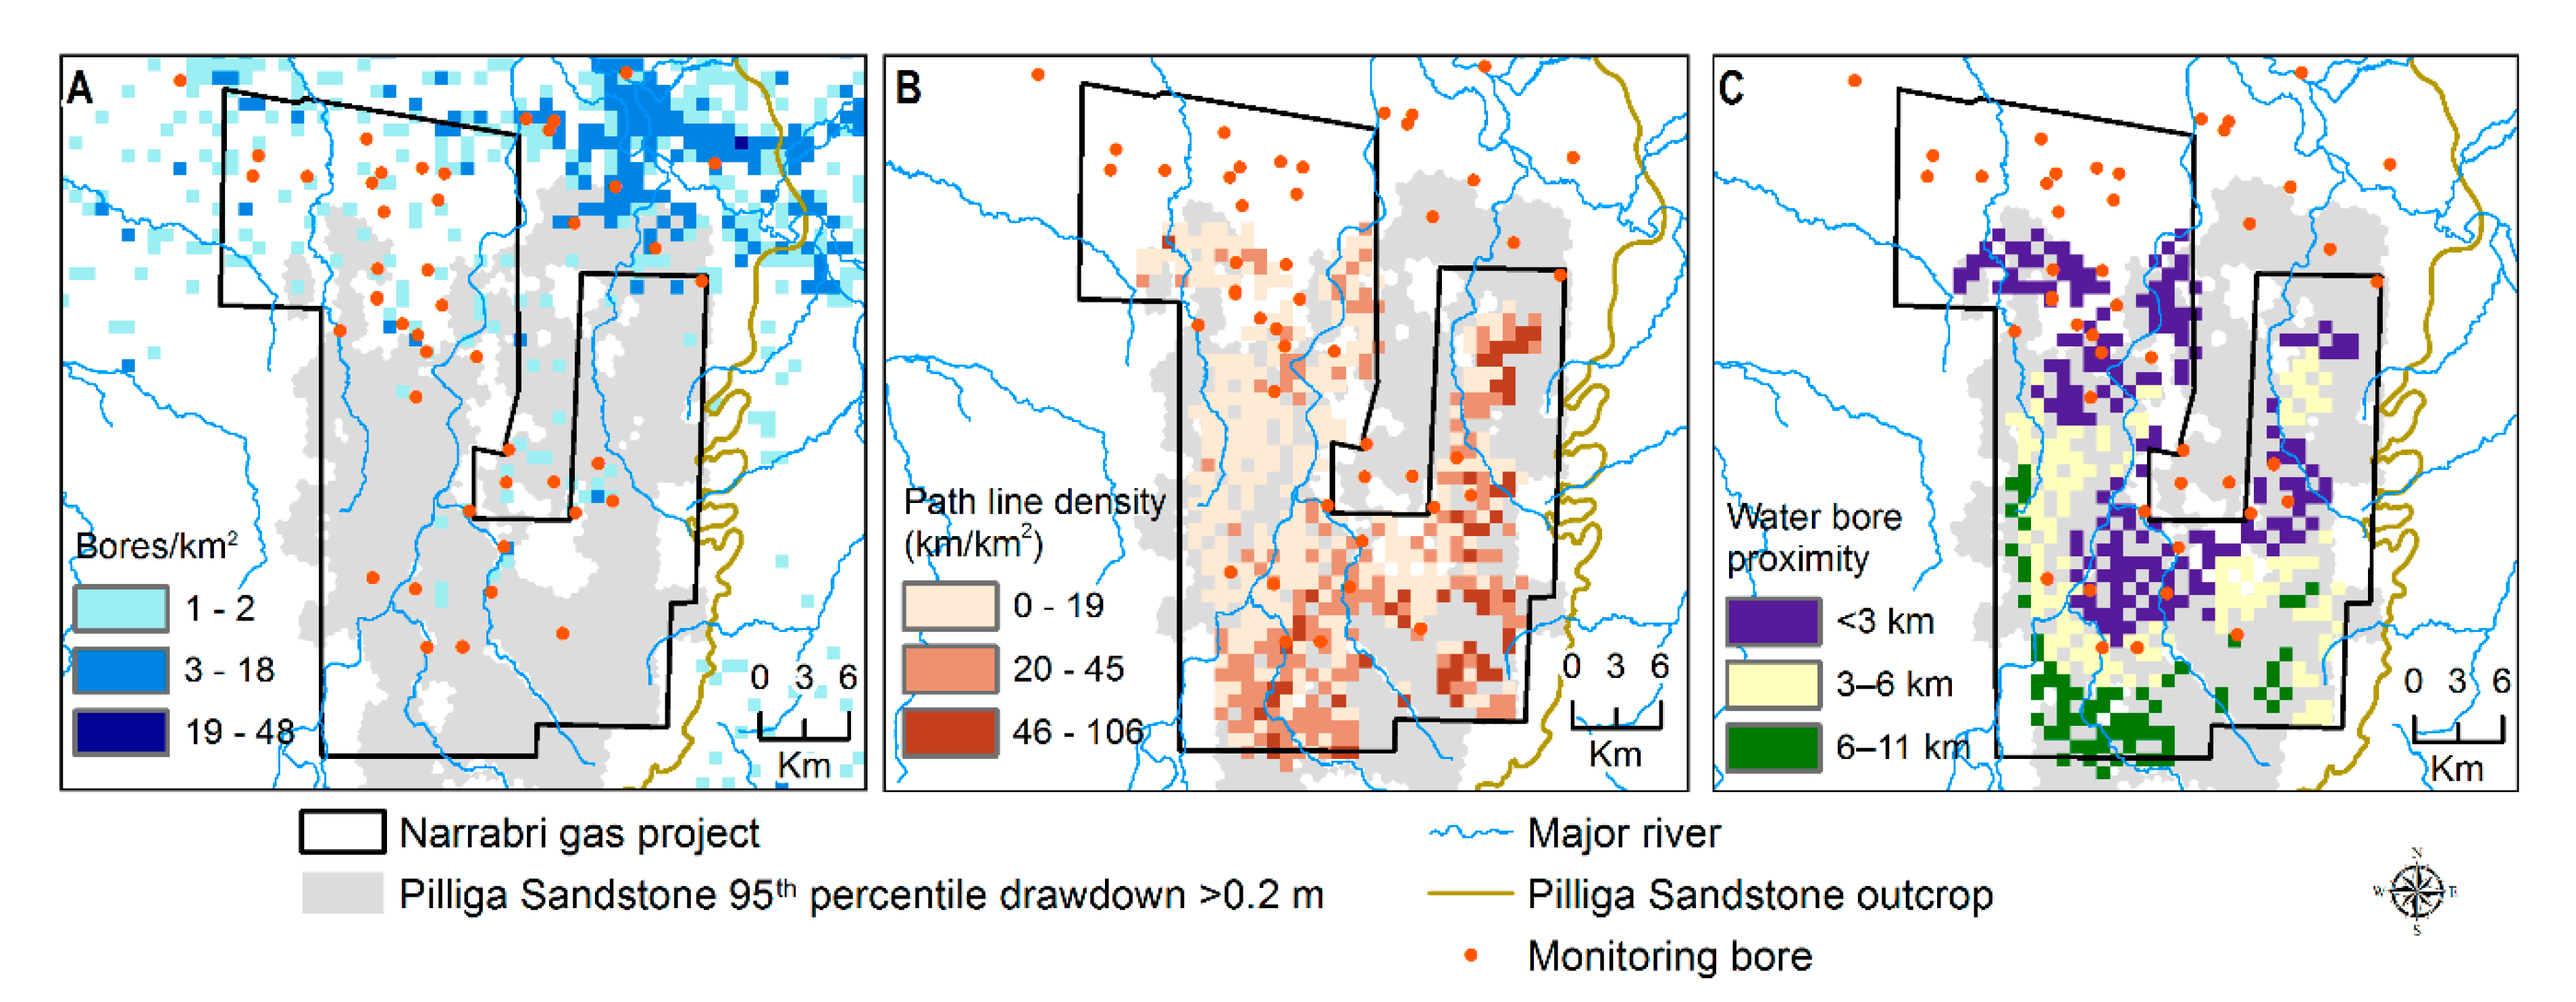
2.2. Ecohydrological Connectivity of Receptors

Receptors, in the context of this study, are features that are potentially impacted as a result of CSG development due to their dependence on and hydrological connection to groundwater. For the region around the NGP, receptors included groundwater dependent ecosystems (GDEs), natural springs, and water production bores for irrigation, stock watering and community use. The conceptualisations of the hydrogeological and ecohydrological connections were refined using qualitative analyses and receptor impact models to identify those affected through changes in hydrological response variables, e.g., groundwater levels or hydrological regime. The complexities of the relationships between hydrological and ecological components of the system requires methods that integrate qualitative and quantitative information. For example, using expert elicitation, process mapping and signed digraphs to construct qualitative predictive models that are developed into quantitative statistical predictions of how hydrological responses from CSG development could impact the receptor [19]. Changes in the hydrological response variables are linked to measurable potential impact metrics, e.g., changes in vegetation cover, aquatic species composition. This explicitly linked receptors with surficial source aquifers for groundwater-dependent vegetation, deeper spring aquifer sources, and surface water systems for water-dependent vegetation [20]. Through this process the receptors identified for vulnerability assessment of CSG development impact for the NGP area are summarised in Table 1.

2.3. Numerical Groundwater Flow Simulation Model

A numerical groundwater flow model built using MODFLOW-USG [14] and developed as part of the Bioregional Assessment Program was modified and used in this study as described in detail by Janardhanan et al. [21]. In the present study the model was applied for particle tracking analysis in the context of environmental receptor vulnerability analysis. A highly parameterized version of the model in which pilot points [22] were used to represent spatial heterogeneity of hydraulic properties was used together with mod-PATH3DU for particle tracking simulation.
The model used a simplified representation of the hydrostratigraphy in the region comprising aquifer and aquitard layers of the Namoi alluvium, Surat Basin and Gunnedah Basin as shown in Table 2. The aquifer of interest for the present study, the Pilliga Sandstone, was represented as an independent layer in the numerical model. Similarly, the target formations for coal seam gas production, Hoskissons coal and Maules Creek Coal formations were represented as independent layers. The aquitard layers in the Surat and Gunnedah Basins comprising different formations were represented by 9 numerical model layers.
The unstructured grid allowed efficient application of greater resolution in areas of interest, e.g., where the most change is expected to occur, or near sensitive assets. The use of MODFLOW-USG also enabled the grid to conform to pinching-out formations following geological boundaries that did not extend over the entire model domain. The model plan area was discretised into Voronoi cells varying in size from 300 m near the NGP and watercourses, and up to 3 km elsewhere in the model (Figure 2). The finer mesh clearly identifies the area of planned CSG development and discretisation around watercourses. The resulting mesh has 58,649 Voronoi cells in planar view, covering an area of approximately 59,000 km2. The cross-sectional view in Figure 2 represents the simplified hydrostratigraphy near the Narrabri gas project that was further discretised for the numerical model.
The previously reported version of this model [21] used a parsimonious parameterization of hydraulic properties considering observed depth dependence of hydraulic conductivity. Core data analysis identified spatial structure for the interburden formations [23]. Spatial variabilities are particularly relevant for informing propagation of drawdown through the aquitard sequence and for particle tracking of advective flow. In this study, we applied a highly parameterised approach primarily to characterize the heterogeneity and spatial variability of the hydraulic properties of the layers in the model, especially the layer representing Pilliga Sandstone.
Turnadge et al. [23] derived porosity-permeability relationships based on downhole porosity logs obtained from 97 exploration wells located across the Gunnedah Basin. They evaluated approaches to upscale these well-scale vertical hydraulic conductivity (Kv) values for inclusion in a regional-scale numerical groundwater model for the Gunnedah and Surat basins. Furthermore, they used this upscaled data to fit geostatistical models to characterize the spatial co-variance of hydraulic properties in the sequences. A spherical variogram with a Sill of 0.764, Nugget of 0.327 and Range of 129 km was used to define the co-variance structure of hydraulic properties horizontally in different model layers. In our highly parameterised modelling scheme, we used this spherical variogram to underpin the spatial covariance structure for interpolating values from the pilot points. A total of 1672 model parameters were used in this highly parameterized scheme. Examples of realizations of the hydraulic conductivity for model layer 6 representing the Pilliga Sandstone aquifer obtained in this manner are shown in Figure 3.
Independent parameters were also used to represent spatially variable flood and irrigation recharge and river conductance [21]. It is noteworthy that this approach enabled simulation of particle tracks for a wide range of hydraulic characteristics.
A total of 500 parameter combinations were evaluated for their predictive responses of CSG-induced drawdown in the aquifers. Drawdown was defined as the hydraulic head differences between baseline model predictions and those simulating CSG development. Latin Hypercube Sampling produced representative samples of these parameters from the high-dimensional parameter space. The prior distributions of parameters were therefore underpinned by available observed covariance structures as opposed to uniform distribution of parameters. The highly parameterized approach enabled testing of a wide range of plausible variabilities in the hydraulic characteristics for predictive analysis to assess the likelihood of impacts in the range of these realizations. The improved solver packages available with MODFLOW-USG also enabled improved model stability that was useful for parallel batch-processing of the numerically stable model with multiple plausible model parameter sets to generate ensembles of predictions.
Rather than providing a single best estimate of groundwater travel times and distances, probabilistic modelling provides a range of estimates based on probability distributions of model parameters and inputs that characterise the groundwater flow system. The distributions of model parameters and inputs reflect the current understanding of the variability and account for uncertainties of the groundwater system. Parameter combinations were filtered during the uncertainty analysis such that only those that are consistent with the available observations and the understanding of the system [23] were used for the particle tracking analysis. Particle tracking was used to investigate the propensity of contaminant particles to flow along the natural groundwater gradient and reach receptors should they be released into the Pilliga Sandstone aquifer by means of well integrity failure.

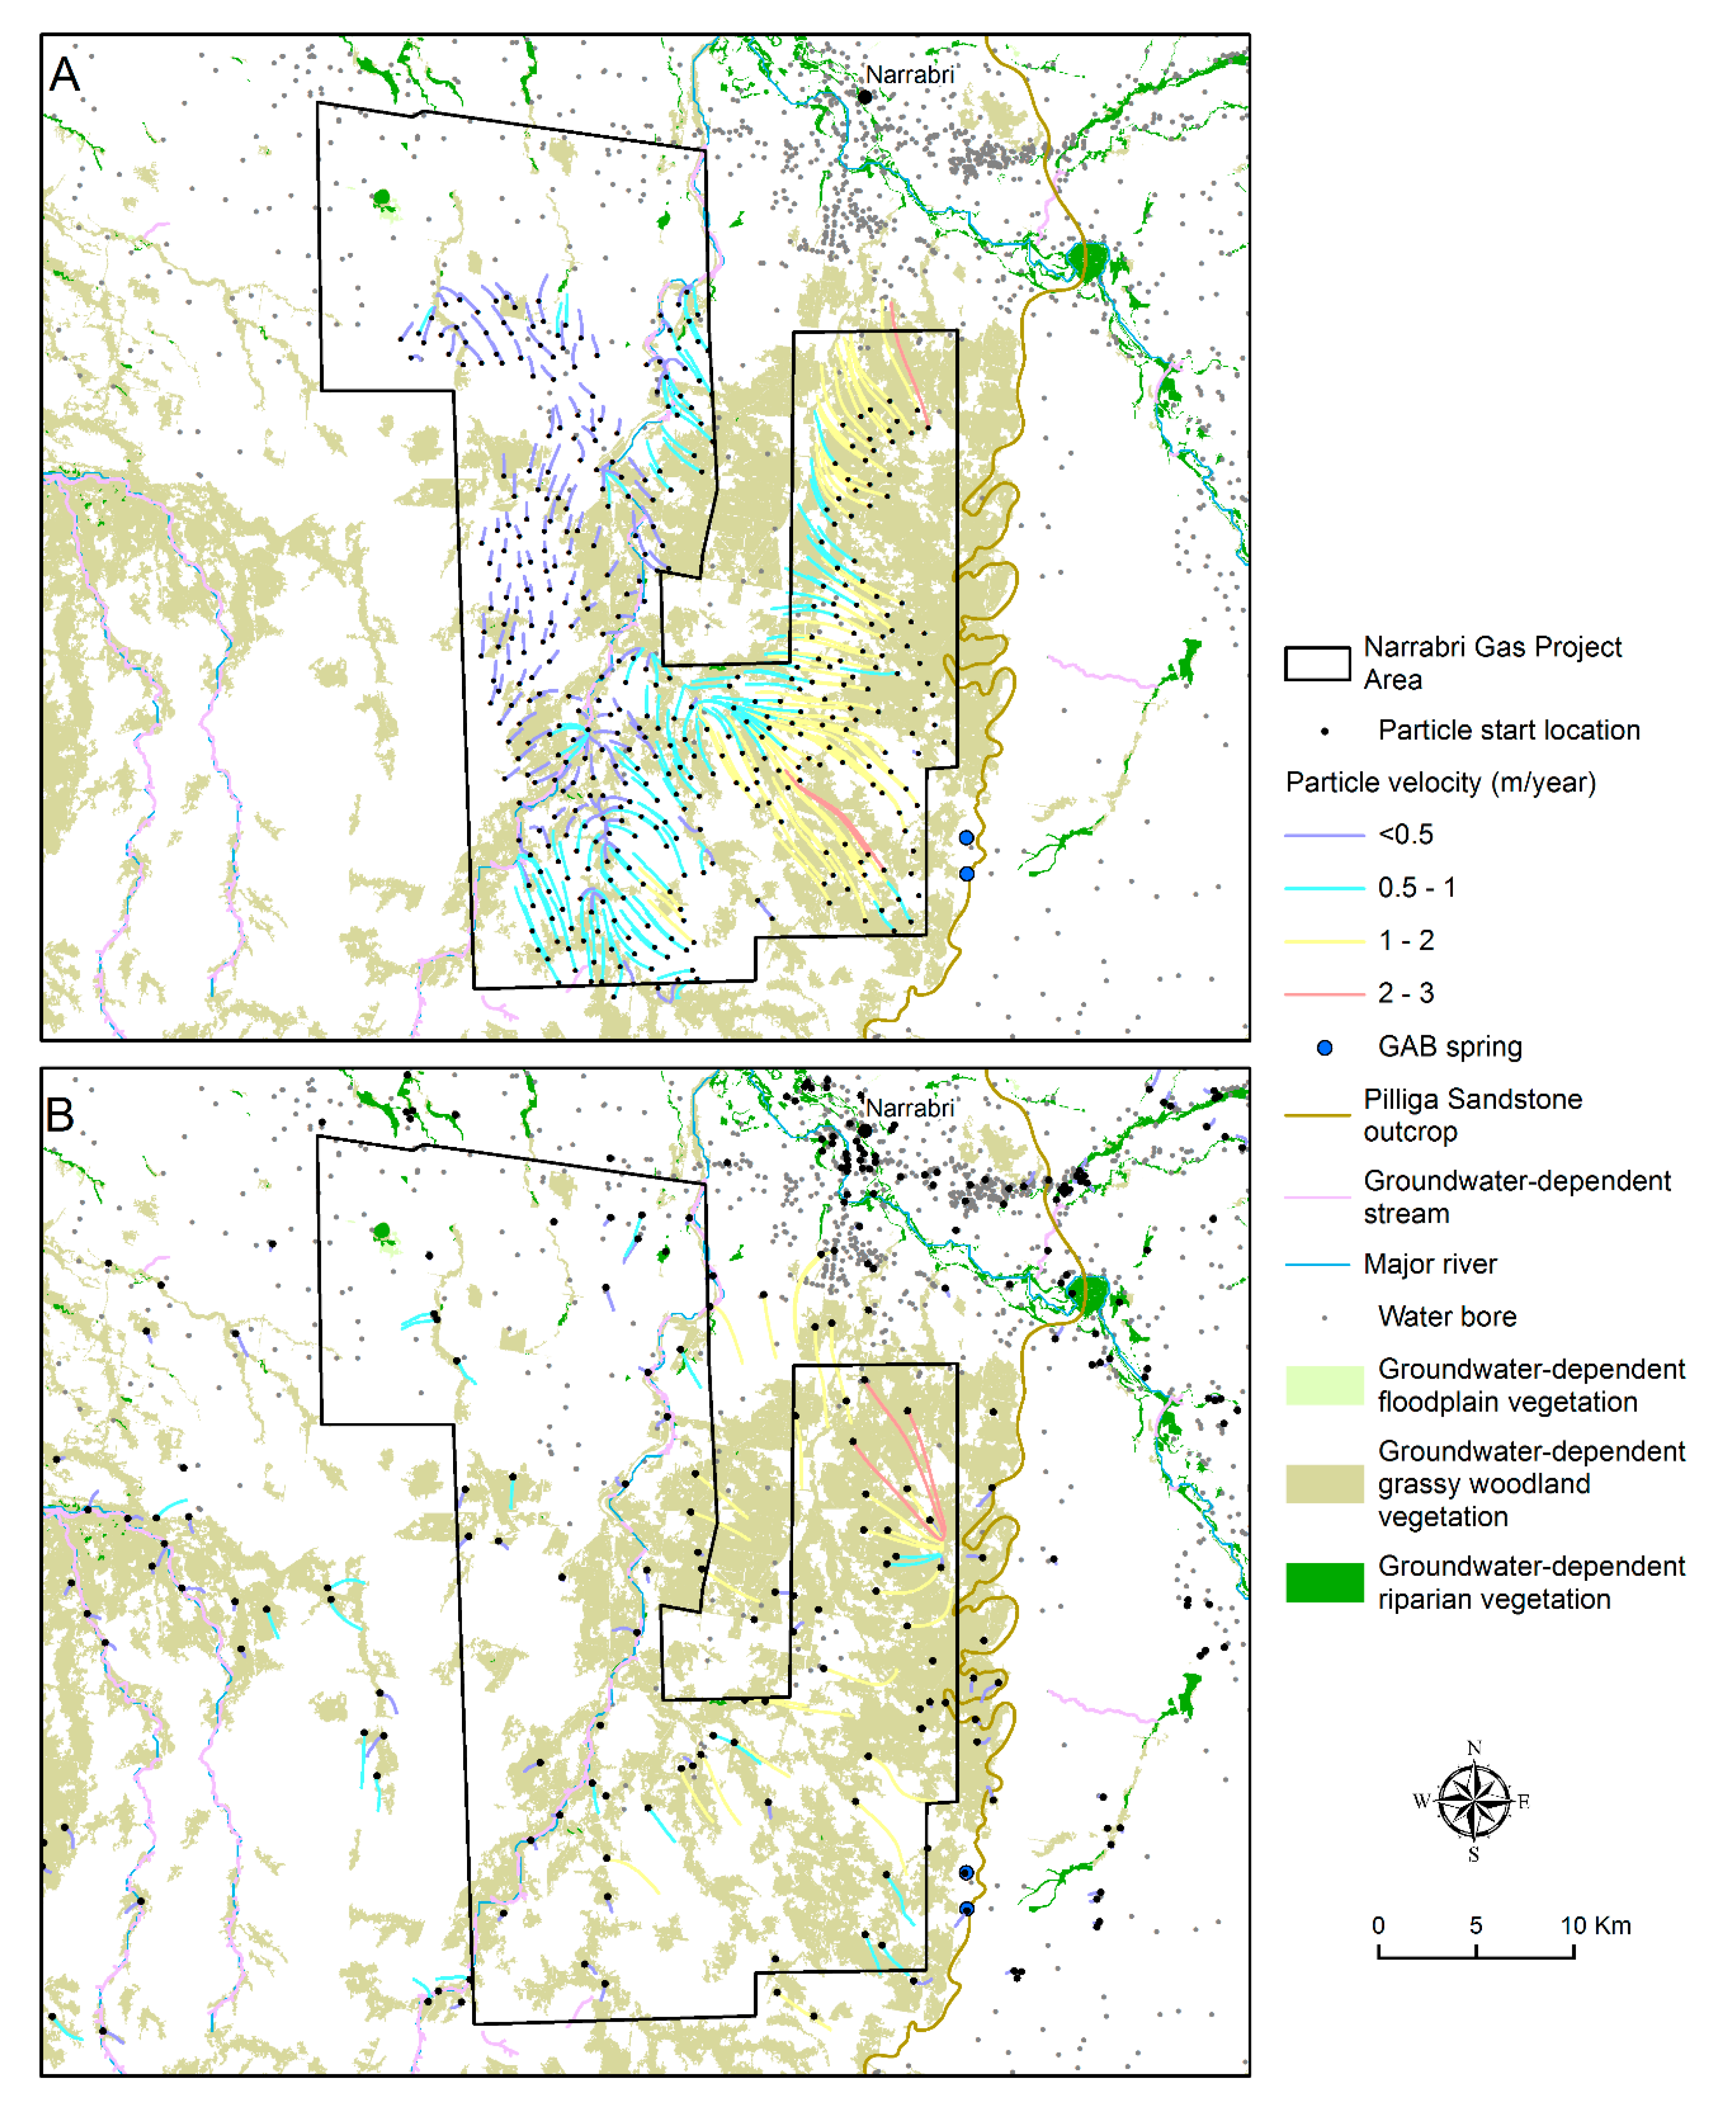
2.4. Particle Tracking Simulation Model

Particle tracking used mod-PATH3DU software [13] compatible with MODFLOW-USG [14]. Forward and reverse direction particle tracking runs were conducted. Particle tracking was performed with no pumping from CSG wells (i.e., assumed that particles had already travelled to the intersection with Pilliga Sandstone aquifer directly above the gas wells). Simulating the release of particles directly into the aquifer thereby represented a worst-case scenario and provided conservative estimates of potential contaminant migration.
In the forward particle tracking analysis, particles were simultaneously released from 409 CSG well locations for 424 simulations over a period of 100 years and were run using varying parameter combinations. This equated to a total of 173,416 completed forward-tracking runs. Another single forward tracking run of 3000 years from all gas well locations was conducted to provide an upper distance estimate using a parameter combination resulting in median predicted drawdown in the Pilliga Sandstone aquifer model layer. While it is highly unrealistic that all wells would fail simultaneously, the objective of this modelling was to estimate where particles may travel from any of the well locations to determine whether any assets could be impacted.
Reverse particle tracking released single particles from a selection of 400 receptor locations representing a range of receptor types, into the Pilliga Sandstone model layer. A selection of 199 locations corresponding to GDEs, a further 199 water bores locations, and 2 springs were included, all located within 30 km north of the CSG well locations in the general direction of groundwater flow. Single reverse tracking runs of 100 years and 3000 years were conducted using a parameter combination resulting in median predicted drawdown in the Pilliga Sandstone aquifer model layer.
Mod-PATH3DU path line files were output as tables of coordinates of points along particle tracks. A scripted process was executed to convert path lines to spatial line vectors for analysis in a GIS. Forward tracking path lines from 100 and 3000-year model runs were spatially intersected with receptor locations using a buffer of 100 m to account for positional error. Grids of water bore densities and proximities to CSG wells were calculated. Path line areal densities (km/km2) were calculated for the probabilistic forward tracking runs of 100 years. Spatial analyses and cartography were performed in the ESRI ArcGIS environment (Environmental Systems Research Institute ArcGIS version 10.2, Redlands, California).

3. Results and Discussion

Probabilistic groundwater model simulations calculated groundwater head drawdown in the Pilliga Sandstone aquifer as a result of CSG well development and defined an impact threshold based on a >5% chance of drawdown of >0.2 m occurring in the Pilliga Sandstone aquifer (Figure 4). This threshold is consistent with the most conservative minimal impact threshold in the New South Wales Aquifer Interference Policy [24]. Drawdown estimates at the 95th percentile level indicated the area where the threshold of 0.2 m would be met or exceeded would intersect with 106 water bores and 1437 km2 of GDE areas (including overlapping extents) and no springs (Figure 4).
In Narrabri CSG development simulations, modelled CSG water extraction ranged from 4 to 107 million cubic metres over the life of the gas project as there was considerable uncertainty in estimates of CSG water production [21]. Particle advection in the Pilliga Sandstone was unlikely to be influenced by pumping during CSG well development compared to a no pumping scenario as drawdown in the Pilliga as a result of pumping was <0.3 m at the median level and <1.5 m at the 95th percentile level (Figure 4). This was considered insufficient to change regional hydraulic gradients and affect contaminant migration paths in the Pilliga aquifer.
Particle tracking distances for single 3000-year simulations were up to 6.7 km in the forward direction and 8.7 km in reverse with maximum velocities of 2–3 m/year (Figure 5A,B). These results are similar to maximum groundwater velocities of 3 m/year in GAB aquifers in the region estimated from carbon isotope (14C) analyses [25]. The maximum velocity of particles over a 100 year forward tracking simulation using a parameter combination resulting in median predicted drawdown in the Pilliga Sandstone was 1.5 m/year. Velocities were higher along the eastern edge of the project area near the Pilliga Sandstone outcrop (Figure 5A,B).
Particle travel velocities from multiple forward tracking simulations over 100 years ranged from <0.5 up to 11 m/year and trajectories also varied (Figure 6A,B). Path lines from CSG wells intersected areas in the Pilliga Sandstone layer underneath two sections of groundwater-dependent streams located within 200 m of planned well locations (Figure 6B). Path lines from forward tracking simulations over 100 years intersected areas beneath groundwater-dependent vegetation, mainly grassy woodland vegetation that is extensive across the study area (Figure 6A). Particle tracking within the Pilliga Sandstone aquifer indicated that impacts are likely to be restricted to receptors in the immediate vicinity of the wells. There was a total of 1437 km2 of groundwater-dependent vegetation within the zone of potential drawdown impact (>5% chance of drawdown >0.2 m in the Pilliga Sandstone aquifer). Monitoring of hydrological response variables associated with these receptors (Table 1) would inform adaptive management plans to respond to negative changes. The optimisation of the location and design of monitoring bores to improve hydraulic change predictions to inform the establishment of an effective early warning monitoring network was investigated in an associated study that found the addition of 10 multi-level piezometers located in areas with the greatest proportion of variability in the ensemble simulations provided relatively high data-worth for reducing uncertainty [25].
Water bore density was highest to the north of the project area (Figure 7A) and bore proximity to CSG wells was lower toward the south (Figure 7C). Path line densities (Figure 7B) followed the velocity trends evident in Figure 5A,B over 3000-year simulations where velocities and path line densities were highest near the Pilliga Sandstone outcrop. No water bores or springs were intersected by or were within 100 m of particle path lines from multiple 100-year realisations or the single 3000-year forward tracking simulation.
Placement of new monitoring bores with the objective of early detection of hydraulic and water quality impacts before they reach receptor locations could be informed by these results. The groundwater model calculated the areas where a >5% chance of drawdown of >0.2 m occurred in the Pilliga Sandstone aquifer as a result of CSG development so focussing water level monitoring on bores within this area would have additional value. There were 34 monitoring bores in the aquifers of the GAB within the area of potential drawdown in the Pilliga Sandstone equating to an average of 4.2 bores/100 km2. There were also 106 water bores within this potential zone of hydrological change (Figure 4). Monitoring bores were sparse in the north-eastern part of the project area where path line density and water bore proximity were high (Figure 7B,C). As estimated particle travel distances were largely limited to within the project area in the 100-year design period, additional monitoring beyond this extent would be of limited value.
Reporting on oil and gas well integrity and barrier failure rates in Australia over 5 years from 2010 to 2015 show that the frequency of failures and subsequent contamination of surrounding environments including overlying aquifers were very low to near zero [3]. Regular monitoring of well casing integrity, hydrological response variables and impact metrics associated with potentially impacted receptors (Table 1), including establishment of baseline (pre-development) conditions and appropriate incident response plans in the event of an incident may be warranted (and potentially required through regulatory approvals) to manage risks.
The specific consequence of contamination in the aquifers that support dependent ecosystems, irrigation, stock watering or potable use, would depend on the persistence, toxicity and bioaccumulation potential of the compounds, and the nature of dilution and attenuation profiles. Given the low groundwater velocities and potentially long travel distances and times to reach many of the receptors (with the exception of grassy woodland GDEs), accounting for dilution and attenuation would likely reduce peak concentrations reached at receptor locations considerably. This study also points to the importance of new data collection particularly during drilling and exploration phases of CSG projects that would further inform the conceptual model understanding of the region and reduce parameter uncertainty. Adaptive management can then be used to adjust operational monitoring plans and responses according to the knowledge gained from new data. A related study applied a spatial optimization technique to identify locations for additional monitoring wells to reduce uncertainty [21].
This study therefore presents a conservative screening analysis at regional scale that provides a rapid assessment of plausible particle travel distances and trajectories from planned CSG well locations. It was concluded from this regional scale assessment of particle advection that detailed studies on contaminant transport would be best focused at the well scale to characterise risks for specific contamination scenarios locally. Such studies could also quantify risks from hazardous events e.g., accidental spills or leaks at the surface from chemical transport and storage, and storage and disposal of CSG wastewater.

4. Conclusions

This study combined probabilistic groundwater modelling and particle tracking analyses to assess the vulnerability of economic and environmental receptors in view of a planned coal seam gas project near Narrabri in northern New South Wales, Australia. Considerable uncertainty in the hydraulic properties of the coal formations, aquitard layers and aquifers in the area existed. Multiple plausible ensembles of hydraulic properties including conductivity and porosity sampled from prior distributions were used to run iterative particle tracking simulations. The approach was a computationally efficient way of accounting for uncertainty in hydrogeological parameters for simulating advective transport of particles. At a regional scale this method was appropriate as a screening assessment to identify and prioritise potential source-receptor combinations prior to employing dedicated local contaminant transport models for contamination risk assessment. This vulnerability assessment approach can be applied as a useful predecessor or first step of a generic preliminary contaminant risk assessment workflow as reported in Mallants et al. [26,27]. Median estimates of groundwater flow in the region were less than 1.5 m per year meaning particles generally did not travel far from their origin. Pumping during coal seam gas well development was considered insufficient to change regional hydraulic gradients and affect contaminant migration paths in the Pilliga Sandstone aquifer. The screening method did not account for effects of dilution or attenuation which could be expected to reduce and delay peak concentrations of contaminants at receptor locations. Based on advective transport alone, the probability of intercepting neighbouring water bores was effectively zero. There was a high chance of intercepting aquifer locations below two sections of groundwater dependent streams due to their proximity to planned gas well locations. Existing monitoring bores were not located within the particle tracking trajectories or ranges. Results indicated that detailed contaminant transport modelling and contamination risk assessment should be focused at a local scale. Probabilistic simulations addressing uncertainty in the hydrogeological parameters that influenced advective flow paths can be used to inform the design of a monitoring network and to direct new data collection. This can reduce uncertainty reduce uncertainty and refine predictions of hydraulic responses to coal seam gas development thereby improving the effectiveness of adaptive management strategies and enhancing the capacity for early detection of impacts.

Author Contributions

D.G. wrote the original manuscript, performed data analysis and visualisation. S.J. developed the overall project design, performed groundwater modelling and data analysis, and edited the manuscript. D.E.P. performed data analysis and edited the manuscript. D.W.G. performed data analysis and edited the manuscript. All authors have read and agreed to the published version of the manuscript.

Funding

This research was funded by the Gas Industry Social and Environmental Research Alliance (GISERA), project number W8. GISERA is a collaboration between the Commonwealth Scientific and Industrial Research Organisation (CSIRO), Commonwealth and state governments and industry established to undertake publicly reported independent research. The purpose of GISERA is for CSIRO to provide quality assured scientific research and information to communities living in gas development regions focusing on social and environmental topics including: groundwater and surface water, biodiversity, land management, the marine environment, human health impacts, and socio-economic impacts. The governance structure for GISERA is designed to provide for and protect research independence and transparency of research outputs.

Acknowledgments

The authors thank Rebecca Doble and Tao Cui and two anonymous reviewers for the Water journal for their valuable suggestions that significantly improved the quality of the manuscript. The authors also acknowledge the Bioregional Assessment Programme for providing the initial version of the groundwater model and spatial data used in this study.

Conflicts of Interest

The authors declare no conflict of interest.

References

  1. Department of Natural Resources, Mines and Energy. Petroleum and Gas Production and Reserve Statistics; Queensland Government: Brisbane, Australia, 2020.
  2. Wu, B.; Doble, R.; Turnadge, C.; Mallants, D.J.C. Bore and Well Induced Inter-AquiferConnectivity: A Review of Literature on Failure Mechanisms and Conceptualisation of Hydrocarbon Reservoir-Aquifer Failure Pathways; CSIRO: Canberra, Australia, 2016.
  3. Huddlestone-Holmes, C.; Wu, B.; Kear, J.; Pandurangan, R. Report into the Shale Gas Well Life Cycle and Well Integrity. EP179028; CSIRO: Canberra, Australia, 2017.
  4. Cousquer, Y.; Pryet, A.; Atteia, O.; Ferré, T.P.; Delbart, C.; Valois, R.; Dupuy, A. Developing a particle tracking surrogate model to improve inversion of ground water–Surface water models. J. Hydrol. 2018, 558, 356–365. [Google Scholar] [CrossRef]
  5. Yidana, S.M. Groundwater flow modeling and particle tracking for chemical transport in the southern Voltaian aquifers. Environ. Earth Sci. 2011, 63, 709–721. [Google Scholar] [CrossRef]
  6. Aller, L. DRASTIC: A Standardized System for Evaluating Ground Water Pollution Potential Using Hydrogeologic Settings; Robert, S., Ed.; Kerr Environmental Research Laboratory, Office of Research and Development, US Environmental Protection Agency: Washington, DC, USA, 1985.
  7. Shirazi, S.M.; Imran, H.; Akib, S. GIS-based DRASTIC method for groundwater vulnerability assessment: A review. J. Risk Res. 2012, 15, 991–1011. [Google Scholar] [CrossRef]
  8. Neshat, A.; Pradhan, B.; Dadras, M. Groundwater vulnerability assessment using an improved DRASTIC method in GIS. Resour. Conserv. Recycl. 2014, 86, 74–86. [Google Scholar] [CrossRef]
  9. Kent, C.R.; Pandey, S.; Turner, N.; Dickinson, C.G.; Jamieson, M. Estimating current and historical groundwater abstraction from the Great Artesian Basin and other regional-scale aquifers in Queensland, Australia. Hydrogeol. J. 2020, 28, 393–412. [Google Scholar] [CrossRef] [Green Version]
  10. Petus, C.; Lewis, M.; White, D. Monitoring temporal dynamics of Great Artesian Basin wetland vegetation, Australia, using MODIS NDVI. Ecol. Indic. 2013, 34, 41–52. [Google Scholar] [CrossRef]
  11. Hamawand, I.; Yusaf, T.; Hamawand, S.G. Coal seam gas and associated water: A review paper. Renew. Sustain. Energy Rev. 2013, 22, 550–560. [Google Scholar] [CrossRef]
  12. Mallants, D.; Apte, S.; Kear, J.; Turnadge, C.; Janardhanan, S.; Gonzalez, D.; Williams, M.; Chen, Z.; Kookana, R.; Taylor, A.; et al. Deeper Groundwater Hazard Screening Research. A Report Prepared by the Commonwealth Scientific and Industrial Research Organisation (CSIRO) for the Australian Government Department of the Environment and Energy; CSIRO: Canberra, Australia, 2017.
  13. Craig, J.R.; Ramadhan, M.; Muffels, C. A Particle Tracking Algorithm for Arbitrary Unstructured Grids. Ground Water 2020, 58, 19–26. [Google Scholar] [CrossRef] [PubMed]
  14. Panday, S.; Huyakorn, P.; Therrien, R.; Nichols, R.J.A.W.R. MODFLOW–USG version 1: An unstructured grid version of MODFLOW for simulating groundwater flow. Adv Water Resour. 2013, 25, 497–511. [Google Scholar]
  15. Frontier Economics. Economic Output of Groundwater Dependent Sectors in the Great Artesian Basin. A Report Commissioned by the Australian Government Great Artesian Basin Jurisdictions Based on Advice from the Great Artesian Basin Coordinating Committee; Frontier Economics: London, UK, 2016. [Google Scholar]
  16. CSIRO. Water Availability in the Namoi. A Report to the Australian Government from the CSIRO Murray-Darling Basin Sustainable Yields Project; CSIRO: Canberra, Australia, 2007. [Google Scholar]
  17. Santos. Environmental Impact Statement for Construction and Operation of the Narrabri Gas Project including Exploration and Appraisal; Santos Ltd.: Sydney, Australia, 2017. [Google Scholar]
  18. Bioregional Assessment Programme. Data Register for the Namoi Subregion; Commonwealth of Australia Bioregional Assessment Programme: Canberra, Australia, 2018. [Google Scholar]
  19. Ickowicz, A.; Hosack, G.; Mitchell, P.; Dambacher, J.; Hayes, K.; O’Grady, A.; Henderson, B.; Herron, N. Receptor Impact Modelling for the Namoi Subregion. Product 2.7 for the Namoi Subregion from the Northern Inland Catchments Bioregional Assessment; Department of the Environment and Energy, Bureau of Meteorology, CSIRO and Geoscience Australia: Canberra, Australia, 2018. [Google Scholar]
  20. Holland, K.; Gonzalez, D.; Mitchell, P.; O’Grady, A.; Janardhanan, S. Hydrogeological and Ecohydrological Connections in the CSG Development Areas of the Namoi Region; CSIRO: Canberra, Australia, 2018.
  21. Janardhanan, S.; Gladish, D.; Gonzalez, D.; Pagendam, D.; Pickett, T.; Cui, T. Optimal Design and Prediction-Independent Verification of Groundwater Monitoring Network. Water 2020, 12, 123. [Google Scholar] [CrossRef] [Green Version]
  22. Doherty, J. Model parameterisation based on pilot points. In Groundwater Data Utilities, Part A: Overview; Watermark Numerical Computing: Brisbane, Australia, 2015. [Google Scholar]
  23. Turnadge, C.; Mallants, D.; Peeters, L. Sensitivity and Uncertainty Analysis of a Regional-Scale Groundwater Flow Model Featuring Coal Seam Gas Extraction; CSIRO: Canberra, Australia, 2018.
  24. NSW DPI. NSW Aquifer Interference Policy. NSW Government Policy for the Licensing and Assessment of Aquifer Interference Activities; New South Wales Department of Primary Industries: Orange, Australia, 2012.
  25. Raiber, M.; Suckow, A. Hydrochemistry of the Pilliga Sandstone Aquifer in NSW—Data Availability, Preliminary Assessment of Spatial Patterns and Conceptual Model Uncertainties; CSIRO: Canberra, Australia, 2018.
  26. Mallants, D.; Apte, S.; Kear, J.; Turnadge, C.; Janardhanan, S.; Gonzalez, D.; Williams, M.; Chen, Z.; Kookana, R.; Taylor, A.; et al. Deeper Groundwater Hazard Screening Research; Commonwealth Scientific and Industrial Research Organisation (CSIRO): Canberra, Australia, 2017.
  27. Mallants, D.; Bekele, E.; Schmid, W.; Miotlinski, K.; Taylor, A.; Gerke, K.; Gray, B. Soil and shallow groundwater pathway analysis of hydraulic fracturing chemicals used in Australia. Water 2020, 12, 941. [Google Scholar] [CrossRef] [Green Version]
Figure 1. Geological basins and existing coal seam gas developments in Queensland and New South Wales (A), and outcropping extents of alluvial and Pilliga Sandstone aquifers in Australia near the Narrabri Gas Project area (B). Data sourced from [18].
Water 12 03177 g001
Figure 2. Voronoi model grid structure and hydrostratigraphy of the Narrabri Gas Project area.
Water 12 03177 g002
Figure 3. Examples of realizations of the hydraulic conductivity (m/day) for model layer 6 representing the Pilliga Sandstone from the highly parameterized modelling scheme.
Water 12 03177 g003
Figure 4. 95th percentile estimate of drawdown in the Pilliga Sandstone aquifer in the Narrabri Gas Project area, water bores, springs and groundwater dependent streams and ecosystems (GDE) based on landscape classifications by Holland et al. [20].
Water 12 03177 g004
Figure 5. Average particle velocities from single 3000-year simulations released into the Pilliga Sandstone aquifer forward from CSG wells (A) and in reverse from selected receptor locations (B).
Water 12 03177 g005
Figure 6. Particle velocities from multiple forward tracking simulations over 100 years released from planned CSG wells into the Pilliga Sandstone aquifer shown at regional scale (A) and local scale (B).
Water 12 03177 g006
Figure 7. Water bore density (A), path line density from multiple forward tracking analysis (B), and water bore proximity based on Euclidean distances to planned CSG well locations (C).
Water 12 03177 g007
Table 1. Receptors, hydrological response variables and potential impact metrics (adapted from [20]).
ReceptorHydrological Response VariablePotential Impact Metric
Groundwater-dependent floodplain vegetation High-flow return interval, water tableFoliage cover
Groundwater-dependent riparian vegetation High-flow return interval, zero-flow regime, water tableFoliage cover
Groundwater-dependent grassy woodland vegetation Water tableFoliage cover
Groundwater-dependent rainforest vegetation Water tableFoliage cover
Groundwater dependent streamZero-flow regime, water tableAquatic macroinvertebrate family richness
Natural springs (GAB)Water tableFlow
Water production boresWater tableBore yield, water quality
GAB, Great Artesian Basin.
Table 2. Conceptualization of hydrostratigraphy and layers in the numerical groundwater model.
ProvincePeriodFormationsLayer in Groundwater ModelModelled Hydrostratigraphic Unit
Namoi AlluviumPleistocene, PlioceneNarrabri Formation, Gunnedah, Cubbaroo Formation1–2Aquifer
Surat BasinCretaceous, JurrasicRolling Downs Group, Liverpool Range Volcanics, Blythsdale Group,3–5Inter-burden
Surat BasinJurassicPilliga Sandstone6Aquifer
Surat Basin/Gunnedah BasinJurassic, Triassic, PermianPurlawaugh Formation, Garrawilla Volcanics, Napperby and Deriah formations, Digby Formation, Black Jack Group – Coogal and Nea Subgroup7–9Inter-burden
Gunnedah BasinPermianHoskissons Coal10Aquifer
Gunnedah BasinPermianBlack Jack Gropu—Brothers Subgroup, Watermark Formation, Porcupine Formation, Upper Maules Creek Formation11–13Inter-burden
Gunnedah BasinPermianMaules Creek Coal, Lower Maules Creek Formation14Aquifer
Gunnedah BasinPermianGoonbri Formation, Leard Formation, Werrie Basalt and Boggabri Volcanics15Basement
Publisher’s Note: MDPI stays neutral with regard to jurisdictional claims in published maps and institutional affiliations.

