Article

Mass Production of Plasma Activated Water: Case Studies of Its Biocidal Effect on Algae and Cyanobacteria

1
Department of Physical Electronics, Faculty of Science, Masaryk University, Kotlářská 267/2, 611 37 Brno, Czech Republic
2
V. Kaplan Department, Faculty of Mechanical Engineering, Brno University of Technology, Technická 2896/2, 616 69 Brno, Czech Republic
3
Institute of Botany, Czech Academy of Sciences, Lidická 25/27, 602 00 Brno, Czech Republic
*
Author to whom correspondence should be addressed.
Water 2020, 12(11), 3167; https://doi.org/10.3390/w12113167
Submission received: 29 September 2020 / Revised: 2 November 2020 / Accepted: 8 November 2020 / Published: 12 November 2020

Abstract

:
Efficient treatment of contaminated water in industrially viable volumes is still a challenging task. The hydrodynamic cavitation plasma jet (HCPJ) is a promising plasma source for industrial-scale generation of biologically active environments at high flow rates of several m3/h. The combined effect of a hydro-mechanical phenomenon consisting of hydrodynamic cavitation and electrical discharge in cavitation voids was found to be highly efficient for large-volume generation of reactive oxygen species, ultraviolet (UV) radiation, and electro-mechanical stress in a liquid environment. Here, the persistence of biocidal properties of HCPJ-activated water (i.e., plasma-activated water (PAW)) was tested by the study of algae and cyanobacteria inactivation. Algae and cyanobacteria cultivated in media containing PAW (1:1) were completely inactivated after 72 h from first exposure. The test was performed at a total power input of up to 0.5 kWh/m3 at the treated liquid flow rate of 1 m3/h. A beneficial modification of our previous HCPJ design is described and thoroughly characterized with respect to the changes of hydrodynamic flow conditions as well as discharge performance and its optical characteristics. The modification proved to provide high biocidal activity of the resulting PAW, which confirms a strong potential for further design optimization of this promising water (liquid) plasma source.

Graphical Abstract

1. Introduction

Generation of reactive oxygen and nitrogen species (RONS) in liquids (especially water) has now become a topical field of physical research involving the cavitation phenomenon. The RONS are generated using various physico-chemical mechanisms, involving strong ultrasound fields [1], reactive gas/liquid admixtures to the liquid (or cavitation cloud), or highly innovative plasma-liquid interactions [2,3]. The last, the plasma-chemical approach, brings the benefit of in-situ tailored generation of reactive species, but raises a problem of energy-efficient transport of generated reactive species into the liquid environment. Various liquid discharge technologies were studied intensively for their cross-disciplinary applications in environmental, bio-medical [4,5], or agricultural areas [6]. Water and aqueous solutions (media) treated/activated by atmospheric air plasmas, so-called plasma-activated water (PAW) or plasma-activated media (PAM), were found to have substantial antimicrobial [7] and antitumor properties [8]. In agriculture, exposure to PAW can lead to enhanced seed germination and growth of plants [9] in addition to its strong bactericidal effect [10]. Further applications of discharge plasmas generated in liquids include chemical synthesis [11,12,13], nanoparticle synthesis [14,15,16], destruction of pollutants in wastewaters [17,18,19,20,21,22], polymer surface treatment [23,24,25], etc. Nevertheless, the main hindrance remains in place even after two decades of intensive research effort: What is an effective method for large-volume liquid treatment?
Direct generation of electrical discharges in liquids is complicated by generally high breakdown strength of liquids (>1 MV/cm). In most cases, the discharge breakdown in a genuinely liquid environment is initiated by applying ultra-fast high voltage pulses to a highly curved discharge electrode(s) [17,23,26]. This approach limits not only the volume of generated plasma, but more importantly, the power input that can be dissipated into the treated medium. The use of a subsidiary gas-phase environment with subsequent mixing of plasma produced species into the liquid is, therefore, more popular today. Introduction of the gas-phase allows reduction of breakdown strength to technically more feasible values of 10 kV/cm. Typical representatives of such an approach include plasma jets submerged in liquid [7,11,27]; discharges generated above [10,13] or from the liquid surface [25], discharges in liquid aerosol [3]; or discharges initiated inside the gas micro-bubbles introduced [21] or formed inside the liquid volume [18,24]. Still, none of these methods of discharge plasma generation can deliver a sufficiently high and cost-effective throughput of plasma-treated liquid (see Table 1).
Recently the authors of this paper applied a novel approach to overcome this technological barrier (see patent [31]). The method employs an energy-efficient generation of a dense hydrodynamic cavitation cloud (referred to as a cavitation cloud) that proved itself to be a highly suitable environment for the generation of electrical discharges by a pair of axially positioned semi-insulated electrodes. The cavitation cloud comprises an ample number of tiny voids (cavities) with the internal pressure of liquid vapours of a few kPa only. An advantageous low-pressure environment is formed inside the flowing liquid, where even a moderate high-voltage (HV) field of 1 kV/cm can sustain discharge plasma in a considerable volume of liquid, see Figure 1. The setup is called a hydrodynamic cavitation plasma jet (HCPJ).
Our first experiments with the HCPJ demonstrated its exceptionally high efficacy in direct cyanobacteria remediation (Microcystis aeruginosa) from contaminated water [28]. The combined effect of hydrodynamic cavitation and discharge plasma led to a single-pass removal of all cyanobacteria with no increase in microcystin concentration in treated water. In actual numbers, 6 L of cyanobacteria contaminated water (5 × 10⁵ cells/mL) was disinfected in less than 15 s. This volume efficiency is a remarkable improvement over the known methods of underwater discharge generation (Table 1), even when we compare the HCPJ with a few known works where authors also employed cavitation clouds to sustain the underwater discharge [29,32,33]. Very recently, a plasma-cavitation device for water treatment of throughput similar to ours was presented in [30], but unfortunately no details were given in the article with respect to discharge ignition or energy consumption, so we can not make a qualified comparison to our previous results in [28]. In both of these plasma-cavitation device experiments [28,30], the high volumetric efficiency (of almost 1 m3/h) was obtained for direct plasma remediation of water. However, according to our best knowledge, so far, there are no reports on using such devices for the production of PAW as an active medium itself, allowing flow rates close to 1 m3/h to produce PAW with proven remote, ex-plasma biocidal activity. Reaching this “psychological limit” will significantly push the potential of PAW towards its commercially viable utilization.
In the present paper we demonstrate the efficient production of plasma activated water (PAW) with biocidal activity using HCPJ at the flow rate of 0.55 m3/h and energy efficiency as high as 1 kWh/m3 of PAW. The biocidal activity of produced PAW is demonstrated on the remediation of algae and cyanobacteria by their delayed exposure to plasma activated water (PAW). Unlike in [28], where direct plasma treatment of contaminated medium was studied, here, we used uncontaminated water to produce PAW, and we studied its biocidal effects afterwards. In addition to that, the original HCPJ set-up was modified. The volume of generated plasma was significantly increased by lowering the backpressure at the nozzle output. The PAW was prepared at the volumetric flow rate of 0.55 m3/h at 400 W power input to plasma; at these conditions, 1 to 5 passes of water through the system were tested. For the sake of reference, the HCPJ-induced biocidal effect of PAW was compared with the effect of ozonisation treatment.

2. Materials and Methods

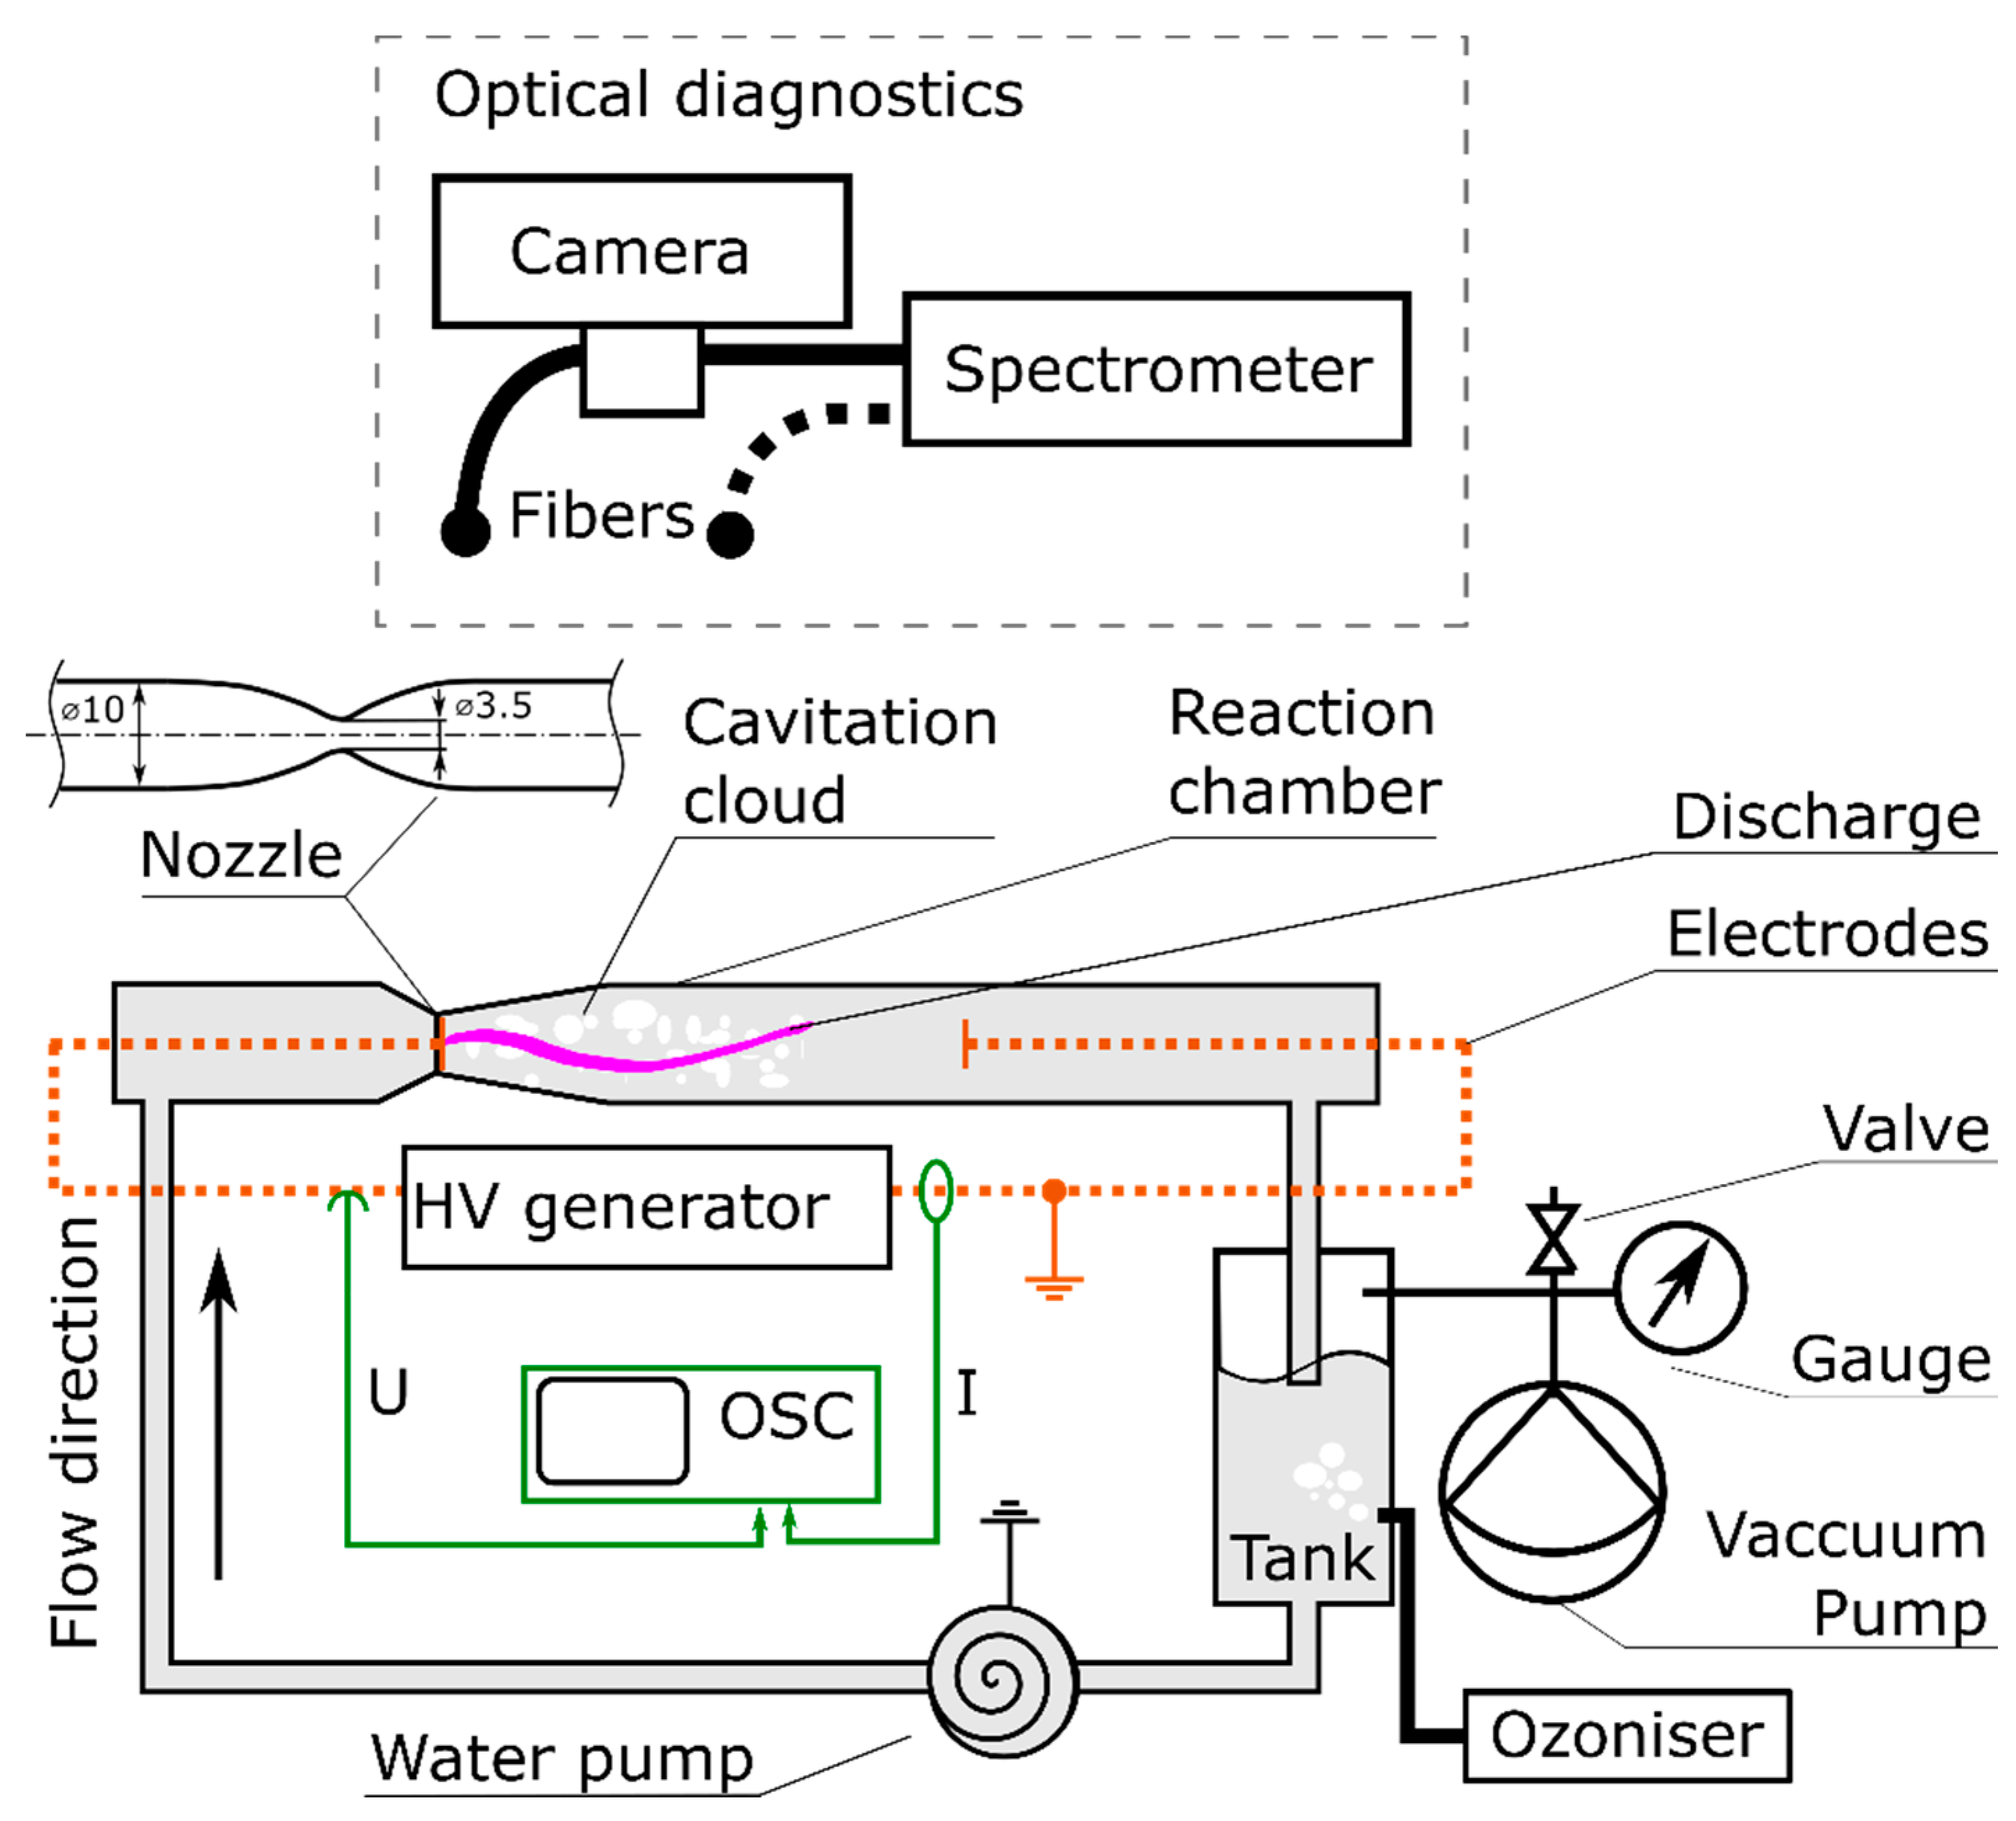
2.1. Hydrodynamic Cavitation Plasma Jet Device (HCPJ)

The setup of the HCPJ device is given in Figure 2. The whole device consisted of the HCPJ unit with HV generator, vacuum unit, ozonizer, and electrical/optical diagnostics. For the presented experiments, the HCPJ device [28] was modified to allow reduction of the backpressure at the water tank below atmospheric pressure, which lead to a significant increase of generated plasma volume. The backpressure of 40 kPa was achieved using a single-stage membrane vacuum pump VM 40 D (LAVAT, Czech Republic), which reduced the gas pressure above the water surface in the water tank. The backpressure was controlled using a gas-tight ball valve and measured with a gas pressure gauge, Leybold Heraeus Nr. 160 40 (Leybold Heraeus, Hanau, Germany). Visual appearance of the discharge ignited using the modified HCPJ unit is shown in Figure 1.
The discharge was ignited in the cavitation cloud generated in the reaction chamber made of a transparent polycarbonate tube (12 mm outer diameter, 10 mm inner diameter) enabling the optical diagnostics of the generated HCPJ phenomenon. The cavitation cloud was generated in the water stream that passed through the Venturi nozzle with a minimum inner diameter of 3.5 mm. The cavitation phenomenon was caused by the Bernoulli‘s principle, and the cavitation was characterized by transition between bubble cloud regime and liquid jet surrounded by vapor, which is characteristic of supercavitation. The cavities were saturated with liquid vapours at vapor pressures of several kPa, making the conditions favourable for the generation of the cavity-plasma jet phenomenon. Reducing the backpressure enabled a substantial expansion of the cavitation cloud region resulting in a substantially prolonged active plasma region. The liquid circuit was a closed-loop circuit with a grounded water pump, CALPEDA CT 61/A (Calpeda S.p.A., Montorso Vicentino, Italy, rated power input 100 W, volumetric flow rate approx. 0.55 m3/h at 40 kPa) and a water tank of approximately 2 L of liquid. For the introduction of the ozone gas into the treated liquid, the ozoniser GO-1000H (PROFI OZON, Praha, Czech Republic) was used.
The discharge itself was generated using two electrodes, depicted using a dashed orange line in Figure 2. They were made of insulated copper wire: 2 mm diameter metal wire and 4 mm diameter with insulation. The wire was cut and submerged co-axially in the liquid stream so that the liquid was in direct contact with only the end surface of the wire. The HV electrode was positioned in the liquid stream in the Venturi nozzle throat, about 6 mm upstream (to the left) from the minimum throat diameter, see Figure 1. The grounded electrode was placed approximately 16 cm from the HV electrode in the reaction chamber behind the cavitation cloud region. The discharge was energized using a custom-made tunable high voltage generator (HV generator) consisting of a low-voltage tunable generator with adjustable output voltage amplitude and a high-voltage transformer for the up-conversion to HV. The HV generator produced at the output an HV of sinewave waveform. The HV frequency could be tuned to enable HCPJ operation close to the resonance of the HV loop to maximize the energy efficiency of plasma generation. In the present experiments, the frequency of 65 kHz was used. The total average input power measured at the input of the HV generator was 400 W and was kept constant for all presented experiments.

2.2. Treatment Procedures of Contaminated Water

The motivation for the presented research was to find an efficient and industrial-scale method for generation of biologically active water medium, enabling large-scale remediation of contaminated water from, for e.g., algae and cyanobacteria. The decontamination process was studied in two series for algae and cyanobacteria contaminated water, respectively. In both series, tap water was treated either with plasma generated in the cavitation cloud, or by ozonation in the water tank. The treated water was then tested for biocidal activity. Two litre samples of untreated reference water and water treated according to the conditions detailed in Table 2 were tested. The water samples were stored in sterile polyethylene terephthalate (PET) bottles and used for cultivation tests the same day.

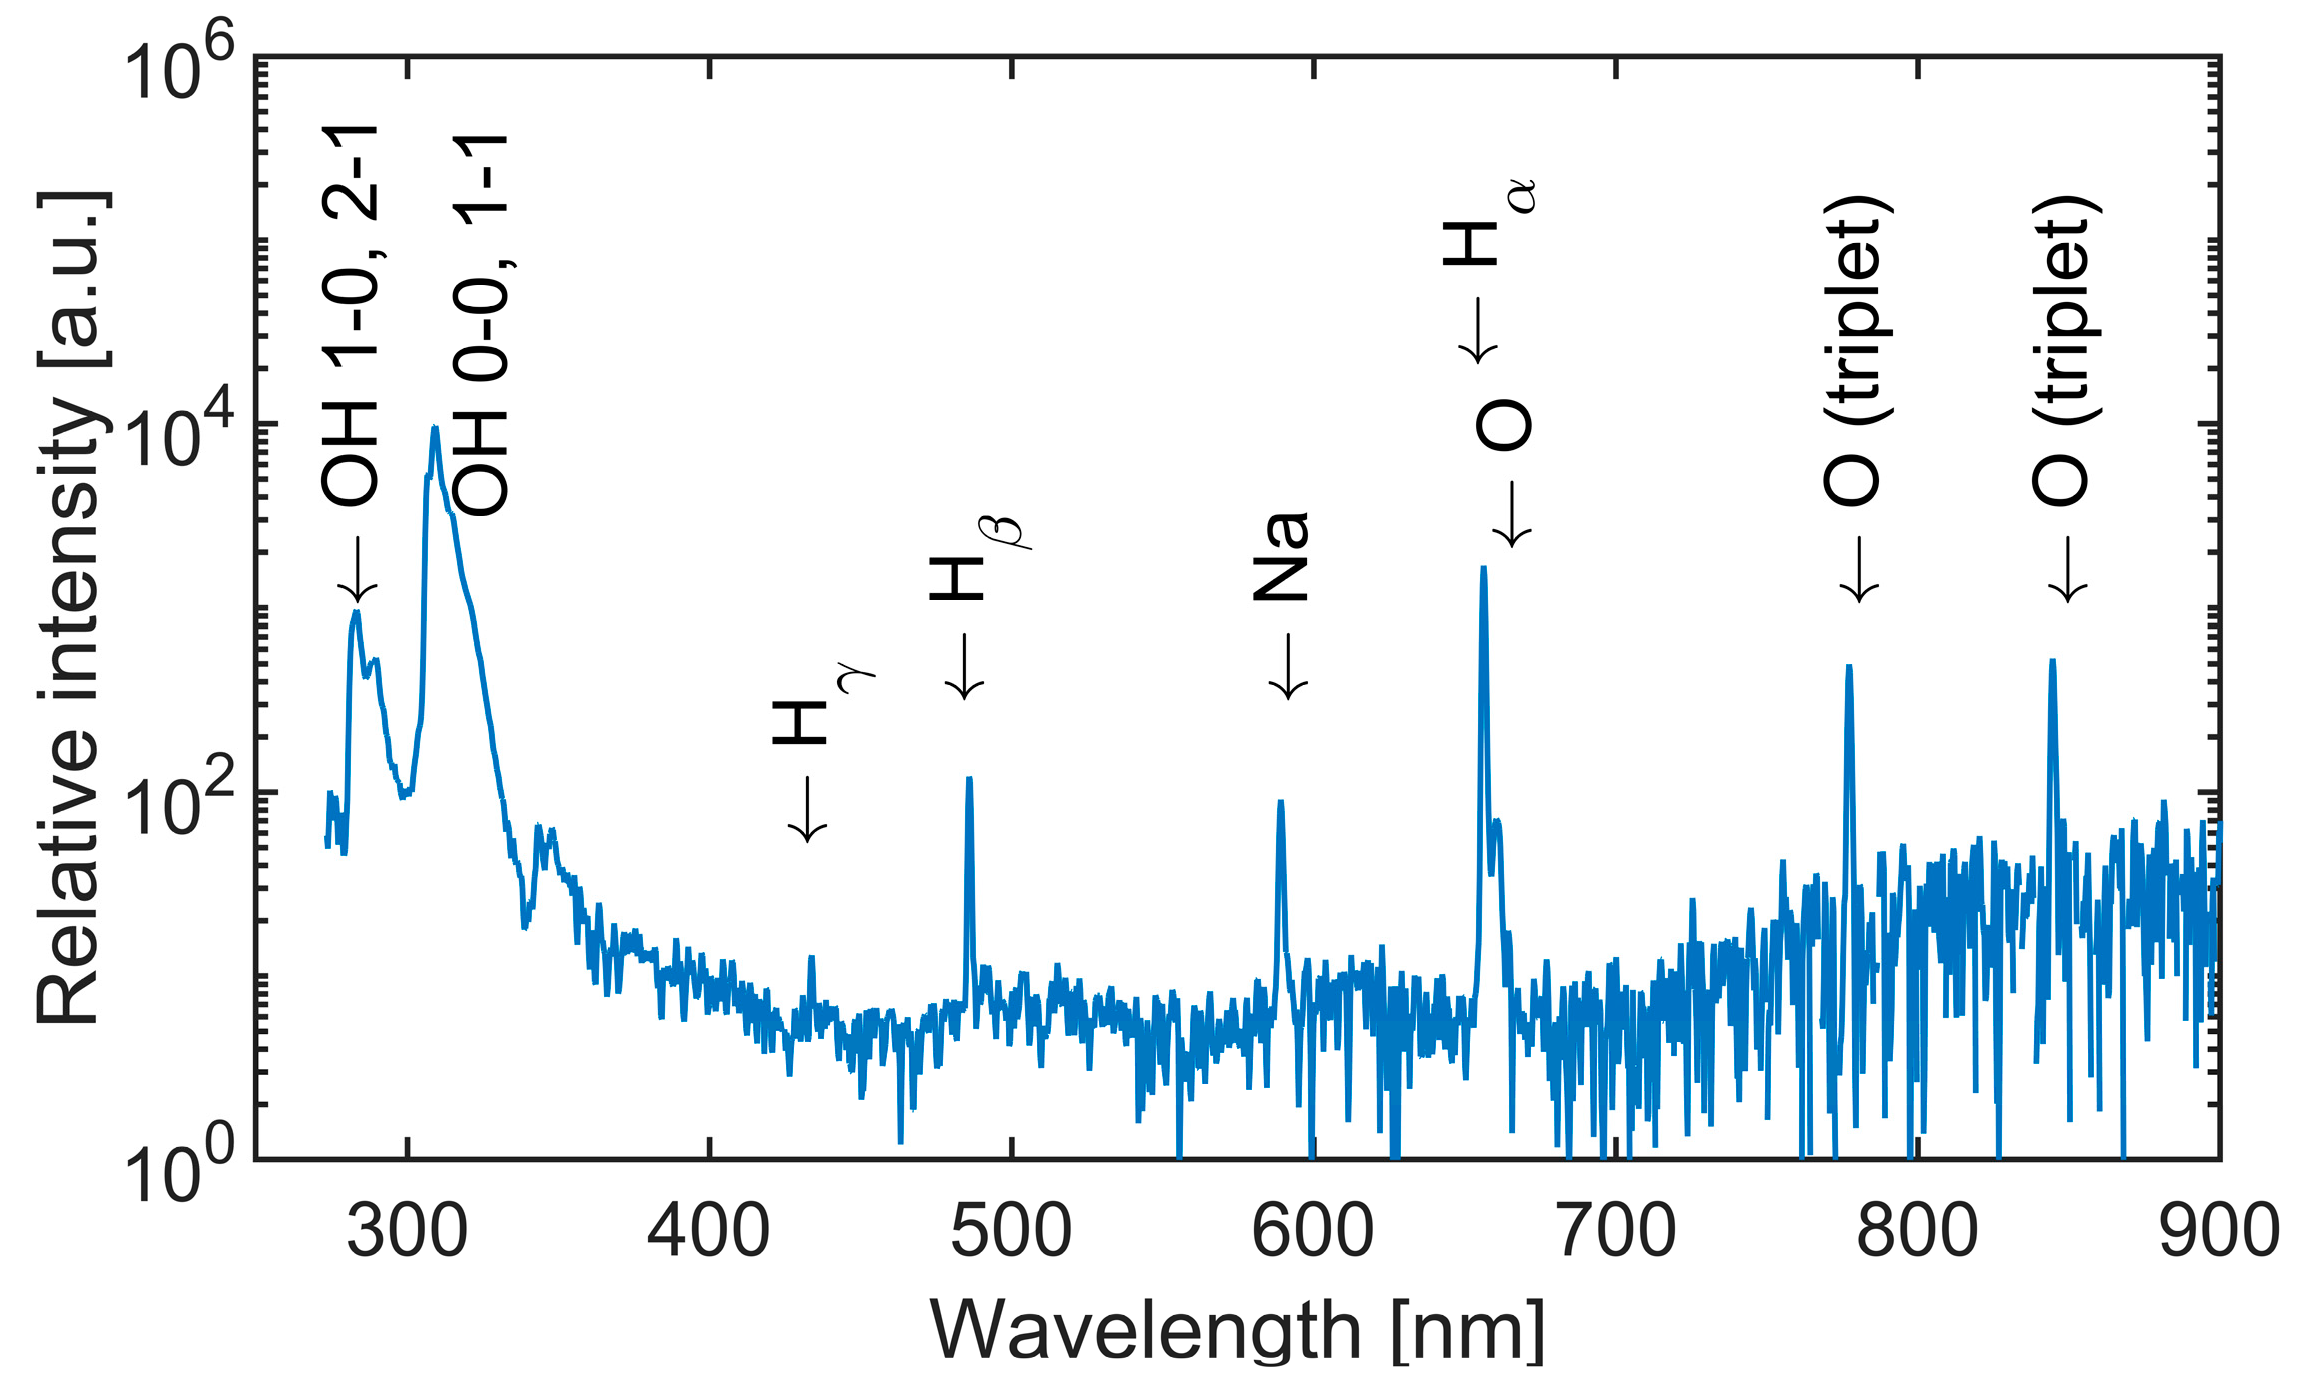
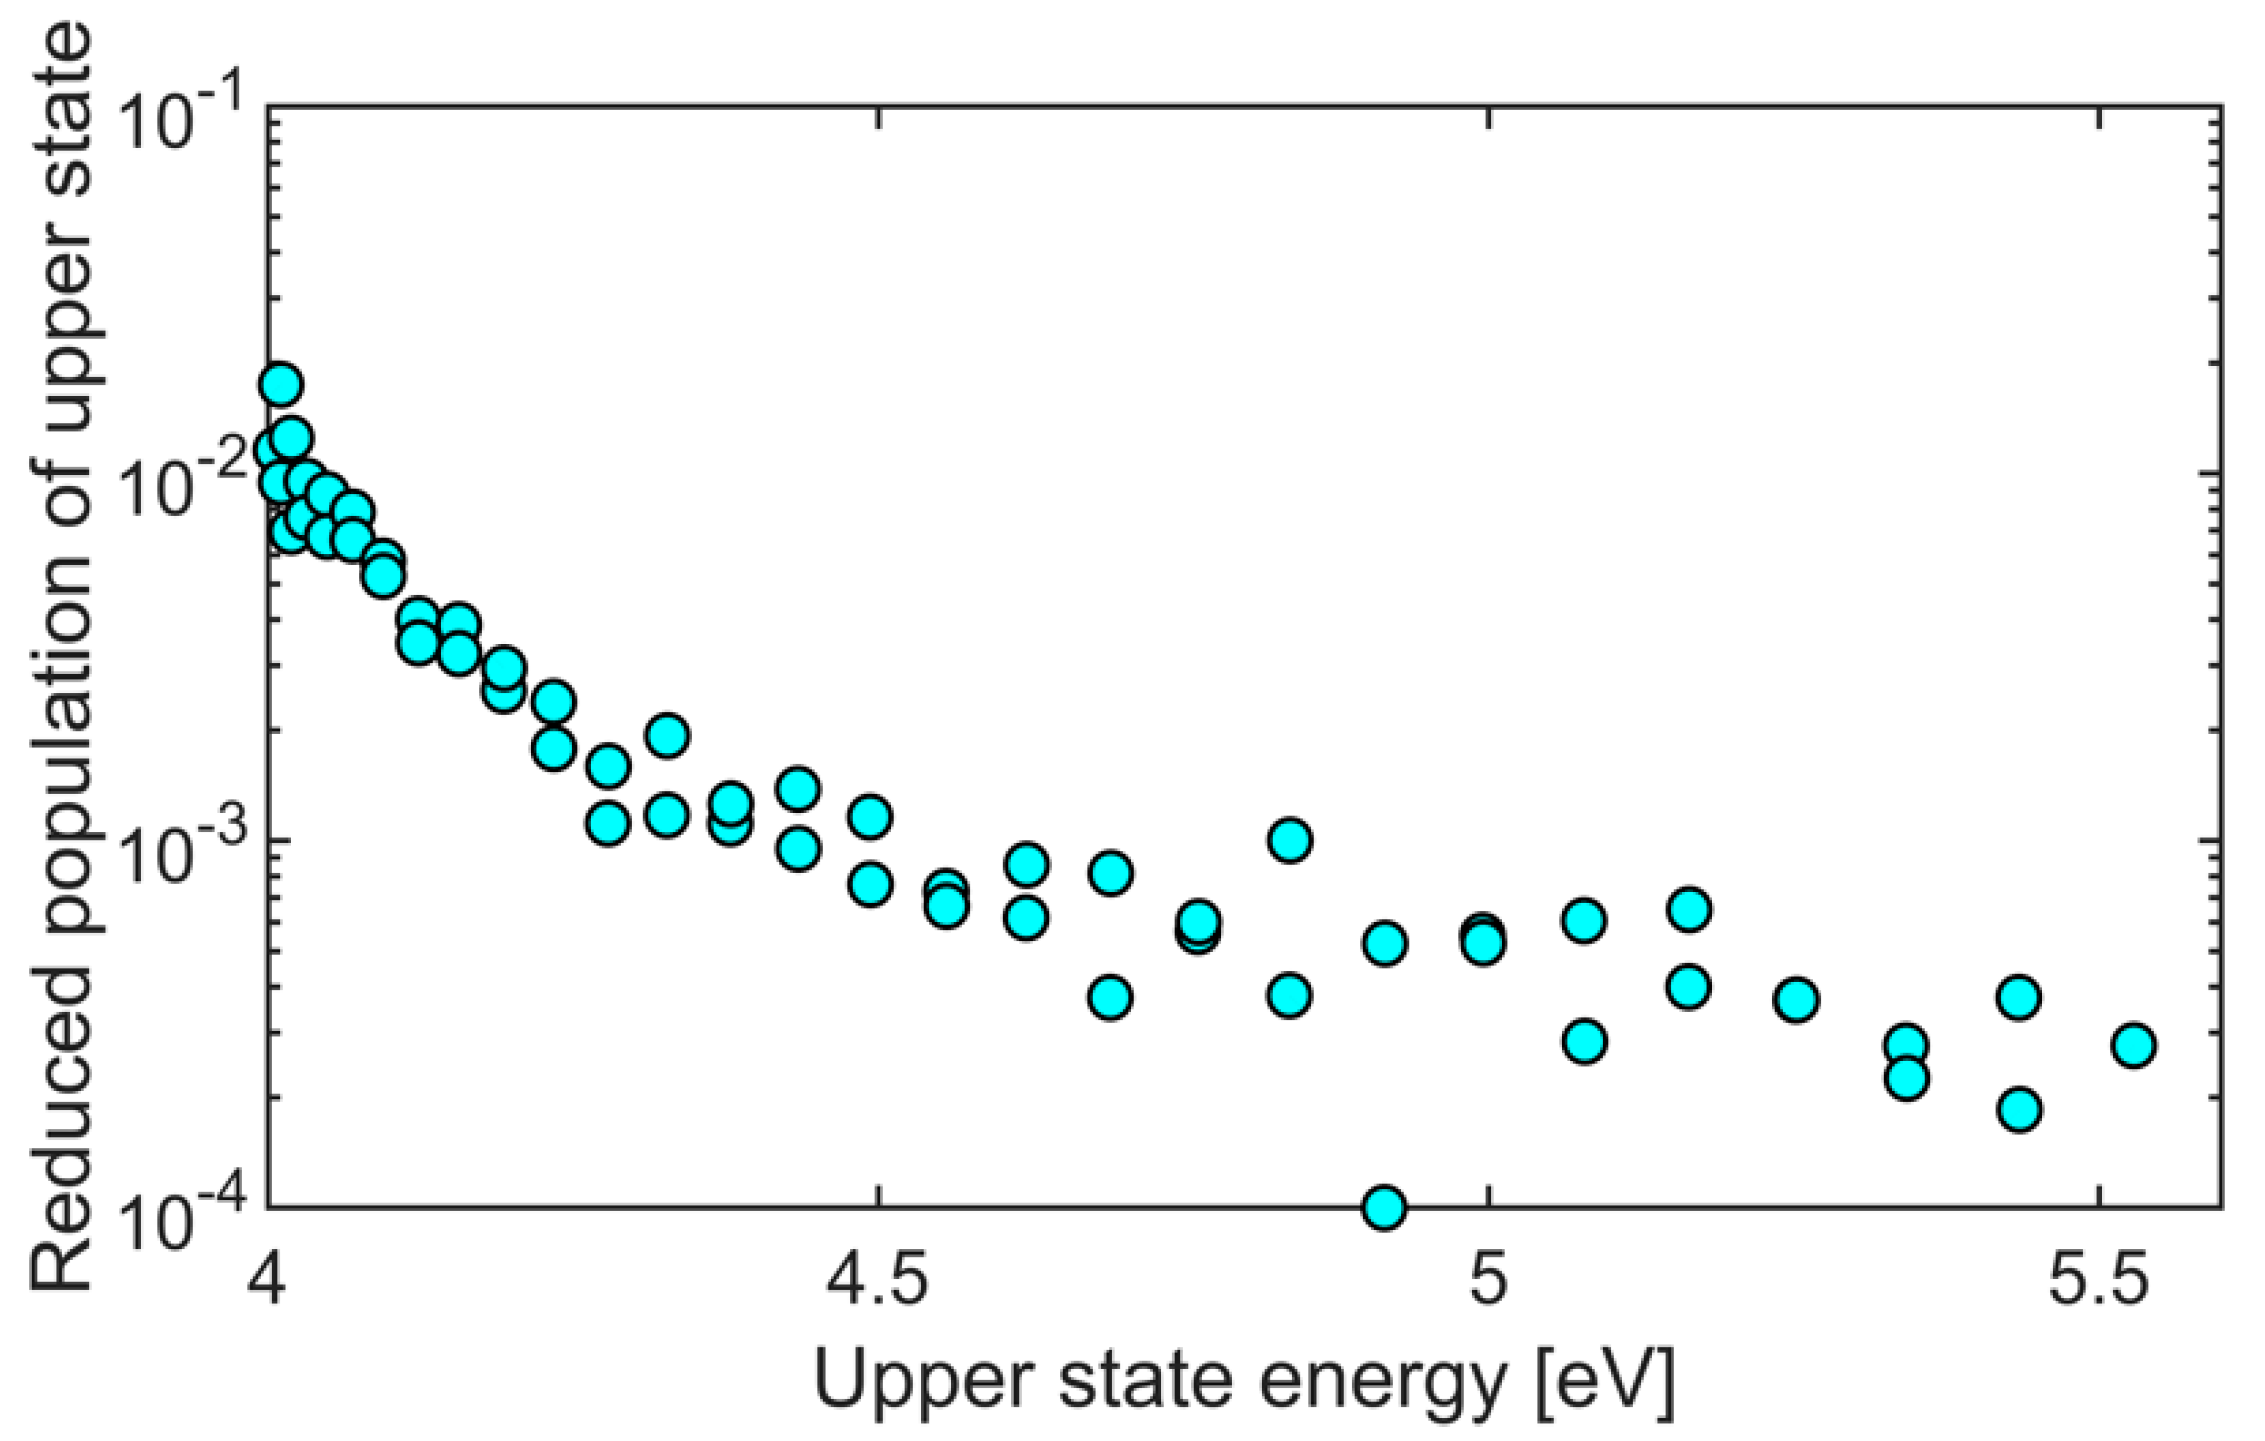
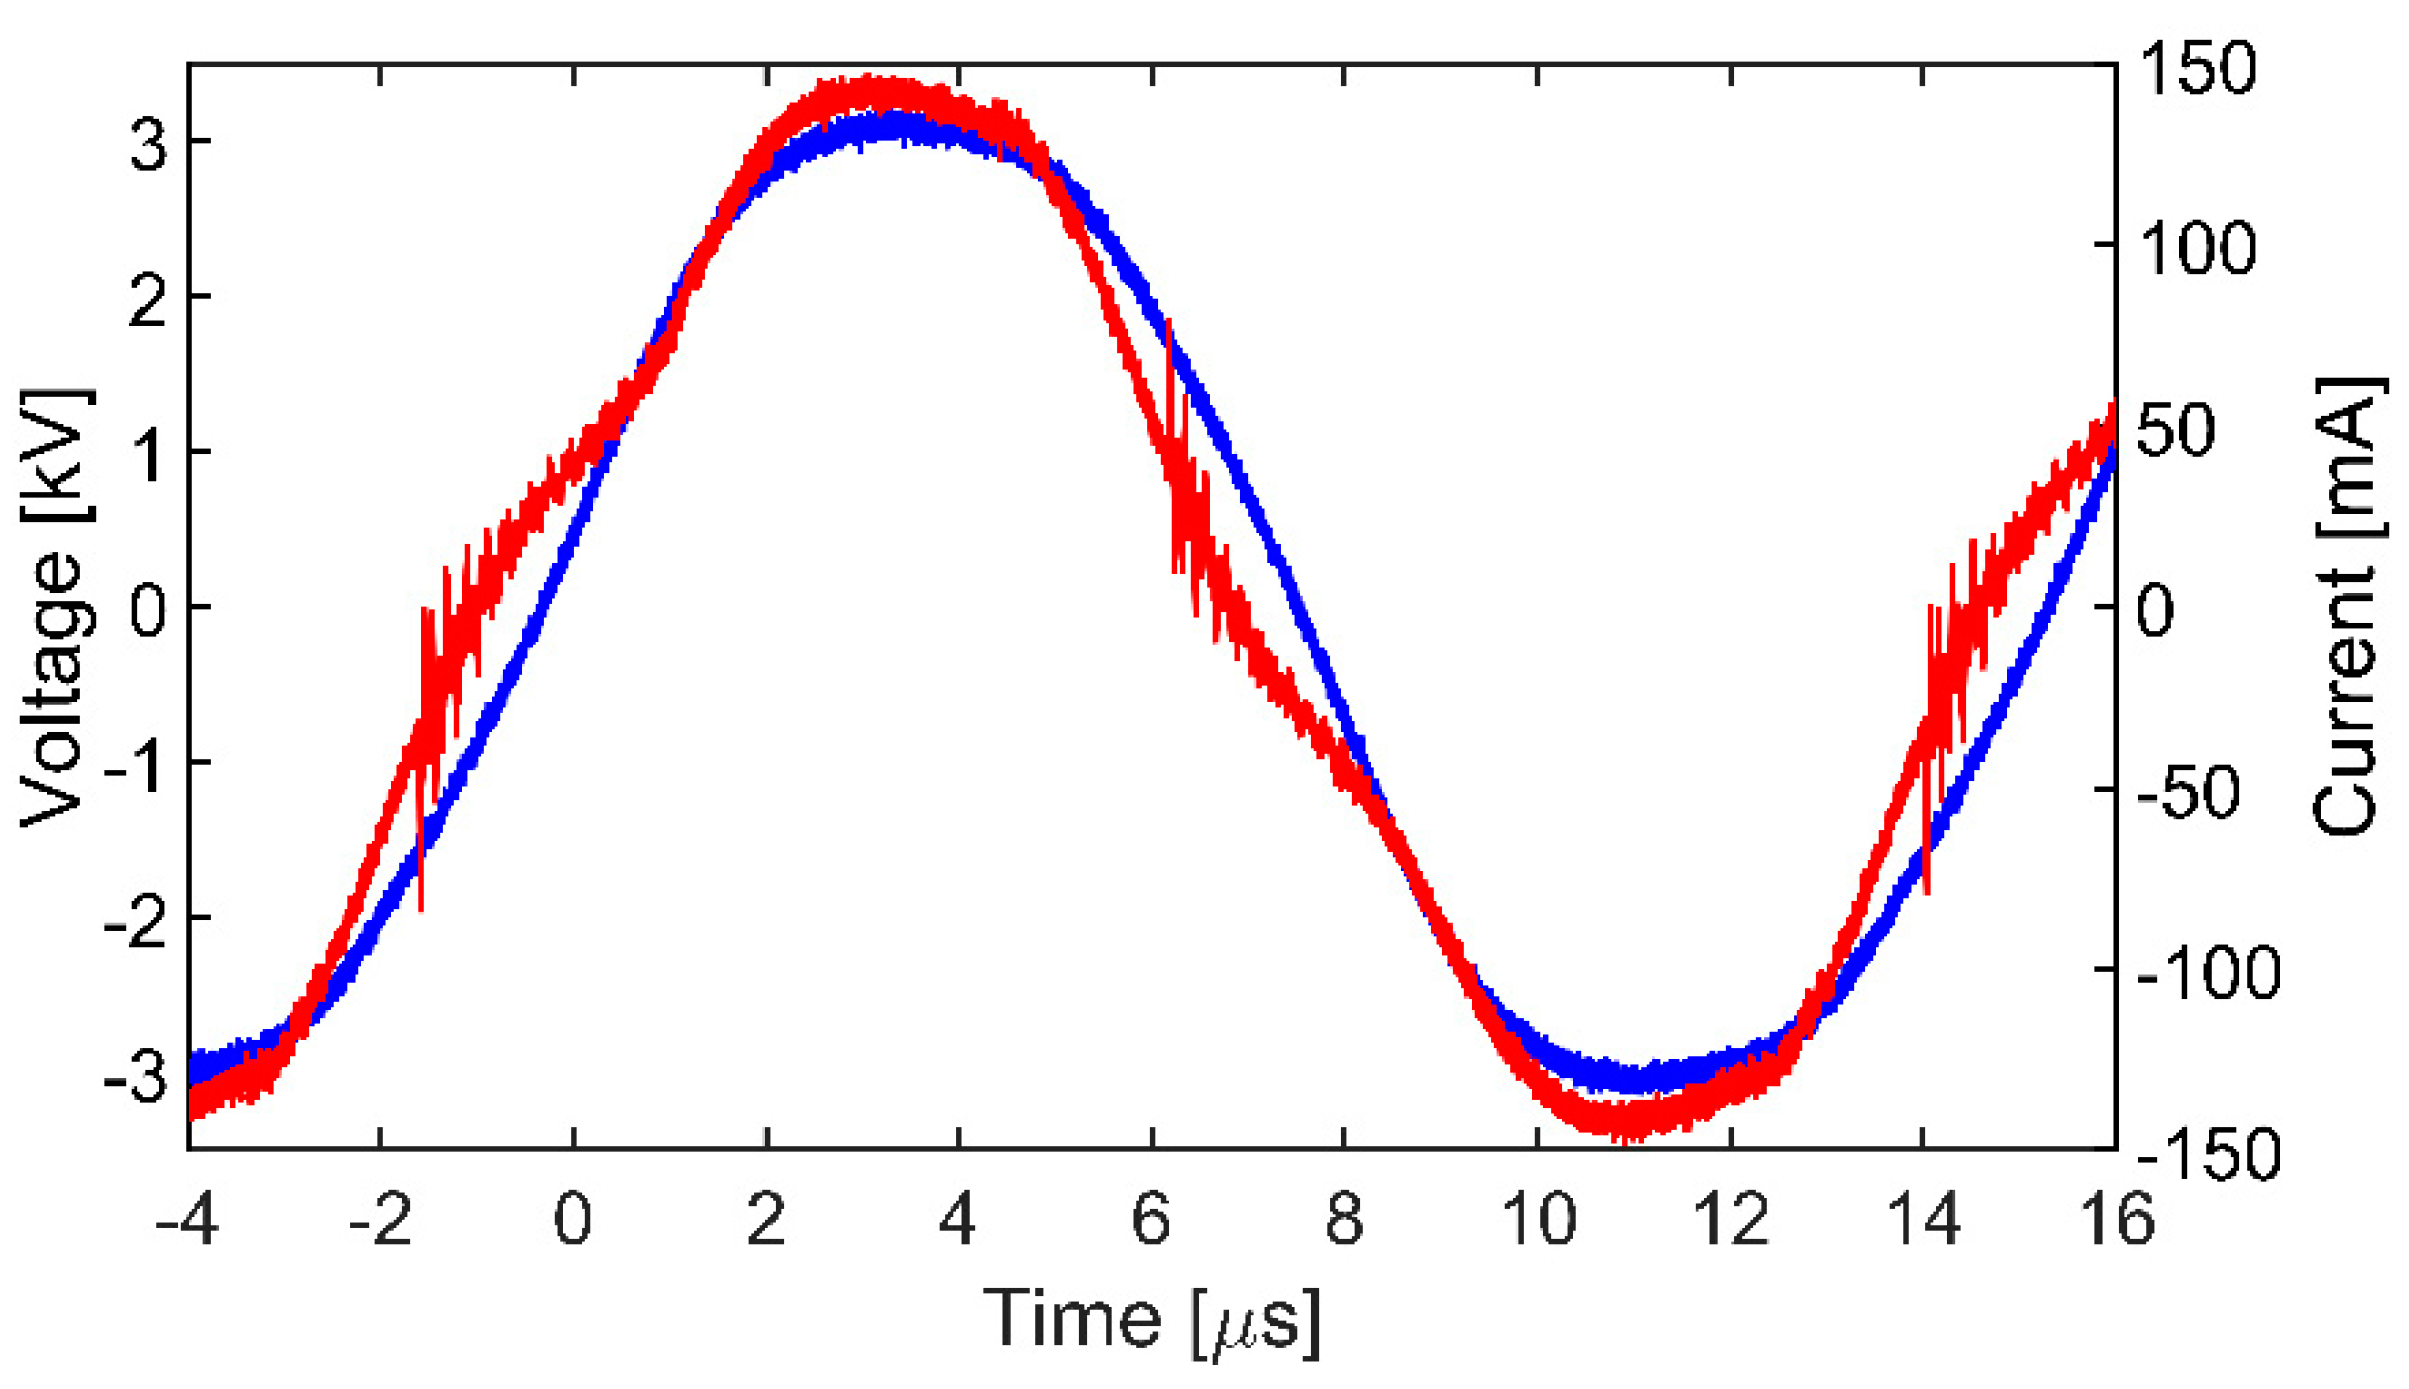
2.3. Diagnostical Methods of the Plasma Jet

The discharge parameters of the HCPJ were studied using electrical and optical diagnostics. The voltage applied to the electrodes and the current flowing through the reactor was followed using a digital storage oscilloscope (labelled OSC in Figure 2), Infiniium DSO-S 204A (Keysight Technologies Inc., Santa Rosa, CA, USA), which enabled continuous acquisition of up to 52 MPts/channel at 2 GHz bandwidth with 10 GSa/s with high-definition resolution of 10-bit. For the voltage and current measurement, the oscilloscope was equipped with an HV probe, Tektronix P6015A, and Pearson 2877 current monitor.
For the optical diagnostics, a fast framing camera in visible (VIS) wave range and two spectrographs operating in ultraviolet (UV) and visible-to-near infrared (VIS-NIR) were used. The Sony CyberShot DSC-RX10 III camera (Sony Corporation, Tokyo, Japan) was used to follow the evolution of the plasma-cavitation phenomenon dynamics. The camera (20 MPix, focal length 24–600 mm, f-number 2.4–4) enabled us to capture the motion in a high-speed framerate of 1000 fps at reduced effective resolution of 1136 × 384 pixels at three colour channels (red, green, blue) simultaneously. This enabled the capturing of slightly averaged spatio-temporal evolutions of the HCPJ, averaging approximately 60 periods of the discharge in a single frame at the estimated (theoretical) spatial resolution of 0.25 mm in the lateral dimension and 0.4 mm in the radial dimension.
Optical emission spectra of the discharge were consecutively recorded in two spectral ranges (UV and UV-VIS-NIR). The emission of the discharge was consecutively acquired from two distinct regions above both ends of the discharge channel. Two quartz optical fibres were used to sample the emission of the discharge (2 m, single fibre 600 µm; Avantes BV, Apeldoorn, The Netherlands). The first fibre was placed above the HV electrode situated inside the Venturi nozzle. The second fibre was placed above the other end of the discharge channel approximately 9 cm away from the first fibre in the direction of the flow of the cavitation cloud. The spots from which the spectra were captured were approximately 1 cm in diameter.
The spectra were recorded without temporal resolution using two fixed grating AvaSpec ULS3648TEC-USB2 spectrometers (Avantes BV). The range of the spectrometer for survey spectra in the broad spectral was from 200 nm to 1100 nm, and it was equipped with a grating UA (200–1100 nm) and entrance slit with the width of 25 µm. The spectral orders that overlapped were suppressed using order-sorting coating with 350 and 600 nm long pass filters. The theoretical resolution of the survey spectrometer configuration was in the order of 1.1 nm. For the acquisition of discharge emission from the UV range with higher spectral resolution, the second spectrometer was used. The second spectrometer was equipped with a grating UE (290–395 nm) and entrance slit with the width of 10 µm and offered a theoretical spectral resolution of the order of 0.1 nm. The recorded spectra were then analysed using a Spectrum Analyzer 1.8 (Masaryk University, Brno, Czech Republic, [34]) and a massiveOES (Masaryk University, Brno, Czech Republic [35,36]).

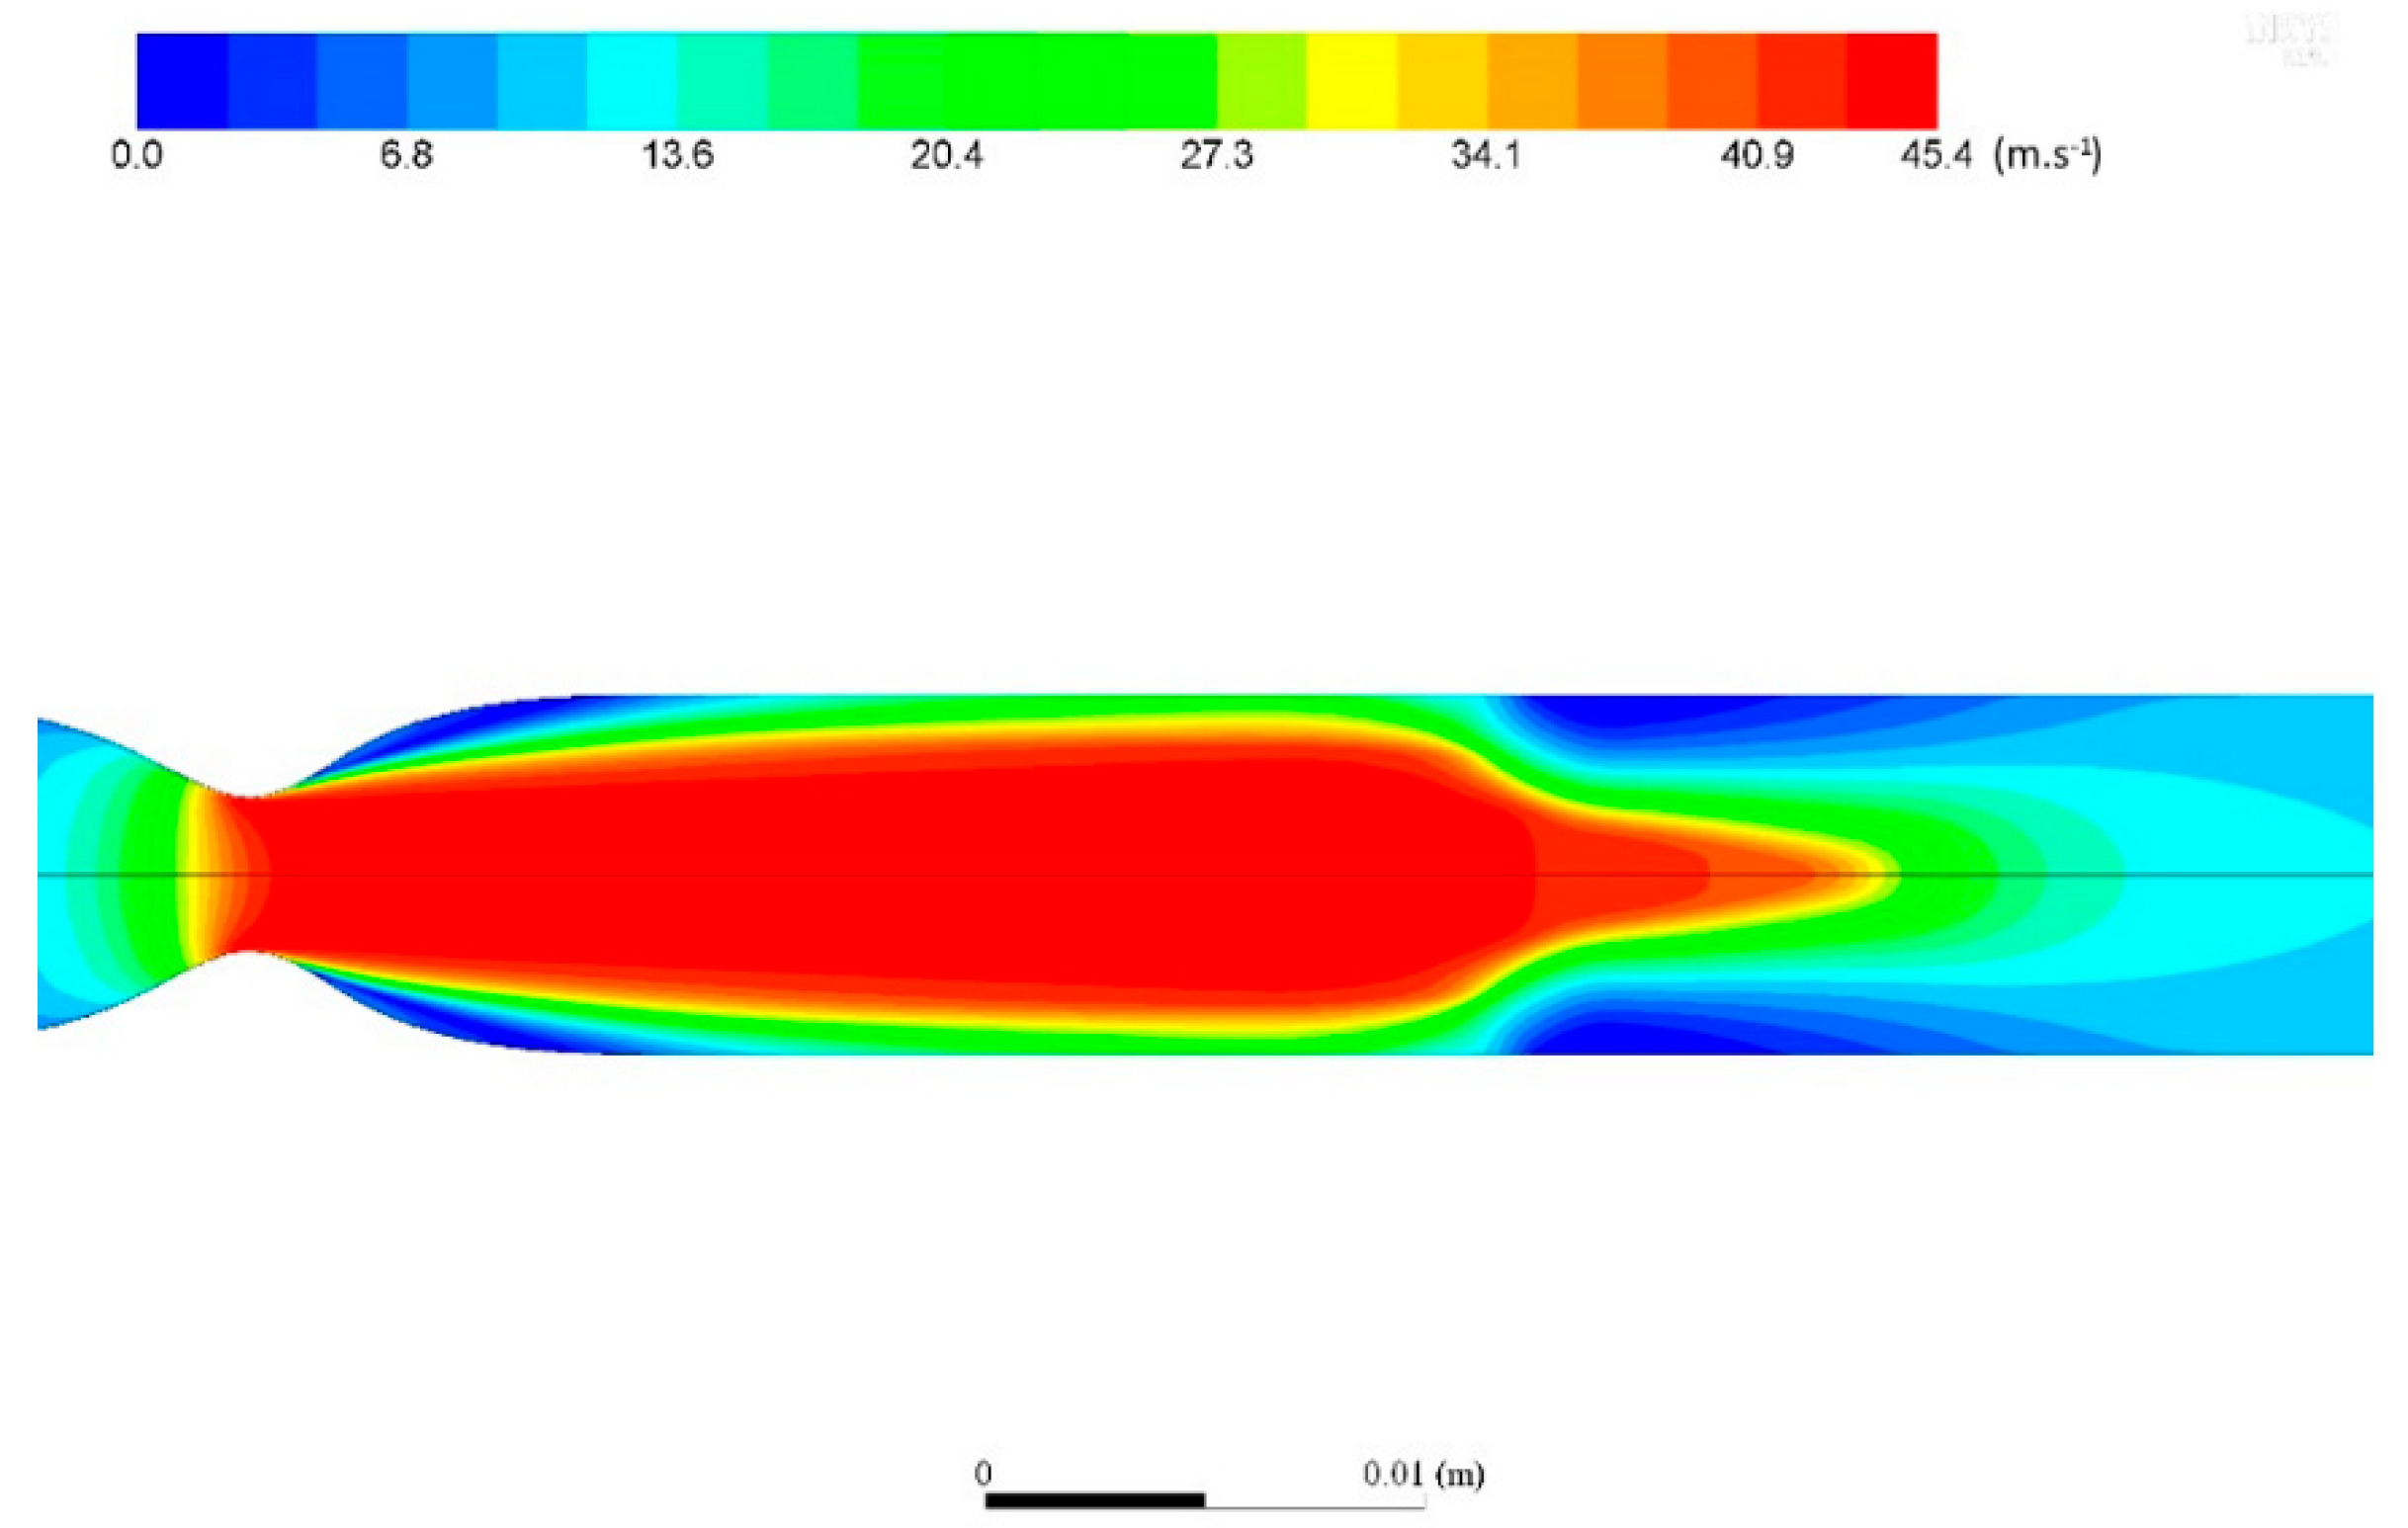
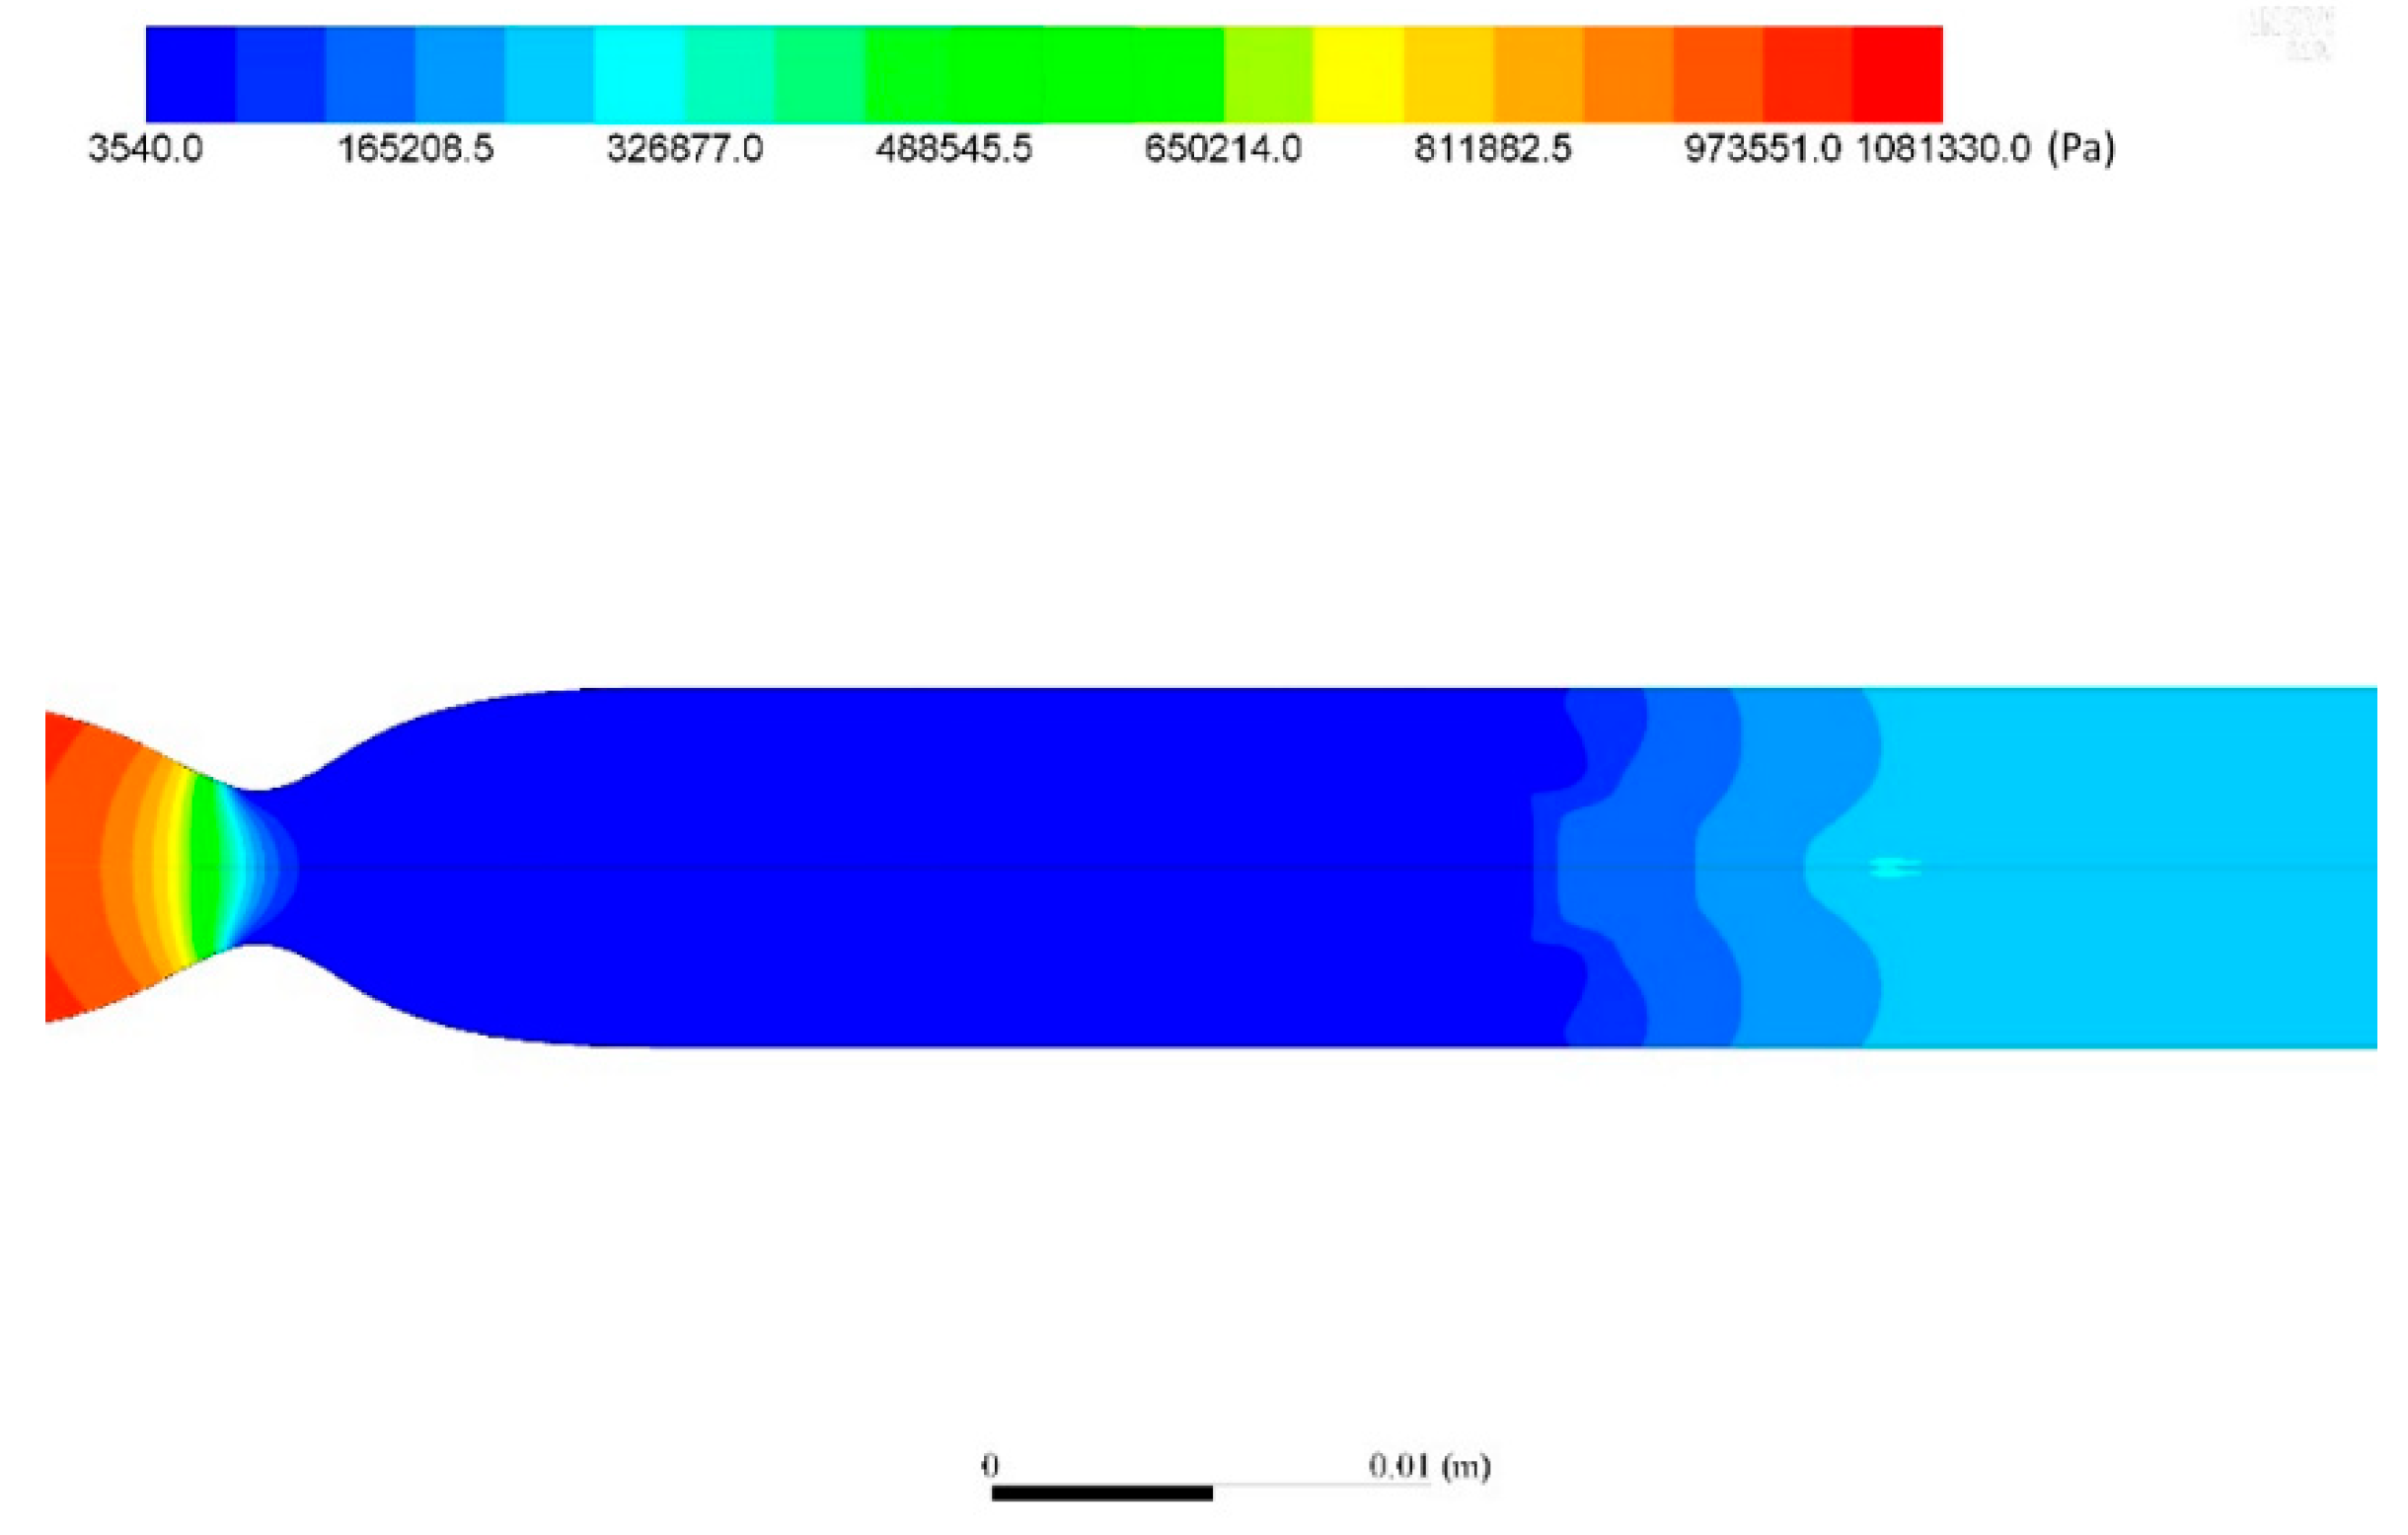
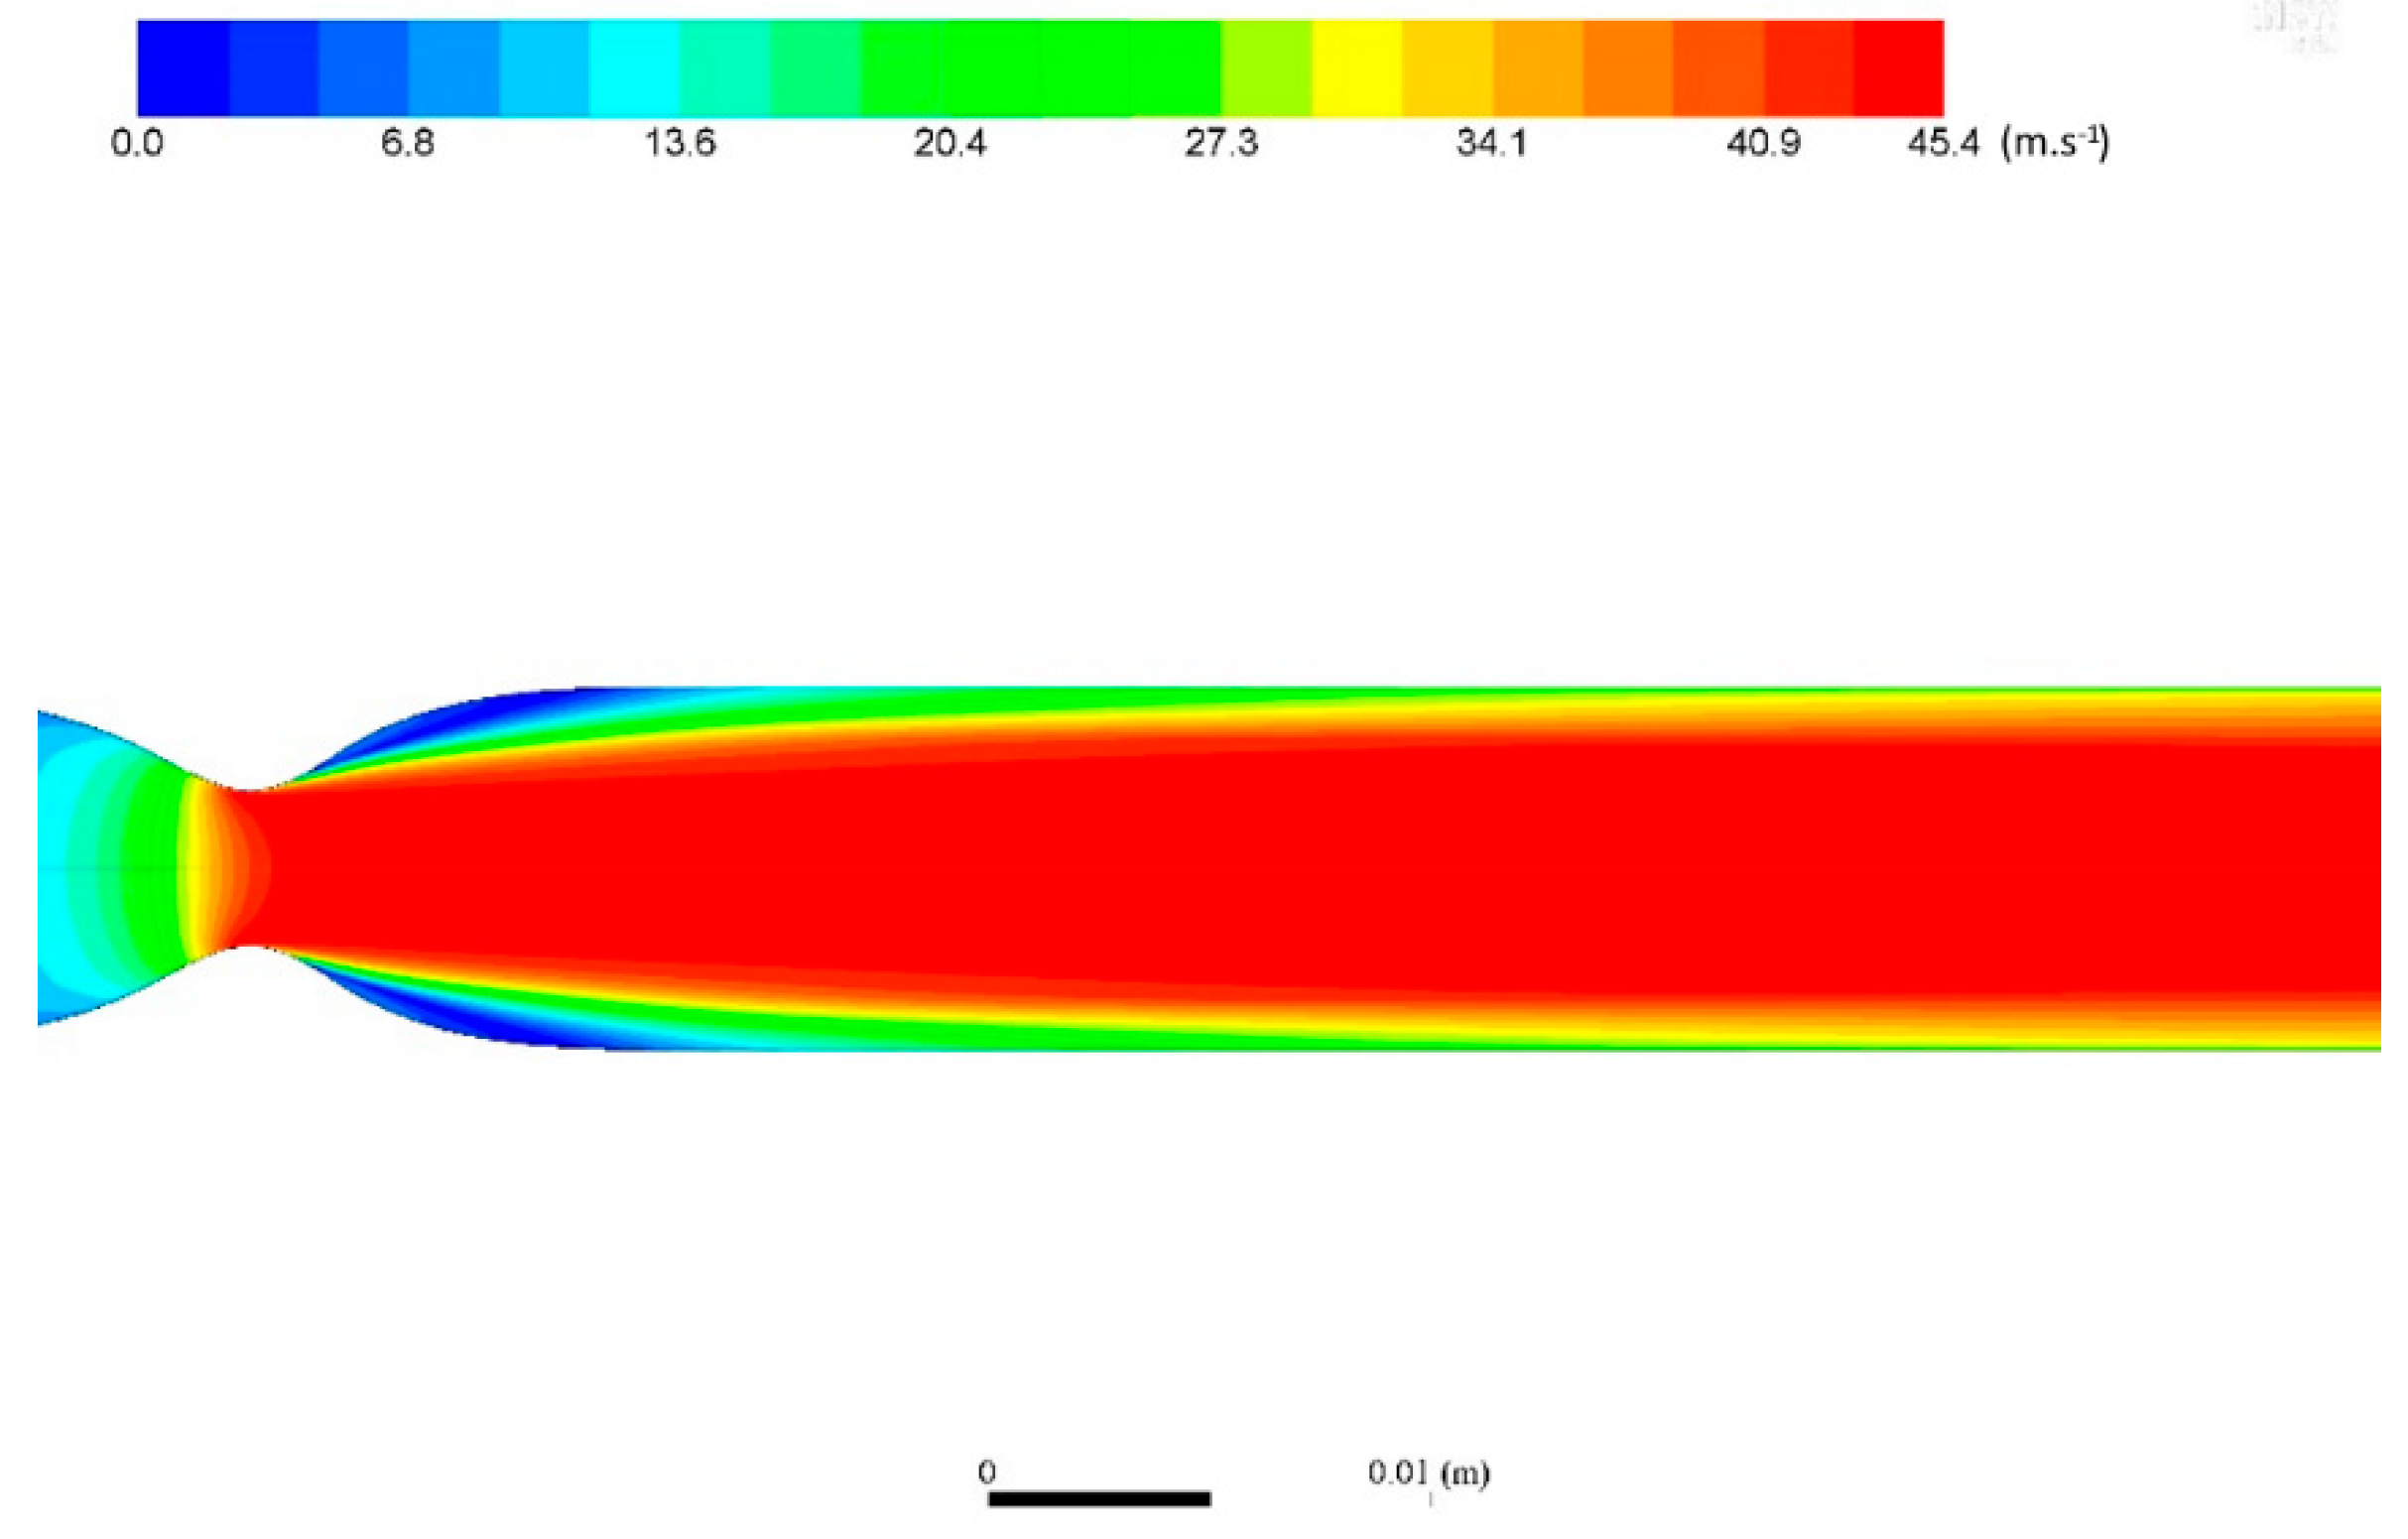
2.4. Model of Hydrodynamic Cavitation at Reduced Backpressure

The numerical simulation of the cavitating flow without the discharge was performed to better understand the behaviour of the HCPJ at reduced pressure. The backpressure in the model was taken as the outlet pressure of the nozzle. The simulation was performed using the commercial computational fluid dynamics (CFD) software (ANSYS, ANSYS, Inc., Canonsburg, PA, USA; [37]). The simulation was based on the Schneer–Sauer model [38]. The model employs a truncated Rayleigh–Plesset equation, and it is relatively robust and sufficiently accurate to gain the necessary insight into the dynamics of the cavitation phenomenon in studied conditions. Details of the model are given in Appendix A.

2.5. Algae and Cyanobacteria Culturing Conditions, Growth Inhibition Test

The green alga Raphidocelis subcapitata (Korshikov) and the cyanobacterium Synechococcus elongatus (Nägeli) were used as test organisms. Cultures of these species were obtained from the Culture Collection of Autotrophic Organisms (CCALA), Třeboň, Czech Republic. The organisms were cultivated in 100 mL Erlenmayer flasks at 24 ± 1 °C under continuous illumination (90 µmol m2/s) by fluorescent lamps (Phillips, TLD 36 W/33) in growth media. As a cultivation medium, ZBB medium was used—a 1:1 combination of Z-medium (Zehnder and Staub medium) and BB-medium (Bristol and Bold medium), media preparation and composition can be obtained in https://utex.org/products/bold-basal-medium.
The growth inhibition test using the unicellular green algae and cyanobacteria was evaluated using a modified variant of the ISO 8692 test procedure, see https://www.sis.se/api/document/preview/914323/. The aim of these tests was to determine the effects of treated water on the growth of freshwater microalgae or cyanobacteria. The growing test organisms were exposed to the treated water in 96-well cell culture plates from Thermo Fisher Scientific containing 250 µL of sample per well over a period of 24–72 h. The growth rate in experiments was evaluated by performing in vivo fluorescence measurements using a microplate fluorescence reader SPARK (Tecan, Männedorf, Switzerland).
The growth media and inoculum cultures were prepared and used according to EN ISO 8692:2012 and Culture Collection of Algae and Protozoa (CCAP, https://www.ccap.ac.uk/). Z-medium was mixed 1:1 with PAW, ozone treated water was mixed 1:1 with ZBB medium, to keep equal nutrient composition in all tests. The initial cell concentrations for the alga and cyanobacterium were 100,000 cells per mL and 400,000 cells per mL, respectively. The plates were covered with a transparent lid and incubated under standard light and temperature conditions without shaking/mixing (see ISO 8692 for cultivation conditions).

3. Results and Discussion

The results of experimental findings and their discussion are divided into two sections. First, we describe the active environment generated by the HCPJ unit by means of the discharge characterisation. Second, we discuss the results of the biological effects showing the comparison of studied techniques on algae and cyanobacteria deactivation.

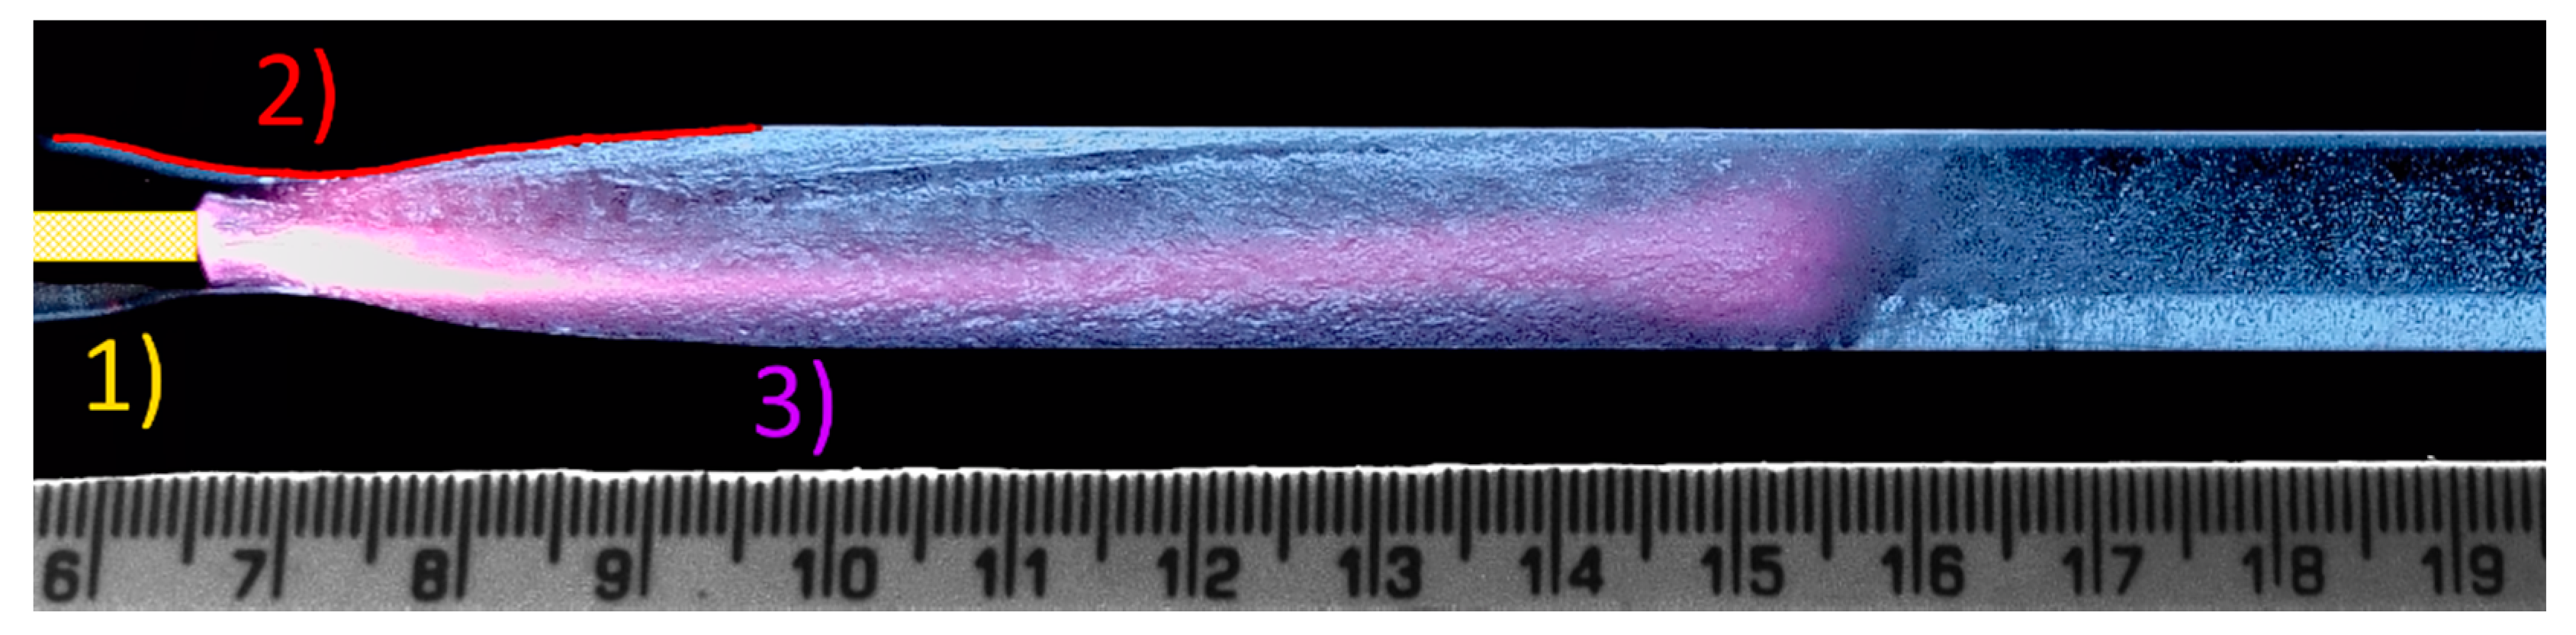
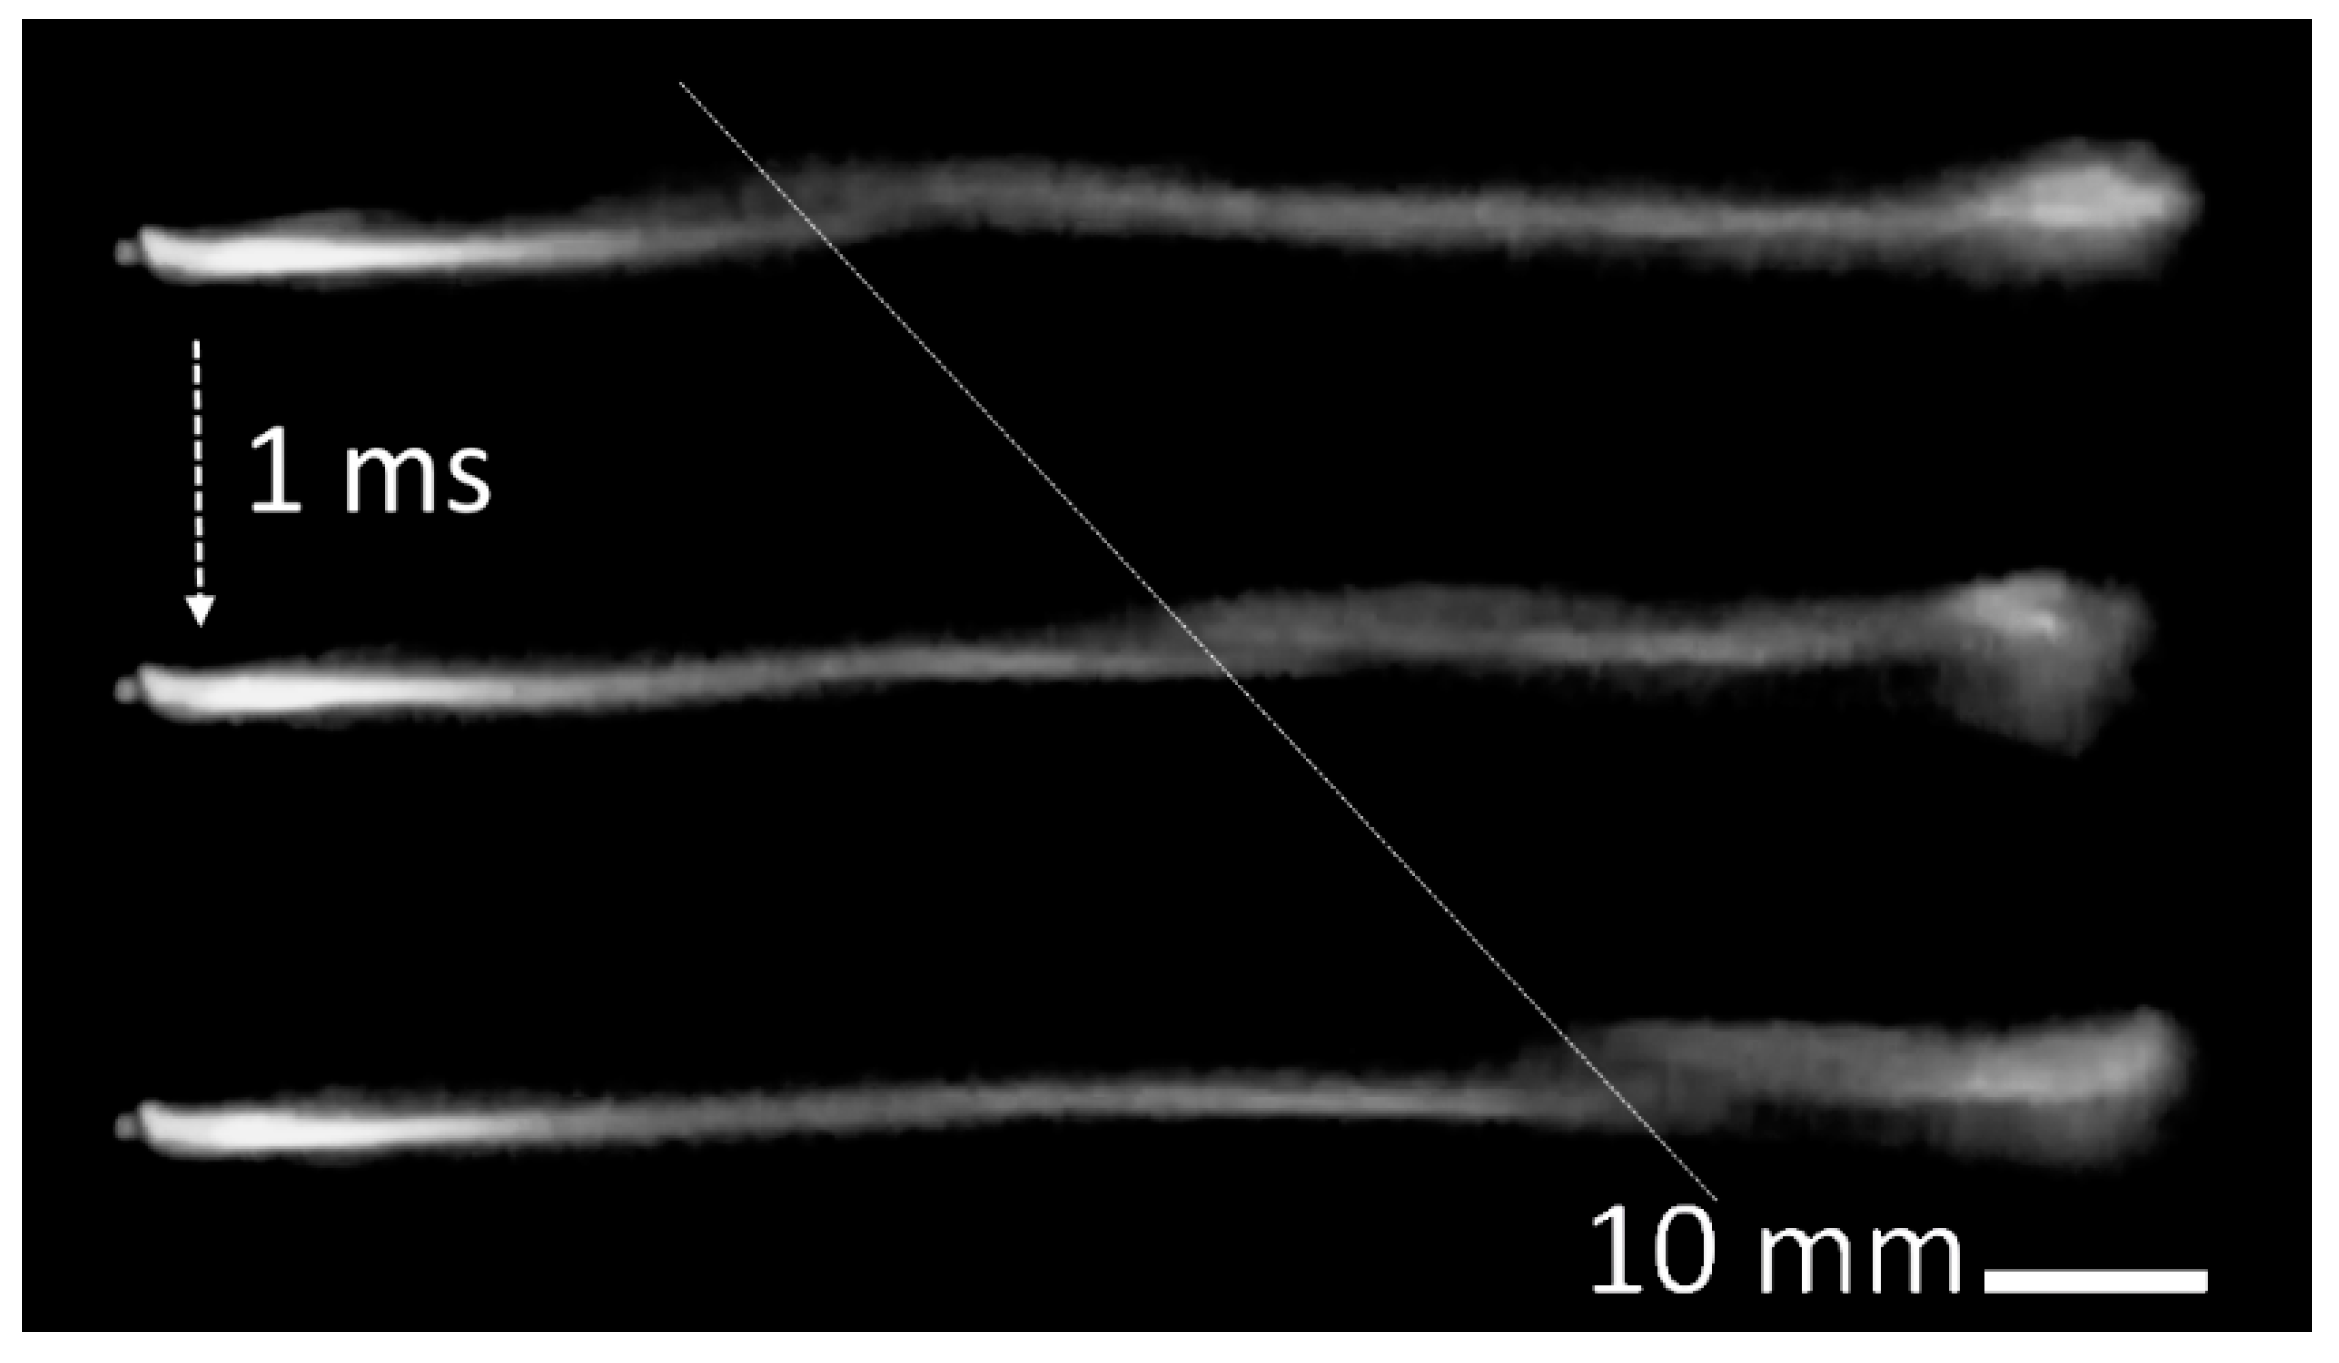
3.1. Phenomenological Description of HCPJ Generated at Sub-Atmospheric Pressure

The HCPJ represents a specific type of plasma jet operating in the highly complex environment of the liquid cavitation cloud located to the right of the HV electrode (Figure 1 and Figure 2). The HCPJ manifested itself as a luminous plasma channel generated in the cavitation cloud in the space between the electrodes. A highly luminous part of the discharge was located in the cavitation cloud next to the HV electrode, i.e., to the right of the HV electrode with respect to Figure 2. From that point the channel propagated mostly as a visually constricted channel in the cavitation-liquid stream. The channel could be narrow or twisted along the inner surface of the flow conduit. The discharge channel ended in a visually branched structure resembling the structure of the streamer discharge in gasses [39]. The branched end was situated near the end of the cavitation cloud in the region where the density of cavities dropped rapidly due to collapse (i.e., condensation), see Figure 1.
Figure 3 shows the comparison of the HCPJ operating at reduced backpressure of 40 kPa (a) and at atmospheric pressure of 100 kPa (b). The length of the plasma channel decreased with the increase of the backpressure at the reaction chamber. From the image in Figure 1 and the sequence of high-speed images of the discharge, we inferred that the average discharge length at 40 kPa backpressure ranged from 9 to 9.5 cm, which correlated with the actual length of the generated cavitation cloud. The channel length at 40 kPa backpressure was more than 6 times longer than that at the atmospheric pressure conditions.
The principal mechanisms of the HCPJ discharge generation has not been studied in detail yet. The empirical analyses of the high-frame-rate videos of the discharge evolution given in Figure 4 suggest that the discharge phenomenon is strongly coupled to the evolution of the cavitation cloud. The observed evolution of various irregularities appearing in the discharge column corresponded to the estimated stream velocity obtained from the CFD simulation. The estimated irregularity propagation speed was 20 m/s, which roughly corresponds to the speed of sound in the cavitation cloud, which is a mixture of saturated vapour and water [40]. This is also in strong agreement with our CFD model that predicts the presence of the boundary layer in the vicinity of the inner surface of the tube with the flow velocity of the same order, i.e., approximately 20 m/s, see Figure A5, Figure A6 and Figure A7 in Appendix A for details. Furthermore, the observation of HCPJ irregularity propagation along the tube indicates that the presence of the discharge strongly influences the dynamics of the formed cavitation cloud. Hence the HCPJ should be treated as a highly complex plasma–fluid dynamics phenomenon that requires a robust multidisciplinary approach.
Figure 5 shows the optical emission spectra of discharge at reduced pressure conditions. Discharge emission was dominated by the emission of an OH radical at the UVB range around 280–315 nm, which was followed by the emission of H atomic lines (Hα, Hβ, Hγ) with the dominant emission of Hα at 656 nm and emission of atomic oxygen with dominant triplets at 777 nm and 846 nm, respectively. The variation of the background fell within the sensitivity/noise limits of the used setup and therefore it could represent only an artifact of the sensitivity correction of the measured spectra, not the radiation of spectral continua. For the long plasma channel at reduced pressure conditions, we investigated the differences of the HCPJ to the right of the HV electrode (i.e., in the nozzle) and at the end of the cavitation cloud. Using optical emission spectroscopy, we have found that to the degree of uncertainty of our measurement, the spectrum was qualitatively the same.
Although the spectral resolution of UV spectrometer was not sufficient to resolve individual spectral lines of rovibronic transitions of OH (A-X) emission, we were able to fit the recorded spectra of OH (A-X) emissions at around 310 nm using a state-by-state simulation approach adopted in the massiveOES software [35,36]. Only υ’ = 0 and υ’ = 1 transitions were assumed for performing the Boltzmann plot fitting procedure in the software. From the resulting Boltzmann plot of the OH (A-X, υ’ = 0) transitions given in Figure 6 we could deduce a possible two-temperature distribution, keeping in mind the experimental errors of the used method, i.e., the sensitivity of spectrometers, signal-to-noise ratio, spectral calibration, or unknown transmissivity of the cavitation cloud. Similar behaviour is well described for gas discharges involving water or water vapours (see, e.g., [35,36,41]).
Figure 7 shows a single period of the HCPJ current and voltage at reduced backpressure of 40 kPa and at HV power supply input power of 400 W and a frequency of 65 kHz. The current flowing through the reactor and voltage measured at the discharge electrodes are slightly phase shifted, which indicates the complex impedance of the HCPJ with the prevailing resistive part and capacitive reactance dominating the imaginary part. At the given conditions, the peak-to-peak value of HV was approximately 6.4 kV and the peak-to-peak value of the current was approximately 300 mA.

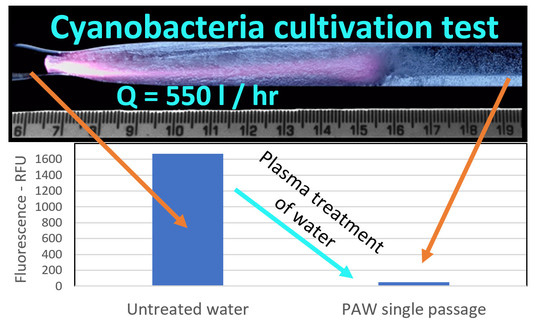
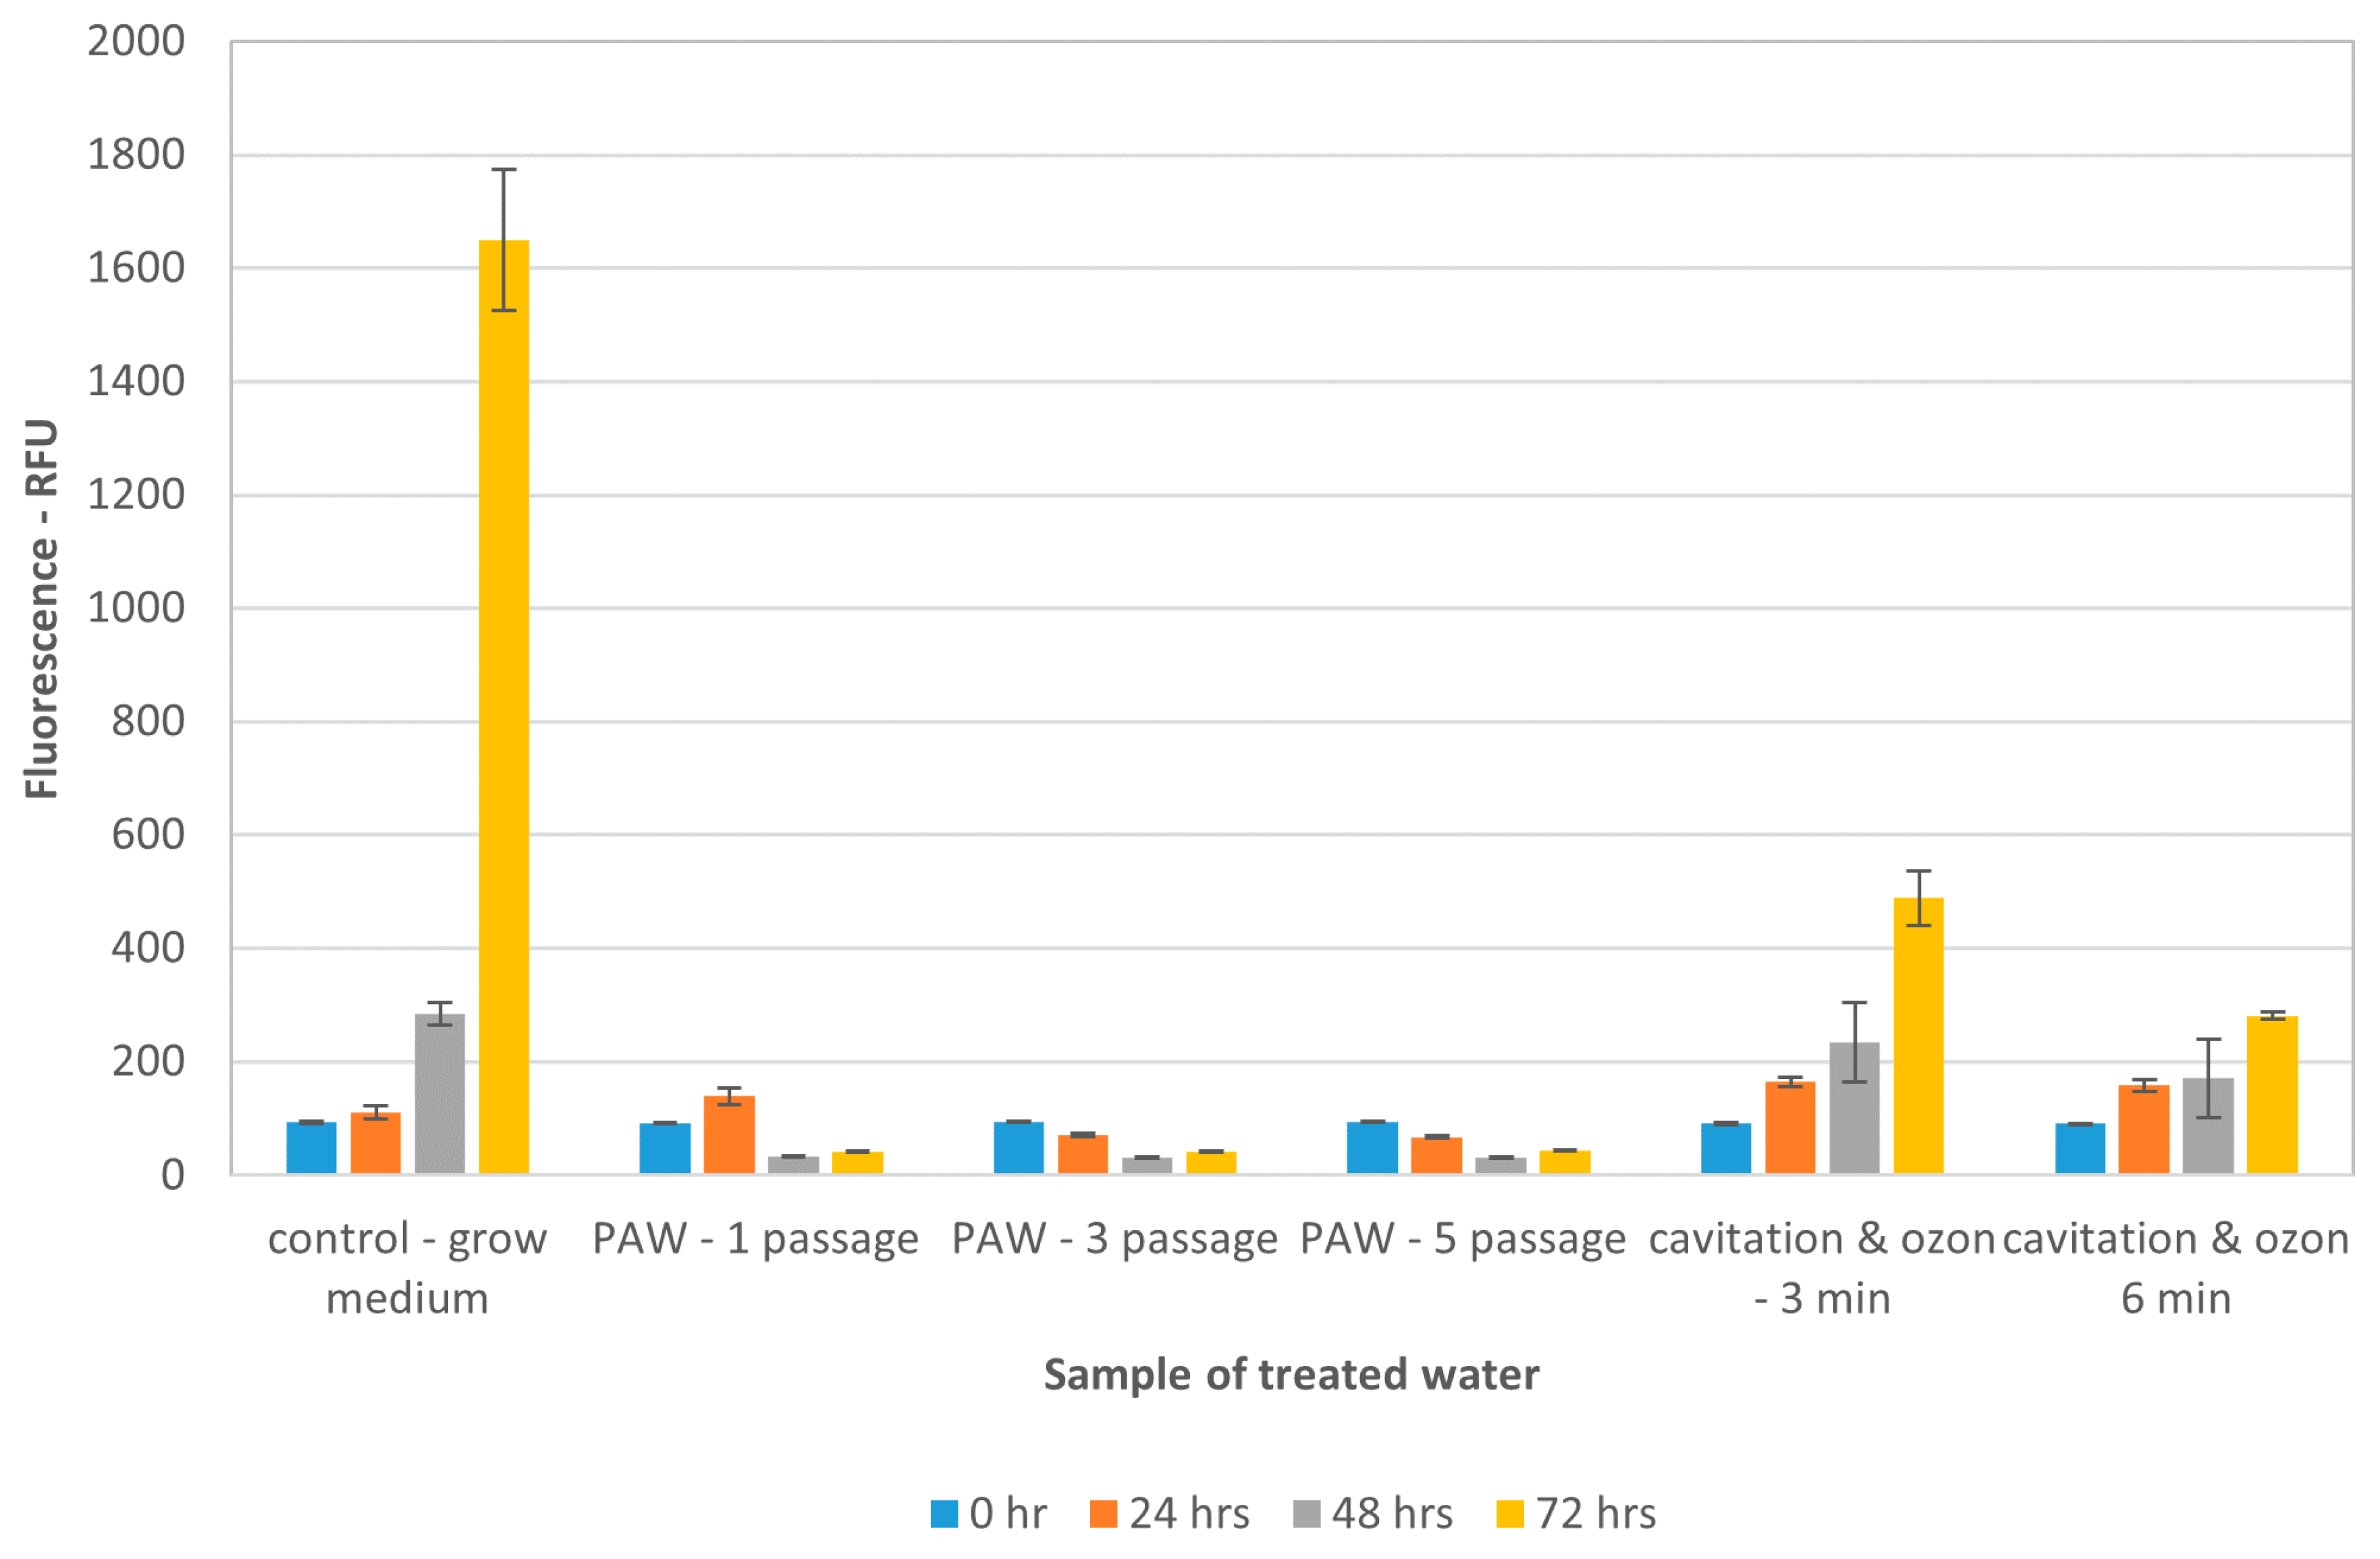
3.2. Treatment of Water Contaminated with Algae and Cyanobacteria

The biologically active water medium was prepared using either the plasma-cavitation treatment in the HCPJ at reduced backpressure or ozonisation with mechanical treatment in the cavitation cloud. Both methods belong to the so-called advanced oxidation processes [42]. The biological activity of prepared water medium was assessed by remediation of contaminated water from algae and cyanobacteria. The results are presented for both bio-contaminants separately based on the growth tests described in Section 2. The biological activity was monitored using the fluorescence test, e.g., real measurement of the biomass and the dynamics of growth. Growth in time, especially cell division, is an important parameter in the case of comparing similar methods; we can see and measure the situation where a treatment method causes just temporal injury, detectable by the temporal inhibition of photosynthesis, and then the algae or cyanobacteria are growing again after 3–4 days [28].
The idea of the experimental design used in this paper is driven by the practical situation, where, for e.g., in a swimming pool or cooling waters, we cannot use chlorination or another treatment for the whole volume or refill the water (due to, e.g., allergy, corrosion, etc.). In these cases, we can treat only part of the water, which will transfer the biocidal activity into the whole content. That is why we treat only part of the water and mix it with a nutrient medium with actively growing populations of algae or cyanobacteria.
The results of remediation of algae from water (the effect of activated water) showing the relation to time of cultivation after the treatment procedure are given in Figure 8. The cultivation tests were evaluated in 24 h intervals for three days after the treatment. We can see (Figure 8) that the reference water did not inhibit algal growth and in fact algae were growing in the reference water nearly as well as in the Z-medium. Only a single pass (at a flow rate of approximately 9230 mL/min the single pass of liquid media corresponds to the 13 s of batch treatment of 2 L of PAW in total) of water through the HCPJ device described in this paper provided similar effects on algae as that of 3 or 6 min of hydrodynamic cavitation with ozone. If we applied 3 or even 5 cycles, i.e., 39 or 65 s of total batch treatment by the HCPJ device, respectively, we saw the collapse of algal population and dead cells already after 24 h of cultivation. Importantly, the algal population was not able to revitalise even after 72 h of cultivation in ideal growth conditions.
Similar results to those with algae can be seen with cyanobacteria. The removal from water as the effect of PAW is given in Figure 9 showing the relation to time of cultivation after the treatment procedure. The 3-day cultivation tests were evaluated in 24 h intervals.
An interesting observation came from comparing the effect of PAW on algae (Figure 8) and cyanobacteria (Figure 9). Algae need more than a single pass of PAW in the HCPJ to be totally inhibited, whereas cyanobacterial cells had already died after one cycle of treatment. This can be explained by the difference in cellular structure of algae and cyanobacteria. Algae, as a eukaryote organism that has more barriers (cellular membrane) than does cyanobacteria, which is evolutionarily simpler.
We would also like to highlight another interesting result of experiments with cyanobacteria presented in this paper. Figure 9 shows that the hydrodynamic cavitation treatment of 3 or even 6 min with ozone inhibit cyanobacterial cell division and growth for 24–48 h, but after 72 h of exposition in ideal conditions, cyanobacteria start to grow again. This was not the case of the treatment by the HCPJ device presented in this paper, because in Figure 9 we can already see that a single pass of the PAW treatment, e.g., a single cycle, destroyed the metabolic activity of cells and killed the cyanobacterial population as early as 24 h after the treatment, without any revitalisation during the next days in ideal growing conditions. The interpretation of this effect is more complex. Our hypothesis is that the spectrum of radicals, which are produced by the HCPJ device (RONS) is richer than the radicals produced by ozone diluted in experimental water. This phenomenon needs further study, but it promises high potential for any further use of this HCPJ device in water decontamination and treatment of waste or technological waters.

4. Conclusions

In the presented paper we have shown a significant technological upgrade of PAW production using the HCPJ device, with the possibility to generate plasma and cavitation at reduced pressure. The achieved PAW production rate of the laboratory-scale device peaked at 0.55 m3/h, which is almost 15 times more than the best result we are aware of (pulsed submerged arc of [22]). The long-term biological effects of HCPJ prepared PAW were proven with algae and cyanobacteria inactivation, when cultivated in prepared PAW. We proved that PAW produced using only a single cycle of water treatment, i.e., 13 s of total batch treatment in the HCPJ, can destroy the metabolic activity of cyanobacterial cells and kill the cyanobacterial population in 24 h after the treatment. Albeit the processing conditions and produced PAW parameters differ substantially for each of the published methods, the presented data give compelling evidence for the industrial feasibility of the proposed novel method of generating PAW. These results together with our former results [28] of direct plasma remediation of water using the HCPJ point to a much wider range of possible applications where the HCPJ technology could be utilised, such as applications demanding effective removal of organic or microbial contaminants in large volumes.

Author Contributions

Conceptualization, J.Č., P.S. and B.M.; methodology, J.Č., P.S., P.R., E.M. and B.M.; formal analysis, J.Č., L.P., P.R. and E.M.; investigation, J.Č., P.S., J.R., L.P., P.R. and E.M.; writing—original draft preparation, J.Č., J.R., P.R., E.M. and B.M; writing—review and editing, P.S.; visualization, J.Č., P.R., E.M. and B.M.; supervision, P.S. and B.M.; funding acquisition, P.S., P.R. and B.M. All authors have read and agreed to the published version of the manuscript.

Funding

This research was supported by the Technological Agency of Czech Republic under project No. SS01020006. The Czech Science Foundation is gratefully acknowledged for support of this research under project No. 19-10660S “Removal of estrogens from waste water using hydrodynamic cavitation in combination with advanced oxidation processes”. This work results within the collaboration of the COST Action CA19110.

Acknowledgments

This research was supported by the Technological Agency of Czech Republic under project No. SS01020006. The Czech Science Foundation is gratefully acknowledged for support of this research under project No. 19-10660S “Removal of estrogens from waste water using hydrodynamic cavitation in combination with advanced oxidation processes”. This work results within the collaboration of the COST Action CA19110. We are grateful to both anonymous peer reviewers for their thoughtful comments that helped us improve the quality of our manuscript.

Conflicts of Interest

The authors declare no conflict of interest.

Appendix A. Numerical Model

A numerical simulation of the cavitating flow (without plasma discharge) was carried out to design the nozzle and assess the parameters of the supercavitation for different outlet pressures.

Appendix A.1. Governing Equations

Conservation of mass and momentum for turbulent variable density flow is governed by the Reynolds-averaged Navier–Stokes equations.
ρ m t + ( ρ m v l ¯ ) x i = 0
( ρ m v l ¯ ) t + ( ρ m v l ¯ v J ¯ ) x i = p x i + x j [ ( μ m + μ t ) ( v l ¯ x j + v J ¯ x i 2 3 δ i j v k x k ) ]
where ρ is density, v l ¯ is averaged velocity, p is pressure, μ is dynamic viscosity, and subscript m denotes mixture. Closure of the system (A1, A2) is via a two-equation realizable k-epsilon turbulence model [37].
Two-phase flow was treated as a homogeneous mixture using volume fraction α ( α = 1 if only water occupies the computational cell, α = 0 if only vapor occupies the computational cell, 0 < α < 1 if both phases are present in the computational cell). Mixture density and dynamic viscosity were defined as a function of the volume fraction:
ρ m = ρ v α v + ρ l ( 1 α v )
μ m = μ v α v + μ l ( 1 α v )
where subscripts v and l denote vapor and liquid phases.
Mass transfer due to cavitation was modelled using the Schnerr–Sauer cavitation model [38]. The model based on a truncated Rayleigh–Plesset equation is relatively robust and sufficiently accurate. The vapor-mass conservation equation comprising the effect of mass transfer is
( ρ v α v ) t + ( ρ v α v v l ¯ ) x i = m e v a p ˙ m c o n d ˙
Evaporation rate for p v a p > p :
m e v a p ˙ = ρ v ρ l ρ m α v ( 1 α v ) 3 R B 2 3 ( p v p ) ρ l
Condensation rate for p v a p < p :
m c o n d ˙ = ρ v ρ l ρ m α v ( 1 α v ) 3 R B 2 3 ( p p v ) ρ l
where bubble radius R B is defined as
R B = ( α v 1 α v 3 4 π 1 n ) 1 / 3
where n is the bubble number density.
Commercial CFD code ANSYS Fluent 19.1 where the above-mentioned mathematical model is solved by the finite volume method was applied for the analysis. The QUICK interpolation scheme for the momentum equation, second order upwind schemes for the turbulence equations, and QUICK scheme for the vapor fraction were employed. Simulations were performed as transients with second order interpolations in time and with a computational time step 1 × 10⁻⁶ s.

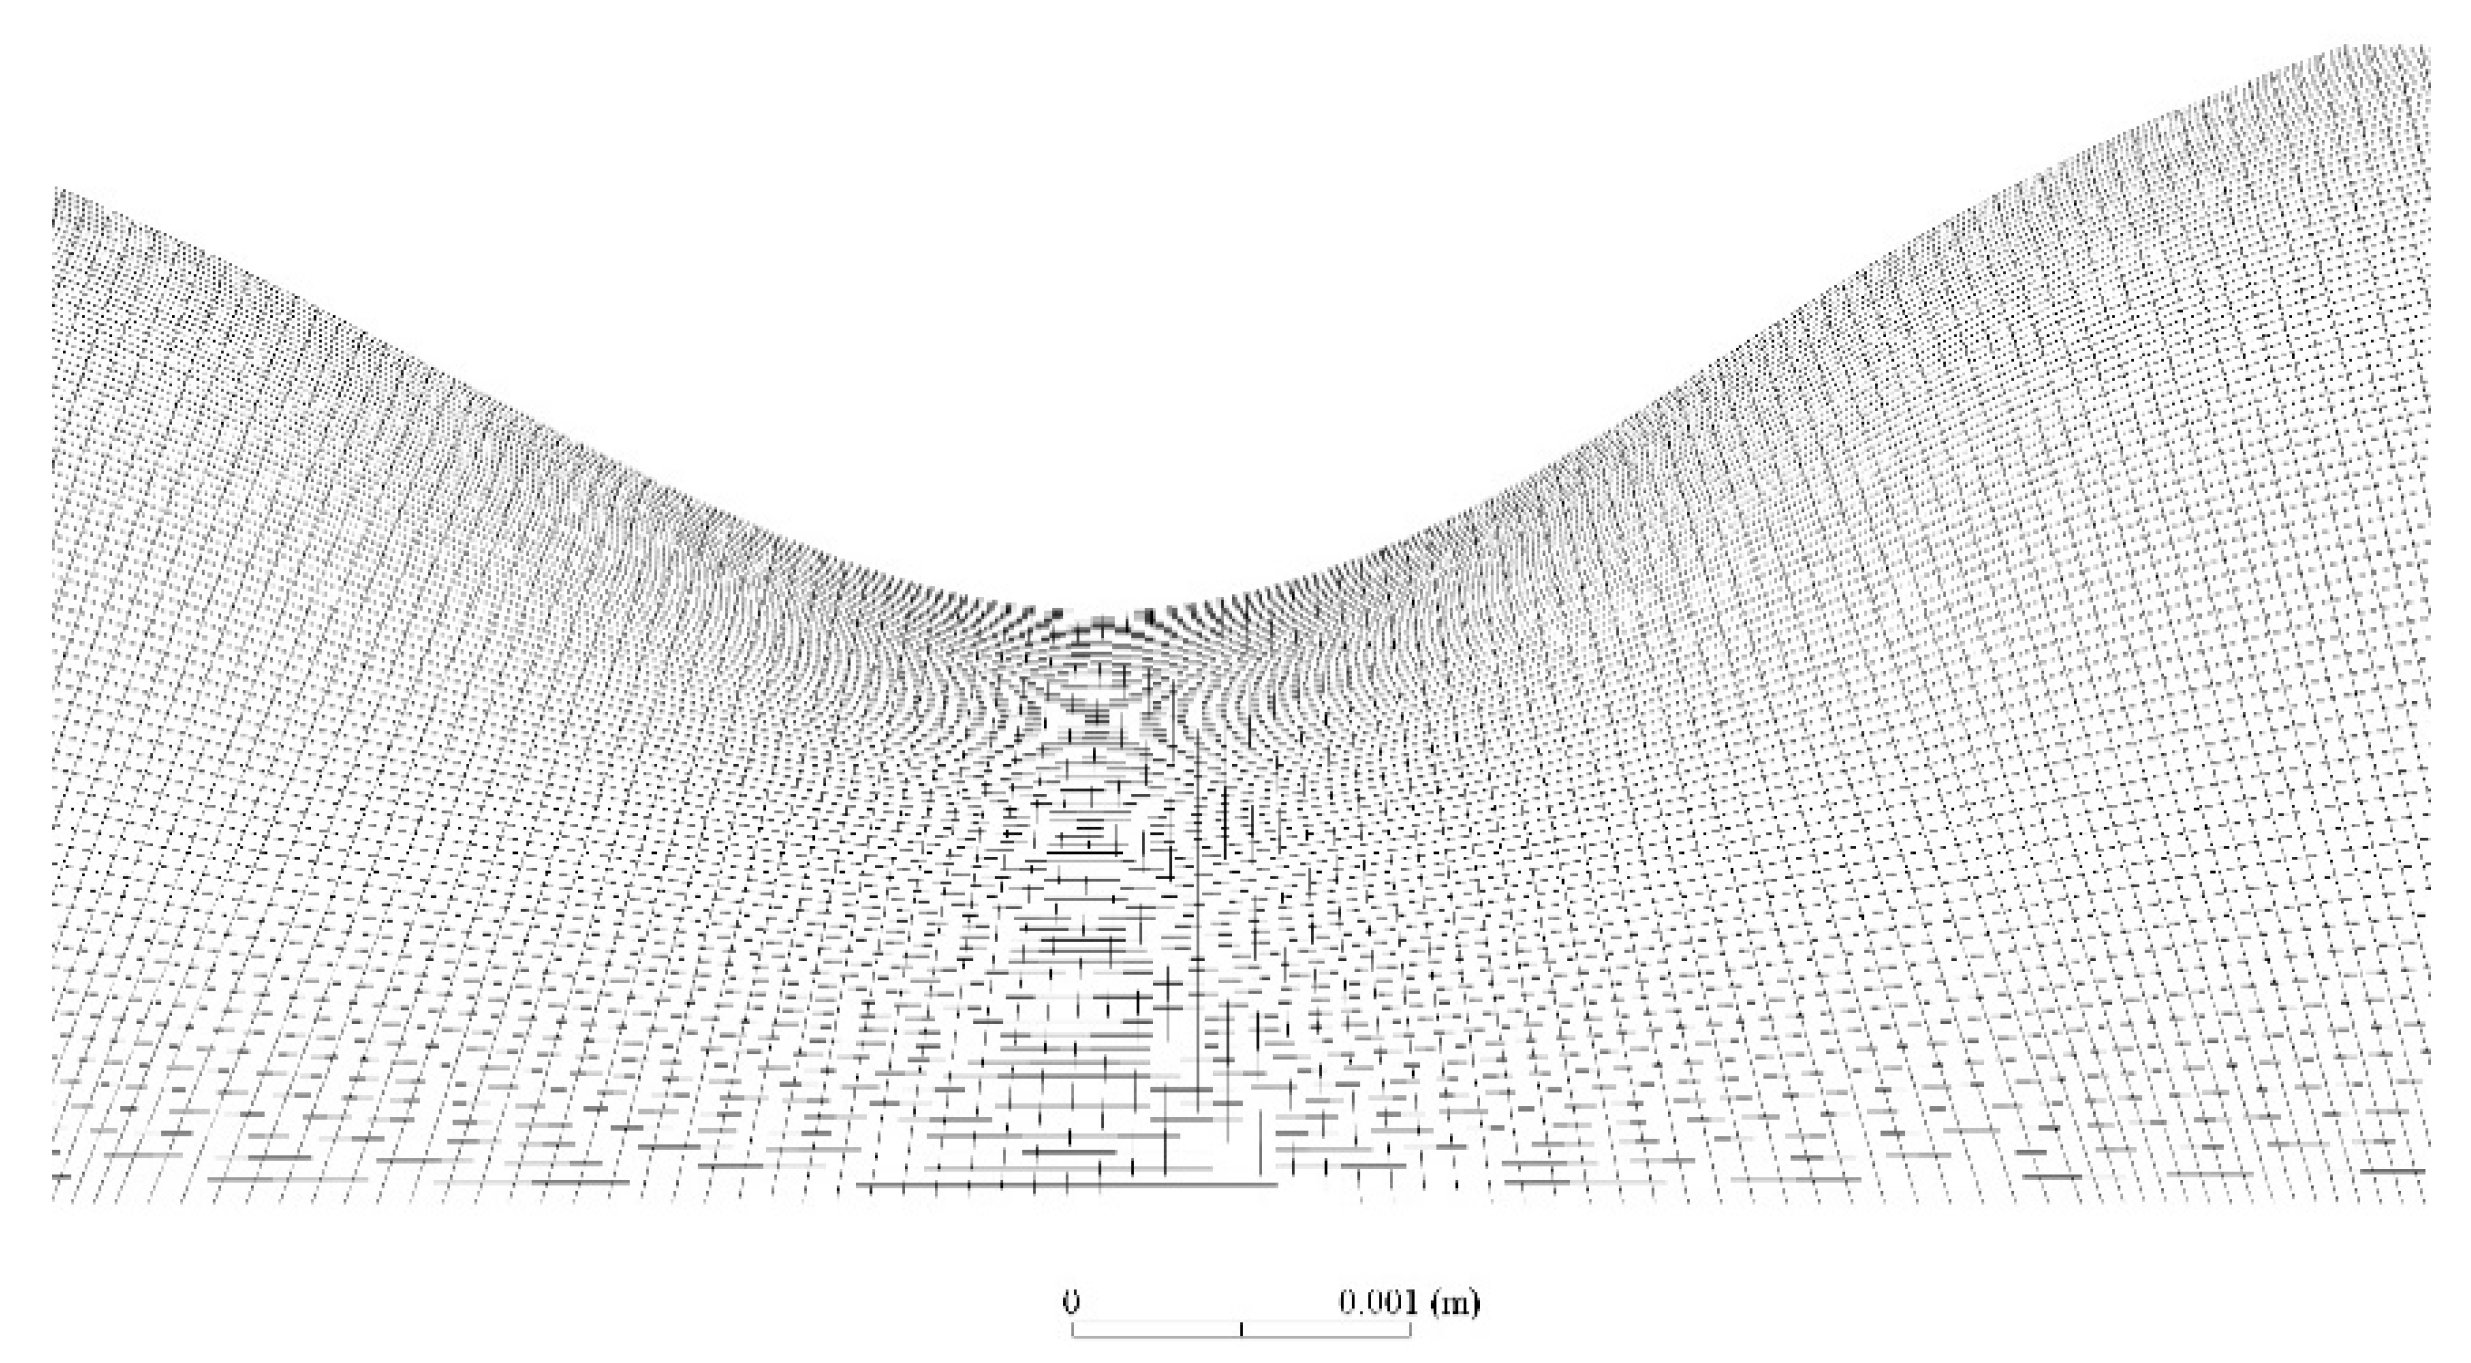
Appendix A.2. Geometry and Computational Mesh

An axisymmetric nature of the geometry and boundary conditions was employed. The length of the whole computational domain was 40 times that of the pipe diameter.
Three mesh densities were tested to ensure mesh independence, and finally 2D mesh with 74,000 quadrilateral cells was used for the simulations, see Figure A1. The value of wall y+ was in the range of 15–20 (y+ is a dimensionless distance from wall directly related to computational mesh size close to the wall, y+ should be up to 120 for correct simulation).
Figure A1. Details of the computational mesh in the nozzle throat (whole domain was filled with quadrilateral cells stretched in the flow direction, mesh is finer close to the walls to capture the velocity gradient within the boundary layer).
Water 12 03167 g0a1
Velocity was prescribed on the inlet and static pressure on the outlet. Two regimes were tested, which corresponded to experimental testing. Cavitation number was defined according to the following relation:
σ = p 2 p v a p ρ v t 2 2
Cavitation number was 0.11 for the first regime (atmospheric pressure on the outlet, see Figure A2, Figure A3 and Figure A4) and 0.095 for the second regime (negative gauge pressure on the outlet, see Figure A5, Figure A6 and Figure A7).
Supercavitation was developed for both regimes. The difference was in the length of the water jet, which reached 7.7 nozzle throat diameters in the first case and around 15 nozzle throat diameters in the second case. No apparent transient instabilities or flashing were observed during the simulation.
Figure A2. Phase distribution ( σ = 0.11 ), water = 1, vapor = 0.
Water 12 03167 g0a2
Figure A3. Velocity field (in m.s−1) ( σ = 0.11 ).
Water 12 03167 g0a3
Figure A4. Absolute static pressure field in (Pa) ( σ = 0.11 ).
Water 12 03167 g0a4
Figure A5. Phase distribution ( σ = 0.095 ), water = 1, vapor = 0.
Water 12 03167 g0a5
Figure A6. Velocity field in (m·s−1) ( σ = 0.095 ).
Water 12 03167 g0a6
Figure A7. Absolute static pressure field in (Pa) ( σ = 0.095 ).
Water 12 03167 g0a7

References

  1. Yasuda, J.; Yoshizawa, S.; Umemura, S. Efficient generation of cavitation bubbles and reactive oxygen species using triggered high-intensity focused ultrasound sequence for sonodynamic treatment. Jpn. J. Appl. Phys. 2016, 55, 07KF24. [Google Scholar] [CrossRef]
  2. Bruggeman, P.J.; Kushner, M.J.; Locke, B.R.; Gardeniers, J.G.; Graham, W.G.; Graves, D.B.; Hofman-Caris, R.C.H.M.; Maric, D.; Reid, J.P.; Ceriani, E.; et al. Plasma-liquid interactions: A review and roadmap. Plasma Sources Sci. Technol. 2016, 25, 053002. [Google Scholar] [CrossRef]
  3. Machala, Z.; Tarabová, B.; Sersenová, D.; Janda, M.; Hensel, K. Chemical and antibacterial effects of plasma activated water: Correlation with gaseous and aqueous reactive oxygen and nitrogen species, plasma sources and air flow conditions. J. Phys. D Appl. Phys. 2019, 52, 034002. [Google Scholar] [CrossRef]
  4. Kaushik, N.K.; Ghimire, B.; Li, Y.; Adhikari, M.; Veerana, M.; Kaushik, N.; Jha, N.; Adhikari, B.; Lee, S.J.; Masur, K.; et al. Biological and medical applications of plasma-activated media, water and solutions. Biol. Chem. 2018, 400, 39–62. [Google Scholar] [CrossRef] [PubMed]
  5. Brandenburg, R.; Bogaerts, A.; Bongers, W.; Fridman, A.; Fridman, G.; Locke, B.R.; Miller, V.; Reuter, S.; Schiorlin, M.; Verreycken, T.; et al. White paper on the future of plasma science in environment, for gas conversion and agriculture. Plasma Process. Polym. 2019, 16, 1700238. [Google Scholar] [CrossRef] [Green Version]
  6. Thirumdas, R.; Kothakota, A.; Annapure, U.; Siliveru, K.; Blundell, R.; Gatt, R.; Valdramidis, V.P. Plasma activated water (PAW): Chemistry, physico-chemical properties, applications in food and agriculture. Trends Food Sci. Technol. 2018, 77, 21–31. [Google Scholar] [CrossRef]
  7. Zhang, Q.; Ma, R.; Tian, Y.; Su, B.; Wang, K.; Yu, S.; Zhang, J.; Fang, J. Sterilization Efficiency of a Novel Electrochemical Disinfectant against Staphylococcus aureus. Environ. Sci. Technol. 2016, 50, 3184–3192. [Google Scholar] [CrossRef]
  8. Lu, P.; Boehm, D.; Cullen, P.; Bourke, P. Controlled cytotoxicity of plasma treated water formulated by open-air hybrid mode discharge. Appl. Phys. Lett. 2017, 110, 264102. [Google Scholar] [CrossRef] [Green Version]
  9. Ito, M.; Oh, J.-S.; Ohta, T.; Shiratani, M.; Hori, M. Current status and future prospects of agricultural applications using atmospheric-pressure plasma technologies. Plasma Process. Polym. 2018, 15, 1700073. [Google Scholar] [CrossRef]
  10. Gamaleev, V.; Iwata, N.; Ito, G.; Hori, M.; Hiramatsu, M.; Ito, M. Scalable treatment of flowing organic liquids using ambient-air glow discharge for agricultural applications. Appl. Sci. 2020, 10, 801. [Google Scholar] [CrossRef] [Green Version]
  11. Rezaei, F.; Nikiforov, A.; Morent, R.; De Geyter, N. Plasma Modification of Poly Lactic Acid Solutions to Generate High Quality Electrospun PLA Nanofibers. Sci. Rep. 2018, 8, 2241. [Google Scholar] [CrossRef] [PubMed] [Green Version]
  12. Park, H.; Yoo, S.; Kim, K. Synthesis of Carbon-Coated TiO2 by Underwater Discharge with Capillary Carbon Electrode. IEEE Trans. Plasma Sci. 2019, 47, 1482–1486. [Google Scholar] [CrossRef]
  13. Yayci, A.; Baraibar, Á.G.; Krewing, M.; Fueyo, E.F.; Hollmann, F.; Alcalde, M.; Kourist, R.; Bandow, J.E. Plasma-Driven in Situ Production of Hydrogen Peroxide for Biocatalysis. ChemSusChem 2020, 13, 2072–2079. [Google Scholar] [CrossRef] [PubMed]
  14. Mariotti, D.; Patel, J.; Švrček, V.; Maguire, P. Plasma-liquid interactions at atmospheric pressure for nanomaterials synthesis and surface engineering. Plasma Process. Polym. 2012, 9, 1074–1085. [Google Scholar] [CrossRef]
  15. Liguori, A.; Gallingani, T.; Padmanaban, D.B.; Laurita, R.; Velusamy, T.; Jain, G.; Macias-Montero, M.; Mariotti, D.; Gherardi, M. Synthesis of Copper-Based Nanostructures in Liquid Environments by Means of a Non-equilibrium Atmospheric Pressure Nanopulsed Plasma Jet. Plasma Chem. Plasma Process. 2018, 38, 1209–1222. [Google Scholar] [CrossRef]
  16. Kaushik, N.K.; Kaushik, N.; Linh, N.; Ghimire, B.; Pengkit, A.; Sornsakdanuphap, J.; Lee, S.-J.; Choi, E. Plasma and Nanomaterials: Fabrication and Biomedical Applications. Nanomaterials 2019, 9, 98. [Google Scholar] [CrossRef] [Green Version]
  17. Lukeš, P.; Locke, B.R. Degradation of substituted phenols in a hybrid gas-liquid electrical discharge reactor. Ind. Eng. Chem. Res. 2005, 44, 2921–2930. [Google Scholar] [CrossRef]
  18. Kozáková, Z.; Nejezchleb, M.; Krčma, F.; Halamová, I.; Čáslavský, J.; Dolinová, J. Removal of organic dye Direct Red 79 from water solutions by DC diaphragm discharge: Analysis of decomposition products. Desalination 2010, 258, 93–99. [Google Scholar] [CrossRef]
  19. Magureanu, M.; Dobrin, D.; Mandache, N.B.; Bradu, C.; Medvedovici, A.; Parvulescu, V.I. The mechanism of plasma destruction of enalapril and related metabolites in water. Plasma Process. Polym. 2013, 10, 459–468. [Google Scholar] [CrossRef]
  20. Jiang, B.; Zheng, J.; Qiu, S.; Wu, M.; Zhang, Q.; Yan, Z.; Xue, Q. Review on electrical discharge plasma technology for wastewater remediation. Chem. Eng. J. 2014, 236, 348–368. [Google Scholar] [CrossRef]
  21. Tampieri, F.; Giardina, A.; Bosi, F.J.; Pavanello, A.; Marotta, E.; Zaniol, B.; Neretti, G.; Paradisi, C. Removal of persistent organic pollutants from water using a newly developed atmospheric plasma reactor. Plasma Process. Polym. 2018, 15, e170027. [Google Scholar] [CrossRef]
  22. Meirovich, A.; Parkansky, N.; Boxman, R.L.; Berkh, O.; Barkay, Z.; Rosenberg, Y. Treatment of Methylene Blue water solution by submerged pulse arc in multi-electrode reactor. J. Water Process Eng. 2016, 13, 53–60. [Google Scholar] [CrossRef]
  23. Šimor, M.; Krump, H.; Hudec, I.; Ráheľ, J.; Brablec, A.; Černák, M. Atmospheric pressure H2O plasma treatment of polyester cord threads. Acta Phys. Slovaca 2004, 54, 43–48. [Google Scholar]
  24. Nikiforov, A.Y.; Leys, C. Surface treatment of cotton yarn by underwater capillary electrical discharge. Plasma Chem. Plasma Process. 2006, 26, 415–423. [Google Scholar] [CrossRef]
  25. Galmiz, O.; Zemánek, M.; Pavliňák, D.; Černák, M. Plasma treatment of polyethylene tubes in continuous regime using surface dielectric barrier discharge with water electrodes. J. Phys. D Appl. Phys. 2018, 51, 195201. [Google Scholar] [CrossRef] [Green Version]
  26. Locke, B.R.; Sato, M.; Sunka, P.; Hoffmann, M.R.; Chang, J.-S. Electrohydraulic discharge and nonthermal plasma for water treatment. Ind. Eng. Chem. Res. 2006, 45, 882–905. [Google Scholar] [CrossRef]
  27. Shan, M.; Chen, B.; Yao, C.; Han, Q.; Zhu, C.; Yang, Y. Electric characteristic and cavitation bubble dynamics using underwater pulsed discharge. Plasma Sci. Technol. 2019, 21, 074002. [Google Scholar] [CrossRef]
  28. Maršálek, B.; Maršálková, E.; Odehnalová, K.; Pochylý, F.; Rudolf, P.; Stahel, P.; Rahel, J.; Čech, J.; Fialová, S.; Zezulka, Š. Removal of Microcystis aeruginosa through the combined effect of plasma discharge and hydrodynamic cavitation. Water 2020, 12, 8. [Google Scholar] [CrossRef] [Green Version]
  29. Ihara, S.; Hirohata, T.; Kominato, Y.; Yamabe, C.; Ike, H.; Hakiai, K.; Hirabayashi, K.; Tamagawa, M. Water treatment using discharge generated in cavitation field with micro bubble cloud. Electr. Eng. Jpn. (Engl. Transl. Denki Gakkai Ronbunshi) 2014, 186, 1–10. [Google Scholar] [CrossRef]
  30. Abramov, V.O.; Abramova, A.V.; Cravotto, G.; Nikonov, R.V.; Fedulov, I.S.; Ivanov, V.K. Flow-mode water treatment under simultaneous hydrodynamic cavitation and plasma. Ultrason. Sonochem. 2020, 70, 105323. [Google Scholar] [CrossRef]
  31. Rudolf, P.; Pochylý, F.; Sťahel, P.; Ráheľ, J.; Čech, J.; Maršálek, B. Apparatus for purifying liquids and a method for purifying liquids using this apparatus. Czech Patent No. 308532, 13 December 2019. [Google Scholar]
  32. Ihara, S.; Sakai, T.; Yoshida, Y.; Nishiyama, H. Fundamental characteristics of discharge plasma generated in a water cavitation field. J. Electrost. 2018, 93, 110–117. [Google Scholar] [CrossRef]
  33. Oka, Y.; Ohnishi, K.; Asami, K.; Suyama, M.; Nishimura, Y.; Hashimoto, T.; Yonezawa, K.; Nakamura, T.; Yatsuzuka, M. Dispersion of carbon nanotubes into water without dispersant using cavitation bubble plasma. Vacuum 2017, 136, 209–213. [Google Scholar] [CrossRef]
  34. Navratil, Z.; Trunec, D.; Smid, R.; Lazar, L. A software for optical emission spectroscopy-problem formulation and application to plasma diagnostics. Czechoslov. J. Phys. 2006, 56, B944. [Google Scholar] [CrossRef]
  35. Voráč, J.; Synek, P.; Procházka, V.; Hoder, T. State-by-state emission spectra fitting for non-equilibrium plasmas: OH spectra of surface barrier discharge at argon/water interface. J. Phys. D Appl. Phys. 2017, 50, 294002. [Google Scholar] [CrossRef]
  36. Voráč, J.; Synek, P.; Potočńáková, L.; Hnilica, J.; Kudrle, V. Batch processing of overlapping molecular spectra as a tool for spatio-temporal diagnostics of power modulated microwave plasma jet. Plasma Sources Sci. Technol. 2017, 26, 025010. [Google Scholar] [CrossRef]
  37. ANSYS Fluent Users Guide. Available online: http://www.ansys.com (accessed on 3 August 2020).
  38. Sauer, J.; Schnerr, G.H. Development of a new cavitation model based on bubble dynamics. J. Appl. Math. Mech. 2001, 81, 561–562. [Google Scholar] [CrossRef]
  39. Briels, T.M.P.; Kos, J.; Winands, G.J.J.; van Veldhuizen, E.M.; Ebert, U. Positive and negative streamers in ambient air: Measuring diameter, velocity and dissipated energy. J. Phys. D Appl. Phys. 2008, 41, 234004. [Google Scholar] [CrossRef] [Green Version]
  40. Shamsborhan, H.; Coutier-Delgosha, O.; Caignaert, G.; Nour, F.A. Experimental determination of the speed of sound in cavitating flows. Exp. Fluids 2010, 49, 1359–1373. [Google Scholar] [CrossRef]
  41. Bruggeman, P.J.; Sadeghi, N.; Schram, D.C.; Linss, V. Gas temperature determination from rotational lines in non-equilibrium plasmas: A review. Plasma Sources Sci. Technol. 2014, 23, 023001. [Google Scholar] [CrossRef] [Green Version]
  42. Comninellis, C.; Kapalka, A.; Malato, S.; Parsons, S.A.; Poulios, I.; Mantzavinos, D. Advanced oxidation processes for water treatment: Advances and trends for R&D. J. Chem. Technol. Biotechnol. 2008, 83, 769–776. [Google Scholar] [CrossRef]
Figure 1. A HCPJ generated in a Venturi nozzle with the flow of 0.55 m3/h at sub-atmospheric backpressure of 40 kPa. Plasma was initiated using an HV sine-wave generator with the frequency of 65 kHz. HV measured at electrodes was 6.4 kV peak-to-peak. Power was set to 400 W measured at the HV power supply input. Exposure time was 1/20 s. The positions of the HV electrode (1) and outer contour of the Venturi nozzle (2) are indicated by the yellow and red colors, respectively. The discharge channel (3) was generated inside a cavitation cloud. The electrodes were separated by approximately 16 cm.
Water 12 03167 g001
Figure 2. Experimental setup consisting of the HCPJ unit, vacuum unit, ozoniser, and electrical/optical diagnostics. For details, see Section 2.1.
Water 12 03167 g002
Figure 3. The HCPJ generated at an input power of 400 W and pressure of 40 kPa (a) or 100 kPa (b). Images taken from a 1000 fps video record with the single frame exposure time of 1 ms.
Water 12 03167 g003
Figure 4. The spreading of a channel irregularity within the HCPJ generated at an input power of 400 W and 40 kPa pressure. Images taken from the 1000 fps video record with the single frame exposure time of 1 ms. The spatial and temporal scales are given together with the dashed line indicating spreading of the irregularity.
Water 12 03167 g004
Figure 5. Survey of the optical emission spectrum of the HCPJ generated at 400 W input power and 40 kPa pressure. Position is above the outlet of the nozzle.
Water 12 03167 g005
Figure 6. Typical example of the Boltzmann plot of the state-by-state fitting of the OH (A-X) emission spectrum of the HCPJ performed using the massiveOES package. Only υ’ = 0 transitions are shown.
Water 12 03167 g006
Figure 7. Current and voltage waveforms of the HCPJ generated at 65 kHz and 400 W of input power of the HV generator. The voltage waveform is given in blue while the current waveform is given in red.
Water 12 03167 g007
Figure 8. Growth of algae in water samples treated by HCPJ (PAW), and cavitation with ozonisation over time (0 h, 24 h, 48 h, 72 h). Fluorescence measurements are given in relative fluorescence units (RFU).
Water 12 03167 g008
Figure 9. Growth test of cyanobacteria in water samples treated by HCPJ (PAW), and cavitation with ozonisation. Fluorescence measurements are given in relative fluorescence units (RFU).
Water 12 03167 g009
Table 1. Comparison of volume efficiency of water treatment using various discharges.
ApplicationReactor/Electrode ConfigurationVolume EfficiencyRefs.
PAW generationplasma jet to the water surface10 mL/min[10]
spark to the water surface0.7 mL/min[8]
plasma electrospray1.7 mL/min[3]
dielectric barrier discharge (DBD) on or above the water surface; immersed Ar + O2 or air plasma jets0.5–25 mL/min[6] and references therein
Pollution removal (phenols, dyes, etc.)hybrid (corona pulse + water surface DBD)7 mL/min[17]
direct current (DC) diaphragm discharge38 mL/min[18]
pulsed DBD5 mL/min[19]
wetted wall DBD; hybrid; DC corona in water; DC diaphragm0.4–300 mL/min[20] and references therein
pulsed submerged arc600 mL/min[22]
Cyanobacteria removalHPCJ24,000 mL/min[28] 1
Organic dye removalalternating current arc in a cavitation field400 mL/min[29]
Organic dye and E. coli removaldischarge in cavitation field16,700 mL/min[30]
1 The first published results of the HCPJ discharge setup operated at atmospheric pressure conditions.
Table 2. Treatment conditions of water.
Water Flow RatePAW ProductionOzonisation TreatmentBackpressure (kPa)
9 230 mL/min
(0.55 m3/h)
Single pass of media through the reactor, i.e., 13 s of total treatment time of 2 L PAW-40
Triple pass of media through the reactor, i.e., 39 s of total treatment time of 2 L PAW-40
Quintuple pass of media through the reactor, i.e., 65 s of total treatment time of 2 L PAW-40
-3 min in total100
-6 min in total100
Publisher’s Note: MDPI stays neutral with regard to jurisdictional claims in published maps and institutional affiliations.

